evaluation of sefton’s drink less enjoy more intervention · • the intervention and evaluation...
TRANSCRIPT
PHI, Faculty of Education, Health and Community, Liverpool John Moores University, 3rd Floor Exchange Station, Tithebarn Street, Liverpool, L2 2QP0151 231 4542 | [email protected] / [email protected] | www.ljmu.ac.uk/phi | ISBN: 978-1-912210-38-1 (web)
Evaluation of Sefton’s Drink Less Enjoy More intervention
Kim Ross-Houle, Zara Quigg
October2018
Contents
Contributions .............................................................................................................................................. 1
Acknowledgements .................................................................................................................................... 1
Summary ..................................................................................................................................................... 2
1. Introduction ............................................................................................................................................ 3
2. Findings ................................................................................................................................................... 6
2.1 Baseline pre-intervention findings ................................................................................................... 6
2.1.1 Pseudo-intoxicated actor alcohol test purchases ...................................................................... 6
2.1.2 Nightlife user survey .................................................................................................................. 7
2.2 Pre and post-DLEM intervention comparisons ............................................................................... 10
2.2.1 Pseudo-intoxicated actor alcohol test purchases .................................................................... 10
2.2.2 Nightlife user survey (selected questions) ............................................................................... 10
2.3 Post-intervention nightlife user survey: intervention awareness .................................................. 12
3. Conclusion ............................................................................................................................................. 13
4. References ............................................................................................................................................ 14
5. Appendix 1: Supplementary table ........................................................................................................ 15

1
Contributions Overall project management and evaluation design:
Zara Quigg, Nadia Butler, Kim Ross-Houle
Data collection:
Nadia Butler, Kim Ross-Houle, Rebecca Bates, Charlotte Bigland, Hannah Grey, Emma Begley, Claire Poole, Esha Ubido, Zoe Swithenbank
Data inputting:
Claire Poole, Rebecca Bates, Charlotte Bigland
Data analysis:
Rebecca Bates, Kim Ross-Houle, Nadia Butler
Report write up:
Kim Ross-Houle, Hannah Grey, Zara Quigg, Charlotte Bigland
Front cover design:
Laura Heeks, Sophie Orrett
Acknowledgements We would like to thank all those who contributed to the development and implementation of the Drink Less Enjoy More intervention, and the evaluation process. In particular:
• The intervention and evaluation funders CHAMPS Public Health Collaborative and Sefton Local Authority.
• The Drink Less Enjoy More steering group. • All nightlife users who participated in the surveys. • The actors for supporting the implementation of the pseudo-intoxicated actors study.
Findings presented in this report form part of a broader study evaluating the expansion of the Drink Less Enjoy More Intervention from Liverpool to all local authorities across Cheshire and Merseyside. Full findings from the overall study can be found here: Quigg, Z. et al. (2018). Evaluation of the Cheshire and Merseyside Drink Less Enjoy More Intervention. Public Health Institute, Liverpool John Moores University, Liverpool.

2
Summary • Drink Less Enjoy More (DLEM) is a community based multi-component intervention
aiming to prevent excessive alcohol consumption and related harms in nightlife settings through, in the first instance, raising adherence to and knowledge of UK legislation prohibiting the sale of alcohol to, or purchasing of alcohol for, drunks.
• DLEM has been implemented across Liverpool City Centre’s nightlife since 2014, and in 2017/18 was expanded across Cheshire and Merseyside, including Sefton Local Authority Area.
• As part of an evaluation of DLEM across Cheshire and Merseyside, surveys with nightlife users and alcohol test purchases using pseudo-intoxicated actors (a proxy measure for the sale of alcohol to drunks) were implemented pre and post-intervention in Southport Town Centre.
• This report provides a summary of information collected specifically from Southport, including data from: alcohol test purchases (pre-intervention = 50; post-intervention = 51) and nightlife user surveys (pre-intervention = 67; post-intervention = 75).
• Across Sefton, the DLEM intervention was implemented from October to December 2017. • Whilst small sample sizes mean that findings should be interpreted with caution, findings
suggest some positive outcomes over this time period: Post-intervention 1 , 38.4% of survey participants were aware of the DLEM
intervention; of these: o 31.8% agreed2 it demonstrated that people who are drunk would not get served
more alcohol in nightlife venues. o 23.8% agreed it would make them drink less alcohol before going on a night out. o 14.3% agreed it would make them drink less alcohol whilst on a night out. o 57.1% agreed it made them feel safer on a night out. o 28.6% agreed that it would make them more likely to go on a night out.
The proportion of survey participants recognising that serving alcohol to customers who are already drunk is illegal increased from 63.1% pre-intervention to 74.3% post-intervention.
The proportion of survey participants recognising it is illegal for a person to buy alcohol for a friend who was already drunk rose from 53.8% pre-intervention to 60.8% post-intervention.
There was a slight reduction in the proportion of alcohol test purchases that resulted in the sale of alcohol to a pseudo-intoxicated actor from 32.0% pre-intervention to 27.5% post-intervention.
• Implementation of DLEM across Sefton nightlife settings appears to be associated with improvements in nightlife user knowledge of associated alcohol legislation. Whilst there was only a slight reduction in the number of successful test purchases to pseudo-intoxicated actors in on-licenced premises the number of successful serves was low in the pre-intervention phase.
1 Post-intervention measurements were taken during November 2017. 2 Including strongly agree/agree.
3
1. Introduction
The night time economy (NTE) is considered to be an environment that is associated with high levels of drunkenness and alcohol related harm [1–3], as well being a place that provides local employment, economic investment, cultural events and regeneration in cities and towns. Despite the potential positive elements the NTE can bring to an area, drinking to excess can damage health whilst placing higher demands on police, local authorities and health services who must manage nightlife drunkenness and associated problems such as anti-social behaviour, violence and alcohol related injuries [4]. The high prevalence of harm warrants specific interventions to make the NTE a safe and inclusive place for all those who want to participate. A broad range of policies and interventions have been employed to reduce such harms, including high profile policing, changes to licensing laws and environmental measures to improve the NTE. While some evidence suggests that such measures can contain and manage alcohol related harms, they are limited in their ability to reduce levels of intoxication or address harmful and pervasive cultures of nightlife drunkenness [1-2, 5]. In 2013, the first UK study exploring the propensity of bar staff to serve alcohol to customers who were displaying signs of intoxication was undertaken in Liverpool City Centre. This found that 84% of purchase attempts by pseudo-intoxicated actors resulted in the sale of alcohol [6]. This is despite it being an offence to knowingly sell alcohol to, or buy alcohol for, someone who is clearly intoxicated [7]. Violation of these laws can result in fines being imposed on the person selling alcohol, the holder of the premise licence, the premise supervisor, or the person who purchases alcohol on behalf of an intoxicated individual. Despite this, until recently, enforcement, awareness and compliance of this legislation has been typically low [6, 8].
Studies conducted elsewhere have suggested that reductions in the over service of alcohol to drunks and related harms can be achieved through multi-agency interventions that incorporate community mobilisation, enforcement of the law around the service of alcohol and responsible bar server training [9-12]. Based on this, since 2014 the Drink Less Enjoy More (DLEM) intervention has been implemented to address sales of alcohol to drunks, drunkenness and related harms in Liverpool’s nightlife [13-14]. DLEM aims to achieve this through, in the first instance: increasing awareness of legislation prohibiting the sale of alcohol to, and purchasing of alcohol for drunks; supporting and increasing bar staff compliance with the law; and promoting responsible alcohol consumption amongst nightlife users. Following earlier evaluation of DLEM, which suggested positive changes in public awareness and bar staff adherence to the laws [14], in 2017 DLEM was expanded across the Cheshire and Merseyside area, including Sefton Local Authority area (see Box 1).
Building on the Liverpool DLEM intervention, local partners across Sefton developed and implemented DLEM, relevant to their community settings (see Box 1). The Public Health Institute at Liverpool John Moores University was commissioned to implement a research study to evaluate key elements of the expansion of DLEM across Cheshire and Merseyside. Specific to Sefton, the objectives of the study were to:

4
• Explore the tendency of bar servers to sell alcohol to pseudo-intoxicated actors (a proxy measure for sales of alcohol to drunks).
• Assess nightlife users’ knowledge of alcohol legislation regarding sale of alcohol to, and purchasing of alcohol for, drunks.
• Provide an understanding of nightlife user alcohol consumption patterns, attitudes relating to drunkenness, perceptions of the nightlife environment, and prevalence of adverse nightlife events.
• Explore potential changes in bar staff adherence to, and nightlife user awareness of alcohol legislation over the intervention implementation period.
• Explore nightlife user awareness of DLEM and their perceptions of it.
This report provides a summary of findings specific to the evaluation that was carried out in Southport which is part of Sefton Local Authority Area.
To meet study objectives and to allow for comparisons with past studies (and the broader Cheshire and Merseyside DLEM evaluation [15]), research methods used in previous evaluations were repeated [13-14]. These included:
Nightlife user surveys: A short anonymous survey was conducted opportunistically with users of Southport’s NTE on a Friday and Saturday night in September (pre-intervention; N=67) and November (post-intervention; N=75) 2017. The surveys were conducted through face-to-face interviews on the street in Southport between 9.10pm and 1am. The survey explored: knowledge of legislation on service of alcohol to, and purchasing of alcohol for, drunks; drinking behaviours on the night of survey; use of the nightlife environment; and, expectations and tolerance of drunkenness. To ascertain the prevalence of harms (e.g. assaults), participants were asked whether they had experienced a number of adverse events on, or after nights out in the area in the previous three months. Post-intervention, participants were also asked about their awareness and perceptions of DLEM, and potential behaviour change as a result of the intervention. Alcohol test purchase attempts: Alcohol test purchase attempts were made by pseudo-intoxicated actors in 50 venues over four nights (Wednesday, 13 venues; Thursday, 11 venues; Friday, 14 venues; Saturday, 12 venues) in September 2017, between the hours of 9pm and 1.30am. The test purchase attempts were repeated in November 2017 with 47 of the same venues3 and in 51 venues overall. The test purchases were made with one actor and one researcher in a pair, and followed a protocol adapted from previous studies [6, 14]. Full study methodology4 and findings from the Cheshire and Merseyside DLEM study are available here: Quigg, Z et al (2018). Evaluation of the Cheshire and Merseyside Drink Less Enjoy More Intervention. Public Health Institute, Liverpool John Moores University, Liverpool.
3 Three venues were not open or had closed down and therefore a re-test was not possible so alternative venues were selected for testing. 4 Ethical approval for the study was granted by Liverpool John Moores University Research Ethics Committee (LJMU research ethics committee reference: 15/EHC/073).
5
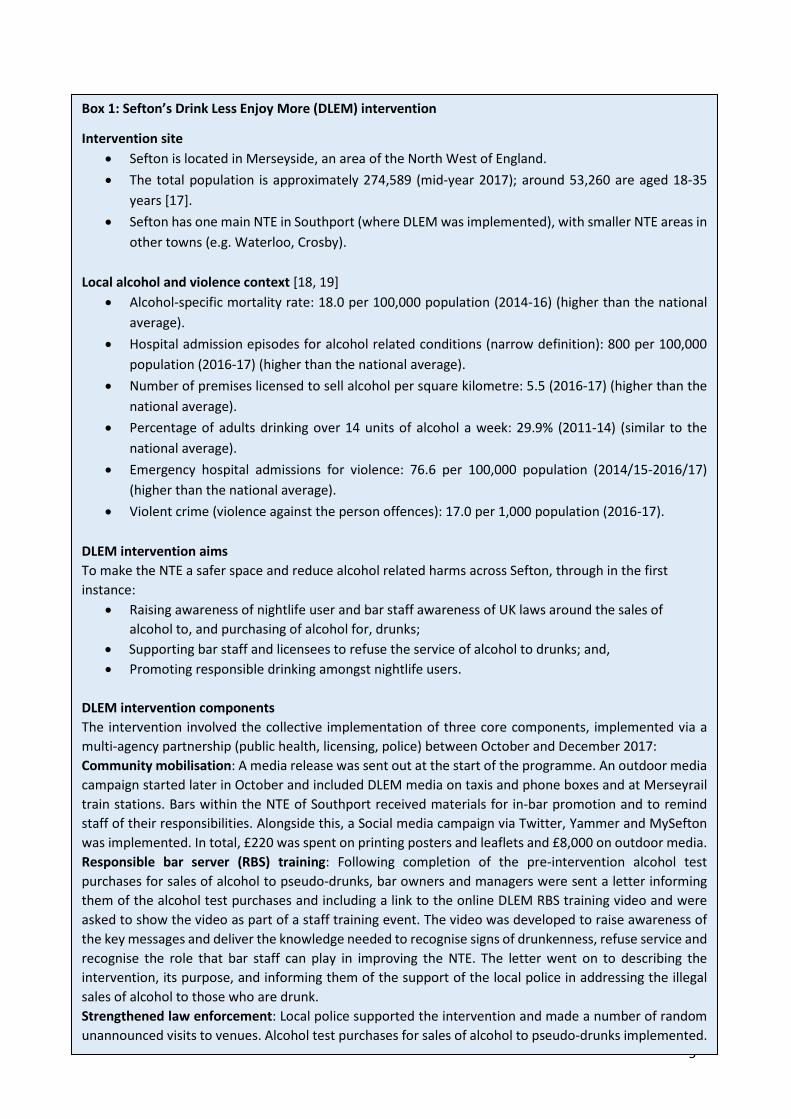
Box 1: Sefton’s Drink Less Enjoy More (DLEM) intervention
Intervention site • Sefton is located in Merseyside, an area of the North West of England. • The total population is approximately 274,589 (mid-year 2017); around 53,260 are aged 18-35
years [17]. • Sefton has one main NTE in Southport (where DLEM was implemented), with smaller NTE areas in
other towns (e.g. Waterloo, Crosby). Local alcohol and violence context [18, 19]
• Alcohol-specific mortality rate: 18.0 per 100,000 population (2014-16) (higher than the national average).
• Hospital admission episodes for alcohol related conditions (narrow definition): 800 per 100,000 population (2016-17) (higher than the national average).
• Number of premises licensed to sell alcohol per square kilometre: 5.5 (2016-17) (higher than the national average).
• Percentage of adults drinking over 14 units of alcohol a week: 29.9% (2011-14) (similar to the national average).
• Emergency hospital admissions for violence: 76.6 per 100,000 population (2014/15-2016/17) (higher than the national average).
• Violent crime (violence against the person offences): 17.0 per 1,000 population (2016-17). DLEM intervention aims To make the NTE a safer space and reduce alcohol related harms across Sefton, through in the first instance:
• Raising awareness of nightlife user and bar staff awareness of UK laws around the sales of alcohol to, and purchasing of alcohol for, drunks;
• Supporting bar staff and licensees to refuse the service of alcohol to drunks; and, • Promoting responsible drinking amongst nightlife users.
DLEM intervention components The intervention involved the collective implementation of three core components, implemented via a multi-agency partnership (public health, licensing, police) between October and December 2017: Community mobilisation: A media release was sent out at the start of the programme. An outdoor media campaign started later in October and included DLEM media on taxis and phone boxes and at Merseyrail train stations. Bars within the NTE of Southport received materials for in-bar promotion and to remind staff of their responsibilities. Alongside this, a Social media campaign via Twitter, Yammer and MySefton was implemented. In total, £220 was spent on printing posters and leaflets and £8,000 on outdoor media. Responsible bar server (RBS) training: Following completion of the pre-intervention alcohol test purchases for sales of alcohol to pseudo-drunks, bar owners and managers were sent a letter informing them of the alcohol test purchases and including a link to the online DLEM RBS training video and were asked to show the video as part of a staff training event. The video was developed to raise awareness of the key messages and deliver the knowledge needed to recognise signs of drunkenness, refuse service and recognise the role that bar staff can play in improving the NTE. The letter went on to describing the intervention, its purpose, and informing them of the support of the local police in addressing the illegal sales of alcohol to those who are drunk. Strengthened law enforcement: Local police supported the intervention and made a number of random unannounced visits to venues. Alcohol test purchases for sales of alcohol to pseudo-drunks implemented.
6
2. Findings5
2.1 Baseline pre-intervention findings
2.1.1 Pseudo-intoxicated actor alcohol test purchases Alcohol test purchase attempts by a pseudo-intoxicated actor were made in 50 venues, including pubs, bars and clubs, prior to the implementation of the DLEM intervention. One third (32.0%) of pre-intervention test purchases resulted in the service of alcohol, with four (25.0%) venues attempting to upsell (i.e. suggesting a double measure instead of a single). The day of the week (Wednesday, 3 venues served; Thursday, 3 venues served; Friday, 5 venues served; Saturday, 5 venues served) that the test purchase attempt was made on did not have a significant association with the service of alcohol. On two (4.0%) occasions bar staff asked the actor to show proof of age or I.D. when making the purchase attempt. Of the venues that refused service, twenty eight (82.4%) involved a direct refusal, and telling the actor they would not be able to serve them alcohol due to being too drunk. Four (11.8%) venues went further and offered a soft drink, five (14.7%) used caring statements to refuse the service of alcohol. Five (14.7%) venues ignored the pseudo-intoxicated actor, whilst three (8.8%) sought help to refuse from another member of staff.
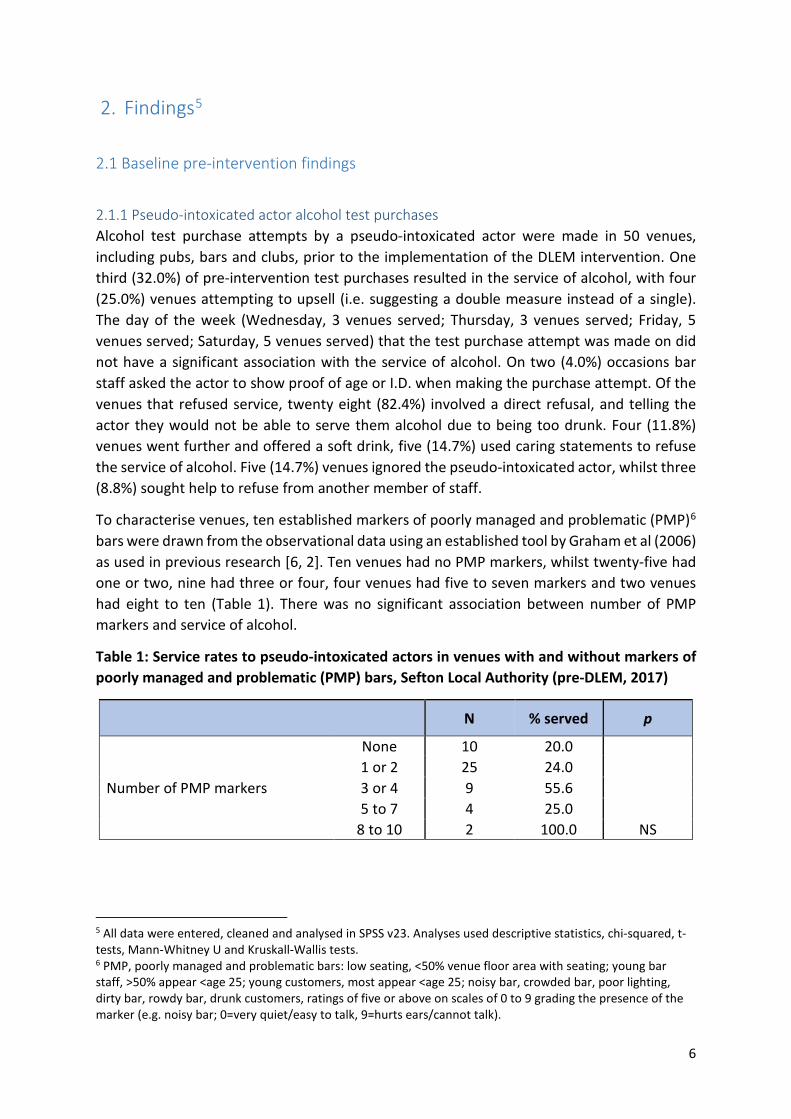
To characterise venues, ten established markers of poorly managed and problematic (PMP)6 bars were drawn from the observational data using an established tool by Graham et al (2006) as used in previous research [6, 2]. Ten venues had no PMP markers, whilst twenty-five had one or two, nine had three or four, four venues had five to seven markers and two venues had eight to ten (Table 1). There was no significant association between number of PMP markers and service of alcohol.
Table 1: Service rates to pseudo-intoxicated actors in venues with and without markers of poorly managed and problematic (PMP) bars, Sefton Local Authority (pre-DLEM, 2017)
N % served p
Number of PMP markers
None 10 20.0
NS
1 or 2 25 24.0 3 or 4 9 55.6 5 to 7 4 25.0
8 to 10 2 100.0
5 All data were entered, cleaned and analysed in SPSS v23. Analyses used descriptive statistics, chi-squared, t-tests, Mann-Whitney U and Kruskall-Wallis tests. 6 PMP, poorly managed and problematic bars: low seating, <50% venue floor area with seating; young bar staff, >50% appear <age 25; young customers, most appear <age 25; noisy bar, crowded bar, poor lighting, dirty bar, rowdy bar, drunk customers, ratings of five or above on scales of 0 to 9 grading the presence of the marker (e.g. noisy bar; 0=very quiet/easy to talk, 9=hurts ears/cannot talk).
7
2.1.2 Nightlife user survey Sample characteristics Sixty seven nightlife users took part in the pre-intervention survey on Friday and Saturday nights in September 2017. Surveys were completed between 9.25pm and 1am, with 68.7% being completed between 9.25pm and 11.59pm. Around two thirds (65.7%) of the pre-intervention respondents were male. Participants’ ages ranged from 18 to 60 years, with a mean age of 30 years. A minority (14.9%) of pre-intervention participants reported that they were currently a student, and over half (59.7%) reported living locally. Nightlife usage Twelve respondents (17.9%) reported that this was their first night out in Southport, whilst 23.9% reported regularly going out once a week or more. Six in ten (62.7%) participants reported that they usually go on a night out at least once a month. On the night of the survey, 9.0% reported that they had come out between 12pm and 5.59pm, 26.9% between 6pm and 7.59pm, 43.3% between 8pm and 9.59pm, 17.9% between 10pm and 11.59pm, and 3.0% between 12am and 1am. A minority (7.7%) of participants said they expected to leave the areas nightlife between 10pm and 11.59pm, 47.7% between 12am and 1.59am, 18.5% between 2am and 3.59am, 15.4% between 4am and 5.59am, and 10.8% after 6am. Overall, the mean time survey participants expected to be out in the NTE was five and a half hours. Alcohol consumption7 and drunkenness The majority (95.5%) of participants had consumed alcohol prior to taking part in the survey (termed drinkers from here). Almost one in five (19.4%) had their first drink between 12pm and 17.59pm, 30.6% between 6pm and 7.59pm, 32.3% between 8pm and 9.59pm, 12.9% between 10pm and 11.59pm, and 4.8% after 12am. Four in ten (41.9%) participants had drank at home or a friend’s house before entering the NTE (i.e. preloading). Overall, drinkers reported consuming a median of 7.7 units prior to survey participation. Participants were asked if they intended to consume more alcohol during the rest of their night out. Overall, 83.9% of all participants (80.0% of drinkers) reported that they would drink more alcohol. The median number of units expected to be consumed was 8.2. In total, the median expected number of units consumed over the course of the night was 14.2, including what had been drank and what was expected8. Further to this, 9.2% of participants said they planned on drinking more once they had left the NTE (e.g. at home).
Using a scale of 1 (completely sober) to 10 (very drunk), participants were asked: how drunk they felt at the time of the survey, how drunk they thought they would be when they left the
7 To calculate the amount of alcohol consumed by nightlife patrons, drinks were coded into standard UK units using the following conversion: small glass (125ml) of wine, 1.5 units; standard (175ml) glass of wine, 2.1 units; large (250ml) glass of wine, 3.0 units; pint of lager/beer/cider, 2.0 units; bottle of lager/beer/cider, 1.7 units; can of lager/beer/cider, 2.0 units; bottle of alcopops, 1.5 units; single (25ml) shot of spirits, 1.0 unit; and a pitcher of cocktail, 6.0 units. 8 For ethical reasons no visibly drunk individuals were invited to participate, thus the median units consumed may represent an underestimate of alcohol consumption levels and/or patterns. The study also relied on self-reported levels of alcohol consumption which were not verified and could therefore be under or over estimated.

8
NTE, and how drunk they thought people typically get in the area whilst on a night out (Figure 1). Of those who had consumed alcohol prior to the survey, the mean level of reported drunkenness was 3.7. Thirteen (21.0%) drinkers reported feeling completely sober. The mean score for how drunk drinkers (including those who had not drank alcohol prior to the survey but intended to do so on the remainder of their night out) felt they would be when they left the city’s nightlife that night was 6.9. The mean level of reported drunkenness that people reach on nights out in the area was 7.3.
Drunkenness ratings of those who had consumed alcohol prior to the survey were grouped into two categories: low (one to five) and high (six to ten). At the time of the survey, just over one in five (22.6%) reported their current level of drunkenness as high, 71.0% reported their expected levels of drunkenness to be high by the end of the night, and 75.4% felt that people typically reach high levels of drunkenness on nights out in the area.
Adverse nightlife events
Participants were asked whether they had experienced any negative events while they were on, or after a night out in the local NTE in the previous three months (Figure 2). Over one third (38.5%) had vomited whilst on a night out, 33.8% had had a serious verbal argument, 27.7% had been so drunk they needed help walking, 26.2% had been injured, 16.9% had unprotected sex, 8.5% had been involved in a physical assault, 7.7% regretted having sex with someone, and 6.2% had experienced a sexual assault (including sexual harassment). One third (32.3%) of participants had tried to appear more sober to gain entry into a venue, and 18.5% tried to appear more sober to get served at the bar. Almost one in ten (9.2%) had been refused entry to a venue for being too drunk, 9.2% had been asked to leave somewhere because they were too drunk, 4.6% had been refused service at the bar because they had been too drunk, and 6.2% had asked a friend to buy them alcohol because they were too drunk to get served themselves.

9
Figure 1: Participants perceptions on their and other nightlife users’ level of drunkenness, Southport nightlife users (pre-DLEM, 2017)
Figure 2: Proportion of participants who experienced a negative nightlife event whilst on, or after a night out in the past three months, Southport nightlife users (pre-DLEM, 2017)
3.7
6.97.3
1.0
2.0
3.0
4.0
5.0
6.0
7.0
8.0
9.0
10.0
0%
10%
20%
30%
40%
50%
60%
70%
80%
90%
100%
Own current level ofdrunkenness
Own expected level ofdrunkeness
Others typical level ofdrunkeness
Mean level of drunkenness
Perc
enta
ge re
port
ing
each
dru
nken
ness
le
vel
38.5
33.8
32.3
27.7
26.2
18.5
18.5
16.9
9.2
9.2
7.7
6.2
6.2
4.6
0.0 10.0 20.0 30.0 40.0
Vomiting
Serious verbal argument
Tried to appear sober to gain entry
So drunk needed assistance to walk
Injury
Tried to appear sober to get served
Physical assault
Unprotected sex
Refused entry to a venue
Asked to leave because too drunk
Regretted having sex with someone
Sexual assault
Asked a friend to purchase alcohol for them
Refused service at the bar
%
10
2.2 Pre and post-DLEM intervention comparisons
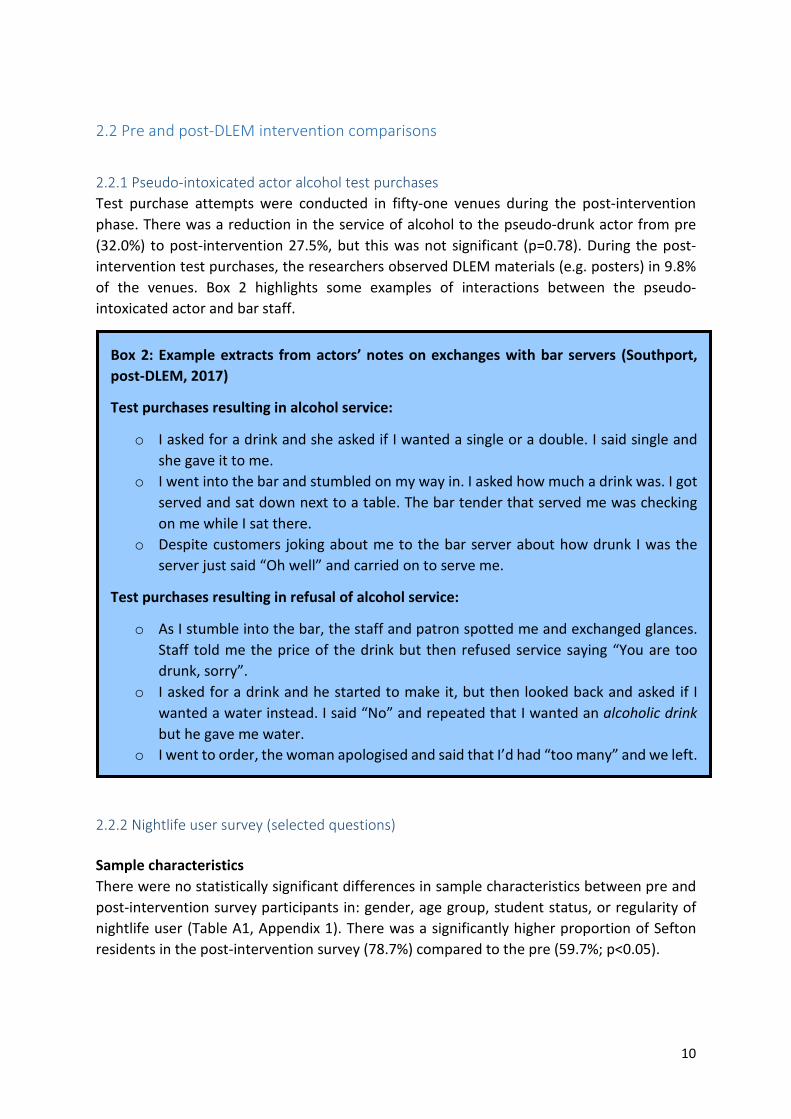
2.2.1 Pseudo-intoxicated actor alcohol test purchases Test purchase attempts were conducted in fifty-one venues during the post-intervention phase. There was a reduction in the service of alcohol to the pseudo-drunk actor from pre (32.0%) to post-intervention 27.5%, but this was not significant (p=0.78). During the post-intervention test purchases, the researchers observed DLEM materials (e.g. posters) in 9.8% of the venues. Box 2 highlights some examples of interactions between the pseudo-intoxicated actor and bar staff.
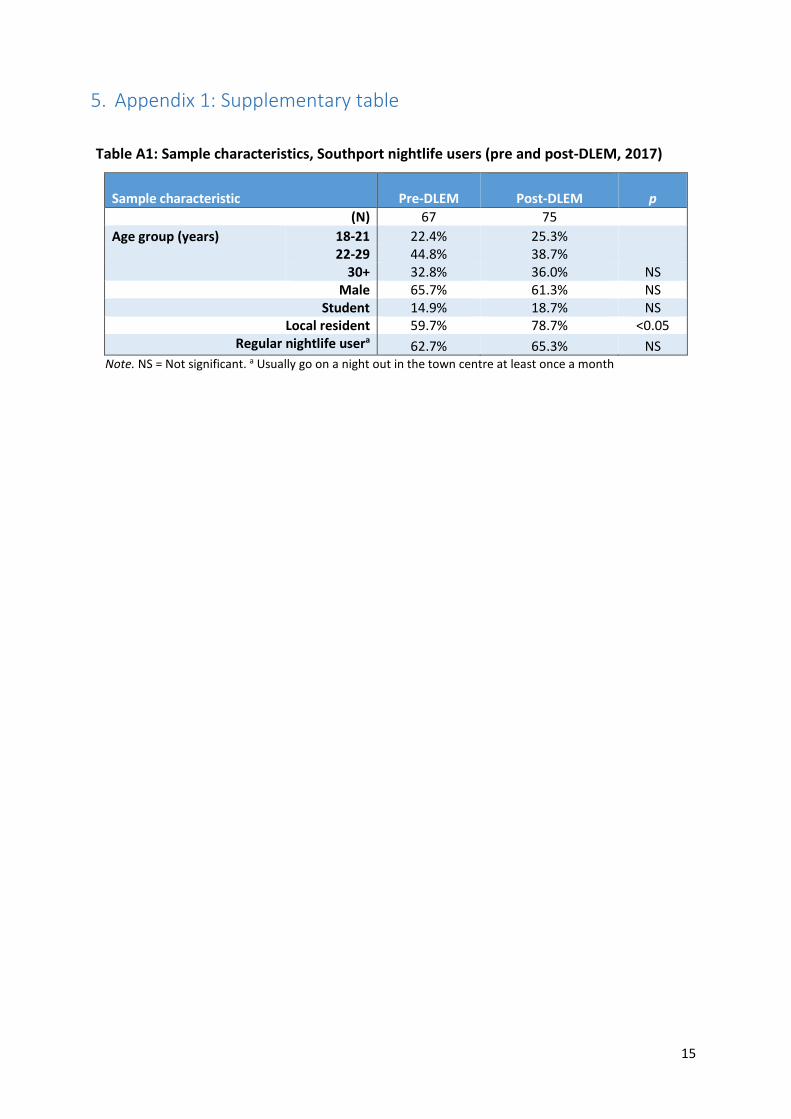
2.2.2 Nightlife user survey (selected questions) Sample characteristics There were no statistically significant differences in sample characteristics between pre and post-intervention survey participants in: gender, age group, student status, or regularity of nightlife user (Table A1, Appendix 1). There was a significantly higher proportion of Sefton residents in the post-intervention survey (78.7%) compared to the pre (59.7%; p<0.05).
Box 2: Example extracts from actors’ notes on exchanges with bar servers (Southport, post-DLEM, 2017)
Test purchases resulting in alcohol service:
o I asked for a drink and she asked if I wanted a single or a double. I said single and she gave it to me.
o I went into the bar and stumbled on my way in. I asked how much a drink was. I got served and sat down next to a table. The bar tender that served me was checking on me while I sat there.
o Despite customers joking about me to the bar server about how drunk I was the server just said “Oh well” and carried on to serve me.
Test purchases resulting in refusal of alcohol service:
o As I stumble into the bar, the staff and patron spotted me and exchanged glances. Staff told me the price of the drink but then refused service saying “You are too drunk, sorry”.
o I asked for a drink and he started to make it, but then looked back and asked if I wanted a water instead. I said “No” and repeated that I wanted an alcoholic drink but he gave me water.
o I went to order, the woman apologised and said that I’d had “too many” and we left.

11
Knowledge of the law The proportion of respondents recognising that it was against the law for bar staff to serve alcohol to customers who were already drunk was higher in the post-intervention survey results compared with the pre-intervention survey (pre, 63.1%; post, 74.3%). Similarly, participants recognising that it was illegal for a person to buy alcohol for a friend who was already drunk was higher in the post-intervention results compared to pre (pre, 53.8%; post, 60.8%) (Figure 3).
Figure 3: Participant awareness of the law around serving alcohol to, and purchasing alcohol for, drunk people, Southport nightlife users (pre and post-DLEM, 2017)
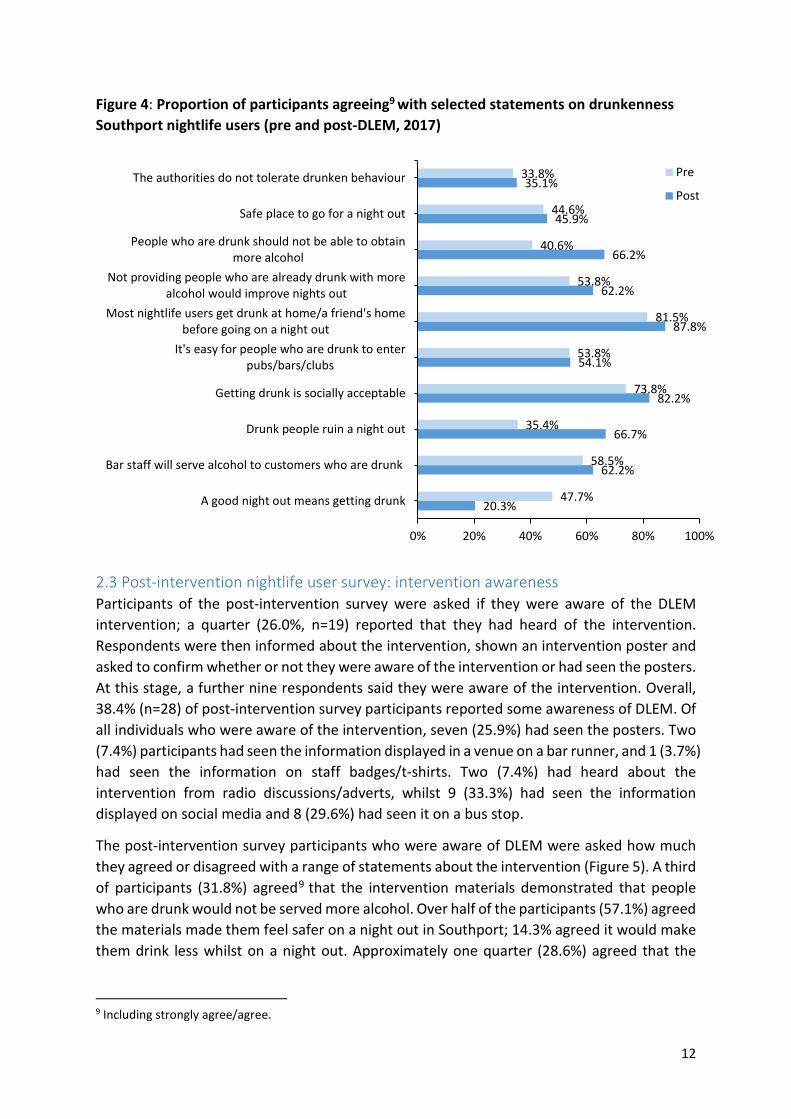
Drunkenness Participants were asked how much they agreed or disagreed with a range of statements relating to drunkenness across Southport Town Centre using a six point scale from strongly agree to strongly disagree (Figure 4). The proportion of participants agreeing9 that a good night out means getting drunk was lower (>5%) in the post-intervention survey results (20.3%), compared with pre (47.7%). The proportion of participants agreeing with the following statements was higher (>5%) in the post-intervention survey results, compared with pre:
• People who are drunk should not be able to obtain more alcohol; • Not providing people who are already drunk with more alcohol would improve nights
out; • Most people get drunk at home/a friend’s home before visiting Sefton’s nightlife for a
night out; • Getting drunk is socially acceptable in Sefton’s nightlife; and, • Drunk people ruin a night out.
63.1%
33.8%
3.1%
53.8%
35.4%
10.8%
74.3%
23.0%
2.7%
60.8%
32.4%
6.8%
0.0%
20.0%
40.0%
60.0%
80.0%
100.0%
Illegal Legal Don't know Illegal Legal Don't know
Bar server selling alcohol to someone who isalready drunk
Person buying alcohol for a friend who is alreadydrunk
Pre Post
12
Figure 4: Proportion of participants agreeing9 with selected statements on drunkenness Southport nightlife users (pre and post-DLEM, 2017)
2.3 Post-intervention nightlife user survey: intervention awareness Participants of the post-intervention survey were asked if they were aware of the DLEM intervention; a quarter (26.0%, n=19) reported that they had heard of the intervention. Respondents were then informed about the intervention, shown an intervention poster and asked to confirm whether or not they were aware of the intervention or had seen the posters. At this stage, a further nine respondents said they were aware of the intervention. Overall, 38.4% (n=28) of post-intervention survey participants reported some awareness of DLEM. Of all individuals who were aware of the intervention, seven (25.9%) had seen the posters. Two (7.4%) participants had seen the information displayed in a venue on a bar runner, and 1 (3.7%) had seen the information on staff badges/t-shirts. Two (7.4%) had heard about the intervention from radio discussions/adverts, whilst 9 (33.3%) had seen the information displayed on social media and 8 (29.6%) had seen it on a bus stop.
The post-intervention survey participants who were aware of DLEM were asked how much they agreed or disagreed with a range of statements about the intervention (Figure 5). A third of participants (31.8%) agreed9 that the intervention materials demonstrated that people who are drunk would not be served more alcohol. Over half of the participants (57.1%) agreed the materials made them feel safer on a night out in Southport; 14.3% agreed it would make them drink less whilst on a night out. Approximately one quarter (28.6%) agreed that the
9 Including strongly agree/agree.
20.3%
62.2%
66.7%
82.2%
54.1%
87.8%
62.2%
66.2%
45.9%
35.1%
47.7%
58.5%
35.4%
73.8%
53.8%
81.5%
53.8%
40.6%
44.6%
33.8%
0% 20% 40% 60% 80% 100%
A good night out means getting drunk
Bar staff will serve alcohol to customers who are drunk
Drunk people ruin a night out
Getting drunk is socially acceptable
It's easy for people who are drunk to enterpubs/bars/clubs
Most nightlife users get drunk at home/a friend's homebefore going on a night out
Not providing people who are already drunk with morealcohol would improve nights out
People who are drunk should not be able to obtainmore alcohol
Safe place to go for a night out
The authorities do not tolerate drunken behaviour Pre
Post

13
intervention would make them more likely to go on a night out in Southport and would make them drink less before coming on a night out (23.8%).
Figure 5: Perceptions of the DLEM intervention, Southport nightlife users aware of DLEM (post-DLEM, 2017)
3. Conclusion This small-scale study aimed to assess the initial impact of the implementation of DLEM across nightlife settings in Southport Town Centre (part of Sefton Local Authority) over an eight week period in 2017. Findings suggest that the intervention is associated with a positive impact as they demonstrate increased knowledge about legislation with regards to the service of alcohol to drunks and, to a lesser extent, increased adherence to the law. However, it is worth noting that the sales to pseudo-intoxicated actors were low in the pre-intervention phase with researchers noting examples of existing good practise, such as citing the legislation when refusing service. Researchers also noted that the NTE was relatively quiet meaning that overly intoxicated people would be more noticeable. Despite this, there are still high levels of alcohol consumption (as evidenced through the surveys) and evidence of alcohol harms [18]. Altering the attitude and expectation that you will get served no matter how drunk you are is an important step in reducing drunkenness and alleviating pressures on public services. Changing the culture of drinking to excess in nightlife environments is a complex task however that will likely take time to achieve. Given the expected levels of alcohol consumption and drunkenness amongst Southport’s nightlife users, DLEM should form part of broader alcohol policy and prevention activity that aims to reduce excessive and risky alcohol consumption across NTEs in Sefton. The good practices in refusing sales of alcohol to the pseudo-intoxicated actors in Southport should be explored further, and if relevant shared with partners/on-licensed premises in other areas across Sefton.
31.8
28.6
23.8
14.3
57.1
63.6
19
23.8
19
4.8
47.6
47.6
61.9
28.6
4.5
4.8
4.8
4.8
9.5
0% 20% 40% 60% 80% 100%
Demonstrates that people who are drunk inbars will not get served more alcohol
Would make you more likely to come on a nightout
Would make you drink less alcohol beforecoming on a night out
Would make you drink less alcohol whilst in barson a night out
Makes you feel safer on a night out
Strongly agree Agree Neither Disagree Strongly disagree

14
4. References 1. Quigg, Z., Hughes, K., Ford, K. J., Hunt, A., Hardcastle, K., & McGee, C. (2015). Evaluation of the
Liverpool Say No to Drunks Pilot Intervention. Liverpool: Centre for Public Health, Liverpool John Moores University.
2. Quigg, Z., Ford, K., McGee, C., Grey, H., Hardcastle, K., & Hughes, K. (2016). Evaluation of the Liverpool Drink Less Enjoy More intervention. Liverpool: Centre for Public Health, Liverpool John Moores University.
3. Wilkinson, C. (2009). Raising the bar: preventing aggression in and around bars, pubs and clubs. Drug Alcohol Rev. 28: 696–97.
4. Burton, R., Henn, C., Lavoie, D., O’Connor, R., Perkins, C., Sweeney, K., Greaves, F., Ferguson, B., Beynon, C., Belloni, A., Musto, V., Marsden, J. and Sheron, N. (2016). A rapid evidence review of the effectiveness and cost-effectiveness of alcohol control policies: an English perspective. The Lancet. 389: 1558-80
5. Bellis, M. A., & Hughes, K. (2011). Getting drunk safely? Night-life policy in the UK and its public health consequences. Drug and Alcohol Review, 30(5), 536-545.
6. Hughes, K., Bellis, M. A., Leckenby, N., Quigg, Z., Hardcastle, K., Sharples, O., & Llewellyn, D.J. (2014). Does legislation to prevent alcohol sales to drunk individuals work? Measuring the propensity for night-time sales to drunks in a UK city. Journal of Epidemiology and Community Health, 68, 453-456.
7. CPS. (2005). Licensing of Alcohol 2003. Retrieved from Legislation.gov.uk: https://www.legislation.gov.uk/ukpga/2003/17/contents [Accessed on 05th April 2018]
8. Hughes, K. & Anderson, Z. (2008). Identifying drunkenness and preventing sales of alcohol to intoxicated customers in Manchester. Liverpool: Centre for Public Health, Liverpool John Moores University.
9. Andreasson, S., Lindewald, B. & Rehnman, C. (2000). Over-serving patrons in licensed premises in Stockholm. Addiction; 95(3): 359-63.
10. Jones, L., Hughes, K., Atkinson, A.M. and Bellis M.A. (2011). Reducing harm in drinking environments: a systematic review of effective approaches. Health Place. 17: 508–18.
11. Lenk K. M., Toomey T. L. & Erickson D. J. (2006). Propensity of alcohol establishments to sell to obviously intoxicated patrons. Alcoholic Clinical and Experimental Research; 30: 1194-1199.
12. Wallin, E., Gripenberg, J. & Andréasson S. (2005). Overserving at licensed premises in Stockholm: effects of a community action program. Journal of Studies on Alcohol and Drugs; 66(6): 806-814.
13. Butler, N., Quigg, Z., Wallis, S., Grey, H., & Bigland, C. (2017). Liverpool’s Drink Less Enjoy More intervention Progress monitoring report. Liverpool: Public Health Institute, Liverpool John Moores University.
14. Quigg, Z., Hughes, K., Butler, N., Ford, K. J., Canning, I., & Bellis, M. A. (2018). Drink Less Enjoy More: effects of a multi-component intervention on improving adherence to, and knowledge of, alcohol legislation in a UK nightlife setting. Addiction, 23 (2), 529-845.
15. Quigg, Z., Butler, N., Bates, R., Grey, H., Ross-Houle, K. and Bigland, C. (2018). Evaluation of the Cheshire and Merseyside Drink Less Enjoy More Intervention. Public Health Institute, Liverpool John Moores University, Liverpool.
16. Graham, K., Bernards, S., Osgood, D. W., & Wells, S. (2006). Bad nights or bad bars? Multi-level analysis of environmental predictors of aggression in late-night large-capacity bars and clubs. Addiction, 101(11), 1569-1580.
17. Population estimates for England, Wales, Scotland and Northern Ireland. Data accessed on 5/10/18:https://www.ons.gov.uk/peoplepopulationandcommunity/populationandmigration/populationestimates/datasets/populationestimatesforukenglandandwalesscotlandandnorthernireland
18. Local Alcohol Profiles. Data accessed on 5/10/18: https://fingertips.phe.org.uk/profile/local-alcohol-profiles/data#page/0/gid/1938132984/pat/6/par/E12000002/ati/102/are/E06000049
19. Public Health Outcomes Framework. Data accessed on 5/10/18: https://fingertips.phe.org.uk/profile/public-health-outcomes-framework/data#page/0/gid/1000041/pat/6/par/E12000002/ati/102/are/E06000049
15
5. Appendix 1: Supplementary table
Table A1: Sample characteristics, Southport nightlife users (pre and post-DLEM, 2017)
Sample characteristic Pre-DLEM Post-DLEM p (N) 67 75
Age group (years) 18-21 22.4% 25.3% 22-29 44.8% 38.7%
30+ 32.8% 36.0% NS Male 65.7% 61.3% NS
Student 14.9% 18.7% NS Local resident 59.7% 78.7% <0.05
Regular nightlife usera 62.7% 65.3% NS Note. NS = Not significant. a Usually go on a night out in the town centre at least once a month