eumetsat meteosat-iasi inter-calibration algorithm...eumetsat meteosat-iasi inter-calibration...
TRANSCRIPT

Slide: 1 Date
EUMETSAT Meteosat-IASI Inter-calibration Algorithm
Tim HewisonMarianne König

Slide: 2 Feb 2008 GSICS
Contents
• Strategy– Traceability, Consistency, Predictability, Integrity, Stability
• Practice– Radiance Definition– Error Analysis– 3.9µm missing spectral contribution– Non-linearity
• Summary of Results for Meteosat-7, 8 and 9– Effect of changes to non-linearity corrections
• Comparison with NWP monitoring statistics
• Future Plans– Model variability/predictability

Slide: 3 Feb 2008 GSICS
Inter-calibration StrategyC
onsi
sten
cyTr
acea
bilit
y
NWP Bias CorrectionStatistics
Calibration Accuracy
Assessment(ref. instrument)
Analysis
Instrument Collocations
(Time Series)
Collocation Requirements
(in time, space)
Understanding& Predicting
Biases
Specifications for Future
Instruments
Less Bias inLevel 1 & 2Products
Re-analysis for Climate
Monitoring
OperationalCorrections
Principles Methodology Results Benefits
EUMETSAT 2007
EUMETSAT 2008
Liaisons 2008
Consistencybetween
instruments
Slide: 4 Feb 2008 GSICS
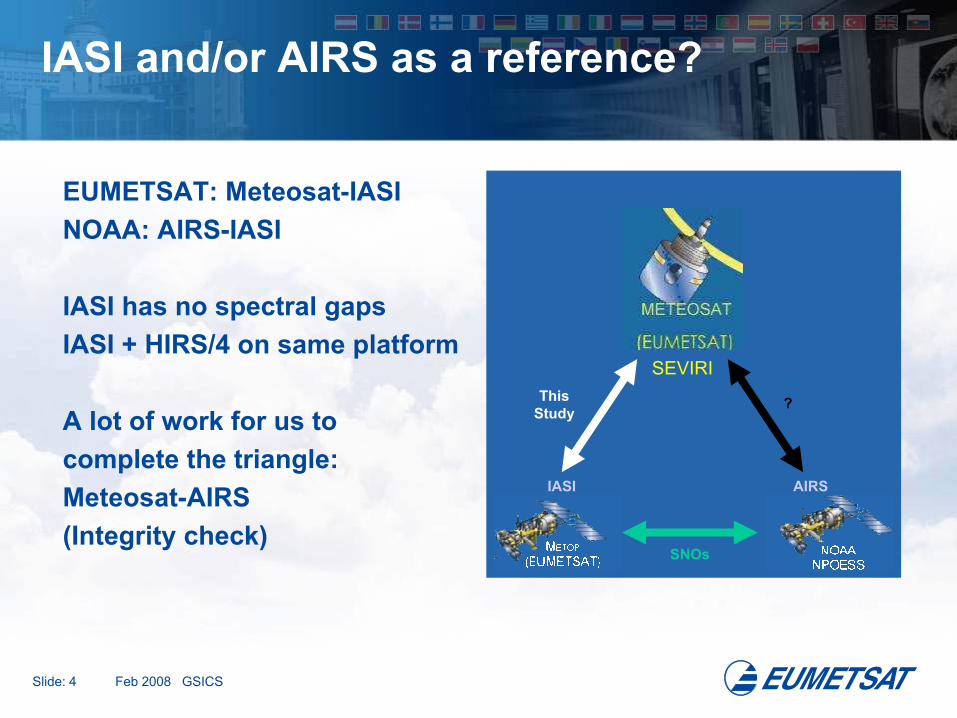
IASI and/or AIRS as a reference?
EUMETSAT: Meteosat-IASINOAA: AIRS-IASI
IASI has no spectral gapsIASI + HIRS/4 on same platform
A lot of work for us to complete the triangle:Meteosat-AIRS(Integrity check)
IASI AIRS
SEVIRI
?
SNOs
This Study
Slide: 5 Feb 2008 GSICS
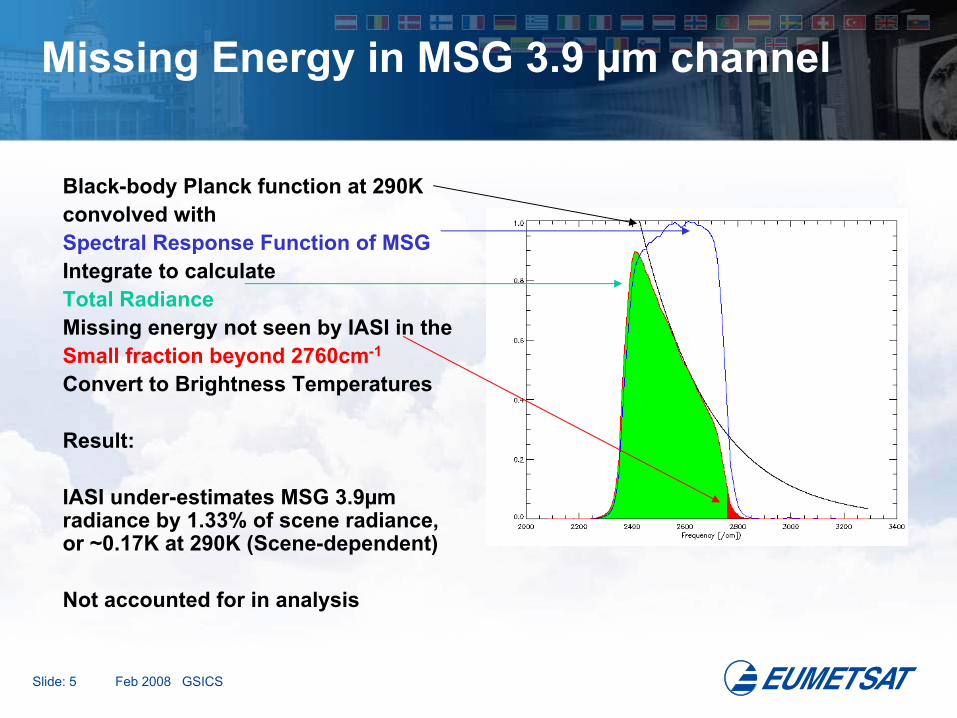
Missing Energy in MSG 3.9 µm channel
Black-body Planck function at 290Kconvolved with Spectral Response Function of MSGIntegrate to calculate Total RadianceMissing energy not seen by IASI in theSmall fraction beyond 2760cm-1
Convert to Brightness Temperatures
Result:
IASI under-estimates MSG 3.9µm radiance by 1.33% of scene radiance, or ~0.17K at 290K (Scene-dependent)
Not accounted for in analysis
Slide: 6 Feb 2008 GSICS
New Radiance Definition
Marianne told us all about the new radiance definitionECP833 also includes changes to non-linearity corrections
As a temporary work around for 2007 data,needed to ensure consistent definition of radiance:– Read in old IMPF-defined radiances– Convert to brightness temperatures– Convert back to effective radiances
Archive Data will be re-processed according to new definition

Slide: 7 Feb 2008 GSICS
Collocation Criteria
Meteosat First Generation
∆Lat < 30°, ∆Lon < 30° of SSP∆t < 30 mins (=scan period)|θ| < 15° (Incidence angle)∆θ < 2° (Incidence angle diff.)3x3 MFG pixels / IASI iFoV
Meteosat Second Generation
∆Lat < 30°, ∆Lon < 30° of SSP∆t < 15 mins (=scan period)|θ| < 15° (Incidence angle)∆θ < 2° (Incidence angle diff.)5x5 MSG pixels / IASI iFoV
(Corrected Radiance Definition)
Can investigate temporal variability and angular dependence further using Rapid Scan data

Slide: 8 Feb 2008 GSICS
Uncertainty due to Spatial Variability
Estimate uncertainty due to spatial variabilityas Standard Deviation of Meteosat pixels within collocated IASI iFoVs
Use as error bars in weighted regression
IASI iFoV Meteosat
pixels
Slide: 9 Feb 2008 GSICS
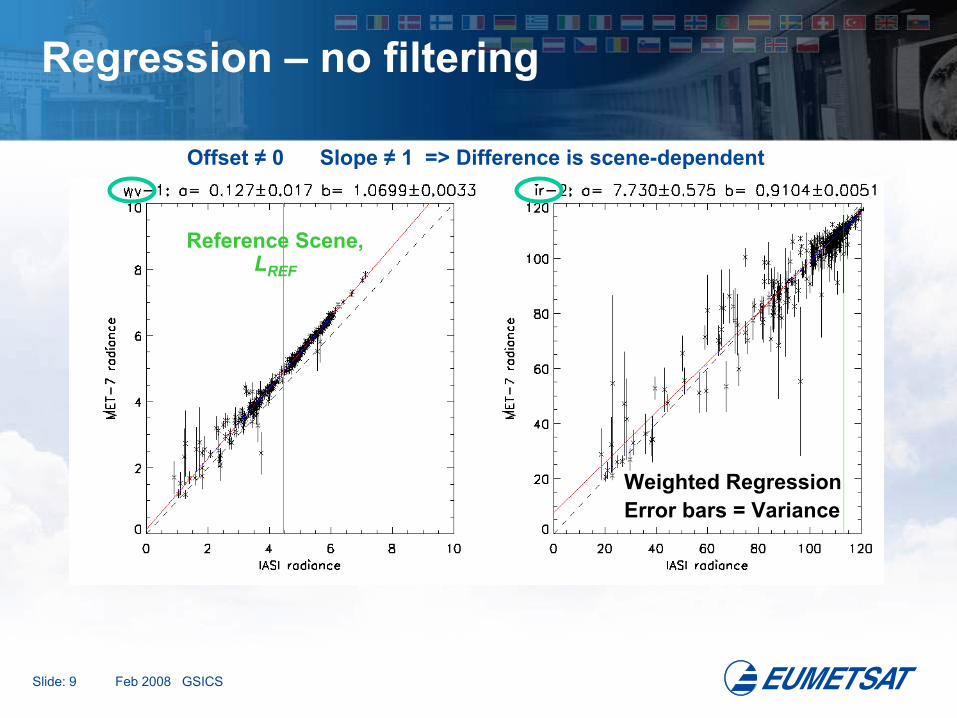
Regression – no filtering
Offset ≠ 0 Slope ≠ 1 => Difference is scene-dependent
Weighted RegressionError bars = Variance
Reference Scene, LREF
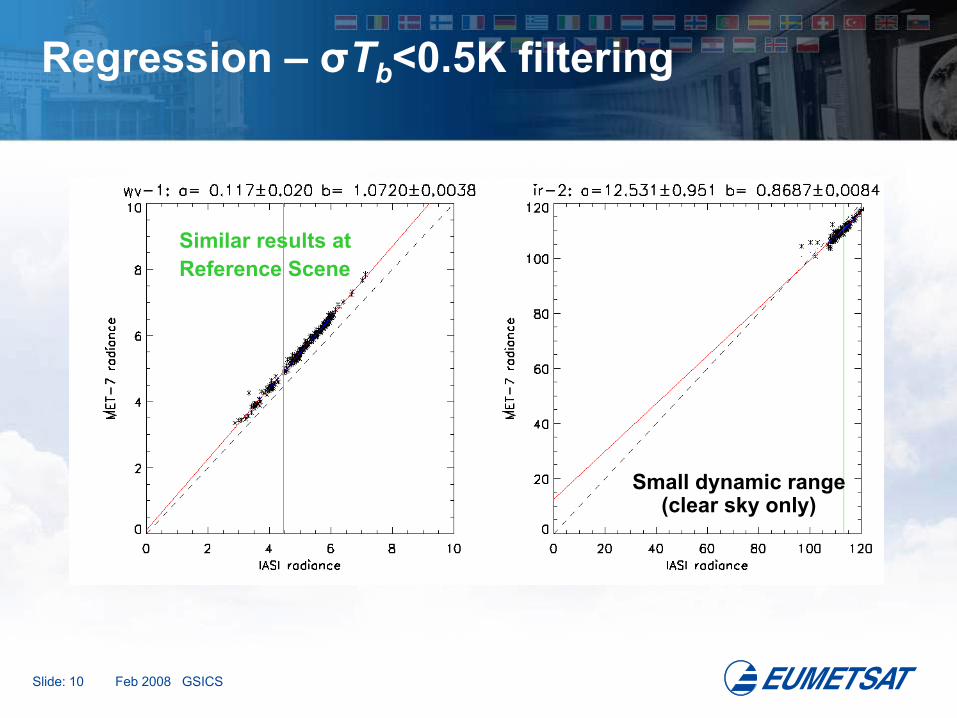
Slide: 10 Feb 2008 GSICS
Regression – σTb<0.5K filtering
Small dynamic range (clear sky only)
Similar results atReference Scene
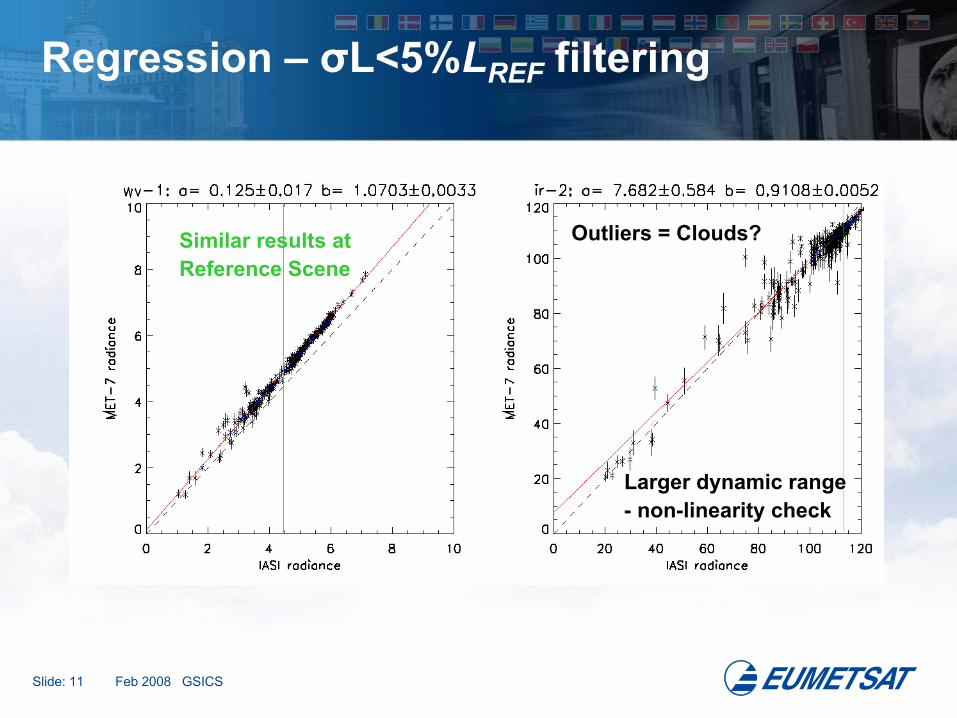
Slide: 11 Feb 2008 GSICS
Regression – σL<5%LREF filtering
Larger dynamic range- non-linearity check
Similar results atReference Scene
Outliers = Clouds?
Slide: 12 Feb 2008 GSICS
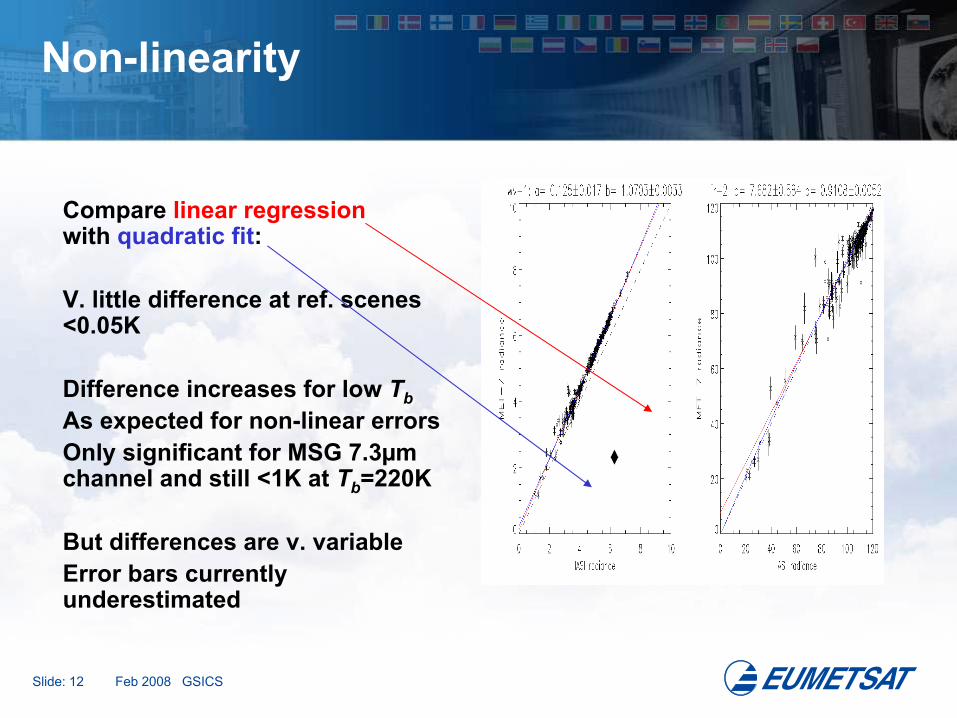
Non-linearity
Compare linear regressionwith quadratic fit:
V. little difference at ref. scenes <0.05K
Difference increases for low TbAs expected for non-linear errorsOnly significant for MSG 7.3µm channel and still <1K at Tb=220K
But differences are v. variableError bars currently underestimated
Slide: 13 Feb 2008 GSICS
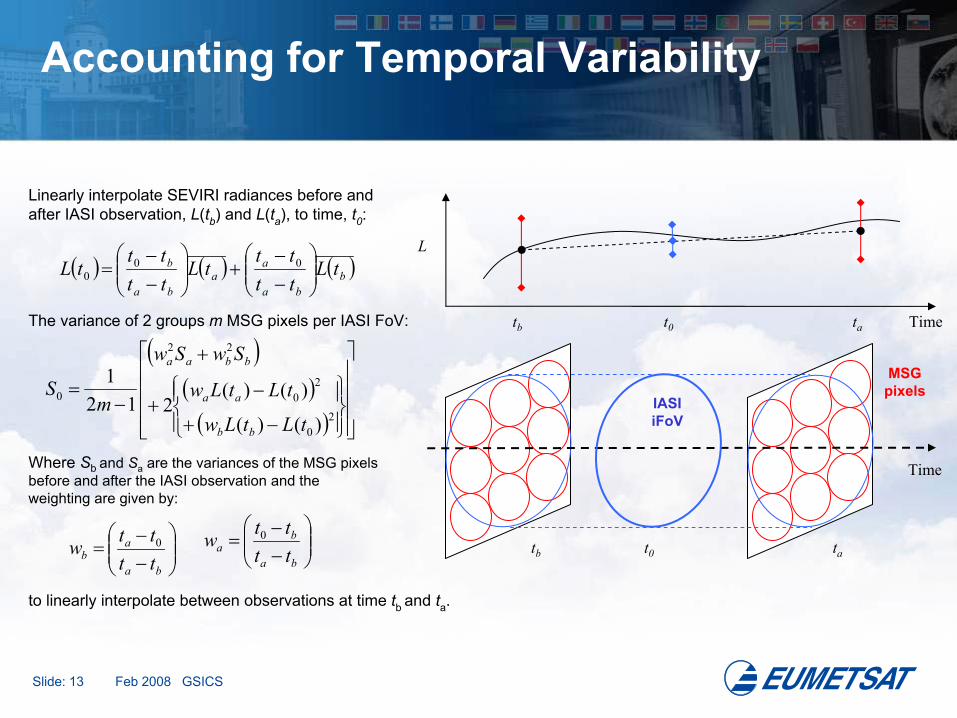
Accounting for Temporal Variability
tb tat0
tat0tb
L
Time
Time
IASI iFoV
MSG pixels
Linearly interpolate SEVIRI radiances before and after IASI observation, L(tb) and L(ta), to time, t0:
( ) ( ) ( )bba
aa
ba
b tLtttttL
tttttL
−−
+
−−
= 000
( )( )( )
−+
−+
+
−=
20
20
22
0
)()(
)()(212
1
tLtLw
tLtLw
SwSw
mS
bb
aa
bbaa
−−
=ba
ab tt
ttw 0
−−
=ba
ba tt
ttw 0
The variance of 2 groups m MSG pixels per IASI FoV:
Where Sb and Sa are the variances of the MSG pixels before and after the IASI observation and the weighting are given by:
to linearly interpolate between observations at time tb and ta.
Slide: 14 Feb 2008 GSICS
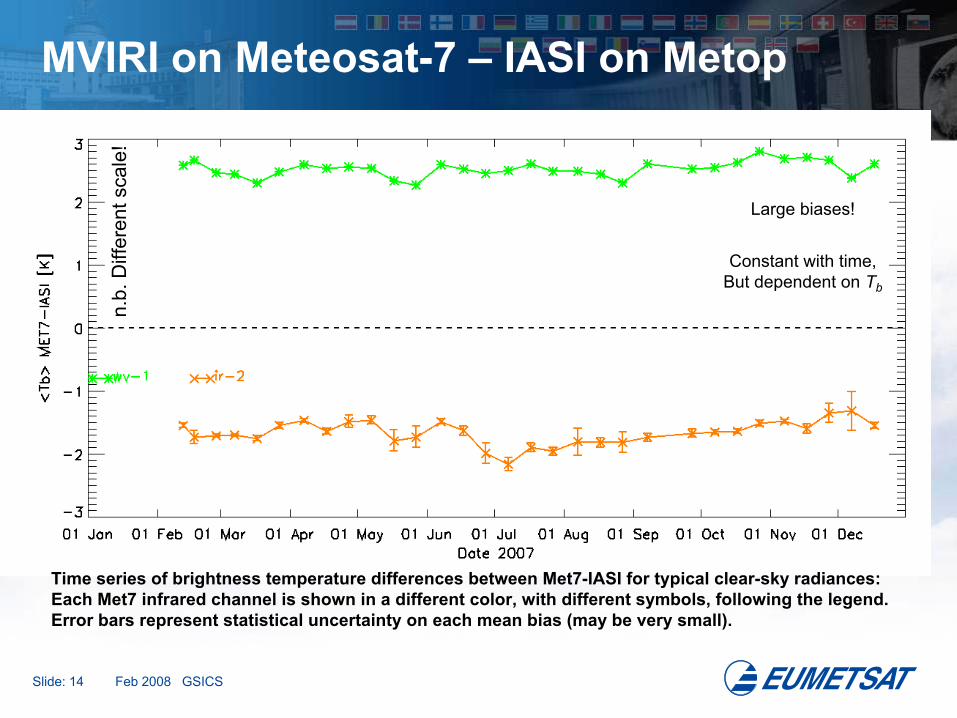
MVIRI on Meteosat-7 – IASI on Metop
Time series of brightness temperature differences between Met7-IASI for typical clear-sky radiances: Each Met7 infrared channel is shown in a different color, with different symbols, following the legend.Error bars represent statistical uncertainty on each mean bias (may be very small).
Large biases!
Constant with time, But dependent on Tb
n.b.
Diff
eren
t sca
le!

Slide: 15 Feb 2008 GSICS
SEVIRI on Meteosat-8 – IASI on Metop
Time series of brightness temperature differences between MSG1-IASI for typical clear-sky radiances. Each MSG infrared channel is shown in a different color, with different symbols, following the legend.Error bars represent statistical uncertainty on each mean bias (may be very small).
Small biases: µ<1KConstant: σ ~0.10K
Slide: 16 Feb 2008 GSICS
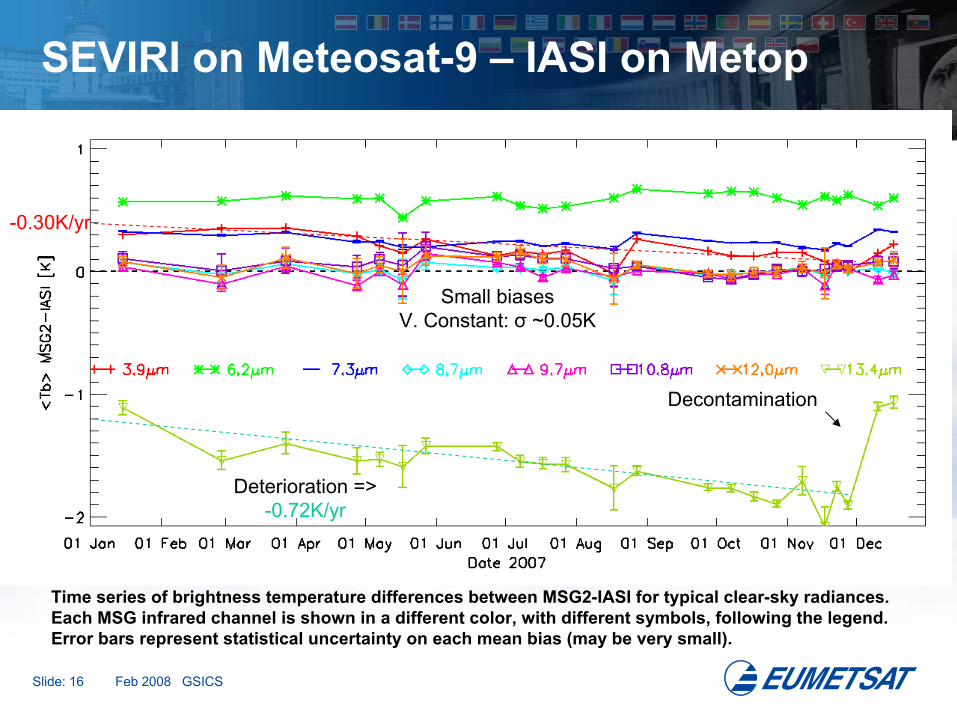
SEVIRI on Meteosat-9 – IASI on Metop
Time series of brightness temperature differences between MSG2-IASI for typical clear-sky radiances. Each MSG infrared channel is shown in a different color, with different symbols, following the legend.Error bars represent statistical uncertainty on each mean bias (may be very small).
Decontamination
Small biasesV. Constant: σ ~0.05K
Deterioration => -0.72K/yr
-0.30K/yr

Slide: 17 Feb 2008 GSICS
Contamination of MSG2 13.4µm filter
Possible explanation:Build-up of ice on filter
Use spectral response function of different thickness ice To modify 13.4µm channel’s nominal SRFRepeat IASI comparison for each caseTest contaminated/nominal ratio is consistent with trend
Slide: 18 Feb 2008 GSICS
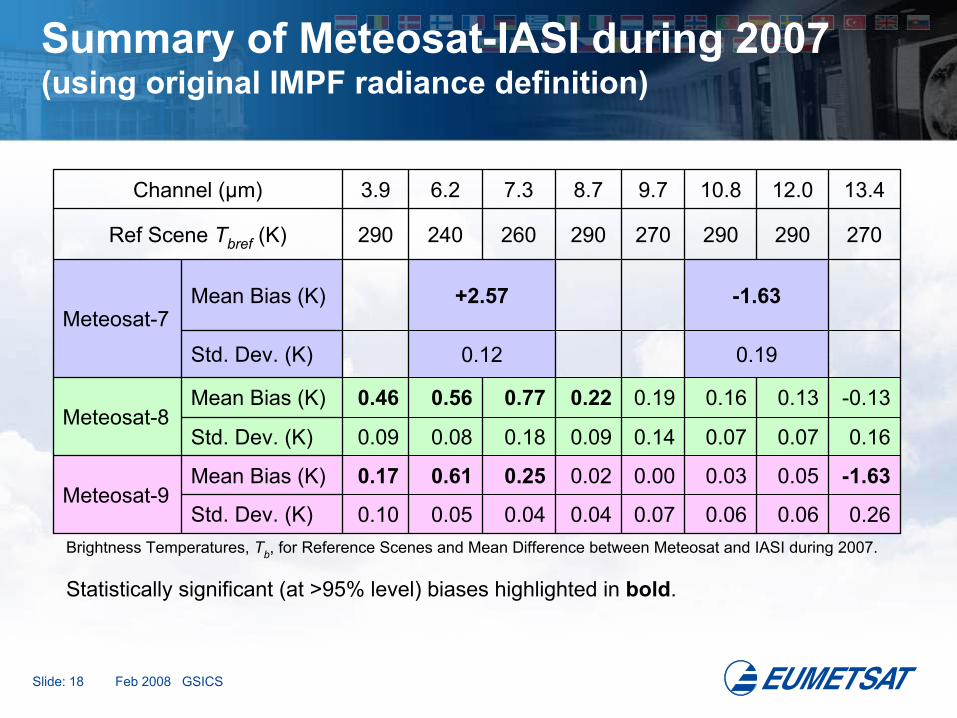
Summary of Meteosat-IASI during 2007(using original IMPF radiance definition)
Brightness Temperatures, Tb, for Reference Scenes and Mean Difference between Meteosat and IASI during 2007.
Statistically significant (at >95% level) biases highlighted in bold.
Meteosat-9
Meteosat-8
Meteosat-7
0.260.060.060.070.040.040.050.10Std. Dev. (K)
-0.130.130.160.190.220.770.560.46Mean Bias (K)
0.160.070.070.140.090.180.080.09Std. Dev. (K)
-1.630.050.030.000.020.250.610.17Mean Bias (K)
0.190.12Std. Dev. (K)
-1.63+2.57Mean Bias (K)
270290290270290260240290Ref Scene Tbref (K)
13.412.010.89.78.77.36.23.9Channel (µm)

Slide: 19 Feb 2008 GSICS
Meteosat-9 results Before and After new radiance definition & non-linearity corrections
Brightness Temperatures, Tb, for Reference Scenes and Mean Difference between Meteosat-9 and IASI during 2007.
Before and after reprocessing with new radiance definition and non-linearity correctionsStatistically significant (at >95% level) biases highlighted in bold – only 7.3 and 13.4µm
0.060.04
0.050.25
Meteosat-9AFTER
New-Old(non-linear corrn)
Meteosat-9BEFORE
0.260.060.070.070.040.040.060.10Std. Dev. (K)
0.29-0.02 -0.01-0.01-0.06-0.11 -0.65-0.14Mean Bias (K)
0.050.020.030.010.000.020.040.01Std. Dev. (K)
-1.340.030.02-0.01-0.040.14-0.040.03Mean Bias (K)
0.260.060.070.040.050.10Std. Dev. (K)
-1.630.030.000.020.610.17Mean Bias (K)
270290290270290260240290Ref Scene Tbref (K)
13.412.010.89.78.77.36.23.9Channel (µm)
Slide: 20 Feb 2008 GSICS
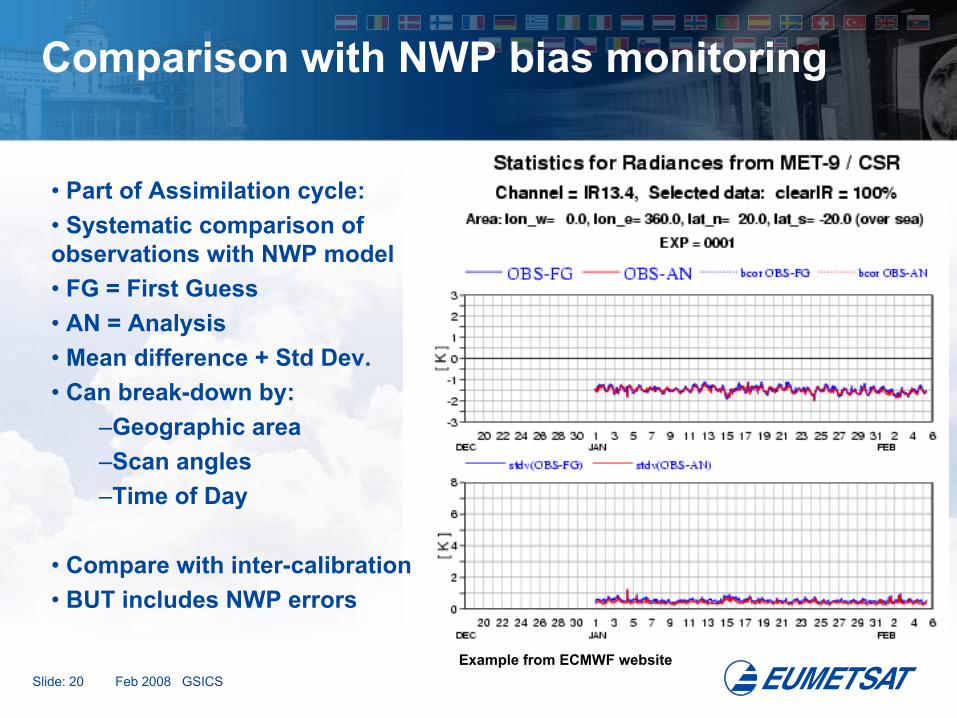
Comparison with NWP bias monitoring
Example from ECMWF website
• Part of Assimilation cycle:• Systematic comparison of observations with NWP model• FG = First Guess• AN = Analysis• Mean difference + Std Dev.• Can break-down by:
–Geographic area–Scan angles–Time of Day
• Compare with inter-calibration• BUT includes NWP errors

Slide: 21 Feb 2008 GSICS
ECMWF bias monitoring for AIRS & IASI
+0.6+1.14.013-0.5-0.54.175+0.4+1.54.186+0.6+0.94.426+0.1>+26.426-0.2+0.87.130-0.1-0.17.513-0.5-0.38.840-1.6+0.19.622-0.1-0.610.900.0-0.314.03-0.1-0.314.33<-2-3.314.98
< IASI-FG> (K)
<AIRS-FG> (K)
Channel (µm) • Jan 2008
• Tropics, Clear Skies over Sea• Day and night
–But different orbits!
• Mean OBS-FG estimated–Same AIRS-IASI channels
• Significant biases (>95%) shown in bold:
– 4 channels for AIRS– 2 channels for IASI

Slide: 22 Feb 2008 GSICS
MVIRI on Meteosat-7 – IASI on Metop
Time series of brightness temperature differences between Met7-IASI for typical clear-sky radiances: Each Met7 infrared channel is shown in a different color, with different symbols, following the legend.Error bars represent statistical uncertainty on each mean bias (may be very small).
Large biases!~½ ECMWF
IR-2
WV-1
Ch.
295K
245K
Tbref
+4.5±1.0K+2.57±0.12K
-2.5±1.0K-1.63±0.19K
ECMWF Obs-AN
Met7-IASI
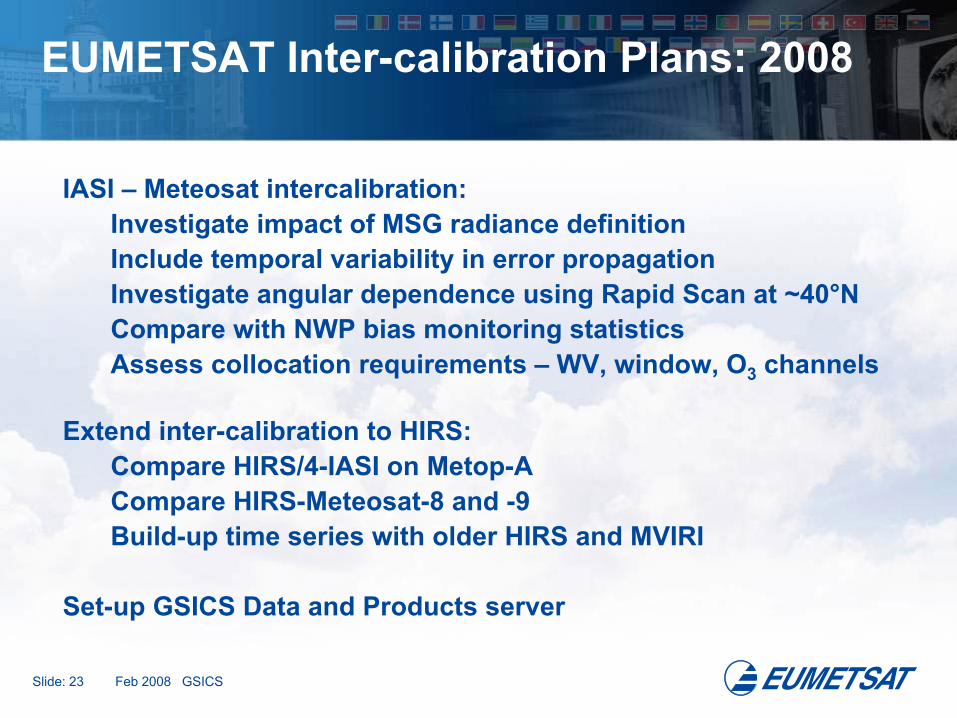
Slide: 23 Feb 2008 GSICS
EUMETSAT Inter-calibration Plans: 2008
IASI – Meteosat intercalibration: Investigate impact of MSG radiance definitionInclude temporal variability in error propagationInvestigate angular dependence using Rapid Scan at ~40°NCompare with NWP bias monitoring statisticsAssess collocation requirements – WV, window, O3 channels
Extend inter-calibration to HIRS:Compare HIRS/4-IASI on Metop-ACompare HIRS-Meteosat-8 and -9Build-up time series with older HIRS and MVIRI
Set-up GSICS Data and Products server

Slide: 24 Feb 2008 GSICS
Coordinating Inter-calibration Activities
2008 2007 2006 2005 2004 2003 2002 2001 2Meteosat MET-9 SEVIRI
MET-8 SEVIRIMET-7 MVIRIMET-6 MVIRIMET-5 MVIRIMET-4MET-3MET-2MET-1
LEO Metop-A IASIAqua AIRS
LEO HIRS Metop-A HIRS/4NOAA-18 HIRS/4NOAA-17 HIRS/3NOAA-16 HIRS/3NOAA-15 HIRS/3NOAA-14 HIRS/2
0E
17:08
63E
0E57E 0E
57E
21:55
09:30
16:2822:01
13:36
Wang
Complete
Planned
EUMETSATNOAAOther