version 0.2, 16 january 2004 slide: 1 applications of meteosat second generation (msg) squall lines...
TRANSCRIPT
Version 0.2, 16 January 2004 Slide: 1
APPLICATIONS OFMETEOSAT SECOND GENERATION (MSG)
SQUALL LINES
Author:Author: Jochen Kerkmann (EUMETSAT)Jochen Kerkmann (EUMETSAT) ([email protected])([email protected])
Contributors:Contributors: D. Rosenfeld (HUJ)D. Rosenfeld (HUJ)
Version 0.2, 16 January 2004 Slide: 2
Squall Line over Western Africa14 July 2003
Version 0.2, 16 January 2004 Slide: 3
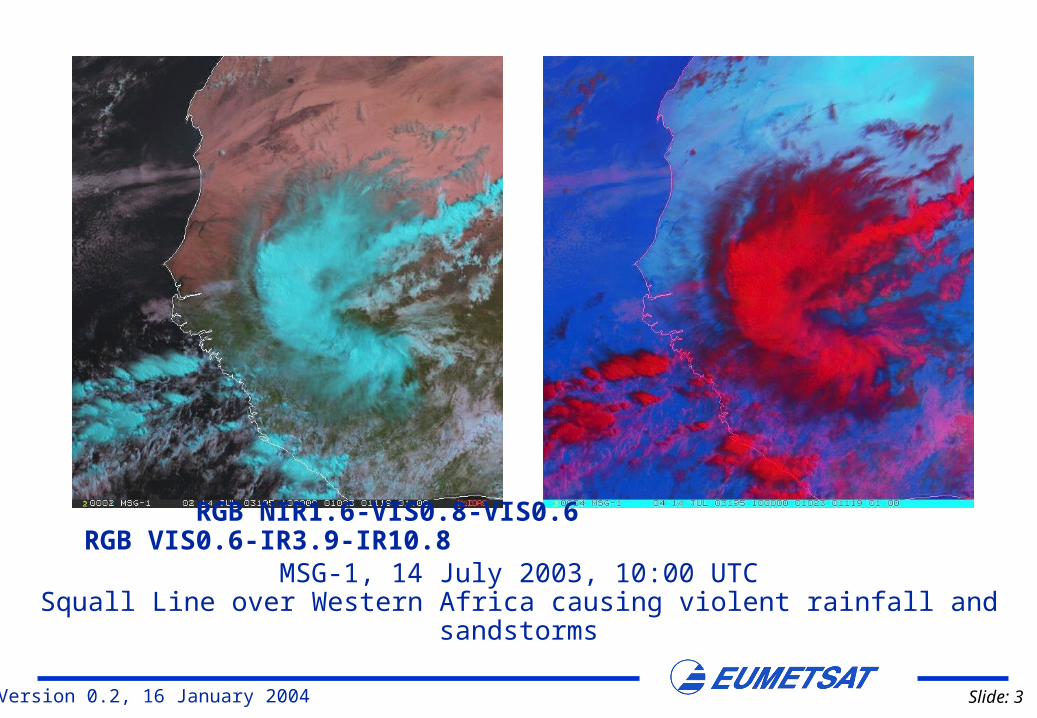
MSG-1, 14 July 2003, 10:00 UTCSquall Line over Western Africa causing violent rainfall and sandstorms
RGB NIR1.6-VIS0.8-VIS0.6 RGB VIS0.6-IR3.9-IR10.8
Version 0.2, 16 January 2004 Slide: 4
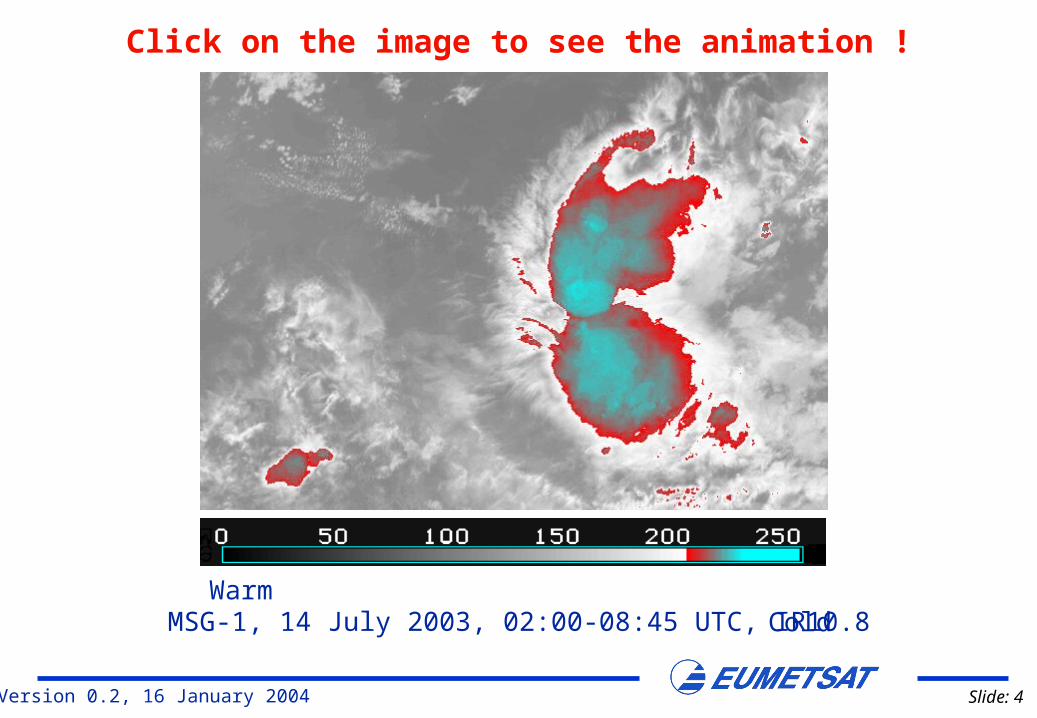
MSG-1, 14 July 2003, 02:00-08:45 UTC, IR10.8
Click on the image to see the animation !
Warm Cold
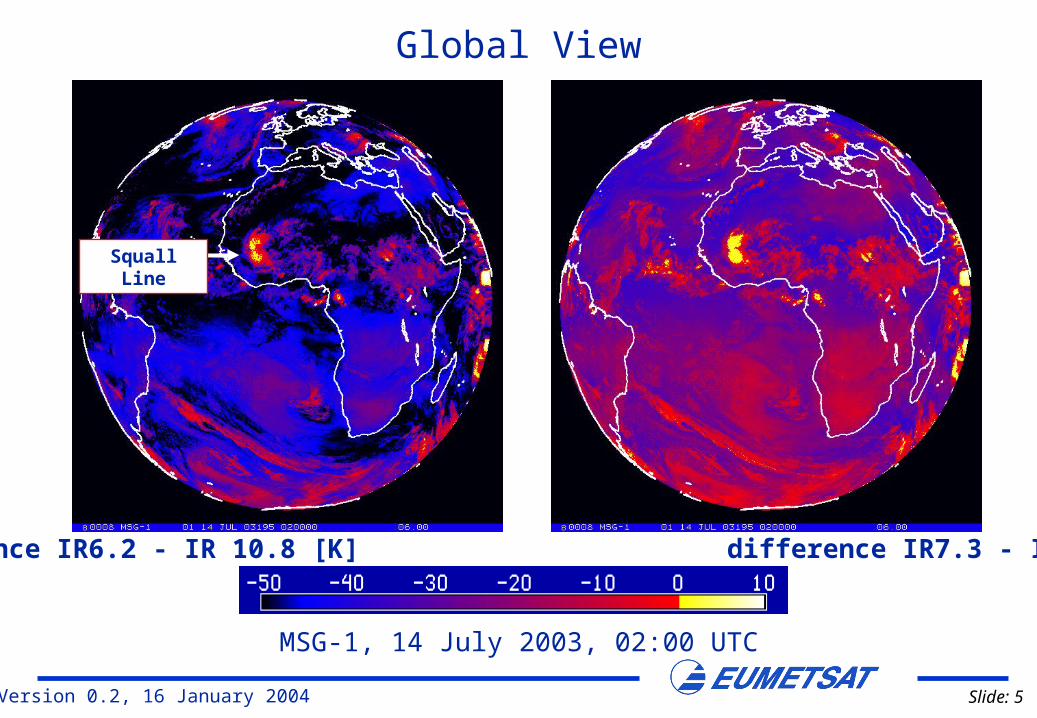
Version 0.2, 16 January 2004 Slide: 5
MSG-1, 14 July 2003, 02:00 UTC
difference IR6.2 - IR 10.8 [K] difference IR7.3 - IR10.8 [K]
Squall Line
Global View
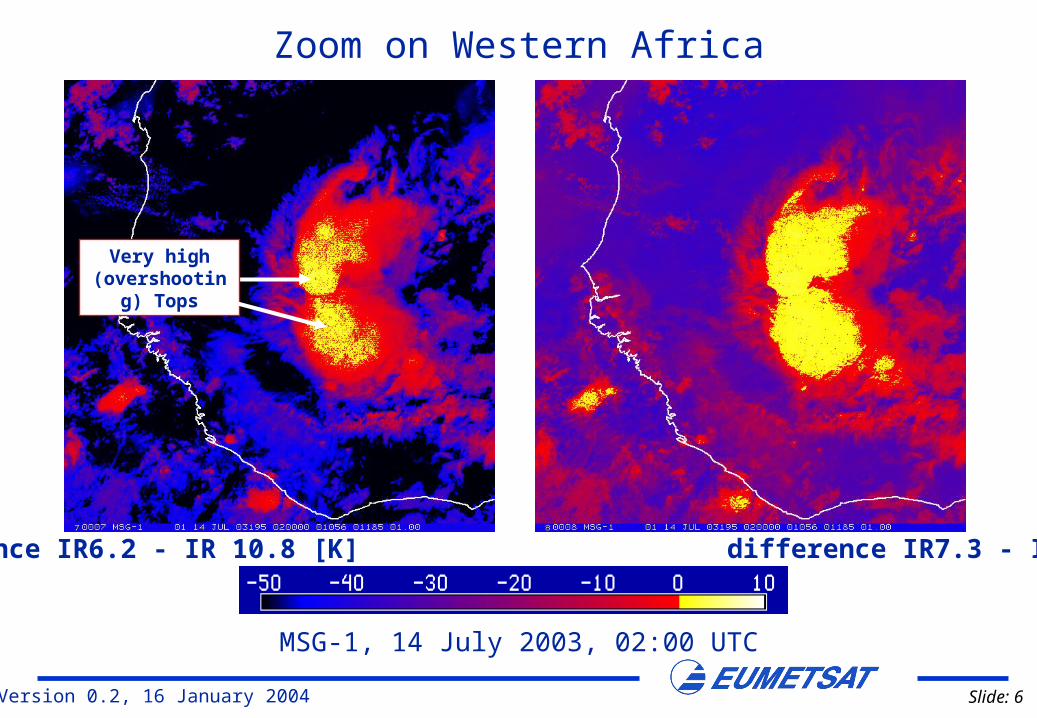
Version 0.2, 16 January 2004 Slide: 6
difference IR6.2 - IR 10.8 [K] difference IR7.3 - IR10.8 [K]
MSG-1, 14 July 2003, 02:00 UTC
Zoom on Western Africa
Very high (overshooting)
Tops
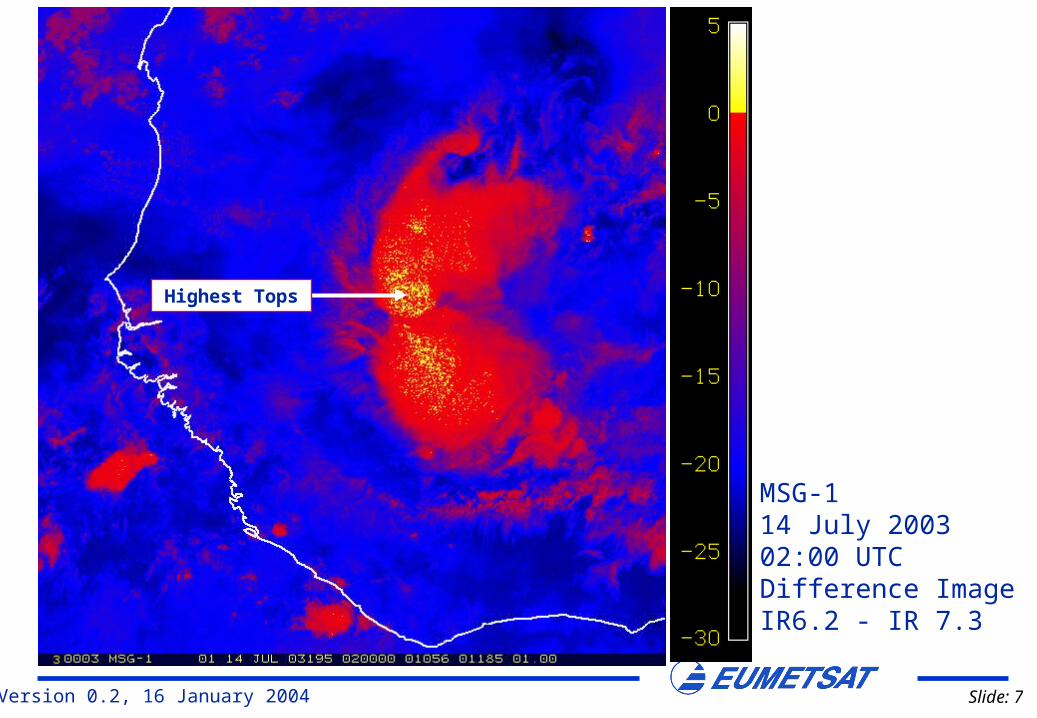
Version 0.2, 16 January 2004 Slide: 7
MSG-114 July 200302:00 UTCDifference ImageIR6.2 - IR 7.3
Highest Tops
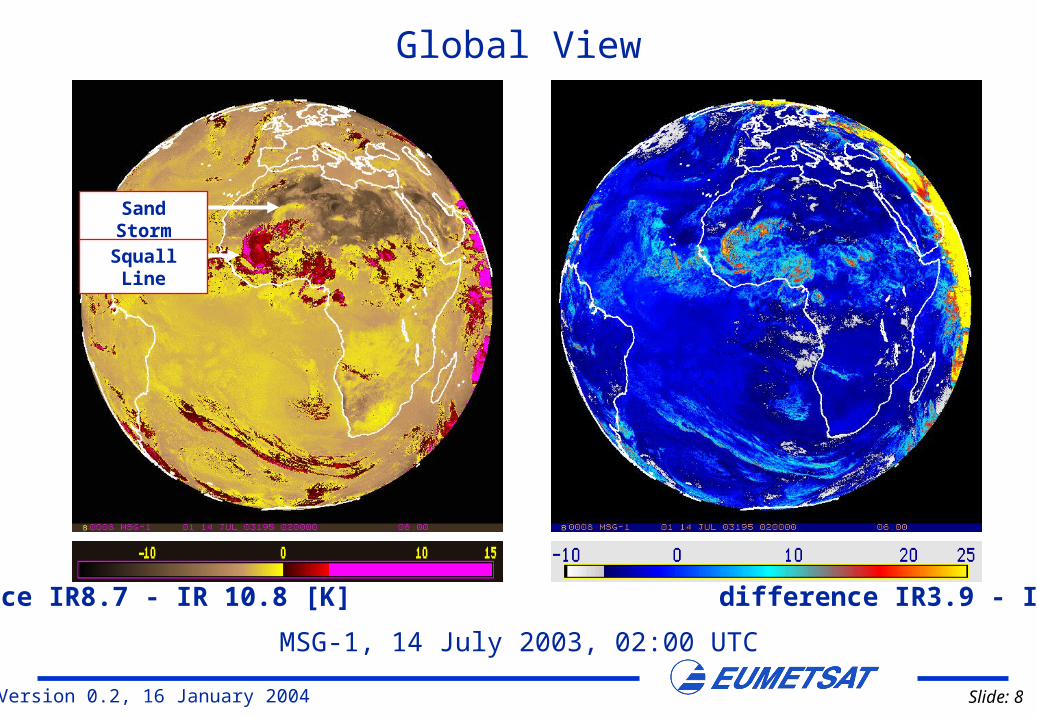
Version 0.2, 16 January 2004 Slide: 8
difference IR8.7 - IR 10.8 [K] difference IR3.9 - IR10.8 [K]
MSG-1, 14 July 2003, 02:00 UTC
Sand Storm
Squall Line
Global View
Version 0.2, 16 January 2004 Slide: 9
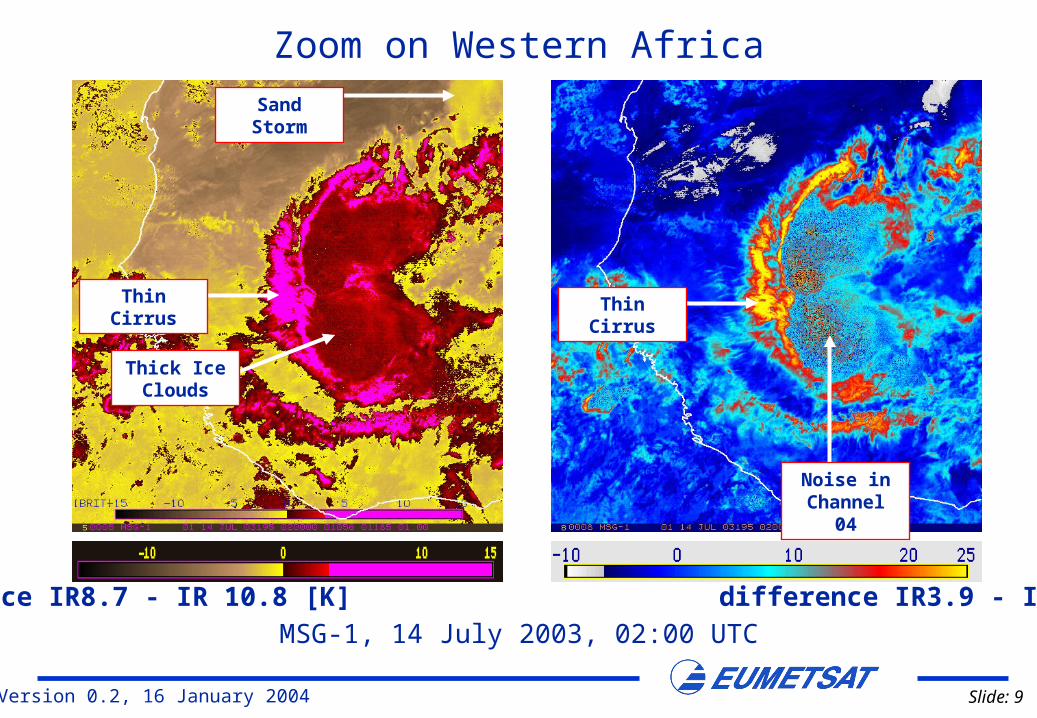
difference IR8.7 - IR 10.8 [K] difference IR3.9 - IR10.8 [K]
MSG-1, 14 July 2003, 02:00 UTC
Zoom on Western Africa
Sand Storm
Thin Cirrus Thin Cirrus
Noise in Channel 04
Thick Ice Clouds
Version 0.2, 16 January 2004 Slide: 10
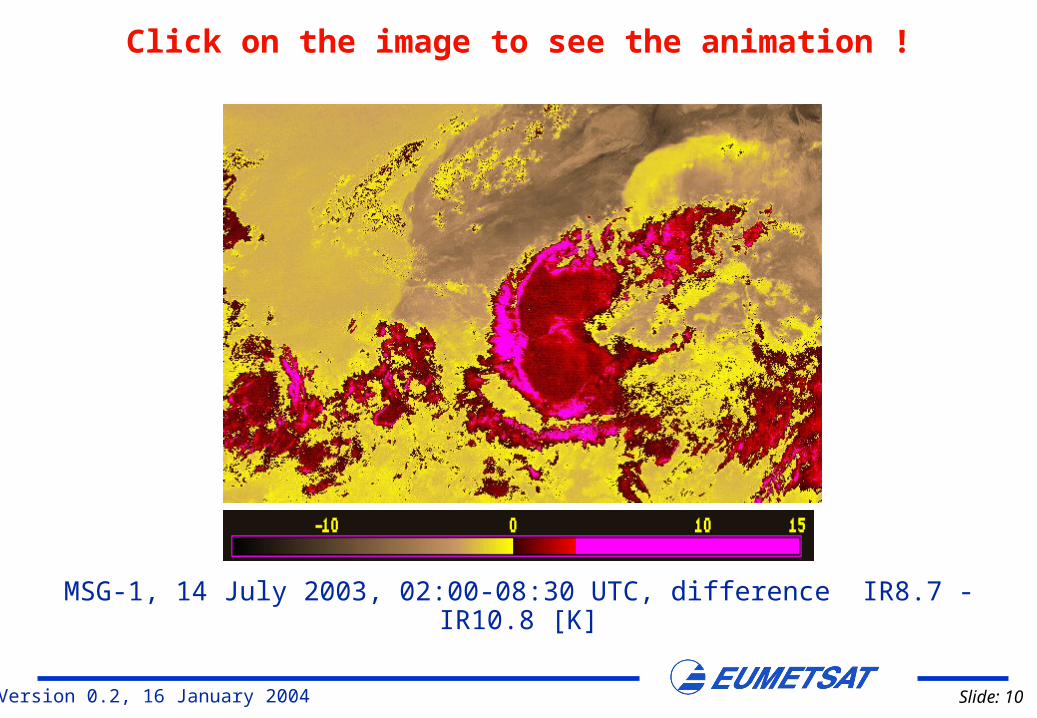
MSG-1, 14 July 2003, 02:00-08:30 UTC, difference IR8.7 - IR10.8 [K]
Click on the image to see the animation !
Version 0.2, 16 January 2004 Slide: 11
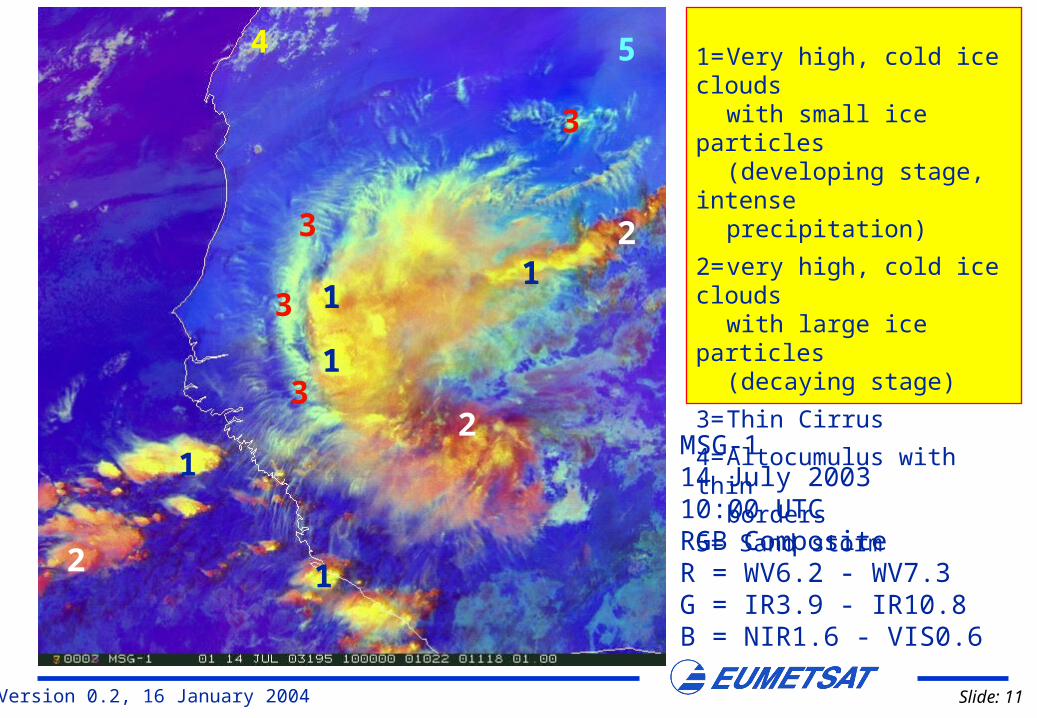
MSG-114 July 200310:00 UTCRGB CompositeR = WV6.2 - WV7.3G = IR3.9 - IR10.8B = NIR1.6 - VIS0.6
1= Very high, cold ice cloudswith small ice particles
(developing stage, intense precipitation)
2= very high, cold ice cloudswith large ice particles (decaying stage)
3= Thin Cirrus
4= Altocumulus with thinborders
5= Sand storm
11
1
1
2
2
2
1
4
3
3
3
3
5
Version 0.2, 16 January 2004 Slide: 12
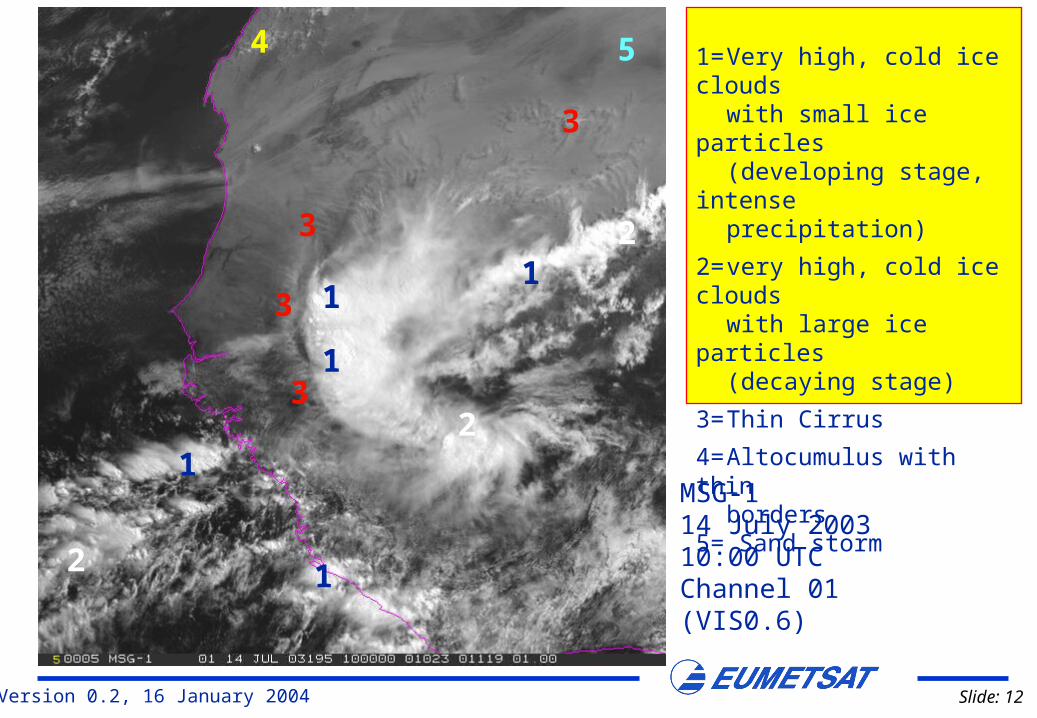
MSG-114 July 200310:00 UTCChannel 01(VIS0.6)
11
1
1
2
2
1
2
3
3
3
3
4 5 1= Very high, cold ice cloudswith small ice particles
(developing stage, intense precipitation)
2= very high, cold ice cloudswith large ice particles (decaying stage)
3= Thin Cirrus
4= Altocumulus with thinborders
5= Sand storm
Version 0.2, 16 January 2004 Slide: 13
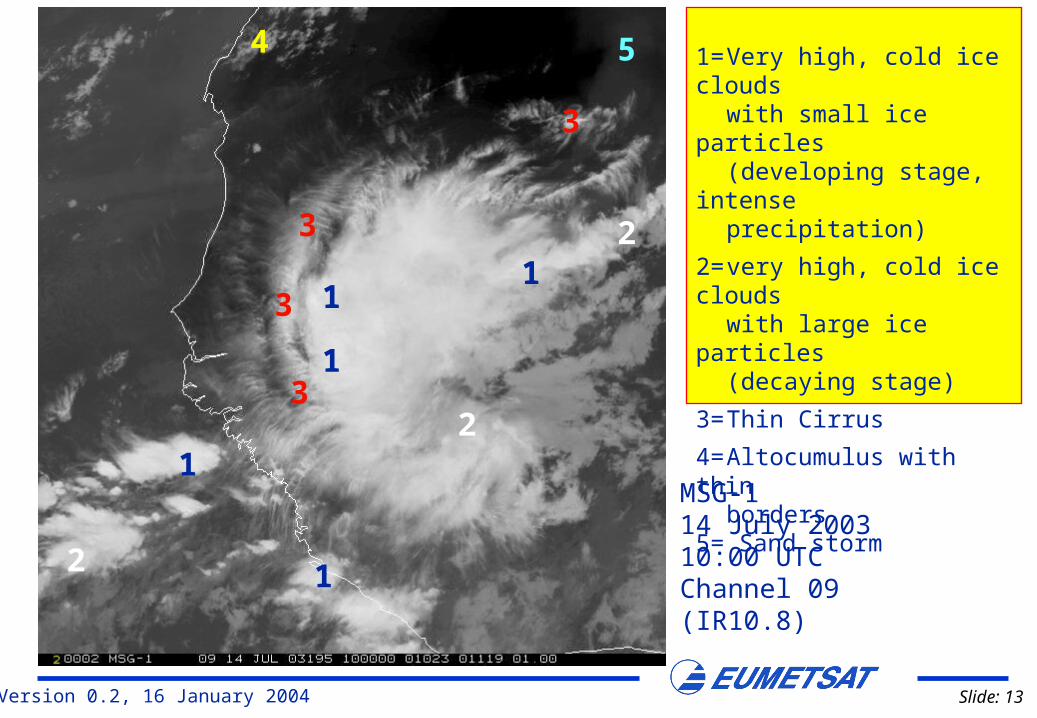
MSG-114 July 200310:00 UTCChannel 09(IR10.8)
11
1
1
2
2
1
2
3
3
3
3
4 5 1= Very high, cold ice cloudswith small ice particles
(developing stage, intense precipitation)
2= very high, cold ice cloudswith large ice particles (decaying stage)
3= Thin Cirrus
4= Altocumulus with thinborders
5= Sand storm
Version 0.2, 16 January 2004 Slide: 14
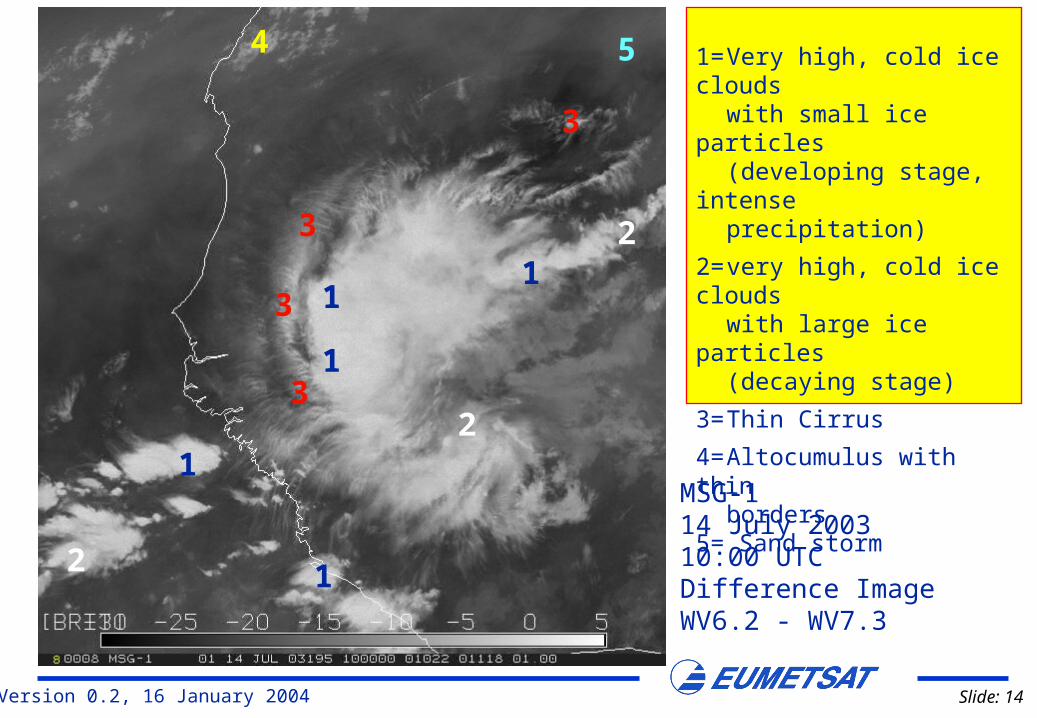
MSG-114 July 200310:00 UTCDifference ImageWV6.2 - WV7.3
1
1
1
1
12
2
2
3
3
3
3
4 5 1= Very high, cold ice cloudswith small ice particles
(developing stage, intense precipitation)
2= very high, cold ice cloudswith large ice particles (decaying stage)
3= Thin Cirrus
4= Altocumulus with thinborders
5= Sand storm
Version 0.2, 16 January 2004 Slide: 15
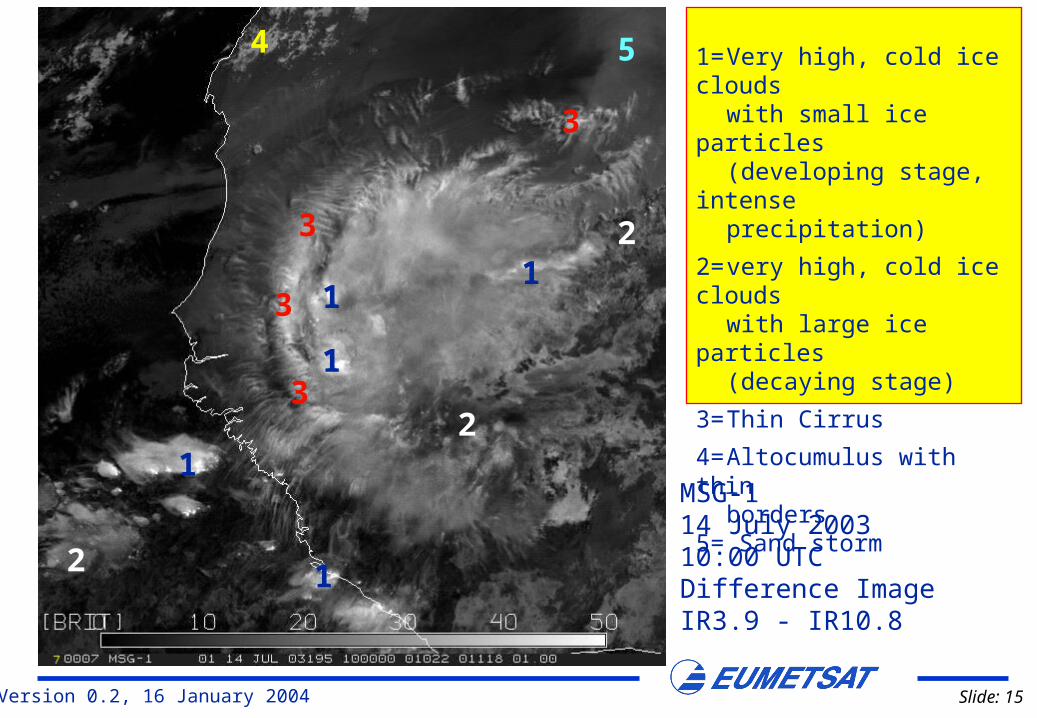
MSG-114 July 200310:00 UTCDifference ImageIR3.9 - IR10.8
1
1
1
1
12
2
2
3
3
3
3
4 5 1= Very high, cold ice cloudswith small ice particles
(developing stage, intense precipitation)
2= very high, cold ice cloudswith large ice particles (decaying stage)
3= Thin Cirrus
4= Altocumulus with thinborders
5= Sand storm
Version 0.2, 16 January 2004 Slide: 16
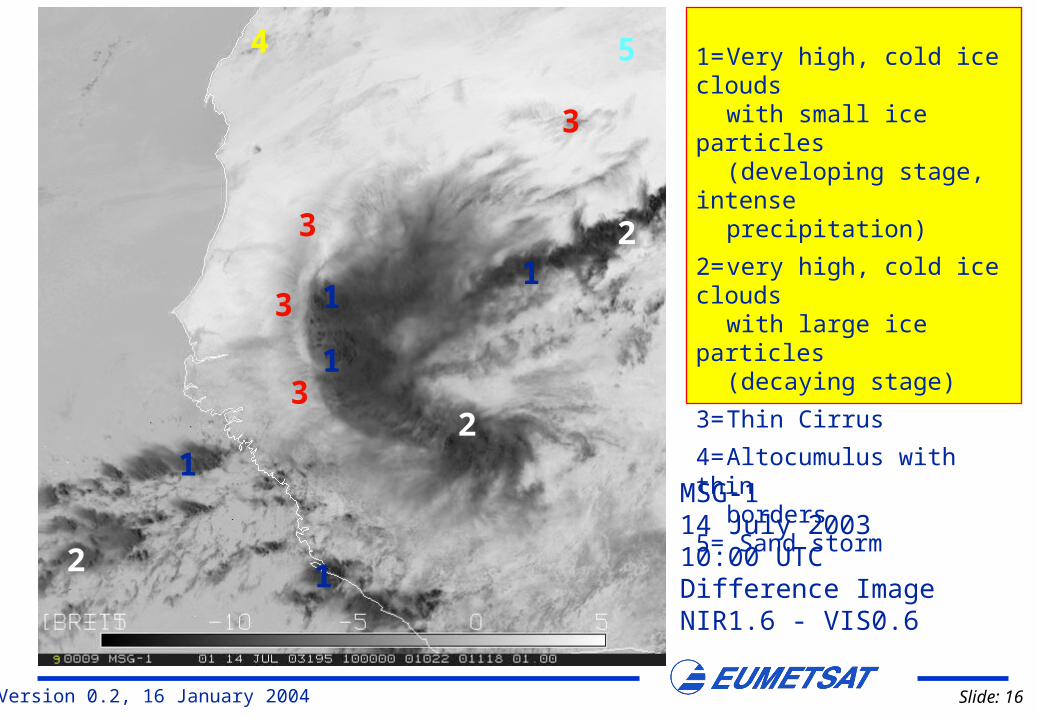
MSG-114 July 200310:00 UTCDifference ImageNIR1.6 - VIS0.6
1
1
1
1
12
2
2
3
3
3
3
4 5 1= Very high, cold ice cloudswith small ice particles
(developing stage, intense precipitation)
2= very high, cold ice cloudswith large ice particles (decaying stage)
3= Thin Cirrus
4= Altocumulus with thinborders
5= Sand storm
Version 0.2, 16 January 2004 Slide: 17
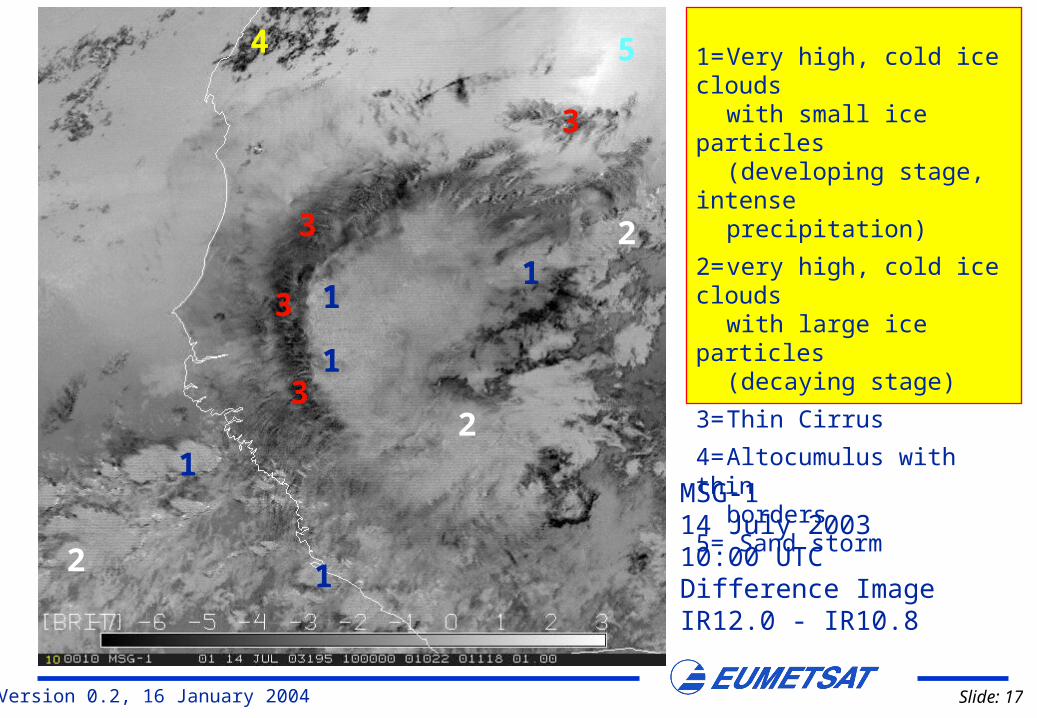
MSG-114 July 200310:00 UTCDifference ImageIR12.0 - IR10.8
1
1
1
1
12
2
2
3
3
3
3
4 5 1= Very high, cold ice cloudswith small ice particles
(developing stage, intense precipitation)
2= very high, cold ice cloudswith large ice particles (decaying stage)
3= Thin Cirrus
4= Altocumulus with thinborders
5= Sand storm
Version 0.2, 16 January 2004 Slide: 18
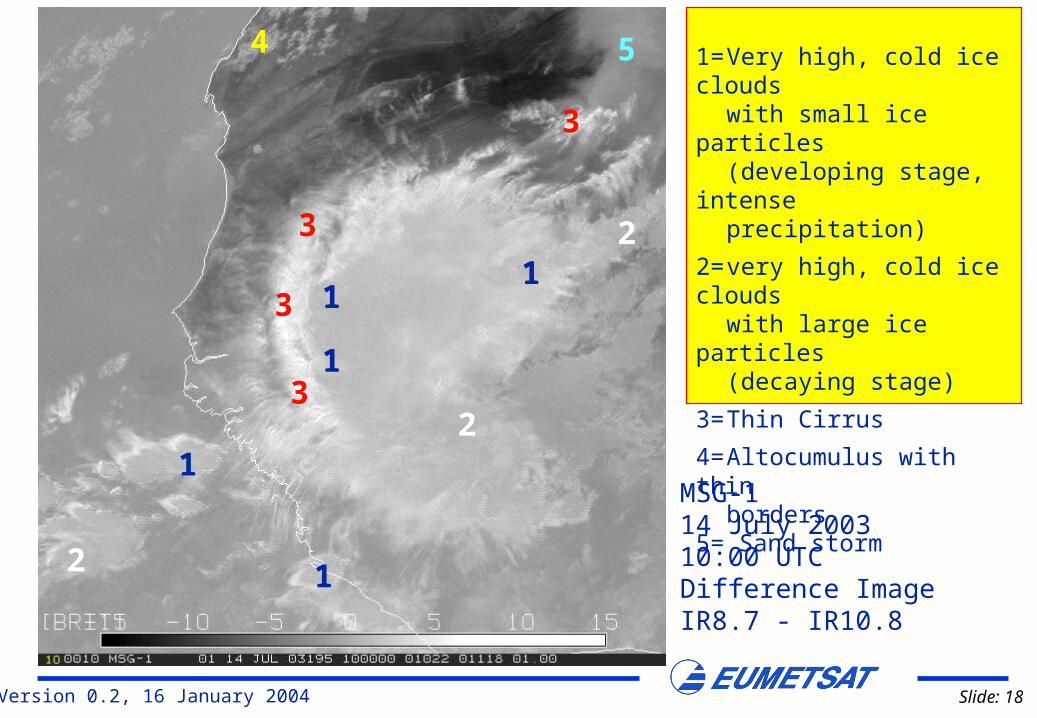
MSG-114 July 200310:00 UTCDifference ImageIR8.7 - IR10.8
1
1
1
1
12
2
2
3
3
3
3
4 5 1= Very high, cold ice cloudswith small ice particles
(developing stage, intense precipitation)
2= very high, cold ice cloudswith large ice particles (decaying stage)
3= Thin Cirrus
4= Altocumulus with thinborders
5= Sand storm
Version 0.2, 16 January 2004 Slide: 19
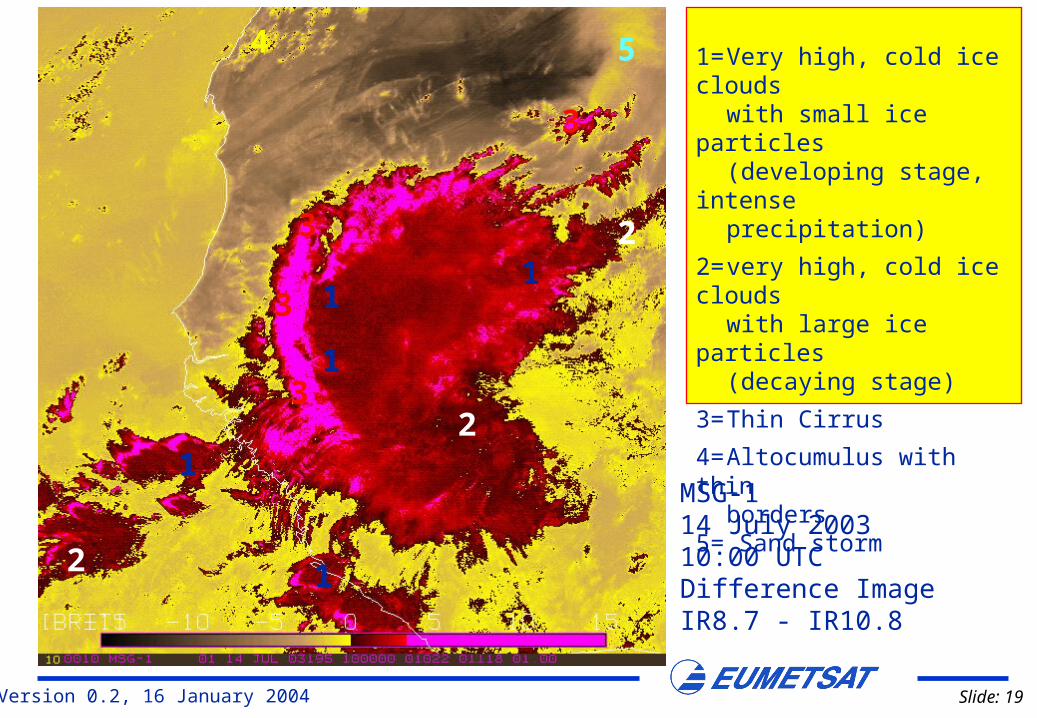
MSG-114 July 200310:00 UTCDifference ImageIR8.7 - IR10.8
1
1
1
1
12
2
2
3
3
3
3
4 5 1= Very high, cold ice cloudswith small ice particles
(developing stage, intense precipitation)
2= very high, cold ice cloudswith large ice particles (decaying stage)
3= Thin Cirrus
4= Altocumulus with thinborders
5= Sand storm
Version 0.2, 16 January 2004 Slide: 20
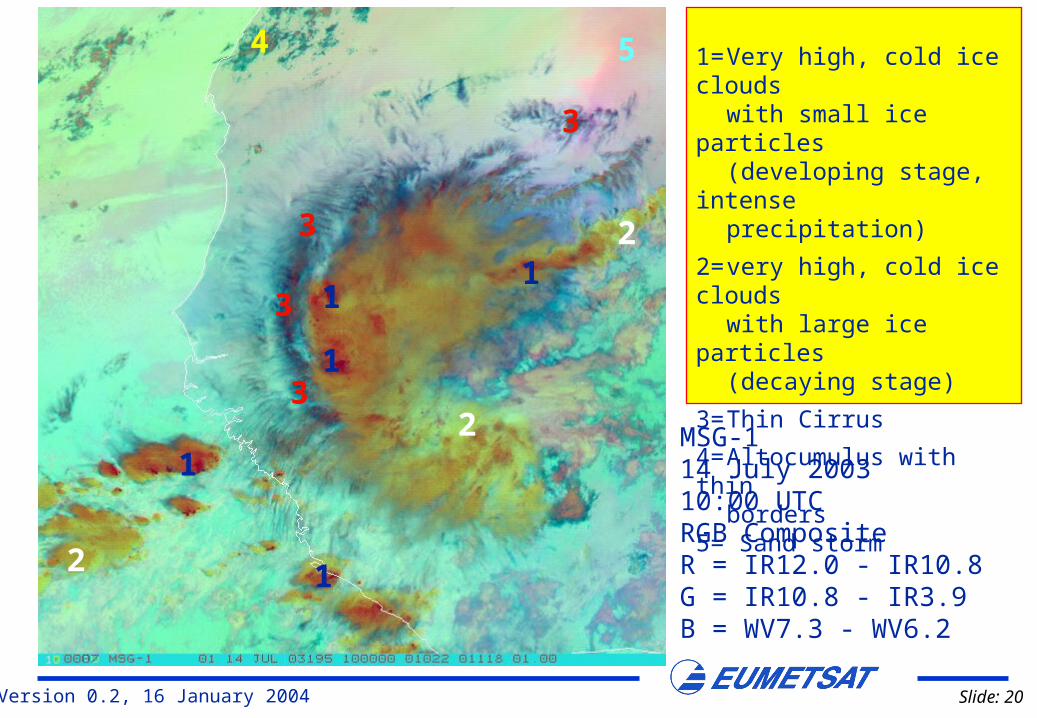
MSG-114 July 200310:00 UTCRGB CompositeR = IR12.0 - IR10.8G = IR10.8 - IR3.9B = WV7.3 - WV6.2
1
1
1
1
12
2
2
3
3
3
3
4 5 1= Very high, cold ice cloudswith small ice particles
(developing stage, intense precipitation)
2= very high, cold ice cloudswith large ice particles (decaying stage)
3= Thin Cirrus
4= Altocumulus with thinborders
5= Sand storm
Version 0.2, 16 January 2004 Slide: 21
Squall Line over Central Africa20 May 2003
Version 0.2, 16 January 2004 Slide: 22
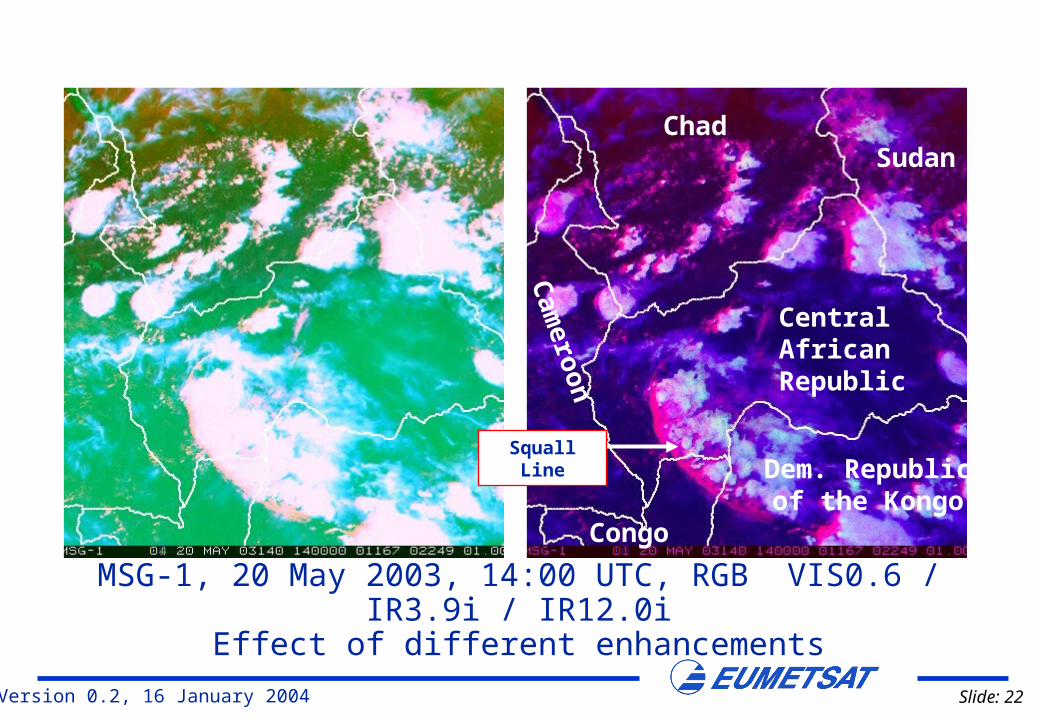
MSG-1, 20 May 2003, 14:00 UTC, RGB VIS0.6 / IR3.9i / IR12.0iEffect of different enhancements
CentralAfricanRepublic
Chad
Dem. Republicof the Kongo
Congo
Sudan
Squall Line
Cam
eroon
Version 0.2, 16 January 2004 Slide: 23
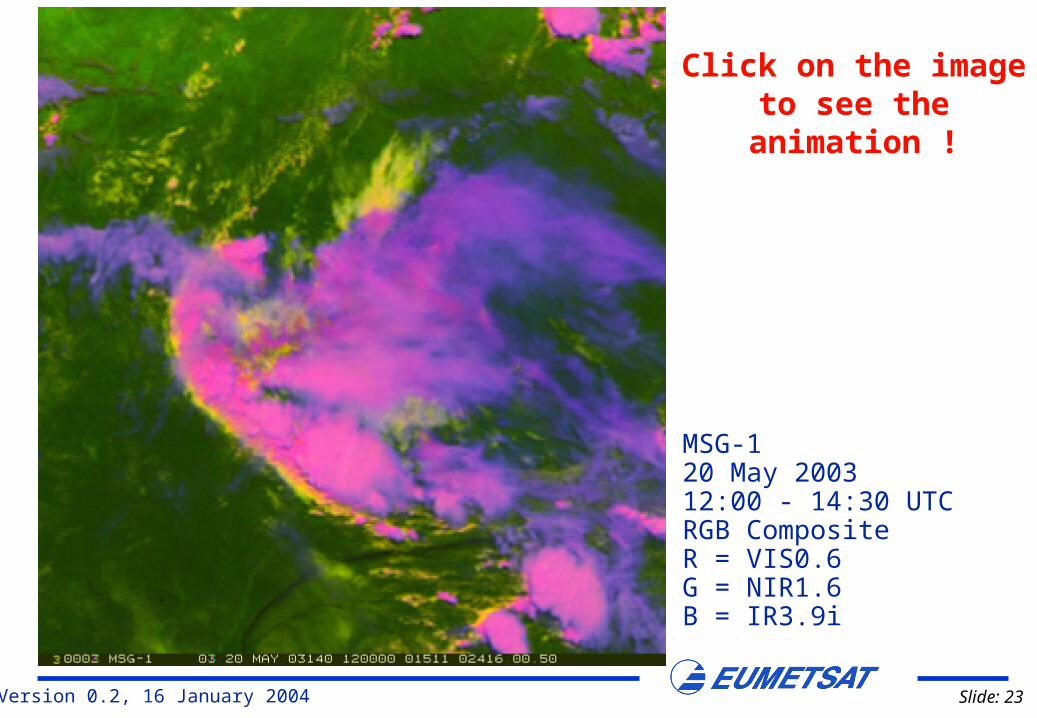
MSG-120 May 200312:00 - 14:30 UTCRGB CompositeR = VIS0.6G = NIR1.6B = IR3.9i
Click on the image to see the animation !
Version 0.2, 16 January 2004 Slide: 24
SUMMARY
Version 0.2, 16 January 2004 Slide: 25
• IR10.8 to get info on cloud top temperature/height
• WV6.2-IR10.8 and WV6.2-WV7.3 to identify highest tops
• HRVIS to see detailed structures
• NIR1.6 and IR3.9 (solar component) to get information on phase and particle size
• IR3.9 - IR10.8 to find areas with most intense development/precipitation
• RGBs to monitor cloud types and convective development:
– RGB 01/03/09 (Day) or RGB 01/04/09 (Day)– RGB 05-06/04-09/03-01 (Day)– RGB 10-09/09-04/09 (Day & Night)– RGB 10-09/09-04/06-05 (Day & Night)
Monitoring of Squall Lines