espon 2013 programme - internal seminar “crossing knowledge frontiers, serving the territories”...
TRANSCRIPT

ESPON 2013 Programme - Internal Seminar“Crossing Knowledge Frontiers, Serving the Territories”
17-18 November 2010 Liège, Belgium
A.P. Russo (URV, LP) and L. Servillo (KUL)
ATTREG Project (ESPON 2013/1/7)
“The Attractiveness of Regions and Cities for Residents and Visitors” (2010-2012)

LEAD PARTNERUniversity Rovira i Virgili (ES)
PROJECT PARTNERSKU Leuven (BE)Univ. of Venice Ca’ Foscari (IT)EURICUR Rotterdam (NL)Univ. of Coimbra (PT)
Centre for Tourism Research (DK) IGSO (PL)Univ. of Ljubljana (SI)Univ. of West England (UK)
RESEARCH SUBCONTRACTORIstanbul Technological University (TR)

Research background
• Emerging importance in ESPON 2006 results of “soft” factors as drivers
of regional development• Acknowledgement in the new geographic and planning literature of the
intertwining of economic and cultural aspects in determining the
competitive advantage of regions and cities, and on mobility as an
epistemological paradigm for the social sciences• Increased attention in ESPON 2013 to socially and culturally-
embedded development processes, mobility, and territorial capital as
a strategic, multidimensional asset to achieve more competitiveness and
cohesion (new round of projects: DEMIFER, EDORA, FOCI, etc.)• Growing policy orientation of this research stream • ESPON 1.3.3 (2004-2006) as the first attempt to “map” attraction factors in
European regions and to explain their differential capacity to “valorise”
their attractiveness as a development asset
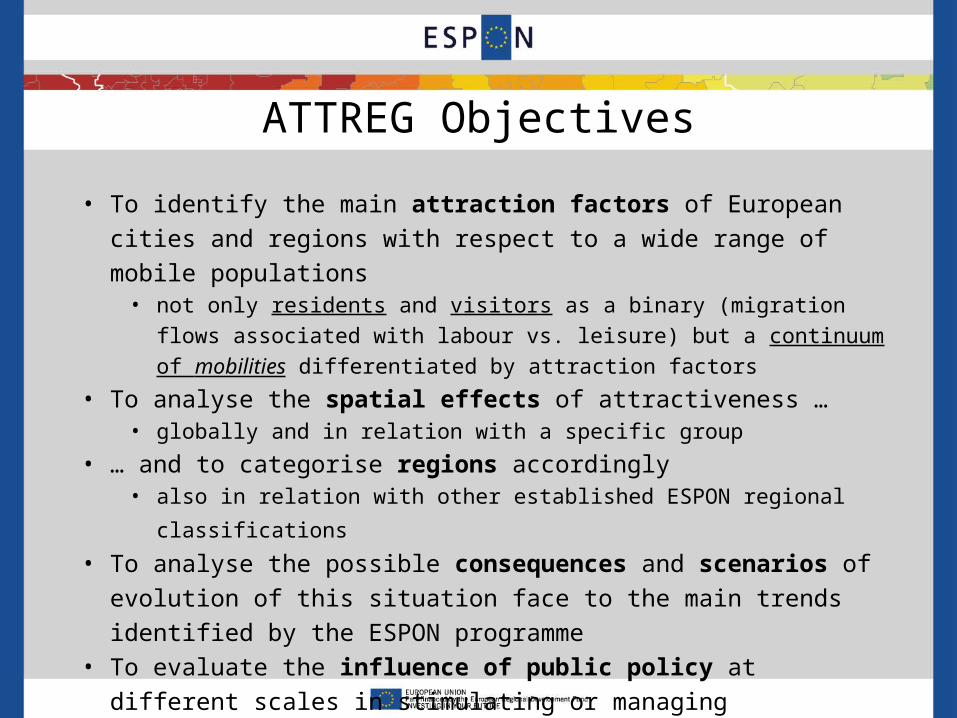
ATTREG Objectives
• To identify the main attraction factors of European cities and regions with
respect to a wide range of mobile populations• not only residents and visitors as a binary (migration flows associated with
labour vs. leisure) but a continuum of mobilities differentiated by attraction
factors
• To analyse the spatial effects of attractiveness …• globally and in relation with a specific group
• … and to categorise regions accordingly • also in relation with other established ESPON regional classifications
• To analyse the possible consequences and scenarios of evolution of this
situation face to the main trends identified by the ESPON programme• To evaluate the influence of public policy at different scales in
stimulating or managing attractiveness so as to reach desired effects • in relation to the main European policy documents (e.g.EU2020).

Early assumptions
What drives mobility, today?– Jobs (yes, but increasingly, it’s firms that follow workers and talents)– Convenience – people “vote with their feet” and respond to convenient
mixes of purchasing power, taxes, services. – Quality of life (yes, but different elements matter for different groups of
mobile population)• Safe, “green”, serviced places for families• Beautiful (unspoilt, heritage-rich) settings for tourists and some place-
aware residents • Vibrant, exiting, mostly urban centres for young people and “creatives”• Highly accessible, connected, wealthy places for business elites • Warm, “manufactured”, serviced places for retired people and second
home owners – Social composition of places
• Some want to be together with their “peer” like some immigrant group and mass tourists
• Some want to avoid them, like allocentric tourists and “pioneers”

Mobility• If the world was “flat” and dimensionless, everybody would go somewhere
and stay there. Mostly a large number of people would end up in beautiful, safe, well connected cities. And every place would try to “dress” itself to attract certain types of people (but some places would have an “acquired advantage”) . NOT SO SIMPLE.
What HINDERS mobility, today?Affective permanences – some people would not move even if they had a better life
somewhere else. There are fast movers and slow movers.
Dimension externalities. As places attract more and more people, they lose some of their advantages – quality of life goes down, prices go up, accessibility may decrease… at a certain point “less crowded” places may become more attractive as a spatial affect of increased mobility. Mostly, this means that there’s a chance for second-order cities and rural areas.
Between-groups (negative) externalities. Just as it may attract them, the attraction of certain groups may repel others. Some people do not like to live where there are too many immigrants, or too many tourists (but some do).

Policy consequences– At various levels, places / regions / countries may develop “enhancements”
which are specifically aimed at the attraction of certain “target” groups – mostly, the talented new workers and the wealthier tourists. BUT THEY HAVE TO BE AWARE OF THE LIMITS AND SPATIAL EFFECTS of such policies, which otherwise would in “zero-sum” game
– Urban-rural relations are particularly at stake. Urban growth may establish synergies with the capacity of attraction of surrounding urban areas, or may result in a negative externality. Thus managing urban-rural relation is also about managing attractiveness at the correct regional scale.
– European policies targeting territorial cohesion and smart, sustainable and inclusive development have to know what is the foreseeable effect on the attractive of regions and the potential responsiveness for certain groups. For instance, making a few “European engine places” very accessible may lead to their abrupt loss of attractiveness in a very short time (impact of low-cost airlines in places like Venice, Barcelona). While pointing at strengthening the position of second-order cities may take some weigh off crowded urban areas.

Conceptual framework

TERRITORIAL CAPITAL (potential assets)
Environmental Capital(climate, natural resources, protected landscapes, green areas, rural areas
and/or settlement structures, etc. )
Antropic Capital(monuments and landmarks, quality of the built environment, housing, infrastructure,
hotels, etc. )
Economic Capital(firms and sectors, level of economic activity, employment, networks and
clusters, innovativeness, investments, centrality, etc. )
Social & Cultural Capital(population diversity, social networks, gender /
ethnic participation, crime, academic production, cultural
activities etc. )
Institutional Capital(democracy, efficiency of the system, tax
climate, participatory processes, accessibility, etc. )
Human Capital(skills and diversity of workforce,
scholarisation levels,, etc. )
POTENTIAL USERS AND ATTRACTION FACTORS
Residents(different types by educational level / income / skills / mobility profiles / etc.)
Visitors(different types by type of stay / tourism
activity / cultural profiles / etc.)
Attraction factors for residents(accessibility / labour market / quality of
place / tax climate / security / cultural and social dynamism / etc.)
Attraction factors for visitors(accessibility / entertainment offer / quality of place / costs / specific interest facilities /
etc.)
MOBILISATION (governance processes outcome
Public decision-makers Sectoral stakeholders
Associations of categories Cultural agencies / NGOsEconomic performance
Redistribution of resources
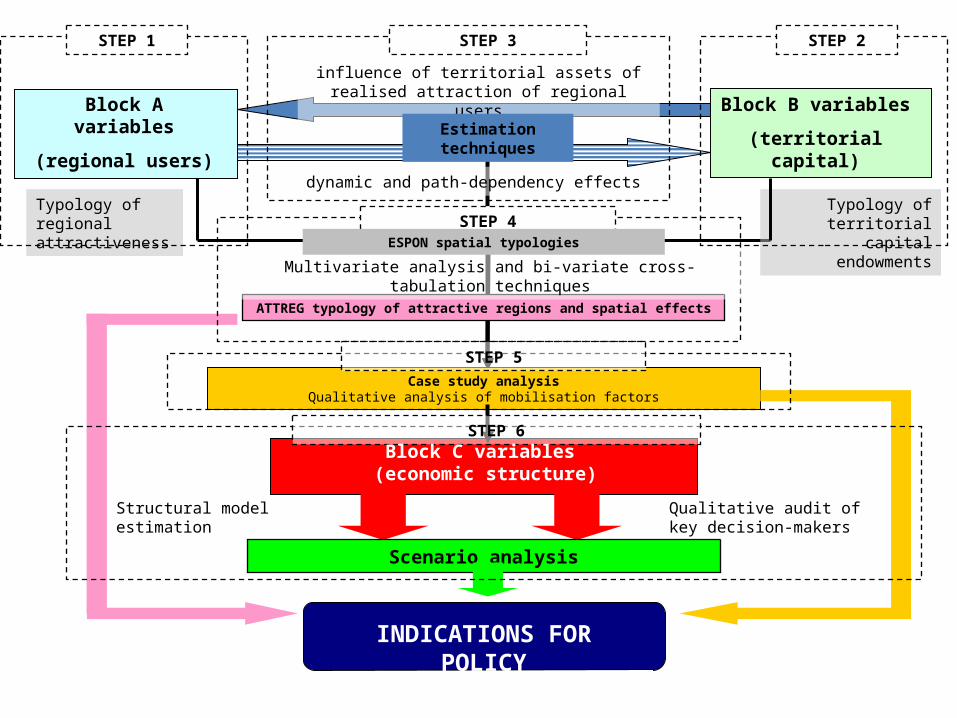
Block A variables
(regional users)
Block B variables
(territorial capital)
influence of territorial assets of realised attraction of regional users
dynamic and path-dependency effects
Case study analysisQualitative analysis of mobilisation factors
Estimation techniques
Typology of regional attractiveness
ATTREG typology of attractive regions and spatial effects
Structural model estimation Qualitative audit of key decision-makers
Scenario analysis
Typology of territorial capital endowments
INDICATIONS FOR POLICY
STEP 1 STEP 2STEP 3
STEP 4
Multivariate analysis and bi-variate cross-tabulation techniques
STEP 5
STEP 6Block C variables
(economic structure)
ESPON spatial typologies

“ASSETS” (dimensions of territorial capital):
1. Physical / environmental cap.
- Environmental amenities, degree of protection, climate, etc.
2. Antropic cap.
- Heritage, architecture, infrastructure, etc.
3. Economic cap.
- Economic structure, jobs, innovativeness, purchasing power, etc.
4. Social & cultural cap.
- Social diversity, participation by ethnic and gender, cultural activities and infrastructure, etc.
5. Human cap.
- Skills and diversity of human resource pool
6. Institutional cap.
- Governance structures, government effectiveness, transparency, etc.
“AUDIENCES” (attracted populations):
- High-skilled labour force (mostly from OECD countries)
- Low-skilled labour force (mostly from non-OECD countries)
- Tourists
- “traditional” – upscale and budget
- “unconventional” (new lifestyle mobilities)
1. How do different audiences respond to differences in endowments (or changes) in dimensions of territorial capital
2. How are these phenomena distributed territorially, what are their local and spatial effects
3. Regional typologies
“DESCRIPTIVE”:
• According to endowments of different classes of territorial capital
• According to mobilised flows (“winner” and “loser” regions)
“ANALYTICAL”
• According to effects (matching different categories or ATTREG categories with other ESPON typologies)
• According to geographical typologies (coastal vs. inland, peripheral vs. central, urban vs. rural, ESPON space vs. CEC countries, etc.)
?

Role of case studies
• To obtain fine-grained knowledge about processes of “mobilisation” of
territorial assets to achieve attractiveness and the role of specific policies
• To explain counter-intuitive results
• To analyse in deep spatial effects (spatial externalities, network effects)
• To conduct intra-regional and qualitative analysis
• To provide a foundation and identify common issues in typologies as
resulting from clustering and other analytic techniques

Role of territorial scenario analysis
• What does knowledge about territorial attractiveness and attraction factor
contributes to established ESPON scenarios?
• How will the attractiveness of cities and regions evolve in the medium-
long term?
• What is the role of economic factors in generating “equilibria” in the
spatial distribution of attractiveness?
• What is a desirable “mix” of audiences and how could local and
European policy “orient” attractiveness to achieve it?

Role of policy analysis

First steps forward
• Inception report of conceptual and methodological focus, delivered June 2010 and substantially approved
• A list of variables and a database in construction (assembling different sources – ESPON and non-ESPON – and some collection in CEC countries)
• A cartographic base to reproduce the first results
• Contractual stage concluded and first reporting on-going
• First ATTREG International Workshop tomorrow (19 Nov) in Leuven, with lecturers and discussants from relevant ESPON projects and other experts
• A web-management tool for the project implemented and a website to be opened soon (www.attreg.espon2013.net)

Database ATTREG (7 months after the start of the project)Number of variables that:
category
Have been identified in
Inception Report
are available need better specification
Are subject to on-going
inquiries
need to be compiled/
are likely to become available
measuring mobility, flows and change 14 12 0 2 0
Environmental capital 10 8 2 0 0
Antropic capital 8 5 1 0 2
Economic capital 11 4 6 0 1
Social/Cultural capital 6 1 5 0 0
Human capital 6 6 0 0 0
Institutional capital 7 3 2 1 1
Context cross-tabulation variables 3 0 0 3 0
totals (of variables) 65 39 16 6 4
% of all variables 60% 25% 9% 6%

Sources used
Database from project 1.3.3
ESPON 2013
ESPON 2007
EURO STAT
OTHER SOURCE
to be specified
No. of variables available in named source 2 11 11 16
No. of variables needing more specification/indication of potential source
16
No. of variables for which there are on-going inquiries 5
No. of variables that require additional work from ATTREG team to acquire 4
