environmental impacts of the asean-china free trade ... · pdf fileenvironmental impacts of...
TRANSCRIPT
Environmental Impactsof the ASEAN-China
Free Trade Agreementon the Greater Mekong
Sub-Region
Hing Vutha and Hossein JalilianCambodia Development Resource Institute
September 2008

Environmental Impacts of the ASEAN-China Free Trade Agreement on the Greater Mekong Sub-Region
trade knowledge network
Copyright © 2008 International Institute for Sustainable Development
Published by the International Institute for Sustainable Development
International Institute for Sustainable Development161 Portage Avenue East, 6th FloorWinnipeg, ManitobaCanadaR3B 0Y4Tel: (204) 958-7700Fax: (204) 958-7710E-mail: [email protected] site: http://www.iisd.org
Environmental Impacts of the ASEAN-China Free Trade Agreement on the Greater Mekong Sub-Region
Hing Vutha and Hossein Jalilian, Cambodia Development Resource Institute
September 2008
Environmental Impacts of the ASEAN-China Free Trade Agreement on the Greater Mekong Sub-Region
trade knowledge network
�
About the Trade Knowledge Networkhttp://www.tradeknowledgenetwork.net
The Trade Knowledge Network (TKN) is a global collaboration of research institutions across Africa, Asia, Europe and the Americas working on issues of trade, investment and sustainable development. The overarching aim of the TKN is to help ensure that trade and investment contribute to sustainable development, where social development and environmental goals are equitably addressed in trade and investment policies. Coordinated by the International Institute for Sustainable Development (IISD), the TKN links network members, strengthens capacity in areas of research, training and policy analysis, and also generates new research to assess and address the impact of trade and investment policies on sustainable development. The current phase of TKN research and policy engagement is kindly supported by the Swiss Agency for Development and Cooperation (SDC) and The Norwegian Agency for Development Cooperation (NORAD). In addition, TKN has received past support from the Rockefeller Foundation, the Norwegian Ministry of Foreign Affairs, the International Development Research Centre (IDRC), and the Canadian International Development Agency (CIDA).
About the International Institute for Sustainable Development (IISD)http://www.iisd.org
The International Institute for Sustainable Development contributes to sustainable development by advancing policy recommendations on international trade and investment, economic policy, climate change, measurement and assessment, and natural resources management. Through the Internet, we report on international negotiations and share knowledge gained through collaborative projects with global partners, resulting in more rigorous research, capacity building in developing countries and better dialogue between North and South.
IISD’s vision is better living for all—sustainably; its mission is to champion innovation, enabling societies to live sustainably. IISD is registered as a charitable organization in Canada and has 501(c)(3) status in the United States. IISD receives core operating support from the Government of Canada, provided through the Canadian International Development Agency (CIDA), the International Development Research Centre (IDRC) and Environment Canada; and from the Province of Manitoba. The Institute receives project funding from numerous governments inside and outside Canada, United Nations agencies, foundations and the private sector.

Environmental Impacts of the ASEAN-China Free Trade Agreement on the Greater Mekong Sub-Region
trade knowledge network
��
About the Cambodia Development ResearchInstitute (CDRI)http://www.cdri.org.kh
The Cambodia Development Research Institute produces independent, objective, high quality policy-relevant development research, to maximise its accessibility to policy makers, influencers and stakeholders, and to have it affect policy in five interrelated areas that are key for Cambodia’s sustainable development: ■ economy, trade and regional cooperation; ■ poverty reduction, agricultural development and rural livelihoods; ■ democratic governance and public sector reform; ■ natural resources and the environment; ■ human security, peace building and conflict transformation.
CDRI’s research is designed, implemented and disseminated within an ethical framework that emphasizes the principles of consultation and participation, transparency, informed consent, confidentiality of data, local ownership and participation, respect for privacy and the wellbeing of the vulnerable, a commitment to the strengthening of local capacity and sensitivity to local culture.
Acknowledgements
The CDRI study team consisted of Mr. Hing Vutha, research associate, and Dr. Hossein Jalilian, director of research. Financial support for the study was provided by the International Institute for Sustainable Development (IISD) through the Trade Knowledge Network (TKN). The authors and CDRI would like to express their genuine gratitude to IISD for its generous support to this project.
The authors would also like to thank Aaron Cosbey, Heike Baumüller and Oli Brown from IISD for their constructive insights and comments on the analytical framework and the draft report. Additionally, the authors received very useful ideas, comments and suggestions from all distinguished participants who took part in a dissemination workshop of preliminary key findings. Their valuable contributions are gratefully acknowledged.
Environmental Impacts of the ASEAN-China Free Trade Agreement on the Greater Mekong Sub-Region
trade knowledge network
���
Table of Contents
Executive Summary 1
Acronyms and Abbreviations 3
1 Introduction 4 1.1. Background 4 1.2. Research objectives 5 1.3. Scope of the study 5 1.4. Structure 6
2 Overview of the debate on trade and the environment 7 2.1. Environmental regulations, competitiveness and relocation of industry 7 2.1.1. Do stringent environmental regulations affect a country’s competitiveness? 7 2.1.2. Do environmental regulations cause dirty industries to relocate? 8 2.2. Economic growth and environment 11 2.3. Trade liberalization and the environment 12 2.4. Summary 14
3 An approach to assessing the impacts of trade on the environment 15 3.1. Measuring and forecasting environmental consequences of trade 15 3.2. Adjusted method for assessing the environmental consequences of trade 16 3.2.1. Trade matrix as a tool to analyze trade trends 16 3.2.2. Classifying sectors by pollution intensity 16 3.2.3. Analyzing the impact of trade on pollution levels 18
4 ASEAN-China Free Trade Agreement (ACFTA) and its impacts on trade and the environment in the GMS 19 4.1. Overview of the ACFTA 19 4.1.1. Historical development of the ACFTA 19 4.1.2. Rationale for the ASEAN-China FTA 20 4.1.3. The Early Harvest Program 20 4.1.4. Trade in Goods Agreement 21 4.2. Trade within the GMS and its implications on the environment 25 4.2.1. Overview of trade between the GMS5 countries and China 25 4.2.2. Impacts of trade on pollution levels 30
5 Cambodia’s trade with China and its impact on the environment 32 5.1. Economic relations between Cambodia and China 32 5.2. Impacts of trade on the environment in Cambodia 36
6 Conclusion and Policy Discussion 40
Environmental Impacts of the ASEAN-China Free Trade Agreement on the Greater Mekong Sub-Region
trade knowledge network
�v
References 42
Statistical Appendix 47
Tables and FiguresFigure 1: Environmental Kuznets Curve 11Figure 2: Trade between China and the GMS5 countries 25Figure 3: Trend of China’s imports from GMS5 countries 27Figure 4: Trend of GMS5 countries’ imports from China 29Figure 5: Trade between Cambodia and China 32Figure 6: Trend of China’s imports from Cambodia 34Figure 7: Trend of Cambodia’s imports from China 36
Table 1: Summary of pollution intensity classification by sector 17Table 2: ACFTA preferential tariff rates: ASEAN6 and China 21Table 3: ACFTA preferential tariff rates: Vietnam 22Table 4: ACFTA preferential tariff rates: Cambodia, Laos PDR and Myanmar 22Table 5: Tariff reduction schedules for the sensitive track: ASEAN6 and China 23Table 6: Tariff reduction schedules for the sensitive track: New ASEAN Countries 23Table 7: Export structure from GMS5 countries to China 26Table 8: Import structure of GMS5 countries from China 28Table 9: Trade-environment matrix for total trade between GMS5 countries and China 30Table 10: Export structure of Cambodia to China 33Table 11: Import structure of Cambodia from China 35Table 12: Trade-environment matrix for Cambodia's exports to China 37Table 13: Estimated pollution gain to Cambodia from Chinese imports 38
Table A.1: Pollution intensity by medium with respect to total value of output. 47Table A.2: Thailand trade with China 48Table A.3: Vietnam trade with China 49Table A.4: Lao PDR trade with China 50Table A.5: Myanmar trade with China 51Table A.6: RCA index of GMS5 in the Chinese market 52Table A.7: RCA index of Thailand in the Chinese market 52Table A.8: RCA index of Vietnam in the Chinese market 53Table A.9: RCA index of Lao PDR in the Chinese market 53Table A.10: RCA index of Myanmar in the Chinese market 54Table A.11: RCA index of Cambodia in the Chinese market 54Table A.12: RCA index of China in the GMS5 market 55Table A.13: RCA index of China in the Cambodian market 55
Environmental Impacts of the ASEAN-China Free Trade Agreement on the Greater Mekong Sub-Region
trade knowledge network
�
Executive Summary
The Greater Mekong Sub-region (GMS)—comprising Cambodia, Lao People’s Democratic Republic (PDR), Myanmar, Thailand, Vietnam and the southwestern province of Yunnan in China—has seen rapid social and economic changes over the past two decades, especially in trade liberalization through closer economic cooperation. In 2004, as members of the Association of Southeast Asian Nations (ASEAN), the GMS5 countries (GMS countries minus Yunnan province in China) and China entered into the ASEAN China Free Trade Agreement (ACFTA). Under the ACFTA, each country is obligated to implement gradual tariff reductions for the exports of ACFTA partners.
As a result of the commitments made in the ACFTA, tariff rates of Chinese exports to GMS5 countries have been lowered, as have been the tariff rates for exports from GMS5 countries to China. An analysis of trade flows before and after the ACFTA has shown that trade between China and the GMS5 countries has increased significantly since the signing of the ACFTA, in particular for goods whose tariff rates were reduced under the ACFTA. A similar trend can be observed in the trade relationship between China and Cambodia, although some Cambodian exports eligible for lower tariffs have seen relatively slow growth due to difficulties faced by exporters in meeting China’s import standards for agricultural products such as cassava, live animals and fish. These findings suggest that the ACFTA has been a significant driver of the rapid expansion of trade between the GMS5 countries and China, at least for products that do not have to comply with extensive health and food safety standards.
Trade between the GMS5 countries and China is concentrated in a small number of product groups such as machinery and electrical appliances, base metals, mineral products, chemicals, textiles and apparels, rubber and vegetable products. Two thirds of the trade volume is in products that fall into the least polluting sectors (i.e. those sectors that emit total toxic pollution of less than 500 pounds per million USD of production), while a third is in products that fall into the most polluting sectors (i.e. more than 1,500 pounds per million USD of production). The level of pollution intensity generated by the latter sector is significant, and its projected growth is likely to generate even greater levels of pollution in the near term.
Within the GMS trade structure, China is the major producer of goods in the most polluting sectors, which means that much of the GMS-wide pollution intensity originates in China. In the case of Cambodia, rising imports in the most polluting sectors from China have led to a substantial “gain” from trade for the Cambodian environment, but this has come at the cost of environmental degradation in China.
Within the GMS there is considerable trade in natural resources such as minerals, agricultural commodities and wood, and in products derived from these resources. Trade in natural resource-based products raises environmental concerns over resource depletion. Significant demands for wood and wood products by China have led to growth in exports of such products from GMS5 countries. Unregulated trade expansion in wood and wood products can result in forest decline, which leads to other environmental problems, such as loss of biodiversity, land erosion, flooding, landslides and climate change. Agricultural expansion and mining can further exacerbate pressures on natural forests. In the absence of fisheries management systems, increased trade in fish products is likely to contribute to overfishing with adverse effects on fish stocks and negative impacts on local livelihoods, especially those of the people who are directly dependent on fishing.
Natural resource depletion is of particular concern to Cambodia, which exports many natural resource-based products, such as wood, fish and rubber. Cambodia is already facing a number of environmental
Environmental Impacts of the ASEAN-China Free Trade Agreement on the Greater Mekong Sub-Region
trade knowledge network
�
challenges including the loss of forest cover, depletion of inland fisheries, degradation of coastal resources and the loss of biodiversity, all compounded by weak environmental regulations. An increase in trade in natural resource-based products within this context is likely to lead to further decrease in environmental quality.
Environmental issues have received some attention from GMS leaders, who have agreed in GMS Summits to improve cooperation in order to address environmental challenges common to the region. However, there is lack of institutional mechanisms to coordinate the implementation of environmental protection policies or action plans. The absence of provisions concerning environmental cooperation in the ACFTA also suggests significant shortcomings in regional economic policy making. It is true that inclusion of environmental concerns in the GMS trade agenda would not be easy given the current low level of development across the region, which calls for sustained high rates of economic growth. But economic growth at the expense of environmental degradation will not lead to sustained social and economic progress. Finding the balance between economic growth and environmental sustainability is a priority issue (and challenge) for achieving sustainable development in the GMS. In this regard, it is important that countries in the GMS strengthen cooperation mechanisms through policies and institutions to effectively respond to emerging environmental issues.
At the domestic level, the Royal Government of Cambodia has put in place regulatory frameworks and policy plans with the long-term goal to manage, conserve and protect the environment and natural resources in a sustainable manner. However, the implementation of these frameworks is constrained by shortages of skilled staff, insufficient budget allocations, overlaps in functional areas among responsible agencies and poor physical facilities. These are key priority agendas that should be addressed by the government as well as the donor and civil society communities.
This study demonstrates clearly a number of possible environmental problems that may arise from trade liberalization, the main engine of economic growth. While it is important for GMS countries to pursue further trade liberalization and deepen economic integration to sustain economic growth, environmental issues must be considered and included in trade negotiations and agreements in order to mitigate any negative consequences of trade to the environment. Only then will trade boost economic growth and contribute to sustainable development.
Environmental Impacts of the ASEAN-China Free Trade Agreement on the Greater Mekong Sub-Region
trade knowledge network
�
Acronyms and Abbreviations
ASEAN Association of South East Asian Nations ACFTA ASEAN-China Free Trade AreaCDRI Cambodia Development Resource InstituteCEP Core Environment ProgramEHP Early Harvest ProgramEKC Environmental Kusnet’s CurveEPS Environmental Performance AssessmentFDI Foreign Direct InvestmentFTA Free Trade AgreementGMS Greater Mekong Sub-region HS Harmonized SystemIISD International Institute for Sustainable DevelopmentIO Input-Output ISIC International Standard Industrial ClassificationLDC Least-developed CountriesMDG Development Millennium GoalMFN Most Favoured NationMRC Mekong River CommissionNEAP National Environmental Action PlanNSDP National Strategic Development PlanRCA Revealed Comparative AdvantageROO Rule of OriginSAM Social Accounting MatrixSEDP Socio-Economic Development PlanS&P Standard and Poor SPS Sanitary and Phytosanitary StandardsTIS Trade in Service TKN Trade Knowledge NetworkUSD United States DollarWGE Working Group on EnvironmentWTO World Trade Organization
Environmental Impacts of the ASEAN-China Free Trade Agreement on the Greater Mekong Sub-Region
trade knowledge network
�
1 Introduction
1.1. Background
The Greater Mekong Sub-region (GMS) comprises Cambodia, the Lao People’s Democratic Republic (PDR), Myanmar, Thailand, Vietnam and the southwestern Chinese province of Yunnan.1 The region covers an area of almost 2.3 million square metres with a population of about 266 million. In the past two decades the GMS has seen rapid social and economic changes, and economic liberalization policies have helped transform some GMS countries into some of the fastest growing economies in the world. The four formerly centrally planned economies (namely China, Vietnam, Lao PDR and Cambodia) have embarked on intensive economic reform programs since the late 1970s (China), late 1980s (Vietnam) and early 1990s (Lao PDR and Cambodia) with remarkable achievements. These economies are now more liberalized and open than just fifteen years ago (although the extent of market liberalization differs considerably among them),2 with trade and investment playing an important role in achieving high economic growth.
All GMS economies are involved in the multilateral trading system as well as several regional free trade agreements. With the exception of the Lao PDR, which is in the process of applying for membership, all GMS economies are members of the World Trade Organization (WTO). The GMS5 countries (Cambodia, Lao PDR, Myanmar, Thailand and Vietnam) are members of the Association of South East Asian Nations (ASEAN), which formed a single trading bloc to negotiate free trade agreements (FTAs) with various countries including China, Australia, New Zealand, Korea, Japan, India, the European Union (EU) and the United States of America (U.S.). China, on the other hand, has concluded two regional FTAs3 and five bilateral trade agreements,4 and negotiated FTAs with Korea and Australia.5
Almost all the free trade agreements implemented or negotiated by the GMS economies cover mostly the economic aspects of trade, with emphasis on reduction and elimination of tariff and non-tariff barriers, trade in services, investment liberalization, technical barriers to trade and trade facilitation. Little attention has been paid to environmental issues in their negotiations. Because environmental sustainability is one of the three components of sustainable development – along with social and economic development – and because the GMS has to deal with environmental issues that are of regional concern or significance, especially those pertaining to the Mekong river as well as other shared resources, free trade agreements made by the GMS economies should have provisions covering environmental issues.
To date, little research has been carried out into the environmental implications of FTAs in the GMS. This study attempts to fill this knowledge gap by examining the possible impacts of trade on the environment, both from the perspective of the GMS5 countries as well as that of Cambodia. The ASEAN-China Free Trade Area (ACFTA) was chosen as a case study to illustrate the correlation between FTAs and trade, and the possible implications of FTA-induced changes in trade flows on the environment. The study looks
1 This paper uses the acronym GMS when referring to the whole of the GMS, including the Yunnan province of China, and GMS5 when referring to the GMS region minus Yunnan province (i.e. Cambodia, Lao PDR, Myanmar, Thailand and Vietnam).
2 Trade openness index of GMS economies in 2005 was very high at 154 for Thailand, 147 for Vietnam, 125 for Cambodia, 76 for Lao PDR and 70 for China as compared to 82, 64, 30, 37 and 27 respectively in 1990.
3 ASEAN-China FTA (ACFTA) and Asia-Pacific Trade Agreement (APTA), previously known as the Bangkok Agreement.4 China-Chile FTA, China-Hong Kong FTA, China-Macao FTA, China-Pakistan FTA and New Zealand-China FTA.5 Quoted from the Free Trade Agreement Database for Asia of the Asia Regional Integration Center (ARIC): http://www.aric.adb.org

Environmental Impacts of the ASEAN-China Free Trade Agreement on the Greater Mekong Sub-Region
trade knowledge network
�
into the salient features and provisions of ACFTA, and examines future trends of trade flow within the sub-region. A trade-environment matrix is constructed as a tool to estimate the environmental impacts of trade flow changes (see the methodology section for more details).
1.2. Research objectives
The overall object�ve of this study is to promote better understanding of the environmental implications of FTAs in the GMS with a view to mainstreaming sustainable development considerations into the negotiation and implementation of FTAs. The spec�fic object�ves of the project include: 1) outlining the general relationship between FTAs, trade and the environment; 2) reviewing the salient features of ACFTA’s focus on tariff reduction schedules and thematic cooperation; 3) examining the evolution of China-GMS5 trade under the ACFTA and assessing the resulting environmental impacts for the GMS, with a special focus on Cambodia; 4) understanding Cambodia’s key sustainable development needs and priorities and exploring how the ACFTA might impact on these priorities; and 5) informing policy makers (especially those in trade and environment ministries) about the potential environmental implications of FTAs with a view to improving coherence between trade and environment policies in future FTA negotiations.
1.3. Scope of the study
This is an exploratory study that attempts to illustrate the interaction between FTAs, trade and the environment through a case study of the ASEAN-China FTA. This interaction is complex and the study is limited in its ability to examine the full range of environmental problems that may arise from trade, especially given the short period that has elapsed since the signing of the ACFTA.
Moreover, due to data limitations, the study does not thoroughly analyze the causal relationship between FTAs and changes in trade flows. Instead, it attempts to demonstrate preliminary trends in trade flows before and after the ACFTA, loosely linking trade flows to tariff reductions to demonstrate the elasticity of trade in response to FTA-induced tariff changes. The study looks only at trade in goods, not trade in services.
In the absence of comprehensive environmental data, the analysis of environmental impacts from trade is based primarily on pollution intensity generated by output production, with a specific focus on final products. Also, a broad qualitative assessment of other environmental impacts is outlined in the section on Cambodia. Finally, the study does not look at social impacts of trade, though the authors recognize that these impacts exist and should be assessed in further research.
This study does not offer any firm conclusions or policy recommendations and due to the above-mentioned limitations, its results should be treated cautiously. The authors hope that the study will encourage additional new research to assess the complex interaction between FTAs, trade and the environment in the GMS.

Environmental Impacts of the ASEAN-China Free Trade Agreement on the Greater Mekong Sub-Region
trade knowledge network
�
1.4. Structure
Chapter Two provides an overview of the debate on trade and the environment with a particular focus on three aspects: 1) environmental regulations, competitiveness and the relocation of industry or pollution haven hypothesis; 2) economic growth and the environment; and 3) trade liberalization and the environment. Chapter Three describes the methodology used in this study for measuring the impacts of international trade on the environment (more specifically on pollution intensity) in the GMS (overall) and in Cambodia. Chapter Four looks at the characteristics of the ACFTA and its possible impacts on trade and the environment in the GMS. It consists of two parts. The first part provides an overview of ACFTA with a discussion of its historical development, rationale and the salient features of the agreement. The second part discusses trade between China and the GMS5 and its impact on pollution levels. Chapter Five looks at the specific case of Cambodia by examining environmental impacts of trade between Cambodia and China under ACFTA, and looks at Cambodia’s needs and priorities for environmental and natural resource sustainability. Chapter Six provides concluding remarks and a brief policy discussion.
Environmental Impacts of the ASEAN-China Free Trade Agreement on the Greater Mekong Sub-Region
trade knowledge network
�
2 Overview of the debate on trade and the environment
Literature on trade and its impact on the environment emerged relatively recently. Since the 1970s, as a result of increasing concerns over environmental degradation caused by rapid industrialization, economic growth and globalization, analysts have been recommending the mainstreaming of environmental issues into trade negotiation agendas. However, these issues have not been mainstreamed particularly effectively, resulting in a growing debate on a wide range of issues concerning the trade and environment nexus—from the impacts of environmental regulations on trade to the effects of growth and trade liberalization on the environment. This section reviews the global debate on the linkages between trade and the environment with a focus on three key commonly debated aspects: 1) environmental regulations, competitiveness and relocation of industry or pollution haven hypothesis; 2) economic growth and the environment; and 3) trade liberalization and environment. This review will not discuss methodological approaches but rather attempt to outline major findings, both supporting and contradicting the various hypotheses concerning trade and the environment.
2.1. Environmental regulations, competitiveness and relocation of industry
2.1.1. Do stringent environmental regulations affect a country’s competitiveness?
Environmental policies can affect production costs and therefore competitiveness. Theoretical work on this incorporates the environmental cost into the production function6 and estimates the impact it has on competitiveness. Several empirical studies to test this hypothesis have come up with mixed results, with some supporting the argument that environmental policies increase production costs considerably, thereby reducing competitiveness, and others claiming that environmental costs play a comparatively minor role in determining comparative advantage and competitiveness.
Among early studies that observed the impact of environmental regulations on competitiveness are Siebert (1974), Pethig (1976) and McGuire (1982). Their empirical findings drew the general conclusion that strict environmental standards weaken a country’s competitive position in pollution intensive industries and diminish their exports. A study by Lucas, Wheeler and Hettige (1992) attempted to test the displacement hypothesis by using time-series estimates of manufacturing pollution intensity during 1960-88 for a large sample of developed and developing countries. They found that pollution intensity was higher in low-income countries (with lower environmental standards) and thus these countries specialize in pollution-intensive activities. Low and Yeats (1992), who focused on pollution intensity of trade between North and South, also found that the South exports relatively dirty products and the North exports relatively clean products.
However, other empirical studies did not find strong evidence that environmental regulations per se have influenced competitiveness (OECD, 1993; Tobey, 1990; Walter, 1973). These studies estimated that
6 The cost of production is associated with the cost of many inputs including labour, capital and technology. In this case the cost of compliance with environmental standards is included in the production cost.
Environmental Impacts of the ASEAN-China Free Trade Agreement on the Greater Mekong Sub-Region
trade knowledge network
�
abatement costs in developed countries range between 1 and 3 per cent of total costs, making the price effects of environmental regulations insignificant. There are also arguments that stringent environmental regulations stimulate companies to use more advanced technologies in production and encourage innovation and R&D towards environmental friendliness, thus raising overall productivity and enhancing performance. This is commonly known as the Porter Hypothesis. Porter and van der Linde (1995) argued that policy makers, business leaders and environmentalists have focused on the static cost impacts of environmental regulations and have ignored the more important offsetting productivity benefits from innovation. They suggested that environmental regulations that set proper environmental standards can trigger innovation that lowers product costs, improves product consistency and quality and boosts resource productivity. Ultimately, these enhancements make companies more competitive, not less so.
In support of the Porter Hypothesis, Berman and Bui (1998) examined the effects of U.S. air-quality regulations on the productivity of oil refineries from 1977 to 1993, and found that oil refineries located in areas with stringent regulations, such as southern California, recorded faster productivity growth than oil refineries operating under less stringent regulations, presumably because the former were forced to advance their investment plans in new technologies. Cohen and Fenn (1997) examined whether good environmental performance harms or helps a company’s bottom line. Their study was based on financial and environmental data of the 500 companies included in the Standard and Poor (S&P) index,7 divided into 85 industries. The authors compared the performance of two investment portfolios: one “green” portfolio, which included only the environmental leaders in each industry (those with an environmental record better than the median of the industry), and one “brown” portfolio, which included only the environmental laggards. They found that in 80 per cent of the comparisons, the “green” portfolio outperformed the “brown” portfolio financially. The authors concluded that there is no systematic evidence that good environmental performance comes at the expense of reduced profitability.
In summary, competitiveness concerns over environmental policies seem to have been overstated, with no strong empirical evidence to support theoretical predictions. Competitiveness is determined by several key factors including human capital, technology, business climate and the quality of a country’s institutions, among others. While environmental controls are likely to create additional costs to production, their costs do not seem to be significant to total production costs, with limited influence on price and competitiveness compared to other factors.
2.1.2. Do environmental regulations cause dirty industries to relocate?
Another question that has been discussed is whether environmental regulations stimulate the shift of pollution-intensive industries to countries with relatively low environmental standards. This phenomenon is commonly known as pollution haven hypothesis. It expands the classic two-factor trade model (capital and labour) by treating pollution as a production factor. Pollution abundance or scarcity is determined by environmental policies, which reflect both the value that societies place on the environment and their ability and capacity to absorb pollution. A country is considered as pollution abundant when it has relatively large absorptive capacity to cope with pollution, which makes for a comparative advantage in pollution-intensive activities. The hypothesis further predicts that countries with lax environmental standards will have a comparative advantage in pollution-intensive industries, or dirty industries, and will thus attract more investment in these sectors. A number of studies have attempted to test
7 The S&P 500 is a stock market index containing the stocks of 500 Large-Cap corporations, most of which are U.S. corporations. The index is the most notable of the many indices owned and maintained by Standard & Poor’s, a division of McGraw-Hill. (cited from Wikipedia).

Environmental Impacts of the ASEAN-China Free Trade Agreement on the Greater Mekong Sub-Region
trade knowledge network
�
this hypothesis and their empirical results vary according to the countries studied, timeframe and research methods. The following sections highlight empirical findings from some interesting studies that support as well as discount the pollution haven hypothesis.
Studies that support relocation effects of environmental regulations
There are a number of studies that provide some evidence to support the idea that dirty industries relocate in response to stricter environmental regulation (Low and Yeats, 1992; Henderson, 1996; Kahn, 1997; Gray, 1997; Xing and Kolstad, 1998 and 2002; Brunnermeier and Levinson, 2004). Low and Yeats (1992), for example, used the Revealed Comparative Advantage (RCA)8 measure to determine the magnitude of location pull of dirty industries toward developing countries where environmental standards tend to be relatively lower. Their results showed that developing countries have a stronger tendency to develop RCA in polluting industries.
Henderson (1996) examined the effects of ground-level ozone regulation on economic activity and tested whether regulation had any effect on the relocation of firms between sub-national counties in the U.S. He found a significant reduction of polluting plants in counties that had switched to non-attainment status, which requires plants to have greener production equipment to reduce emissions, and a significant increase in polluting plants in counties with attainment status. Polluting industries spread out, moving from non-attainment (polluted) to attainment (initially less polluted) areas. This finding has been corroborated by Kahn (1997), who suggested that air quality improvements in polluted areas had been achieved in part by relocation of polluting industries due to differing levels of regulatory stringency.
Gray (1997) attempted to test whether differences across U.S. states in pollution regulation affect the location of manufacturing activity. He found a significant connection between the level of stringency in environmental regulations and the number of new plants—states with more stringent environmental regulations had fewer new manufacturing plants. These results were confirmed by Xing and Kolstad (1998), who examined foreign direct investment (FDI) of several U.S. industries, including industries with high pollution control costs (chemicals and primary metals) as well as industries with more modest pollution control costs (electrical and non-electrical machinery, transportation equipment and food products), to evaluate the effect of stringent environmental policies on the location of polluting industries. Their statistical analysis shows that laxity of environmental regulations in a host country is a significant determinant of FDI from the U.S. for heavily polluting industries and is insignificant for less polluting industries. The result has been confirmed by more recent studies by the same researchers (Xing and Kolstad, 2002), which looked at the impact of environmental regulations on the movement of capital in polluting industries in the U.S.
The literature review on the pollution haven hypothesis by Brunnermeier and Levinson (2004) discusses recent studies that support the effects of environmental regulation on industry relocation. Those studies, which used panel data to control for unobserved heterogeneity or instruments to control for endogeneity, found statistically significant pollution haven effects.
8 Revealed Comparative Advantage (RCA) is a measure of relative competitive performance of a country’s exports of a particular product or class of goods. It is calculated by dividing the country’s share of world exports of the product in question by the country’s share of total world trade. Products with a ratio greater than one may be considered indicative of the country’s underlying comparative advantage, relative to products with a ratio smaller than one.
Environmental Impacts of the ASEAN-China Free Trade Agreement on the Greater Mekong Sub-Region
trade knowledge network
�0
Studies that do not find relocation effects of environmental regulations
There have also been several studies that found no evidence to support the theory of relocation of dirty industries due to tough environmental regulations (Duerksen et al., 1980; Walter, 1982; Beghin et al., 1997a; Eskeland et al., 1997). Their conclusions are based on the argument that environmental control costs are relatively insignificant and there are various other factors (including natural resources, market size, access to international markets, human capital and investment incentives) that have greater influence on investment decisions. One of the earlier studies carried out by Duerksen et al. (1980) used trade and investment data to examine whether differences in environmental control costs have led to industrial flight from the U.S. toward least-developed countries (LDCs). They found that host countries that received the most overseas investment in pollution-intensive sectors such as chemicals, paper, metals and petroleum refining were other industrial countries, not LDCs, and that the share of U.S. FDI in pollution-intensive industries in LDCs did not increase significantly over time in comparison to that of other developed countries. The study concluded that there was no evidence of widespread relocation of U.S. industries to pollution havens.
Other studies based on analysis of investment data were carried out by Walter (1982), Repetto (1995), Albrecht (1998) and Eskeland et al. (1997). For example, Walter (1982) examined trends in FDI both in terms of industry mix and destination by firms from Western Europe, Japan and the U.S. during 1970-78. He found that although there was a large amount of overseas production in pollution-intensive industries, there was little evidence that it was influenced by differing environmental control costs. He therefore concluded that there was no evidence that FDI was shifting towards countries with more lenient standards.
Similarly, Repetto (1995) noted that although developing and transitional economies received 45 per cent of outward FDI from the U.S., their share of environmentally sensitive industries (petroleum and gas, chemicals and primary or fabricated metals) was considerably smaller. Only 5 per cent of the investments received by developing and transitional economies went into these sectors, compared with 24 per cent of these investments received by developed countries. He concluded that, “to the extent that the developed countries are seen to be exporting their ‘dirty’ industries, they seem to be exporting them to each other, not to the less developed economies.” (Repetto, 1995, quoted in OECD, 1997, pg. 10).
This conclusion was corroborated by Albrecht (1998), who evaluated whether the outflow of FDI from the U.S. was concentrated in dirty industries and the inflow concentrated in clean industries. In fact, he found it was just the opposite. Outward FDI was growing faster in clean industries, while inward FDI was growing faster in dirty industries. In other words, the U.S. seemed to be “importing” more dirty industries than it was “exporting.” Another study investigating patterns of FDI to assess the concentration in polluting industries was described in Eskeland et al. (1997). The study covered investment from the U.S. into Mexico, Venezuela, Côte d’Ivoire and Morocco during the 1980s and found no evidence to suggest that investments in these countries were biased towards polluting sectors.
To sum up, environmental regulations seem to have limited effects on location decisions for most sectors because compliance costs are too small to be a significant decision factor. This is also because factors such as resource endowment, market size, market access, human capital and the overall investment climate have a strong influence on international location decisions. Foreign direct investment can be resource-seeking, market-seeking or efficiency-seeking, and other corporate interests can determine where to locate a production facility. Nevertheless, in the case of some sectors, in particular energy intensive ones such as cement production, iron and steel, environmental regulations can play a role, albeit a comparatively small one vis-à-vis other factors, when choosing production location.

Environmental Impacts of the ASEAN-China Free Trade Agreement on the Greater Mekong Sub-Region
trade knowledge network
��
2.2. Economic growth and the environment
How does economic growth affect the environment?
Another issue that is commonly discussed in the trade and environment literature concerns the consequences of economic growth on environmental quality. There has been an increase in research and debate on the relationship between economic growth and the environment following the recognition that the environment has been gradually degraded along with the rapid growth of the global economy. One of the main theoretical concepts that has shaped this debate is the Environmental Kuznets Curve (EKC) (Grossman and Krueger, 1991).
The EKC extends the concept of the Kuznets Curve, as demonstrated in Figure 1. The EKC depicts the relationship between income and environmental quality along a development curve, and predicts that environmental damage will increase at lower income levels (known as environmental decay), reach a maximum level (known as turning point income) and decline thereafter (known as environmental improvement). The logic of the EKC relationship is that at the early stage of industrialization and development, the economy uses a lot of natural resources and dirty technologies for production, which cause environmental damage. When the quality of life improves as a result of development, people have increasing demands for an environment-friendly society, which in turn put pressure on government policies to improve environmental quality.
Figure 1: Environmental Kuznets Curve
Most of the empirical studies on the EKC address the following two questions: Is there an inverted-U relationship between income and environmental degradation? And if so, at what income level does environmental degradation start declining? For example, Grossman and Krueger (1995) examined the relationship between various environmental indicators and the levels of per capita income, and found that economic growth brought an initial phase of environmental deterioration followed by a phase of improvement. The turning points for different pollutants varied, but in most cases they came before a country reached a per capita income of $8,000.9
Following Grossman and Krueger’s study, Shafik and Bandopadhyay (1992) estimated the relationship between economic growth and several key indicators of environmental quality, and found a consistently significant relationship between income and all environmental quality indicators. As income began to rise, pollution such as sulphur dioxide and suspended particulate matter increased initially and then decreased once the economy reached a certain level of income.
9 All dollar amounts are in U.S. dollars.
Income per capita
En
viro
nm
en
tal
dam
age

Environmental Impacts of the ASEAN-China Free Trade Agreement on the Greater Mekong Sub-Region
trade knowledge network
��
In general, an EKC has been found in some areas of environmental degradation that have immediate and visible impacts, such as air pollution, but not in areas with longer term and less visible impacts, such as solid waste, loss of biodiversity and climate change. Furthermore, even if the EKC has been observed in the past, it would be premature to conclude that it is inevitable or automatic. Impacts could be changed with the right supporting policies (which could bring long-term economic benefits), just as environmental improvement with income growth is not automatic, but depends on policies and institutions. Government policies and institutions, civil society, and market functions all play a critical role in assuring sufficient conditions and compliance with standards for environmental protection along the course of development.
2.3. Trade liberalization and the environment
Trade liberalization is likely to increase trade volume, expand economic activities and affect environmental quality. The impact of trade liberalization on the environment can be deconstructed into three interacting components: a composition effect, a scale effect and a technique effect (Grossman and Krueger 1991):
The compos�t�on effect arises from change in specialization when trade is more open. In other words, a country will specialize and export products for which it has relatively abundant resources and import products that are relatively scarce. The scale of the composition effect depends on the extent to which the country’s comparative advantage will be in either pollution-intensive sectors or less polluting sectors. The net effect on the local environment will be positive if expanding export sectors are less polluting on average than contracting import-competing sectors and negative if expanding export sectors are more polluting on average than contracting import-competing sectors.
The scale effect arises from enhanced economic activities due to trade liberalization. For given pollution coefficients, increased production is always harmful to the environment and thus the scale effect is negative because it generates additional pollution and emissions.
The techn�que effect occurs when producers introduce cleaner production techniques with lower emission intensity leading to reductions in the level of pollution per unit of output.
What matters for the environment is the net result of the composition, scale and technique effects, not the individual components. The impact of trade liberalization on the environment is positive if the composition and technique effects exceed the scale effect, and negative if the opposite holds.
Trade liberalization with positive environmental consequences
Among key empirical studies, Grossman and Krueger (1991, 1993), Birdsall and Wheeler (1992), Antweiler et al. (1998) and Tsai (1999) all argued that trade liberalization could improve environmental conditions and quality. In their assessment of environmental impacts of the North American Free Trade Agreement (NAFTA), Grossman and Krueger (1993) suggested that a more liberal trade regime and greater access to the large U.S. market was likely to generate income growth in Mexico to the level that would result in increased political pressure for environmental protection, which would be good for the environment. They concluded with the positive view that there would be pollution reduction in Mexico as the country was specialized in labour-intensive industry and agriculture sectors, which require less energy input and generate less hazardous waste per unit of output than more capital and human capital intensive sectors. The findings were supported by Tsai (1999), who found that post-liberalization emission levels turned out to be lower than pre-liberalization emission levels, validating the argument that trade liberalization leads to better environmental quality.

Environmental Impacts of the ASEAN-China Free Trade Agreement on the Greater Mekong Sub-Region
trade knowledge network
��
Another study that examined the effect of trade policy on pollution is outlined in Birdsall and Wheeler (1992). Their paper argued that the liberalization of trade regimes and increased foreign investment in Latin America were not associated with pollution-intensive industrial development. From case studies and econometric evidence, the authors concluded that protected economies were more likely to favour pollution intensive industries, while openness actually encouraged cleaner industry through the importation of developed-country pollution standards through foreign direct investment, as well as imports of efficient technologies. Antweiler et al. (1998) developed a theoretical model that divided trade’s impact on pollution into scale, technique and composition effects to investigate how openness to international goods markets affects pollution concentrations, using data on sulphur dioxide concentrations. Their study found that trade liberalization resulted in pollution reduction—if trade liberalization raised GDP per capita by 1 per cent, then pollution concentration fell by about 1 per cent. Combining the estimates of all three effects led them to conclude that freer trade appeared to be good for the environment.
Trade liberalization with negative environmental consequences
Trade liberalization could have negative environmental consequences if scale and composition effects outweigh the technique effect in countries with comparative advantage in dirty industries, and if the scale effect outweighs the technique and composition effects in countries with comparative advantage in clean industries. Developing countries, especially those with lax environmental regulations but greater capacity to absorb pollution, are likely to specialize and export pollution-intensive industries. In such cases, trade liberalization could lead to environmental degradation.
One famous study that supports the above argument is by Copeland and Taylor (1994). The study analyzed to what extent pollution levels were affected by trade liberalization by decomposing the environmental effect into scale, composition and technique effects. To do this, the study used a simple, static two-country general equilibrium model in which income-induced differences in environmental policy create incentives to trade. The analytical results suggested that free trade lowers pollution levels in countries rich in human capital (North) and increases pollution levels in countries low in human capital (South), thereby increasing worldwide pollution provided that factor prices are not equalized across countries.
Another interesting study that viewed trade liberalization as a cause of environmental damage was by Chilchilnisky (1994), who examined how differences in property rights could affect the use of natural resources. She used a general equilibrium model with two goods, two inputs and two countries. It is similar to a standard Heckscher-Ohlin model, which is based on the fundamental assumption that one country (in the South) with an ill-defined property rights regime will trade with another country (in the North) that has a clearly defined property right regime, though the two countries may have identical technologies, endowments and preferences. The study suggested that the country with ill-defined property rights will increase the overuse of resources, which will result in over-production in the South and over-consumption in the North. Chilchilnisky’s main conclusion was that ‘’the international market transmits and enlarges the externalities of the global commons. No policy that ignores this connection can work.” (Chilchilnisky, 1994, pg. 108).
Cole et al. (1998) examined how the Uruguay Round of trade negotiations would impact on emissions in five air pollutants (nitrogen dioxide, sulphur dioxide, carbon monoxide, suspended particulate matter and carbon dioxide), and estimated that most developing and transitional economies would experience an increase in emissions in all five pollutants, while in the developed countries emissions in three of the air pollutants would decrease, whist emissions in the other two would increase. Country-specific empirical studies can be found in Lee and Roland-Holst (1997) and Lopez (1997). They examined how trade influenced the environment in Indonesia by using an applied general equilibrium analysis, and

Environmental Impacts of the ASEAN-China Free Trade Agreement on the Greater Mekong Sub-Region
trade knowledge network
��
found that unilateral trade liberalization by Indonesia would increase emission levels for almost all major pollution categories. Lopez (1997), in his study on how freer trade in western Ghana affected agricultural production, income and the environment, concluded that trade liberalization had negative impacts on both income and the environment. Lopez proposed that further trade liberalization was likely to decrease national income and cause serious biomass depletion.
Based on available empirical studies examining the impacts of trade liberalization on the environment, it is not possible to draw overall conclusions on whether freer trade damages or improves environmental quality. The interaction between trade liberalization and the environment depends on country-specific factors, such as existing policies and institutional structures, and on the trade liberalization agreement itself. Given that the empirical results are inconclusive and that it cannot be ruled out that trade liberalization could harm the environment, trade agreements should incorporate environmental cooperation as well as harmonization of environmental policies into the cooperation package, for the sake of better regional and global environmental quality.
2.4. Summary
This section provides an overview of the debate on trade and the environment with a specific focus on two aspects of the issue: the impact of environmental regulations on trade patterns and competitiveness as well as the effect of economic growth and trade liberalization on the environment. Several widely accepted theoretical constructs guide the debate on these issues, but empirical studies have failed to produce sufficient evidence to support theoretical predictions. Thus, there is no universal conclusion to the question of how trade impacts on the environment.
Variations in environmental standards are inevitable, especially among developing and developed countries. The extent to which such variations affect production costs and competitiveness remains contested. This chapter argues that environmental costs imposed by countries with stringent environmental regulations are proportionally insignificant, and have little influence on competitiveness (although the actual impact will depend on the relative share of pollution control costs in the overall cost structure, which can be high for some sectors). Competitiveness per se may be determined by many factors including labour, available technologies, market structure, business climate, policies and institutions. We also argue that weaknesses in environmental regulations in developing countries have not necessarily been the major factor driving relocation of pollution-intensive industries. Factors like political stability, availability of natural resources, market size, market access, investment climate and others are of critical importance to investment decisions.
While economic growth and increase in income are perhaps the easiest indicators of human progress, unbridled economic growth can damage the environment. Achieving sustainable development that balances economic growth with environmental sustainability will depend on the implementation of supporting policies and institutions that can assure sufficient environmental compliance as required by law.
Trade liberalization can have positive or negative consequences on the environment depending on a country’s comparative advantage, existing policies and resource management. There is very little environmental policy coordination among trading partners, and environmental issues are usually neglected in trade negotiations. Linking better environmental management with trade liberalization is therefore imperative to preserve the natural environment and ensure sustainable progress

Environmental Impacts of the ASEAN-China Free Trade Agreement on the Greater Mekong Sub-Region
trade knowledge network
��
3 An approach to assessing the impacts of trade on the environment
This section provides an overview of the methodologies used in this study for estimating the impacts of international trade on the environment, and specifically pollution intensity, across the GMS and in Cambodia.
3.1. Measuring and forecasting environmental consequences of trade
To assess whether growth in trade will lead to deterioration in environmental quality, one must be able to a) measure the environmental consequences of productive activities, including those caused by trade, and b) consider the dynamic interaction between trade, income and environmental quality.
Environmental degradation and resource depletion are by-products of productive activities. Factor inputs such as oil and other energy sources may cause direct environmental degradation in their production processes. Factor inputs may also contribute indirectly towards environmental degradation if the inputs used in their production had contributed towards environmental degradation. To capture the magnitude of environmental degradation caused by any productive activity, it is important to distinguish between direct and indirect environmental degradation effects.
In order to assess the level of environmental degradation associated with any productive activity, one must specify the way in which factor inputs enter into such activity. The relationship between various inputs and outputs, and the way in which they are related, is usually captured by a production function. A production function can measure any assumed changes in the demand for goods and services, including those caused by trade. Furthermore, through the specification of links between productive activities and the level of environmental degradation associated with each activity, the environmental consequences of changes in demand (for goods and services caused by trade) can also be measured. Forecasting future environmental degradation associated with any future change in demand for goods and services can be carried out in a similar way. This is the principle of forecasting used in this study.
The relative accuracy of measuring and forecasting changes in the demand for goods and services and the associated levels of environmental degradation varies with the degree of sophistication of the applied measurement/forecasting tools. For a more sophisticated analysis of the impacts of trade on the environment and resource depletion, the authors of this study recommend the use of the Input-Output (IO) or Social Accounting Matrix (SAM), which allows for the analysis of interactions among sectors and institutions in an economy. SAM is a data analysis framework that offers a situational snapshot in time, providing base-year information in a consistent manner across a whole set of variables. Within this framework, all factor inputs including human resources, physical capital, natural resources and other intermediate inputs enter into the final factor accounts.
However, this study did not use SAM as the tool of analysis for estimating possible impacts of trade on environmental degradation and resource depletion, because the available data was too limited in terms of quality and quantity. Instead, the study used an adjusted method of analysis, which is based on an industrial pollution projection system developed by Hettige et al. for the World Bank in 1995.10
10 Hettige, H., P. Martin, M. Signh and D. Wheeler, “The Industrial Pollution Projection System.” Policy Research Working Paper 1431, World Bank, 1995.

Environmental Impacts of the ASEAN-China Free Trade Agreement on the Greater Mekong Sub-Region
trade knowledge network
��
3.2. Adjusted method for assessing the environmental consequences of trade
In order to explore the link between trade and the environment, this study employed an adjusted method for estimating the effects of trade on pollution levels. The adjusted method included the development of trade matrices depicting trends in trade between China and the GMS5 countries over a six-year period; calculation of Revealed Comparative Advantage matrices; classification of trade sectors into three categories based on the amount of pollution released by their production; and finally, the development of trade-environment matrices with estimates of pollution intensity for select trade sectors. The following section elaborates on this adjusted method, which is simpler (and more affordable to carry out) than SAM, yet able to provide an indication of the impact of trade on one aspect of environmental degradation, namely pollution.
3.2.1. Trade matrix as a tool to analyze trade trends
To begin, import and export trade matrices were constructed to show the trajectory of trade development between China and the GMS5 countries over a period of six years: 2001 (before the GMS5 countries signed their trade agreement with China), 2004 (the year in which the trade agreement was signed) and 2007 (three years after signing of the trade agreement). Table 7 on pg. 26 provides an example of such matrix. Two sets of trade matrices were constructed: one to show exports from the GMS5 countries to China as well as imports from China to the GMS5 countries, and another to show exports from Cambodia to China as well as imports from China to Cambodia. The trade matrices are organized by trade sectors, which are identified by two-digit Harmonized System (HS) classification codes. The columns show the volume of trade (per sector) as well as the share of that particular trade sector in overall trade.
In addition to the trade matrices, Revealed Comparative Advantage (RCA) indices were computed from available trade data in order to analyze trade specialization of each country. As noted earlier in this study, the RCA measures relative competitive performance of a country’s exports in a particular product or class of goods. The RCA indices help predict exports for the future, when trade will be fully liberalized. Specialization will determine trade patterns and possible environmental consequences.
3.2.2. Classifying sectors by pollution intensity
This study attempted to assess environmental impacts of trade in two ways: a) quantitatively, by looking at pollution intensity as one example of environmental degradation across the GMS, and b) qualitatively, by examining other environmental impacts of trade in Cambodia. The authors realize the limitations of using only pollution data as indicators of impact on the environment, but hope that this can serve as a starting point for further research into the question of how trade impacts on various aspects of environmental quality and natural resource sustainability in the GMS.
To classify different trade sectors by pollution intensity (emission per unit of output), this study used the three-digit International Standard Industrial Classification (ISIC) system developed in the Industrial Pollution Projection System study carried out by Hettige et al. for the World Bank (1995). The study estimated industrial emissions to the air, water and land as well as the sum of emissions to all mediums (air, water, land) using three economic variables: value of output, value added and employment. For the purpose of analyzing the impacts of trade on pollution levels, we chose to use the pollution intensity levels for all media released by physical volume of output (see Table A.1. in the appendix for estimated amounts of pollution released by each trade sector in pounds per output valued at one million USD).
Environmental Impacts of the ASEAN-China Free Trade Agreement on the Greater Mekong Sub-Region
trade knowledge network
��
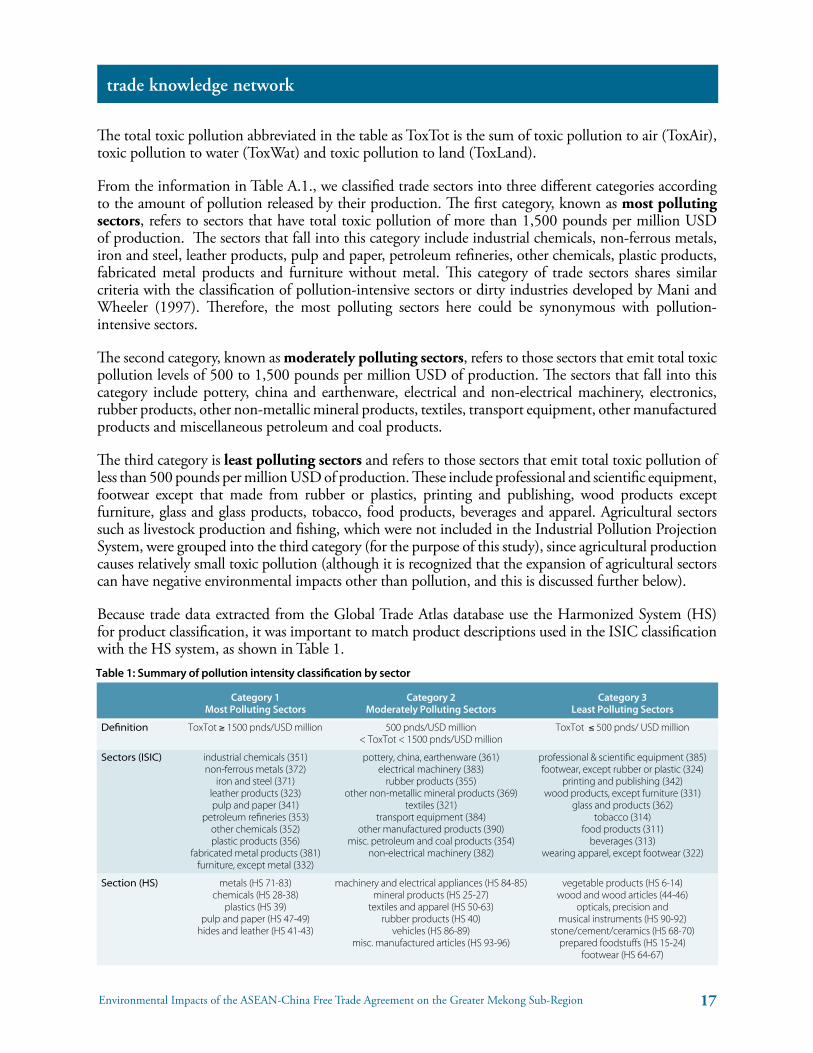
The total toxic pollution abbreviated in the table as ToxTot is the sum of toxic pollution to air (ToxAir), toxic pollution to water (ToxWat) and toxic pollution to land (ToxLand).
From the information in Table A.1., we classified trade sectors into three different categories according to the amount of pollution released by their production. The first category, known as most pollut�ng sectors, refers to sectors that have total toxic pollution of more than 1,500 pounds per million USD of production. The sectors that fall into this category include industrial chemicals, non-ferrous metals, iron and steel, leather products, pulp and paper, petroleum refineries, other chemicals, plastic products, fabricated metal products and furniture without metal. This category of trade sectors shares similar criteria with the classification of pollution-intensive sectors or dirty industries developed by Mani and Wheeler (1997). Therefore, the most polluting sectors here could be synonymous with pollution-intensive sectors.
The second category, known as moderately pollut�ng sectors, refers to those sectors that emit total toxic pollution levels of 500 to 1,500 pounds per million USD of production. The sectors that fall into this category include pottery, china and earthenware, electrical and non-electrical machinery, electronics, rubber products, other non-metallic mineral products, textiles, transport equipment, other manufactured products and miscellaneous petroleum and coal products.
The third category is least pollut�ng sectors and refers to those sectors that emit total toxic pollution of less than 500 pounds per million USD of production. These include professional and scientific equipment, footwear except that made from rubber or plastics, printing and publishing, wood products except furniture, glass and glass products, tobacco, food products, beverages and apparel. Agricultural sectors such as livestock production and fishing, which were not included in the Industrial Pollution Projection System, were grouped into the third category (for the purpose of this study), since agricultural production causes relatively small toxic pollution (although it is recognized that the expansion of agricultural sectors can have negative environmental impacts other than pollution, and this is discussed further below).
Because trade data extracted from the Global Trade Atlas database use the Harmonized System (HS) for product classification, it was important to match product descriptions used in the ISIC classification with the HS system, as shown in Table 1. Table 1: Summary of pollution intensity classification by sector
Category 1 Category 2 Category 3 Most Polluting Sectors Moderately Polluting Sectors Least Polluting Sectors
Definition ToxTot≥1500pnds/USDmillion 500pnds/USDmillion ToxTot≤500pnds/USDmillion <ToxTot<1500pnds/USDmillion
Sectors (ISIC) industrialchemicals(351) pottery,china,earthenware(361) professional&scientificequipment(385) non-ferrousmetals(372) electricalmachinery(383) footwear,exceptrubberorplastic(324)
ironandsteel(371) rubberproducts(355) printingandpublishing(342) leatherproducts(323) othernon-metallicmineralproducts(369) woodproducts,exceptfurniture(331) pulpandpaper(341) textiles(321) glassandproducts(362) petroleumrefineries(353) transportequipment(384) tobacco(314) otherchemicals(352) othermanufacturedproducts(390) foodproducts(311) plasticproducts(356) misc.petroleumandcoalproducts(354) beverages(313) fabricatedmetalproducts(381) non-electricalmachinery(382) wearingapparel,exceptfootwear(322) furniture,exceptmetal(332)
Section (HS) metals(HS71-83) machineryandelectricalappliances(HS84-85) vegetableproducts(HS6-14) chemicals(HS28-38) mineralproducts(HS25-27) woodandwoodarticles(44-46) plastics(HS39) textilesandapparel(HS50-63) opticals,precisionand pulpandpaper(HS47-49) rubberproducts(HS40) musicalinstruments(HS90-92) hidesandleather(HS41-43) vehicles(HS86-89) stone/cement/ceramics(HS68-70) misc.manufacturedarticles(HS93-96) preparedfoodstuffs(HS15-24) footwear(HS64-67)

Environmental Impacts of the ASEAN-China Free Trade Agreement on the Greater Mekong Sub-Region
trade knowledge network
��
3.2.3. Analyzing the impact of trade on pollution levels
To estimate the impact of trade on pollution levels, the study team constructed a trade-environment matrix using data from the import/export trade matrices. The main assumption of a trade-environment matrix is that increasing trade (especially exports) will lead to an increase in production and a corresponding change in pollution levels. An example of such matrix can be found in Table 9 on page 30. The rows of the trade-environment matrix classify traded sectors according to their level of pollution intensity, and the columns depict time markers in the trade relationship between the GMS5 countries and China: pre-agreement (2001), signing of the agreement (2004) and post-agreement (2007). For each period, the first column records the trade value of each product category, the second column records the product’s relative share of total trade and the third column records estimated pollution intensity (EPI), which is extracted from the 1995 World Bank study by Hettige et al.
The EPI enables us to measure the level of pollution generated by production of output valued at one million USD. It is important to note that this analysis considers only the environmental consequences of final products. We understand that there are backward linkages, which result in some final products appearing to have small negative impacts on the environment when the production of their individual inputs may have caused many negative impacts. However, the analysis in this study is limited only to the final products.

Environmental Impacts of the ASEAN-China Free Trade Agreement on the Greater Mekong Sub-Region
trade knowledge network
��
4 ASEAN-China Free Trade Agreement (ACFTA) and its impacts on trade and the environment in the GMS
This chapter looks at the characteristics of ACFTA and its possible impacts on trade and the environment in the GMS5 countries and China. It consists of two parts. The first part presents an overview of ACFTA, including its historical development, rationale and the salient features of the agreement. The second part discusses trade between the GMS5 countries and China and its impact on the environment in terms of changes in pollution levels.
4.1. Overview of the ACFTA
4.1.1. Historical development of the ACFTA
Relations between ASEAN11 and the People’s Republic of China have undergone profound changes over the past 15 years. The relationship has evolved from one in which China was viewed as a potential threat to ASEAN, to the current relationship in which China is seen as a dynamic economic partner. China established official contact with ASEAN in 1991 and became a dialogue partner in 1996. ASEAN-China relations quickened pace with the establishment of the ASEAN-China Joint Cooperation Committee (in 1997), the ASEAN-China Cooperation Fund (also in 1997) and a series of ASEAN-China summits that followed. Since then, cooperation between ASEAN and China (especially in trade and investment) has been growing rapidly. Bilateral trade, for example, grew from $11.06 billion in 1994 to $39.5 billion in 2000. ASEAN’s investment in China was only $90 million in 1991, but it reached $4.8 billion in 1998 and $26.2 billion in 2001. China’s investment in ASEAN reached $1.1 billion in 2001 (ASEAN Secretariat).
After China joined the WTO in 2001, the volume of total trade grew at the fast pace of more than 20 per cent per annum during the period of 2001–06. Trade volume grew to $145.2 billion in 2006 and is anticipated to reach $200 billion by 2010 (Lim and Lai, 2007). Given such rapid developments in trade, a free trade area between ASEAN and China was proposed in the ASEAN+3 summit in November 2000 (involving ASEAN countries, China, Japan and Korea). This was followed by the establishment of the ASEAN-China expert group, which was tasked to conduct a feasibility study on ACFTA. The report by the expert group, which suggested that China and ASEAN create a free trade area within ten years, received applause from leaders at the ASEAN-China Summit in 2001.
On 4 November 2002, at the Eighth ASEAN-China Summit in Phnom Penh, ASEAN member states and China signed the Framework Agreement on Comprehensive Economic Cooperation between ASEAN countries and China. The Framework Agreement aimed to: 1) strengthen and enhance economic, trade and investment cooperation; 2) progressively liberalize and promote trade in goods and services, and create a transparent, liberal and facilitative investment regime; 3) explore new areas and develop appropriate measures for closer economic cooperation; and 4) facilitate more effective economic integration of the newer ASEAN members and bridge the development gap among the parties. The agreement covered trade in goods and services and investment, with provision for an Early Harvest Program (EHP)
11 The Association of Southeast Asian Nations or ASEAN was established on 8 August 1967 in Bangkok by the five original Member Countries, namely Indonesia, Malaysia, Philippines, Singapore and Thailand. Brunei Darussalam joined on 8 January 1984, Vietnam on 28 July 1995, Lao PDR and Myanmar on 23 July 1997 and Cambodia on 30 April 1999.

Environmental Impacts of the ASEAN-China Free Trade Agreement on the Greater Mekong Sub-Region
trade knowledge network
�0
to accelerate tariff reduction as well as elimination on certain agricultural goods. The EHP covered eight groups of agricultural produce—live animals, meat and edible meat offal, fish, dairy products, other animal products, live trees, vegetables and fruits and nuts—and set a three-year time frame for implementation beginning in January 2004. Along with the implementation of the EHP, ASEAN countries and China also negotiated trade agreements in goods and services as part of the ACFTA. The Trade in Goods Agreement was concluded in November 2004 and entered into force in July 2005, while the Trade in Services Agreement was signed in January 2007 and entered into force in July 2007.
4.1.2. Rationale for the ASEAN-China FTA
ASEAN’s motivations for forming the FTA were both economic and political. ASEAN countries welcomed the idea of an FTA with China for a number of reasons. First, China is a huge and dynamic economy, and its growing demand for goods and services from ASEAN could serve as a new engine of growth (Chia, 2004). ASEAN looks to China as its future primary export market for energy raw materials and electronic and machine parts. Closer ASEAN-China economic ties could also enable ASEAN to reduce dependence on the U.S., EU and Japan (Bernardino, 2004). Second, China is quite flexible toward newer ASEAN countries (Cambodia, Lao PDR, Myanmar and Vietnam), providing special and preferential treatment and development assistance, and extending WTO most favoured nation (MFN) benefits to non-WTO members. Such measures make it feasible for the newer ASEAN countries to benefit from trade liberalization with China, and could make it easier to bridge the development gap in the region. Third, China and ASEAN would be able to go further than the agreements and commitments made by all WTO members in liberalizing agricultural trade, because China’s temperate agriculture and ASEAN’s tropical agriculture are complementary. Fourth, ASEAN views the ASEAN-China FTA as a potential route to speed up its post-crisis recovery. According to Bernardino, ASEAN’s wish is to “ride the Chinese economic express with the objective of re-attracting [FDI] and hopefully redirect into the South East Asian region some of the huge amounts of FDI currently flowing into China.” (Bernardino, 2004, pg. 5).
China’s motivations for forming the ASEAN-China FTA were also both political and economic. Politically, China wished to remain on friendly terms with its neighbours to the south (Chia, 2004). The ASEAN-China FTA was part of a confidence-building process to allay ASEAN concerns over China’s economic threat by offering closer collaboration in areas including trade and investment, agriculture, information and communications technology, human resource development, Mekong basin development, tourism and security. Another main objective was geopolitical: to counter the United States’ containment strategy against China and to protect China’s trade routes in South East Asia. Closer economic relations with ASEAN would enable China to build its geopolitical clout and counterbalance the influence of the U.S. and Japan (Bernardino, 2004). Economically, China wanted to make ASEAN its backyard and source of raw materials as it becomes an industrial economy and net agricultural importer (Bernardino, 2004). Bernardino also asserted that China’s accession to the WTO in November 2001 as well as continued pressures by the U.S. were behind China’s drive to forge alliances with other developing countries, especially with its East Asian neighbours, including ASEAN, Japan and Korea, through the ASEAN+3 initiatives and the ASEAN-China FTA.
4.1.3. The Early Harvest Program
The Early Harvest Program (EHP) was part of the Framework Agreement, and was intended to accelerate tariff reduction and elimination on traded goods. The EHP covers products included in chapters 1–8 under the Harmonized System at the HS 8/9 digit level, and includes live animals, meat and edible meat offal, fish, dairy products, other animal products, live trees, edible vegetables and edible fruits and nuts.
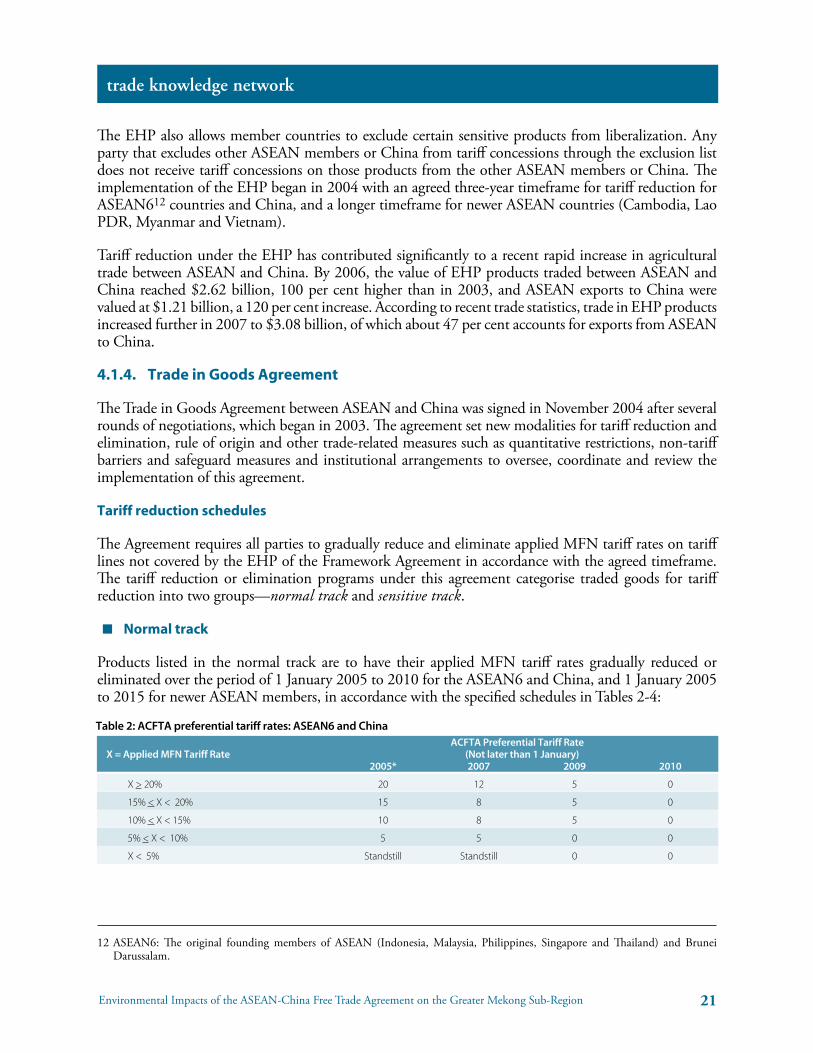
Environmental Impacts of the ASEAN-China Free Trade Agreement on the Greater Mekong Sub-Region
trade knowledge network
��
The EHP also allows member countries to exclude certain sensitive products from liberalization. Any party that excludes other ASEAN members or China from tariff concessions through the exclusion list does not receive tariff concessions on those products from the other ASEAN members or China. The implementation of the EHP began in 2004 with an agreed three-year timeframe for tariff reduction for ASEAN612 countries and China, and a longer timeframe for newer ASEAN countries (Cambodia, Lao PDR, Myanmar and Vietnam).
Tariff reduction under the EHP has contributed significantly to a recent rapid increase in agricultural trade between ASEAN and China. By 2006, the value of EHP products traded between ASEAN and China reached $2.62 billion, 100 per cent higher than in 2003, and ASEAN exports to China were valued at $1.21 billion, a 120 per cent increase. According to recent trade statistics, trade in EHP products increased further in 2007 to $3.08 billion, of which about 47 per cent accounts for exports from ASEAN to China.
4.1.4. Trade in Goods Agreement
The Trade in Goods Agreement between ASEAN and China was signed in November 2004 after several rounds of negotiations, which began in 2003. The agreement set new modalities for tariff reduction and elimination, rule of origin and other trade-related measures such as quantitative restrictions, non-tariff barriers and safeguard measures and institutional arrangements to oversee, coordinate and review the implementation of this agreement.
Tariff reduction schedules
The Agreement requires all parties to gradually reduce and eliminate applied MFN tariff rates on tariff lines not covered by the EHP of the Framework Agreement in accordance with the agreed timeframe. The tariff reduction or elimination programs under this agreement categorise traded goods for tariff reduction into two groups—normal track and sensitive track.
■ Normal track
Products listed in the normal track are to have their applied MFN tariff rates gradually reduced or eliminated over the period of 1 January 2005 to 2010 for the ASEAN6 and China, and 1 January 2005 to 2015 for newer ASEAN members, in accordance with the specified schedules in Tables 2-4:
12 ASEAN6: The original founding members of ASEAN (Indonesia, Malaysia, Philippines, Singapore and Thailand) and Brunei Darussalam.
Table 2: ACFTA preferential tariff rates: ASEAN6 and China ACFTA Preferential Tariff Rate
X = Applied MFN Tariff Rate (Not later than 1 January) 2005* 2007 2009 2010
X>20% 20 12 5 0
15%<X<20% 15 8 5 0
10%<X<15% 10 8 5 0
5%<X<10% 5 5 0 0
X<5% Standstill Standstill 0 0
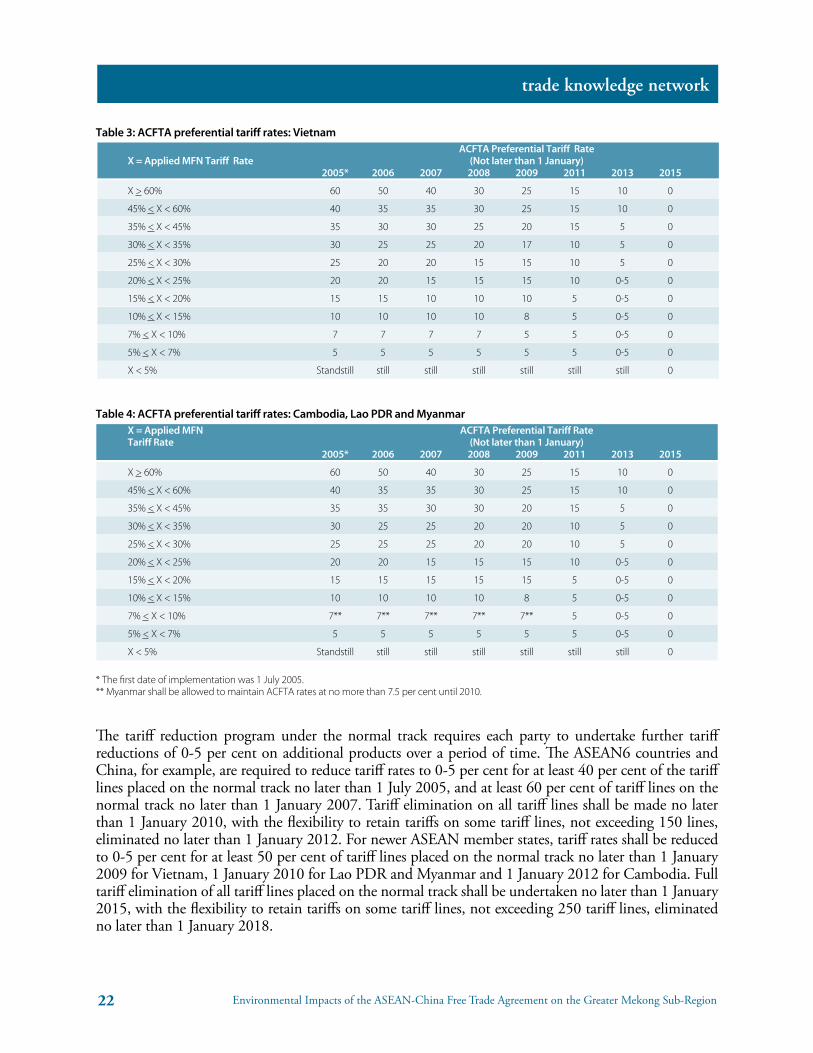
Environmental Impacts of the ASEAN-China Free Trade Agreement on the Greater Mekong Sub-Region
trade knowledge network
��
Table 3: ACFTA preferential tariff rates: Vietnam ACFTA Preferential Tariff Rate X = Applied MFN Tariff Rate (Not later than 1 January) 2005* 2006 2007 2008 2009 2011 2013 2015
X>60% 60 50 40 30 25 15 10 0
45%<X<60% 40 35 35 30 25 15 10 0
35%<X<45% 35 30 30 25 20 15 5 0
30%<X<35% 30 25 25 20 17 10 5 0
25%<X<30% 25 20 20 15 15 10 5 0
20%<X<25% 20 20 15 15 15 10 0-5 0
15%<X<20% 15 15 10 10 10 5 0-5 0
10%<X<15% 10 10 10 10 8 5 0-5 0
7%<X<10% 7 7 7 7 5 5 0-5 0
5%<X<7% 5 5 5 5 5 5 0-5 0
X<5% Standstill still still still still still still 0
Table 4: ACFTA preferential tariff rates: Cambodia, Lao PDR and Myanmar X = Applied MFN ACFTA Preferential Tariff Rate Tariff Rate (Not later than 1 January) 2005* 2006 2007 2008 2009 2011 2013 2015
X>60% 60 50 40 30 25 15 10 0
45%<X<60% 40 35 35 30 25 15 10 0
35%<X<45% 35 35 30 30 20 15 5 0
30%<X<35% 30 25 25 20 20 10 5 0
25%<X<30% 25 25 25 20 20 10 5 0
20%<X<25% 20 20 15 15 15 10 0-5 0
15%<X<20% 15 15 15 15 15 5 0-5 0
10%<X<15% 10 10 10 10 8 5 0-5 0
7%<X<10% 7** 7** 7** 7** 7** 5 0-5 0
5%<X<7% 5 5 5 5 5 5 0-5 0
X<5% Standstill still still still still still still 0
*Thefirstdateofimplementationwas1July2005.**MyanmarshallbeallowedtomaintainACFTAratesatnomorethan7.5percentuntil2010.
The tariff reduction program under the normal track requires each party to undertake further tariff reductions of 0-5 per cent on additional products over a period of time. The ASEAN6 countries and China, for example, are required to reduce tariff rates to 0-5 per cent for at least 40 per cent of the tariff lines placed on the normal track no later than 1 July 2005, and at least 60 per cent of tariff lines on the normal track no later than 1 January 2007. Tariff elimination on all tariff lines shall be made no later than 1 January 2010, with the flexibility to retain tariffs on some tariff lines, not exceeding 150 lines, eliminated no later than 1 January 2012. For newer ASEAN member states, tariff rates shall be reduced to 0-5 per cent for at least 50 per cent of tariff lines placed on the normal track no later than 1 January 2009 for Vietnam, 1 January 2010 for Lao PDR and Myanmar and 1 January 2012 for Cambodia. Full tariff elimination of all tariff lines placed on the normal track shall be undertaken no later than 1 January 2015, with the flexibility to retain tariffs on some tariff lines, not exceeding 250 tariff lines, eliminated no later than 1 January 2018.

Environmental Impacts of the ASEAN-China Free Trade Agreement on the Greater Mekong Sub-Region
trade knowledge network
��
■ Sensitive track
Products listed on the sensitive track need to have their applied MFN rates reduced to end rates by dates to be mutually agreed. The number of products in this track is subject to a ceiling of 400 tariff lines at the Harmonized System (HS) 6-digit level and 10 per cent of total import value based on 2001 trade statistics for the ASEAN6 and China, and of 500 tariff lines for the newer ASEAN countries. Tariff lines in the sensitive track are further classified into the Sensitive List and the Highly Sensitive List. The applied MFN tariff rate for tariff lines placed on the Sensitive List shall be reduced to 20 per cent no later than 1 January 2012 for ASEAN6 and China and no later than 1 January 2015 for newer ASEAN members.13 The further tariff rate reduction to 0-5 per cent shall be done no later than 1 January 2018 for ASEAN6 and China and no later than 1 January 2020 for newer ASEAN members. For products placed on the Highly Sensitive List, which should not exceed 100 tariff lines at the HS 6-digit level for ASEAN6 and China, and 150 tariff lines for newer ASEAN members, the tariff rates shall be reduced to not more than 50 per cent no later than 1 January 2015 for ASEAN6 and China, and 2018 for newer ASEAN member states. Tables 5 and 6 provide a summary of the tariff reduction schedules for the sensitive track:Table 5: Tariff reduction schedules for the sensitive track: ASEAN6 and China
No later than January 2012 No later than January 2018
Sensitive List 20% 0-5%
Highly Sensitive List -- <50%
Table 6: Tariff reduction schedules for the sensitive track: New ASEAN countries
No later than January 2015 No later than January 2018 No later than January 2020
Sensitive List 20% -- 0-5%
Highly Sensitive List -- <50% --
Rules of origin
The rules of origin (ROO) provided in the Trade in Goods Agreement set out criteria and rules for products eligible for the preferential tariff concession under ACFTA. According to the origin criteria under Annex 3 of the Agreement, products imported by a member country shall be deemed to be originating and eligible for lower tariff if they are wholly obtained or produced in the country. If they are not wholly produced, they need to have local content of no less than 40 per cent. Products that satisfy ROO requirements shall receive a Certificate of Origin issued by government authorities designated by the exporting country with notification to the other countries in conformation with the Operational Certification Procedures.
Other components
For other important trade related measures such as non-tariff measures, technical barriers to trade, sanitary and phytosanitary standards (SPS), subsidies and countervailing measures, anti-dumping measures and intellectual property rights, the Trade in Goods Agreement basically follows various provisions of the WTO. For example, the Agreement states that quantitative restrictions should not be maintained unless otherwise permitted under the WTO disciplines, and other non-tariff barriers (other than quantitative restrictions) should be identified and eliminated as soon as possible after entry into force of the Agreement.
13 Vietnam has not yet determined the specific tariff rate on the Sensitive List for reduction by 1 January 2015.

Environmental Impacts of the ASEAN-China Free Trade Agreement on the Greater Mekong Sub-Region
trade knowledge network
��
On safeguard measures,14 the Agreement stresses that each signatory country that is a WTO Member retains its rights and obligations under Article XIX of GATT 1994 and the WTO Agreement on Safeguards, while providing ACFTA safeguard measures for countries that are not WTO Members. A country is free to take ACFTA safeguard measures if its tariff concessions under the EHP or the Trade in Goods Agreement tariff reduction schedule cause or threaten to cause serious injury from imports to domestic industries that produce like or directly competitive products. The measure may increase the tariff rate applicable to the product concerned to the WTO MFN tariff rate applied to such product at the time when the measure is taken, and may also be maintained for an initial period of up to three years, with possible extension for a period not exceeding one year.
While pending the establishment of a permanent institution, a body comprising the ASEAN Economic Ministers (AEM) and the Ministry of Commerce of China (MOFCOM) is designated to oversee, supervise, coordinate and review the implementation of the Trade in Goods Agreement. This body is supported and assisted by the ASEAN Senior Economic Officials Meeting. The AEM-MOFCOM was to meet within a year of the official start of the Agreement, and then biennially or otherwise as appropriate to review the Agreement for the purpose of considering further measures to liberalize trade in goods as well as to develop disciplines and negotiate agreements on trade-related provisions of WTO disciplines.
Unlike some trade agreements that contain environmental provisions, especially those signed by the U.S. and Canada, the Trade in Goods Agreement does not have provisions discussing the environmental aspects of trade. Instead, environmental cooperation between ASEAN and China is addressed through other cooperation initiatives. First, under the ASEAN+3 summit, environmental ministers meet once a year to discuss policy issues and areas of cooperation, which include natural resources conservation; water resources conservation; protection of the ocean environment; environmental technology training and public participation; wetland protection; forest ecological system and biodiversity conservation; clean production and the prevention and control of trans-boundary pollution. Other cooperation on environmental issues between ASEAN and China is made possible through the GMS framework. The problems of environmental degradation in the GMS have been recognized and raised in a series of GMS Summits,15which are an important venue for leaders to discuss and agree on priority actions for the GMS Economic Cooperation Program.
The GMS Economic Cooperation Program has a vision to promote sustainable management of the sub-region’s resources in order to reverse earlier degradation and mitigate adverse environmental impacts from new development. One of its priority areas is the Core Environment Program (CEP), which has five components: strategic environmental assessments of GMS economic corridors and priority sectors; biodiversity conservation corridors initiative; environmental performance assessments (EPAs); capacity building for environmental management; and program development, delivery and sustainable financing. The CEP is intended to empower GMS countries to effectively manage their environment and economic development through conserving biodiversity, strengthening their environment and development planning and management capacity and responding to climate change in a collective and collaborative manner.
14 Under WTO rules, safeguard measures (such as quantitative import restrictions or duty increases to higher than bound rates) can be implemented to temporarily restrict imports of a specific product, where such imports have caused or threaten to cause serious injury to the importing Member’s domestic industry.
15 The GMS Summit takes place every three years. The first GMS summit was held in Phnom Penh, Cambodia on 3 November 2002, the second summit was held in Kunming, China on 4-5 July 2005 and the third took place in Vientiane, Lao PDR on 30-31 March 2008.

Environmental Impacts of the ASEAN-China Free Trade Agreement on the Greater Mekong Sub-Region
trade knowledge network
��
The Working Group on Environment (WGE) serves as a forum and advisory body to address environmental issues in sub-regional projects and facilitate cooperation in information exchange training, policy coordination and project financing and implementation. Notable achievements have been made through the CEP, including launching of several pilot projects to improve biodiversity conservation, strengthening the WGE through capacity building, and establishing the Environment Operations Centre (EOC) to coordinate trans-boundary environmental issues and share resources and information on long-term and sustainable basis.
In summary, economic and trade relations between ASEAN and China have developed quickly, and the move to form the ACFTA was another major step toward closer and deeper economic cooperation for mutual benefit. However, the environmental agenda has not been well discussed in trade negotiations, as reflected by the absence of provisions in the trade agreement to deal with environmental consequences arising from trade. Although regional environmental cooperation between ASEAN and China exists in other initiatives, none of them are specifically linked to trade.
4.2. Trade within the GMS and its implications on the environment
4.2.1. Overview of trade between the GMS5 countries and China
External trade in the GMS has grown rapidly over the past eight years, as shown in Figure 2. Total trade between China and the GMS5 countries grew at an average rate of 27 per cent per annum from $9.98 billion in 2000 to $53.01 billion in 2007. The GMS5 countries’ exports to China represent about half of total trade and grew at an average rate of 26 per cent per annum during 2000-07, while imports from China rose by 29 per cent per annum during the same period.
Figure 2: Trade between China and the GMS5 countries
Source:GlobalTradeAtlasandUNComtrade

Environmental Impacts of the ASEAN-China Free Trade Agreement on the Greater Mekong Sub-Region
trade knowledge network
��
Export of goods from GMS5 countries to China
The export structure from GMS5 countries to China is highly concentrated on a small number of product groups, accounting for 87 per cent of all exports in 2007. The largest export products are machinery and mechanical appliances and electrical machinery, representing about half of total exports, followed by mineral fuels, rubber, plastics, chemicals and woods. Certain agricultural products including vegetables and fruits are also among the major exports from the GMS5 countries to China, in spite of their much smaller share (4 per cent). Table 7 shows that the volume of top ten export products has risen dramatically over the last seven years (from $4.75 billion in 2001 to $12.1 billion in 2004 and $23.1 billion in 2007), and their relative share has increased from 81 per cent in 2001 to 88 per cent in 2007.
Table 7: Export structure from GMS5 countries to China(inUSDmillion)
HS Code Description Value Periodical Change (%) Share (%) 2001 2004 2007 2004/01 2007/04 2007/01 2001 2004 2007
84 Machinery&mechanical 975.1 2,846.9 7,251.6 192% 155% 644% 16.5% 19.9% 27.5% appliances
85 Electricalmachinery 918.3 2,984.6 5,818.3 225% 95% 534% 15.6% 20.9% 22.1%
27 Mineralfuelsandoils 1,071.9 2,426.7 2,506.0 126% 3% 134% 18.2% 17.0% 9.5%
40 Rubber 465.8 1,155.0 2,297.1 148% 99% 393% 7.9% 8.1% 8.7%
39 Plastics 666.4 1,223.7 1,641.3 84% 34% 146% 11.3% 8.6% 6.2%
29 Organicchemicals 104.8 344.1 1,357.4 228% 294% 1195% 1.8% 2.4% 5.1%
44 Woodandarticlesofwood 244.3 456.5 762.2 87% 67% 212% 4.1% 3.2% 2.9%
07 Ediblevegetables 139.7 326.8 649.6 134% 99% 365% 2.4% 2.3% 2.5%
26 Ores,slagandash 33.5 130.3 436.0 289% 234% 1200% 0.6% 0.9% 1.7%
08 Ediblefruit 130.1 214.6 369.7 65% 72% 184% 2.2% 1.5% 1.4%
Total top 10 export items 4,750.4 12,109 23,089 154.9% 90.7% 386.1% 80.5% 84.8% 87.5%
Others 1,150 2,162 3,283 87.9% 51.9% 185.4% 19.5% 15.2% 12.5%
All products 5,901 14,272 26,373 141.9% 84.8% 346.9% 100% 100% 100%
Source: Global Trade Atlas 2007
Thailand is the largest exporter to China among the GMS5 countries. Thailand’s exports in 2007 amounted to $22.65 billion, or about 86 percent of total GMS5 exports in that year, a significant increase from $11.54 billion in 2004. The largest export product groups include machinery and electrical appliances, rubber, organic chemicals, mineral fuel, vegetables, wood, and fruits and nuts. Vietnam is the second largest export country to China, with export value at $3.21 billion in 2007. Vietnam’s export pattern is similar to that of Thailand, with exports concentrated in natural resource products (mineral fuel, ore, wood, rubber), agricultural goods (vegetable, fruits and nuts, starch) and manufactured goods (machinery and electrical appliances, footwear). These top ten products contribute significantly to total exports (87 per cent). Myanmar is the third largest export country to China, followed by Lao PDR and Cambodia. Their export structures are not much different from that of Vietnam, concentrated mainly on natural resources and agricultural products (see more detail in Tables A.2-A.5 in the appendix). The export structure of Cambodia to China is discussed in greater detail in the next chapter of this report.
Figure 3 shows trends of China’s imports from GMS5 countries for two major groups of products. Group one, which is represented in solid lines on the graph, refers to product clusters whose tariff rates were reduced under the ACFTA commitment for imports originating from GMS5 countries. Those products include machinery and mechanical appliances (HS 84), electronic machinery (HS 85), mineral fuel (HS 27), rubber (HS 40), plastics (HS 39), vegetables (HS 07) and fruits (HS 08). Group two, which is
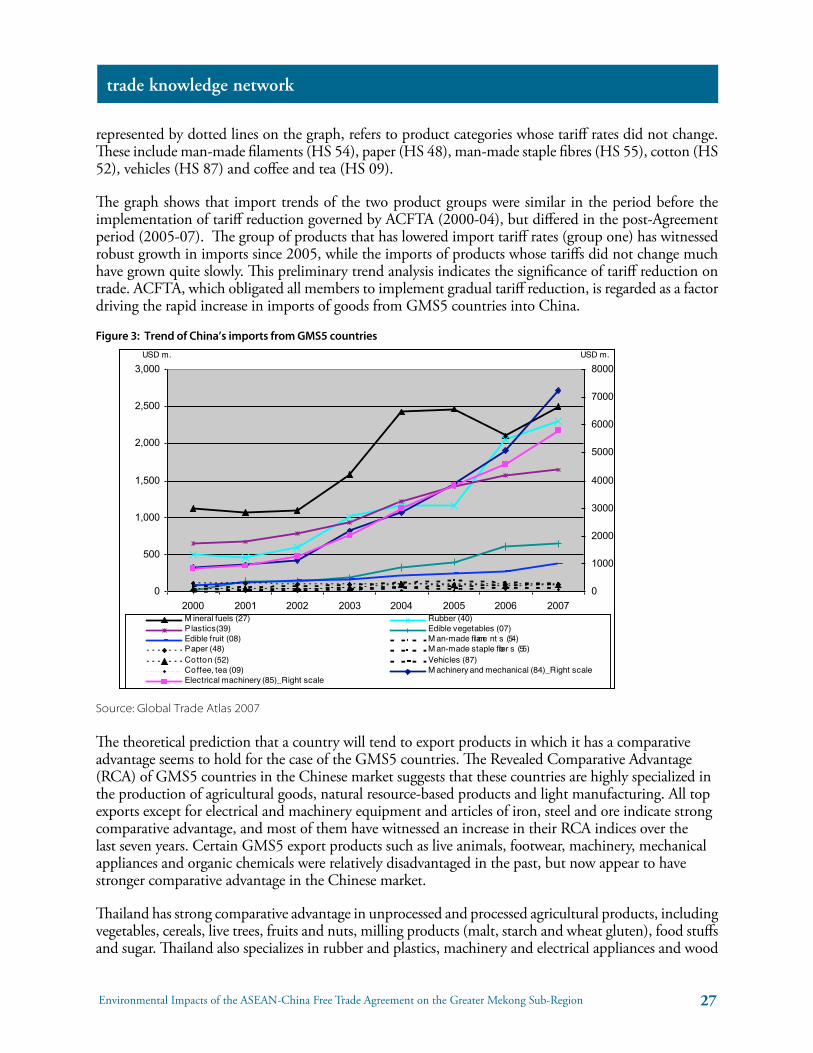
Environmental Impacts of the ASEAN-China Free Trade Agreement on the Greater Mekong Sub-Region
trade knowledge network
��
represented by dotted lines on the graph, refers to product categories whose tariff rates did not change. These include man-made filaments (HS 54), paper (HS 48), man-made staple fibres (HS 55), cotton (HS 52), vehicles (HS 87) and coffee and tea (HS 09).
The graph shows that import trends of the two product groups were similar in the period before the implementation of tariff reduction governed by ACFTA (2000-04), but differed in the post-Agreement period (2005-07). The group of products that has lowered import tariff rates (group one) has witnessed robust growth in imports since 2005, while the imports of products whose tariffs did not change much have grown quite slowly. This preliminary trend analysis indicates the significance of tariff reduction on trade. ACFTA, which obligated all members to implement gradual tariff reduction, is regarded as a factor driving the rapid increase in imports of goods from GMS5 countries into China.
Figure 3: Trend of China’s imports from GMS5 countries
Source: Global Trade Atlas 2007
The theoretical prediction that a country will tend to export products in which it has a comparative advantage seems to hold for the case of the GMS5 countries. The Revealed Comparative Advantage (RCA) of GMS5 countries in the Chinese market suggests that these countries are highly specialized in the production of agricultural goods, natural resource-based products and light manufacturing. All top exports except for electrical and machinery equipment and articles of iron, steel and ore indicate strong comparative advantage, and most of them have witnessed an increase in their RCA indices over the last seven years. Certain GMS5 export products such as live animals, footwear, machinery, mechanical appliances and organic chemicals were relatively disadvantaged in the past, but now appear to have stronger comparative advantage in the Chinese market.
Thailand has strong comparative advantage in unprocessed and processed agricultural products, including vegetables, cereals, live trees, fruits and nuts, milling products (malt, starch and wheat gluten), food stuffs and sugar. Thailand also specializes in rubber and plastics, machinery and electrical appliances and wood

Environmental Impacts of the ASEAN-China Free Trade Agreement on the Greater Mekong Sub-Region
trade knowledge network
��
products. Like Thailand, Vietnam has specialization in unprocessed and processed agricultural products, rubber and wood products. In addition, Vietnam is also good at producing mineral fuel, clothing apparel and footwear, and these products have strong comparative advantage in the Chinese market. Myanmar’s specialization pattern is mainly concentrated in agricultural goods and natural resource-based products, while the comparative advantage of Lao PDR lies in limited products such as rubber, wood products, coffee and tea and apparels (see more detail in Tables A.6-A.10 in the appendix). Cambodia’s pattern of specialization in the Chinese market is discussed in the next chapter of this report.
Import of goods by GMS5 countries from China
GMS5 countries’ imports from China are concentrated in manufacturing and industrial products, as shown in Table 8. The major import products, which accounted for 67.5 per cent of total imports in 2007, include machinery and mechanical appliances, electrical machinery, iron and steel, vehicles, mineral fuels and oils, cotton and fabrics and chemicals and fertilizers. Machinery, mechanical appliances and electrical machinery accounted for more than a third of total imports in 2007. This means that GMS5 countries and China have a high level of intra-industry trade.
Thailand is the largest importer of Chinese goods among GMS5 countries. In 2007, Thailand imported $11.98 billion of goods from China, or about 45 percent of total GMS5 imports. The largest import product groups are machinery and electrical appliances, iron and steel, base metals, chemicals, plastics and vehicles. Vietnam was the second largest importer of goods from China (among GMS5 countries), with imports valued at $11.91 billion, or 44 percent of GMS5 imports. Machinery and electrical appliances are the top imports, followed by iron and steel, mineral fuel, vehicles and fertilizers. Vietnam also imports a significant amount of cotton and fabrics from China, and these imports are used as inputs for export-oriented garment production. Myanmar accounts for the next largest share of imports from China, followed by Cambodia and Lao PDR. Their import structures are very similar to that of Vietnam (see more detail in Tables A.2-A.5 in the appendix). Cambodia’s import structure from China will be discussed in greater detail in the next chapter of this report.
Table 8: Import structure of GMS5 countries from China(inUSDmillion)
HS Code Description Value Periodical Change (%) Share (%) 2001 2004 2007 2004/01 2007/04 2007/01 2001 2004 2007
84 Machinery&mechanical 998.5 1,973.5 4,803.5 98% 143% 381% 20.4% 17.1% 18.0% appliances
85 Electricalmachinery 730.3 1,718.4 4,091.8 135% 138% 460% 14.9% 14.9% 15.4%
72 Ironandsteel 205.5 1,231.7 3,611.5 499% 193% 1657% 4.2% 10.7% 13.6%
87 Vehicles 528.1 330.3 1,054.7 -37% 219% 100% 10.8% 2.9% 4.0%
27 Mineralfuelsandoils 303.0 797.2 997.3 163% 25% 229% 6.2% 6.9% 3.7%
73 Articlesofironorsteel 95.2 232.1 771.2 144% 232% 710% 1.9% 2.0% 2.9%
52 Cotton 149.5 406.7 739.2 172% 82% 394% 3.1% 3.5% 2.8%
60 Fabrics 56.2 219.4 677.9 290% 209% 1105% 1.1% 1.9% 2.5%
29 Organicchemicals 130.3 229.7 646.8 76% 182% 396% 2.7% 2.0% 2.4%
31 Fertilizers 86.9 486.9 588.7 460% 21% 577% 1.8% 4.2% 2.2%
Total top 10 import items 3,283.9 3,283.9 17,982 132.2% 135.8% 447.6% 67.1% 66.0% 67.5%
Others 1,608.3 1,608.3 8,651.8 144.1% 120.4% 437.9% 32.9% 34.0% 32.5%
All products 4,892.3 4,892.3 26,634 136.1% 130.6% 444.4% 100.0% 100.0% 100.0%
Source: Global Trade Atlas 2007

Environmental Impacts of the ASEAN-China Free Trade Agreement on the Greater Mekong Sub-Region
trade knowledge network
��
Figure 4 shows the trend of GMS5 imports from China for two groups of products. The first group (represented by solid lines on the graph) includes machinery and mechanical appliances (HS 84), electronic machinery (HS 85), iron and steel (HS 72), vehicles (HS 87), cotton (HS 52), fabrics (HS 60) and organic chemicals (HS 29). Import tariffs for majority of these products originating from China were reduced by GMS5 countries. The second group (represented by dotted lines on the graph) shows products whose tariff rates did not change much. These include paper (HS 48), glass and glassware (HS 70), footwear (HS 64), cereals (HS 10), preparation of meat (HS 16) and sugar and confectionery (HS 17).
The graph in Figure 4 shows that the two product groups had similar growth trends (constant growth) during the pre-FTA period (2000-04), but these began to diverge after the implementation of tariff reductions in 2005. The group of products with lower import tariff rates has witnessed robust growth in imports post FTA signing (2005-07), while products whose tariffs did not change much have shown only modest growth in imports. This preliminary trend analysis reflects the significance of tariffs on trade flows, and suggests that the implementation of tariff reductions under ACFTA is a factor driving the rapid increase of GMS5 imports from China.
Figure 4: Trend of GMS5 countries’ imports from China
Source: Global Trade Atlas 2007
RCA analysis suggests that China has a comparative advantage in a wide range of products in GMS5 countries’ markets. The major specializations are footwear, stone and ceramics, textiles and textile articles, hides and leathers, and iron and steel. Unlike in GMS5 countries, only half of China’s top ten exports (cotton, iron and steel, fabrics, fertilizers, machinery and mechanical appliances) have comparative advantage. Trade in these products represents about 39 per cent of China’s total exports to GMS5 countries. Although the RCA indices of major export products have not changed significantly over the last seven years, most of them have witnessed slight increases. For example, the RCA of cotton has increased from 2.51 in 2001 to 2.77 in 2007, while iron and steel’s RCA index jumped quickly to 2.22 in 2007 from 0.95 in 2001. Vehicles are one exception, given that the RCA index of vehicle manufacturing has dropped considerably over the last seven years from a level of comparative advantage (2.61) to one of disadvantage (0.90) (for more information see Table A.12 in the appendix).

Environmental Impacts of the ASEAN-China Free Trade Agreement on the Greater Mekong Sub-Region
trade knowledge network
�0
4.2.2. Impacts of trade on pollution levels
As elaborated in the methodology section, in order to estimate the impacts of trade on pollution levels, we classified traded products into three major categories by levels of pollution intensity: most polluting sectors, moderately polluting sectors and least polluting sectors. Trade value is defined as the sum of exports and imports of the GMS5 countries to and from China, and this figure is used to estimate GMS-wide environmental impacts in terms of pollution intensity generated by production.
Table 9 suggests that total trade in the most pollut�ng sectors has increased over time at a faster pace than other sectors and accounts for a significant amount of total trade—25 per cent in 2007. Since production of these goods generates a greater amount of pollution intensity than other product groups, rapid increase in their production as a result of increased trade across the sub-region is likely to raise pollution intensity and thus contribute to environmental degradation. At the total value at $13.44 billion in intra-GMS trade, pollution intensity is estimated to reach 118.5 million pounds for the whole sub-region. China is the major producer of goods in the most polluting sectors, accounting for 70 per cent of the $13.44
Table 9: Trade-environment matrix for total trade between GMS5 countries and China
HS Code Description Value (in USD billion) Share (%) EPI* (in million pounds) 2001 2004 2007 2001 2004 2007 2001 2004 2007
71-83 Basemetals 0.63 2.37 6.09 5.8 9.2 11.5 5.6 21.3 54.9
28-38 Chemicals 0.75 1.92 4.40 7.0 7.4 8.3 9.4 24.0 54.9
39-43 Plastics 0.72 1.41 2.15 6.7 5.5 4.1 1.8 3.5 5.3
47-49 Pulpandpaper 0.19 0.20 0.47 1.7 0.8 0.9 0.7 0.7 1.7
41-43 Hidesandleather 0.08 0.20 0.33 0.7 0.8 0.6 0.4 1.0 1.7
Most polluting sectors 2.37 6.10 13.44 21.93 23.62 25.36 17.89 50.53 118.5
84-85 Machinery& 3.62 9.52 21.97 33.6 36.9 41.4 1.8 4.8 11.2 electricalappliances
25-27 Mineralproducts 1.45 3.40 4.01 13.4 13.2 7.6 1.1 2.6 3.1
50-63 Textilesandapparel 0.74 1.87 3.82 6.8 7.2 7.2 0.5 1.3 2.7
40 Rubberproducts 0.50 1.23 2.51 4.6 4.8 4.7 0.6 1.4 3.0
86-89 Vehicles 0.60 0.46 1.27 5.6 1.8 2.4 0.5 0.4 1.0
93-96 Miscellaneous 0.06 0.18 0.45 0.6 0.7 0.8 0.04 0.1 0.3 manufacturedarticles
Moderately polluting sectors 6.97 16.67 34.03 64.58 64.53 64.20 4.57 10.68 21.14
6-14 Vegetableproducts 0.53 1.23 2.08 4.9 4.8 3.9 0.01 0.02 0.04
44-46 Woodandwoodarticles 0.25 0.51 0.96 2.3 2.0 1.8 0.1 0.2 0.4
90-92 Optical,precision& 0.15 0.44 0.85 1.4 1.7 1.6 0.1 0.2 0.3 musicalInstrument
68-70 Stone/cement/ceramics 0.09 0.27 0.55 0.8 1.0 1.0 0.03 0.1 0.2
15-24 Preparedfoodstuffs 0.30 0.33 0.53 2.7 1.3 1.0 0.1 0.1 0.1
64-67 Footwear 0.05 0.12 0.28 0.4 0.5 0.5 0.023 0.1 0.1
1-5 Liveanimals 0.08 0.12 0.26 0.8 0.5 0.5 0.001 0.002 0.005
97-99 Antiquesandworksofart 0.01 0.04 0.03 0.1 0.1 0.0 0.004 0.019 0.012
Least polluting sectors 1.46 3.06 5.53 13.52 11.85 10.44 0.30 0.64 1.21
Total All products 10.79 25.82 53.01 100 100 100 23 62 141
*EstimatedPollutionIntensitySource: Authors’ calculation based on trade data from Global Trade Atlas

Environmental Impacts of the ASEAN-China Free Trade Agreement on the Greater Mekong Sub-Region
trade knowledge network
��
billion of traded goods in the most polluting sectors in 2007. Since trade in these sectors produces the vast majority of estimated pollution arising from trade between China and GMS5 countries, then much of the GMS-wide pollution intensity generated by trade originates in China.
For the moderately pollut�ng sectors, which include machinery and electrical appliances, mineral products, textiles and apparel, rubber products, vehicles and miscellaneous manufactured articles, trade in these goods accounts for 64 per cent of total trade at a value of $34.03 billion, with pollution intensity estimated at 21.14 million pounds. Although the percentage increase in pollution intensity between 2001 and 2007 is quite significant, the overall intensity level generated by trade in these sectors is less than a fifth of that for the most polluting sectors. China and the GMS5 countries have traded with each other at similar levels (in this category), and have thus contributed almost equally to GMS-wide pollution from the production of goods falling into the moderately polluting sectors.
Trade in products that fall into the least pollut�ng sectors accounts for only 10 per cent of total trade, with pollution intensity estimated at just 1.21 million pounds. By this classification, wood and wood products, which represent 17 per cent of trade in the least polluting sectors (with the majority coming from GMS5 countries) are considered to be products that cause the least harm in terms of pollution intensity.
Although trade in natural resource-based products tends to cause lower levels of pollution than trade in other products, it has large implications for other aspects of environmental degradation. In the absence of strong regulations and enforcement, an increase in trade in wood and wood products is likely to lead to deforestation, which will in turn cause many local and global environmental problems. At the local level, loss of forest cover reduces the ground’s water retention capacity, making lowlands more prone to flooding and landslides, increases the rate of soil erosion and reduces biodiversity. Globally, deforestation contributes indirectly to global warming by reducing the earth’s carbon sinks (WTO, 1999).
Having agreed to gradually reduce tariff rates under ACFTA, GMS5 countries and China are expected to experience continued growth in trade, with exports based on their respective specializations and competitiveness. Given the recent trend in trade in the most polluting sectors, which has risen at a constant rate over the last seven years, one may surmise that trade in these sectors will continue to grow, both in terms of absolute value and relative share. Providing that production of these sectors generates substantial amounts of pollution intensity, the additional value of trade is likely to cause greater damage to the environment.
The analysis of RCA and trade structures indicates that China exports from its most polluting sectors and is likely to remain the main producer and exporter of most polluting products, given its relatively strong comparative advantage in their production. This means that the majority of additional pollution intensity will be generated in China as a result of greater production in response to emerging trade opportunities. For the moderately polluting sectors, intra-industry trade in machinery and electrical appliances has witnessed rapid growth over time. Machinery and electrical appliances are likely to remain the major trading products that the GMS5 countries and China will export to each other, while trade in other products such as rubber, textiles and apparel, vehicles and mineral products is also expected to rise. Since the production of these products is more technology based, an increase in their trade is less likely to significantly increase pollution as compared to trade in products from the most polluting sectors.
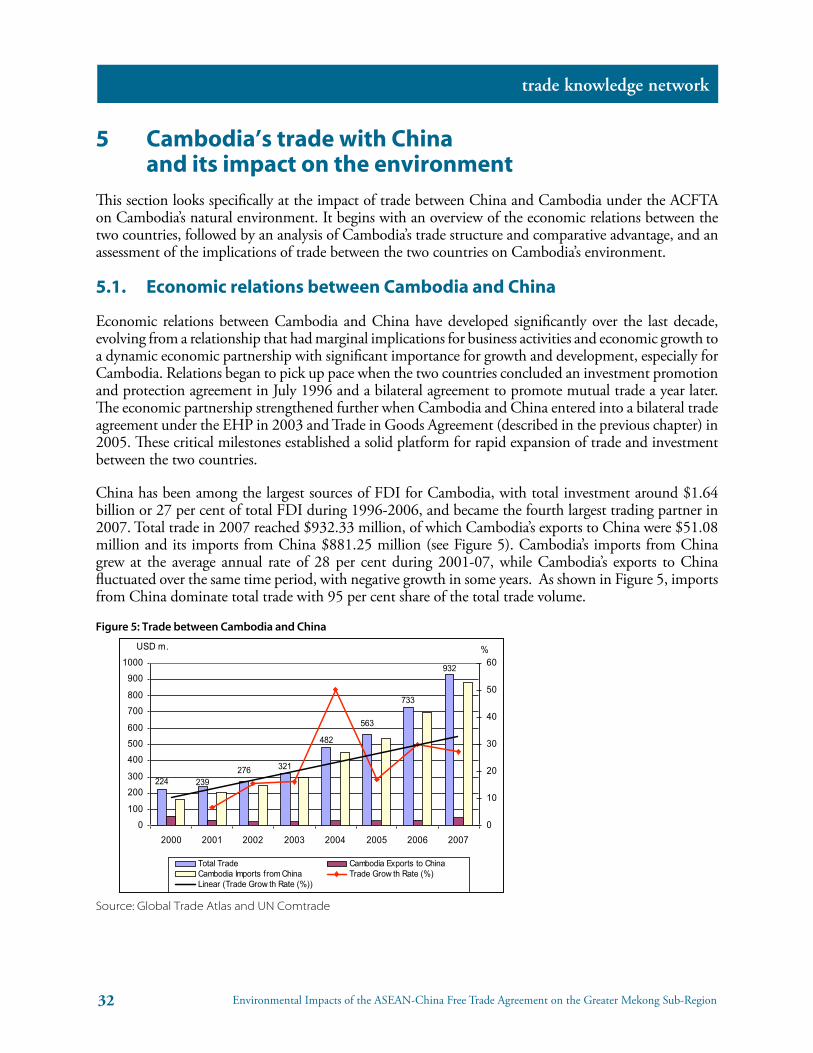
Environmental Impacts of the ASEAN-China Free Trade Agreement on the Greater Mekong Sub-Region
trade knowledge network
��
5 Cambodia’s trade with China and its impact on the environment
This section looks specifically at the impact of trade between China and Cambodia under the ACFTA on Cambodia’s natural environment. It begins with an overview of the economic relations between the two countries, followed by an analysis of Cambodia’s trade structure and comparative advantage, and an assessment of the implications of trade between the two countries on Cambodia’s environment.
5.1. Economic relations between Cambodia and China
Economic relations between Cambodia and China have developed significantly over the last decade, evolving from a relationship that had marginal implications for business activities and economic growth to a dynamic economic partnership with significant importance for growth and development, especially for Cambodia. Relations began to pick up pace when the two countries concluded an investment promotion and protection agreement in July 1996 and a bilateral agreement to promote mutual trade a year later. The economic partnership strengthened further when Cambodia and China entered into a bilateral trade agreement under the EHP in 2003 and Trade in Goods Agreement (described in the previous chapter) in 2005. These critical milestones established a solid platform for rapid expansion of trade and investment between the two countries.
China has been among the largest sources of FDI for Cambodia, with total investment around $1.64 billion or 27 per cent of total FDI during 1996-2006, and became the fourth largest trading partner in 2007. Total trade in 2007 reached $932.33 million, of which Cambodia’s exports to China were $51.08 million and its imports from China $881.25 million (see Figure 5). Cambodia’s imports from China grew at the average annual rate of 28 per cent during 2001-07, while Cambodia’s exports to China fluctuated over the same time period, with negative growth in some years. As shown in Figure 5, imports from China dominate total trade with 95 per cent share of the total trade volume.
Figure 5: Trade between Cambodia and China
Source: Global Trade Atlas and UN Comtrade

Environmental Impacts of the ASEAN-China Free Trade Agreement on the Greater Mekong Sub-Region
trade knowledge network
��
Exports of goods from Cambodia to China
As shown in Table 10, Cambodia’s exports to China are highly concentrated in a small number of product groups, including natural resource-based products, agricultural products and apparel. Wood and wood products represent the largest export, constituting 47 per cent of total exports to China valued at $24.09 million, and rubber the second largest export (21.6 per cent) with total value of $11 million in 2007. A considerable amount of rubber was also exported to Vietnam through cross-border trade for processing and re-export to China. Other major exports are cotton and clothing products, essential oils, fish and crustaceans and live animals.
Table 10: Export structure of Cambodia to China(inUSDmillion)
HS Code Description Value Periodical Change (%) Share (%) 2001 2004 2007 2004/01 2007/04 2007/01 2001 2004 2007
44 Woodandwoodproducts 27.03 15.07 24.09 -44% 60% -11% 77.7% 51.0% 47.2%
40 Rubber 5.71 2.53 11.01 -56% 335% 93% 16.4% 8.6% 21.6%
52 Cotton 0.44 8.85 4.78 1914% -46% 989% 1.3% 29.9% 9.4%
61 Articlesofapparelandclothing 0.05 0.07 3.66 34% 4936% 6628% 0.2% 0.2% 7.2% accessories-knittedandcrocheted
33 Essentialoils 0.00 0.06 1.86 - 2863% - 0.0% 0.2% 3.6%
63 Othermadeuptextilearticles 0.01 0.09 1.36 964% 1412% 15988% 0.0% 0.3% 2.7%
03 Fishandcrustaceans 0.93 1.28 1.17 38% -9% 26% 2.7% 4.3% 2.3%
01 Liveanimals 0.24 0.04 1.03 -84% 2469% 323% 0.7% 0.1% 2.0%
62 Articlesofapparelandclothing 0.08 0.68 0.81 712% 18% 859% 0.2% 2.3% 1.6% accessories-notknittedorcrocheted
60 Knittedorcrochetedfabrics 0.02 0.01 0.39 -32% 2804% 1882% 0.1% 0.0% 0.8%
Total top 10 export items 34.5 28.7 50.2 -17% 75% 45% 99.2% 97.1% 98.2%
Others 0.3 0.9 0.9 143% 85% 349% 0.8% 2.9% 1.8%
All products 34.8 29.6 51.1 142% 85% 347% 100% 100% 100%
Source: Global Trade Atlas 2007
Figure 6 shows the trend of China’s imports from Cambodia for products whose tariff rates were reduced (represented by solid lines in the graph) as well as those whose tariff rates did not change much (represented by dotted lines in the graph). China has reduced import tariffs for the majority of imports from Cambodia under its ACFTA commitment, including rubber (HS 40), wood products (HS 44), apparel and clothing (HS 61), live animals (HS 01), fish and crustacean (HS 03) and essential oils (HS 33). However, it has excluded footwear (HS 64) from tariff reduction.
The graph in Figure 6 shows a mixture of trends among exports: some products, like rubber, wood products and clothing apparel, experienced rapid increase in exports since the implementation of tariff reductions in 2005, while exports of other products increased relatively slowly. Rubber, wood and clothing apparel responded well to lower tariff rates implemented by China under ACFTA, as Cambodia has a comparative advantage and competitiveness in their production. However, other products, especially agricultural goods, have not fully benefited from preferential tariffs provided by China. The volume of exports of live animals and fish, for example, did not change much between the periods before and after 2005 in spite of differing tariff rates. Cassava is another example of an export commodity that failed to catch the market access opportunity. Instead of exporting directly to China, Cambodia exports cassava to Vietnam and Thailand, where it is processed for re-export to China.

Environmental Impacts of the ASEAN-China Free Trade Agreement on the Greater Mekong Sub-Region
trade knowledge network
��
The above analysis suggests that tariff reductions implemented by China under ACFTA have been important in enhancing some of Cambodia’s exports, especially exports in products for which Cambodia has a comparative advantage. Tariff reductions have not been enough, however, for agricultural goods whose exports require a Sanitary and Phytosanitary Standards (SPS) certificate. It is not easy for exporters in Cambodia to obtain the SPS certificate given severe lack of laboratory facilities and technical staff. In summary, ACFTA has contributed only partly to a growth in Cambodian exports to China.
Figure 6: Trend of China’s imports from Cambodia
Source: Global Trade Atlas and UN Comtrade
RCA analysis suggests that Cambodia has a strong comparative advantage in a narrow range of products, including live animals, textiles and apparel, wood, rubber and fish. These are currently among the top ten exports to China. Table A.11 in the appendix shows that except for wood, RCA indices of products in which Cambodia has a comparative advantage experienced upward and rapid growth over the last seven years. Furthermore, certain products such as apparel articles, footwear and essential oils, which were disadvantaged in the Chinese market in the past, are now becoming more competitive with very strong RCA indices. Given Cambodia’s level of development and resource endowment, including abundant land for agricultural production as well as cheaper labour costs, it is likely that Cambodia will remain specialized in more natural resource-based, agricultural and apparel products, and will likely export more of these products to China.
Imports of goods from China to Cambodia
Cambodia’s imports from China are concentrated in manufacturing and industrial products. The major imports, which represent about 80 per cent of total imports from China, include cotton and fabrics, machinery and mechanical appliances, electrical machinery, ceramic products and vehicles. Among these products, textiles and apparel (HS 50-63) have the greatest share of imports, with total value of $529 million in 2007 (or 60 per cent of total imports from China), a significant increase from $297.7 million in 2004 and $114.4 million in 2001.
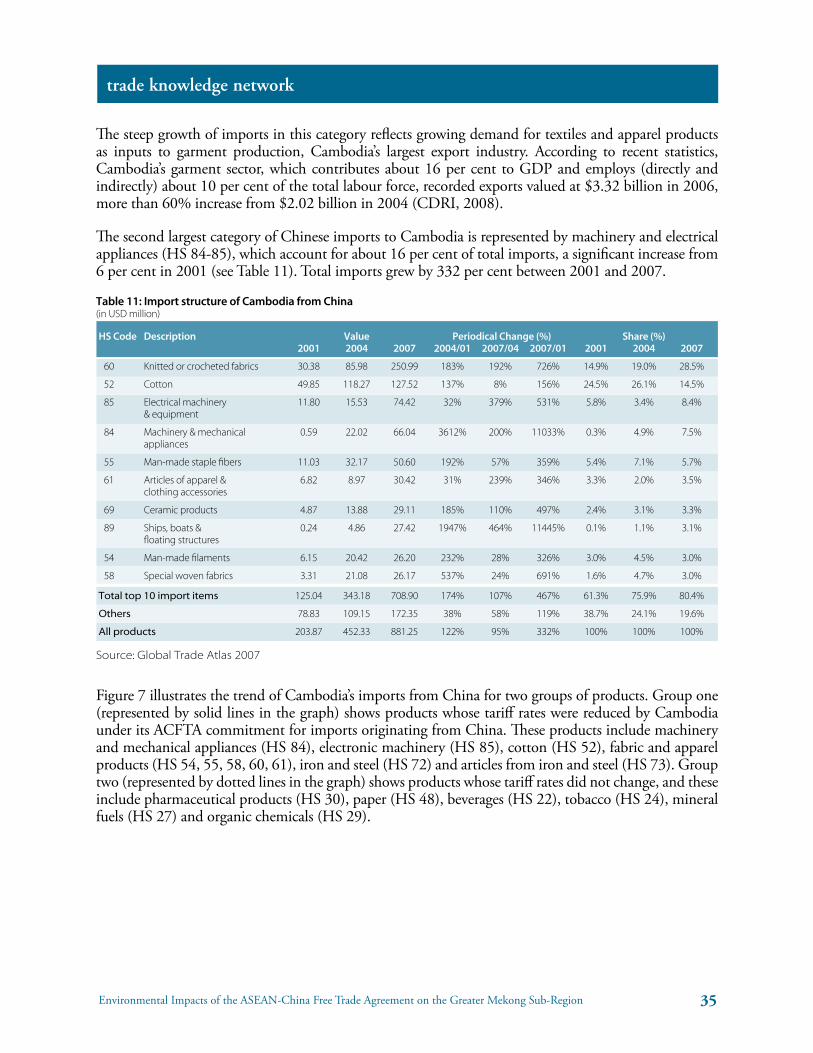
Environmental Impacts of the ASEAN-China Free Trade Agreement on the Greater Mekong Sub-Region
trade knowledge network
��
The steep growth of imports in this category reflects growing demand for textiles and apparel products as inputs to garment production, Cambodia’s largest export industry. According to recent statistics, Cambodia’s garment sector, which contributes about 16 per cent to GDP and employs (directly and indirectly) about 10 per cent of the total labour force, recorded exports valued at $3.32 billion in 2006, more than 60% increase from $2.02 billion in 2004 (CDRI, 2008).
The second largest category of Chinese imports to Cambodia is represented by machinery and electrical appliances (HS 84-85), which account for about 16 per cent of total imports, a significant increase from 6 per cent in 2001 (see Table 11). Total imports grew by 332 per cent between 2001 and 2007.
Table 11: Import structure of Cambodia from China(inUSDmillion)
HS Code Description Value Periodical Change (%) Share (%) 2001 2004 2007 2004/01 2007/04 2007/01 2001 2004 2007
60 Knittedorcrochetedfabrics 30.38 85.98 250.99 183% 192% 726% 14.9% 19.0% 28.5%
52 Cotton 49.85 118.27 127.52 137% 8% 156% 24.5% 26.1% 14.5%
85 Electricalmachinery 11.80 15.53 74.42 32% 379% 531% 5.8% 3.4% 8.4% &equipment
84 Machinery&mechanical 0.59 22.02 66.04 3612% 200% 11033% 0.3% 4.9% 7.5% appliances
55 Man-madestaplefibers 11.03 32.17 50.60 192% 57% 359% 5.4% 7.1% 5.7%
61 Articlesofapparel& 6.82 8.97 30.42 31% 239% 346% 3.3% 2.0% 3.5% clothingaccessories
69 Ceramicproducts 4.87 13.88 29.11 185% 110% 497% 2.4% 3.1% 3.3%
89 Ships,boats& 0.24 4.86 27.42 1947% 464% 11445% 0.1% 1.1% 3.1% floatingstructures
54 Man-madefilaments 6.15 20.42 26.20 232% 28% 326% 3.0% 4.5% 3.0%
58 Specialwovenfabrics 3.31 21.08 26.17 537% 24% 691% 1.6% 4.7% 3.0%
Total top 10 import items 125.04 343.18 708.90 174% 107% 467% 61.3% 75.9% 80.4%
Others 78.83 109.15 172.35 38% 58% 119% 38.7% 24.1% 19.6%
All products 203.87 452.33 881.25 122% 95% 332% 100% 100% 100%
Source: Global Trade Atlas 2007
Figure 7 illustrates the trend of Cambodia’s imports from China for two groups of products. Group one (represented by solid lines in the graph) shows products whose tariff rates were reduced by Cambodia under its ACFTA commitment for imports originating from China. These products include machinery and mechanical appliances (HS 84), electronic machinery (HS 85), cotton (HS 52), fabric and apparel products (HS 54, 55, 58, 60, 61), iron and steel (HS 72) and articles from iron and steel (HS 73). Group two (represented by dotted lines in the graph) shows products whose tariff rates did not change, and these include pharmaceutical products (HS 30), paper (HS 48), beverages (HS 22), tobacco (HS 24), mineral fuels (HS 27) and organic chemicals (HS 29).

Environmental Impacts of the ASEAN-China Free Trade Agreement on the Greater Mekong Sub-Region
trade knowledge network
��
Figure 7: Trend of Cambodia’s imports from China
Source: Global Trade Atlas and UN Comtrade
The graph in Figure 7 shows that the two product groups experienced similar import trends before the implementation of tariff reductions (2000-04), growing at a constant and similar pace. The trends began to diverge in 2005 and have continued to do so in the post-FTA period (2005-07). The group of products that has lower import tariff rates (group one) has witnessed robust growth in imports since 2005, while products whose tariffs did not change much have seen relatively slow increases in imports (and in some cases decreases). This preliminary trend analysis illustrates the importance of tariff levels on China’s exports to Cambodia. In this regard, ACFTA has considerably increased trade between Cambodia and China, especially in terms of Chinese exports to Cambodia.
RCA analysis suggests that China has a comparative advantage in a wide range of products with major specialization in manufacturing and industrial goods. Table A.13 in the appendix shows that China has very strong comparative advantage in machinery and electrical appliances, vehicles, textiles and apparels, base metals, footwear and ceramic products. The majority of these products have very high RCA indices (i.e. 409 for knits and fabrics and 115 for iron and steel) and the high RCA numbers reflect the great domination of Chinese products in the Cambodian market. One of the evident examples is textiles and apparels (mostly cotton, fabric, and apparel and clothing accessories), which Cambodia imports as inputs for garment production (in absence of domestic production). It is anticipated that trade between the two countries will continue to grow, partly due to their ongoing economic development policies and partly due to the greater opportunities arising from the trade agreements the two countries have concluded.
5.2. Impacts of trade on the environment in Cambodia
Table 12 shows a trade-environment matrix for Cambodia’s exports to China. It indicates that Cambodia exported about $1.9 million of the most pollut�ng sectors to China in 2007, a little less than 4 per cent of Cambodia’s total exports to China. Table 13, which presents estimated pollution gains from Chinese imports to Cambodia, shows that Cambodia imported about $84.5 million of the same sectors from China in 2007, about 10 per cent of total imports from China. Since Cambodia does not have

Environmental Impacts of the ASEAN-China Free Trade Agreement on the Greater Mekong Sub-Region
trade knowledge network
��
comparative advantage in products from the most polluting sectors, imports in this category create what would appear to be overall welfare gains for Cambodia. Not only was pollution intensity generated by the production of exports in the most polluting sectors fairly minimal (estimated at 23 thousand pounds in 2007), pollution intensity arising from growing imports in the most polluting sectors was generated elsewhere (in China). Pollution intensity generated by Chinese imports from the most polluting sectors was estimated at 681 thousand pounds in 2007, a substantial “gain” from trade for the Cambodian environment. While this trade structure results in overall benefits to Cambodia’s environment, it comes at the cost of environmental degradation in China.
Table 12: Trade-environment matrix for Cambodia's exports to China
HS Code Description Value (in USD billion) Share (%) EPI* (in pounds) 2001 2004 2007 2001 2004 2007 2001 2004 2007
28-38 Chemicals 0 0.07 1.86 0.0% 0.2% 3.6% 0 855 23255
39-43 Plastic,hidesandleather 0.03 0.01 0.02 0.1% 0% 0% 71 27 52
47-49 Pulpandpaper 0 0.01 0.02 0% 0% 0% 2 45 62
71-83 Basemetal 0 0 0 0% 0% 0% 0 8 13
Most polluting sectors 0.03 0.09 1.90 0.1% 0.3% 3.7% 73 936 23382
50-63 Textilesandapparel 0.61 10 11.23 1.8% 33.8% 22.0% 429 6978 7841
40 Rubber 5.71 2.53 11.01 16.4% 8.6% 21.6% 6713 2978 12958
93-96 Miscellaneous 0 0.04 0.14 0% 0.1% 0.3% 0 26 84 manufacturedarticles
25-27 Mineralproducts 0 0 0.01 0.0% 0.0% 0.0% 0 0 9
84-85 Machinery& 0.08 0.05 0.01 0.2% 0.2% 0% 38 26 4 electricalappliances
86-89 Vehicles 0 0 0 0% 0% 0% 0 0 1
Moderately polluting sectors 6.40 12.62 22.41 18.4% 42.7% 43.9% 7181 10009 20897
44-46 Woodandwoodarticles 27.03 15.07 24.09 77.7% 51.0% 47.2% 10595 5907 9442
1-5 Liveanimals 1.17 1.32 2.20 3.4% 4.5% 4.3% 21 23 38
64-67 Footwear 0 0.03 0.30 0% 0.1% 0.6% 0 12 146
15-24 Preparedfoodstuffs 0 0.06 0.12 0% 0.2% 0.2% 0 14 29
6-14 Vegetableproducts 0.17 0.36 0.06 0.5% 1.2% 0.1% 3 6 1
68-70 Stone/cement/ceramics 0.01 0.01 0 0% 0% 0% 4 3 1
90-92 Optical,precision& 0 0 0 0% 0% 0% 0 0 0 musicalinstruments
97-99 Antiquesandworksofart 0 0 0 0% 0% 0% 0 0 0
Least polluting sectors 28.38 16.84 26.77 81.5% 57.0% 52.4% 10623 5965 9657
Total All products 34.80 29.56 51.08 100% 100% 100% 17877 16910 53936
*EstimatedPollutionIntensity
Source: Authors’ calculation based on trade data from Global Trade Atlas
For the moderately pollut�ng sectors, the total amount of Cambodia’s exports to China was $22.41 million in 2007 (or 44 per cent of total exports), while imports in this category represented the largest share of Cambodia’s imports from China (83 per cent). Because the production of goods in these sectors generates considerably less pollution than the most polluting sectors, the pollution impacts of these exports were less significant, as reflected by the EPI level of 21 thousand pounds. However, the amount of pollution generated by these exports was about two times greater in 2007 than in 2004. This is mainly due to the dramatic increase in the export of rubber with some processing content. Providing that Cambodia

Environmental Impacts of the ASEAN-China Free Trade Agreement on the Greater Mekong Sub-Region
trade knowledge network
��
is likely to expand its exports to China in this sector due to its specialization, and in response to greater demands and trade opportunities arising from tariff reductions, pollution intensity is likely to increase accordingly.
Table 13: Estimated pollution gain to Cambodia from Chinese imports
Description Value (in USD million) Share (%) EPI (in thousand pound) 2001 2004 2007 2001 2004 2007 2001 2004 2007
Mostpollutingsectors 29.50 48.35 84.50 14% 11% 10% 260 389 681
Moderatelypollutingsectors 147.01 353.98 732.05 72% 78% 83% 102 241 488
Leastpollutingsectors 27.35 50.01 64.69 13% 11% 7% 10 15 22
Allproducts 203.87 452.33 881.25 100% 100% 100% 372 645 1190
Source: Authors’ calculation based on trade data from Global Trade Atlas
Finally, the trade-environment matrix also shows that Cambodia generated about half of its total exports to China from the least pollut�ng sectors, with an estimated EPI of just under 10 thousand pounds. Certain products in these sectors are those in which Cambodia has a comparative advantage and so the volume of exports in this category is expected to rise (while export patterns are not likely to change much). In spite of the expected rise, the future impact of these trade sectors on pollution levels is likely to be minimal.
The above analysis shows that products in the least polluting sectors, such as wood and wood products, generate relatively little pollution intensity. This may lead to the conclusion that export of wood and wood products has a negligible impact on the environment. However, when one examines more deeply the multiple impacts of timber trade, the assessment shows different results. Several studies have shown that large-scale trade in wood and wood products is one of the leading causes of deforestation in Cambodia. Cambodia’s forests are disappearing at a rapid rate (one of the highest in the world), with forest cover having fallen from 73 per cent (of total landmass) in 1965 to about half in recent years.
There are multiple negative effects of such significant deforestation. The most obvious and concerning ones are the negative impacts on biodiversity, water retention and erosion. The loss of forests results in the loss of natural habitats for many species of animals and plants, including non-timber forest resources. Also, because deforestation occurs mostly in the upland areas of the country, it reduces the ground’s water retention capacity, making the lowlands more prone to flooding and sloped areas more prone to landslides. Deforestation in Cambodia is also likely to contribute to climate change along with the rapid decline in forests around the world.
Given stronger demand for rubber products as intermediate inputs for the production of various goods such as tyres and cables, China is likely to increase its imports in these goods from its neighbouring countries. This opportunity creates incentives for rubber exporters in Cambodia to increase rubber production, especially by way of expanding cultivation areas. While export-oriented rubber expansion is good for the economy, it raises several concerns for the environment. The areas best suited for rubber production are the northeastern provinces of Kompong Cham, Kratie, Mondolkiri, and Ratanakiri, and these provinces are still heavily forested. Expansion in rubber production could result in further deforestation, with multiple negative consequences for Cambodia’s environment.
China has been a major market for Cambodia’s fish, and this market has a high potential for expansion. Such export opportunity could lead to an increase in the scale of fishing activities. Unfortunately, there is a growing trend of using inappropriate and in some cases illegal fishing methods on both the small and
Environmental Impacts of the ASEAN-China Free Trade Agreement on the Greater Mekong Sub-Region
trade knowledge network
��
the large scale. These practices have undermined the sustainability of fish stocks, which in turn can have adverse effects on fish species (biodiversity) and local livelihoods, especially for people who are directly dependent on fishing (estimated at around 40 per cent of the country’s population).
The Cambodian government has recognized these challenges by developing the National Environmental Action Plan (NEAP) to manage, conserve and protect Cambodia’s environment and natural resources in an ecologically sustainable manner. In an attempt to address the key environmental challenges, the NEAP focuses on six priority themes: 1) forest policy, 2) fisheries and floodplain agriculture in the Tonle Sap region, 3) coastal fisheries management, 4) biodiversity and protected areas, 5) energy development and the environment and 6) urban waste management. The implementation of the NEAP is constrained, however, by factors such as shortages of skilled staff, insufficient budget allocations, overlaps in functional areas among responsible agencies and poor physical facilities.
In summary, greater demands for natural resource products could lead to overexploitation and other unsustainable practises in resource extraction in Cambodia. Although the Cambodian government has developed the National Environmental Action Plan to address these issues, it is constrained by a lack of clear guidelines and transparent management systems to regulate trade-oriented natural resource extraction. If these constraints are not addressed, then the projected increase in trade in natural resource-based products is likely to cause significant resource depletion in the near term, further jeopardising Cambodia’s natural environment.

Environmental Impacts of the ASEAN-China Free Trade Agreement on the Greater Mekong Sub-Region
trade knowledge network
�0
6 Conclusion and Policy Discussion
This study has explored the general relationship between FTAs, trade and the environment through a case study of the ASEAN-China FTA, examining the impact of the ACFTA from the perspective of the GMS5 countries as well as that of Cambodia. The study looked at the evolution of China-GMS5 trade under the ACFTA, focusing specifically on trade in goods, and tried to assess GMS-wide environmental impacts resulting from this trade. The examination of linkages between trade and the environment was carried out quantitatively by looking at pollution intensity as a proxy measure of environmental degradation. In addition, a qualitative assessment of other trade impacts on the environment was explored in relation to trade between Cambodia and China.
The GMS has witnessed rapid expansion of intra-regional trade in recent years and ACFTA has been the major factor contributing to this trend. For example, tariff reduction under the Early Harvest Program (EHP) contained in the ACFTA contributed significantly to a rapid increase in agricultural trade between ASEAN and China. By 2006, the value of EHP products traded between ASEAN and China reached $2.62 billion, 100 per cent higher than in 2003. Also, an analysis of flows in trade in goods between GMS5 countries and China found that ACFTA tariff reductions resulted in a rapid increase in imports of GMS5 country products into China and Chinese products into GMS5 countries. For the specific trade relationship between China and Cambodia, ACFTA tariff reductions resulted in a significant increase of Chinese exports to Cambodia, which dominate the China-Cambodia trade relationship. On the Cambodian side, ACFTA was important in enhancing Cambodian exports in products for which Cambodia has a comparative advantage, but not in exports of agricultural goods that require Sanitary and Phytosanitary Standards (SPS) certificates (as Cambodia’s exporters lack the laboratory facilities and technical staff to secure SPS certificates).
Trade in goods between GMS5 countries and China is highly concentrated in machinery and electrical appliances, base metals, mineral products, chemicals, textiles and apparels, rubber and vegetable products. About two thirds of the total trade in goods is in products that fall into the least polluting sectors, while a third of the total trade is in goods that fall into the most polluting sectors. Pollution intensity generated by the latter sectors is large, and the growth path in these sectors is likely to generate even greater levels of pollution in the near term. Within the GMS, China is the major producer of goods in the most polluting sectors, which means that much of the GMS-wide pollution intensity originates in China.
Within the GMS trade structure, there is considerable trade in natural resources such as minerals, agricultural goods and wood, and in products derived from these resources. Trade in natural resource-based products raises concerns over resource depletion. In countries without effective regulatory regimes, trade-driven natural resource exploitation can lead to illegal logging and inappropriate forest cutting, resulting in significant losses of forest resources. Deforestation causes further local and global environment problems.
Natural resource depletion is of particular concern to Cambodia, which exports many natural resource-based products such as wood, fish and rubber. There are multiple environmental concerns that arise from an increase in trade in these commodities. For example, deforestation (caused by wood extraction and agro-industry expansion) reduces biodiversity, increases soil erosion and changes the shape of rivers, especially the Mekong River, the Tonle Sap River and the Tonle Sap Lake. Overfishing has adverse effects on fish stocks, with negative impacts on local livelihoods, especially the livelihoods of people who are directly dependent on fishing.
Environmental Impacts of the ASEAN-China Free Trade Agreement on the Greater Mekong Sub-Region
trade knowledge network
��
Although the Royal Government of Cambodia has developed a national plan to manage, conserve and protect Cambodia’s natural resource base, the implementation of this plan is constrained by shortages of skilled staff, insufficient budget allocations, overlaps in functional areas among responsible agencies and poor physical facilities.
The ASEAN-China FTA does not contain provisions for cooperation on environmental problems that may arise from trade liberalization. Outside the FTA, environmental concerns have been raised in GMS Summits, but there are no policy instruments to govern the implementation of environmental protection and conservation initiatives, nor is there sufficient cooperation among GMS countries to tackle these issues. This suggests significant shortcomings in regional economic policy making.
It is true that inclusion of environmental concerns in the GMS trade agenda would not be easy given the current low level of development across the region, which requires sustained high rates of economic growth. But economic growth at the expense of environmental degradation will not lead to sustained social and economic progress. Finding the balance between economic growth and environmental sustainability is a priority issue (and challenge) for achieving sustainable development in the GMS. In this regard, it is important that countries in the GMS strengthen cooperation mechanisms (policies and institutions) to effectively respond to emerging environmental issues.
It is important to reiterate that the primary objective of this study was to illustrate the linkages between FTAs, trade and the environment in the GMS by focusing on pollution intensity as a proxy measure for the impact of trade on the environment. The ASEAN-China FTA is still very new and is being phased in slowly, so any impact assessment is only preliminary and indicative.
The analysis employed in this study has several limitations that welcome further research. First, the causation effects of ACFTA on trade have not been fully covered due to data limitations, in great part due to the short period that has elapsed since the signing of the ACFTA. Additional research looking into ACFTA-induced trade flows would add great value to this study. Second, the study does not fully examine the consequences of trade in natural resource-based products on resource sustainability. There is need for further research on environmental and social impacts of resource use. Third, because trade in forest products and fish resources has been growing significantly in the GMS, research on trade in these products, and the implications on the environment in the GMS, would complement the results of this study.
In conclusion, this study argues that trade, which is widely recognized as an engine of economic growth, could be a source of significant environmental problems, especially in countries without the necessary regulatory frameworks or management systems to ensure sustainable exploitation of natural resources. This study therefore recommends that environmental issues be considered and included in trade negotiations and agreements in order to mitigate any negative consequences of trade to the environment. Only then will trade boost economic growth and contribute to sustainable development.
Environmental Impacts of the ASEAN-China Free Trade Agreement on the Greater Mekong Sub-Region
trade knowledge network
��
References
Adelman, I. and Robinson, S. (1988), “Macroeconomic adjustment and income distribution: Alternative models applied to two economies.” Journal of Development Economics, Vol. 29.
Agras, J. and Chapman, D. (1999), “A dynamic approach to the Environmental Kuznets Curve hypothesis.” Ecological Economics 28: 267-27.
Albrecht, J. (1998), “Environmental policy and inward investment position of US dirty industries.” Intereconomics, July/August 1998: 186-194.
Alpay, S. (no date), “How can trade liberalization be conducive to a better environment? A survey of the literature.” Department of International Trade (Istanbul: Beykent University)
Amjad, R., Colclough, D., Garcia, N., Hopkins, N., Infante, R. and Rodgers, G. (1990), Quantitative Techniques in Employment Planning. (Geneva: ILO).
Antweiler, W., Copeland, B.R. and Taylor, M.S. (1998), “Is free trade good for the environment.” NBER Working Paper Series, No. 6707.
Beghin, J., Roland-Holst, D. and Mensbrugghe, V.D.D. (1994), “Survey of the trade and environment nexus: Global dimensions.” OECD Economic Studies No. 23 (Paris: Organization for Economic Cooperation and Development)
Beghin, J. and Potier, M. (1997a), “Effects of trade liberalization on the environment in the manufacturing sector.” World Economy 20 (4): 435–456.
Beghin, J., Dessus, S., Roland-Holst, D. and van-der-Mensbrugghe, D. (1997b), “The trade and environment nexus in Mexican agriculture.” Agricultural Economics 17 (2-3): 115-131.
Birdsall, N. and Wheeler, D. (1992), “Trade policy and industrial pollution in Latin America: Where are the pollution havens?” In Low, P. (ed.), International Trade and the Environment (Washington, DC: World Bank)
Berman, E. and Bui, L. (1998), “Environmental regulations and productivity: Evidence from oil refineries.” NBER Working Paper Series, No. 6776.
Bernardino, N. Y. (2004), “The ASEAN-China Free Trade Area: Issues and Prospects.” Regional Workshop Paper No. 6 (Manila: Asia-Pacific Network for Food Sovereignty)
Brunnermeier, Smita and Arik Levinson (2004), “Examining the evidence on environmental regulations and industry location,” Journal of Environment and Development, Vol. 13 (1): 6-41.
CDRI (2008), Annual Development Review 2007-08.
Chichilnisky, G. (1994), “Global environment and North South trade,” American Economic Review 84: 851-874.

Environmental Impacts of the ASEAN-China Free Trade Agreement on the Greater Mekong Sub-Region
trade knowledge network
��
Cohen, M. and Fenn, S. (1997), “Environmental and financial performance: Are they related?” Mimeograph, Department of Economics (Nashville: Vanderbilt University)
Cohen, S.I., (1987), “Input-output versus social accounting in the macro-analysis of development policy.” Industry and Development, Part 22.
Cole, M.A., Rayner, A.J. and Bates, J.M. (1998), “Trade liberalization and the environment: the case of the Uruguay Round.” World Economy 21 (3): 337-347.
Copeland, B.R. and Taylor, M.S. (1994), “North-South trade and the environment,” Quarterly Journal of Economics 109: 755-787.
Cropper, M. and Griffiths, C. (1994), “The interaction of population growth and environmental quality.” American Economic Review, Vol. 84 (2): 250-54.
Dean, Judith M. (1992), “Trade and the environment: A survey of the literature.” Background paper for “World Development Report 1992” (Washington, D.C: World Bank)
Duerksen, C. and Leonard, H.J. (1980), “Environmental regulations and the location of industries: an international perspective.” Columbia Journal of World Business, Summer 1980.
Eskeland, G. and Harrison, A. (1997), “Moving to greener pasture? Multinationals and the pollution-haven hypothesis.” Policy Research Working Paper, No. 1744. (Washington, D.C: World Bank)
Frankel, J. and A.K. Rose (2003), “Is trade good or bad for the environment? Sorting out the causality.” John F. Kennedy School of Government, Faculty Research Working Paper Series, RWP03-038.
Ferroni, M. and Grootaert, C. (1993), “Policy reform: concepts, data, analysis.” In Demery, L. et. al. (eds.), Understanding the Social Effects of Policy Reform. (Washington, D.C: World Bank).
Gray, W. (1997). “Manufacturing plant location: Does state pollution regulation matter?” NBER Working Paper, No. 5880.
Grossman, G.M. and Krueger, A.B. (1991), “Environmental impacts of a North American Free Trade Agreement.” NBER Working Paper, No. 3914, November 1991.
Grossman, G.M. and Krueger, A.B. (1993), “Environmental impacts of a North American Free Trade Agreement.” In P. Garder (ed.), The U.S.-Mexico Free Trade Agreement. (Cambridge, Massachusetts, USA: MIT Press)
Grossman, G.M. and Krueger, A.B. (1995), “Economic growth and the environment.” Quarterly Journal of Economics, Vol. 110 (2): 353-77.
Hayden, C. and Round, J. (1982), “Developments in social accounting methods as applied to the analysis of income distribution and employment issues.” World Development, Vol. 10.
Henderson, V. (1996), “Effects of air quality regulation.” American Economic Review, Vol. 86 (4).
Environmental Impacts of the ASEAN-China Free Trade Agreement on the Greater Mekong Sub-Region
trade knowledge network
��
Hettige, H., Martin, P., Singh, M. and Wheeler, D. (1994), “The industrial pollution projection system.” Environment, Infrastructure and Agriculture Division (PRDEI) of the Policy Research Department (Washington, D.C: World Bank)
Hirschman, A.O., (1958), The Strategy of economic development. Yale University Press, New Haven, Connecticut, USA.
IISD (2007), Trade and environment: A resource book. (Geneva: International Institute for Sustainable Development)
Jayadevappa, R. and Chhatre, S. (2000), “International trade and environmental quality: A survey.” Ecological Economics 32: 175–194.
Kahn, M. (1997), “The silver lining of rust belt manufacturing decline: Killing off pollution externalities.” Mimeograph (New York: Columbia University).
Kaufmann, R.K., Davidsdottir, B., Garnham, S. and Pauly, P. (1997), “The Determinants of atmospheric SO2 concentration: Reconsidering the Environmental Kuznets Curve.” Ecological Economics (Special Issue on the Environmental Kuznets Curve).
Khan, H. and Thorbecke, E. (1989), “Macroeconomic effects of technology choice: Multiplier and structural path analysis within a SAM framework.” Journal of Policy Modelling, Vol. 11.
Lee, H. and Roland-Holst, D. (1997), “The environment and welfare implications of trade and tax policy.” Journal of Development Economics 52: 65-82.
Lim, T. S. and Lai, H. (2007) Harmony and Development: ASEAN-China Relations (Singapore: World Scientific Publishing Company)
Lopez, R. (1997), “Environmental externalities in traditional agriculture and the impact of trade liberalization: The case of Ghana.” Journal of Development Economics 53: 17-39.
Low, P. and Yeats, A. (1992), “Do dirty industries migrate?” In P. Low (ed.) “International Trade and the Environment.” World Bank Discussion Paper 159, (Washington, D.C: World Bank)
Lucas, R., Wheeler, D. and Hettige, H. (1992), “Economic development, environmental regulations and the international migration of toxic industrial pollution: 1960-1988.” Background paper for World Development Report 1992 (Washington, D.C: World Bank)
Mani, M. and Wheeler, D. (1997), In search of pollution haven? Dirty industry in the world economy, 1960-1995.
McGuire, M. (1982), “Regulation, factor rewards and international trade.” Journal of Public Economics 17.
Muqtada, M. and Hildeman, A. (eds.) (1993), “Labour markets and human resource planning in Asia: Perspectives and evidence.” (Geneva: ILO)

Environmental Impacts of the ASEAN-China Free Trade Agreement on the Greater Mekong Sub-Region
trade knowledge network
��
OECD (1993), “Environmental policies and industrial competitiveness.” (Paris: Organization for Economic Cooperation and Development)
OECD (1997) “Foreign direct investment and the environment: An overview of the literature.” (Paris: Organization for Economic Cooperation and Development)
Palm, F. C. and Smit, H.D. (1991), Economic modelling and policy analysis.
Panayotou, T. (1993), “Empirical tests and policy analysis of environmental degradation at different stages of economic development.” Working Paper 238 (Geneva: International Labour Organization)
Panayotou, T. (1995), “Environmental degradation at different stages of economic development.” In Ahmed I. and J.A. Doeleman (eds.) Beyond Rio: The environmental crises and sustainable livelihoods in the Third World. Macmillan Press, London, UK.
Pethig, R. (1976), “Pollution, welfare and environmental policy in the theory of comparative advantage.” Journal of Environmental Economics and Management, Vol. 2.
Porter, Michael and Claas von der Linde (1995), “Green and competitive: Ending the stalemate.” Harvard Business Review, September/October 1995: 120-134.
Pyatt, G. and Round, J. I., (eds.) (1985), Social accounting matrices: A basis for planning. World Bank Symposium (Washington, D.C.: World Bank)
Quizon, J. and Binswanger, H. (1986), “Modelling the impact of agricultural growth and government policy on income distribution in India.” World Bank Economic Review, Vol.1.
Repetto, R. (1995), Jobs, competitiveness and environmental regulation: What are the real issues? (Washington D.C.: World Resources Institute)
Round, J. (1984), “Income distribution within a social accounting matrix: A review of some experience in Malaysia and other LDCs.” In Nissen, H. P. (ed.) Towards income distribution policies. Department of Economics, EADI - Book Series, No. 3. (Tilburg: University of Paderborn)
Sadoulet, E. and de Janvry, A. (1995), Quantitative development policy analysis, Johns Hopkins University Press, London.
Scobie, G. M. (1989), “Macroeconomic adjustment and the poor: Toward a research policy.” Cornell Food and Nutrition Programme, Monograph 1. (Ithaca, USA: Cornell University)
Selden, T. M. and Song, D. (1995), “Neoclassical growth, the J Curve for abatement, and the inverted U Curve for pollution.” Journal of Environmental Economics and Management, Vol. 29: 162-68.
Shafik, N. and Bandyopadhyay, S. (1992), “Economic growth and environmental quality: Time series and cross-section evidence.” Policy Research Working Paper No. WPS904 (Washington, D.C: World Bank)

Environmental Impacts of the ASEAN-China Free Trade Agreement on the Greater Mekong Sub-Region
trade knowledge network
��
Siebert, H. (1977), “Environmental quality and the gains from trade.” Kyklos, Vol. 30: 657-73.
Thirlwall, A.P. (1990), Growth and development: with special reference to developing economies. 4th edition, Macmillan, London.
Tobey, J. (1990), “The impact of domestic environmental policies on patterns of world trade: An empirical test.” Kyklos, Vol. 43: 191-209.
Tsai, P.L. (1999), “Is trade liberalization harmful to the environment? An alternative view.” Journal of Economic Studies, 26 (3): 201-108.
Walter, I. (1973), “The pollution content of American trade.” Western Economic Journal, 11: 61-70.
Walter, I. (1982), “Environmentally induced industrial relocation to developing countries.” In S. Rubin (ed.) Environment and Trade. Allanheld, Osmun, and Co., New Jersey.
WTO (1999), Trade and Environment. Special studies 4 (Geneva: World Trade Organization)
Xing, Y. and Kolstad, C. (1998), “Do lax environmental regulations attract foreign investment?” Mimeograph. (Santa Barbara, CA: University of California).
Xing, Y. and Kolstad, C. (2002). “Do lax environmental regulations attract foreign investment?” Environmental and Resource Economics, 21(1): 1-2.
Yandle, B., Vijayaraghavan, M. and Bhattarai, M. (2002), “The environmental Kuznets Curve: A primer.” PERC Research Study 02-1.
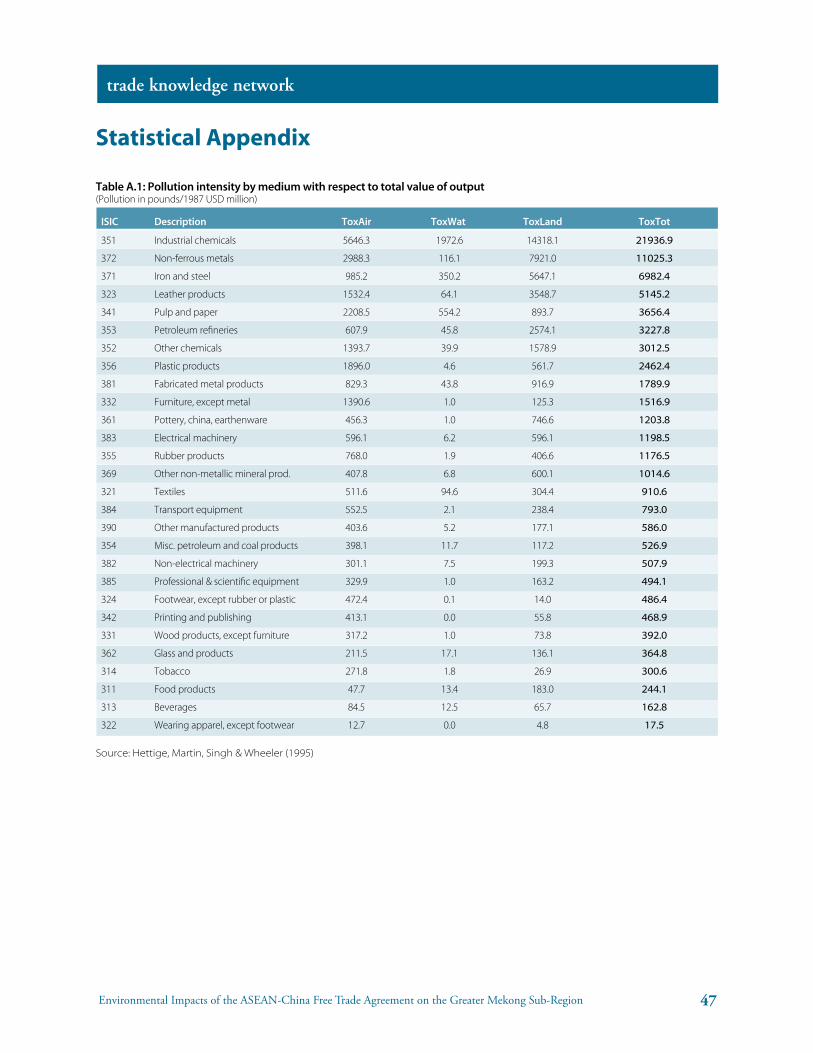
Environmental Impacts of the ASEAN-China Free Trade Agreement on the Greater Mekong Sub-Region
trade knowledge network
��
Statistical Appendix
Table A.1: Pollution intensity by medium with respect to total value of output(Pollutioninpounds/1987USDmillion)
ISIC Description ToxAir ToxWat ToxLand ToxTot
351 Industrialchemicals 5646.3 1972.6 14318.1 21936.9
372 Non-ferrousmetals 2988.3 116.1 7921.0 11025.3
371 Ironandsteel 985.2 350.2 5647.1 6982.4
323 Leatherproducts 1532.4 64.1 3548.7 5145.2
341 Pulpandpaper 2208.5 554.2 893.7 3656.4
353 Petroleumrefineries 607.9 45.8 2574.1 3227.8
352 Otherchemicals 1393.7 39.9 1578.9 3012.5
356 Plasticproducts 1896.0 4.6 561.7 2462.4
381 Fabricatedmetalproducts 829.3 43.8 916.9 1789.9
332 Furniture,exceptmetal 1390.6 1.0 125.3 1516.9
361 Pottery,china,earthenware 456.3 1.0 746.6 1203.8
383 Electricalmachinery 596.1 6.2 596.1 1198.5
355 Rubberproducts 768.0 1.9 406.6 1176.5
369 Othernon-metallicmineralprod. 407.8 6.8 600.1 1014.6
321 Textiles 511.6 94.6 304.4 910.6
384 Transportequipment 552.5 2.1 238.4 793.0
390 Othermanufacturedproducts 403.6 5.2 177.1 586.0
354 Misc.petroleumandcoalproducts 398.1 11.7 117.2 526.9
382 Non-electricalmachinery 301.1 7.5 199.3 507.9
385 Professional&scientificequipment 329.9 1.0 163.2 494.1
324 Footwear,exceptrubberorplastic 472.4 0.1 14.0 486.4
342 Printingandpublishing 413.1 0.0 55.8 468.9
331 Woodproducts,exceptfurniture 317.2 1.0 73.8 392.0
362 Glassandproducts 211.5 17.1 136.1 364.8
314 Tobacco 271.8 1.8 26.9 300.6
311 Foodproducts 47.7 13.4 183.0 244.1
313 Beverages 84.5 12.5 65.7 162.8
322 Wearingapparel,exceptfootwear 12.7 0.0 4.8 17.5
Source: Hettige, Martin, Singh & Wheeler (1995)

Environmental Impacts of the ASEAN-China Free Trade Agreement on the Greater Mekong Sub-Region
trade knowledge network
��
Table A.2: Thailand trade with China
Imports
Chapter Description Value (in USD m.) Share 2001 2004 2007 2001 2004 2007
HS-84 Machinery,reactors,boilers 631.20 1,289.71 2,723.07 25.2% 22.2% 22.7%
HS-85 Electricalmachinery,etc. 579.84 1,258.55 2,539.32 23.2% 21.7% 21.2%
HS-72 Ironandsteel 66.16 675.60 1,126.36 2.6% 11.6% 9.4%
HS-29 Organicchemicals 86.29 141.60 371.36 3.4% 2.4% 3.1%
HS-28 Inorganicchemicals 97.84 196.98 322.63 3.9% 3.4% 2.7%
HS-90 Optical,medicalinstruments 33.83 132.76 317.80 1.4% 2.3% 2.7%
HS-73 Ironandsteelproducts 26.44 87.31 276.23 1.1% 1.5% 2.3%
HS-39 Plastic 28.07 97.97 255.00 1.1% 1.7% 2.1%
HS-38 Misc.chemicalproducts 57.08 145.76 247.07 2.3% 2.5% 2.1%
HS-87 Vehicles,notrailway 19.12 64.91 231.03 0.8% 1.1% 1.9%
Total top 10 import items 1,625.85 4,091.16 8,409.86 65.0% 70.5% 70.2%
Others 876.64 1,709.21 3,568.75 35.0% 29.5% 29.8%
All products 2,502.49 5,800.37 11,978.61 100.0% 100.0% 100.0%
Exports
Chapter Description Value (in USD m.) Share 2001 2004 2007 2001 2004 2007
HS-84 Machinery,reactors,boilers 903.88 2,916.04 7,075.34 19.2% 25.3% 31.2%
HS-85 Electricalmachinery,etc. 965.71 2,796.59 5,582.89 20.5% 24.2% 24.6%
HS-40 Rubber 405.27 956.10 1,975.42 8.6% 8.3% 8.7%
HS-39 Plastic 664.57 1,215.45 1,620.26 14.1% 10.5% 7.2%
HS-29 Organicchemicals 85.11 334.92 1,356.28 1.8% 2.9% 6.0%
HS-27 Mineralfuel,oil 334.10 696.37 1,316.27 7.1% 6.0% 5.8%
HS-07 Vegetables 125.54 273.71 456.61 2.7% 2.4% 2.0%
HS-90 Optical,medicalinstruments 72.32 183.99 345.12 1.5% 1.6% 1.5%
HS-44 Wood 117.02 267.45 274.34 2.5% 2.3% 1.2%
HS-08 Ediblefruitsandnuts 72.75 181.72 251.34 1.5% 1.6% 1.1%
Total top 10 export items 3,746.28 9,822.35 20,253.85 79.5% 85.1% 89.4%
Others 966.51 1,715.25 2,398.60 20.5% 14.9% 10.6%
All products 4,712.79 11,537.60 22,652.45 100.0% 100.0% 100.0%
Source: Global Trade Atlas 2007

Environmental Impacts of the ASEAN-China Free Trade Agreement on the Greater Mekong Sub-Region
trade knowledge network
��
Table A.3: Vietnam trade with China
Imports
Chapter Description Value (in USD m.) Share 2001 2004 2007 2001 2004 2007
HS-72 Ironandsteel 118.47 460.39 2,308.75 6.6% 10.8% 19.4%
HS-84 Machinery,reactors,boilers 260.58 537.64 1,687.48 14.4% 12.6% 14.2%
HS-85 Electricalmachinery,etc. 54.47 228.43 1,345.03 3.0% 5.4% 11.3%
HS-27 Mineralfuel,oil 245.34 641.63 793.37 13.6% 15.1% 6.7%
HS-87 Vehicles,notrailway 479.38 160.31 638.20 26.6% 3.8% 5.4%
HS-31 Fertilizers 82.66 411.55 393.87 4.6% 9.7% 3.3%
HS-52 Cottonandyarn,fabric 22.46 146.92 371.43 1.2% 3.4% 3.1%
HS-73 Ironandsteelproducts 33.75 87.01 347.79 1.9% 2.0% 2.9%
HS-60 Knit,crochetedfabrics 7.04 100.65 342.84 0.4% 2.4% 2.9%
HS-55 Manmadestaplefibers 23.32 81.65 304.03 1.3% 1.9% 2.6%
Total top 10 import items 1,327.46 2,856.17 8,532.78 73.5% 67.0% 71.7%
Others 477.42 1,403.90 3,372.85 26.5% 33.0% 28.3%
All products 1,804.88 4,260.06 11,905.63 100.0% 100.0% 100.0%
Exports
Chapter Description Value (in USD m.) Share 2001 2004 2007 2001 2004 2007
HS-27 Mineralfuel,oil 737.82 1,728.29 1,189.24 73.1% 69.7% 37.0%
HS-40 Rubber 53.18 180.64 272.53 5.3% 7.3% 8.5%
HS-44 Wood 6.04 22.46 241.71 0.6% 0.9% 7.5%
HS-26 Ores,slag,ash 17.22 109.37 236.01 1.7% 4.4% 7.3%
HS-85 Electricalmachinery,etc. 11.30 66.33 225.64 1.1% 2.7% 7.0%
HS-07 Vegetables 13.39 50.04 180.13 1.3% 2.0% 5.6%
HS-84 Machinery,reactors,boilers 9.31 48.48 176.33 0.9% 2.0% 5.5%
HS-08 Ediblefruitsandnuts 48.93 32.03 112.13 4.8% 1.3% 3.5%
HS-64 Footwear 4.56 29.84 92.72 0.5% 1.2% 2.9%
HS-11 Milling,malt,starch 9.97 43.69 67.36 1.0% 1.8% 2.1%
Total top 10 export items 911.73 2,311.17 2,793.80 90.3% 93.3% 86.9%
Others 98.17 167.16 420.62 9.7% 6.7% 13.1%
All products 1,009.89 2,478.32 3,214.42 100.0% 100.0% 100.0%
Source: Global Trade Atlas 2007

Environmental Impacts of the ASEAN-China Free Trade Agreement on the Greater Mekong Sub-Region
trade knowledge network
�0
Table A.4: Lao PDR trade with China
Imports
Chapter Description Value (in USD m.) Share 2001 2004 2007 2001 2004 2007
HS-84 Machinery,reactors,boilers 6.64 15.04 40.92 12.2% 15.0% 23.1%
HS-87 Vehicles,notrailway 6.96 10.53 32.22 12.8% 10.5% 18.2%
HS-85 Electricalmachinery,etc. 22.40 34.97 24.08 41.2% 34.8% 13.6%
HS-90 Optical,medicalinstruments 0.69 0.38 15.62 1.3% 0.4% 8.8%
HS-88 Aircraft,spacecraft 0.03 0.04 14.54 0.1% 0.0% 8.2%
HS-98 Specialclassification,NESOI 0.00 13.72 13.82 0.0% 13.6% 7.8%
HS-72 Ironandsteel 0.22 1.18 6.78 0.4% 1.2% 3.8%
HS-73 Ironandsteelproducts 0.74 4.56 4.01 1.4% 4.5% 2.3%
HS-76 Aluminumandarticlesthereof 0.12 0.98 3.41 0.2% 1.0% 1.9%
HS-31 Fertilizers 0.13 0.30 1.72 0.2% 0.3% 1.0%
Total top 10 import items 37.93 81.72 157.13 69.7% 81.3% 88.6%
Others 16.48 18.85 20.28 30.3% 18.7% 11.4%
All products 54.41 100.57 177.41 100.0% 100.0% 100.0%
Exports
Chapter Description Value (in USD m.) Share 2001 2004 2007 2001 2004 2007
HS-44 Wood 5.15 9.39 32.76 69.1% 74.4% 38.5%
HS-74 Copperandarticlesthereof 0.00 0.01 17.72 0.0% 0.1% 20.8%
HS-40 Rubber 0.28 1.50 12.88 3.7% 11.9% 15.2%
HS-26 Ores,slag,ash 0.00 0.10 7.98 0.0% 0.8% 9.4%
HS-10 Cereals 0.12 0.11 3.49 1.6% 0.9% 4.1%
HS-12 Misc.grain,seed 1.42 1.26 3.35 19.0% 10.0% 3.9%
HS-33 Perfumery,cosmeticproducts 0.00 0.00 2.52 0.0% 0.0% 3.0%
HS-01 Liveanimals 0.20 0.00 1.28 2.7% 0.0% 1.5%
HS-94 Furnitureandbedding 0.00 0.08 1.03 0.0% 0.6% 1.2%
HS-08 Ediblefruitsandnuts 0.03 0.00 0.38 0.4% 0.0% 0.5%
Total top 10 export items 7.20 12.45 83.40 96.5% 98.7% 98.1%
Others 0.26 0.17 1.59 3.5% 1.3% 1.9%
All products 7.46 12.62 84.99 100.0% 100.0% 100.0%
Source: Global Trade Atlas 2007

Environmental Impacts of the ASEAN-China Free Trade Agreement on the Greater Mekong Sub-Region
trade knowledge network
��
Table A.5: Myanmar trade with China
Imports
Chapter Description Value (in USD m.) Share 2001 2004 2007 2001 2004 2007
HS-84 Machinery,reactors,boilers 88.00 108.55 277.63 17.7% 11.6% 16.4%
HS-85 Electricalmachinery,etc. 59.01 180.83 183.27 11.9% 19.3% 10.8%
HS-72 Ironandsteel 12.20 81.24 155.22 2.5% 8.7% 9.2%
HS-87 Vehicles,notrailway 19.97 87.73 153.27 4.0% 9.3% 9.1%
HS-73 Ironandsteelproducts 26.98 44.51 125.01 5.4% 4.7% 7.4%
HS-27 Mineralfuel,oil 33.10 57.70 98.82 6.7% 6.1% 5.8%
HS-55 Manmadestaplefibers 37.52 44.32 90.92 7.5% 4.7% 5.4%
HS-52 Cottonandyarn,fabric 35.06 49.82 64.15 7.0% 5.3% 3.8%
HS-29 Organicchemicals 6.25 13.35 49.10 1.3% 1.4% 2.9%
HS-40 Rubber 7.60 18.45 43.99 1.5% 2.0% 2.6%
Total top 10 import items 325.69 686.49 1,241.37 65.5% 73.1% 73.4%
Others 171.67 252.05 450.56 34.5% 26.9% 26.6%
All products 497.36 938.55 1,691.92 100.0% 100.0% 100.0%
Exports
Chapter Description Value (in USD m.) Share 2001 2004 2007 2001 2004 2007
HS-44 Wood 89.15 141.88 189.38 66.4% 68.6% 51.1%
HS-26 Ores,slag,ash 5.37 10.76 37.86 4.0% 5.2% 10.2%
HS-12 Misc.grain,seed 5.22 10.56 26.63 3.9% 5.1% 7.2%
HS-40 Rubber 0.79 12.02 25.34 0.6% 5.8% 6.8%
HS-03 Fishandseafood 6.72 3.62 18.01 5.0% 1.8% 4.9%
HS-07 Vegetables 0.82 3.14 12.60 0.6% 1.5% 3.4%
HS-71 Preciousstones 3.74 7.66 12.43 2.8% 3.7% 3.4%
HS-85 Electricalmachinery,etc. 3.20 0.00 9.84 2.4% 0.0% 2.7%
HS-90 Optical,medicalinstruments 0.00 0.07 8.05 0.0% 0.0% 2.2%
HS-08 Ediblefruitsandnuts 7.90 1.47 5.90 5.9% 0.7% 1.6%
Total top 10 export items 122.91 191.18 346.04 91.6% 92.4% 93.4%
Others 11.28 15.67 24.53 8.4% 7.6% 6.6%
All products 134.19 206.85 370.56 100.0% 100.0% 100.0%
Source: Global Trade Atlas 2007

Environmental Impacts of the ASEAN-China Free Trade Agreement on the Greater Mekong Sub-Region
trade knowledge network
��
Table A.6: RCA index of GMS5 in the Chinese market
HS Code Description RCA 2007 RCA 2004 RCA 2001 RCA Change RCA Change RCA Change 2001-07 (%) 2004-07 (%) 2001-04 (%)
07 Ediblevegetables 29.40 31.73 27.50 6.91 -7.4 15.4
08 Ediblefruits 14.69 13.62 14.65 0.28 7.9 -7.1
40 Rubber 8.69 9.59 9.28 -6.43 -9.4 3.3
44 Woodandarticlesofwood 3.48 3.45 2.91 19.44 0.6 18.7
84 Machineryandmechanical 2.11 1.22 0.99 112.93 72.8 23.2 appliances
39 Plastics 1.31 1.71 1.80 -27.14 -23.4 -4.9
29 Organicchemicals 1.28 0.57 0.48 166.14 125.8 17.9
85 Electricalandmachinery 0.82 0.83 0.68 20.79 -0.8 21.7 equipment
73 Articlesofironorsteel 0.31 0.24 0.17 85.52 27.2 45.8
26 Ores,slagandash 0.29 0.30 0.33 -11.49 -1.1 -10.5
10 Cereals 15.62 4.46 6.85 128.14 250.1 -34.8
09 Coffee,tea,mateandspices 13.20 10.07 10.46 26.23 31.1 -3.7
16 Meat,fishandseafoodfood 6.45 3.36 2.17 197.41 91.7 55.1 preparations
06 Livetreesandplants 6.05 5.32 1.32 359.61 13.6 304.4
64 Footwear 5.69 3.23 0.92 521.42 76.4 252.3
01 Liveanimals 2.56 0.19 0.72 255.70 1243.8 -73.5
Source: Authors’ calculation based on trade data from Global Trade Atlas
Table A.7: RCA index of Thailand in the Chinese market
HS Code Description RCA 2006 RCA 2004 RCA 2001
7 Ediblevegetablesandcertainrootsandtubers 31.97 32.87 30.93
10 Cereals 28.83 5.39 8.54
11 Millingproducts,malt,starches 22.64 17.83 17.28
8 Ediblefruit,nuts,peelofcitrusfruit,melons 10.08 14.26 10.26
40 Rubberandarticlesthereof 9.30 9.82 10.11
17 Sugarsandsugarconfectionery 8.31 9.03 14.90
57 Carpetsandothertextilefloorcoverings 6.15 1.59 2.20
6 Livetreesandplants 5.88 6.51 1.52
16 Meat,fishandseafoodfoodpreparations 2.25 2.94 2.05
84 Nuclearreactors,boilers,machinery,etc. 2.14 1.49 1.23
Source: Authors’ calculation based on trade data from Global Trade Atlas

Environmental Impacts of the ASEAN-China Free Trade Agreement on the Greater Mekong Sub-Region
trade knowledge network
��
Table A.8: RCA index of Vietnam in the Chinese market
HS Code Description RCA 2006 RCA 2004 RCA 2001
11 Millingproducts,malt,starches 148.81 52.35 29.78
9 Coffee,tea,mateandspices 94.71 55.95 58.98
7 Ediblevegetablesandcertainrootsandtubers 57.91 27.98 15.39
8 Ediblefruit,nuts,peelofcitrusfruit,melons 38.82 11.70 32.19
64 Footwear,gaitersandthelike,partsthereof 32.22 14.21 3.34
46 Manufacturesofplaitingmaterial,basketwork,etc. 27.51 18.04 15.77
16 Meat,fishandseafoodfoodpreparations 16.61 3.79 2.89
40 Rubberandarticlesthereof 13.30 8.63 6.19
53 Vegetabletextilefibers,yarns&wovens,etc. 8.07 3.42 2.14
65 Headgearandpartsthereof 6.88 3.06 0.34
10 Cereals 6.45 0.68 0.04
44 Woodandarticlesofwood,woodcharcoal 4.92 0.98 0.42
63 Made-uptextilearticles,needlecraftsets,wornclothing,etc. 4.86 1.96 1.09
14 Vegetableplaitingmaterials,vegetableproducts 3.95 29.94 23.75
27 Mineralfuels,oils,distillationproducts,etc. 3.90 8.14 10.14
1 Liveanimals 3.83 0.28 0.45
62 Articlesofapparel,accessories,notknitorcrochet 3.24 0.59 0.31
3 Fish,crustaceans,molluscs,aquaticinvertebrates 2.23 1.51 1.60
Source: Authors’ calculation based on trade data from Global Trade Atlas
Table A.9: RCA index of Lao PDR in the Chinese market
HS Code Description RCA 2006 RCA 2004 RCA 2001
94 Furniture,lighting,signs,prefabricatedbuildings 142.50 684.62 314.58
10 Cereals 109.23 2.23 6.50
92 Musicalinstruments,partsandaccessories 60.38 108.13 5.96
44 Woodandarticlesofwood,woodcharcoal 56.42 80.32 48.52
95 Toys,games,sportsrequisites 28.20 121.67 75.05
40 Rubberandarticlesthereof 24.31 14.06 4.40
13 Lac,gums,resins,vegetablesapsandextracts 19.14 0.00 27.06
33 Essentialoils,perfumes,cosmetics 17.43 0.00 0.00
14 Vegetableplaitingmaterials,vegetableproducts 11.89 13.38 22.10
61 Articlesofapparel,accessories,knitorcrochet 3.73 1.59 0.23
12 Oilseed,oleagicfruits,grain,seed,fruit 3.62 7.63 13.86
74 Copperandarticlesthereof 2.97 0.05 0.00
62 Articlesofapparel,accessories,notknitorcrochet 2.03 0.65 0.49
Source: Authors’ calculation based on trade data from Global Trade Atlas
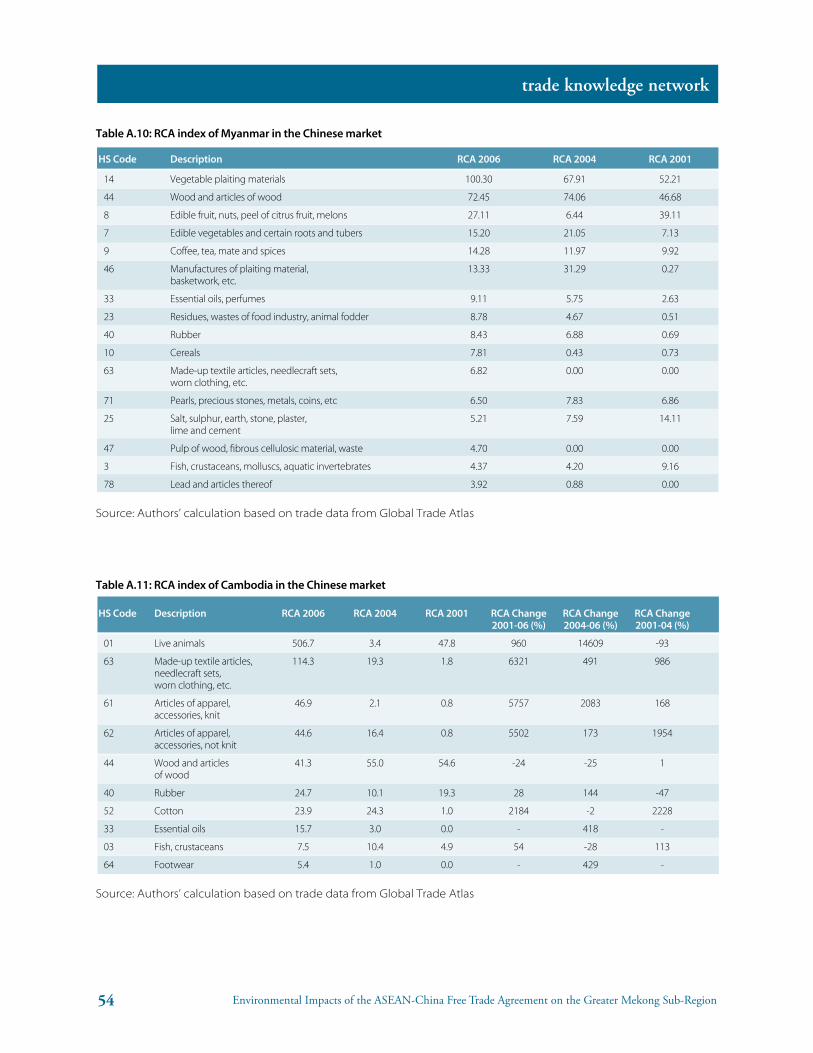
Environmental Impacts of the ASEAN-China Free Trade Agreement on the Greater Mekong Sub-Region
trade knowledge network
��
Table A.10: RCA index of Myanmar in the Chinese market
HS Code Description RCA 2006 RCA 2004 RCA 2001
14 Vegetableplaitingmaterials 100.30 67.91 52.21
44 Woodandarticlesofwood 72.45 74.06 46.68
8 Ediblefruit,nuts,peelofcitrusfruit,melons 27.11 6.44 39.11
7 Ediblevegetablesandcertainrootsandtubers 15.20 21.05 7.13
9 Coffee,tea,mateandspices 14.28 11.97 9.92
46 Manufacturesofplaitingmaterial, 13.33 31.29 0.27 basketwork,etc.
33 Essentialoils,perfumes 9.11 5.75 2.63
23 Residues,wastesoffoodindustry,animalfodder 8.78 4.67 0.51
40 Rubber 8.43 6.88 0.69
10 Cereals 7.81 0.43 0.73
63 Made-uptextilearticles,needlecraftsets, 6.82 0.00 0.00 wornclothing,etc.
71 Pearls,preciousstones,metals,coins,etc 6.50 7.83 6.86
25 Salt,sulphur,earth,stone,plaster, 5.21 7.59 14.11 limeandcement
47 Pulpofwood,fibrouscellulosicmaterial,waste 4.70 0.00 0.00
3 Fish,crustaceans,molluscs,aquaticinvertebrates 4.37 4.20 9.16
78 Leadandarticlesthereof 3.92 0.88 0.00
Source: Authors’ calculation based on trade data from Global Trade Atlas
Table A.11: RCA index of Cambodia in the Chinese market
HS Code Description RCA 2006 RCA 2004 RCA 2001 RCA Change RCA Change RCA Change 2001-06 (%) 2004-06 (%) 2001-04 (%)
01 Liveanimals 506.7 3.4 47.8 960 14609 -93
63 Made-uptextilearticles, 114.3 19.3 1.8 6321 491 986 needlecraftsets, wornclothing,etc.
61 Articlesofapparel, 46.9 2.1 0.8 5757 2083 168 accessories,knit
62 Articlesofapparel, 44.6 16.4 0.8 5502 173 1954 accessories,notknit
44 Woodandarticles 41.3 55.0 54.6 -24 -25 1 ofwood
40 Rubber 24.7 10.1 19.3 28 144 -47
52 Cotton 23.9 24.3 1.0 2184 -2 2228
33 Essentialoils 15.7 3.0 0.0 - 418 -
03 Fish,crustaceans 7.5 10.4 4.9 54 -28 113
64 Footwear 5.4 1.0 0.0 - 429 -
Source: Authors’ calculation based on trade data from Global Trade Atlas

Environmental Impacts of the ASEAN-China Free Trade Agreement on the Greater Mekong Sub-Region
trade knowledge network
��
Table A.12: RCA index of China in the GMS5 market
HS Code Description RCA 2006 RCA 2004 RCA 2001 RCA Change RCA Change RCA Change 2001-06 (%) 2004-06 (%) 2001-04 (%)
52 Cotton 2.77 2.54 2.51 10.50 9.19 1.20
72 Ironandsteel 2.22 1.57 0.95 133.52 41.29 65.28
60 Fabrics 2.16 1.82 2.04 5.63 18.58 -10.92
31 Fertilizers 1.87 3.88 1.56 20.09 -51.80 149.14
84 Machineryand 1.35 1.14 1.32 2.31 18.41 -13.59 mechanicalappliances
73 Articlesofironorsteel 1.00 0.97 0.96 3.49 2.91 0.56
85 Electricalmachinery 0.97 0.87 0.75 29.35 11.52 15.99
87 Vehicles 0.90 0.68 2.61 -65.72 32.43 -74.12
29 Organicchemicals 0.84 0.71 1.06 -20.75 19.03 -33.42
27 Mineralfuelsandoils 0.27 0.52 0.51 -47.12 -47.93 1.55
Source: Authors’ calculation based on trade data from Global Trade Atlas
Table A.13: RCA index of China in the Cambodian market
HS Code Description RCA 2006 RCA 2004 RCA Change 2004-06 (%)
85 Electricalmachineryandequipment 4745 1144 315%
84 Machineryandmechanicalappliances 1725 587 194%
89 Ships,boatsandotherfloatingstructures 490 1177 -58%
87 Vehiclesotherthanrailway 455 484 -6%
60 Knittedorcrochetedfabric 409 433 -6%
96 Miscellaneousmanufacturedarticles 294 5711 -95%
95 Toys,games,sportsrequisites 143 74 94%
73 Articlesofironorsteel 120 95 26%
72 Ironandsteel 115 112 2%
90 Optical,photo,technical,medical 97 38 152%
61 Articlesofapparel,accessories 65 20 227%
76 Aluminumandarticlesthereof 56 8 638%
52 Cotton 52 103 -50%
55 Manmadestaplefibers 45 52 -13%
88 Aircraft,spacecraft 43 0 -
94 Furniture,lighting,signs,prefabricatedbuildings 43 8 452%
58 Specialwovenortuftedfabric 41 15 164%
64 Footwear 31 18 70%
54 Manmadefilaments 29 5 426%
69 Ceramicproducts 29 79 -64%
Source: Authors’ calculation based on trade data from Global Trade Atlas