enhanced recovery of shale oil: eagle ford shale and other
TRANSCRIPT
1
Enhanced Recovery of Shale Oil: Eagle Ford Shale and Other Shale Basins
Prepared for:
Midland CO2 Conference Week 2019 - Theme Session 1
Unconventional Reservoir Cyclic Injection Projects
Prepared By:
Vello A. Kuuskraa, President
Advanced Resources International, Inc.
Arlington, VA
December 12th, 2019
25th Annual CO2 & ROZ Flooding Conference
Midland, TX
Enhanced Recovery of Shale Oil:
Eagle Ford Shale and Other
Shale Basins
| JAF2019_090.PPT | December 5, 2019 | www.adv-res.com
2
Enhanced Recovery of Shale Oil: Eagle Ford Shale and Other Shale Basins
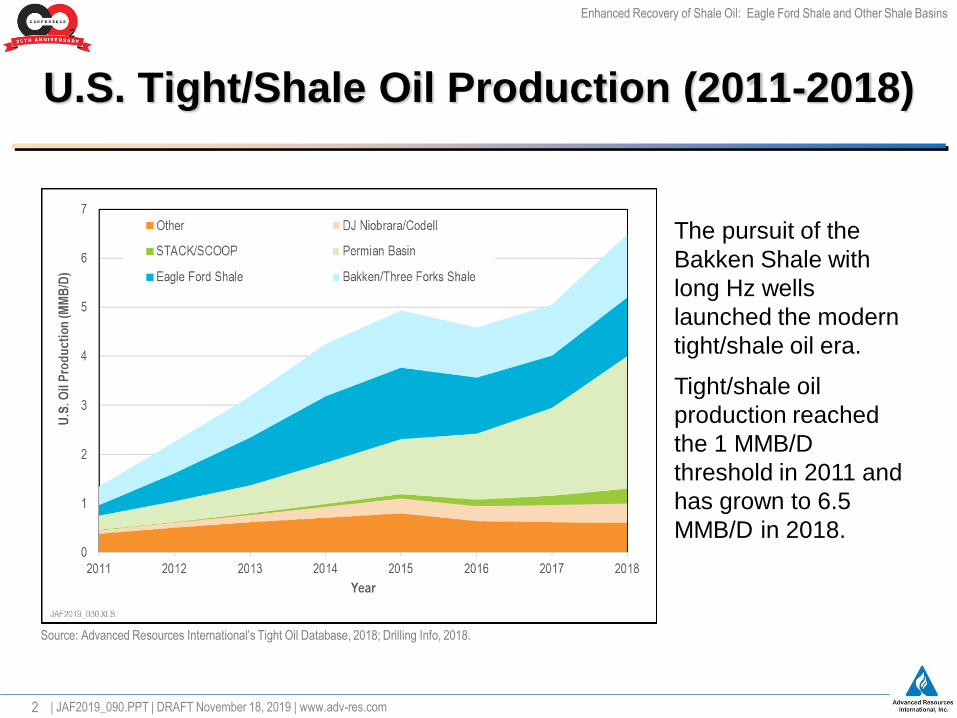
Source: Advanced Resources International’s Tight Oil Database, 2018; Drilling Info, 2018.
U.S. Tight/Shale Oil Production (2011-2018)
| JAF2019_090.PPT | December 5, 2019 | www.adv-res.com
The pursuit of the
Bakken Shale with
long Hz wells
launched the modern
tight/shale oil era.
Tight/shale oil
production reached
the 1 MMB/D
threshold in 2011 and
has grown to 6.5
MMB/D in 2018.
| JAF2019_090.PPT | DRAFT November 18, 2019 | www.adv-res.com
3
Enhanced Recovery of Shale Oil: Eagle Ford Shale and Other Shale Basins
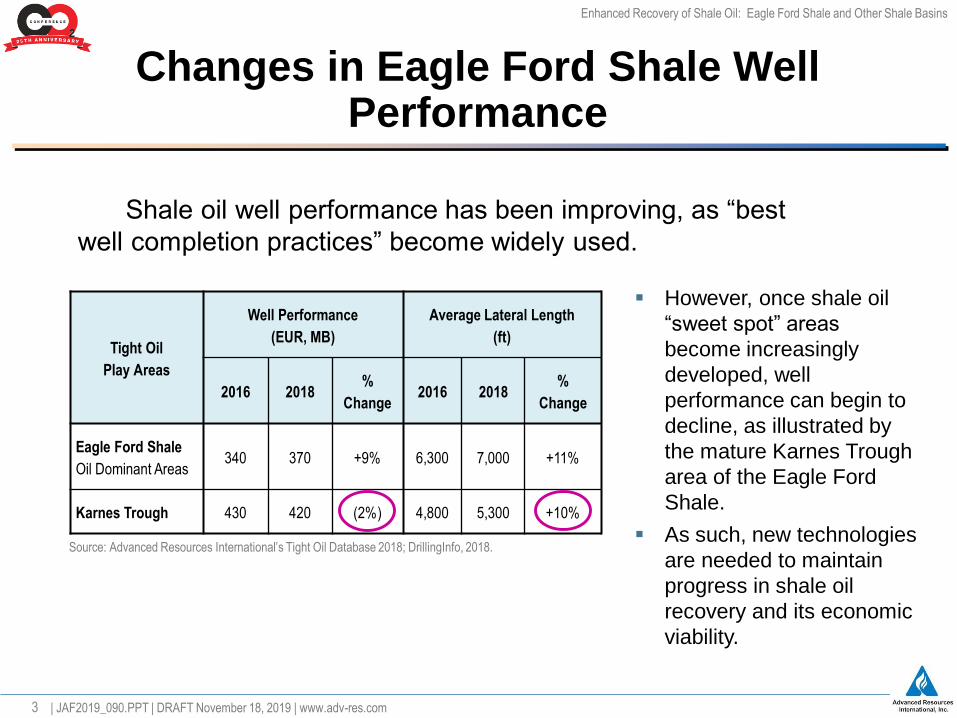
Changes in Eagle Ford Shale Well Performance
Source: Advanced Resources International’s Tight Oil Database 2018; DrillingInfo, 2018.
Tight Oil
Play Areas
Well Performance
(EUR, MB)
Average Lateral Length
(ft)
2016 2018%
Change2016 2018
%
Change
Eagle Ford Shale
Oil Dominant Areas340 370 +9% 6,300 7,000 +11%
Karnes Trough 430 420 (2%) 4,800 5,300 +10%
| JAF2019_090.PPT | December 5, 2019 |
www.adv-res.com
▪ However, once shale oil
“sweet spot” areas
become increasingly
developed, well
performance can begin to
decline, as illustrated by
the mature Karnes Trough
area of the Eagle Ford
Shale.
▪ As such, new technologies
are needed to maintain
progress in shale oil
recovery and its economic
viability.
Shale oil well performance has been improving, as “best
well completion practices” become widely used.
| JAF2019_090.PPT | DRAFT November 18, 2019 | www.adv-res.com
4
Enhanced Recovery of Shale Oil: Eagle Ford Shale and Other Shale Basins
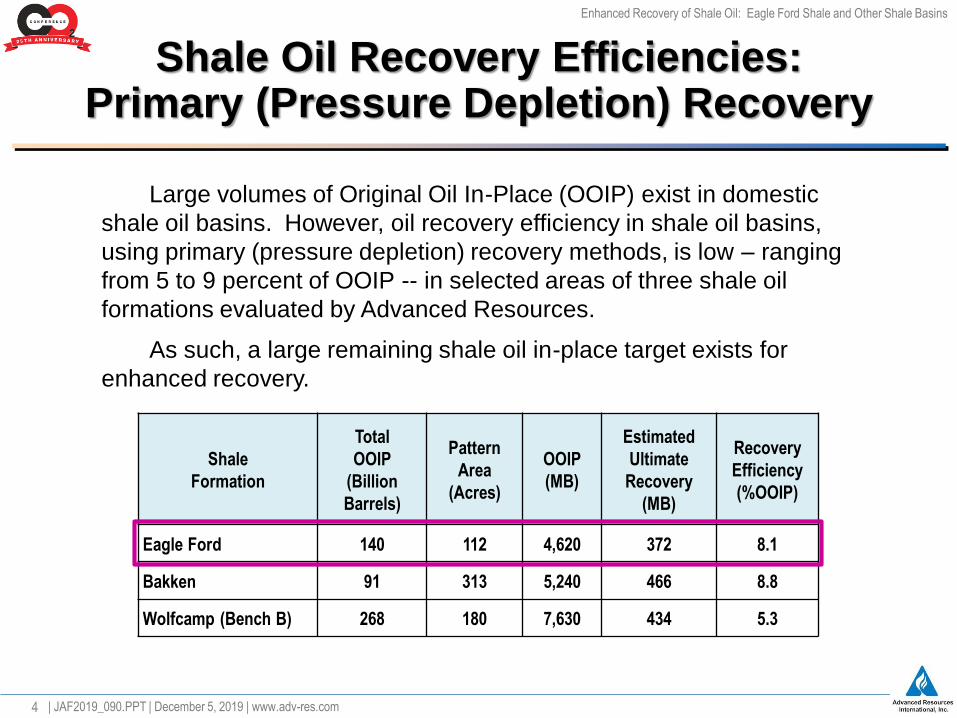
Shale Oil Recovery Efficiencies: Primary (Pressure Depletion) Recovery
Large volumes of Original Oil In-Place (OOIP) exist in domestic
shale oil basins. However, oil recovery efficiency in shale oil basins,
using primary (pressure depletion) recovery methods, is low – ranging
from 5 to 9 percent of OOIP -- in selected areas of three shale oil
formations evaluated by Advanced Resources.
As such, a large remaining shale oil in-place target exists for
enhanced recovery.
Shale
Formation
Total
OOIP
(Billion
Barrels)
Pattern
Area
(Acres)
OOIP
(MB)
Estimated
Ultimate
Recovery
(MB)
Recovery
Efficiency
(%OOIP)
Eagle Ford 140 112 4,620 372 8.1
Bakken 91 313 5,240 466 8.8
Wolfcamp (Bench B) 268 180 7,630 434 5.3
| JAF2019_090.PPT | December 5, 2019 | www.adv-res.com
5
Enhanced Recovery of Shale Oil: Eagle Ford Shale and Other Shale Basins
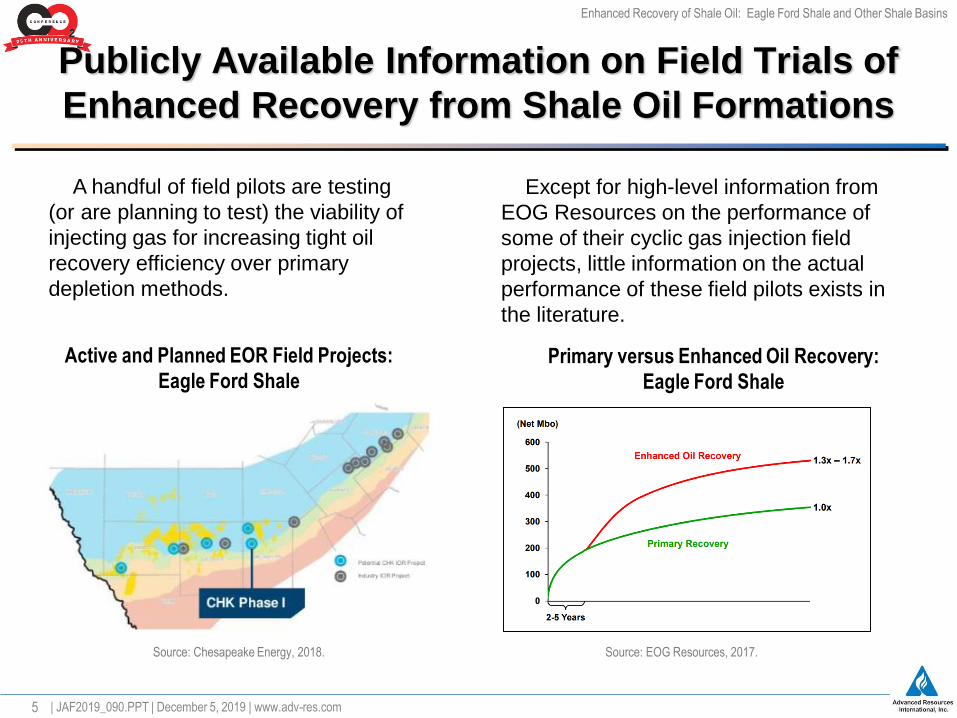
Publicly Available Information on Field Trials of
Enhanced Recovery from Shale Oil Formations
A handful of field pilots are testing
(or are planning to test) the viability of
injecting gas for increasing tight oil
recovery efficiency over primary
depletion methods.
Active and Planned EOR Field Projects:
Eagle Ford Shale
Source: Chesapeake Energy, 2018. Source: EOG Resources, 2017.
Primary versus Enhanced Oil Recovery:
Eagle Ford Shale
Except for high-level information from
EOG Resources on the performance of
some of their cyclic gas injection field
projects, little information on the actual
performance of these field pilots exists in
the literature.
| JAF2019_090.PPT | December 5, 2019 | www.adv-res.com
6
Enhanced Recovery of Shale Oil: Eagle Ford Shale and Other Shale Basins
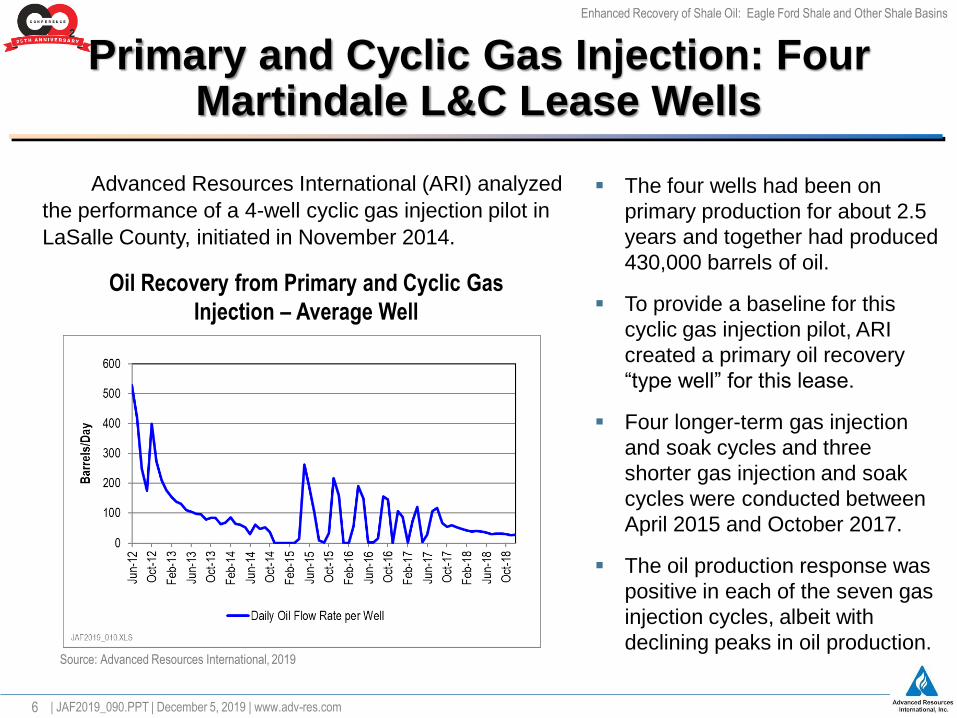
Advanced Resources International (ARI) analyzed
the performance of a 4-well cyclic gas injection pilot in
LaSalle County, initiated in November 2014.
Text
▪ The four wells had been on
primary production for about 2.5
years and together had produced
430,000 barrels of oil.
▪ To provide a baseline for this
cyclic gas injection pilot, ARI
created a primary oil recovery
“type well” for this lease.
▪ Four longer-term gas injection
and soak cycles and three
shorter gas injection and soak
cycles were conducted between
April 2015 and October 2017.
▪ The oil production response was
positive in each of the seven gas
injection cycles, albeit with
declining peaks in oil production.
| JAF2019_090.PPT | December 5, 2019 | www.adv-res.com
Oil Recovery from Primary and Cyclic Gas
Injection – Average Well
Source: Advanced Resources International, 2019
Primary and Cyclic Gas Injection: Four Martindale L&C Lease Wells
7
Enhanced Recovery of Shale Oil: Eagle Ford Shale and Other Shale Basins
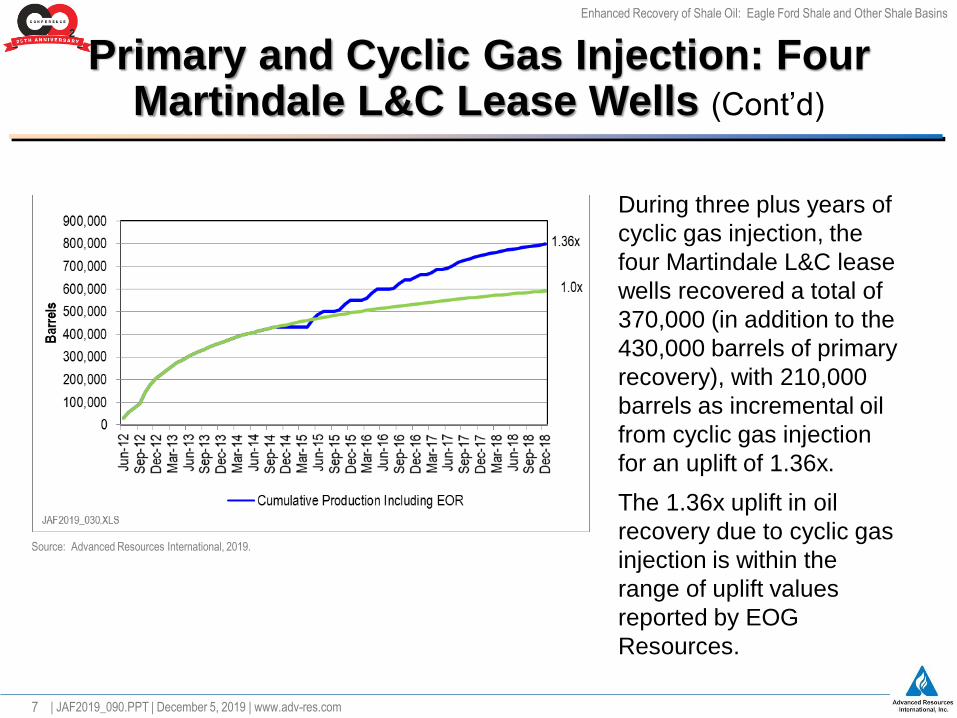
Primary and Cyclic Gas Injection: Four Martindale L&C Lease Wells (Cont’d)
Source: Advanced Resources International, 2019.
| JAF2019_090.PPT | December 5, 2019 | www.adv-res.com
During three plus years of
cyclic gas injection, the
four Martindale L&C lease
wells recovered a total of
370,000 (in addition to the
430,000 barrels of primary
recovery), with 210,000
barrels as incremental oil
from cyclic gas injection
for an uplift of 1.36x.
The 1.36x uplift in oil
recovery due to cyclic gas
injection is within the
range of uplift values
reported by EOG
Resources.
8
Enhanced Recovery of Shale Oil: Eagle Ford Shale and Other Shale Basins
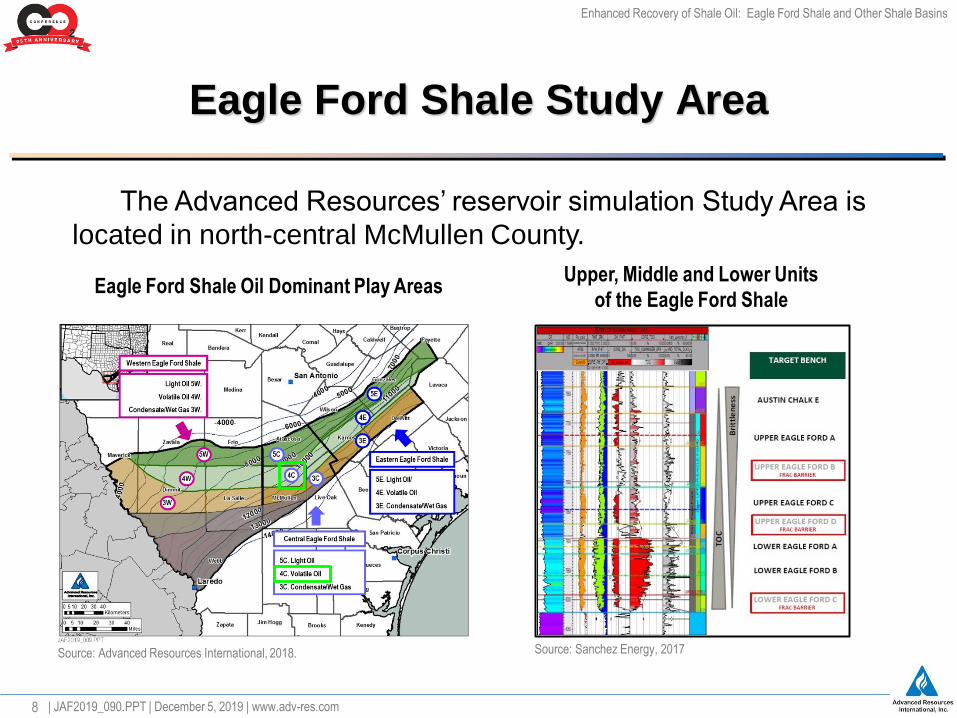
Eagle Ford Shale Study Area
| JAF2019_090.PPT | December 5, 2019 | www.adv-res.com
The Advanced Resources’ reservoir simulation Study Area is
located in north-central McMullen County.
Upper, Middle and Lower Units
of the Eagle Ford Shale
Source: Sanchez Energy, 2017
Eagle Ford Shale Oil Dominant Play Areas
Source: Advanced Resources International, 2018.
9
Enhanced Recovery of Shale Oil: Eagle Ford Shale and Other Shale Basins
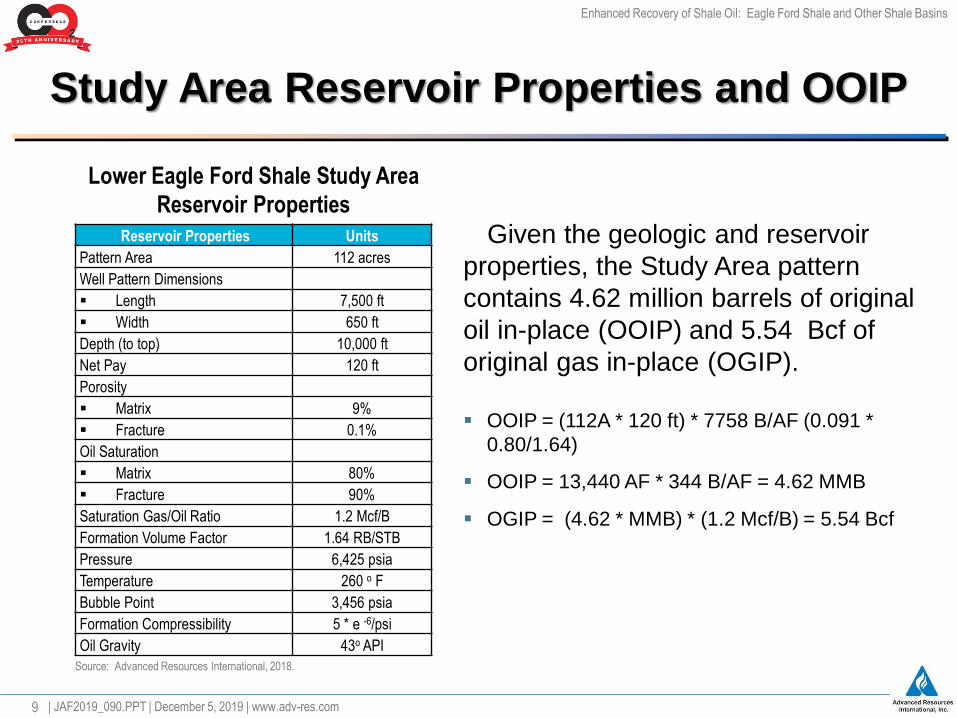
Study Area Reservoir Properties and OOIP
Given the geologic and reservoir
properties, the Study Area pattern
contains 4.62 million barrels of original
oil in-place (OOIP) and 5.54 Bcf of
original gas in-place (OGIP).
Lower Eagle Ford Shale Study Area
Reservoir Properties
Source: Advanced Resources International, 2018.
Reservoir Properties Units
Pattern Area 112 acres
Well Pattern Dimensions
▪ Length 7,500 ft
▪ Width 650 ft
Depth (to top) 10,000 ft
Net Pay 120 ft
Porosity
▪ Matrix 9%
▪ Fracture 0.1%
Oil Saturation
▪ Matrix 80%
▪ Fracture 90%
Saturation Gas/Oil Ratio 1.2 Mcf/B
Formation Volume Factor 1.64 RB/STB
Pressure 6,425 psia
Temperature 260 o F
Bubble Point 3,456 psia
Formation Compressibility 5 * e -6/psi
Oil Gravity 43o API
▪ OOIP = (112A * 120 ft) * 7758 B/AF (0.091 *
0.80/1.64)
▪ OOIP = 13,440 AF * 344 B/AF = 4.62 MMB
▪ OGIP = (4.62 * MMB) * (1.2 Mcf/B) = 5.54 Bcf
| JAF2019_090.PPT | December 5, 2019 | www.adv-res.com
10
Enhanced Recovery of Shale Oil: Eagle Ford Shale and Other Shale Basins
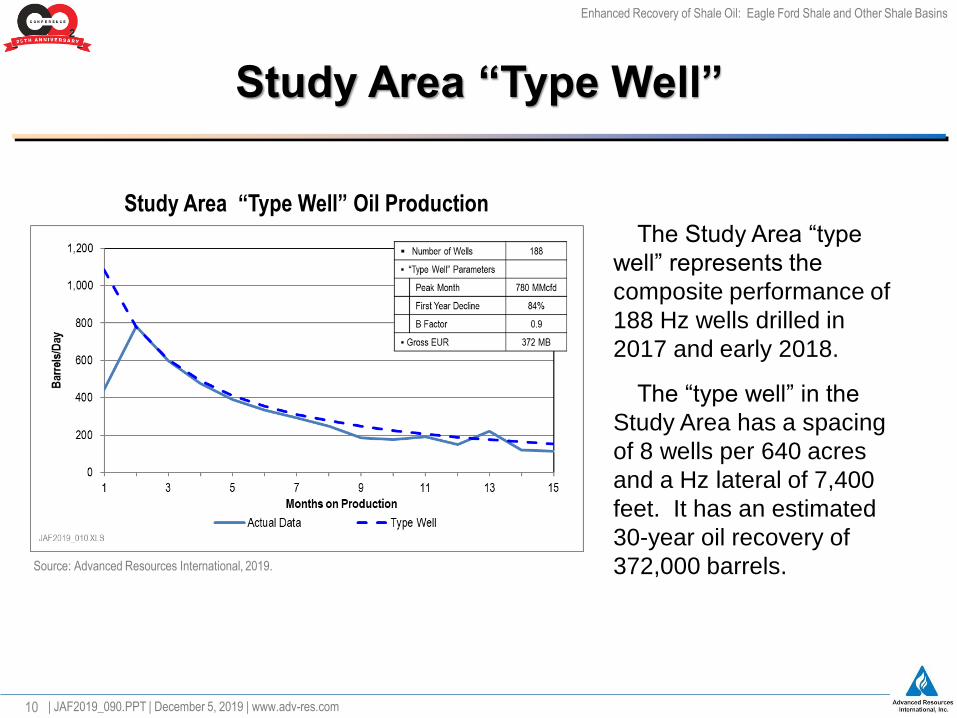
Study Area “Type Well”
The Study Area “type
well” represents the
composite performance of
188 Hz wells drilled in
2017 and early 2018.
The “type well” in the
Study Area has a spacing
of 8 wells per 640 acres
and a Hz lateral of 7,400
feet. It has an estimated
30-year oil recovery of
372,000 barrels.
Study Area “Type Well” Oil Production
Source: Advanced Resources International, 2019.
| JAF2019_090.PPT | December 5, 2019 | www.adv-res.com
11
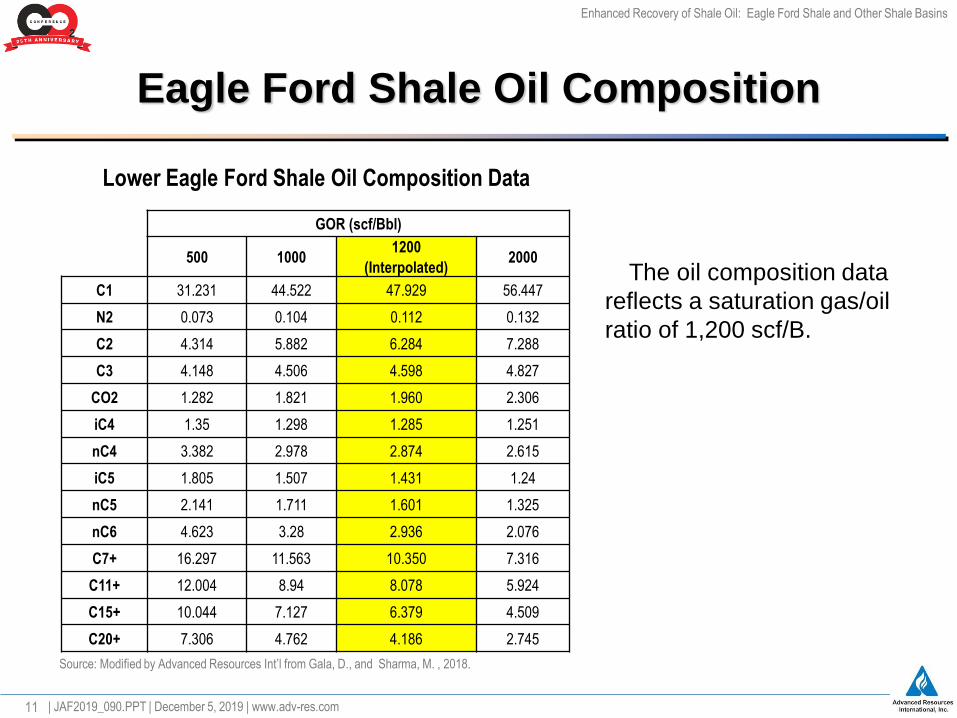
Enhanced Recovery of Shale Oil: Eagle Ford Shale and Other Shale Basins
The oil composition data
reflects a saturation gas/oil
ratio of 1,200 scf/B.
Lower Eagle Ford Shale Oil Composition Data
GOR (scf/Bbl)
500 10001200
(Interpolated)2000
C1 31.231 44.522 47.929 56.447
N2 0.073 0.104 0.112 0.132
C2 4.314 5.882 6.284 7.288
C3 4.148 4.506 4.598 4.827
CO2 1.282 1.821 1.960 2.306
iC4 1.35 1.298 1.285 1.251
nC4 3.382 2.978 2.874 2.615
iC5 1.805 1.507 1.431 1.24
nC5 2.141 1.711 1.601 1.325
nC6 4.623 3.28 2.936 2.076
C7+ 16.297 11.563 10.350 7.316
C11+ 12.004 8.94 8.078 5.924
C15+ 10.044 7.127 6.379 4.509
C20+ 7.306 4.762 4.186 2.745
Eagle Ford Shale Oil Composition
| JAF2019_090.PPT | December 5, 2019 | www.adv-res.com
Source: Modified by Advanced Resources Int’l from Gala, D., and Sharma, M. , 2018.
12
Enhanced Recovery of Shale Oil: Eagle Ford Shale and Other Shale Basins
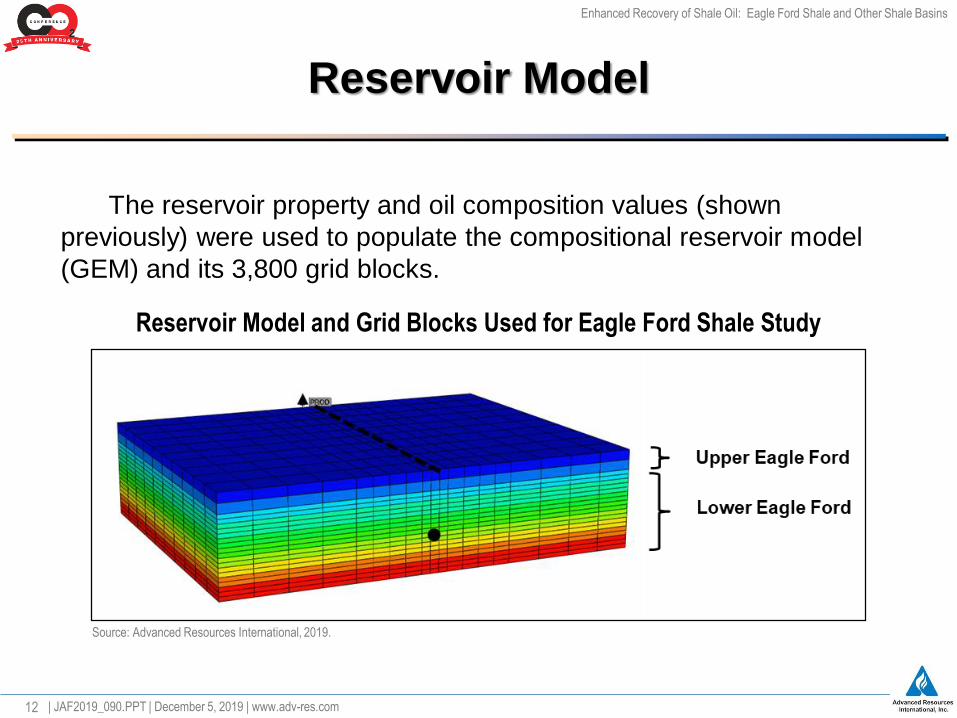
Reservoir Model
Reservoir Model and Grid Blocks Used for Eagle Ford Shale Study
Source: Advanced Resources International, 2019.
The reservoir property and oil composition values (shown
previously) were used to populate the compositional reservoir model
(GEM) and its 3,800 grid blocks.
| JAF2019_090.PPT | December 5, 2019 | www.adv-res.com
13
Enhanced Recovery of Shale Oil: Eagle Ford Shale and Other Shale Basins
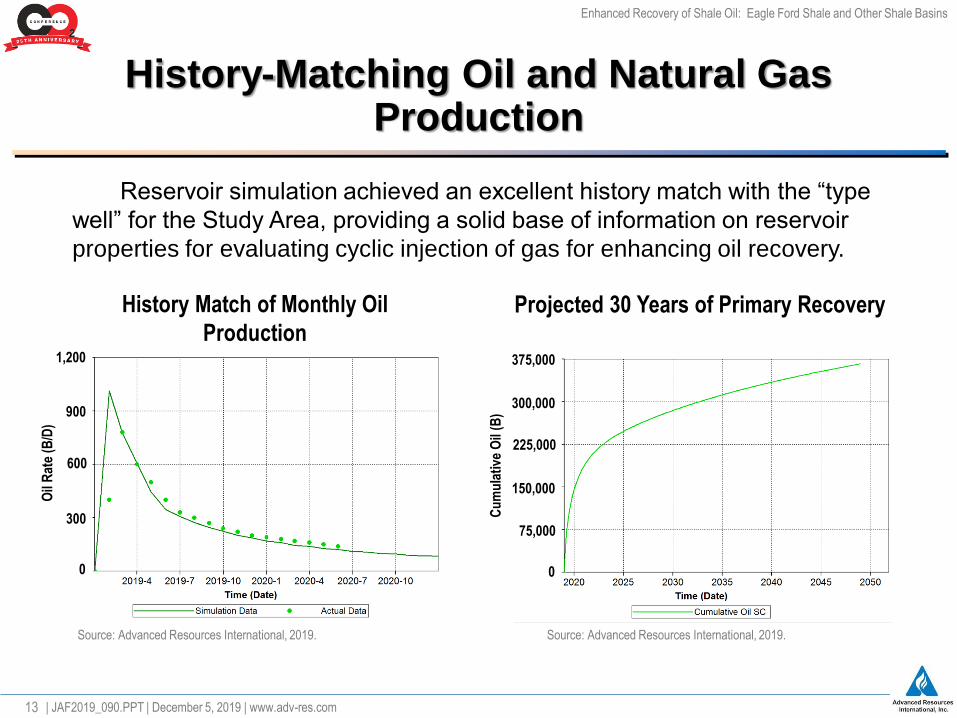
History-Matching Oil and Natural Gas Production
Reservoir simulation achieved an excellent history match with the “type
well” for the Study Area, providing a solid base of information on reservoir
properties for evaluating cyclic injection of gas for enhancing oil recovery.
History Match of Monthly Oil
Production
Source: Advanced Resources International, 2019.
Projected 30 Years of Primary Recovery
| JAF2019_090.PPT | December 5, 2019 | www.adv-res.com
1,200
Oil
Rat
e (B
/D)
900
600
300
0
Source: Advanced Resources International, 2019.
375,000
Cu
mu
lati
ve O
il (B
)
300,000
225,000
150,000
0
75,000
14
Enhanced Recovery of Shale Oil: Eagle Ford Shale and Other Shale Basins
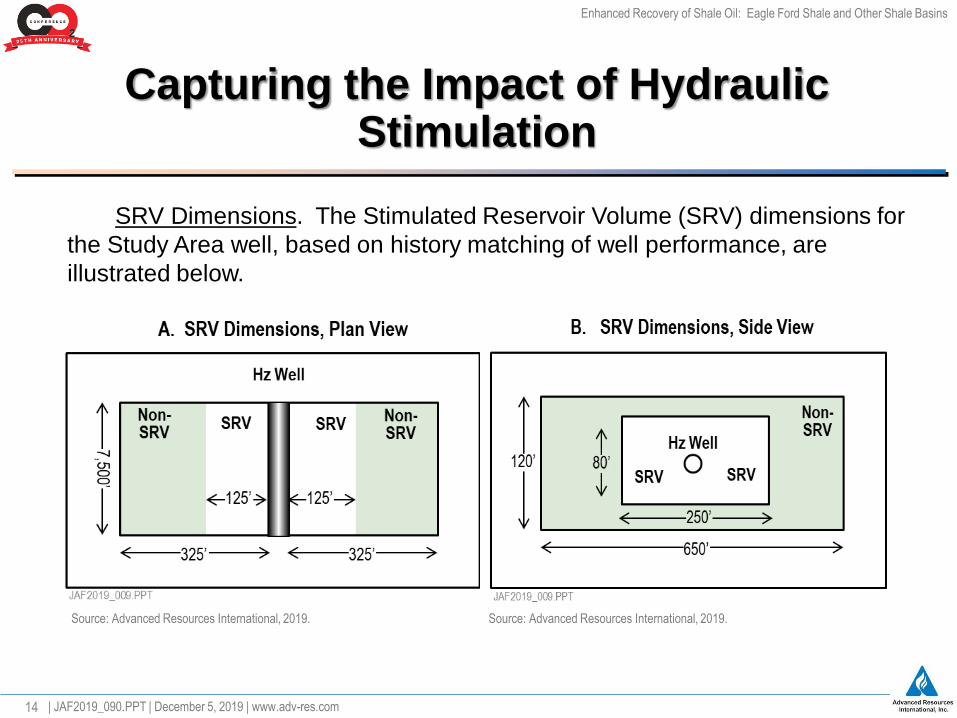
Capturing the Impact of Hydraulic Stimulation
SRV Dimensions. The Stimulated Reservoir Volume (SRV) dimensions for
the Study Area well, based on history matching of well performance, are
illustrated below.
Source: Advanced Resources International, 2019. Source: Advanced Resources International, 2019.
| JAF2019_090.PPT | December 5, 2019 | www.adv-res.com
15
Enhanced Recovery of Shale Oil: Eagle Ford Shale and Other Shale Basins
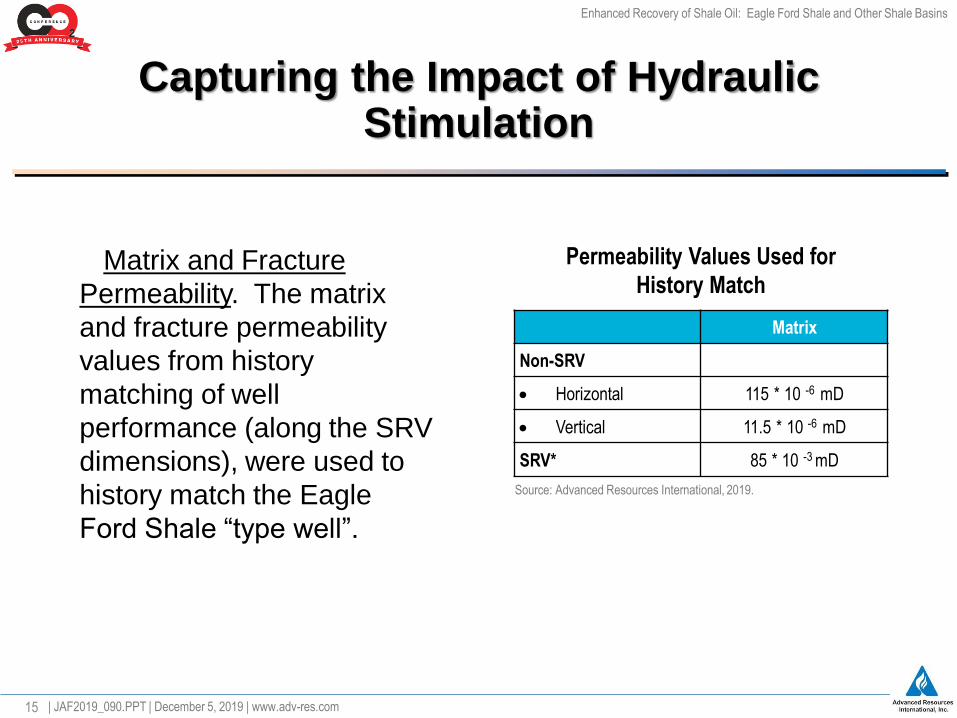
Capturing the Impact of Hydraulic Stimulation
Matrix and Fracture
Permeability. The matrix
and fracture permeability
values from history
matching of well
performance (along the SRV
dimensions), were used to
history match the Eagle
Ford Shale “type well”.
Permeability Values Used for
History Match
Source: Advanced Resources International, 2019.
Matrix
Non-SRV
• Horizontal 115 * 10 -6 mD
• Vertical 11.5 * 10 -6 mD
SRV* 85 * 10 -3 mD
| JAF2019_090.PPT | December 5, 2019 | www.adv-res.com
16
Enhanced Recovery of Shale Oil: Eagle Ford Shale and Other Shale Basins
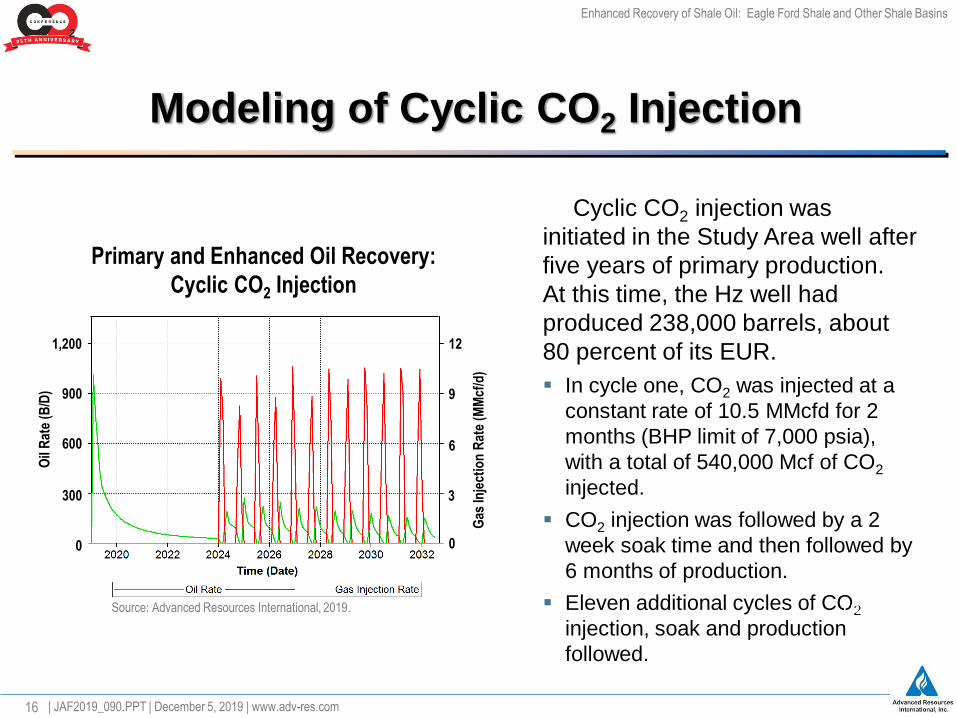
Modeling of Cyclic CO2 Injection
Cyclic CO2 injection was
initiated in the Study Area well after
five years of primary production.
At this time, the Hz well had
produced 238,000 barrels, about
80 percent of its EUR.
▪ In cycle one, CO2 was injected at a
constant rate of 10.5 MMcfd for 2
months (BHP limit of 7,000 psia),
with a total of 540,000 Mcf of CO2
injected.
▪ CO2 injection was followed by a 2
week soak time and then followed by
6 months of production.
▪ Eleven additional cycles of CO2
injection, soak and production
followed.
| JAF2019_090.PPT | December 5, 2019 | www.adv-res.com
16
Primary and Enhanced Oil Recovery:
Cyclic CO2 Injection
Source: Advanced Resources International, 2019.
1,200
900
600
300
0
Oil
Rat
e (B
/D)
12
9
6
3
0
Gas
Inje
ctio
n R
ate
(MM
cf/d
)
17
Enhanced Recovery of Shale Oil: Eagle Ford Shale and Other Shale Basins
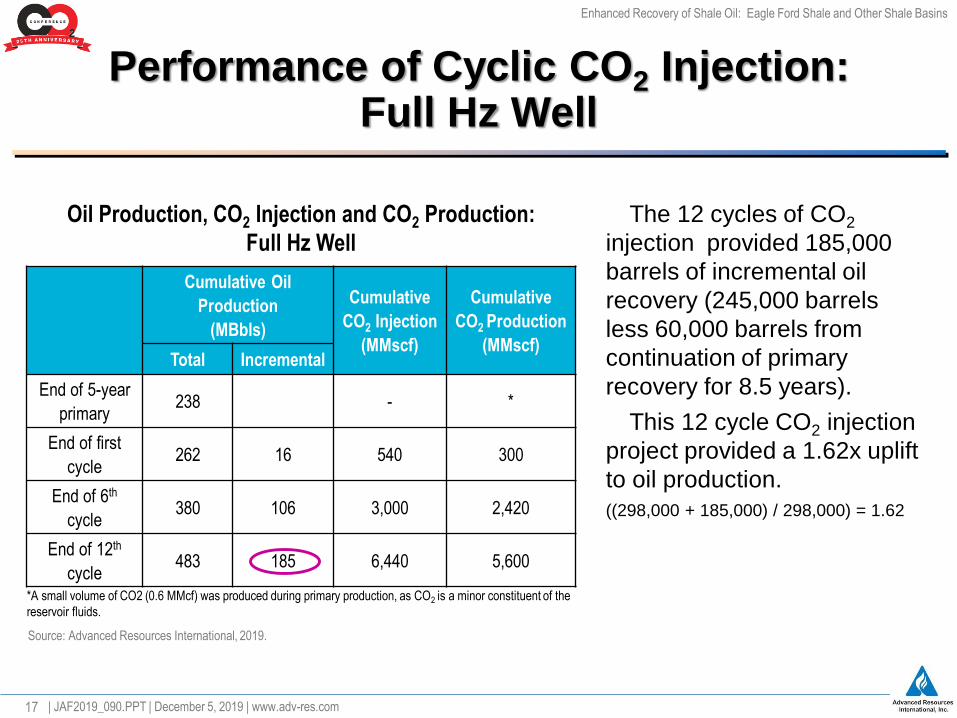
Performance of Cyclic CO2 Injection: Full Hz Well
The 12 cycles of CO2
injection provided 185,000
barrels of incremental oil
recovery (245,000 barrels
less 60,000 barrels from
continuation of primary
recovery for 8.5 years).
This 12 cycle CO2 injection
project provided a 1.62x uplift
to oil production.
((298,000 + 185,000) / 298,000) = 1.62
Oil Production, CO2 Injection and CO2 Production:
Full Hz Well
Source: Advanced Resources International, 2019.
Cumulative Oil
Production
(MBbls)
Cumulative
CO2 Injection
(MMscf)
Cumulative
CO2 Production
(MMscf)Total Incremental
End of 5-year
primary238 - *
End of first
cycle262 16 540 300
End of 6th
cycle380 106 3,000 2,420
End of 12th
cycle483 185 6,440 5,600
*A small volume of CO2 (0.6 MMcf) was produced during primary production, as CO2 is a minor constituent of the
reservoir fluids.
| JAF2019_090.PPT | December 5, 2019 | www.adv-res.com
18
Enhanced Recovery of Shale Oil: Eagle Ford Shale and Other Shale Basins
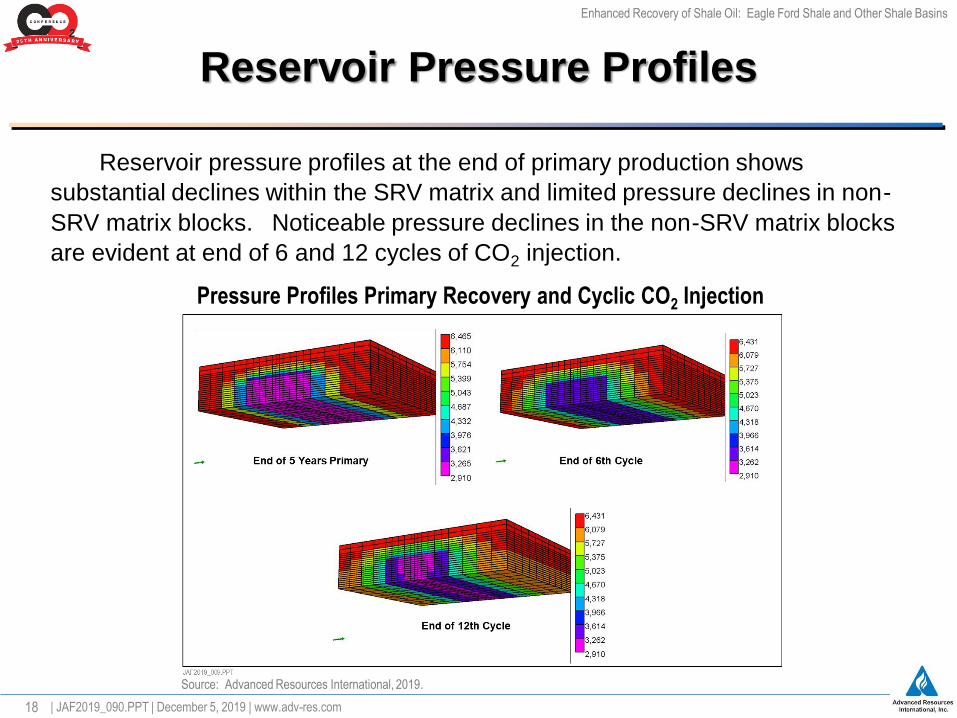
Reservoir pressure profiles at the end of primary production shows
substantial declines within the SRV matrix and limited pressure declines in non-
SRV matrix blocks. Noticeable pressure declines in the non-SRV matrix blocks
are evident at end of 6 and 12 cycles of CO2 injection.
Reservoir Pressure Profiles
| JAF2019_090.PPT | December 5, 2019 | www.adv-res.com
Source: Advanced Resources International, 2019.
Pressure Profiles Primary Recovery and Cyclic CO2 Injection
19
Enhanced Recovery of Shale Oil: Eagle Ford Shale and Other Shale Basins
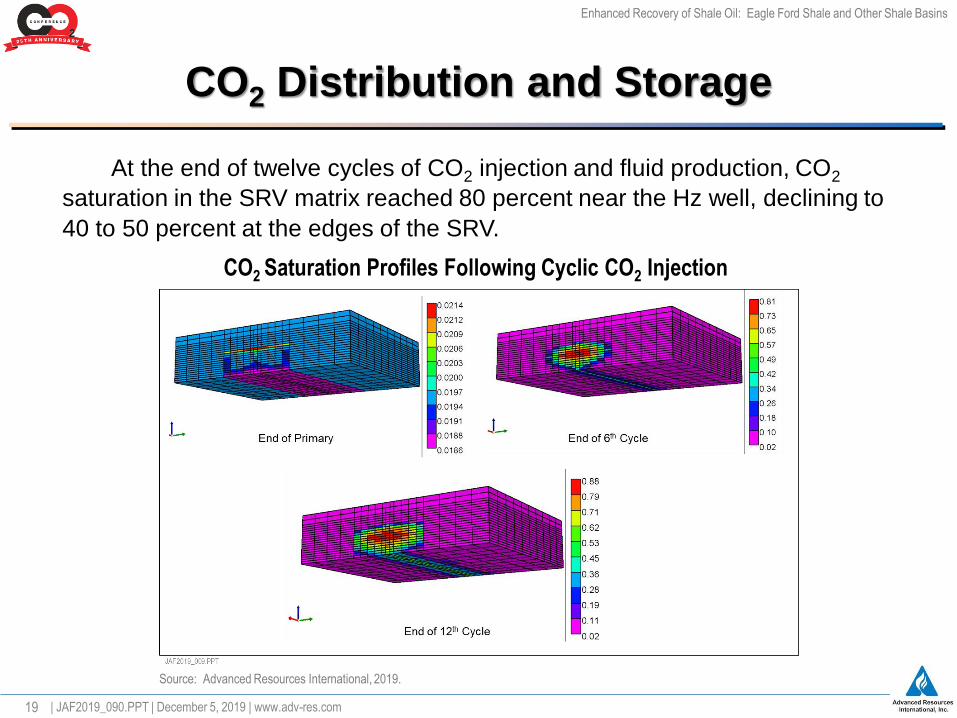
At the end of twelve cycles of CO2 injection and fluid production, CO2
saturation in the SRV matrix reached 80 percent near the Hz well, declining to
40 to 50 percent at the edges of the SRV.
CO2 Distribution and Storage
| JAF2019_090.PPT | December 5, 2019 | www.adv-res.com
Source: Advanced Resources International, 2019.
CO2 Saturation Profiles Following Cyclic CO2 Injection
20
Enhanced Recovery of Shale Oil: Eagle Ford Shale and Other Shale Basins
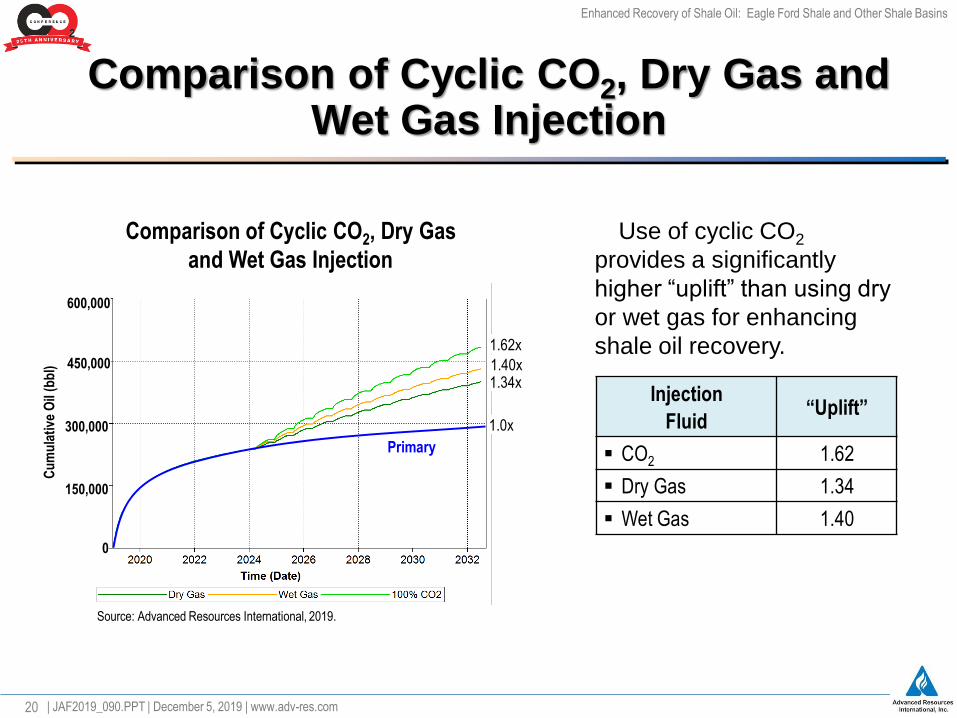
Comparison of Cyclic CO2, Dry Gas and Wet Gas Injection
Use of cyclic CO2
provides a significantly
higher “uplift” than using dry
or wet gas for enhancing
shale oil recovery.
Comparison of Cyclic CO2, Dry Gas
and Wet Gas Injection
Source: Advanced Resources International, 2019.
Injection
Fluid“Uplift”
▪ CO2 1.62
▪ Dry Gas 1.34
▪ Wet Gas 1.40
| JAF2019_090.PPT | December 5, 2019 | www.adv-res.com
600,000
450,000
300,000
150,000
Cu
mu
lati
ve O
il (b
bl)
Primary
0
1.62x
1.40x1.34x
1.0x
21
Enhanced Recovery of Shale Oil: Eagle Ford Shale and Other Shale Basins
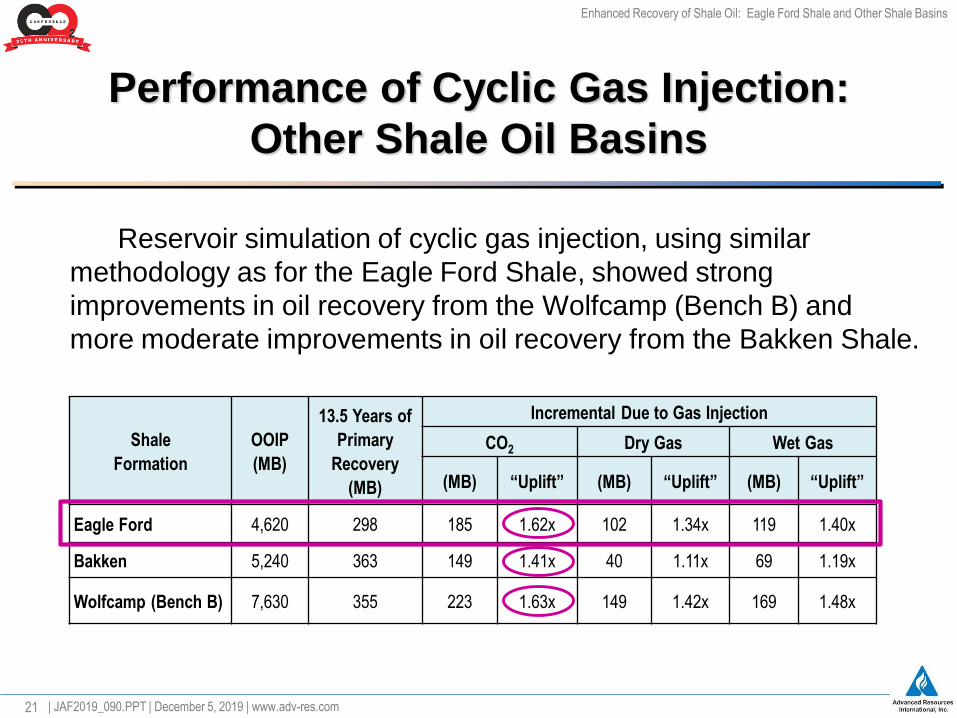
Reservoir simulation of cyclic gas injection, using similar
methodology as for the Eagle Ford Shale, showed strong
improvements in oil recovery from the Wolfcamp (Bench B) and
more moderate improvements in oil recovery from the Bakken Shale.
Shale
Formation
OOIP
(MB)
13.5 Years of
Primary
Recovery
(MB)
Incremental Due to Gas Injection
CO2 Dry Gas Wet Gas
(MB) “Uplift” (MB) “Uplift” (MB) “Uplift”
Eagle Ford 4,620 298 185 1.62x 10² 1.34x 119 1.40x
Bakken 5,240 363 149 1.41x 40 1.11x 69 1.19x
Wolfcamp (Bench B) 7,630 355 223 1.63x 149 1.42x 169 1.48x
Performance of Cyclic Gas Injection:
Other Shale Oil Basins
| JAF2019_090.PPT | December 5, 2019 | www.adv-res.com
22
Enhanced Recovery of Shale Oil: Eagle Ford Shale and Other Shale Basins
Closing Observations
▪ In geologically favorable settings, cyclic injection of gas can improve
shale oil recovery efficiency by 10% to 60% over primary recovery
efficiency depending on type of gas injection and shale formation.
▪ Cyclic injection of CO2 provides significantly more incremental oil
recovery compared to cyclic injection of dry or wet gas.
▪ Numerous oil recovery mechanisms are involved in cyclic gas injection,
including restoring pressure, viscosity reduction, oil swelling and
miscibility.
▪ However, the geologic setting and field development practices need to
be favorable for enabling cyclic injection of gas to achieve significant
pressure increases (above MMP for CO2) for effective oil recovery.
| JAF2019_090.PPT | December 5, 2019 | www.adv-res.com
Oil recovery efficiencies from shale oil formations are low (5%
to 9%) using primary (pressure depletion) practices, leaving
behind a large remaining oil in-place target for enhanced recovery.

23
Enhanced Recovery of Shale Oil: Eagle Ford Shale and Other Shale Basins
Advanced
Resources
Internationalwww.adv-res.com
| JAF2019_090.PPT | December 5, 2019 | www.adv-res.com
Office Locations
Washington, DC
4501 Fairfax Drive, Suite 910
Arlington, VA 22203
Phone: (703) 528-8420
Knoxville, TN
1210 Kenesaw Ave.
Suite 1210A
Knoxville, TN 37919-7736