eagle ford shale basin study april 19, 2019 doe/netl …
TRANSCRIPT
Eagle Ford Shale Basin Study
Preliminary – Do Not Cite or Quote INTERNAL USE ONLY – NOT APPROVED FOR PUBLIC RELEASE
April 19, 2019 DOE/NETL-YYYY/####
About the National Energy Technology Laboratory
The National Energy Technology Laboratory (NETL), part of the United States (U.S.) Department of Energy (DOE) national laboratory system, is owned and operated by DOE. NETL supports DOE’s mission to advance the energy security of the United States.
Disclaimer
This report was prepared as an account of work sponsored by an agency of the United States Government. Neither the United States Government nor any agency thereof, nor any of their employees, makes any warranty, express or implied, or assumes any legal liability or responsibility for the accuracy, completeness, or usefulness of any information, apparatus, product, or process disclosed, or represents that its use would not infringe privately owned rights. Reference therein to any specific commercial product, process, or service by trade name, trademark, manufacturer, or otherwise does not necessarily constitute or imply its endorsement, recommendation, or favoring by the United States Government or any agency thereof. The views and opinions of authors expressed therein do not necessarily state or reflect those of the United States Government or any agency thereof.
Printed in the United States of America
Available to DOE and DOE contractors from the Office of Scientific and Technical Information (OSTI):
U.S. Department of Energy Office of Scientific and Technical Information P.O. Box 62 Oak Ridge, TN 37831-0062 www.osti.gov Phone: (865) 576-8401 Fax: (865) 576-5728 Email: [email protected]
Available to the public from the National Technical Information Service (NTIS):
U.S. Department of Commerce National Technical Information Service 5301 Shawnee Road Alexandria, VA 22312 www.ntis.gov Phone: (800) 553-NTIS (6847) or (703) 605-6000 Fax: (703) 605-6900 Email: [email protected]
DRAFT - Eagle Ford Shale Basin Study
INTERNAL USE ONLY – NOT APPROVED FOR PUBLIC RELEASE
Author List: Advanced Resources International (ARI)
Vello A. Kuuskraa President
This report was prepared by MESA for the U.S. DOE NETL. This work was completed under DOE NETL Contract Number DE-FE0025912. This work was performed under MESA Study Activity: 0025192.01.2110.104.006.
The authors wish to acknowledge the excellent guidance, contributions, and cooperation of the NETL staff, particularly:
Jared Ciferno, NETL Technical Monitor
Elena Melchert, Joseph Renk
DOE Contract Number DE-FE0025912

DRAFT - Eagle Ford Shale Basin Study
INTERNAL USE ONLY – NOT APPROVED FOR PUBLIC RELEASE
This page intentionally left blank.

DRAFT - Eagle Ford Shale Basin Study
i INTERNAL USE ONLY – NOT APPROVED FOR PUBLIC RELEASE
TABLE OF CONTENTS List of Exhibits ............................................................................................................................... iii
Acronyms and Abbreviations ................................................................................................... iv
1 Introduction .......................................................................................................................... 1
2 Development Activity ......................................................................................................... 2
3 Geologic Setting .................................................................................................................. 3
3.1 Stratigraphic Column ................................................................................................... 3
3.2 Shale Interval ................................................................................................................ 4
3.3 Deposition ..................................................................................................................... 5
3.4 Shale Depth .................................................................................................................. 6
3.5 Hydrocarbon Windows ................................................................................................ 7
3.6 Oil Dominant Area ....................................................................................................... 8
3.7 Shale Mineralogy .......................................................................................................... 9
3.8 Structural Setting .......................................................................................................... 9
3.9 Thermal Maturity ......................................................................................................... 10
4 Reservoir Properties ........................................................................................................... 12
4.1 Shale Isopach ............................................................................................................. 12
4.2 Reservoir Porosity ........................................................................................................ 17
4.3 Oil and Water Saturation ........................................................................................... 17
4.4 Producing Gas-Oil Ratio ............................................................................................ 17
4.5 Oil Gravity .................................................................................................................... 17
4.6 Oil Composition .......................................................................................................... 20
4.7 Matrix Permeability ..................................................................................................... 21
4.8 Reservoir Temperature ............................................................................................... 21
4.9 Reservoir Pressure ....................................................................................................... 21
5 Estimates of Original Oil In-Place (OOIP) ........................................................................ 22
5.1 Challenges in Estimating Original Oil In-Place ........................................................ 22
5.2 Sources of Information for OOIP Resource Estimate .............................................. 22
5.3 Assessment Methodology ........................................................................................... 2
5.4 Eastern Shale Area ....................................................................................................... 3
5.5 Central Shale Area ....................................................................................................... 7
5.6 Western Shale Area .................................................................................................... 12
DRAFT - Eagle Ford Shale Basin Study
ii INTERNAL USE ONLY – NOT APPROVED FOR PUBLIC RELEASE
5.7 Total Eagle Ford Shale Area ...................................................................................... 15
6 References ......................................................................................................................... 17
DRAFT - Eagle Ford Shale Basin Study
iii INTERNAL USE ONLY – NOT APPROVED FOR PUBLIC RELEASE
LIST OF EXHIBITS Exhibit 1-1 Eagle Ford Shale Location Map ............................................................................. 1 Exhibit 2-1 Eagle Ford Shale Hz Well Completions, 2011- 2018............................................... 2 Exhibit 3-1 Eagle Ford Shale Stratigraphic Column ................................................................. 3 Exhibit 3-2 Upper, Middle and Lower Units of the Eagle Ford Shale ...................................... 4 Exhibit 3-3 Depositional Platform and Slope of South-Central Texas .................................... 5 Exhibit 3-4 Eagle Ford Shale Depth ........................................................................................... 6 Exhibit 3-5 Eagle Ford Shale Hydrocarbon “Windows” ........................................................... 7 Exhibit 3-6 Eagle Ford Shale Oil Dominant Area ...................................................................... 8 Exhibit 3-7 Eagle Ford Shale Mineralogy .................................................................................. 9 Exhibit 3-8 Karnes Trough Area of the Eagle Ford Shale ......................................................... 9 Exhibit 3-9 Eagle Ford Shale Thermal Maturity ....................................................................... 10 Exhibit 4-1 Eagle Ford Shale Lower Unit Isopach .................................................................. 12 Exhibit 4-2 Lower Eagle Ford Shale Isopach,Hawkville Trough ............................................. 13 Exhibit 4-3 Wycross Unit Well Log ............................................................................................. 13 Exhibit 4-4 Location of Eagle Ford Shale SW to NE Cross-Section ....................................... 15 Exhibit 4-5 Three Well Eagle Ford Shale SW to NE Cross-Section.......................................... 16 Exhibit 4-6 Eagle Ford Shale Producing Gas-Oil Ratios ......................................................... 18 Exhibit 4-7 Eagle Ford Shale API Gravity ................................................................................. 19 Exhibit 4-8 Eagle Ford Shale PVT and Oil Composition Data ............................................... 20 Exhibit 4-9 Relationship of Matrix Permeability to Gas Filled Porosity .................................. 21 Exhibit 5-1 Hydrocarbon Windows of the Eastern Eagle Ford Shale Area ............................ 3 Exhibit 5-2 Depth Map for the Eastern Eagle Ford Shale Area .............................................. 4 Exhibit 5-3 Type Log for the Eastern Area Eagle Ford Shale ................................................... 5 Exhibit 5-4 Eastern Area Reservoir Properties Used for Estimating OOIP for the Lower Unit of the Eagle Ford Shale .............................................................................................................. 6 Exhibit 5-5 OOIP of Lower Shale Unit, Eastern Eagle Ford Shale Area ................................... 6 Exhibit 5-6 Hydrocarbon Windows of the Central Eagle Ford Shale Area ............................ 7 Exhibit 5-7 Depth Map for Central Eagle Ford Shale Area ..................................................... 8 Exhibit 5-8 Sanchez Energy Wycross Well, Northern McMullen County ............................... 9 Exhibit 5-9 API Gravity for Central and Western Eagle Ford Shale ...................................... 10 Exhibit 5-10 Central Area Reservoir Properties Used for Estimating OOIP for the Lower Unit of the Eagle Ford Shale ............................................................................................................ 11 Exhibit 5-11 OOIP of Lower Shale Units, Central Eagle Ford Shale Area ............................. 11 Exhibit 5-12 Hydrocarbon Windows of Western Eagle Ford Shale Area ............................ 12 Exhibit 5-13 Depth Map for Western Eagle Ford Shale Area ................................................ 13 Exhibit 5-14 Western Catarina Well Log, Western Dimmit County ....................................... 14 Exhibit 5-15 Western Area Reservoir Properties Used for Estimating OOIP for the Lower Unit of the Eagle Ford Shale .................................................................................................... 15 Exhibit 5-16 OOIP of Lower Shale Unit, Western Eagle Ford Shale Area ............................ 15 Exhibit 5-17 Summary OOIP of the Eagle Ford Shale Area ................................................... 16
DRAFT - Eagle Ford Shale Basin Study
iv INTERNAL USE ONLY – NOT APPROVED FOR PUBLIC RELEASE
ACRONYMS AND ABBREVIATIONS
API American Petroleum Institute ARI Advanced Resources International B Barrel bbl Barrel BOE Barrel of oil equivalent BOED Barrels of Oil Equivalent per Day bpd Barrels per day CCS Carbon capture and sequestration CO2 Carbon dioxide D&C Drilling and Completion DOE Department of Energy EIA Energy Information Administration EOR Enhanced oil recovery EPA Environmental Protection Agency EUR Estimated ultimate recovery FE Fossil energy ft Foot, Feet GOR Gas-oil ratio Hz Horizontal IOR Improved oil recovery MBbl Thousand barrels MBOED Thousand Barrels Oil Equivalent per Day Mcf Thousand cubic feet MESA Mission Execution and Strategic Analysis MM Million MMB/D Million barrels per day MMcfd Million Cubic Feet per Day MMscf Million standard cubic feet MMscfd Million standard cubic feet per day N2 Nitrogen NETL National Energy Technology Laboratory NGL Natural gas liquids O&M Operation and maintenance OOIP Original oil in-place psi Pounds per square inch R&D Research and development RB/STB Reservoir barrels/stock tank barrels Ro Vitrinite reflectance TOC Total Organic Carbon U.S. United States °C Degrees Celsius °F Degrees Fahrenheit

DRAFT - Eagle Ford Shale Basin Study
v INTERNAL USE ONLY – NOT APPROVED FOR PUBLIC RELEASE
This page intentionally left blank.
DRAFT - Eagle Ford Shale Basin Study
1 INTERNAL USE ONLY – NOT APPROVED FOR PUBLIC RELEASE – DRAFT April 19, 2019
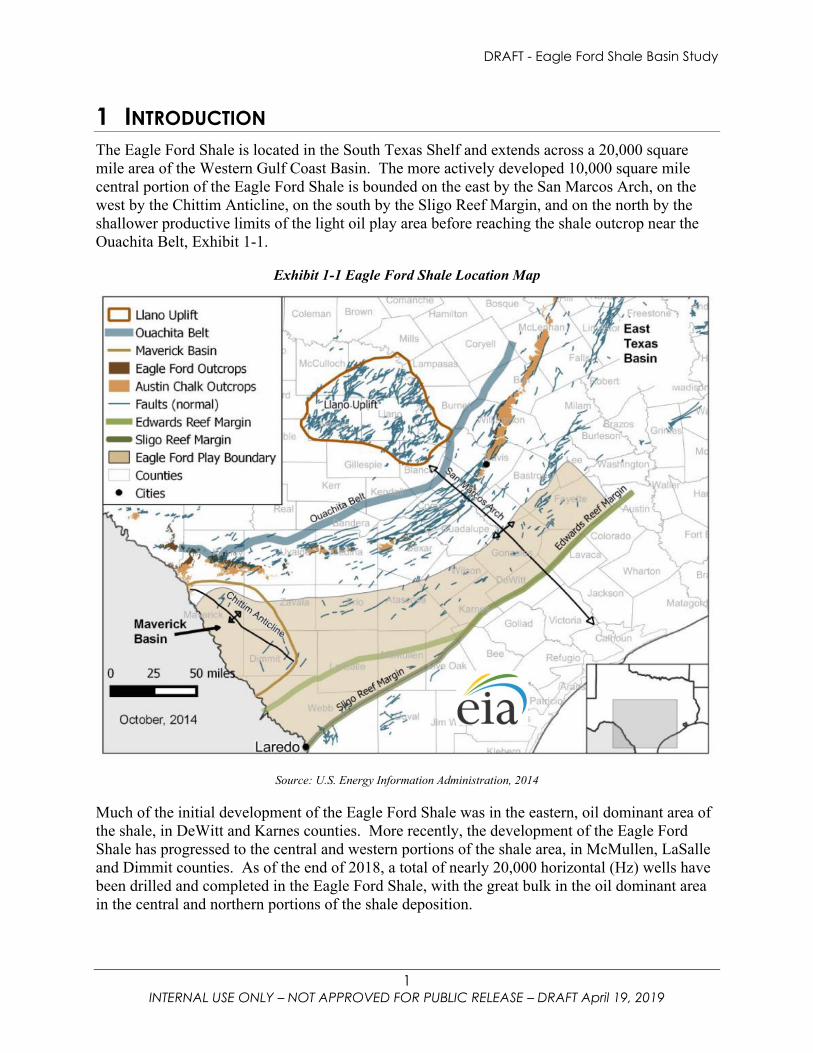
1 INTRODUCTION The Eagle Ford Shale is located in the South Texas Shelf and extends across a 20,000 square mile area of the Western Gulf Coast Basin. The more actively developed 10,000 square mile central portion of the Eagle Ford Shale is bounded on the east by the San Marcos Arch, on the west by the Chittim Anticline, on the south by the Sligo Reef Margin, and on the north by the shallower productive limits of the light oil play area before reaching the shale outcrop near the Ouachita Belt, Exhibit 1-1.
Exhibit 1-1 Eagle Ford Shale Location Map
Source: U.S. Energy Information Administration, 2014
Much of the initial development of the Eagle Ford Shale was in the eastern, oil dominant area of the shale, in DeWitt and Karnes counties. More recently, the development of the Eagle Ford Shale has progressed to the central and western portions of the shale area, in McMullen, LaSalle and Dimmit counties. As of the end of 2018, a total of nearly 20,000 horizontal (Hz) wells have been drilled and completed in the Eagle Ford Shale, with the great bulk in the oil dominant area in the central and northern portions of the shale deposition.
DRAFT - Eagle Ford Shale Basin Study
2 INTERNAL USE ONLY – NOT APPROVED FOR PUBLIC RELEASE – DRAFT April 19, 2019
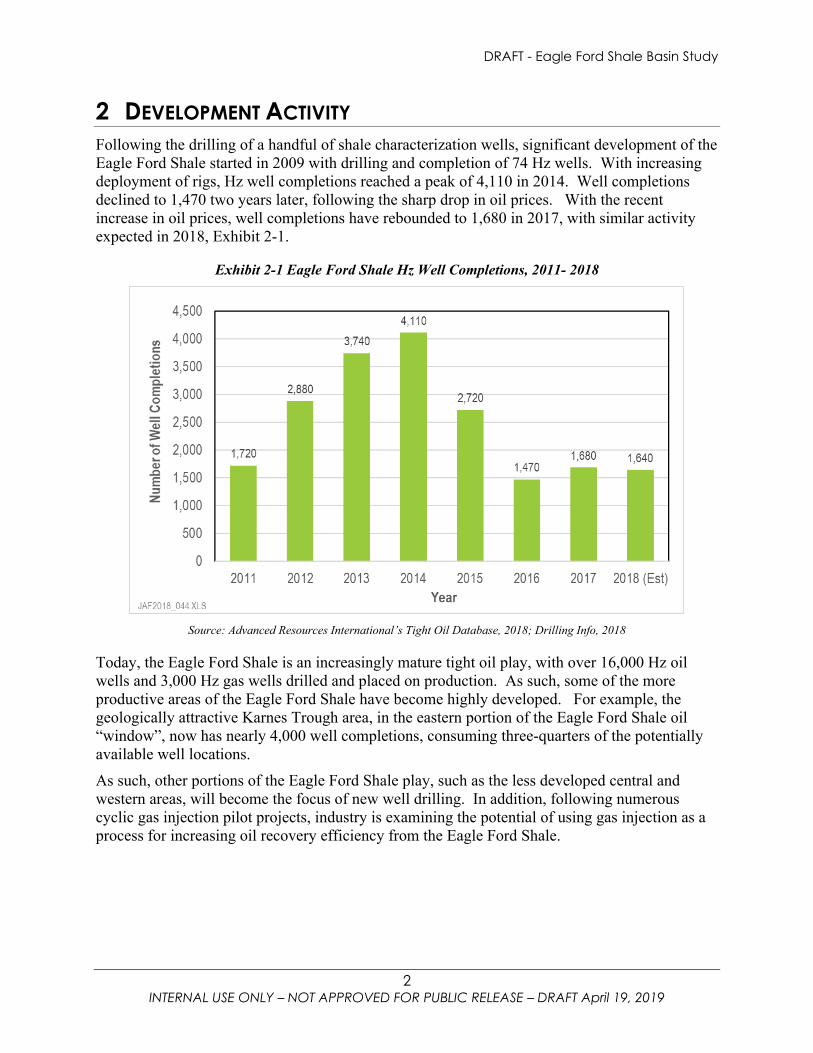
2 DEVELOPMENT ACTIVITY Following the drilling of a handful of shale characterization wells, significant development of the Eagle Ford Shale started in 2009 with drilling and completion of 74 Hz wells. With increasing deployment of rigs, Hz well completions reached a peak of 4,110 in 2014. Well completions declined to 1,470 two years later, following the sharp drop in oil prices. With the recent increase in oil prices, well completions have rebounded to 1,680 in 2017, with similar activity expected in 2018, Exhibit 2-1.
Exhibit 2-1 Eagle Ford Shale Hz Well Completions, 2011- 2018
Source: Advanced Resources International’s Tight Oil Database, 2018; Drilling Info, 2018
Today, the Eagle Ford Shale is an increasingly mature tight oil play, with over 16,000 Hz oil wells and 3,000 Hz gas wells drilled and placed on production. As such, some of the more productive areas of the Eagle Ford Shale have become highly developed. For example, the geologically attractive Karnes Trough area, in the eastern portion of the Eagle Ford Shale oil “window”, now has nearly 4,000 well completions, consuming three-quarters of the potentially available well locations. As such, other portions of the Eagle Ford Shale play, such as the less developed central and western areas, will become the focus of new well drilling. In addition, following numerous cyclic gas injection pilot projects, industry is examining the potential of using gas injection as a process for increasing oil recovery efficiency from the Eagle Ford Shale.
DRAFT - Eagle Ford Shale Basin Study
3 INTERNAL USE ONLY – NOT APPROVED FOR PUBLIC RELEASE – DRAFT April 19, 2019
3 GEOLOGIC SETTING
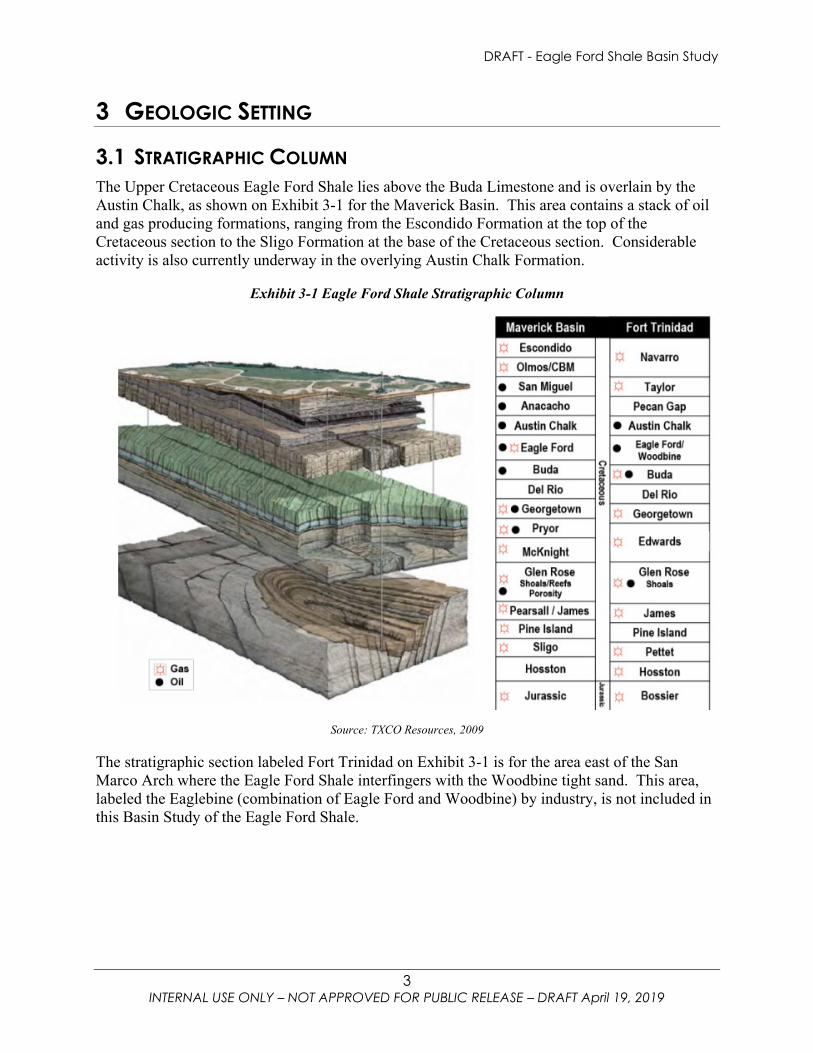
3.1 STRATIGRAPHIC COLUMN The Upper Cretaceous Eagle Ford Shale lies above the Buda Limestone and is overlain by the Austin Chalk, as shown on Exhibit 3-1 for the Maverick Basin. This area contains a stack of oil and gas producing formations, ranging from the Escondido Formation at the top of the Cretaceous section to the Sligo Formation at the base of the Cretaceous section. Considerable activity is also currently underway in the overlying Austin Chalk Formation.
Exhibit 3-1 Eagle Ford Shale Stratigraphic Column
Source: TXCO Resources, 2009
The stratigraphic section labeled Fort Trinidad on Exhibit 3-1 is for the area east of the San Marco Arch where the Eagle Ford Shale interfingers with the Woodbine tight sand. This area, labeled the Eaglebine (combination of Eagle Ford and Woodbine) by industry, is not included in this Basin Study of the Eagle Ford Shale.
DRAFT - Eagle Ford Shale Basin Study
4 INTERNAL USE ONLY – NOT APPROVED FOR PUBLIC RELEASE – DRAFT April 19, 2019
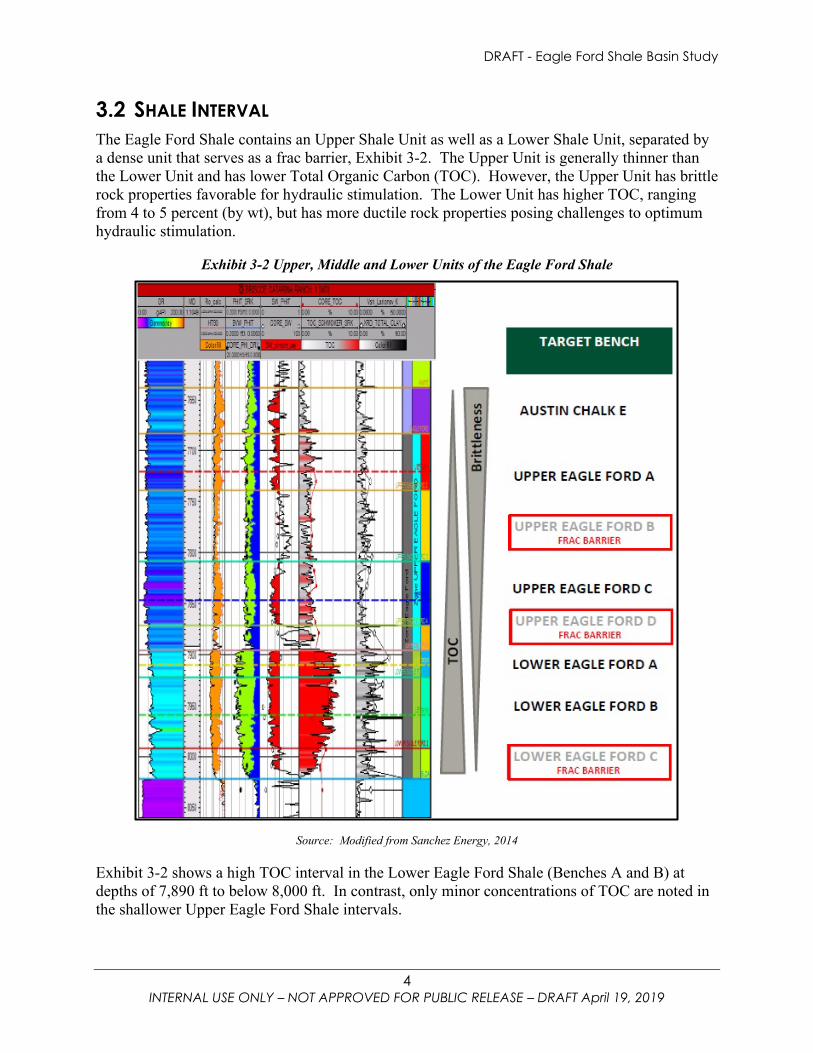
3.2 SHALE INTERVAL The Eagle Ford Shale contains an Upper Shale Unit as well as a Lower Shale Unit, separated by a dense unit that serves as a frac barrier, Exhibit 3-2. The Upper Unit is generally thinner than the Lower Unit and has lower Total Organic Carbon (TOC). However, the Upper Unit has brittle rock properties favorable for hydraulic stimulation. The Lower Unit has higher TOC, ranging from 4 to 5 percent (by wt), but has more ductile rock properties posing challenges to optimum hydraulic stimulation.
Exhibit 3-2 Upper, Middle and Lower Units of the Eagle Ford Shale
Source: Modified from Sanchez Energy, 2014
Exhibit 3-2 shows a high TOC interval in the Lower Eagle Ford Shale (Benches A and B) at depths of 7,890 ft to below 8,000 ft. In contrast, only minor concentrations of TOC are noted in the shallower Upper Eagle Ford Shale intervals.
DRAFT - Eagle Ford Shale Basin Study
5 INTERNAL USE ONLY – NOT APPROVED FOR PUBLIC RELEASE – DRAFT April 19, 2019
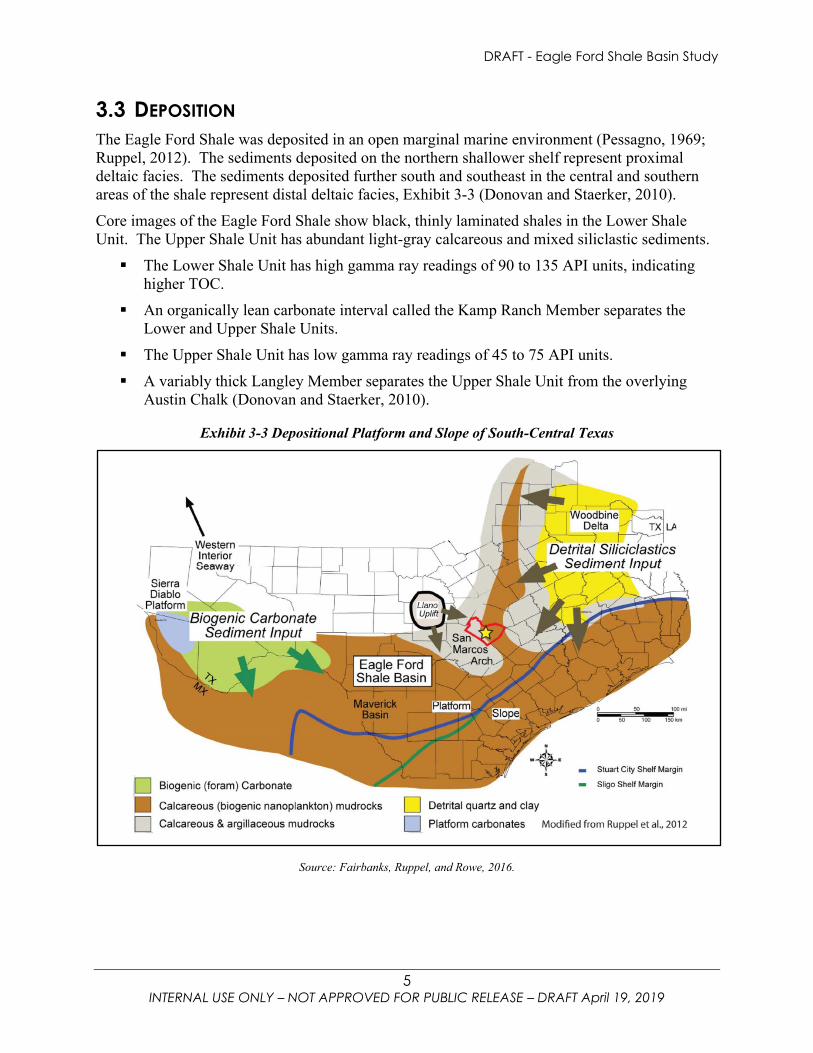
3.3 DEPOSITION The Eagle Ford Shale was deposited in an open marginal marine environment (Pessagno, 1969; Ruppel, 2012). The sediments deposited on the northern shallower shelf represent proximal deltaic facies. The sediments deposited further south and southeast in the central and southern areas of the shale represent distal deltaic facies, Exhibit 3-3 (Donovan and Staerker, 2010). Core images of the Eagle Ford Shale show black, thinly laminated shales in the Lower Shale Unit. The Upper Shale Unit has abundant light-gray calcareous and mixed siliclastic sediments. The Lower Shale Unit has high gamma ray readings of 90 to 135 API units, indicating
higher TOC. An organically lean carbonate interval called the Kamp Ranch Member separates the
Lower and Upper Shale Units. The Upper Shale Unit has low gamma ray readings of 45 to 75 API units. A variably thick Langley Member separates the Upper Shale Unit from the overlying
Austin Chalk (Donovan and Staerker, 2010).
Exhibit 3-3 Depositional Platform and Slope of South-Central Texas
Source: Fairbanks, Ruppel, and Rowe, 2016.
DRAFT - Eagle Ford Shale Basin Study
6 INTERNAL USE ONLY – NOT APPROVED FOR PUBLIC RELEASE – DRAFT April 19, 2019
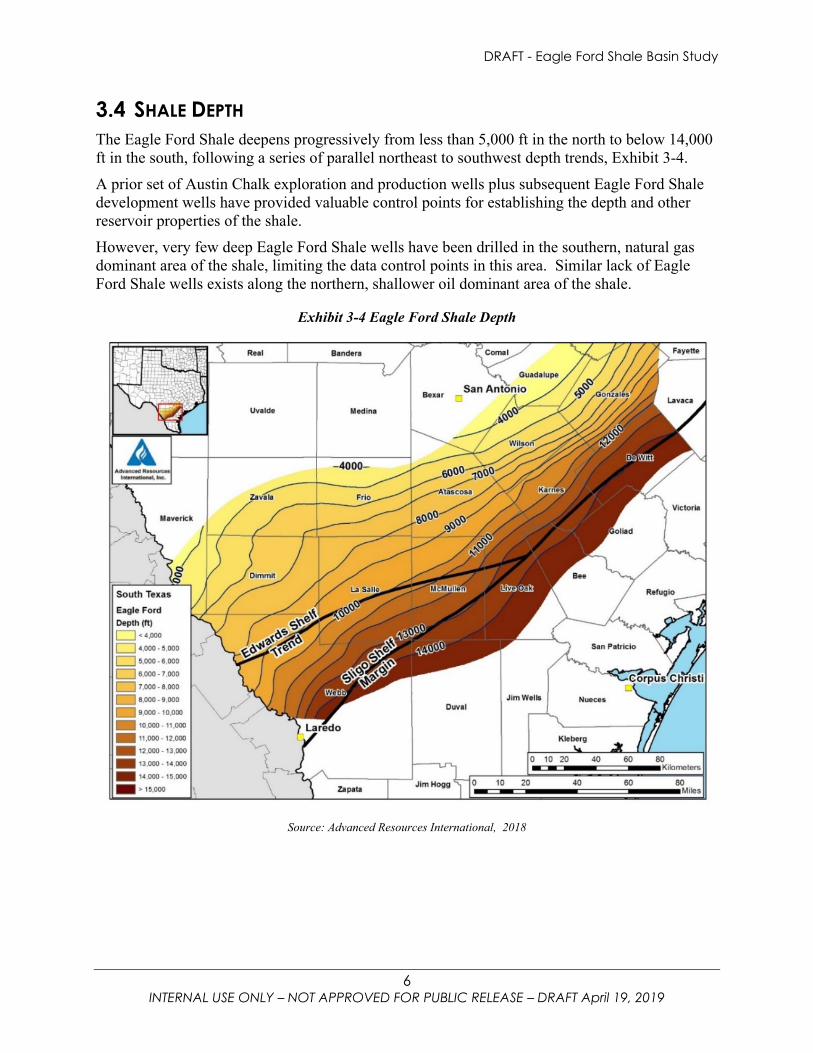
3.4 SHALE DEPTH The Eagle Ford Shale deepens progressively from less than 5,000 ft in the north to below 14,000 ft in the south, following a series of parallel northeast to southwest depth trends, Exhibit 3-4. A prior set of Austin Chalk exploration and production wells plus subsequent Eagle Ford Shale development wells have provided valuable control points for establishing the depth and other reservoir properties of the shale. However, very few deep Eagle Ford Shale wells have been drilled in the southern, natural gas dominant area of the shale, limiting the data control points in this area. Similar lack of Eagle Ford Shale wells exists along the northern, shallower oil dominant area of the shale.
Exhibit 3-4 Eagle Ford Shale Depth
Source: Advanced Resources International, 2018
DRAFT - Eagle Ford Shale Basin Study
7 INTERNAL USE ONLY – NOT APPROVED FOR PUBLIC RELEASE – DRAFT April 19, 2019
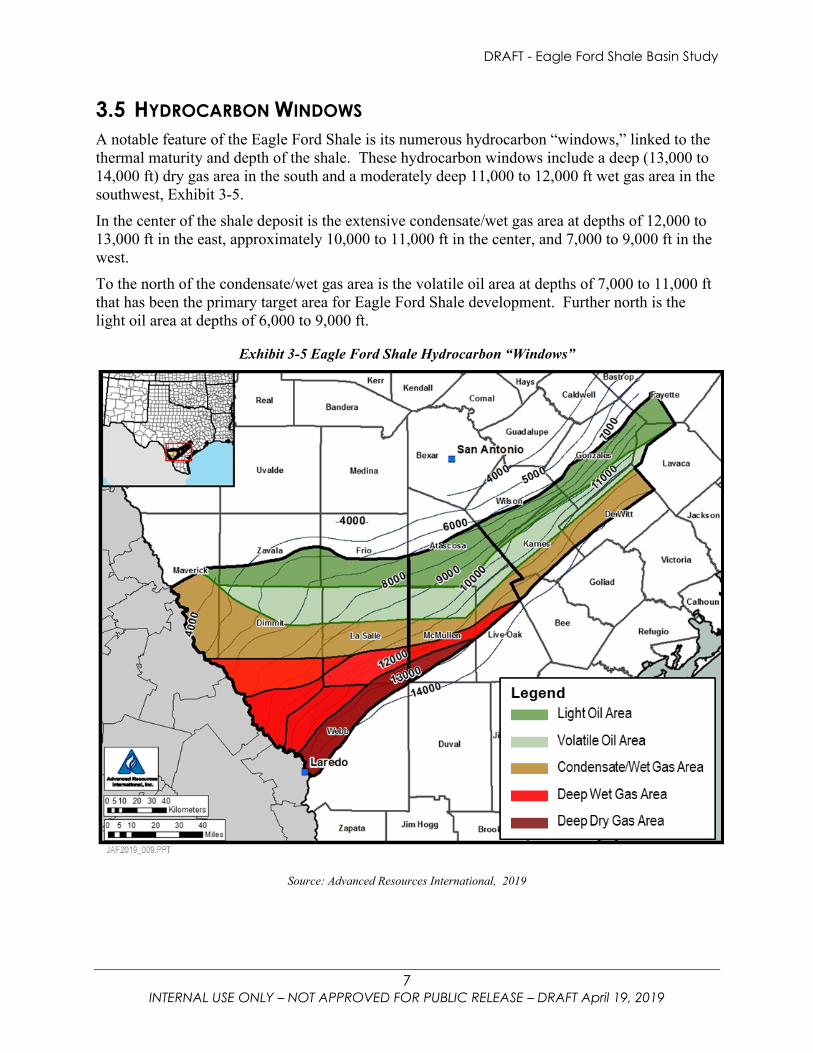
3.5 HYDROCARBON WINDOWS A notable feature of the Eagle Ford Shale is its numerous hydrocarbon “windows,” linked to the thermal maturity and depth of the shale. These hydrocarbon windows include a deep (13,000 to 14,000 ft) dry gas area in the south and a moderately deep 11,000 to 12,000 ft wet gas area in the southwest, Exhibit 3-5. In the center of the shale deposit is the extensive condensate/wet gas area at depths of 12,000 to 13,000 ft in the east, approximately 10,000 to 11,000 ft in the center, and 7,000 to 9,000 ft in the west. To the north of the condensate/wet gas area is the volatile oil area at depths of 7,000 to 11,000 ft that has been the primary target area for Eagle Ford Shale development. Further north is the light oil area at depths of 6,000 to 9,000 ft.
Exhibit 3-5 Eagle Ford Shale Hydrocarbon “Windows”
Source: Advanced Resources International, 2019

DRAFT - Eagle Ford Shale Basin Study
8 INTERNAL USE ONLY – NOT APPROVED FOR PUBLIC RELEASE – DRAFT April 19, 2019
3.6 OIL DOMINANT AREA Exhibit 3-6 shows the location of the oil dominant portion of the Eagle Ford Shale, including the condensate/wet gas, volatile oil and light oil areas in the northern and eastern portions of the shale. These three oil dominant shale hydrocarbon windows extend from Maverick County on the west to Fayette County on the east. Along with production of oil and condensate, the oil dominant areas of the Eagle Ford Shale produce significant volumes of wet associated gas. The natural gas dominant portion of the Eagle Ford Shale, consisting of wet and dry gas areas, exists in the southwestern portion of the shale, primarily in southern LaSalle and McMullen counties and in Webb county. The natural gas dominant portions of the Eagle Ford Shale also provide modest by-product volumes of condensate production.
Exhibit 3-6 Eagle Ford Shale Oil Dominant Area
Source: Advanced Resources International, 2018
DRAFT - Eagle Ford Shale Basin Study
9 INTERNAL USE ONLY – NOT APPROVED FOR PUBLIC RELEASE – DRAFT April 19, 2019
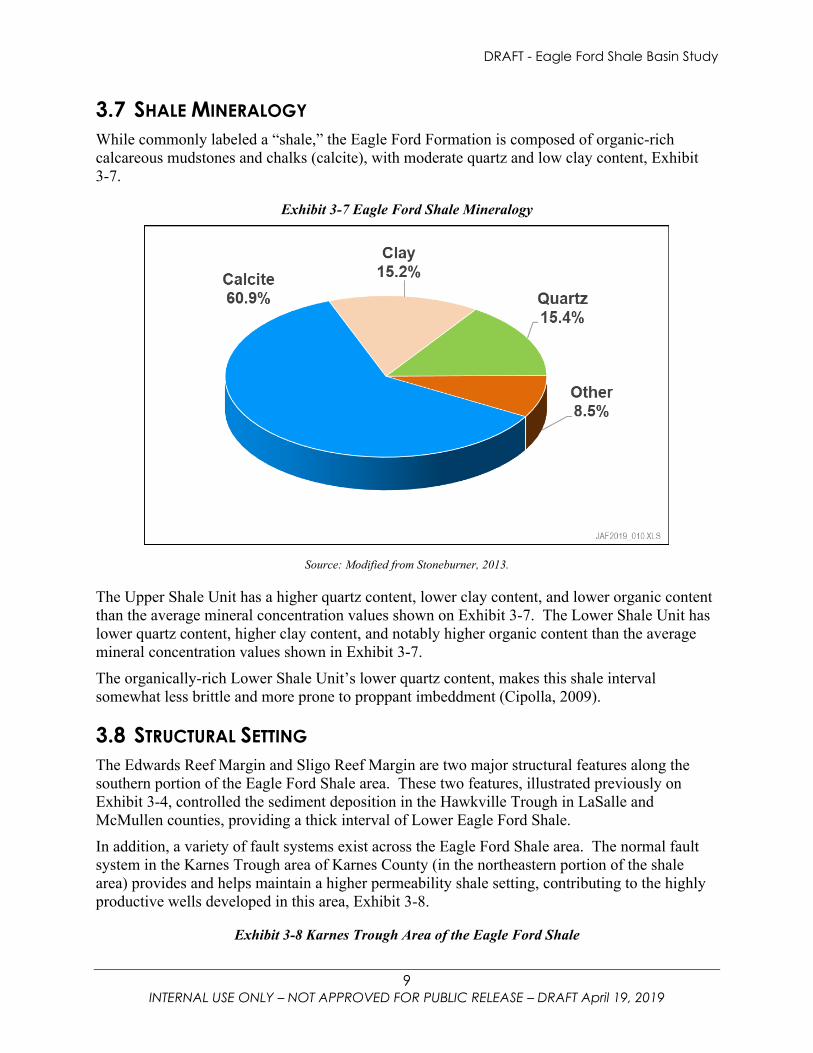
3.7 SHALE MINERALOGY While commonly labeled a “shale,” the Eagle Ford Formation is composed of organic-rich calcareous mudstones and chalks (calcite), with moderate quartz and low clay content, Exhibit 3-7.
Exhibit 3-7 Eagle Ford Shale Mineralogy
Source: Modified from Stoneburner, 2013.
The Upper Shale Unit has a higher quartz content, lower clay content, and lower organic content than the average mineral concentration values shown on Exhibit 3-7. The Lower Shale Unit has lower quartz content, higher clay content, and notably higher organic content than the average mineral concentration values shown in Exhibit 3-7. The organically-rich Lower Shale Unit’s lower quartz content, makes this shale interval somewhat less brittle and more prone to proppant imbeddment (Cipolla, 2009).
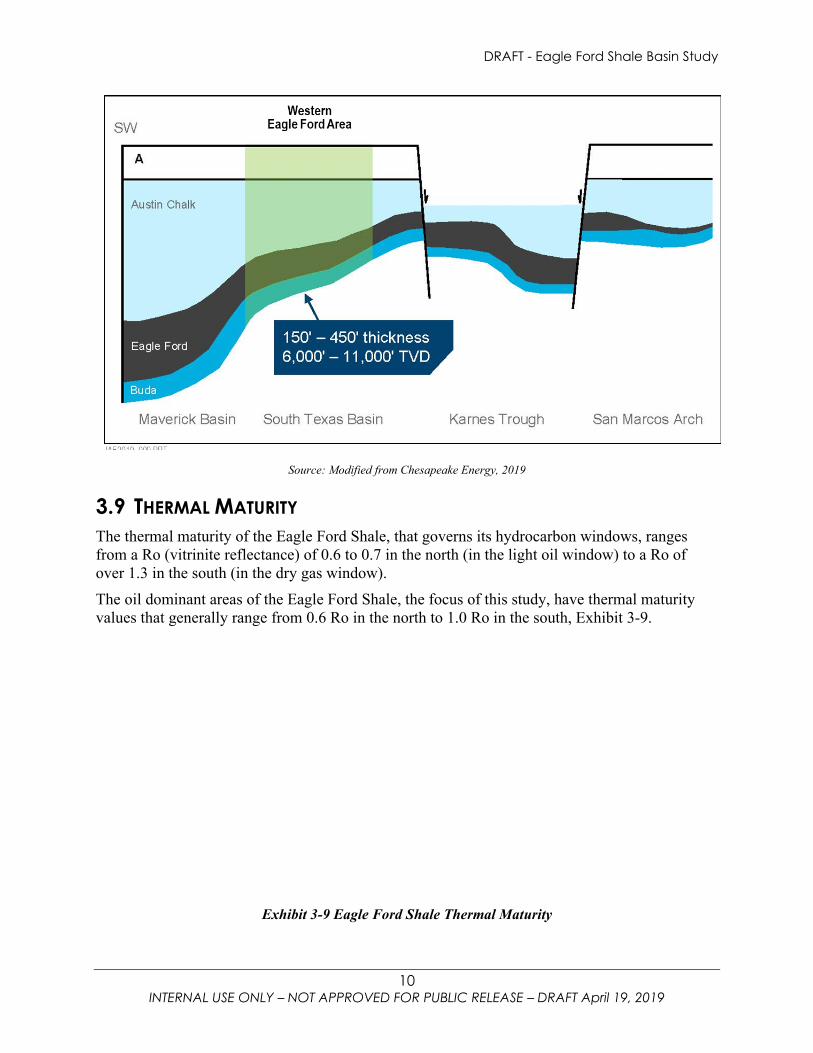
3.8 STRUCTURAL SETTING The Edwards Reef Margin and Sligo Reef Margin are two major structural features along the southern portion of the Eagle Ford Shale area. These two features, illustrated previously on Exhibit 3-4, controlled the sediment deposition in the Hawkville Trough in LaSalle and McMullen counties, providing a thick interval of Lower Eagle Ford Shale. In addition, a variety of fault systems exist across the Eagle Ford Shale area. The normal fault system in the Karnes Trough area of Karnes County (in the northeastern portion of the shale area) provides and helps maintain a higher permeability shale setting, contributing to the highly productive wells developed in this area, Exhibit 3-8.
Exhibit 3-8 Karnes Trough Area of the Eagle Ford Shale
DRAFT - Eagle Ford Shale Basin Study
10 INTERNAL USE ONLY – NOT APPROVED FOR PUBLIC RELEASE – DRAFT April 19, 2019
Source: Modified from Chesapeake Energy, 2019
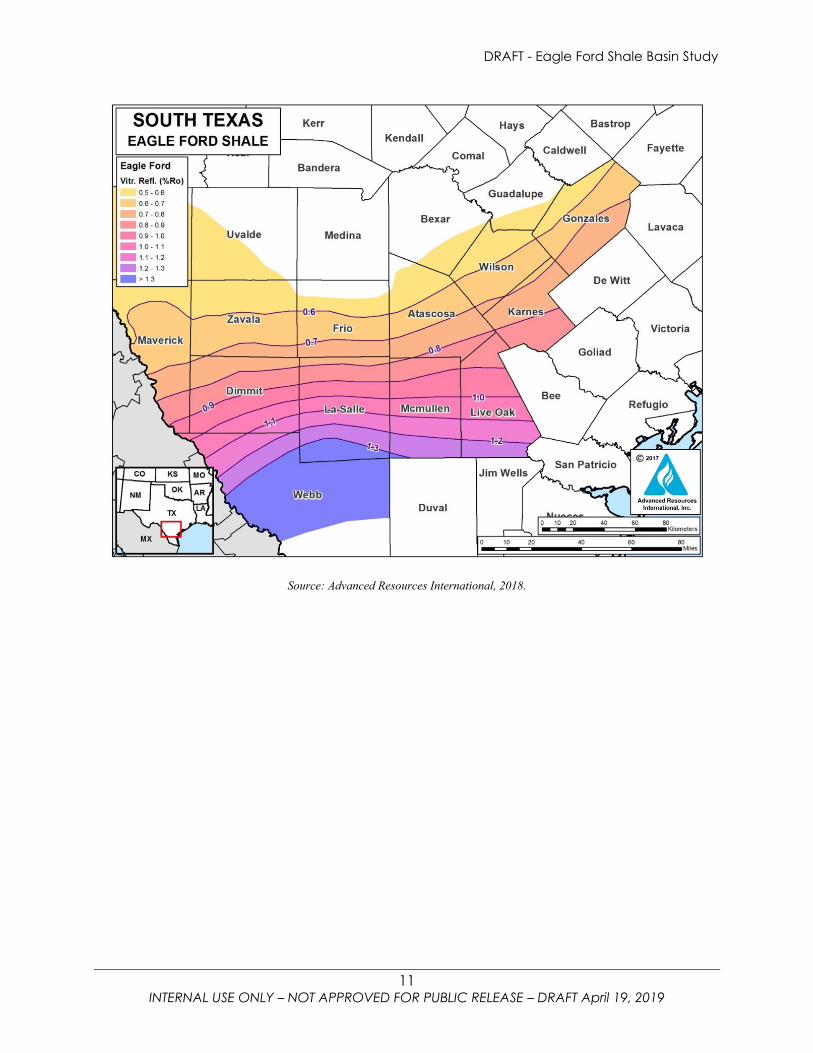
3.9 THERMAL MATURITY The thermal maturity of the Eagle Ford Shale, that governs its hydrocarbon windows, ranges from a Ro (vitrinite reflectance) of 0.6 to 0.7 in the north (in the light oil window) to a Ro of over 1.3 in the south (in the dry gas window). The oil dominant areas of the Eagle Ford Shale, the focus of this study, have thermal maturity values that generally range from 0.6 Ro in the north to 1.0 Ro in the south, Exhibit 3-9.
Exhibit 3-9 Eagle Ford Shale Thermal Maturity
DRAFT - Eagle Ford Shale Basin Study
11 INTERNAL USE ONLY – NOT APPROVED FOR PUBLIC RELEASE – DRAFT April 19, 2019
Source: Advanced Resources International, 2018.
DRAFT - Eagle Ford Shale Basin Study
12 INTERNAL USE ONLY – NOT APPROVED FOR PUBLIC RELEASE – DRAFT April 19, 2019
4 RESERVOIR PROPERTIES The reservoir properties of the Eagle Ford Shale vary greatly, both vertically within the Eagle Ford Shale interval and horizontally across the large shale deposition area. To capture the key reservoir property values and their distribution, we have assembled published data on the Eagle Ford Shale from a variety of sources as well as performed some of the data assembly, interpretation and mapping ourselves. The information on reservoir properties will concentrate on the Lower Shale Unit, the primary development target of the Eagle Ford Shale.
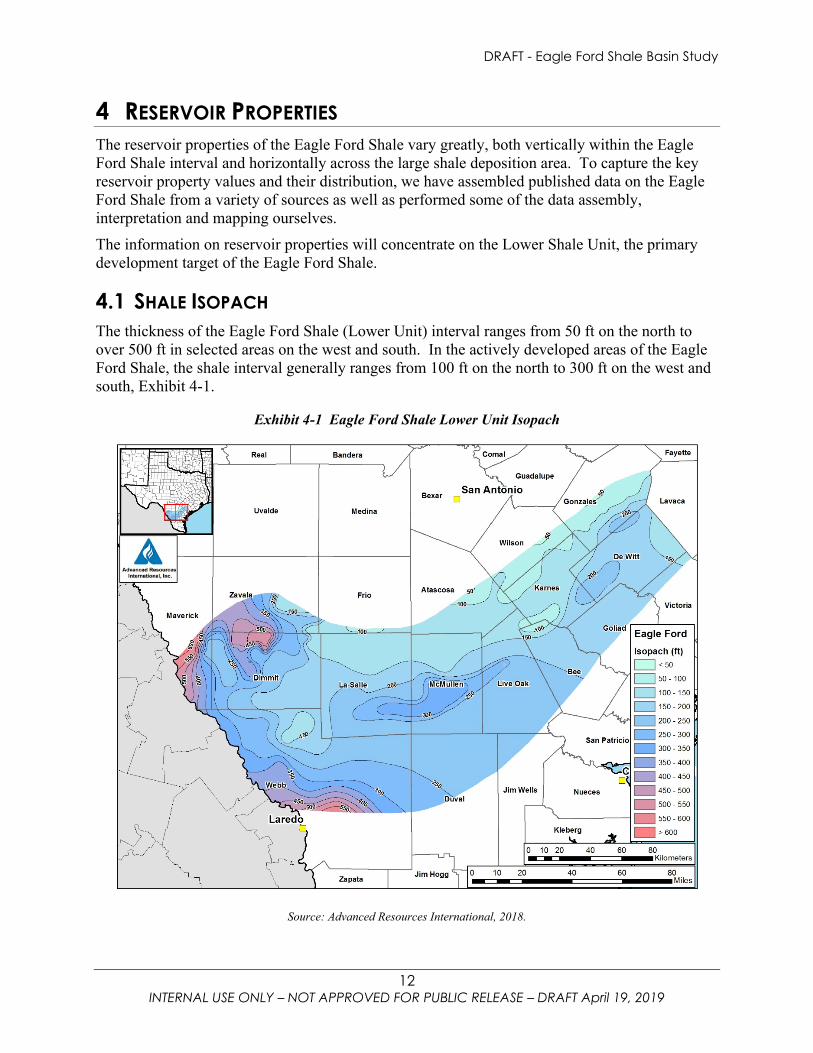
4.1 SHALE ISOPACH The thickness of the Eagle Ford Shale (Lower Unit) interval ranges from 50 ft on the north to over 500 ft in selected areas on the west and south. In the actively developed areas of the Eagle Ford Shale, the shale interval generally ranges from 100 ft on the north to 300 ft on the west and south, Exhibit 4-1.
Exhibit 4-1 Eagle Ford Shale Lower Unit Isopach
Source: Advanced Resources International, 2018.
DRAFT - Eagle Ford Shale Basin Study
13 INTERNAL USE ONLY – NOT APPROVED FOR PUBLIC RELEASE – DRAFT April 19, 2019
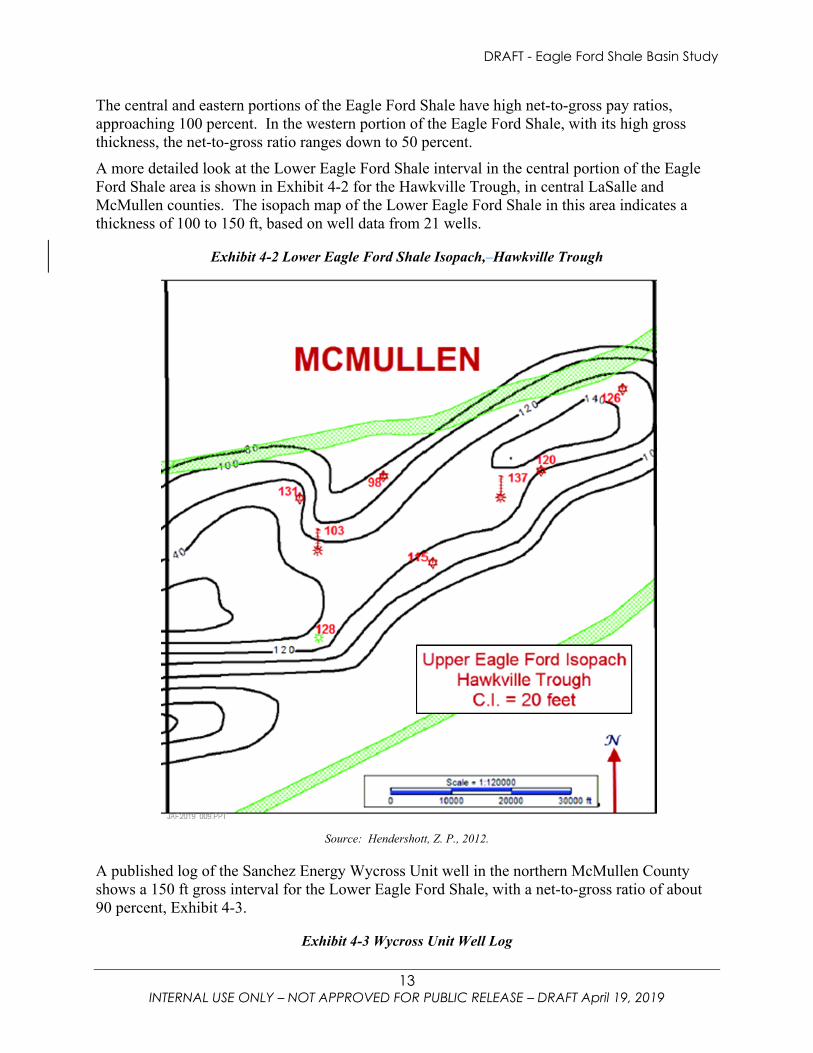
The central and eastern portions of the Eagle Ford Shale have high net-to-gross pay ratios, approaching 100 percent. In the western portion of the Eagle Ford Shale, with its high gross thickness, the net-to-gross ratio ranges down to 50 percent. A more detailed look at the Lower Eagle Ford Shale interval in the central portion of the Eagle Ford Shale area is shown in Exhibit 4-2 for the Hawkville Trough, in central LaSalle and McMullen counties. The isopach map of the Lower Eagle Ford Shale in this area indicates a thickness of 100 to 150 ft, based on well data from 21 wells.
Exhibit 4-2 Lower Eagle Ford Shale Isopach, Hawkville Trough
Source: Hendershott, Z. P., 2012.
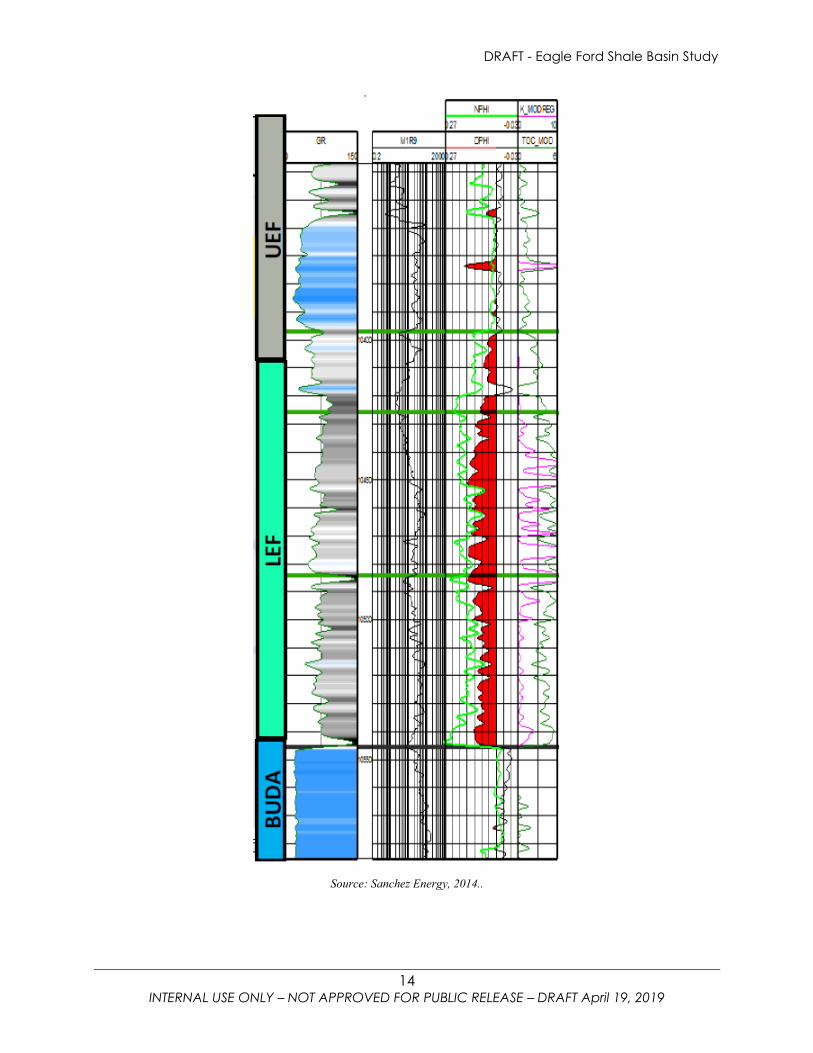
A published log of the Sanchez Energy Wycross Unit well in the northern McMullen County shows a 150 ft gross interval for the Lower Eagle Ford Shale, with a net-to-gross ratio of about 90 percent, Exhibit 4-3.
Exhibit 4-3 Wycross Unit Well Log
DRAFT - Eagle Ford Shale Basin Study
14 INTERNAL USE ONLY – NOT APPROVED FOR PUBLIC RELEASE – DRAFT April 19, 2019
Source: Sanchez Energy, 2014..
DRAFT - Eagle Ford Shale Basin Study
15 INTERNAL USE ONLY – NOT APPROVED FOR PUBLIC RELEASE – DRAFT April 19, 2019
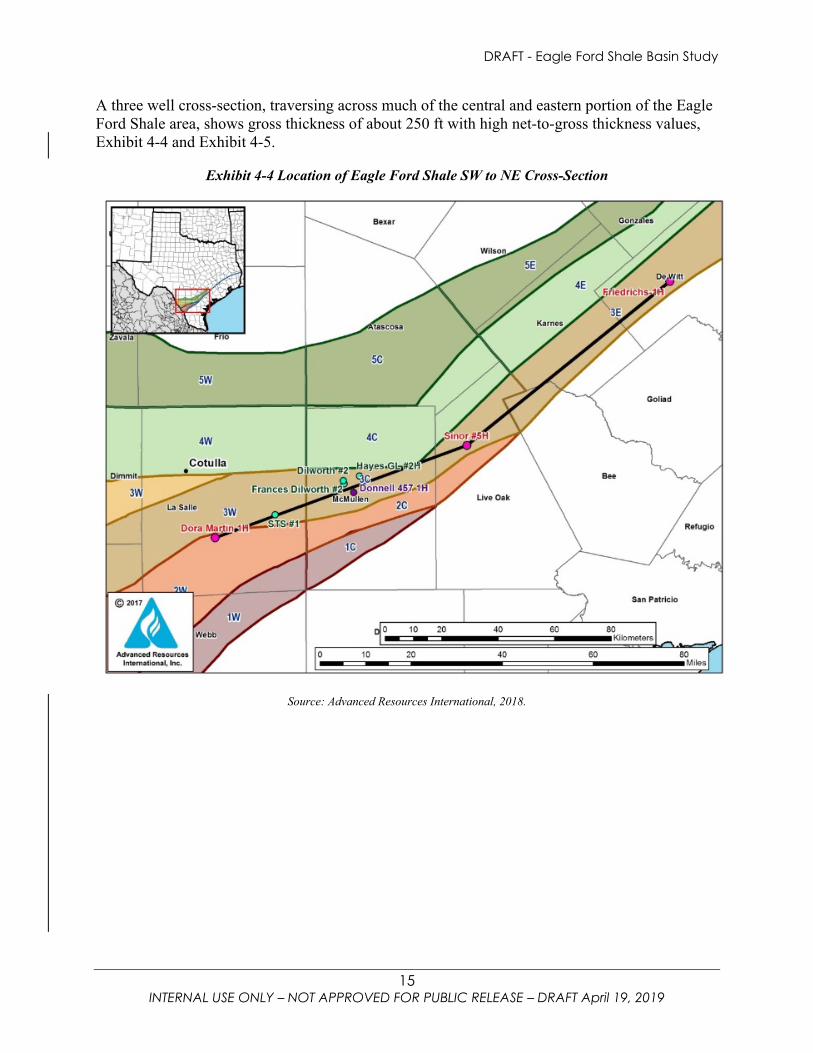
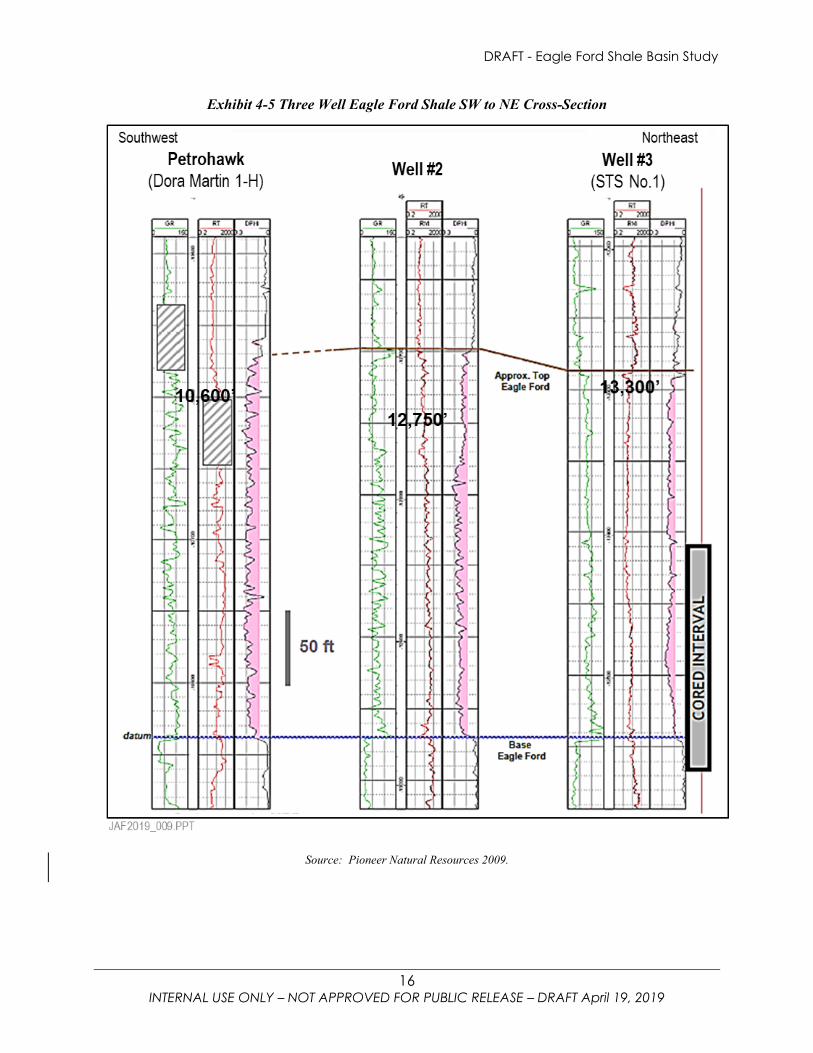
A three well cross-section, traversing across much of the central and eastern portion of the Eagle Ford Shale area, shows gross thickness of about 250 ft with high net-to-gross thickness values, Exhibit 4-4 and Exhibit 4-5.
Exhibit 4-4 Location of Eagle Ford Shale SW to NE Cross-Section
Source: Advanced Resources International, 2018.
DRAFT - Eagle Ford Shale Basin Study
16 INTERNAL USE ONLY – NOT APPROVED FOR PUBLIC RELEASE – DRAFT April 19, 2019
Exhibit 4-5 Three Well Eagle Ford Shale SW to NE Cross-Section
Source: Pioneer Natural Resources 2009.
DRAFT - Eagle Ford Shale Basin Study
17 INTERNAL USE ONLY – NOT APPROVED FOR PUBLIC RELEASE – DRAFT April 19, 2019
4.2 RESERVOIR POROSITY Information on the porosity of the Eagle Ford Shale is scarce in the technical literature for specific areas of the shale. Particularly challenging is establishing the significant porosity values in the organic portions of the shale. Based on industry published information, the porosity of the Eagle Ford Shale matrix ranges from 8 to 11 percent in the Lower Shale Unit and from 4 to 6 percent in the Upper Shale Unit. The natural fracture system adds about 0.1 percent to the matrix porosity values.
4.3 OIL AND WATER SATURATION Laboratory derived information for the Eagle Ford Shale indicates that the shale, in the oil dominant area, has an initial oil saturation of about 80 percent and an immobile water saturation of about 20 percent. The initial oil saturation in the natural fracture system is estimated to be slightly higher, at about 90 percent. (Gala, D., and Sharma, M. , 2018)
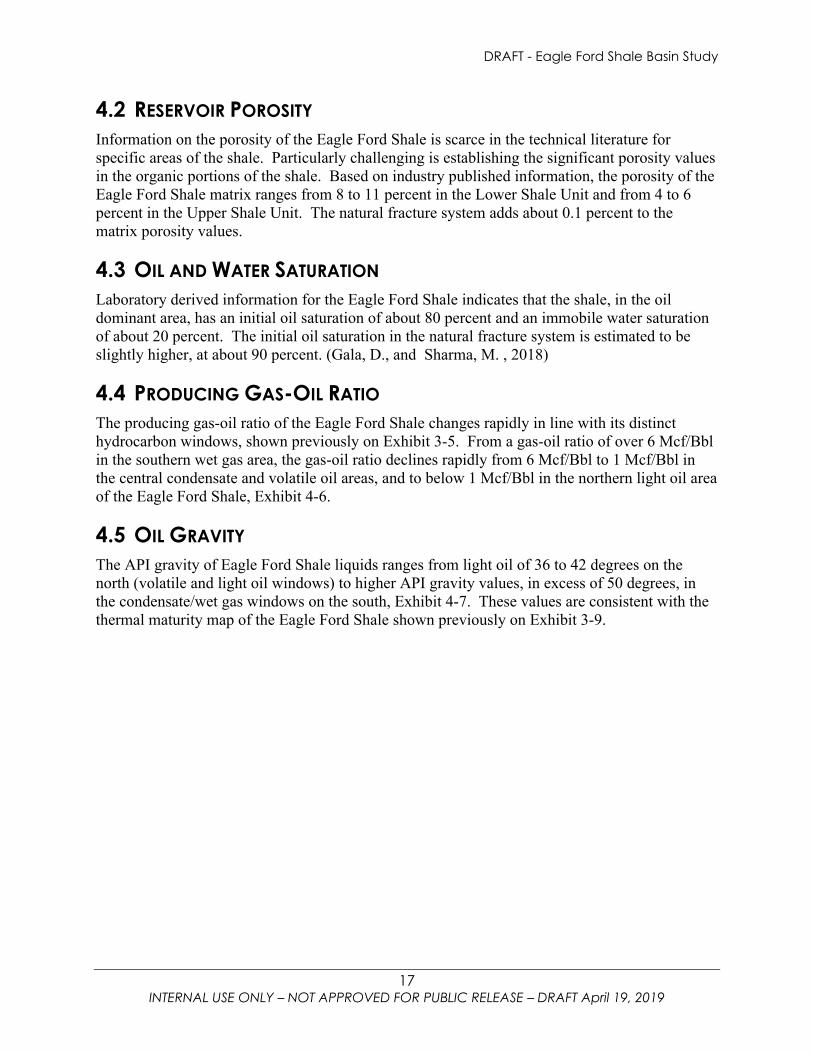
4.4 PRODUCING GAS-OIL RATIO The producing gas-oil ratio of the Eagle Ford Shale changes rapidly in line with its distinct hydrocarbon windows, shown previously on Exhibit 3-5. From a gas-oil ratio of over 6 Mcf/Bbl in the southern wet gas area, the gas-oil ratio declines rapidly from 6 Mcf/Bbl to 1 Mcf/Bbl in the central condensate and volatile oil areas, and to below 1 Mcf/Bbl in the northern light oil area of the Eagle Ford Shale, Exhibit 4-6.
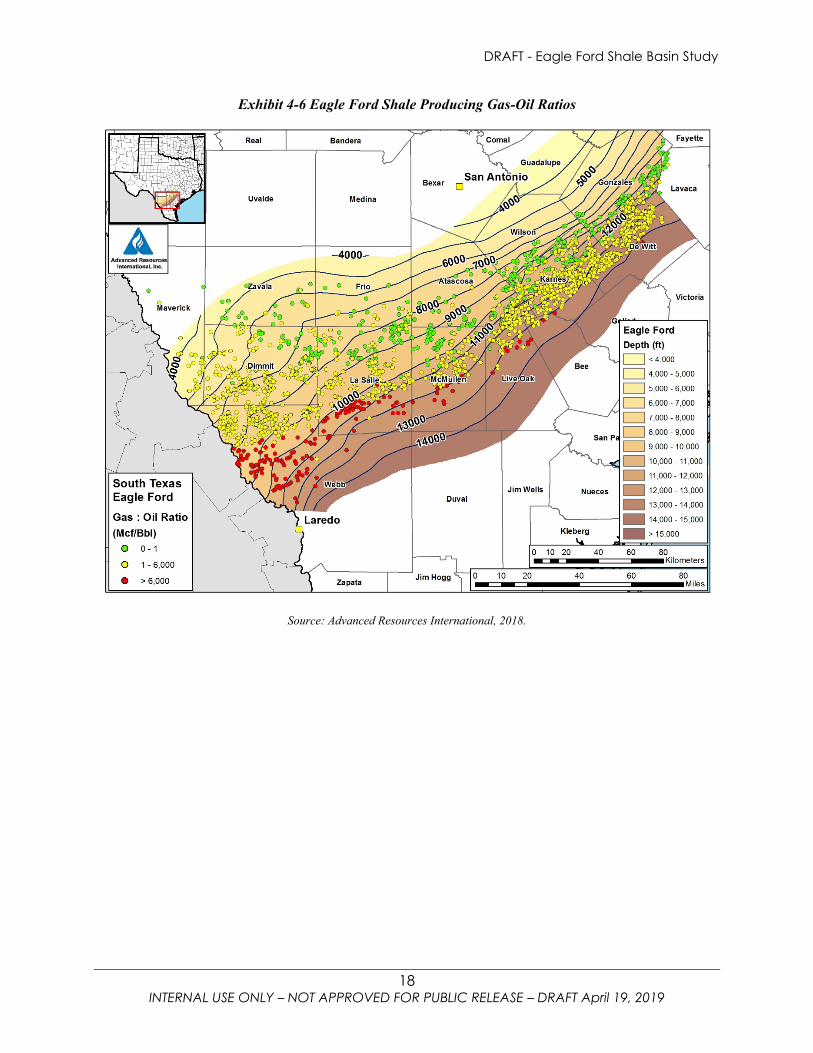
4.5 OIL GRAVITY The API gravity of Eagle Ford Shale liquids ranges from light oil of 36 to 42 degrees on the north (volatile and light oil windows) to higher API gravity values, in excess of 50 degrees, in the condensate/wet gas windows on the south, Exhibit 4-7. These values are consistent with the thermal maturity map of the Eagle Ford Shale shown previously on Exhibit 3-9.
DRAFT - Eagle Ford Shale Basin Study
18 INTERNAL USE ONLY – NOT APPROVED FOR PUBLIC RELEASE – DRAFT April 19, 2019
Exhibit 4-6 Eagle Ford Shale Producing Gas-Oil Ratios
Source: Advanced Resources International, 2018.
DRAFT - Eagle Ford Shale Basin Study
19 INTERNAL USE ONLY – NOT APPROVED FOR PUBLIC RELEASE – DRAFT April 19, 2019
Exhibit 4-7 Eagle Ford Shale API Gravity
Source: Advanced Resources International using data from DrillingInfo, 2017.
DRAFT - Eagle Ford Shale Basin Study
20 INTERNAL USE ONLY – NOT APPROVED FOR PUBLIC RELEASE – DRAFT April 19, 2019
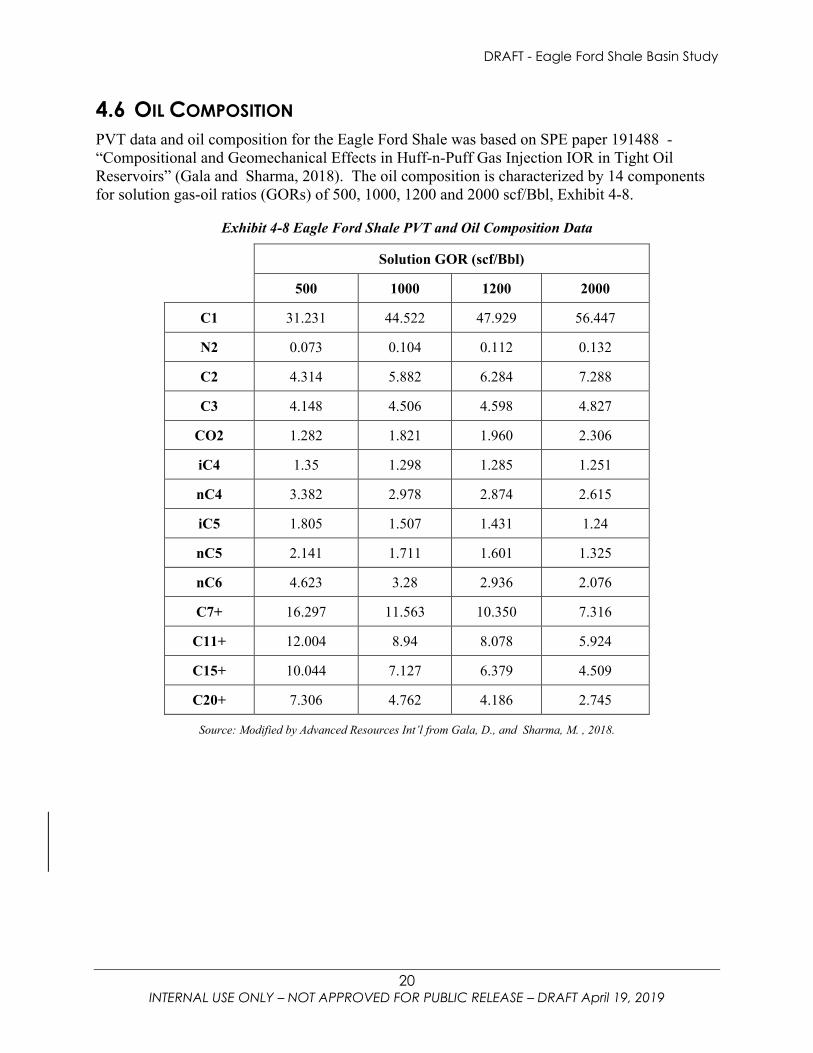
4.6 OIL COMPOSITION PVT data and oil composition for the Eagle Ford Shale was based on SPE paper 191488 - “Compositional and Geomechanical Effects in Huff-n-Puff Gas Injection IOR in Tight Oil Reservoirs” (Gala and Sharma, 2018). The oil composition is characterized by 14 components for solution gas-oil ratios (GORs) of 500, 1000, 1200 and 2000 scf/Bbl, Exhibit 4-8.
Exhibit 4-8 Eagle Ford Shale PVT and Oil Composition Data
Solution GOR (scf/Bbl)
500 1000 1200 2000
C1 31.231 44.522 47.929 56.447
N2 0.073 0.104 0.112 0.132
C2 4.314 5.882 6.284 7.288
C3 4.148 4.506 4.598 4.827
CO2 1.282 1.821 1.960 2.306
iC4 1.35 1.298 1.285 1.251
nC4 3.382 2.978 2.874 2.615
iC5 1.805 1.507 1.431 1.24
nC5 2.141 1.711 1.601 1.325
nC6 4.623 3.28 2.936 2.076
C7+ 16.297 11.563 10.350 7.316
C11+ 12.004 8.94 8.078 5.924
C15+ 10.044 7.127 6.379 4.509
C20+ 7.306 4.762 4.186 2.745
Source: Modified by Advanced Resources Int’l from Gala, D., and Sharma, M. , 2018.
DRAFT - Eagle Ford Shale Basin Study
21 INTERNAL USE ONLY – NOT APPROVED FOR PUBLIC RELEASE – DRAFT April 19, 2019
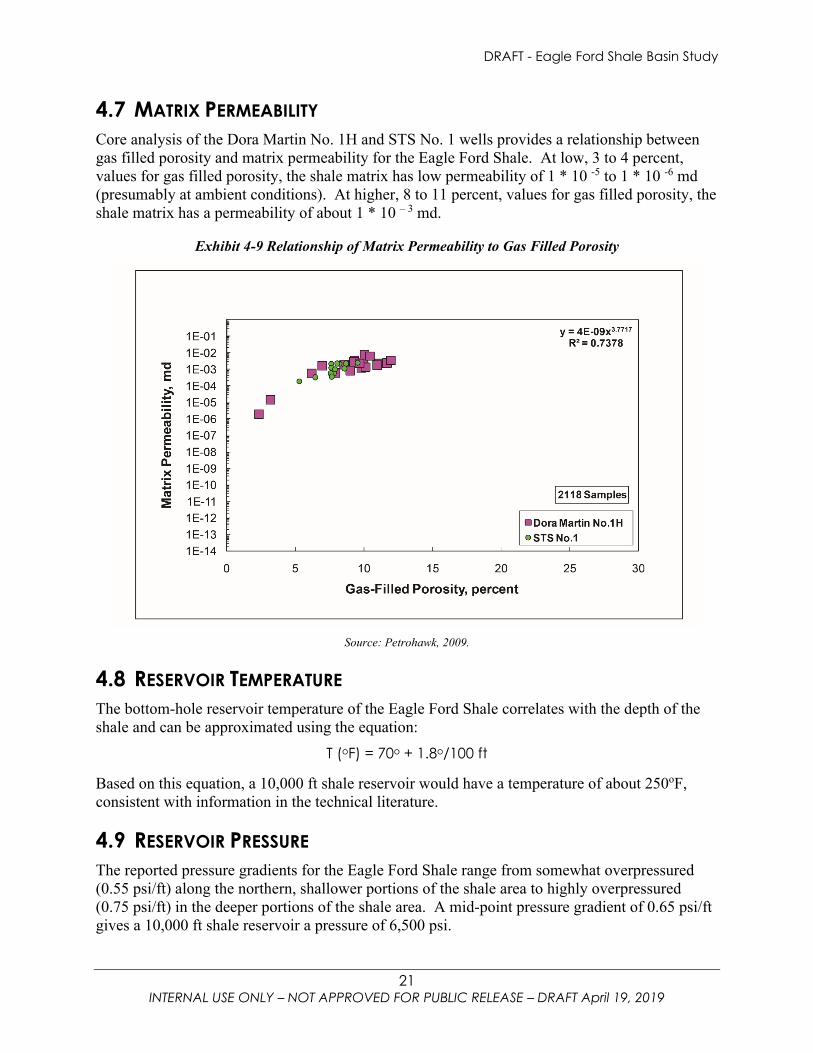
4.7 MATRIX PERMEABILITY Core analysis of the Dora Martin No. 1H and STS No. 1 wells provides a relationship between gas filled porosity and matrix permeability for the Eagle Ford Shale. At low, 3 to 4 percent, values for gas filled porosity, the shale matrix has low permeability of 1 * 10 -5 to 1 * 10 -6 md (presumably at ambient conditions). At higher, 8 to 11 percent, values for gas filled porosity, the shale matrix has a permeability of about 1 * 10 – 3 md.
Exhibit 4-9 Relationship of Matrix Permeability to Gas Filled Porosity
Source: Petrohawk, 2009.
4.8 RESERVOIR TEMPERATURE The bottom-hole reservoir temperature of the Eagle Ford Shale correlates with the depth of the shale and can be approximated using the equation:
T (oF) = 70o + 1.8o/100 ft
Based on this equation, a 10,000 ft shale reservoir would have a temperature of about 250oF, consistent with information in the technical literature.
4.9 RESERVOIR PRESSURE The reported pressure gradients for the Eagle Ford Shale range from somewhat overpressured (0.55 psi/ft) along the northern, shallower portions of the shale area to highly overpressured (0.75 psi/ft) in the deeper portions of the shale area. A mid-point pressure gradient of 0.65 psi/ft gives a 10,000 ft shale reservoir a pressure of 6,500 psi.
DRAFT - Eagle Ford Shale Basin Study
22 INTERNAL USE ONLY – NOT APPROVED FOR PUBLIC RELEASE – DRAFT April 19, 2019
5 ESTIMATES OF ORIGINAL OIL IN-PLACE (OOIP)
5.1 CHALLENGES IN ESTIMATING ORIGINAL OIL IN-PLACE Given its highly heterogeneous and complex geology, establishing a rigorous estimate for the OOIP in the Eagle Ford Shale is a most challenging task, influenced by numerous uncertainties, including: Determining how much of the vertical Lower Eagle Ford Shale interval should be
included as net productive pay, given uncertainties about minimum porosity cut-off values typically used for defining net pay.
Developing reliable estimates for porosity for a resource where a significant portion of the porosity is within the organic content of the shale.
Arriving at a reasonable value for the areal extent of the oil dominant shale area, given uncertainties as to the dividing line between the oil dominant and the natural gas dominant areas of the shale. Similar uncertainties exist for the northern, shallower limit of the light oil area of the Eagle Ford Shale.
Establishing appropriate formation volume factors for converting reservoir barrels to stock tank barrels for the highly variable data on solution gas-oil ratios and the compositions of the oil and condensate in the oil dominate areas of the Eagle Ford Shale.
Even with these challenges and uncertainties, developing an estimate for OOIP (admittedly with a considerable error bound) is a useful exercise. It puts into print the assumptions and data used for the OOIP resource estimate. It also provides a placeholder for additional information sharing by industry and researchers on newly collected geologic and reservoir properties for the Eagle Ford Shale. Our discussions with industry confirm that companies have invested significantly in building in-depth geologic models for their acreage positions in the Eagle Ford and other shale basins. However, so far, only limited portions of this information have been placed into the public domain.
5.2 SOURCES OF INFORMATION FOR OOIP RESOURCE ESTIMATE Our OOIP resource estimate for the Eagle Ford Shale is based on the following set of information sources assembled for this Basin Study:i
Assembly of information from prior well completion and other reports to establish data on formation tops and the gross interval for the Eagle Ford Shale.
Review of information, in various prior studies and technical reports, on geologic and reservoir properties published for the Eagle Ford Shale.
i A great bulk of the information on Eagle Ford Shale reservoir properties has been assembled from prior work performed by Advanced Resources International for various clients. Advanced Resources is contributing a portion of this earlier work to this Basin Study. However, the underlying data used to construct the maps in this report is proprietary data work and is not available for public release.
DRAFT - Eagle Ford Shale Basin Study
2 INTERNAL USE ONLY – NOT APPROVED FOR PUBLIC RELEASE – DRAFT April 19, 2019
Compilation of publicly shared industry information on Eagle Ford Shale reservoir properties for selected lease areas provided by industry.
5.3 ASSESSMENT METHODOLOGY To provide some granularity to the estimates of OOIP, the Basin Study has partitioned the oil dominant portion of the Eagle Ford Shale into Eastern, Central and Western areas. It then further subdivided each of these three geographically established areas into: (1) a condensate/wet gas area; (2) a volatile oil area; and (3) a light oil area, as discussed previously in Section 3.5 of the report, Hydrocarbon Windows. For each area, the study assembled representative volumetric and other reservoir properties essential for estimating OOIP. First, the study established the areal extent for each of these nine resource assessment units of the Eagle Ford Shale. Then, the study risked these areas assuming that about 80 percent of each assessment unit would be accessible and geologically viable. In the future, a somewhat higher accessibility and viability value may prove to be appropriate for the Eastern shale area and a somewhat lower access and viability value may prove to be appropriate for the Western shale area. The primary focus is establishing OOIP values for the organically-rich Lower Unit of the Eagle Ford Shale that is the target of current primary recovery efforts and also the likely first target for applying enhanced oil recovery. Future expansions of this Basin Study may add the Upper Unit of the Eagle Ford Shale to the resource assessment. The OOIP resource estimates draw heavily on the series of maps and exhibits provided in the earlier sections of this report. The resource estimates also benefitted from insights and data gained from the reservoir simulation of primary oil recovery for the Central Area of the Eagle Ford Shale discussed previously in Section 5 of this report. Additional geologic and reservoir property information specific to each of the nine resource assessment units in the three geographic areas of the shale – Eastern, Central and Western areas – was assembled from the technical literature.

DRAFT - Eagle Ford Shale Basin Study
3 INTERNAL USE ONLY – NOT APPROVED FOR PUBLIC RELEASE – DRAFT April 19, 2019
5.4 EASTERN SHALE AREA The Eastern Area of the oil dominant Eagle Ford Shale extends across 2,250 square miles in Karnes, DeWitt, Gonzales and Wilson counties. Portions of this area, particularly in Karnes and DeWitt counties, have seen extensive well drilling, including a series of highly productive shale wells in the Karnes Trough portion of Karnes County. A total of 6,800 Hz Eagle Ford Shale oil wells have been drilled and completed in the Eastern Area of the Eagle Ford Shale. The Eastern Shale Area has three parallel trending hydrocarbon windows that range from a condensate (with wet gas) region on the south, a volatile oil region in the center, and a light oil region on the north, Exhibit 5-1.
Exhibit 5-1 Hydrocarbon Windows of the Eastern Eagle Ford Shale Area
Source: Advanced Resources International, 2018
DRAFT - Eagle Ford Shale Basin Study
4 INTERNAL USE ONLY – NOT APPROVED FOR PUBLIC RELEASE – DRAFT April 19, 2019
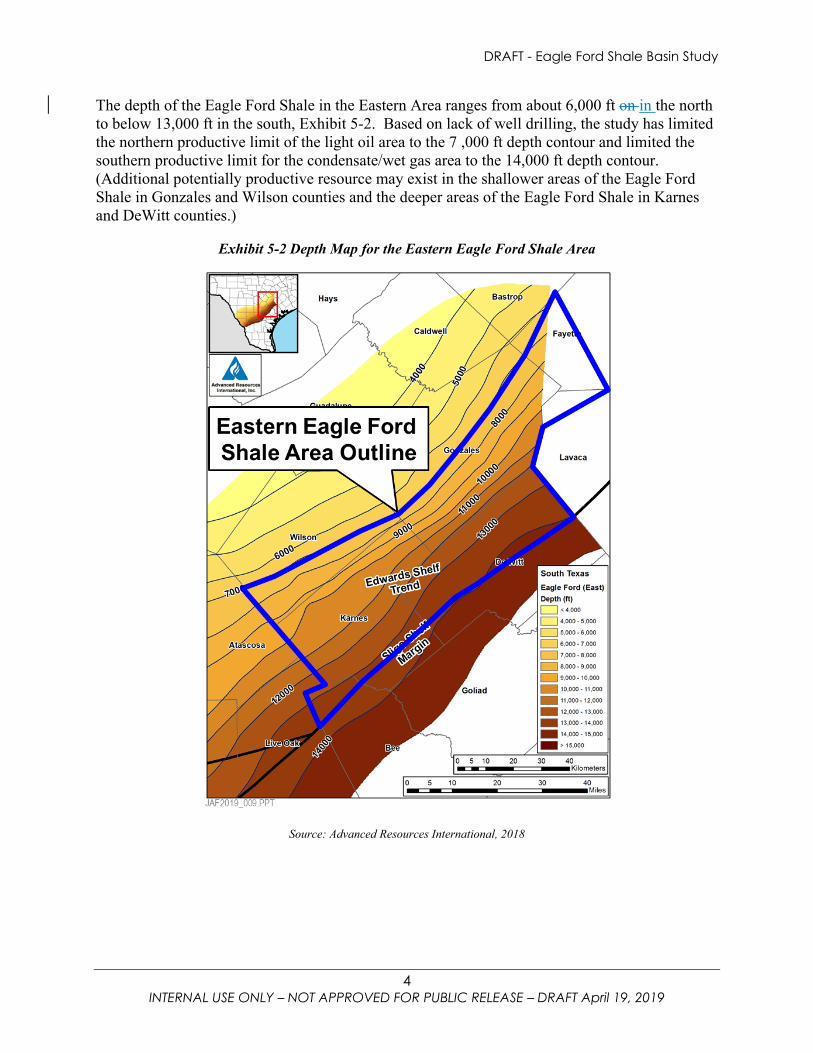
The depth of the Eagle Ford Shale in the Eastern Area ranges from about 6,000 ft on in the north to below 13,000 ft in the south, Exhibit 5-2. Based on lack of well drilling, the study has limited the northern productive limit of the light oil area to the 7 ,000 ft depth contour and limited the southern productive limit for the condensate/wet gas area to the 14,000 ft depth contour. (Additional potentially productive resource may exist in the shallower areas of the Eagle Ford Shale in Gonzales and Wilson counties and the deeper areas of the Eagle Ford Shale in Karnes and DeWitt counties.)
Exhibit 5-2 Depth Map for the Eastern Eagle Ford Shale Area
Source: Advanced Resources International, 2018
DRAFT - Eagle Ford Shale Basin Study
5 INTERNAL USE ONLY – NOT APPROVED FOR PUBLIC RELEASE – DRAFT April 19, 2019
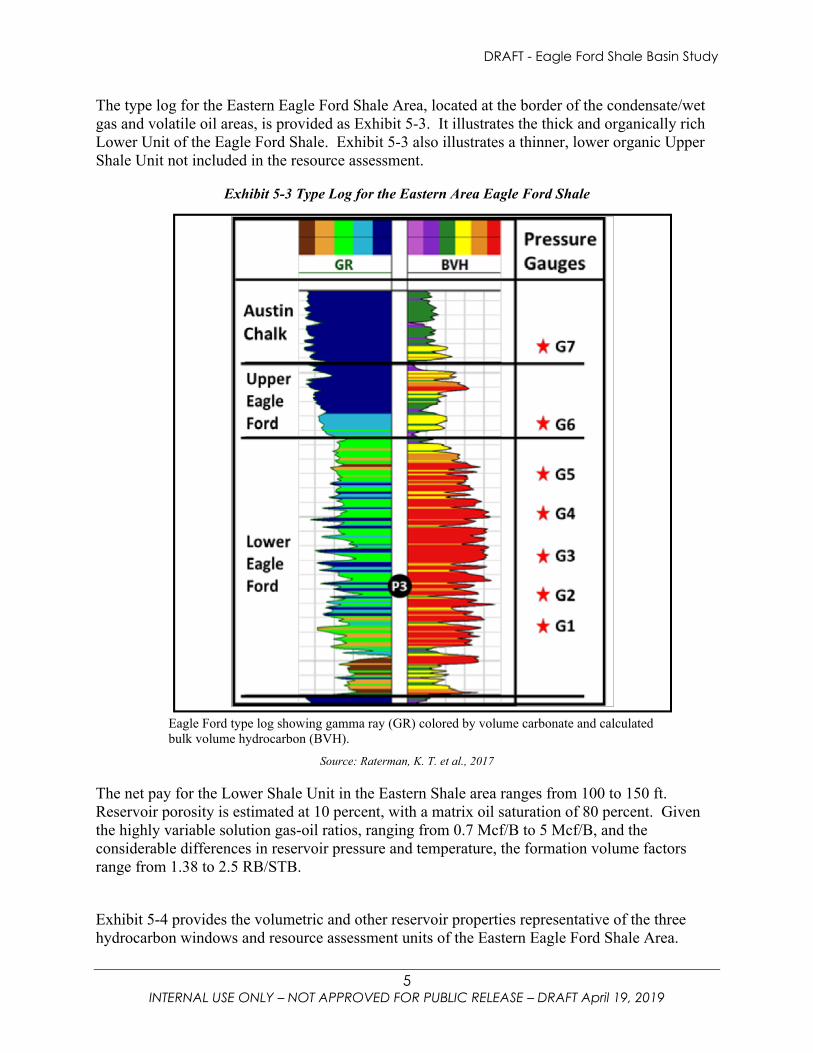
The type log for the Eastern Eagle Ford Shale Area, located at the border of the condensate/wet gas and volatile oil areas, is provided as Exhibit 5-3. It illustrates the thick and organically rich Lower Unit of the Eagle Ford Shale. Exhibit 5-3 also illustrates a thinner, lower organic Upper Shale Unit not included in the resource assessment.
Exhibit 5-3 Type Log for the Eastern Area Eagle Ford Shale
Eagle Ford type log showing gamma ray (GR) colored by volume carbonate and calculated bulk volume hydrocarbon (BVH).
Source: Raterman, K. T. et al., 2017
The net pay for the Lower Shale Unit in the Eastern Shale area ranges from 100 to 150 ft. Reservoir porosity is estimated at 10 percent, with a matrix oil saturation of 80 percent. Given the highly variable solution gas-oil ratios, ranging from 0.7 Mcf/B to 5 Mcf/B, and the considerable differences in reservoir pressure and temperature, the formation volume factors range from 1.38 to 2.5 RB/STB. Exhibit 5-4 provides the volumetric and other reservoir properties representative of the three hydrocarbon windows and resource assessment units of the Eastern Eagle Ford Shale Area.
DRAFT - Eagle Ford Shale Basin Study
6 INTERNAL USE ONLY – NOT APPROVED FOR PUBLIC RELEASE – DRAFT April 19, 2019
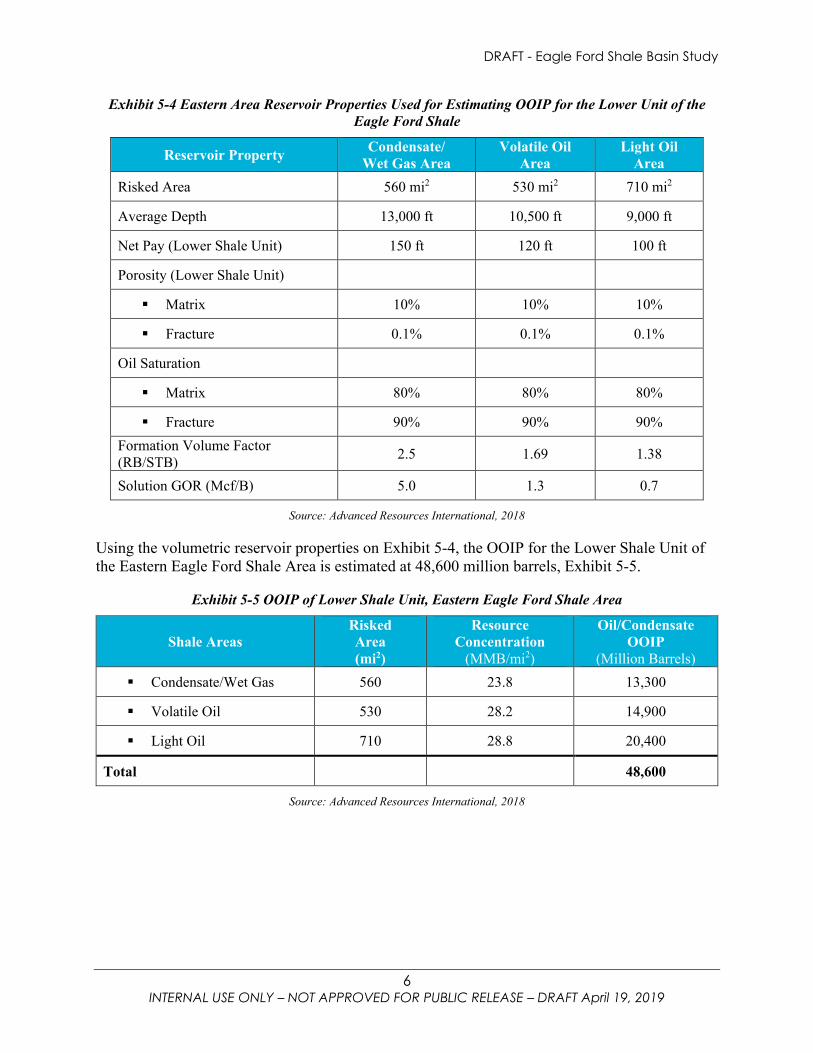
Exhibit 5-4 Eastern Area Reservoir Properties Used for Estimating OOIP for the Lower Unit of the Eagle Ford Shale
Reservoir Property Condensate/ Wet Gas Area
Volatile Oil Area
Light Oil Area
Risked Area 560 mi2 530 mi2 710 mi2
Average Depth 13,000 ft 10,500 ft 9,000 ft
Net Pay (Lower Shale Unit) 150 ft 120 ft 100 ft
Porosity (Lower Shale Unit)
Matrix 10% 10% 10%
Fracture 0.1% 0.1% 0.1%
Oil Saturation
Matrix 80% 80% 80%
Fracture 90% 90% 90% Formation Volume Factor (RB/STB) 2.5 1.69 1.38
Solution GOR (Mcf/B) 5.0 1.3 0.7
Source: Advanced Resources International, 2018
Using the volumetric reservoir properties on Exhibit 5-4, the OOIP for the Lower Shale Unit of the Eastern Eagle Ford Shale Area is estimated at 48,600 million barrels, Exhibit 5-5.
Exhibit 5-5 OOIP of Lower Shale Unit, Eastern Eagle Ford Shale Area
Shale Areas Risked Area (mi2)
Resource Concentration
(MMB/mi2)
Oil/Condensate OOIP
(Million Barrels) Condensate/Wet Gas 560 23.8 13,300
Volatile Oil 530 28.2 14,900
Light Oil 710 28.8 20,400
Total 48,600
Source: Advanced Resources International, 2018
DRAFT - Eagle Ford Shale Basin Study
7 INTERNAL USE ONLY – NOT APPROVED FOR PUBLIC RELEASE – DRAFT April 19, 2019
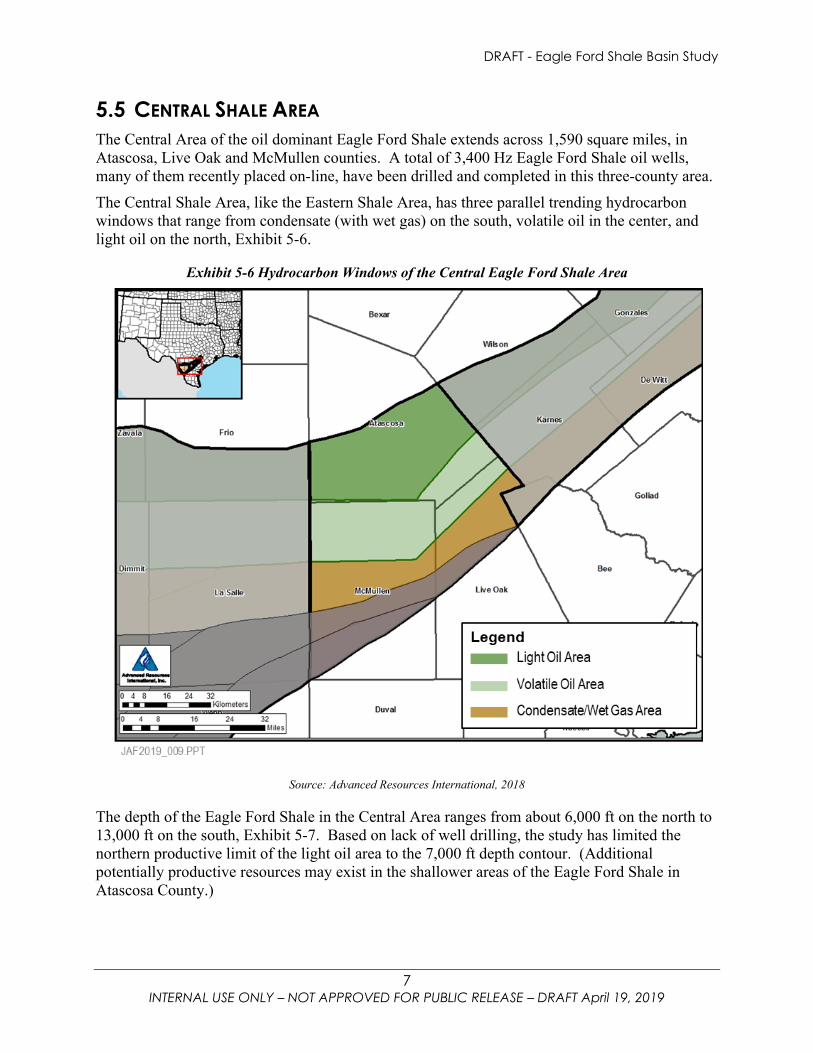
5.5 CENTRAL SHALE AREA The Central Area of the oil dominant Eagle Ford Shale extends across 1,590 square miles, in Atascosa, Live Oak and McMullen counties. A total of 3,400 Hz Eagle Ford Shale oil wells, many of them recently placed on-line, have been drilled and completed in this three-county area. The Central Shale Area, like the Eastern Shale Area, has three parallel trending hydrocarbon windows that range from condensate (with wet gas) on the south, volatile oil in the center, and light oil on the north, Exhibit 5-6.
Exhibit 5-6 Hydrocarbon Windows of the Central Eagle Ford Shale Area
Source: Advanced Resources International, 2018
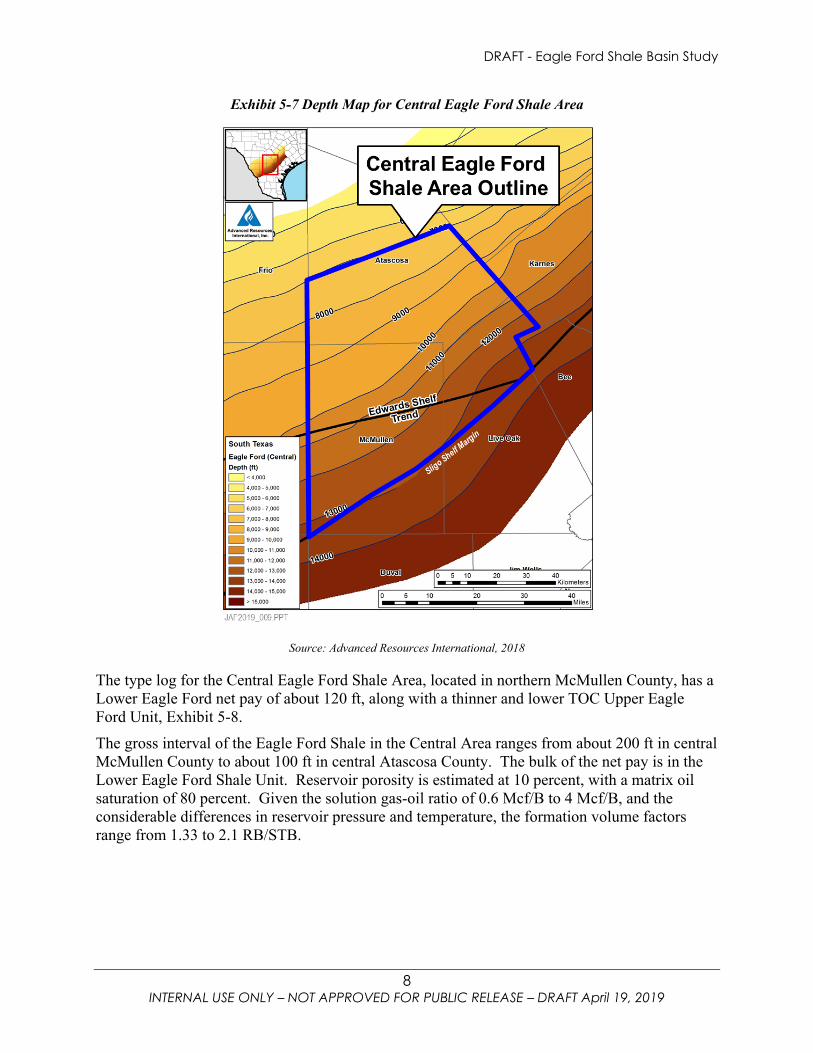
The depth of the Eagle Ford Shale in the Central Area ranges from about 6,000 ft on the north to 13,000 ft on the south, Exhibit 5-7. Based on lack of well drilling, the study has limited the northern productive limit of the light oil area to the 7,000 ft depth contour. (Additional potentially productive resources may exist in the shallower areas of the Eagle Ford Shale in Atascosa County.)
DRAFT - Eagle Ford Shale Basin Study
8 INTERNAL USE ONLY – NOT APPROVED FOR PUBLIC RELEASE – DRAFT April 19, 2019
Exhibit 5-7 Depth Map for Central Eagle Ford Shale Area
Source: Advanced Resources International, 2018
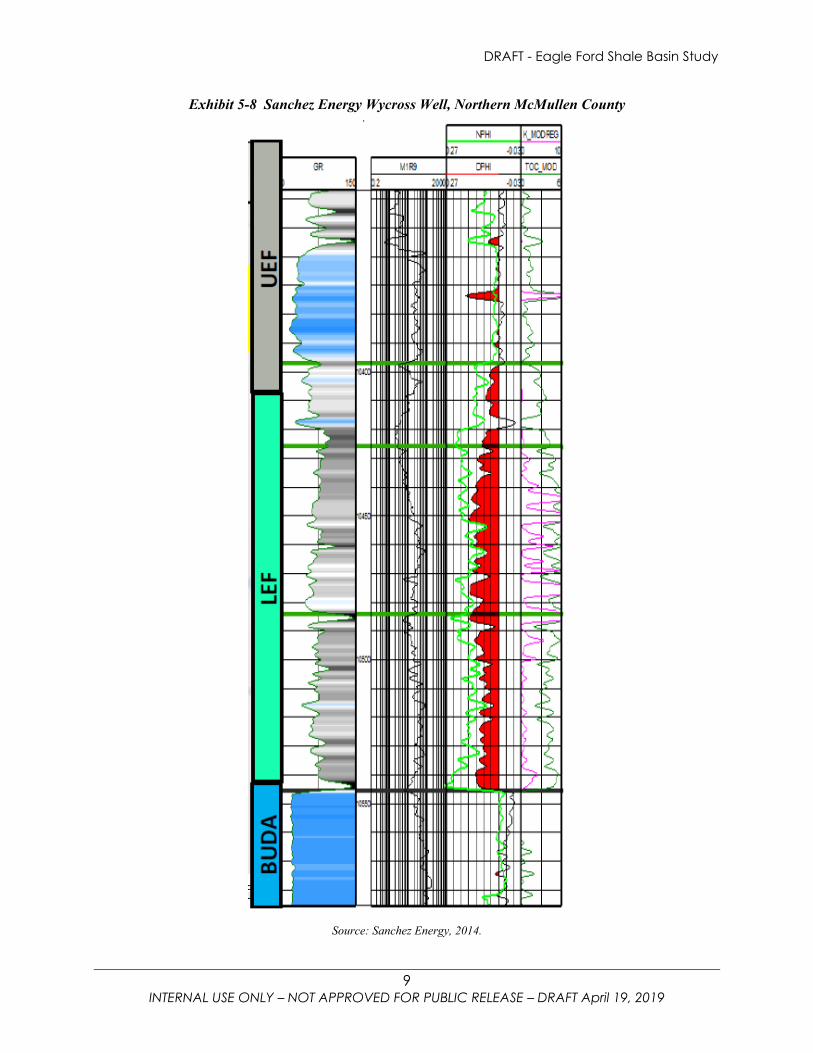
The type log for the Central Eagle Ford Shale Area, located in northern McMullen County, has a Lower Eagle Ford net pay of about 120 ft, along with a thinner and lower TOC Upper Eagle Ford Unit, Exhibit 5-8. The gross interval of the Eagle Ford Shale in the Central Area ranges from about 200 ft in central McMullen County to about 100 ft in central Atascosa County. The bulk of the net pay is in the Lower Eagle Ford Shale Unit. Reservoir porosity is estimated at 10 percent, with a matrix oil saturation of 80 percent. Given the solution gas-oil ratio of 0.6 Mcf/B to 4 Mcf/B, and the considerable differences in reservoir pressure and temperature, the formation volume factors range from 1.33 to 2.1 RB/STB.
DRAFT - Eagle Ford Shale Basin Study
9 INTERNAL USE ONLY – NOT APPROVED FOR PUBLIC RELEASE – DRAFT April 19, 2019
Exhibit 5-8 Sanchez Energy Wycross Well, Northern McMullen County
Source: Sanchez Energy, 2014.
DRAFT - Eagle Ford Shale Basin Study
10 INTERNAL USE ONLY – NOT APPROVED FOR PUBLIC RELEASE – DRAFT April 19, 2019
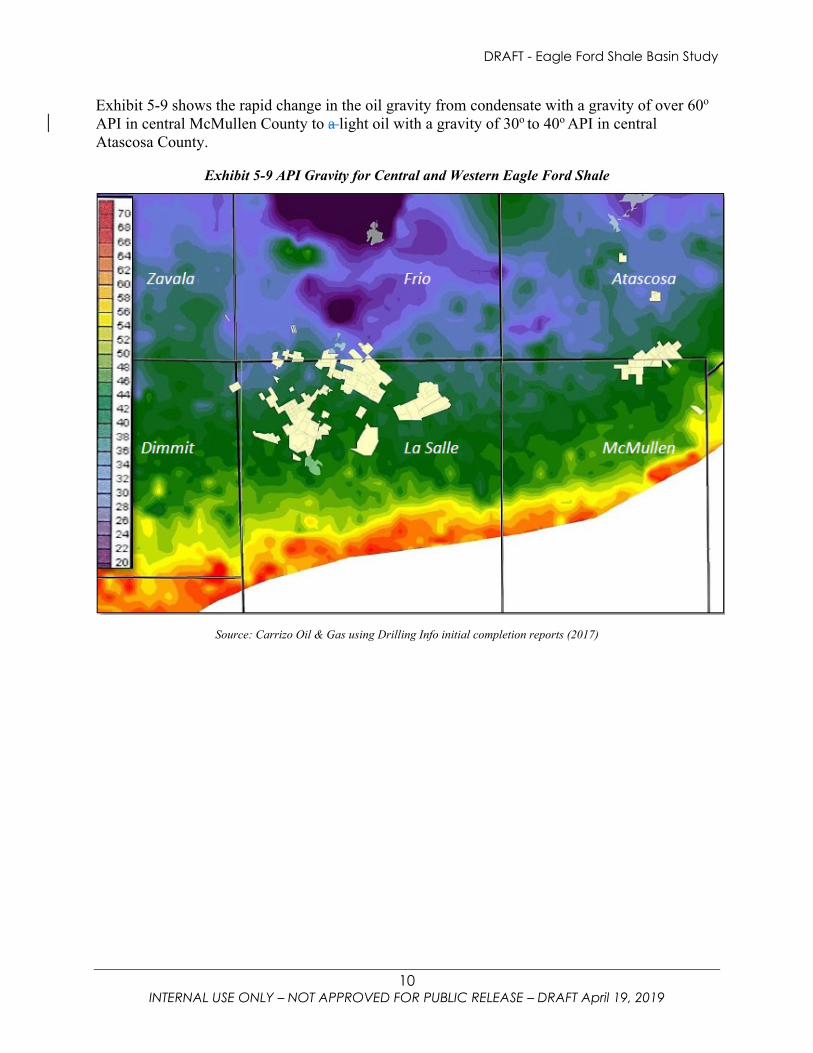
Exhibit 5-9 shows the rapid change in the oil gravity from condensate with a gravity of over 60o API in central McMullen County to a light oil with a gravity of 30o to 40o API in central Atascosa County.
Exhibit 5-9 API Gravity for Central and Western Eagle Ford Shale
Source: Carrizo Oil & Gas using Drilling Info initial completion reports (2017)
DRAFT - Eagle Ford Shale Basin Study
11 INTERNAL USE ONLY – NOT APPROVED FOR PUBLIC RELEASE – DRAFT April 19, 2019
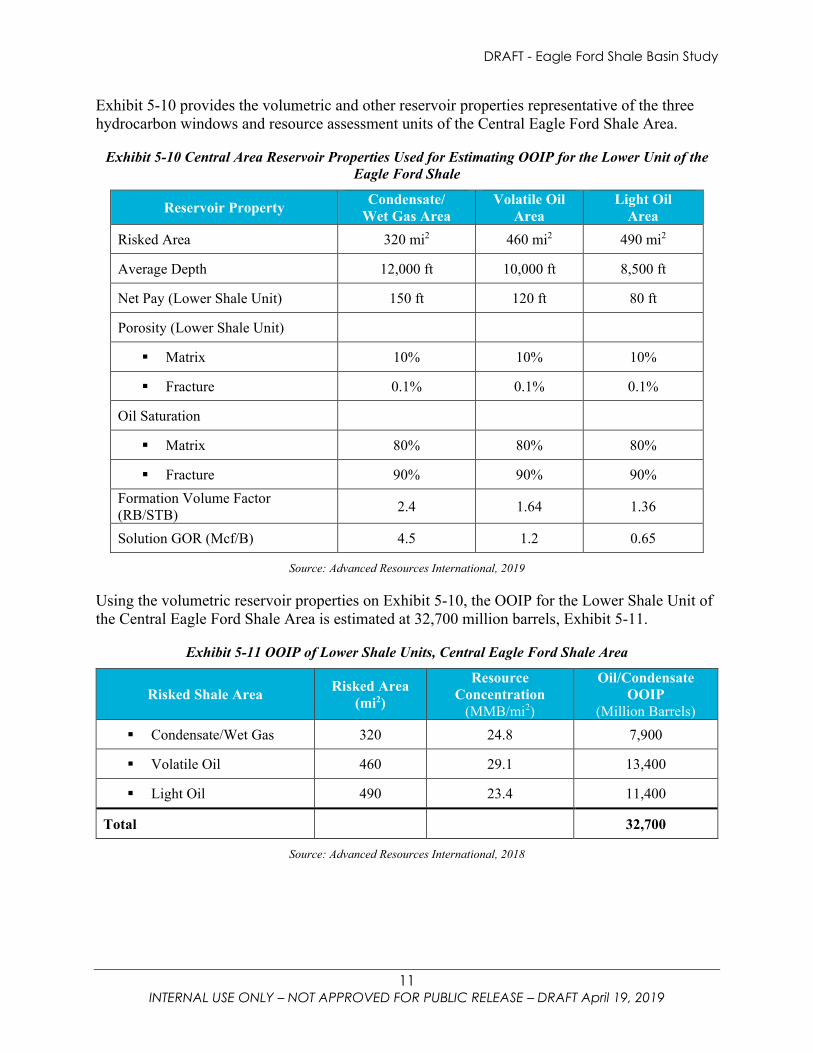
Exhibit 5-10 provides the volumetric and other reservoir properties representative of the three hydrocarbon windows and resource assessment units of the Central Eagle Ford Shale Area.
Exhibit 5-10 Central Area Reservoir Properties Used for Estimating OOIP for the Lower Unit of the Eagle Ford Shale
Reservoir Property Condensate/ Wet Gas Area
Volatile Oil Area
Light Oil Area
Risked Area 320 mi2 460 mi2 490 mi2
Average Depth 12,000 ft 10,000 ft 8,500 ft
Net Pay (Lower Shale Unit) 150 ft 120 ft 80 ft
Porosity (Lower Shale Unit)
Matrix 10% 10% 10%
Fracture 0.1% 0.1% 0.1%
Oil Saturation
Matrix 80% 80% 80%
Fracture 90% 90% 90% Formation Volume Factor (RB/STB) 2.4 1.64 1.36
Solution GOR (Mcf/B) 4.5 1.2 0.65
Source: Advanced Resources International, 2019
Using the volumetric reservoir properties on Exhibit 5-10, the OOIP for the Lower Shale Unit of the Central Eagle Ford Shale Area is estimated at 32,700 million barrels, Exhibit 5-11.
Exhibit 5-11 OOIP of Lower Shale Units, Central Eagle Ford Shale Area
Risked Shale Area Risked Area (mi2)
Resource Concentration
(MMB/mi2)
Oil/Condensate OOIP
(Million Barrels) Condensate/Wet Gas 320 24.8 7,900
Volatile Oil 460 29.1 13,400
Light Oil 490 23.4 11,400
Total 32,700
Source: Advanced Resources International, 2018
DRAFT - Eagle Ford Shale Basin Study
12 INTERNAL USE ONLY – NOT APPROVED FOR PUBLIC RELEASE – DRAFT April 19, 2019
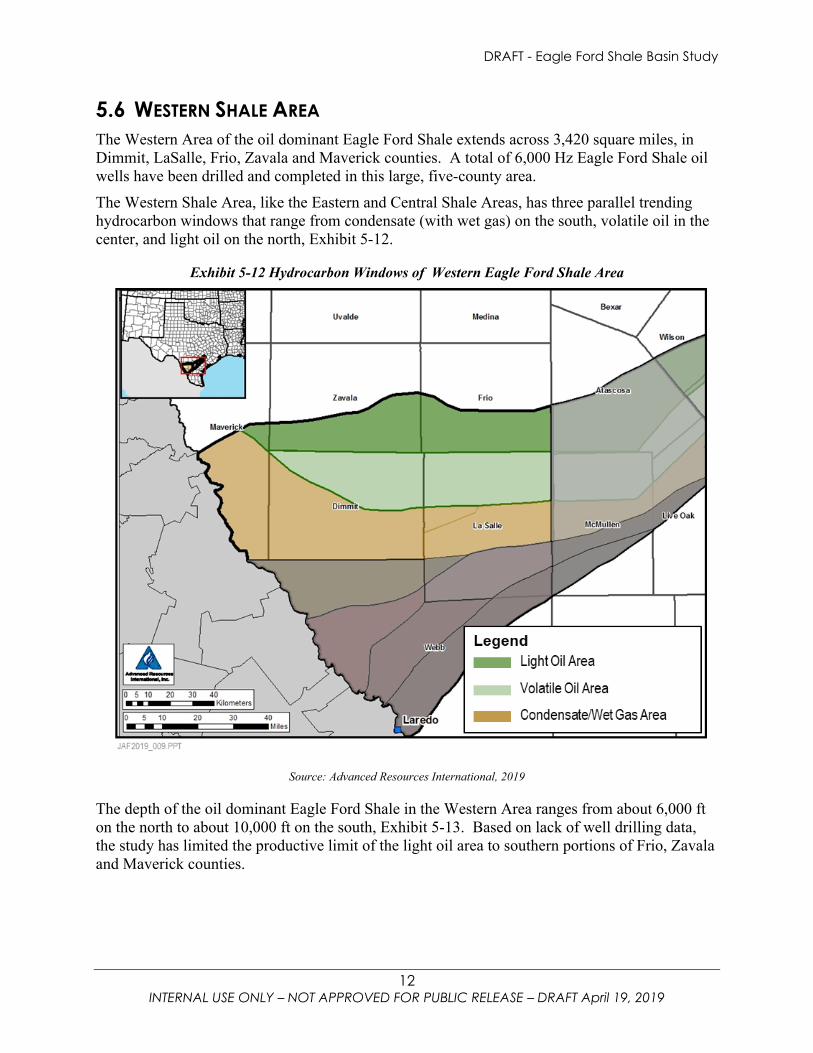
5.6 WESTERN SHALE AREA The Western Area of the oil dominant Eagle Ford Shale extends across 3,420 square miles, in Dimmit, LaSalle, Frio, Zavala and Maverick counties. A total of 6,000 Hz Eagle Ford Shale oil wells have been drilled and completed in this large, five-county area. The Western Shale Area, like the Eastern and Central Shale Areas, has three parallel trending hydrocarbon windows that range from condensate (with wet gas) on the south, volatile oil in the center, and light oil on the north, Exhibit 5-12.
Exhibit 5-12 Hydrocarbon Windows of Western Eagle Ford Shale Area
Source: Advanced Resources International, 2019
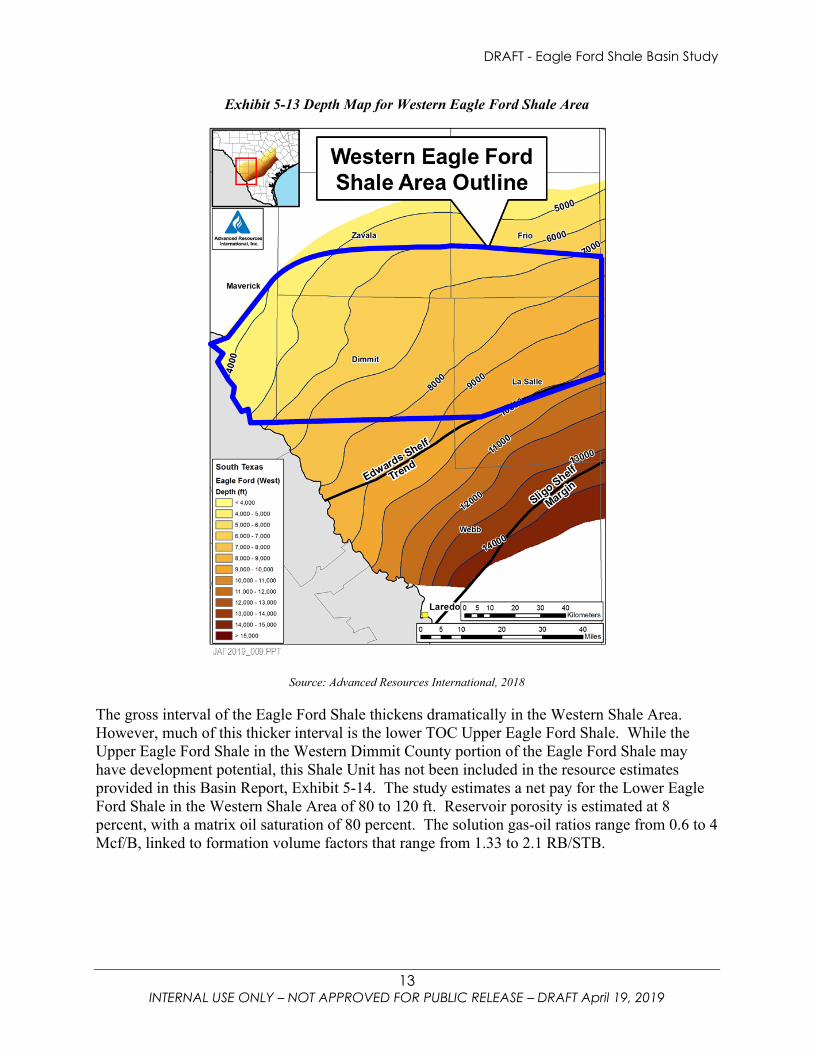
The depth of the oil dominant Eagle Ford Shale in the Western Area ranges from about 6,000 ft on the north to about 10,000 ft on the south, Exhibit 5-13. Based on lack of well drilling data, the study has limited the productive limit of the light oil area to southern portions of Frio, Zavala and Maverick counties.
DRAFT - Eagle Ford Shale Basin Study
13 INTERNAL USE ONLY – NOT APPROVED FOR PUBLIC RELEASE – DRAFT April 19, 2019
Exhibit 5-13 Depth Map for Western Eagle Ford Shale Area
Source: Advanced Resources International, 2018
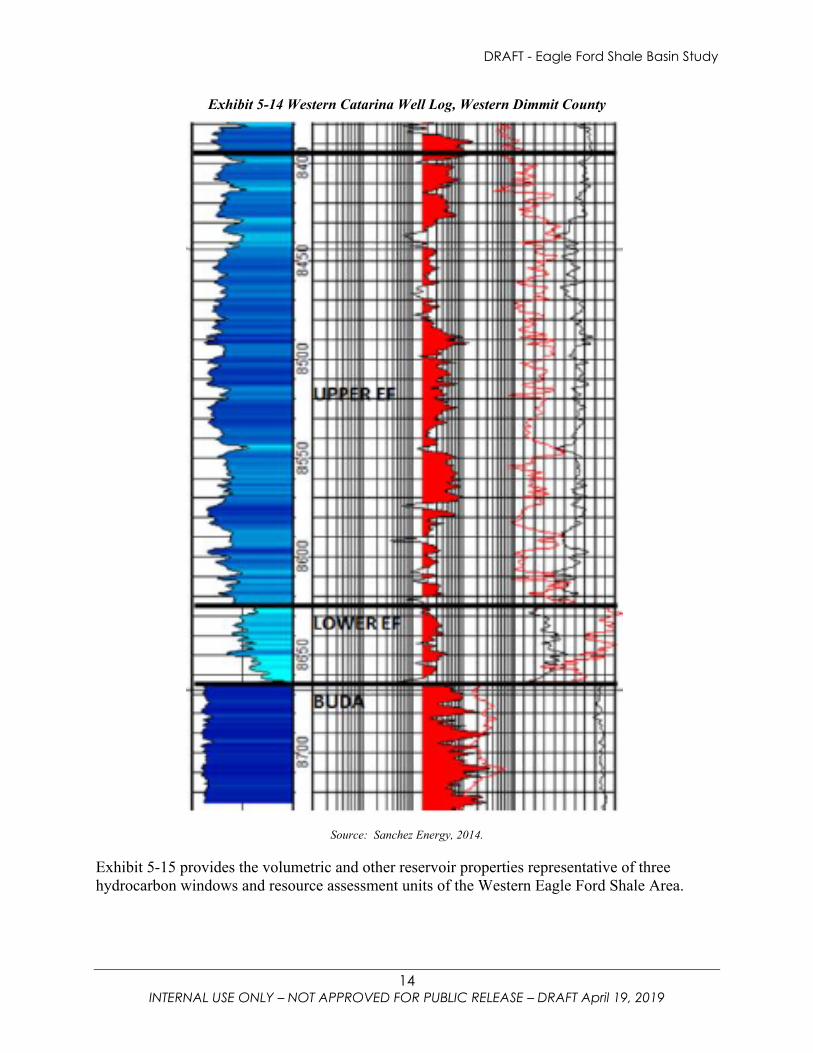
The gross interval of the Eagle Ford Shale thickens dramatically in the Western Shale Area. However, much of this thicker interval is the lower TOC Upper Eagle Ford Shale. While the Upper Eagle Ford Shale in the Western Dimmit County portion of the Eagle Ford Shale may have development potential, this Shale Unit has not been included in the resource estimates provided in this Basin Report, Exhibit 5-14. The study estimates a net pay for the Lower Eagle Ford Shale in the Western Shale Area of 80 to 120 ft. Reservoir porosity is estimated at 8 percent, with a matrix oil saturation of 80 percent. The solution gas-oil ratios range from 0.6 to 4 Mcf/B, linked to formation volume factors that range from 1.33 to 2.1 RB/STB.
DRAFT - Eagle Ford Shale Basin Study
14 INTERNAL USE ONLY – NOT APPROVED FOR PUBLIC RELEASE – DRAFT April 19, 2019
Exhibit 5-14 Western Catarina Well Log, Western Dimmit County
Source: Sanchez Energy, 2014.
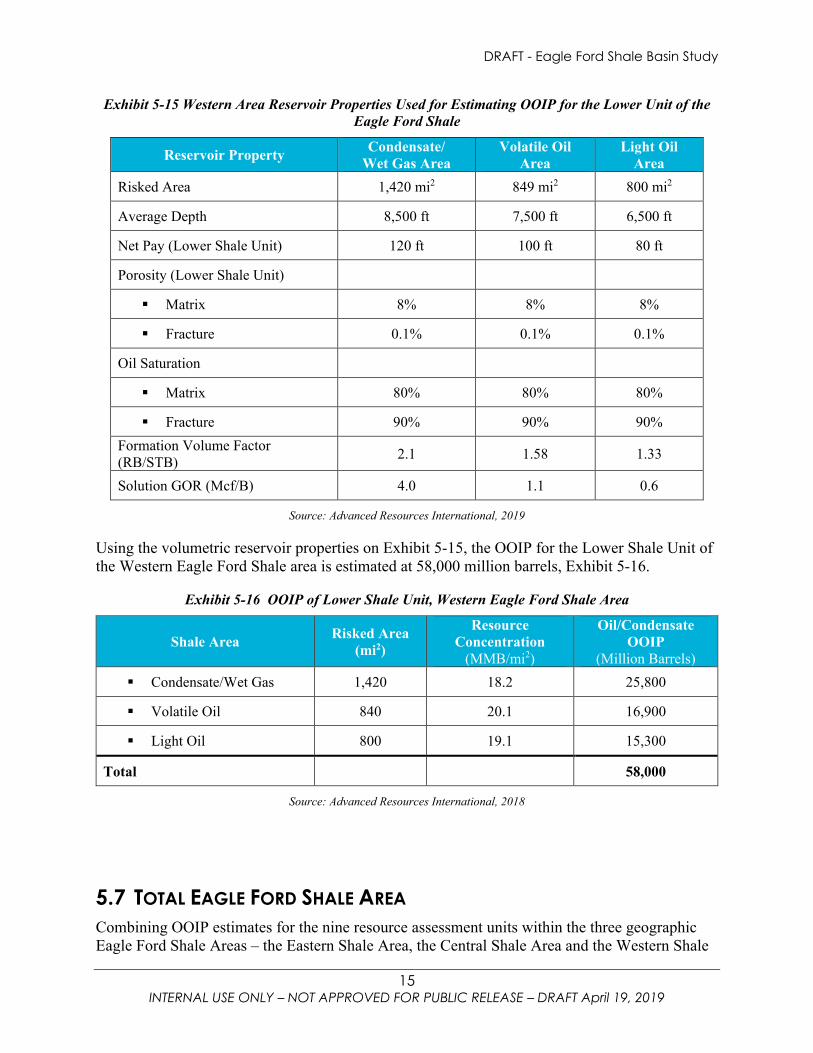
Exhibit 5-15 provides the volumetric and other reservoir properties representative of three hydrocarbon windows and resource assessment units of the Western Eagle Ford Shale Area.
DRAFT - Eagle Ford Shale Basin Study
15 INTERNAL USE ONLY – NOT APPROVED FOR PUBLIC RELEASE – DRAFT April 19, 2019
Exhibit 5-15 Western Area Reservoir Properties Used for Estimating OOIP for the Lower Unit of the Eagle Ford Shale
Reservoir Property Condensate/ Wet Gas Area
Volatile Oil Area
Light Oil Area
Risked Area 1,420 mi2 849 mi2 800 mi2
Average Depth 8,500 ft 7,500 ft 6,500 ft
Net Pay (Lower Shale Unit) 120 ft 100 ft 80 ft
Porosity (Lower Shale Unit)
Matrix 8% 8% 8%
Fracture 0.1% 0.1% 0.1%
Oil Saturation
Matrix 80% 80% 80%
Fracture 90% 90% 90% Formation Volume Factor (RB/STB) 2.1 1.58 1.33
Solution GOR (Mcf/B) 4.0 1.1 0.6
Source: Advanced Resources International, 2019
Using the volumetric reservoir properties on Exhibit 5-15, the OOIP for the Lower Shale Unit of the Western Eagle Ford Shale area is estimated at 58,000 million barrels, Exhibit 5-16.
Exhibit 5-16 OOIP of Lower Shale Unit, Western Eagle Ford Shale Area
Shale Area Risked Area (mi2)
Resource Concentration
(MMB/mi2)
Oil/Condensate OOIP
(Million Barrels) Condensate/Wet Gas 1,420 18.2 25,800
Volatile Oil 840 20.1 16,900
Light Oil 800 19.1 15,300
Total 58,000
Source: Advanced Resources International, 2018
5.7 TOTAL EAGLE FORD SHALE AREA Combining OOIP estimates for the nine resource assessment units within the three geographic Eagle Ford Shale Areas – the Eastern Shale Area, the Central Shale Area and the Western Shale
DRAFT - Eagle Ford Shale Basin Study
16 INTERNAL USE ONLY – NOT APPROVED FOR PUBLIC RELEASE – DRAFT April 19, 2019
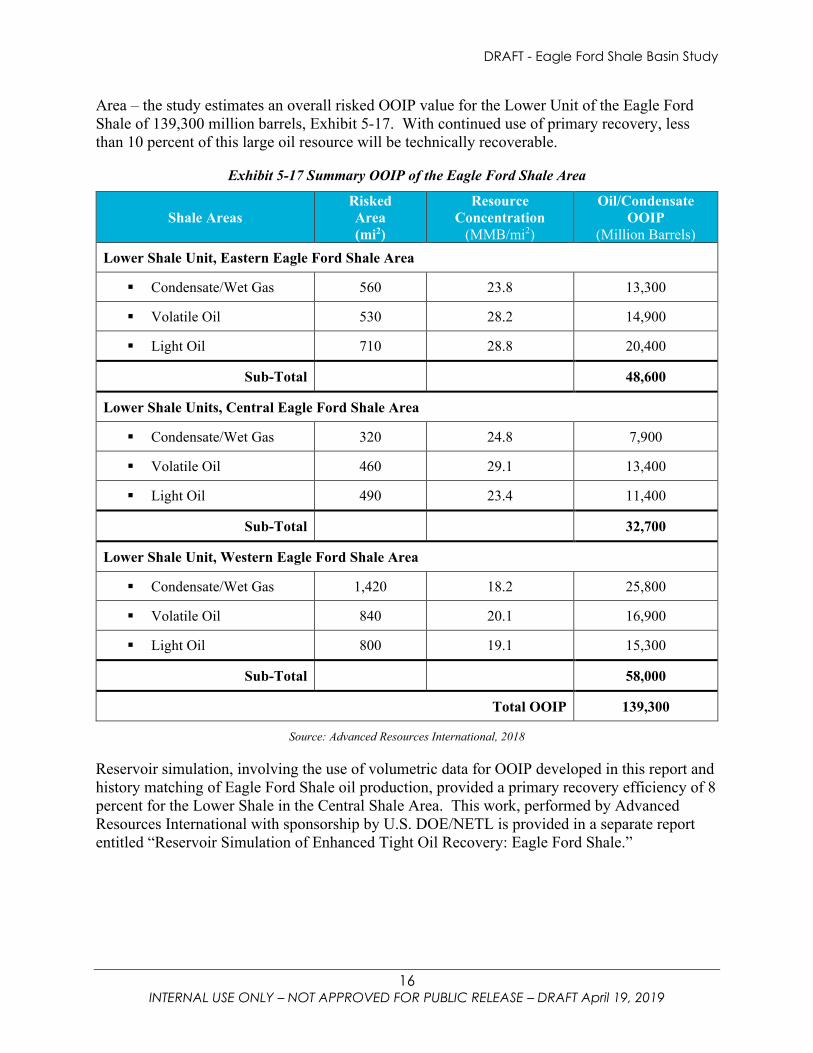
Area – the study estimates an overall risked OOIP value for the Lower Unit of the Eagle Ford Shale of 139,300 million barrels, Exhibit 5-17. With continued use of primary recovery, less than 10 percent of this large oil resource will be technically recoverable.
Exhibit 5-17 Summary OOIP of the Eagle Ford Shale Area
Shale Areas Risked Area (mi2)
Resource Concentration
(MMB/mi2)
Oil/Condensate OOIP
(Million Barrels) Lower Shale Unit, Eastern Eagle Ford Shale Area
Condensate/Wet Gas 560 23.8 13,300
Volatile Oil 530 28.2 14,900
Light Oil 710 28.8 20,400
Sub-Total 48,600
Lower Shale Units, Central Eagle Ford Shale Area
Condensate/Wet Gas 320 24.8 7,900
Volatile Oil 460 29.1 13,400
Light Oil 490 23.4 11,400
Sub-Total 32,700
Lower Shale Unit, Western Eagle Ford Shale Area
Condensate/Wet Gas 1,420 18.2 25,800
Volatile Oil 840 20.1 16,900
Light Oil 800 19.1 15,300
Sub-Total 58,000
Total OOIP 139,300
Source: Advanced Resources International, 2018
Reservoir simulation, involving the use of volumetric data for OOIP developed in this report and history matching of Eagle Ford Shale oil production, provided a primary recovery efficiency of 8 percent for the Lower Shale in the Central Shale Area. This work, performed by Advanced Resources International with sponsorship by U.S. DOE/NETL is provided in a separate report entitled “Reservoir Simulation of Enhanced Tight Oil Recovery: Eagle Ford Shale.”
DRAFT - Eagle Ford Shale Basin Study
17 INTERNAL USE ONLY – NOT APPROVED FOR PUBLIC RELEASE – DRAFT April 19, 2019
6 REFERENCES Carrizo Oil & Gas, 2019, Goldman Sachs Global Energy Conference 2019, January.
Chesapeake Energy, January 2019 Update, www.cheseapeake.com.
Cipolla, C. L., Lolon, E., Mayerhofer, M. J., & Warpinski, N. R. (2009, January 1). The Effect of Proppant Distribution and Un-Propped Fracture Conductivity on Well Performance in Unconventional Gas Reservoirs. Society of Petroleum Engineers. doi:10.2118/119368-MS.
Donovan, A.D., and S. Staerker, 2010. Sequence stratigraphy of the Eagle Ford (Boquillas) formation in the subsurface of South Texas and the outcrops of West Texas: Gulf Coast Association of Geologic Societies Transactions, v. 60, p. 861-899.
Fairbanks, Michael & Ruppel, Stephen & Rowe, Harry. (2016). High-resolution stratigraphy and facies architecture of the Upper Cretaceous (Cenomanian–Turonian) Eagle Ford Group, Central Texas. AAPG Bulletin. 100. 379-403. 10.1306/12071514187.
Gala, D., & Sharma, M. (2018, September 24). Compositional and Geomechanical Effects in Huff-n-Puff Gas Injection IOR in Tight Oil Reservoirs. Society of Petroleum Engineers. doi:10.2118/191488-MS
Hendershott, Z. P., 2012. "Evaluation of the depositional environment of the Eagle Ford Formation using well log, seismic, and core data in the Hawkville Trough, LaSalle and McMullen counties, south Texas" (2012). LSU Master's Theses. 863.https://digitalcommons.lsu.edu/gradschool_theses/863
Petrohawk, IPAA & TIPRO Leaders in Industry Luncheon, July 8, 2009.
Pioneer Natural Resources, Deutsche Bank Energy, Utilities & Power Conference, May 28, 2009.
Raterman, K. T., Farrell, H. E., Mora, O. S., Janssen, A. L., Gomez, G. A., Busetti, S., Warren, M. (2017, July 24). Sampling a Stimulated Rock Volume: An Eagle Ford Example. Unconventional Resources Technology Conference. doi:10.15530/URTEC-2017-2670034
Sanchez Energy Corporation, Analyst Day Presentation, August 26, 2014, www.sanchezenergycorp.com
Stoneburner, R.K., The Exploration, Appraisal and Development of Unconventional Reservoirs: A New Approach to Petroleum Geology”, Search and Discovery Article #41115(2013), AAPG Distinguished Lecturer Presentation at the Tulsa Geological Society Luncheon Meeting, January 29, 2013.
TXCO Resources, Howard Weil 37th Annual Energy Conference, New Orleans, March 22-26, 2009.
U.S. Energy Information Administration (2014) Updates to the EIA Eagle Ford Play Maps, December.
www.netl.doe.gov
Albany, OR • Anchorage, AK • Morgantown, WV • Pittsburgh, PA • Sugar Land, TX
(800) 553-7681
Name of NETL Contact E-mail
Name of SubCLIN Lead E-mail