using seismic inversion and net pay to calibrate eagle ford shale producible ... · using seismic...
TRANSCRIPT
Using Seismic Inversion and Net Pay to Calibrate Eagle Ford Shale Producible Resources
Bo Chen1, Dhananjay Kumar1, Anthony Uerling2, Sheryl Land2, Omar Aguirre2, Tao Jiang1, and Setiawardono Sugianto1
1BP America, 501 Westlake Park Blvd., Houston, Texas 77079
2BP America, 737 N. Eldridge Pkwy., Houston, Texas 77079
GCAGS Explore & Discover Article #00104* http://www.gcags.org/exploreanddiscover/2016/00104_chen_et_al.pdf
Posted September 13, 2016. *Abstract published in the GCAGS Transactions (see footnote reference below) and delivered as an oral presentation at the 66th Annual GCAGS Convention and 63rd Annual GCSSEPM Meeting in Corpus Christi, Texas, September 18–20, 2016.
ABSTRACT
The production outcome of an Eagle Ford well depends on many factors including reservoir properties. This paper discusses an utilization of seismic attributes to predict them and identify the high production potential areas. Multiple studies have identified the sweet spots in unconventional plays, however not many have been directly correlated with and confirmed by the production data. We studied the production data and ana-lyzed the reservoir characteristics associated with it taking into account the operation procedures. It was found that the producible resources lie in the thicker and more po-rous intervals. Both thickness and porosity can be determined with seismic data. Seis-mic inversion is utilized for porosity prediction and seismic net pay for ‘net’ thickness prediction with higher porosity. The seismic net pay, confirmed by the blind well log data, has been used to predict the producible resources for future wells in the Eagle Ford shale in South Texas. The study includes the following four steps. First, a correlation between the petrophysical net pay and the estimated production volume is established. Well logs are analyzed to establish a method to predict net pay from seismic data. Sec-ond, post migration seismic data conditioning is applied to improve seismic data quality, by attenuating noises, flattening the gathers, and balancing the frequency spectrum and amplitude across offsets. Good quality seismic data are required for seismic net pay estimation. Third, using the conditioned seismic data, colored inversion is applied to invert the reflectivity data to relative acoustic impedance. Acoustic impedance is in-versely proportional to porosity and is used to predict porosity in the lower Eagle Ford Shale. Finally, seismic net pay is calculated by detuning the relative acoustic impedance and integrating over the gross thickness intervals. To quality control (QC) the results, the predicted seismic net pay is compared with well log data and estimated production data. We found that seismic net pay in the lower Eagle Ford as an indicator of its reser-voir quality. The reliable estimation of seismic net pay requires an understanding of the rock properties, good quality well data, seismic data conditioning, well calibrated hori-zons, and accurate seismic inversion for impedance followed by porosity prediction.
Originally published as: Chen, B., D. Kumar, A. Uerling, S. Land, O. Aguirre, T. Jiang, and S. Sugianto, 2016, Using seismic inversion and net pay to calibrate Eagle Ford Shale producible resources: Gulf Coast Association of Geological Societies Transactions, v. 66, p. 927.
1
Using Seismic Inversion and Net Pay
to Calibrate Eagle Ford Shale
Producible Resources
B. Chen, D. Kumar, A. Uerling, S. Land,
O. Aguirre, T. Jiang, S. Sugianto
BP America Inc.
1

Objectives
• Identify key petrophysical properties driving
production
• Predict such rock properties from seismic
2
Outline
• Studied area
• Petrophysical analysis
• Seismic data conditioning
• Seismic (coloured) inversion
• Seismic net pay
• Conclusions
3

Production Potential Prediction
EU
R (
bcf
)
Log High Quality Shale Thickness (ft)
EU
R (
bcf
)
Seismic Net Pay (ft)
2R =0.726 2R =0.728
Log and seismic derived high quality
shale (HQS) thickness correlate well
with EUR when operation is the same.
4

Studied Area
Seismic Survey
Studied area is
located in the dry
gas window,
western portion
of Eagle Ford
play.
5
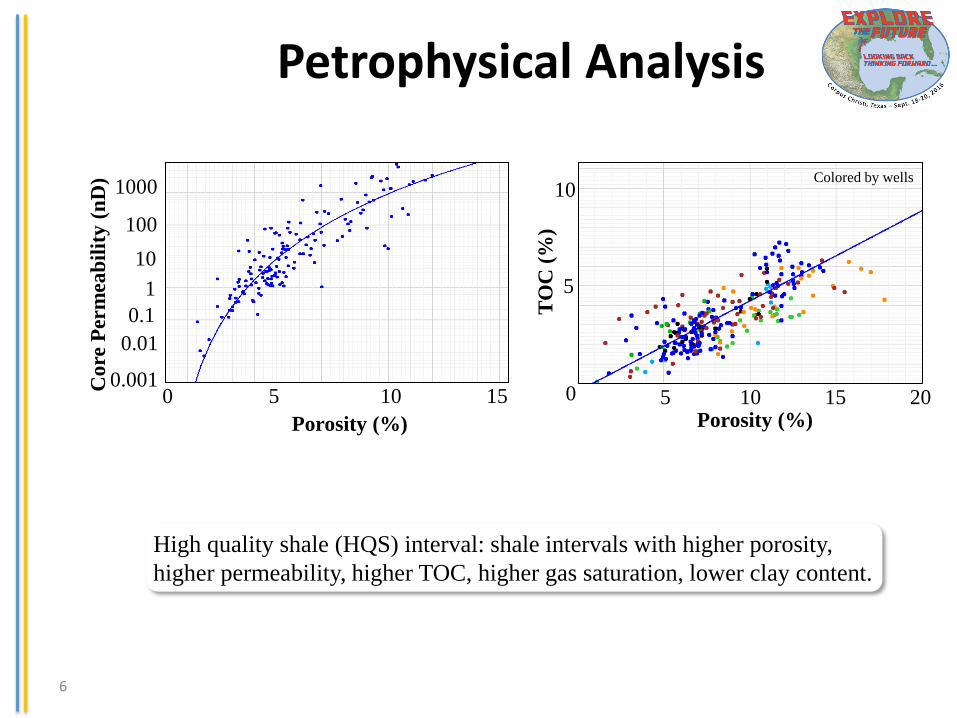
Petrophysical Analysis
Porosity (%)
Co
re P
erm
eab
ilit
y (
nD
)
0 5 10 15 0.001
0.01
0.1
1
10
100
1000
0
5
TO
C (
%)
Porosity (%) 5 10 15 20
10
High quality shale (HQS) interval: shale intervals with higher porosity,
higher permeability, higher TOC, higher gas saturation, lower clay content.
6
Colored by wells

Rock Quality versus EUR
R² = 0.38
R² = 0.73
Seismic shows
more porous and
thicker rocks than
nearby pilot
Close to fault
HQS intervals
Gross intervals
EU
R (
bcf
)
TGIP (bcf/section)
EU
R (
bcf
)
TGIP (bcf/section)
Resources in High Quality Shale
form stronger correlation with EUR
with the same completion designs.
7

Petrophysical Analysis Well A Well B Well C Well D
Ray PHIT Perm flag Ray PHIT Perm flag Ray PHIT Perm flag Ray PHIT Perm flag Gamma HQS Gamma HQS Gamma HQS Gamma HQS
50ft
154
137
TGIP (bcf/section)
Gross Interval
HQS Interval
68
22
76
74
165
134
8

Seismic Data Conditioning Before LEF Instantaneous Amplitude
After LEF Instantaneous Amplitude
Post-migration seismic data
conditioning reduced noise, increased
the resolution and improved the
amplitude fidelity.
3km
3km
Mismatch Buda LEF
After
100 ms
1km Buda LEF
UEF
D oublet
Before
100 ms
1km
UEF
20
- 10
- 20
- 30
4 0 6 0 8 0
20
- 10
- 20
- 30
4 0 6 0 8 0
(Hz)
(dB)
(Hz)
(dB) Before
After
Red: trough
Blue: peak
low
high
low
high
9
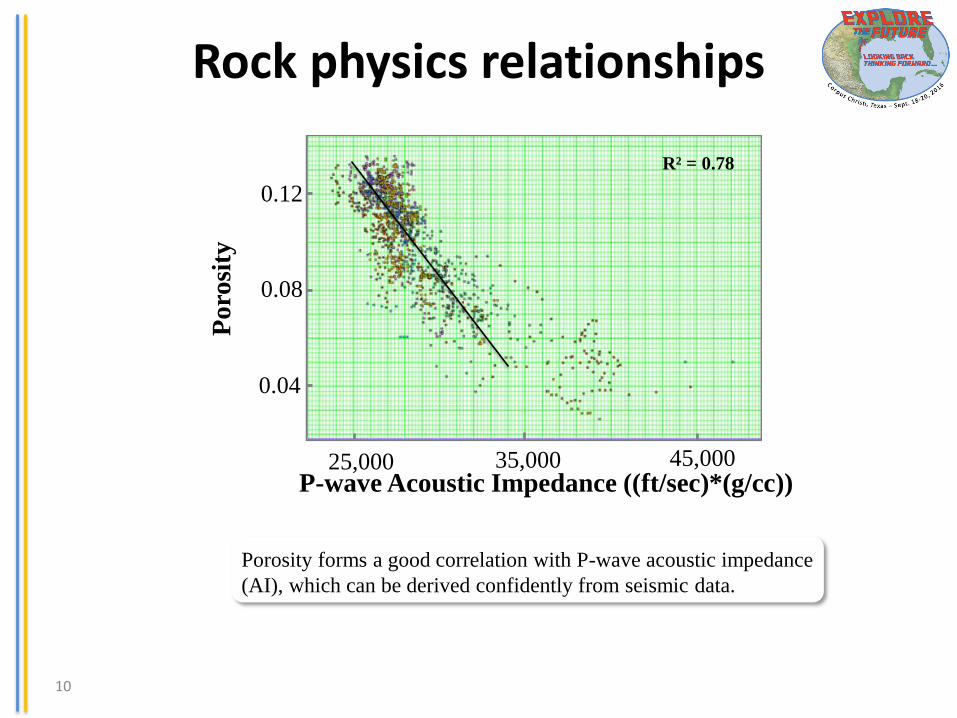
Rock physics relationships
Porosity forms a good correlation with P-wave acoustic impedance
(AI), which can be derived confidently from seismic data.
R² = 0.78
P-wave Acoustic Impedance ((ft/sec)*(g/cc)) 25,000 35,000 45,000
Poro
sity
0.04
0.08
0.12
10

Seismic (coloured) Inversion Inversion operator
Inversion QC with wells
Coloured inversion (CI) and
model-based inversion (MBI)
generated similar results.
(Kumar et al., 2014)
Coloured inversion (CI)
provides bandlimited
(relative) impedance
Log: red Seismic: blue
(Lancaster & Whitecombe, 2000)
20k 60k -12k 12k
MBI CI
11
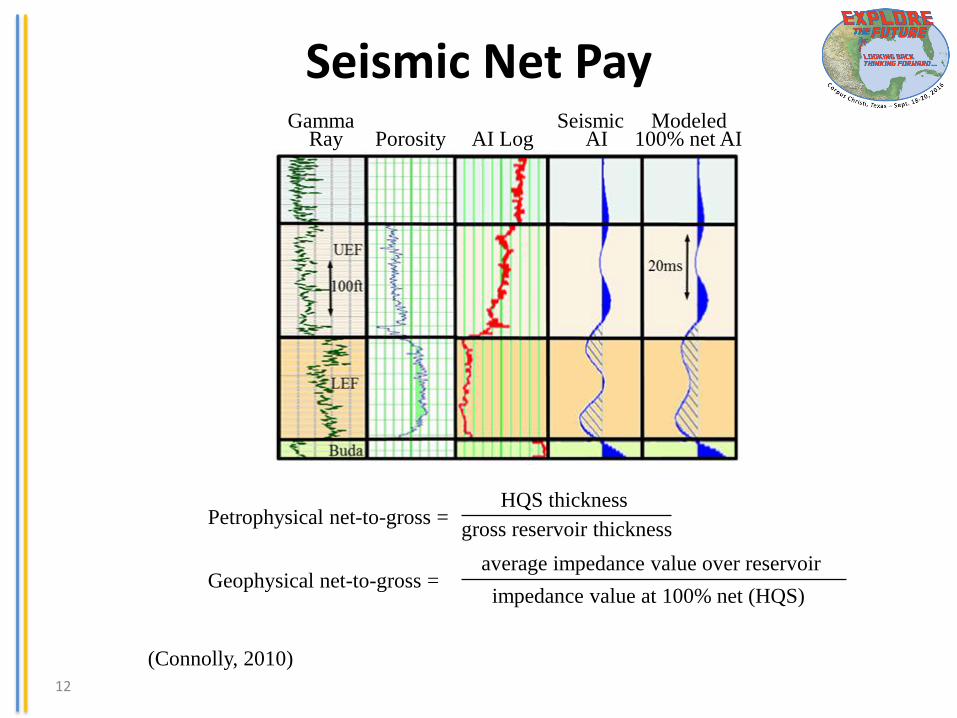
Seismic Net Pay
12
Petrophysical net-to-gross = HQS thickness
gross reservoir thickness
Geophysical net-to-gross = average impedance value over reservoir
impedance value at 100% net (HQS)
(Connolly, 2010)
Ray Porosity AI Log AI 100% net AI Gamma Seismic Modeled

Seismic Net Pay
Tim
e (m
s)
Sei
smic
Net
to
Gro
ss
Max seismic net to gross Average band-limited
impedance Apparent thickness
Time Thickness (ms)
Ap
pa
rent T
hick
ness (m
s) Wedge model
13
Time Thickness (ms)
200
150
100
50
0
0 50 100 150 200 0 50 100 150 200
0.2
0.4
0.6
0.8
1
150
100
50
0
Seismic net-to-gross = average seismic impedance
average modeled impedance for 100% net (HQS)
true thickness (ms)
apparent thickness (ms) ×
Seismic net pay = seismic net-to-gross × apparent thickness
Top
Base data range
(Connolly, 2007)
data range

Seismic Maps
(ms) 3km
(%) 3km
(ft) 3km
0
5
10
15
0
10
20
30
40
0
200
50
100
150
Time thickness Inverted porosity
Seismic net pay
Seismic net pay more directly
characterizes the sweet spot
distributions than thickness or
porosity maps alone.
14
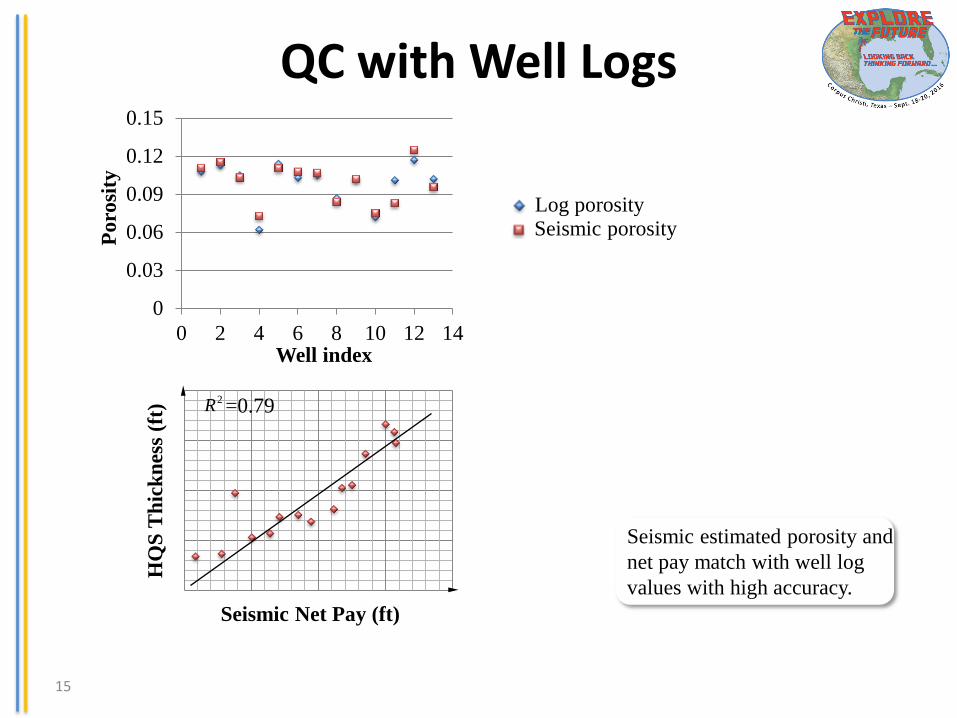
QC with Well Logs
0
0.03
0.06
0.09
0.12
0.15
0 2 4 6 8 10 12 14
Log porosity Seismic porosity
Po
rosi
ty
Well index
HQ
S T
hic
kn
ess
(ft)
Seismic Net Pay (ft)
2R =0.79
Seismic estimated porosity and
net pay match with well log
values with high accuracy.
15

Seismic Prediction of EUR
EU
R (
bcf
)
Log HQS thickness (ft)
EU
R (
bcf
)
Seismic Net Pay (ft)
2R =0.726 2R =0.728
The seismic net pay correlation to EUR is as good
as the correlation with well log HQS thickness.
16

Conclusions
• TGIP in HQS (high quality shale) intervals correlates
well with EUR.
• Seismic (coloured) inversion and seismic net pay
methods generate reliable porosity and HQS thickness.
• Seismic derived HQS can predict EF shale sweet spots.
Plan new wells
Identify refrac candidates
Appraise completion trials
17

Acknowledgements
• BP Lower 48 and BP Upstream Technology
• Numerous BP colleagues’ suggestions and
feedback, including C. Sullivan, W. Simpson,
C. Lazos, A. Cunningham, J. Zhang, S.
Davis, S. Li, L. Sarle, M. Blome, etc.
18

References
• Connolly, P., 2007, A simple, robust algorithm for seismic
net pay estimation: The Leading Edge, 26, 1278-1282, doi:
10.1190/1.2794386
• Connolly, P. A., 2010, Robust workflows for seismic
reservoir characterization: SEG Distinguished Lecture.
• Kumar, D., Sugianto, H., Li, S., Patel, H. and Land S., 2014,
Using relative seismic impedance to predict porosity in the
Eagle Ford shale: SEG Technical Program Expanded
Abstracts, 2688-2692, doi: 10.1190/segam2014-0473.1
• Lancaster, S. and D. Whitecombe, 2000, Fast-track Coloured
Inversion: SEG expanded abstract, doi: 10.1190/1.1815711
19

Questions
20