energy sector vulnerability to climate change: adaptation
TRANSCRIPT

NREL is a national laboratory of the U.S. Department of Energy, Office of Energy Efficiency and Renewable Energy, operated by the Alliance for Sustainable Energy, LLC.
Energy Sector Vulnerability to Climate Change: Adaptation Options to Increase Resilience
American Geophysical Union Fall Meeting
Robin L. Newmark, Dan Bilello, Jordan Macknick, KC Hallet, Ren AndersonNational Renewable Energy Laboratory
Vince TidwellSandia National Laboratories
Craig ZamudaU.S. Department of Energy
December 3, 2012
NREL/PR‐6A20‐57444

Innovation for Our Energy Future National Renewable Energy Laboratory
Energy and Adaptation: some recent efforts
First U.S. National Assessment of Possible Consequences of Climate Variability of Change, 1997-2000, considered “sectors”: agriculture, coastal areas and resources, forests, health, and water. Energy focus was on mitigation, not impacts or adaptation
U.S. Climate Change Science Program’s CCSP Synthesis & Assessment Product 4.5: How might climate change directly or indirectly affect U.S. energy production, supply and consumption?
2013 National Climate Assessment (in process) specifically addresses impacts, energy supply and use, vulnerabilities, interfaces, mitigation and adaptation.
The U.S. Department of Energy is conducting an assessment of vulnerabilities of the U.S. energy sector to climate change and extreme weather. Emphasizing peer reviewed research, it seeks to quantify vulnerabilities and identify specific knowledge or technology gaps. It draws upon a July 2012 workshop, “Climate Change and Extreme Weather Vulnerability Assessment of the US Energy Sector”, hosted by the Atlantic Council and sponsored by DOE to solicit industry input.

Innovation for Our Energy Future National Renewable Energy Laboratory
The DOE effort focuses on the implications of climate change projections on specific elements of the energy system
• Increasing temperature
• Limited water availability
• Sea level rise
• Increasing frequency and intensity of storms and flooding
• Oil and gas exploration and production
• Fuel transport• Thermoelectric power• Hydropower• Wind energy• Solar energy• Bioenergy• Electric grid• Electricity demand
Climate Change Energy Sector Impacts
Photo by NREL 19498Photo by Warren Gretz, NREL 07317

Innovation for Our Energy Future National Renewable Energy Laboratory
Chronic or gradual vs. extreme eventsSingle unit vs. corporate perspective
Local vs. regional or nationalSupply constraints vs. demand projections
Vulnerabilities occur across many dimensions;Stakeholder perspectives drive priorities*
Who pays?Currently, uncompensated costs are often covered by society (not the energy sector or insurance industry)
Energy system damages extend beyond physical systems into social impacts
Complex regulatory regimes are in placeWhat is vulnerable?
‐definition of a 100 yr flood plain‐what are appropriate rebuild standards?
Our increased dependence on electricity (e.g. today’s digital economy) is at odds with increased vulnerabilities to extreme weather and climate change
* Insights from July workshop

Innovation for Our Energy Future National Renewable Energy Laboratory
Finance
Political cycle
Capital stock
Time horizon for planning and risk assessment
1 yr 3-5 yrs 40-50 yrs Decades to millenia
Climate science
There is a disconnect between scales and timeframes of current scientific estimates and those needed by decision makers*
Local/regional planning
25-30 yrs
*In prioritizing vulnerabilities, considerations include the probability and frequency of events, the timeframe, the costs associated with it (direct, indirect and societal)

Innovation for Our Energy Future National Renewable Energy Laboratory
Recirculating Cooling Once‐through Cooling
Pond Cooling
Dry Cooling
Hybrid Cooling
No Cooling Required
CSP and PV
Biopower Nuclear Natural Gas
Coal
Source: Macknick et al., 2011
Ope
ratio
nal w
ater
con
sum
ptio
n (G
al/M
Wh)
An example: Water for thermoelectric power cooling
Power plants equipped with once-through cooling systems accounted for 92% of water withdrawals for thermoelectric power. Plants equipped with recirculating systems withdrew the remaining 8%
Thermoelectric power generation is the largest user of freshwater in the United States, withdrawing over 140,000 million gallons per day (MGD), accounting for 49% of total water use.
Source: Kenny et al, 2009
Innovation for Our Energy Future National Renewable Energy Laboratory
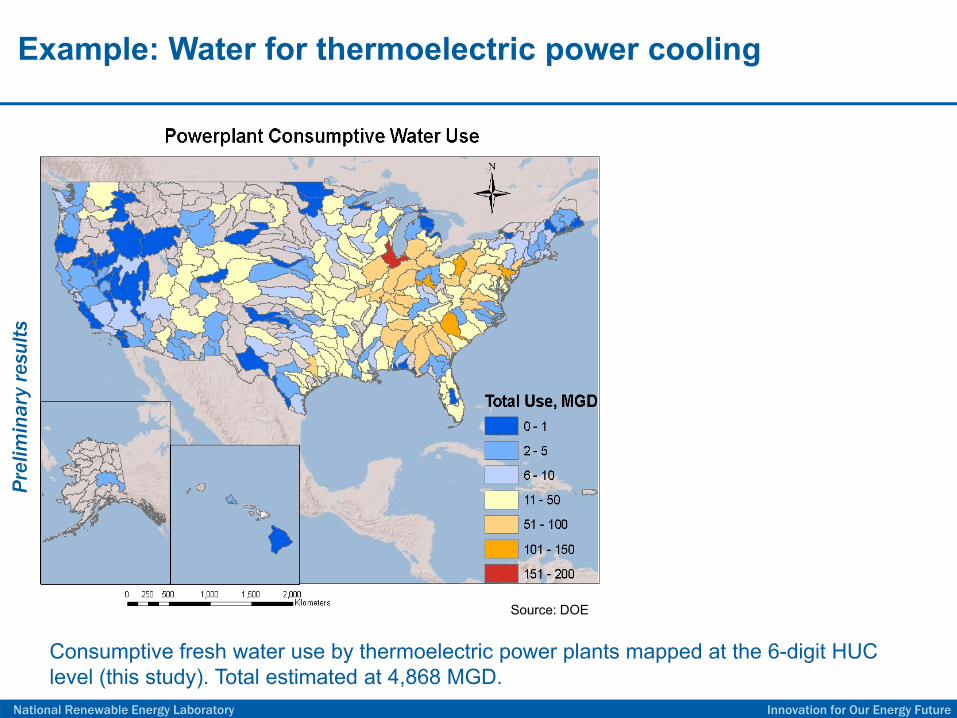
Example: Water for thermoelectric power cooling
Consumptive fresh water use by thermoelectric power plants mapped at the 6-digit HUC level (this study). Total estimated at 4,868 MGD.
Prel
imin
ary
resu
lts
Source: DOE

Innovation for Our Energy Future National Renewable Energy Laboratory
Example: Water for thermoelectric power cooling
Consider retrofitting current power plants for zero freshwater use: using non-potable water (brackish groundwater or municipal waste water) or converting to a dry cooling system
Consumptive fresh water use by thermoelectric power plants mapped at the 6-digit HUC level (this study). Total estimated at 4,868 MGD.
Prel
imin
ary
resu
lts
Source: DOE

Innovation for Our Energy Future National Renewable Energy Laboratory
Transitioning to zero freshwater withdrawal for thermoelectric generation: a scoping level analysis*
Retrofits considered: average difficulty, according to EPA guidelinesRecirculating cooling (first step for once-through cooling systems)
Dry coolingMunicipal waste waterBrackish groundwater
Costs:CapitalOperating and Maintenance (O&M) costsCapture (e.g., conveyance costs for waste water, drilling and pumping
costs for brackish groundwater)TreatmentParasitic energy losses
Availability:Municipal waste water: within 50 miles Brackish water: <2500 ft deep, salinities >10,000 TDS
* NOTE: not taking into consideration site-specific constraints such as land availability, local regulations, technology vintage
Prel
imin
ary
resu
lts

Innovation for Our Energy Future National Renewable Energy Laboratory
Transitioning to zero freshwater withdrawal for thermoelectric generation: retrofit options and ∆LCOE*
*∆LCOE=Change in Levelized Cost of Electricity
For each of 1178 power plants using freshwater in a steam cycle1:Retrofit cost: once‐through to recirculating coolingDetermine availability of brackish and waste waterCost to convert each power plant:‐ waste water‐ brackish water‐ dry cooling
Select least cost alternativeCalculate reduction in water demandAggregate results at the HUC‐6 level
Technology Average capital cost
Waste water $4.8 MBrackish water $12.9 MDry cooling $120 M
0
20
40
60
80
100
120
140
160
Numbe
r of P
lants
Retrofit Cost ($/MWh)
Cost to Retrofit
Prel
imin
ary
resu
lts
Sources: 1. EIA 2010; figures from DOE

Innovation for Our Energy Future National Renewable Energy Laboratory
Transitioning to Zero Freshwater Withdrawal for Thermoelectric Generation: ∆LCOE associated with retrofit
Note: ∆LCOEs tend to be lower in the West, Texas Gulf Coast and south Florida, which are areas prone to drought stress
Technology Number of plants
Waste water 823Brackish water 109Dry cooling 246
*average 2012 wholesale cost over 3 US trading hub regions
With wholesale cost of electricity about $40/MWh*, many retrofits could be accomplished at levels that would add less than 10% to current power plant
generation expenses.
Prel
imin
ary
resu
lts
Source: DOE

Innovation for Our Energy Future National Renewable Energy Laboratory
Transitioning to zero freshwater withdrawal for thermoelectric generation: potential water savings
Applying a simple metric to identify regions susceptible to drought stress where the consumptive use of water approaches 70% of the physical supply (see Tidwell et al., 2012 for details), we find that retrofitting power plants in drought‐vulnerable watersheds could save 847 MGD or about 17% of all thermoelectric consumption.
∆LCOEs for such retrofits are generally below $5/MWh.
Prel
imin
ary
resu
lts
Source: DOE

Innovation for Our Energy Future National Renewable Energy Laboratory
Plant managerUtility
Regional resource manager
Planning and risk assessment scale and timeframe
Single unit
Multiple plants
Competing uses
National policy maker
Such an investment will be viewed differently based on the stakeholder’s perspective
Competing uses
They all could benefit from higher resolution in the fundamental scientific inputs and projections
Average ΔLCOE to retrofit all 1178 U.S. plants is $6.3‐$8.9/MWh* with a range from $0.3 ‐ $900/MWh. *discount rates of 3% and 10%, respectively
Average capital costs range from $4.8M to $120M, depending on the technology
Opportunity to “free up” some freshwater resourcesPr
elim
inar
y re
sults