climate change vulnerability in agriculture and adaptation …
TRANSCRIPT

CLIMATE CHANGE VULNERABILITY IN AGRICULTURE AND
ADAPTATION STRATEGIES OF FARMERS TO CLIMATIC STRESSES IN
KONYA, TURKEY
A THESIS SUBMITTED TO
THE GRADUATE SCHOOL OF NATURAL AND APPLIED SCIENCES
OF
MIDDLE EAST TECHNICAL UNIVERSITY
BY
MELİKE KUŞ
IN PARTIAL FULFILLMENT OF THE REQUIREMENTS
FOR
THE DEGREE OF DOCTOR OF PHILOSOPHY
IN
EARTH SYSTEM SCIENCE
MAY 2019


Approval of the thesis:
CLIMATE CHANGE VULNERABILITY IN AGRICULTURE AND
ADAPTATION STRATEGIES OF FARMERS TO CLIMATIC STRESSES IN
KONYA, TURKEY
submitted by MELİKE KUŞ in partial fulfillment of the requirements for the degree
of Doctor of Philosophy in Earth System Science Department, Middle East
Technical University by,
Prof. Dr. Halil Kalıpçılar
Dean, Graduate School of Natural and Applied Sciences
Prof. Dr. Cemal Can Bilgin
Head of Department, Earth System Science
Prof. Dr. Helga Rittersberger-Tılıç
Supervisor, Earth System Science, METU
Assoc. Prof. Dr. Uğur Murat Leloğlu
Co-Supervisor, Geodetic and Geographic Information
Technologies, METU
Examining Committee Members:
Prof. Dr. Zuhal Akyürek
Department of Civil Engineering, METU
Prof. Dr. Helga Rittersberger-Tılıç
Earth System Science, METU
Prof. Dr. İlkay Dellal
Department of Agricultural Economics, Ankara University
Prof. Dr. Mehmet Ali Çullu
Department of Agriculture, Harran University
Prof. Dr. Bülent Gülçubuk
Agricultural Economics, Ankara University
Date: 30.05.2019

iv
I hereby declare that all information in this document has been obtained and
presented in accordance with academic rules and ethical conduct. I also declare
that, as required by these rules and conduct, I have fully cited and referenced all
material and results that are not original to this work.
Name, Surname:
Signature:
Melike Kuş

v
ABSTRACT
CLIMATE CHANGE VULNERABILITY IN AGRICULTURE AND
ADAPTATION STRATEGIES OF FARMERS TO CLIMATIC STRESSES IN
KONYA, TURKEY
Kuş, Melike
Doctor of Philosophy, Earth System Science
Supervisor: Prof. Dr. Helga Rittersberger-Tılıç
Co-Supervisor: Assoc. Prof Dr. Uğur Murat Leloğlu
May 2019, 150 pages
Agriculture is highly vulnerable to climatic changes and extremes as it is generally an
outdoor activity. Its vulnerability to climate change is estimated at different scales and
then policies are developed to reduce sensitivity and improve adaptive capacity of the
farmers accordingly. Assessments at different scales use different methodologies and
indicators, which result in incomparable outcomes. Macro scale assessments lack
further validation of the results at the local level, and the local level assessments do
not clarify to what extent the household level vulnerability is generalizable to upper
scales. Existing literature lacks a methodology combining the vulnerability
assessments at different scales and determining the drivers of vulnerability acting at
these scales. This thesis develops a multi scale approach to evaluate climate change
vulnerability in agriculture sector using comparable indicators at district and
household levels. Selection and weighing of indicators used in the calculation of
vulnerability are generally criticized in terms of subjectivity. In this study, an index is
developed using district level data and a socio-economic survey is conducted to
evaluate the success of the selected indicators in explaining the variation in
vulnerability levels of the farmers. In order to determine the vulnerability levels of the
farmers, a new vulnerability calculation method is introduced. Household level

vi
vulnerability is defined as a function of crop losses due to climatic changes and
extremes and the difficulty level of compensation of the losses.
Household level data is analyzed using both linear (Multiple Linear Regression) and
non-linear regression (Random Forest) methods to understand the structure of the data
better and find out the significant indicators with a model with higher explanatory
power. The results show that the indicator approach can be used for determining
highly vulnerable areas for prioritizing the actions at the macro scale. The factors
significantly affecting the household level vulnerability are dependency ratio of the
household, number of memberships to agricultural organizations, percentage of land
with good soil quality and percentage of rain-fed land. The results also show that
increasing number of livestock and agricultural equipment owned significantly
contribute to adaptive behavior of the farmers. The results of this study can help policy
makers to prioritize the policy subjects and implementation areas to get more
influential results.
Keywords: Climate change adaptation; Climate change vulnerability index; Multiple
linear regression; Random forest regression

vii
ÖZ
KONYA’DA TARIMIN İKLİM DEĞİŞİKLİĞİ KIRILGANLIĞI VE
ÇİFTÇİLERİN İKLİMSEL STRESLERE UYUM STRATEJİLERİ
Kuş, Melike
Doktora, Yer Sistem Bilimleri
Tez Danışmanı: Prof. Dr. Helga Rittersberger-Tılıç
Ortak Tez Danışmanı: Doç. Dr. Uğur Murat Leloğlu
Mayıs 2019, 150 sayfa
Tarımsal üretim çoğunlukla bir dış mekan faaliyeti olduğundan iklimsel
değişkenliklerden oldukça etkilenmektedir. Tarımın iklimsel değişkenliklere ve aşırı
iklim olaylarına karşı olan kırılganlığı farklı ölçeklerde tahmin edilmekte ve buna
bağlı olarak çiftçilerin hassasiyetlerini azaltmak ve uyum kapasitelerini arttırmak için
politikalar geliştirilmektedir. Farklı ölçeklerdeki değerlendirmeler farklı yöntemler ve
göstergeler kullanmaktadır, ki bu birbiriyle karşılaştırılamayan çıktıların oluşmasına
sebep olmaktadır. Makro ölçek analizler sonuçların yerel seviyede doğrulandığı ileri
doğrulamaya sahip değilken, yerel seviye analizler hanehalkı düzeyinde kırılganlığın
üst ölçeklere ne ölçüde genellenebileceğine açıklık getirmemektedir. Mevcut
literatürde, farklı ölçeklerdeki kırılganlık analizlerini bir araya getiren ve bu
ölçeklerdeki kırılganlığın dinamiklerini belirleyen bir yöntem bulunmamaktadır. Bu
tez çalışması, tarım sektöründe iklim değişikliğine karşı kırılganlığın
değerlendirilmesi için ilçe ve hanehalkı seviyesinde birbiriyle karşılaştırılabilir
göstergeler kullanarak çok-ölçekli bir yaklaşım geliştirmiştir. Kırılganlığın
hesaplanmasında kullanılan göstergeler ve bunların ağırlıklandırılması genellikle
öznellik açısından eleştirilmektedir. Bu çalışmada, ilçe seviyesi veriler kullanılarak
bir endeks oluşturulmuş ve seçilen göstergelerin çiftçilerin kırılganlık seviyelerindeki
viii
değişimi açıklamadaki başarılarının değerlendirilmesi için bir sosyo-ekonomik
araştırma yürütülmüştür. Çiftçilerin kırılganlık seviyelerinin belirlenmesi için yeni bir
kırılganlık hesaplama yöntemi sunulmuştur. Hanehalkı kırılganlık seviyesi iklimsel
değişikliklerden kaynaklı ürün kayıpları ve bu kayıpların telafi edilmesindeki
zorluğun bir fonksiyonu olarak tanımlanmıştır. Hanehalkı düzeyindeki veri yapısının
daha iyi anlaşılması ve önemli göstergelerin açıklayıcı gücü yüksek bir modelle
bulunması için hem doğrusal (Çoklu Doğrusal Regresyon), hem de doğrusal olmayan
(Rastgele Orman) yöntemlerle analiz edilmiştir. Sonuçlar, gösterge yaklaşımının
makro ölçekte faaliyetlerin önceliklendirilmesi için en kırılgan alanların seçilmesinde
kullanılabileceğini göstermiştir. Hanehalkı seviyesinde kırılganlığı en çok etkileyen
faktörler hanehalkının bağımlı nüfus oranı, tarım ile ilgili örgütlere üyelik sayısı,
kaliteli toprağa sahip arazi yüzdesi ve kuru tarım arazisinin yüzdesidir. Sonuçlar
ayrıca sahip olunan çiftlik hayvanı ve tarımsal ekipmanların sayısının artmasının
çiftçilerin uyum davranışlarına önemli katkıları olduğunu göstermiştir. Bu çalışmanın
sonuçları, politika yapıcılara daha etkili sonuçlar elde edilmesi için politika konuları
ve uygulama alanlarının önceliklendirilmesinde yardımcı olacaktır.
Anahtar Kelimeler: İklim değişikliğine uyum; İklim değişikliği kırılganlığı endeksi;
Çoklu doğrusal regresyon; Rastgele orman regresyonu

ix
To vulnerable livings of a planet with changed climates.

x
ACKNOWLEDGEMENTS
First and foremost, I would like to express my sincerest gratitude to my supervisor
Prof. Dr. Helga Rittersberger-Tılıç and co-supervisor Ass. Prof. Dr. Uğur Murat
Leloğlu for their continuous guidance and invaluable support. I feel very lucky to have
a chance to work with them.
I would also like to thank to Prof. Dr. Mehmet Ali Çullu and Prof. Dr. Erhan Akça for
their encouragement and technical support. They were always available to answer my
questions related to agriculture.
I would like to thank experts Beran Gezgin, Ülkü Ermetin, Mustafa Aktaş, Mehmet
Gültekin in Konya Provincial Directorate of Agriculture and Forestry and İrfan
Gültekin and Zafer Arısoy in Bahri Dağdaş International Agriculture Research
Institute, and Dr Mustafa Kan for their patience when I knocked their door with a lot
of questions and for providing me invaluable data.
Special thanks to Bekir Engürülü, Head of Agricultural Insurances and Natural
Disasters Directorate, for his critical comments and suggestions.
I cannot find words to express my gratitude to my parents and sister for their endless
encouragement and morale support.
Last but not least, I would like to express my gratitude to everyone in Doğa Koruma
Merkezi (Nature Conservation Centre) and in particular to Dr Uğur Zeydanlı for
encouraging me during my long journey.

xi
TABLE OF CONTENTS
ABSTRACT ................................................................................................................. v
ÖZ ........................................................................................................................... vii
ACKNOWLEDGEMENTS ......................................................................................... x
TABLE OF CONTENTS ........................................................................................... xi
LIST OF TABLES ................................................................................................... xiv
LIST OF FIGURES ................................................................................................ xvii
LIST OF ABBREVIATIONS ................................................................................ xviii
CHAPTERS
1. INTRODUCTION ................................................................................................ 1
2. LITERATURE REVIEW ..................................................................................... 5
2.1. Climate Change Vulnerability .......................................................................... 5
2.2. How Do We Measure Vulnerability to Climate Change? ................................. 7
2.3. Strategies of Climate Change Adaptation ......................................................... 9
2.4. Drivers of Climate Change Adaptation ........................................................... 11
3. DATA AND METHODOLOGY........................................................................ 13
3.1. Study Site ........................................................................................................ 14
3.2. Two-Step Approach to Evaluate Climate Change Vulnerability Factors in
Agriculture .............................................................................................................. 17
3.2.1. Step 1: Aggregated Index ......................................................................... 18
3.2.1.1. Exposure Indicators ............................................................................ 19
3.2.1.2. Sensitivity Indicators .......................................................................... 20
3.2.1.3. Adaptive Capacity Indicators ............................................................. 26

xii
3.2.2. Vulnerability Index Construction ............................................................. 29
3.2.2.1. Normalization .................................................................................... 29
3.2.2.2. Weighting and Aggregations ............................................................. 30
3.2.3. Step 2: Socio-Economic Survey ............................................................... 31
3.2.3.1. Selection of Pilot Sites ....................................................................... 32
3.2.3.2. Sampling Procedure and the Sample Size ......................................... 35
3.2.4. Measuring Household Level Vulnerability .............................................. 39
3.2.5. Modelling Household Level Vulnerability and Adaptation Behavior ..... 44
4. RESULTS ........................................................................................................... 47
4.1. Vulnerability Index Results ............................................................................ 47
4.1.1. Exposure Sub-Index Results .................................................................... 47
4.1.1. Sensitivity Sub-Index Results .................................................................. 50
4.1.1. Adaptive Capacity Sub-Index Results ...................................................... 53
4.1.1. Overall Vulnerability Index Results ......................................................... 56
4.2. Household Characteristics, Climatic Observations and Risk Coping ............. 59
4.2.1. Demographic Characteristics of the Households ..................................... 59
4.2.2. Features of Farming Systems ................................................................... 63
4.2.3. Crop Diversity .......................................................................................... 65
4.2.4. Observed Climatic Changes ..................................................................... 66
4.2.5. Exposure to Climatic Extremes and Crop Loss ........................................ 69
4.2.6. Risk Coping Strategies and Adaptation Methods ..................................... 71
4.3. Household Level Vulnerability Results .......................................................... 73
4.3.1. Mean Exposure, Sensitivity, Adaptive Capacity and Overall Vulnerability
............................................................................................................................ 73

xiii
4.3.2. Modelling Household Level Vulnerability ............................................... 76
4.3.3. The Drivers of the Household Level Farmer Vulnerability ...................... 76
4.3.4. Household Level Indicators Correlated with the Adaptive Strategy and
Precautionary Behavior....................................................................................... 81
4.3.4.1. Indicators correlated with adaptive strategy ...................................... 81
4.3.4.2. Indicators correlated with the number of precautions taken .............. 83
4.3.5. The Drivers of Adaptation ........................................................................ 84
5. DISCUSSION AND RECOMMENDATIONS ................................................. 89
6. CONCLUSIONS ................................................................................................ 94
REFERENCES ........................................................................................................... 97
APPENDICES ......................................................................................................... 111
A. The Questionnaire Applied in the Survey......................................................... 111
B. The Results of the Socio-Economic Survey ..................................................... 135
CURRICULUM VITAE .......................................................................................... 149

xiv
LIST OF TABLES
TABLES
Table 3-1 Data on 31 districts of Konya Province .................................................... 15
Table 3-2. The multi scale approach used in the study to evaluate climate change
vulnerability and its drivers in agriculture in Konya ................................................. 18
Table 3-3. Selected indicators for exposure .............................................................. 19
Table 3-4. Selected indicators for sensitivity ............................................................ 20
Table 3-5. Results of the Simpson Diversification Index .......................................... 26
Table 3-6. Selected Indicators for adaptive capacity ................................................. 26
Table 3-7. K-means clustering of the districts ........................................................... 33
Table 3-8. The sample distribution of survey data .................................................... 35
Table 3-9. Stratification of sample size according to irrigation ................................ 36
Table 3-10. An example of risk zones table .............................................................. 37
Table 3-11. Hail coverage premium price table ........................................................ 38
Table 3-12. Risk zone classifications for the neighbourhoods ................................. 38
Table 3-13. Indicators used for measuring household level vulnerability ................. 39
Table 3-14. Indicators affecting household level vulnerability ................................. 40
Table 4-1. Exposure sub-index components .............................................................. 47
Table 4-2. Sensitivity sub-index components ............................................................ 50
Table 4-3. Adaptive capacity sub-index components ................................................ 53
Table 4-4. Exposure, sensitivity, adaptive capacity and vulnerability levels of the
districts ...................................................................................................................... 57
Table 4-5. Demographic characteristics of the households ....................................... 60
Table 4-6. Features of farming systems ..................................................................... 65
Table 4-7. Crop diversity ........................................................................................... 66
Table 4-8 Observed climatic changes ........................................................................ 67
Table 4-9 Causes of climatic changes ....................................................................... 68

xv
Table 4-10 Exposure to extreme events and crop loss ............................................... 69
Table 4-11 Correlation between exposure to extreme events and percentage of crop
loss ............................................................................................................................. 70
Table 4-12 Coping strategies of the farmers after a climate related crop loss ........... 71
Table 4-13 Adaptation techniques of the farmers to climate related risks ................. 72
Table 4-14 Descriptive statistics for farmer statement based district level vulnerability
components ................................................................................................................ 74
Table 4-15 Descriptive statistics for farmer statement based district level vulnerability
components ................................................................................................................ 75
Table 4-16 Districts level one-way Analysis of Variance (Anova) results for
vulnerability components ........................................................................................... 76
Table 4-17 Vulnerability averages of the farmers in each district ............................. 76
Table 4-18 Significance of regression model for household level vulnerability ....... 77
Table 4-19 Regression model summary for household level vulnerability with district
level indicators ........................................................................................................... 77
Table 4-20 Significant indicators of household level vulnerability (Method 1)
determined by multiple linear regression ................................................................... 77
Table 4-21 Significant indicators of household level vulnerability (Method 2)
determined by multiple linear regression ................................................................... 78
Table 4-22 Indicators correlated with adaptive strategy ............................................ 82
Table 4-23 Indicators correlated with the number of precautions taken .................... 83
Table 4-24 Significance of regression model for household level vulnerability ....... 85
Table 4-25 Regression model summary for household level vulnerability .............. 85
Table 4-26 Significant indicators of household level vulnerability determined by
multiple linear regression ........................................................................................... 85
Table B-1 Demographic features of the households ................................................ 135
Table B-2. Age Groups of the Respondents ............................................................ 135
Table B-3. Education Levels of the Respondents .................................................... 135
Table B-4. Household Size of the Respondents ....................................................... 136
Table B-5. Income Levels of the Respondents ....................................................... 137

xvi
Table B-6. Percentage Share of Agricultural Income .............................................. 137
Table B-7. Features of the Farming Systems........................................................... 137
Table B-8. Irrigated vs Rain-fed Farming Land ...................................................... 138
Table B-9. Soil Analysis and Fertilization .............................................................. 138
Table B-10. Crop Diversification ............................................................................ 138
Table B-11. Water Resources .................................................................................. 139
Table B-12. Animal Husbandry ............................................................................... 139
Table B-13. Social Setting ....................................................................................... 139
Table B-14. Agricultural Subsidies ......................................................................... 140
Table B-15. Other Livelihood Options .................................................................... 141
Table B-16. Agricultural Insurance ......................................................................... 141
Table B-17. Observed Climatic Changes ................................................................ 142
Table B-18. Reason of Climatic Changes ................................................................ 143
Table B-19. Exposure to Climatic Changes and Livelihood Strategies .................. 143
Table B-20. Adaptation Methods ............................................................................ 144
Table B-21. Precautions Taken Against Drought .................................................... 144
Table B-22. Reason of Not Taking Precaution Against Drought ............................ 145
Table B-23. Precautions Taken Against Flood ........................................................ 145
Table B-24. Reason of Not Taking Precaution Against Flood ................................ 145
Table B-25. Precautions Taken Against Frost ......................................................... 146
Table B-26. Reason of Not Taking Precaution Against Frost ................................. 146
Table B-27. Precautions Taken Against Storm/ Simoon ......................................... 147
Table B-28. Reason of Not Taking Precaution Against Storm/ Simoon ................. 147
Table B-29. Adaptation to Climatic Changes .......................................................... 147
Table B-30. Share of Climate Change in Permanent Migration .............................. 148
Table B-31. Share of Climate Change in Temporary Migration ............................. 148
xvii
LIST OF FIGURES
FIGURES
Figure 3.1 Flow diagram of the two-step vulnerability assessment method .............. 13
Figure 3.2 Location of Konya in Turkey ................................................................... 15
Figure 3.3 The districts selected for vulnerability mapping ...................................... 17
Figure 3.4 K-means clustering and selected districts for the survey.......................... 34
Figure 4.1 Exposure sub-index results for the selected districts ................................ 48
Figure 4.2 Contributions of the components of exposure for each district ................ 49
Figure 4.3 Sensitivity sub-index results for the selected districts .............................. 51
Figure 4.4 Contributions of the components of sensitivity for each district .............. 52
Figure 4.5 Adaptive capacity sub-index results for the selected districts .................. 54
Figure 4.6 Contributions of the components of adaptive capacity for each district .. 55
Figure 4.7 Overall vulnerability index results for the selected districts .................... 58
Figure 4.8 Levels of the components of overall vulnerability for ten districts .......... 59
Figure 4.9 Age groups of the farmers in three districts.............................................. 61
Figure 4.10 Household size ........................................................................................ 62
Figure 4.11 Income groups ........................................................................................ 62
Figure 4.12 Percentage share of agricultural income ................................................. 63
Figure 4.13 Percentage of rain-fed and irrigated land ownership .............................. 64
Figure 4.14 Reasons of crop diversity on different plots ........................................... 66
Figure 4.15 Number of adaptive strategies implemented by the farmers to climatic
extremes ..................................................................................................................... 73
Figure 4.16 Out-of-bag predictor importance estimate results .................................. 79
Figure 4.17 Smoothed partial dependence plot for contributing indicators ............... 80
Figure 4.18 Out-of-Bag Predictor Importance Estimate Results ............................... 86
Figure 4.19 Smoothed Partial Dependence Plot for Contributing Indicators ............ 87

xviii
LIST OF ABBREVIATIONS
ANOVA Analysis of Variance
FA Factor Analysis
GDP Gross Domestic Product
GHGs Green House Gases
IPCC The Intergovernmental Panel on Climate Change
KMO Kaiser-Mayer-Olkin
MLR Multiple Linear Regression
NGO Non-Governmental Organization
OECD Organization for Economic Co-operation and Development
PCA Principal Component Analysis
RF Random Forest
TARSİM Tarım Sigortaları Havuzu (Agricultural Insurance Pool)
UNFCCC The United Nations Framework Convention on Climate Change

xix


1
CHAPTER 1
1. INTRODUCTION
Frequency and severity of extreme climate events such as storms, floods, heat waves
and drought increased in the last couple of decades all around the world (Johnson and
Hutton, 2014; Hisali et al., 2011; Krishnamurthy et al., 2014; Trærup and Mertz,
2011). These climatic anomalies are considered as results of global warming and are
expected to exacerbate the risks on the livelihoods and assets (Heltberg et al., 2009;
Krishnamurthy et al., 2014; Luers et al., 2003). Climatic variability manifests itself
not only as extreme events, but also slower and gradual changes in precipitation and
temperature, which can be a major threat for agricultural production (Mertz et al.,
2010). Agriculture, especially rain-fed agriculture, is quite sensitive to changes in
climatic conditions due to specific requirements of the crops in terms of temperature
and precipitation from planting to harvest. Furthermore, climatic variability increases
the risks of pest and disease spread and soil degradation (Hisali et al., 2011). Recent
crop growth models show that production of wheat, rice and maize will decline
globally (Krishnamurthy et al., 2014). Despite the international attempts to slow down
the generation of anthropogenic greenhouse gasses (GHGs), annual emissions of these
gases do not show a declining trend in many parts of the world. Thus, climate
adaptation emerged as an important strategy in the climate change agenda.
The future risks created by climate change requires actions in vulnerable areas,
especially in the ones where there is a significant gap between the impact and the
adaptive capacities. Agricultural sector is one of the areas in which vulnerabilities are
not defined clearly in terms of temporal and spatial dimensions of climate change. It
is a complicated sector with different actors such as producers, retailers and
consumers, and have interacting social, economic and environmental dimensions
2
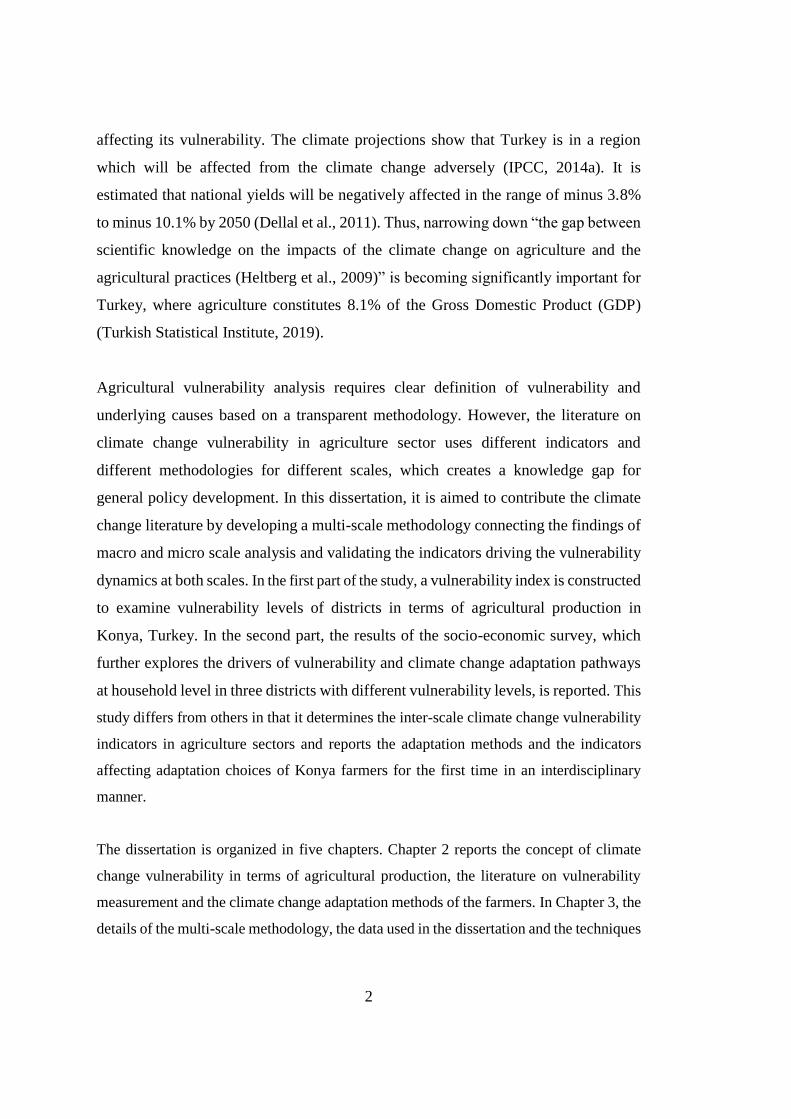
affecting its vulnerability. The climate projections show that Turkey is in a region
which will be affected from the climate change adversely (IPCC, 2014a). It is
estimated that national yields will be negatively affected in the range of minus 3.8%
to minus 10.1% by 2050 (Dellal et al., 2011). Thus, narrowing down “the gap between
scientific knowledge on the impacts of the climate change on agriculture and the
agricultural practices (Heltberg et al., 2009)” is becoming significantly important for
Turkey, where agriculture constitutes 8.1% of the Gross Domestic Product (GDP)
(Turkish Statistical Institute, 2019).
Agricultural vulnerability analysis requires clear definition of vulnerability and
underlying causes based on a transparent methodology. However, the literature on
climate change vulnerability in agriculture sector uses different indicators and
different methodologies for different scales, which creates a knowledge gap for
general policy development. In this dissertation, it is aimed to contribute the climate
change literature by developing a multi-scale methodology connecting the findings of
macro and micro scale analysis and validating the indicators driving the vulnerability
dynamics at both scales. In the first part of the study, a vulnerability index is constructed
to examine vulnerability levels of districts in terms of agricultural production in
Konya, Turkey. In the second part, the results of the socio-economic survey, which
further explores the drivers of vulnerability and climate change adaptation pathways
at household level in three districts with different vulnerability levels, is reported. This
study differs from others in that it determines the inter-scale climate change vulnerability
indicators in agriculture sectors and reports the adaptation methods and the indicators
affecting adaptation choices of Konya farmers for the first time in an interdisciplinary
manner.
The dissertation is organized in five chapters. Chapter 2 reports the concept of climate
change vulnerability in terms of agricultural production, the literature on vulnerability
measurement and the climate change adaptation methods of the farmers. In Chapter 3, the
details of the multi-scale methodology, the data used in the dissertation and the techniques

3
used for the analysis of the data are explained. Linear and non-linear regression techniques
are used in order to improve the explanatory power of the models developed for
understanding the drivers of vulnerability and adaptation. Chapter 4 presents the results
of the district and household level analysis. In the first part of this chapter, the results
obtained from the index approach are presented, while in the second part, general findings
on the demographic characteristics of the farmers, their farming practices, their
observations on climatic changes, their statements on the factors of vulnerability and the
indicators affecting vulnerability and adaptation are presented. Chapter 5 discusses the
results from the perspective of similar studies in literature and provides recommendations
for policy development and the future research. Finally, the questionnaire used in the
survey and some additional tables on the results of the socio-economic survey are
provided in Appendices.


5
CHAPTER 2
2. LITERATURE REVIEW
In the literature review, first of all, the literature on conceptualization of climate change
vulnerability is provided. Then, we proceed with reviewing how vulnerability to climate
change can be measured.
2.1. Climate Change Vulnerability
The term “vulnerability” emerged as a concept in the development debates of 1990s
(Gbetibouo and Ringler, 2009). It was derived from the social sciences (Berry et al.,
2006; Luers et al., 2003) and has been conceptualized differently in various
disciplines. As there is no single conceptualization of vulnerability, there is no
universal definition and methodology of assessing it (Zarafshani et al., 2012).
“Mapping of vulnerability began in the late 1970s (Currey, 1978). However, a large
increase in the number of studies on assessment of spatial vulnerability occurred in
the last decade. Two main reasons, perhaps, lead to this increase. The first is the
recognition of the importance of vulnerability in hazard assessment and disaster
management. The second is the availability of GIS technology, which made it possible
to integrate data of different types (e.g., biophysical and socioeconomic) and from
different sources, analyse data, and present results in a timely and appropriate manner
for environmental and agricultural decision making” (Wilhelmi & Wilhite, 2002)
The United Nations Framework Convention on Climate Change (UNFCCC) calls the
developed country Parties to assist the developing country Parties in affording the
costs of adaptation (Hinkel, 2011). With the high adaptation costs and limited funds
allocated, determination of the most vulnerable societies and prioritizing adaptation

6
measures become a critical issue. The purpose of vulnerability assessments is to
optimize the allocation of limited resources in order to identify mitigation and
adaptation measures globally or locally (Luers et al., 2003).
The Intergovernmental Panel on Climate Change (IPCC) describes the term
“vulnerability” as “the propensity or predisposition to be adversely affected” (IPCC,
2014a). IPCC defines vulnerability to climate change as the interaction between three
components:
i) the magnitude and duration of climate-related exposure;
ii) the sensitivity of a target system to climate risk ; and
iii) the ability of a system to withstand or recover from the exposure (adaptive
capacity)
In this definition, vulnerability is a function of exposure, sensitivity and adaptive
capacity. These components are further explained by IPCC as given below:
“Exposure: the presence of people, livelihoods, species or ecosystems,
environmental functions, services, and resources, infrastructure, or economic, social
or cultural assets in places and settings that could be adversely affected.
Sensitivity: the degree to which a system or species is affected, either adversely
or beneficially, by climate variability or change. The affect may be direct (e.g., a
change in crop yield in response to a change in the mean, range, or variability of
temperature) or indirect (e.g., damages caused by an increase in the frequency of
coastal flooding due to the sea level rise).
Adaptive capacity: the ability of systems, institutions, humans, and other
organisms to adjust to potential damage, to take advantage of opportunities, or to
respond to consequences.”
Although not providing a clearly defined methodology, this definition of the IPCC
became the basis of many studies in vulnerability literature. The approaches used to
measure vulnerability in these studies are summarized in the following section.

7
2.2. How Do We Measure Vulnerability to Climate Change?
Measuring vulnerability is found to be a challenging issue (Luers et al., 2003), if not
found impossible (Hinkel, 2011). According to (Hinkel, 2011), vulnerability cannot
be measured as it is a theoretical concept. As it is not a directly observable
phenomenon, it should be operationalized. An operation is a method used for mapping
vulnerability to observable concepts (Hinkel, 2011), which are functions called
indicators. There are no “universal” indicators as the harm given may vary case to case
or hazard to hazard (Hinkel, 2011). According to (Berry et al., 2006), vulnerability
can be determined based on the relation between the change and its effects. Direct and
indirect impacts of the hazard or slow climatic changes should be understood in order
to adapt properly. For example, direct impacts of climate change on agriculture may
have indirect effects on rural incomes, food prices, health, migration etc. (Heltberg et
al., 2009).
Various techniques are used to assess vulnerability such as statistical analysis, GIS
and mapping techniques, cluster analysis and using indices (Zarafshani et al., 2012).
Most common method is using composite proxy indicators (indexes) (Bär et al., 2015;
Luers et al., 2003) . The purpose of an index is to make a complex issue more
understandable and useful for policy or general public. Some of the examples of
composite indicators are Human Development Index developed by UNDP, Climate
Change Vulnerability Index developed by Maplecroft, Global Adaptation Index by the
Global Adaptation Initiative (Gbetibouo and Ringler, 2009), Index of Human Security
(Luers et al., 2003).
Vulnerability indices can help to monitor the changes regarding vulnerability,
determine the indicators causing the vulnerability and prioritizing solutions to reduce
vulnerability (Shah et al., 2013). (Kelly and Adger, 2000) classifies approaches to
determine indicators as “starting point approach” and “end-point approach”. The first
approach evaluates adaptation to current climate variability, while the second one is a

8
post-disaster approach. (Hinkel, 2011) elaborates the arguments for selecting and
aggregating the indicators to develop vulnerability indexes in four categories based on
their methodology:
Deductive arguments using available scientific knowledge in the form of
frameworks, theories or models in the selection and aggregation of indicating
variables.
Inductive arguments using data to build statistical models that explain
observed harm through some indicating variables.
Normative arguments which use value judgements in the selection and
aggregation of indicating variables.
Non-substantial arguments which are developed based on the structure of the
data on the indicating variables, but do not explain how they combine in the
process of causing vulnerability.
Vulnerability indexes can be used in various scales from global to local (Gerlitz et al.,
2017). However, due to the large impact area of climate change and considerable
differences between different areas, index approach is suggested to be used at local
level (Hinkel, 2011; Hisali et al., 2011; Trærup and Mertz, 2011). Macro-level (global,
national, regional, provincial etc.) climate change vulnerability studies using index
methods are criticized in terms of subjectivity in selection of indicators and their
weights. According to (Gbetibouo and Ringler, 2009), due to high heterogeneity
within provinces and districts in terms of sensitivity and adaptive capacity, mapping
vulnerability at the macro level may lead to a misleading sense of accuracy. Although,
macro-level analysis can be used as a guidance for examining vulnerability, further
work should be done at local levels such as in districts and villages (Fekete et al.,
2010). On the other hand, many studies identifying household level vulnerability and
adaptation methods do not give results that can be generalized to regional or national
level. There is a gap in the literature on the linkages between methodologies for

9
measuring vulnerability at different levels. The research on climate change
vulnerability in agriculture at national and regional scales, which are based on
primarily index calculations and statistical methods, do not shed light on household
level vulnerability in the areas where vulnerability is examined (Wood et al., 2014).
Absence of a common methodology results in usage of different methods and scales
in vulnerability analysis (Luers et al., 2003; Polsky et al., 2007), thus the knowledge
on vulnerability and adaptation is fragmented (Hofmann et al., 2011) and
incomparable most of the time (Polsky et al., 2007). According to (Polsky et al., 2007),
adopting a ‘vulnerability’ perspective requires a thorough investigation of biophysical,
cognitive, and social dimensions of human-environment interactions.
2.3. Strategies of Climate Change Adaptation
The impacts of climate change are various in nature; some of which are predictable
and reducible, while others are unpredictable and have long-term consequences. The
immediate impacts increase the stress on availability of water and favourable climatic
conditions, which are the most important agricultural inputs. Thus, adaptation to
climatic changes in crop production is crucial for sustainable agriculture, which have
significant impacts on other sectors. Despite the global efforts to reduce global
warming, it is important to be ready for the consequences of climate change.
The climate change adaptation attempts can be broadly categorized as responses to
current occurrences (climatic variability) and planned adaptation (preparations to long
term changes) (Hisali et al., 2011). The adaptation strategies also can be divided into
two based on their spatial characteristics; on-farm strategies and off-farm strategies
(Heltberg et al., 2009). On-farm strategies are basically based on agricultural practices
such as water, crop, land and farm assets management. Water management practices
include more irrigation (using additional resources such as ground and underground
water, public irrigation system etc.) (Alauddin and Sarker, 2014; Below et al., 2012;

10
Schilling et al., 2012; Zorom et al., 2013), shifting the timing and amount of irrigation
(Luers et al., 2003) , usage of water saving technologies (Alauddin and Sarker, 2014),
water storage technologies such as runoff harvesting, watering ponds etc. (Below et
al., 2012; Zorom et al., 2013) and making investments of water equipment (Schilling
et al., 2012). Some agricultural practices such as cover crops and mulching also help
conserving soil moisture, which in turn reduces the amount of irrigation water
(Baudoin et al., 2014; Below et al., 2012).
Crop management practices include introducing drought resistant and short-cycle
crops (Alauddin and Sarker, 2014; Baudoin et al., 2014; Below et al., 2012; Deressa
et al., 2009) or crop-mixes (Alauddin and Sarker, 2014; Below et al., 2012; Schilling
et al., 2012; Zorom et al., 2013), changing crop varieties (Alauddin and Sarker, 2014;
Hisali et al., 2011; Zorom et al., 2013), crop rotation (Below et al., 2012) and shifting
to higher value crops (Luers et al., 2003). Despite the fact that climatic changes and
extremes do not have a predictable pattern currently, changing planting/ harvest dates
(Alauddin and Sarker, 2014; Baudoin et al., 2014; Schilling et al., 2012) is used as a
response strategy.
Land management practices are based on soil conservation and restoration techniques
(Alauddin and Sarker, 2014; Zorom et al., 2013) , especially against drought and land
degradation. These techniques include tree planting (Alauddin and Sarker, 2014;
Zorom et al., 2013), improving the soil quality via conservation agriculture practices
such as direct seeding (Alauddin and Sarker, 2014) or by applying more organic or
chemical fertilizer (Baudoin et al., 2014; Below et al., 2012; Mertz et al., 2010;
Schilling et al., 2012; Zorom et al., 2013). Extending the farmland (Below et al., 2012)
and ploughing the marginal lands are also used as an adaptation strategies in order to
increase the production (Schilling et al., 2012).
Asset management practices include mortgaging/selling household assets and land
(Deressa et al., 2009; Hisali et al., 2011; Trærup and Mertz, 2011), using past savings

11
(Hisali et al., 2011) and borrowing from formal or informal sources (Deressa et al.,
2009; Hisali et al., 2011). Animal breeding and sales to cope with climatic shocks is
also used as an adaptation strategy (Alauddin and Sarker, 2014; Below et al., 2012;
Trærup and Mertz, 2011; Zorom et al., 2013).
Off-farm adaptation and coping strategies are practices allowing diversification of
income and livelihood beyond the farm. Farmers either diversify their income by
migrating to other places for wage employment (Baudoin et al., 2014; Below et al.,
2012; Deressa et al., 2009; Hisali et al., 2011; Mertz et al., 2010; Schilling et al., 2012;
Zorom et al., 2013), diversify their livelihood via trade or casual employment
(Baudoin et al., 2014; Trærup and Mertz, 2011) , or rely on remittances from relatives
or government support (Deressa et al., 2009; Mertz et al., 2010; Trærup and Mertz,
2011).
2.4. Drivers of Climate Change Adaptation
The on-farm and off-farm adjustments identified as adaptation responses to climate
change in the previous section are affected from various socio-economic and physical
factors. The direction of the relation between the impact factor and the adaptation
method changes according to the method itself and the agroecological setting it is
applied. The agroecological setting is defined based on climatic and physical factors
that affect agricultural production, thus different households in different
agroecological settings are expected to use different adaptation methods (Deressa et
al., 2009; Hisali et al., 2011; Tessema et al., 2018).
The studies showed that farming experience of the household head has significant
impact on adaptation behaviour, as experienced farmers perceive climate change
better than the unexperienced ones (Below et al., 2012; Tessema et al., 2018; Trinh et
al., 2018). Age of the household head, which is highly correlated with farming
experience, is also an important factor (Deressa et al., 2009; Hisali et al., 2011;

12
Mulinde et al., 2019; Trinh et al., 2018). Gender of the respondent plays a key role in
adoption of certain adaptation methods (Below et al., 2012; Deressa et al., 2009; Hisali
et al., 2011; Mulinde et al., 2019; Thoai et al., 2018). In addition to these factors,
education level of the household head is also determined as a driver of climate change
response (Below et al., 2012; Deressa et al., 2009; Hisali et al., 2011; Mulinde et al.,
2019; Nkondze et al., 2013; Tessema et al., 2018; Trinh et al., 2018), as some of the
adjustments are complex and require awareness and understanding (Mulinde et al.,
2019). In this sense, the other knowledge related factors highlighted in the studies are
access to extension services (Below et al., 2012; Deressa et al., 2009; Hisali et al.,
2011; Mulinde et al., 2019; Tessema et al., 2018), access to the markets (Below et al.,
2012; Mulinde et al., 2019; Tessema et al., 2018), social networks (Below et al., 2012;
Mulinde et al., 2019) and membership to local organisations (Mulinde et al., 2019;
Thoai et al., 2018), which provide access to information and enable farmers to adjust
to the climatic changes.
The studies also identified household size (Below et al., 2012; Mulinde et al., 2019;
Tessema et al., 2018), dependency ratio (Below et al., 2012; Mulinde et al., 2019) and
farm income (Below et al., 2012; Thoai et al., 2018) as other household characteristics
which play role in adaptation strategies. In terms of the characteristics of the farming,
total land area (Mulinde et al., 2019; Trinh et al., 2018), number of cultivated plots
(Trinh et al., 2018) and land tenure (Below et al., 2012; Deressa et al., 2009; Hisali et
al., 2011) are the ones that have impact on adaptation. Furthermore, access to credit
and other financial resources (Deressa et al., 2009; Hisali et al., 2011; Tessema et al.,
2018; Thoai et al., 2018) is prerequisite for some adaptation methods requiring
investment, such as technological adjustments. In this regard, access to off-farm
employment (Deressa et al., 2009; Hisali et al., 2011) enable farmers to diverse their
income for implementing adaptation strategies or cope with the shocks.

13
CHAPTER 3
3. DATA AND METHODOLOGY
In this section, the two-step methodology developed and the data used to measure
vulnerability to climate change are explained. Initially, an index is developed to assess
the vulnerability of agricultural production to climate change at district level in Konya.
Later, the accuracy of the parameters chosen to construct the vulnerability index is
checked via a socio-economic survey conducted with the farmers in three districts
from different vulnerability levels. Figure 3.1 shows the steps followed while creating
the vulnerability index for agricultural sector in Konya.
Literature Findings • Agricultural climate vulnerability studies reviewed
• Indicators for agricultural vulnerability selected
Data Collection
• Availability of data for indicators checked
• Available indicators determined
Index Construction
• Approaches used to determine weights of indicators
are evaluated
• A vulnerability map prepared for 10 districts
Site Survey • A questionnaire referring to the vulnerability
indicators prepared
• A site survey is conducted with 376 farmers in 3
districts
Figure 3.1 Flow diagram of the two-step vulnerability assessment method

14
3.1. Study Site
The global projections show that Turkey is in a region which will be affected from the
climate change adversely (IPCC, 2014b). Thus, narrowing down the gap between
scientific knowledge on the impacts of the climate change on agriculture and the
agricultural adaptation practices (Heltberg et al., 2009) is becoming significantly
important for Turkey, where 19.4% of the population works in agricultural sector
(Turkish Statistical Institute, 2018). The study is conducted in Konya Province located
in the Central Anatolia (Figure 3.2). Total population of the province is recorded as
2.180.149 in 2017 and it has 31 districts, three of which are the central districts. The
province covers 8.1% of the total agricultural land of the country and is a major actor
in agricultural production (Turkish Statistical Institute, 2018). Thus understanding the
factors contributing to vulnerability of Konya farmers is highly important in terms of
developing climate change adaptation policies both for Konya and the other similar
provinces in the region. There are five agro-ecological sub-regions in the province
(Çelı̇k et al., 2015), in which annual precipitation changes from 225 mm to 920 mm
and elevation changes from 850 m to 1510 m above the sea level. As the study area
represents a fairly large area, the crop pattern is highly diversified. The main
agricultural products of the province are wheat, rye, barley, pulses, sugar beet,
sunflower and maize. Irrigated farming is significantly dependent on underground
water.

15
Figure 3.2 Location of Konya in Turkey
Konya Province is classified as a high risk zone for desertification and the farmers
have frequently been exposed to climatic extremes such as drought in the recent years
(Lelandais, 2016). Data on the population, area, precipitation, number of farmers,
agricultural land and the percentage of rain-fed farming is given in Table 3-1.
Table 3-1 Data on 31 districts of Konya Province
District Populat
ion
Area
(km2)
Precipit
.
(mm)
Number of
Registered
Farmers
Agri.
Area (ha)
Rain-
fed
Farmin
g (%)
Ahırlı 4.722 325 550 449 6.383 82%
Akören 6.390 640 300 901 21.313 83%
Akşehir 94.133 895 499 5.709 31.859 65%
Altınekin 14.357 1.312 375 3.297 71.688 24%
Beyşehir 71.336 2.054 580 3.621 37.107 48%
Bozkır 27.457 1.105 580 1.247 21.473 96%
Cihanbeyli 54.892 3.702 290 7.473 220.136 87%
Çeltik 10.209 640 397 2.093 34.269 35%
Çumra 65.054 2.089 306 6.523 127.628 30%
Derbent 4.612 359 530 1.027 10.758 79%
Derebucak 7.272 451 500 179 2.203 41%
Doğanhisar 17.683 482 600 2.785 15.836 80%

16
District Populat
ion
Area
(km2)
Precipit
.
(mm)
Number of
Registered
Farmers
Agri.
Area (ha)
Rain-
fed
Farmin
g (%)
Emirgazi 9.135 798 250 2.297 45.756 94%
Ereğli 139.131 2.214 277 6.958 94.693 42%
Güneysınır 9.769 482 360 1.407 15.519 93%
Hadim 13.260 1.165 690 1.426 8.088 33%
Halkapınar 4.519 605 375 512 5.366 65%
Hüyük 16.296 443 580 1.928 16.916 78%
Ilgın 55.790 1.636 340 6.040 82.625 78%
Kadınhanı 33.065 1.568 380 5.738 208.360 79%
Karapınar 48.968 2.623 279 6.351 144.341 56%
Karatay 295.322 2.832 320 6.890 165.008 23%
Kulu 50.675 2.234 275 5.605 114.081 90%
Meram 340.817 1.822 400 2.848 59.259 52%
Sarayönü 26.335 1.620 300 4.641 120.590 92%
Selçuklu 584.644 1.931 523 2.569 61.950 78%
Seydişehir 63.773 1.458 679 2.876 35.296 41%
Taşkent 6.620 457 550 322 3.372 71%
Tuzlukçu 6.890 704 375 2.356 37.600 87%
Yalıhüyük 1.666 94 920 166 3.705 82%
Yunak 23.956 2.101 225 5.778 129.240 84%
Source: Konya Provincial Directorate of Food Agriculture and Livestock (2014)
Vulnerability mapping study is conducted for 10 of the 31 districts for which the
meteorological data regarding temperature and precipitation is available and complete
(Figure 3.3).

17
Figure 3.3 The districts selected for vulnerability mapping
3.2. Two-Step Approach to Evaluate Climate Change Vulnerability Factors in
Agriculture
Composite index method used in the upper scale (national, regional etc.) climate
change vulnerability studies is criticized in terms of subjectivity in selection of
indicators and their weights. In order to increase the accuracy of the vulnerability
index, the indicators and the weights used in the index should be justified with
household level data. Some of the parameters selected or the weights assigned to these
parameters might not be as significant as expected in the lives of the farmers. In this
study, a two-step approach is developed to assess the vulnerability to climate change
in agriculture.

18
3.2.1. Step 1: Aggregated Index
In the first step, the index method aggregates 18 indicators, selected based on the
literature, at district level into a composite index based on the vulnerability definition
of IPCC (a factor of exposure, sensitivity and adaptive capacity) (IPCC, 2014b); while
in the second step, linear and non-linear regression models are used to determine the
importance levels of household level indicators, which are comparable to the district
level ones, using quantitative household survey data (Table 3-2).
Table 3-2. The multi scale approach used in the study to evaluate climate change vulnerability and its
drivers in agriculture in Konya
Method Aim Scope
Step 1 Aggregated Index
(Deductive)
Assessment of district
level climate change
vulnerability in
agriculture with
district level data
18 indicators are
aggregated using the IPCC
definition of vulnerability
Step 2 Multiple Linear
Regression
(linear) and
Random Forest
(non-linear)
Models
(Inductive)
Assessment of climate
change vulnerability in
agriculture and its
drivers using
household level data
A quantitative survey is
conducted with 376
farmers. Regression
models are used to
determine importance
levels of vulnerability
indicators
A composite vulnerability index is built using three sub-indexes measuring exposure,
sensitivity and adaptive capacity. The indicators for each sub-index are selected
among the ones determined in the literature review based on their relevancy and data
availability. Vulnerability was calculated according to Equation 1, in which the sub-
indexes were calculated by taking the unweighted arithmetic averages of the indicators
(Gbetibouo and Ringler, 2009).
Vulnerability = Exposure + Sensitivity – Adaptive Capacity (1)

19
Data for some indicators (number of small scale farms, land degradation index, non-
agricultural employment opportunities, agricultural income and groundwater amount)
was not available at the district level, thus these indicators were not included in the
index.
3.2.1.1. Exposure Indicators
The main body of literature on climate change related vulnerability analysis defined
exposure as “long term regional climatic changes or climatic variability, including
climatic disasters, which impact the assets and the livelihoods”. In this study,
following climate related exposure indicators are used to determine the level of
exposure to climatic variability:
Table 3-3. Selected indicators for exposure
Indicators Explanation
Average of daily
maximum temperature
above 35 o C, between
2000 and 2015
Temperatures above certain limits, which are called
stress limits, result in yield reduction or even in crop
loss. In this study, exposure to extreme heat is
calculated as the average degrees of daily maximum
temperature above 35 oC whole year (Porter &
Semenov, 2005).
Average of daily
minimum temperature
below 0 o C, between
2000 and 2015
Exposure to extreme cold is measured as the average
degrees of daily minimum temperatures below 0 oC in
March, April and May (expert judgement from Konya
Provincial Directorate of Food, Agriculture and
Livestock)
Mean deviation from
average past (1960-1999)
The absolute deviation (on both directions) amount of
monthly precipitation from average past in mm (1960-
1999), between 2000 and 2015.
20
Indicators Explanation
monthly precipitation,
between 2000 and 2015
The number of extreme climate events such as droughts, flood etc. data was available
from Turkish State Methodological Service, however this data was not confirmed by
the Provincial Directorate of Food, Agriculture and Livestock, thus was not used in
the analysis. The duration of extreme events data is not available either.
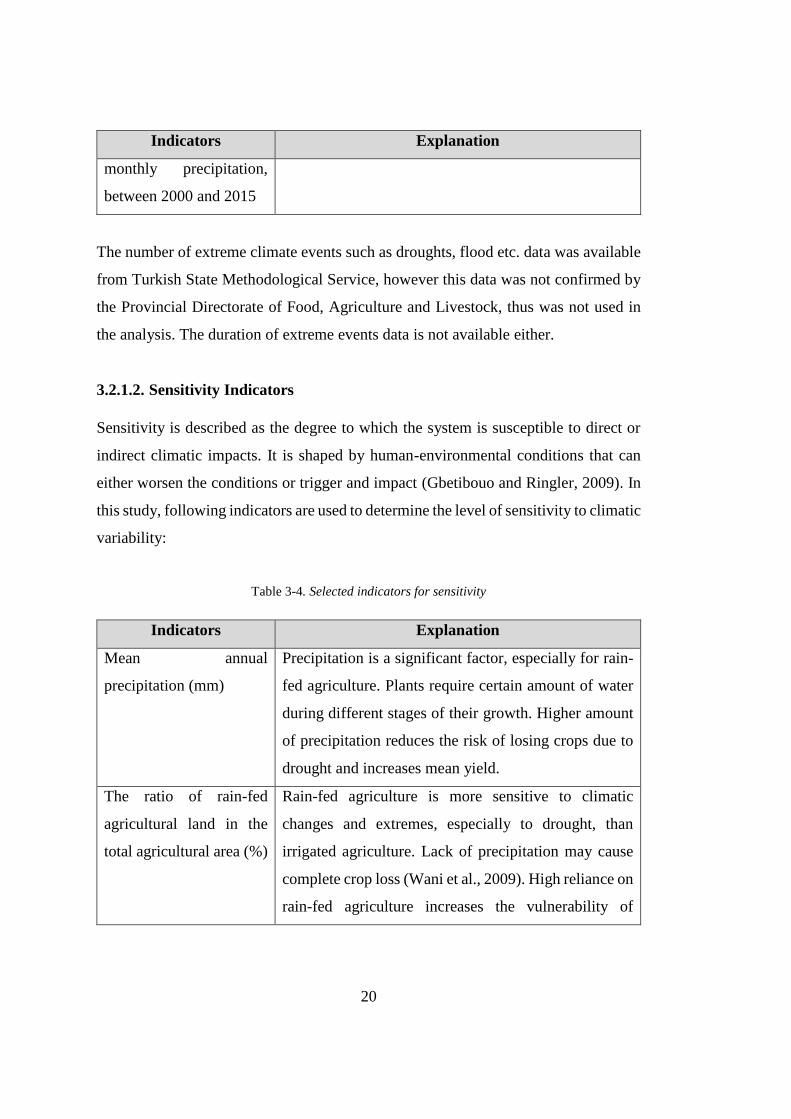
3.2.1.2. Sensitivity Indicators
Sensitivity is described as the degree to which the system is susceptible to direct or
indirect climatic impacts. It is shaped by human-environmental conditions that can
either worsen the conditions or trigger and impact (Gbetibouo and Ringler, 2009). In
this study, following indicators are used to determine the level of sensitivity to climatic
variability:
Table 3-4. Selected indicators for sensitivity
Indicators Explanation
Mean annual
precipitation (mm)
Precipitation is a significant factor, especially for rain-
fed agriculture. Plants require certain amount of water
during different stages of their growth. Higher amount
of precipitation reduces the risk of losing crops due to
drought and increases mean yield.
The ratio of rain-fed
agricultural land in the
total agricultural area (%)
Rain-fed agriculture is more sensitive to climatic
changes and extremes, especially to drought, than
irrigated agriculture. Lack of precipitation may cause
complete crop loss (Wani et al., 2009). High reliance on
rain-fed agriculture increases the vulnerability of

21
Indicators Explanation
agricultural production in the areas exposed to erratic
weather patterns (Abid et al., 2016; Gbetibouo and
Ringler, 2009; Krishnamurthy et al., 2014; Mertz et al.,
2010; Schilling et al., 2012) .
The ratio of farmer
population to the general
population (%)
The larger the proportion of the population obtaining
income from agricultural production, the higher the
vulnerability of that population to climatic changes.
(Gbetibouo and Ringler, 2009) and (Krishnamurthy et
al., 2014) used rural population density as a sensitivity
indicator in their studies. As rural population data is not
available at district level for Konya, the percentage of
farmer population is used as a proxy.
Dependency ratio
(proportion of the
population below 15 and
above 65) (%)
Ratio of dependent population (population below 15
and above 65), which is considered as unproductive,
increases the vulnerability level. In some studies it is
used as an adaptive capacity indicator (Ahsan and
Warner, 2014; Hahn et al., 2009; Piya et al., 2012; Shah
et al., 2013; Wiréhn et al., 2015), while in some others
it is used as a social vulnerability indicator (Lee, 2014).
Illiteracy rate (%)
Education increases the adaptation capacity
significantly (Deressa et al., 2009) as it increases the
capacity to utilize existing assets and opportunities
(Piya et al., 2012). Literacy rate is used as an adaptive
capacity indicator by (Ahsan and Warner, 2014;
Ahumada-Cervantes et al., 2017; Gbetibouo and
Ringler, 2009; Mohmmed et al., 2018; Monterroso et
al., 2014; Tubi et al., 2012; Zarafshani et al., 2012). In

22
Indicators Explanation
this study, illiteracy rate is used as a sensitivity
indicator which worsens readiness for exposure.
The ratio of forest land in
the total area of the
district (%)
Forest land reduces the vulnerability of agricultural
production by providing ecosystem services such as
natural disturbance regulation, biological pest control,
water regulation, erosion control etc. (Decocq et al.,
2016).
Percentage of forest land is used as an environmental
indicator for sensitivity (Corobov et al., 2013;
Krishnamurthy et al., 2014; Monterroso et al., 2014). [1
– Index Value] is used in the calculations as this
indicator reduces sensitivity.
The ratio of first degree
(very fertile) land to the
total area of the district
(%)
Soil quality has been defined as the capacity of a given
type of soil to maintain functions such as regulation of
chemicals, nutrient recycling for productivity etc.
(Berrouet et al., 2018). High quality soils are more
resistant to drought due to their higher retention
capacity. Soil quality is used as a sensitivity indicator
in many studies (Ahumada-Cervantes et al., 2017;
Murthy et al., 2015; Below et al., 2012; Corobov et al.,
2013; Luers et al., 2003; Wiréhn et al., 2015) . In this
study, soil quality is used as the percentage of first
degree soils in Land Use Capability Classification
maps. [1 – Index Value] is used in the calculations as
this indicator reduces sensitivity.
Crop Diversification
Index
Growing multiple crops on the same field, either at the
same time or after each other in sequence, lowers the
risk of complete crop loss. Furthermore, the second

23
Indicators Explanation
crop in the sequence might have benefits such as
nitrogen fixation and reduced disease or pests (Waha et
al., 2013). Crop diversification index is used as a
vulnerability indicator in various studies (Alauddin and
Sarker, 2014; Gbetibouo and Ringler, 2009; Wiréhn et
al., 2015). In this study, Simpson Diversification Index
is calculated using district level data. [1 – Index Value]
is used in the calculations as this indicator reduces
sensitivity.
Some indicators are difficult to categorize such as “dependency ratio”, “illiteracy rate”
and “crop diversification index”. They can be used as indicators of sensitivity or
adaptive capacity. In this study, they are selected as sensitivity indicators as sensitivity
is considered to be social and environmental conditions of the district, while adaptive
capacity is considered to be related with the agricultural implementations and
human/physical capacity related to the agricultural production.
In literature, percentage of rural population is used as a sensitivity indicator; however,
this data is not available for Konya as the management units in the country are changed
with the Law numbered 6360, which turned the rural areas such as villages into urban
neighbourhoods, in 2012. Percentage of farmer population is used as a proxy indicator
for percentage of rural population.
For the soil quality indicator, total percentages of first and second degree soil in Land
Use Capability Classification maps prepared by former General Directorate of Land
Wand Water (TOPRAKSU) between 1966-1971 and updated 1982-1984 (Kalkınma
Bakanlığı, 2014). The classifications in the map, which show the suitability of soils
for most kinds of field crops, are determined by the United States Department of

24
Agriculture (Klingebiel and Montgomery, 1961). There are eight classes of soils in
this classification method:
Class I- have few limitations that restrict their use
Class II- have some limitations that reduce the choice of plants or require
moderate conservation practices
Class III- have severe limitations that reduce the choice of plants or require
special conservation practices or both
Class IV- have very severe limitations that restrict the choice of plants, require
careful management or both.
Class V- have little or no erosion hazard but have other limitations impractical
to remove that limit their use largely to pasture, range, woodland, or wildlife
food and cover
Class VI- have severe limitations that make them generally unsuited to
cultivation and limit their use largely to pasture or range, woodland, or wildlife
food and cover
Class VII- have very severe limitations that make them unsuited to cultivation
and that restrict their use largely to grazing, woodland or wildlife
Class VIII- have limitations that preclude their use for commercial plant
production and restrict their use to recreation, wildlife, or water supply or to
aesthetic purposes.
Crop Diversification Index:
Growing two or more crops on the same field, either at the same time or after each
other in sequence, lowers the risk of complete crop loss. Furthermore, the second crop
in the sequence might have benefits such as nitrogen fixation and reduced disease or
pests (Waha et al., 2013). Several Crop Diversification Index methods are used to
explain diversity of crops in an area with a single indicator such as Bhatia’s Method
(Wiréhn et al., 2015), Jasbir Singh’s Method (Pal and Kar, 2012), Gibbs-Martin Index
(Roy and Barman, 2014; Das and Mili, 2013; Gbetibouo and Ringler, 2009; Patel,

25
2015; Sajjad and Prasad, 2014), Herfindhal Index (Bradshaw et al., 2004; De and
Chattopadhyay, 2010; Heltberg and Bonch-Osmolovskiy, 2011; Ibrahim et al., 2009;
Mukherjee, 2010; Ojo et al., 2014; Velavan and Balaji, 2012), Simpson Index
(Bhattacharyya, 2008; De and Chattopadhyay, 2010; Idowu et al., 2014; Sichoongwe
et al., 2014; Singha et al., 2014), Composite Entropy Index (CEI) (Acharya et al.,
2011) and Modified Entropy Index (Mesfin et al., 2011).
Bhatia’s Method and Jasbir Singh’s Model uses 𝑃𝑒𝑟𝑐𝑒𝑛𝑡 𝑜𝑓 𝑐𝑟𝑜𝑝𝑝𝑒𝑑 𝑎𝑟𝑒𝑎 𝑢𝑛𝑑𝑒𝑟 𝑥 𝑐𝑟𝑜𝑝𝑠
𝑁𝑢𝑚𝑏𝑒𝑟 𝑜𝑓 𝑥 𝑐𝑟𝑜𝑝𝑠
formulate to determine the crop diversity. It considers the crops occupying 10 per cent
or more of the sown area, while Jasbir Singh’s Model uses the same formula and
considers the crops whose proportion is 5 per cent or more. In this study, a model that
considers all the crops regardless of their share in the total sown area is preferred.
Gibbs-Martin Index, Herfindhal Index and Simpson Diversity Index are most
commonly used indices in literature. Simpson Index (∑ 𝑃𝑖2), where Pi is the proportion
of a certain species individuals in the total number of different species individuals, is
used in ecology to measure the probability that two randomly selected individuals
belong to the same species. The same method is used by Herfindhal to determine the
level of concentration in the industry. Both indices range between 0 and 1 and gets
closer to 1 when diversification reduces. Simpson Diversification Index (𝐷𝐼 = 1 −
∑ 𝑃𝑖2 ) is used in crop diversification analysis. Here, Pi is “Proportionate area of the
ith crop in the Gross Cropped Area” and the index gets closer to 1 as the diversification
increases. Gibbs-Martin Index ( 𝐺𝑀 = 1 − ∑ 𝑋𝑖
2
∑(𝑋𝑖)2 ) is used in urbanization pattern
analysis, crop diversification and demographic studies (Patel & Rawat, 2015) . In the
crop diversification analysis, “X” refers to the percentage of certain crop in the total
cropped area. In this study, Simpson Index is used to determine crop diversity
parameter for each district. The results of the Simpson Diversity Index for each district
is given in Table 3-5 below.

26
Table 3-5. Results of the Simpson Diversification Index
District SDV
Beyşehir 0,54
Cihanbeyli 0,56
Çumra 0,82
Ereğli 0,81
Hadim 0,60
Ilgın 0,68
Karapınar 0,79
Kulu 0,54
Meram 0,66
Selçuklu 0,62
Seydişehir 0,66
Yunak 0,51
3.2.1.3. Adaptive Capacity Indicators
The adaptive capacity is defined as the ability of a system or society to adapt to or
cope with the changes in the external conditions. Social and economic characteristics
of the households and their environment affect their adaptive capacity (Hahn et al.,
2009). In this study, following indicators are used to determine the adaptive capacity:
Table 3-6. Selected Indicators for adaptive capacity
Indicators Explanation
Density of farm animals Livestock ownership diversifies the income sources of
farmers and reduces their vulnerability level (Below et
al., 2012). Livestock ownership (density of farm
animals at macro scale) is used in various studies
(Alauddin and Sarker, 2014; Deressa et al., 2009; Hahn
et al., 2009; Mohmmed et al., 2018; Monterroso et al.,
2014; Nkondze et al., 2013; Tesso et al., 2012). In this
study, density of farm animals is calculated as “number

27
Indicators Explanation
of bovine animals + (number of ovine animals/3)” per
hectare of district land.
Number of agricultural
equipment per farmer
Farm assets, especially irrigation equipment, reduces
the vulnerability of farmers both by facilitating
agricultural production and as a coping strategy by
selling them when required. Total value of the farm
assets (Gbetibouo and Ringler, 2009) and ownership of
vehicles (Huynh and Stringer, 2018) are used as
indicators to measure vulnerability. In this study,
number of agricultural equipment per farmer is used as
an adaptive capacity indicator.
Density of road network Road infrastructure, especially paved roads, gives
farmers opportunity to reach markets, inputs,
information and off-farm employment (Piya et al.,
2012). Lack of road network escalates overall socio-
economic vulnerability (Ahsan and Warner, 2014), thus
road density is used as a vulnerability indicator in
various studies (Ahumada-Cervantes et al., 2017;
Corobov et al., 2013; Gbetibouo and Ringler, 2009;
Krishnamurthy et al., 2014). In this study, density of
road network is calculated by dividing the length of the
main roads in the district to the total area of the district.
Extension trainings given
per farmer
Extension trainings on crop and livestock increases the
adaptation capacity to climate change (Deressa et al.,
2009b). Thus, design of training programs, especially
targeting small farm holders, is suggested to develop
capacity of the farmers to utilize their assets and
opportunities (Piya et al., 2012; Zarafshani et al., 2012).

28
Indicators Explanation
In this study, average number of extension trainings
given per farmer is used as an adaptive capacity
indicator at the district level.
Number of agricultural
organizations per farmer
Memberships to the local institutions, especially the
agricultural ones, is considered to be a factor improving
farmer’s resilience to the impacts of climate change
(Tesso et al., 2012; Zarafshani et al., 2012) . In this
sense, the number of farmers who are members of
agricultural organizations (Gbetibouo and Ringler,
2009) or the number of community-based farmer
organizations (Huynh and Stringer, 2018) are used as
indicators of adaptive capacity. In this study, the
number of agricultural organizations per farmer is used
as an indicator of adaptive capacity at district level.
Amount of agricultural
subsidies provided per
hectare (Turkish Lira)
Government provides subsidy schemes to shape crop
patterns and increase resilience of the farmers.
Institutional support is an important factor that
determines the asset portfolio of a household
(Monterroso et al., 2014). Governmental support is a
significant indicator for adaptive capacity (Ahumada-
Cervantes et al., 2017; Alauddin and Sarker, 2014;
Huynh and Stringer, 2018). In this study, amount of
agricultural subsidies provided per hectare in Turkish
Lira in the district is used an adaptive capacity
indicator.
Percentage of agricultural
land insured
Agricultural insurance is found as a significant adaptive
strategy and low level of agricultural insurance
increases vulnerability of the farmers (Mohmmed et al.,

29
Indicators Explanation
2018). Existence of crop insurance is used as an
adaptive capacity indicator in various studies (Hinkel,
2011; Mallari and Ezra, 2016; Robinson et al., 2015;
Schilling et al., 2012; Zarafshani et al., 2012). In this
study, percentage of insured agricultural land is used as
an adaptive capacity indicator at the district level.
Indicators such as number of small scale farms, non-agricultural employment
opportunities, agricultural income and groundwater amount were also chosen to be
used in the index; however, such data is not available for the districts of the province.
Percentage of rain-fed farming is considered as a proxy data for the underground water
amount as the main irrigation source in the province is underground water. Amount
of chemical fertilizers used per hectare was initially considered as an indicator to
calculate vulnerability. The available fertilizer use data for districts is obtained from
registered fertilizer dealers and in some districts there is no dealer, thus the farmers
obtained the chemical fertilizers from other districts. Furthermore, there are
unregistered dealers, which makes the fertilizer usage data unreliable.
3.2.2. Vulnerability Index Construction
Composite index construction is composed of data normalization, weighting the
indicators and aggregation. Further details are given in the below sections.
3.2.2.1. Normalization
Indicators used in the index have different measuring units and should be normalized
in order to be comparable. In this study, the data is normalized based on the method
used in the United Nations Development Programme (UNDP)’s Human Development
Index (UNDP, 2002):

30
Index Value = (Actual value - minimum value)
(Maximum value - minimum value) (2)
The indicator values which are hypothesized to have a negative relationship with the
related sub-index are used as [1 – Index Value]. For example, the ratio of forest land
in the total area of the district, the ratio of first degree (very fertile) land in the total
area of the district and Crop Diversification Index reduce sensitivity, thus their index
value is subtracted from one to reduce their contribution to sensitivity during
normalization.
3.2.2.2. Weighting and Aggregations
There are three main ways to give weights to the indicators (Gbetibouo and Ringler,
2009; Monterroso et al., 2014; Piya et al., 2012; Wiréhn et al., 2015):
a) expert judgement
b) equal weights
c) statistical models such as principal component analysis (PCA) or factor
analysis (FA)
Expert judgement method is found too subjective and for most of the indicators there
might be no consensus among experts (Gbetibouo and Ringler, 2009; Piya et al.,
2012).
Principal Component Analysis (PCA) is a dimension reduction technique that captures
the common information by linearly transforming an original set of variables into a
smaller set of uncorrelated variables (Dunteman, 1989; Gbetibouo and Ringler, 2009;
Sanguansat, 2012). PCA is frequently used in the vulnerability index construction.
The requirements for the factors in PCA are: a) having associated eigenvalues larger
than one, b) individually contributing to the explanation of overall variance by more
than 10%, c) cumulatively contributing to the explanation of overall variance by more

31
than 60% (Nardo et al., 2005). Furthermore, The Kaiser-Mayer-Olkin (KMO) measure
of sampling adequacy test and Bartlett’s sphericity test are used to determine the
suitability of PCA in terms of correlation between the variables. KMO value should
be larger than 0.5 and Bartlett’s test of sphericity value should be larger than 0.05
(Abson et al., 2012). The district level data used in the study did not fulfil the
requirements of PCA analysis. On the other hand, in PCA method, the principal axis
may correspond to some other parameter than vulnerability and it is not possible to
know which axis does, if one does correspond.
In this study, equal weights method is used to aggregate the index figures at district
level analysis. In equal weights approach, the parameters are treated as they are perfect
substitutes of each other and averages of the parameters were calculated to build each
sub-index.
3.2.3. Step 2: Socio-Economic Survey
The objective of the socio-economic survey was to obtain detailed farmer level data
to validate the district level analysis and get further details regarding the vulnerability
drivers at household level. Prior to the survey, non-structured interviews were made
with agricultural experts from the local authorities and the farmers in order to have an
overall understanding of the characteristics of agricultural production in the province
and problems faced by the farmers. It is not always easy to differentiate the climatic
and non-climatic factors of vulnerability (O. Mertz et al., 2010), thus the interviews
aimed at deep understanding of the factors of agricultural vulnerability and isolating
the climatic factors from economic, social and cultural ones. The questionnaire
included questions on demographic characteristics of the household, farming practices
and assets, observations regarding climatic changes over the past 10 years, the impacts
of extreme events exposed and the coping mechanisms, and physical and social setting
of the places lived. The questionnaire was tested on 20 randomly selected farmers in

32
the survey districts. The final questionnaire included 198 multiple choice and open-
ended questions.
3.2.3.1. Selection of Pilot Sites
The results of the district level vulnerability analysis are used to select the districts for
the household level farmer vulnerability survey. Due to financial constraints, limited
number of districts had to be selected among 10 districts, thus the districts are grouped
into three classes (low, medium and high) using two different methods and one from
each is picked to ensure that the chosen districts are representative of the vulnerability
distribution. Initially, the districts are grouped using Natural Breaks (Jenks)
Classification Method in ArcGIS 10.1 software. Jenks method divides the features into
classes by minimizing the variance within the class while maximizing the variance
between the classes (Chen et al., 2013) . The vulnerability classes based on Jenks
Method is determined with the following formula (Baz et al., 2009a) using district
level aggregated vulnerability scores:
𝐺𝑉𝐹 = 1 − ∑ ∑ (𝑧𝑖𝑗−�̅�𝑗)2𝑁𝑗
𝑖=1𝑘𝑗=1
∑ (𝑧𝑖−�̅�)2𝑁𝑖=1
(3)
“where GVF is the goodness of variance fit; 𝑧𝑖𝑗 is the sum of squared deviations from
the array mean; 𝑧�̅� is the sum of squared deviations between classes” (Baz et al.,
2009b).
In the second step, the districts are grouped using k-means clustering technique.
Clustering analysis is a group of multivariate techniques which aim at clustering
objects based on their characteristics (Hair et al., 2009). There are two commonly used
partitioning procedures for cluster analysis: hierarchical cluster procedures and non-
hierarchical cluster procedures. In hierarchical cluster analysis, the objects are
clustered in a tree-like structure by grouping the most similar objects iteratively until

33
all the objects are grouped into one cluster. This clustering technique has two major
procedures called agglomerative method and divisive method, in which clusters are
successively joined or divided (Hair et al., 2009). In the non-hierarchical cluster
analysis, which is referred to as k-means clustering, the objects are grouped into a pre-
determined number of classes. k-means clustering method is used to group the objects
in a way that intragroup homogeneity and intergroup difference is as high as possible
(Kijewska and Bluszcz, 2016). It is commonly used in data mining, pattern recognition
and clustering based estimation (Al-Wakeel and Wu, 2016). Partitioning of the data
into user-specified number of groups is done by assigning -k- initial centroids and
refining them iteratively until each centroid is the mean of its constituent data
(Wagstaff et al., 2001). In this study, k-means analysis is carried out using SPSS 23
software and k is chosen as three to comply with the vulnerability classes determined
using Jenks Method. The analysis is carried out using all 18 vulnerability indicators.
The most representative district for its cluster is chosen based on the Euclidian
distance (straight-line distance) to the cluster mean with the following formula:
𝐷𝑥,𝑀 = √∑ (𝑛𝑖=1 𝑥𝑖𝑘 − 𝑀𝑗)2 (4)
where Dx,M is the Euclidean distance between the observation and the center of the
cluster, xi is the measurement of the ith case for the kth variable, Mj is the mean of the
kth cluster and n is the number of variables. The districts with the closest figures to
their cluster means were Cihanbeyli, Karapınar and Seydişehir.
Table 3-7. K-means clustering of the districts
Districts Cluster
Number
Distance from
Cluster Centre
Beyşehir 1 0,849
Hadim 1 1,133
Seydişehir 1 0,755
Cihanbeyli 2 0,543
Ilgın 2 1,063

34
Districts Cluster
Number
Distance from
Cluster Centre
Yunak 2 0,819
Kulu 2 0,878
Karapınar 3 0,835
Çumra 3 1,023
Ereğli 3 0,928
As these districts belong to three different vulnerability groups determined using the
Jenks Method, they are considered to be the representative of each vulnerability group
and selected as the survey1 districts.
Figure 3.4 K-means clustering and selected districts for the survey
1 The survey was approved by the Human Ethics Research Committee of the Middle East Technical
University, No: 2016-SOS-044 on March 22, 2016.

35
3.2.3.2. Sampling Procedure and the Sample Size
The sample size is calculated using the following formula (Krejcie and Morgan, 1970):
𝑠 = (𝑋2𝑁𝑃(1 − 𝑃)) ÷ (𝑑2(𝑁 − 1) + 𝑋2𝑃(1 − 𝑃)) (5)
where,
s = required sample size,
X2 = the table value chi-square for one degree of freedom at the desired confidence
level (3.841),
N = the population size,
P = the population proportion (assumed to be 0.50 since this would provide the
maximum sample size) and
d = the degree of accuracy expressed as a proportion (0.05).
The population size including the number of farmers in Cihanbeyli, Karapınar and
Seydişehir is 16.700 and the sample size is calculated as 376. The number of
interviews per each district is determined according to the ratio of their farmer
population to the total farmers in three districts (Table 3-8).
Table 3-8. The sample distribution of survey data
Cihanbeyli Karapınar Seydişehir
Number of sample 168 143 65
Proportion 45% 38% 17%
Number of samples for irrigated farming 49 114 48
Number of samples for rain-fed farming 119 29 17
As the aim of the survey was to determine the drivers of the farmer level vulnerability,
it was important to reach the farmers who were affected from the climatic changes and
extremes. Thus, while selecting the neighborhoods to be visited for the survey, further
stratifications were carried out for each district. As the dominant factor affecting crop

36
pattern and crop yield is availability of water in the region, the neighborhoods were
categorized as irrigated and rain-fed based on the dominance of the net area of
irrigated and rain-fed farming. It is done by using the following method:
village point data and irrigated areas raster data are combined,
the village is classified as “irrigated” or “rain-fed” based on the percentage of
intersection of the 2-km buffer zone around the village centre with the irrigated
areas layer,
initial classification is crosschecked with the multi-temporal satellite images
for final classification.
Secondly, depending on the percentage of population in the irrigated and rain-fed
villages, the sample size is stratified in order to determine the number of farmers to be
interviewed in irrigated agriculture villages and rain-fed agriculture villages (Table
3-9).
Table 3-9. Stratification of sample size according to irrigation
District
Popula
tion l
ivin
g i
n
the
irri
gat
ed a
gr.
vil
lages
Popula
tion l
ivin
g i
n
the
rain
-fed
agr.
vil
lages
% s
har
e o
f popula
tion
livin
g i
n i
rrig
ated
agr.
vil
lages
% s
har
e o
f popula
tion
livin
g i
n r
ain
-fed
agr.
vil
lages
Sam
ple
siz
e fo
r ea
ch
dis
tric
t
# o
f fa
rmer
s to
be
inte
rvie
wed
in
irri
gat
ed a
gr.
vil
lag
es
# o
f fa
rmer
s to
be
inte
rvie
wed
in r
ain
-
fed a
gr.
vil
lag
es
Cihanbeyli 7.398 17.995 29% 71% 168 49 119
Karapınar 7.652 1.942 80% 20% 143 114 29
Seydişehir 11.370 3.956 74% 26% 65 48 17
Total 26.420 23.893 376 211 165
In order to increase the probability of reaching to the farmers who had loss from the
climatic changes and extremes, the villages are ranked according to their risk level.

37
The Ministry of Agriculture and Forestry established Agricultural Insurance Pool
(TARSİM) by the Law on Agricultural Insurances dated 14.06.2005 and Numbered
5363 to promote farmers insuring their production materials and crops. In this system,
certain percentage of the premium is paid by the Government. Risk levels for hail,
frost, storm, flood and rain of each village in a district is determined by Tarsim (Table
3-10).
Table 3-10. An example of risk zones table
DISTRICT NEIGHBOURHOOD
2017
HAIL
RISK
ZONE
2017
FROST
RISK
ZONE
2017
STORM
RISK
ZONE
2018
FLOOD
RISK
ZONE
2019
RAIN
RISK
ZONE
SEYDİŞEHİR AKÇALAR C H D I K
SEYDİŞEHİR AŞAĞIKARAÖREN B H D C K
SEYDİŞEHİR BAŞKARAÖREN B H D I K
SEYDİŞEHİR BOSTANDERE B H D I K
SEYDİŞEHİR BOYALI C H D C K
SEYDİŞEHİR DİKİLİTAŞ B H D C K
SEYDİŞEHİR GEVREKLİ B H D I K
… … … … … … …
Risk levels for hail, frost, storm and flood and insurance premium (%) for different
crops are also determined by TARSİM and a general classification for crop is done
(Table 3-11). Risk evaluation for frost do not cover the major crops cultivated in
Konya, thus is not used in the calculations. Furthermore, drought risk levels are
determined at district level, thus drought risk is considered equal in all the
neighbourhoods.
In order to use this data and determine the numeric equivalent of risk zone
classifications for the neighbourhoods, area percentages of crops cultivated in a
district is used to weigh the premium prices (%).

38
Table 3-11. Hail coverage premium price table
Crop
Sens.
Class
Hail Risk Zones and Premium Prices (%)
A B C D E … T U V Y Z
1 0,28 0,32 0,36 0,40 0,44 … 1,84 2,00 2,20 2,40 2,64
2 0,35 0,40 0,45 0,50 0,55 … 2,30 2,50 2,75 3,00 3,30
… … … … … … … … … … … …
75 1,76 2,02 2,27 2,52 2,77 … 11,5
9
12,6
0
13,8
6
15,1
2
16,6
3
Table 3-12. Risk zone classifications for the neighbourhoods
Neighbourhood 2017
Hail Risk
2017
Storm Risk
2017
Flood
Risk
Total
Risk
Average
Risk
Population
over 18
SIĞIRCIK 2,82616441 1,294751135 1,09 5,210916 1,736972 98
TURANLAR 2,82616441 1,294751135 1,09 5,210916 1,736972 214
YAPALI 2,82616441 1,294751135 1,09 5,210916 1,736972 866
DAMLAKUYU 2,56089546 1,395609835 1,09 5,046505 1,682168 306
KELHASAN 2,56089546 1,294751135 1,09 4,945647 1,648549 942
KIRKIŞLA 2,56089546 1,294751135 1,09 4,945647 1,648549 579
KUŞCA 2,56089546 1,294751135 1,09 4,945647 1,648549 1187
KARABAĞ 1,7456065 1,294751135 1,68 4,720358 1,573453 1853
GÜNYÜZÜ 2,17202683 1,294751135 1,09 4,556778 1,518926 1264
… … … … … … …
Sampling can be classified as random and non-random. Random sampling, also
known as probability sampling, includes a random mechanism to obtain a
representative sample and includes methods such as simple random sampling,
systematic sampling, stratified sampling, cluster sampling and multistage sampling.
In non-random sampling on the other hand, the sample is drawn based on non-random
mechanisms, such as snowball sampling and quota sampling, due to unavailability of
sample frame listing of potential respondents or locations (Crano et al, 2015). The
research used the methodology used by (Shah et al., 2013), which is based on a
systematic sampling method, in which interviews started at the end of the main road
or main branch road based on a random number table. Furthermore, quota sampling is

39
used in order to assure that the farmers who had crop, equipment or animal loss in
their agricultural production in the last five years were reached. In this technique, the
respondents are sampled randomly until a predefined number of participants is
achieved (Crano et al, 2015). It was assured that at least 50% of the interviewees were
affected from some kind of climatic extreme such as drought, frost, flood etc. before
the interviews were completed in each village.
The questionnaire was applied using tablet PCs and the data of each interview could
be uploaded in the system instantly. The fieldwork was conducted by experienced
surveyors between 29th and 31st May 2017. The interviews took an average of 45
minutes per farmer and they were conducted with self-identified heads of the
households (all of whom are men). The data was analysed using either IBM SPSS
Statistics 23 or Microsoft Excel.
3.2.4. Measuring Household Level Vulnerability
Household level vulnerability is measured using two different methods based on
farmer statements (Table 3-13), which can be used for measurement of exposure,
sensitivity and adaptive capacity.
Table 3-13. Indicators used for measuring household level vulnerability
Sub-index Indicator Explanation
Exposure Average annual number of
climatic extremes farmers
were exposed
Average number of climatic extremes
farmers were exposed per year for
the last five years
Sensitivity The impact of crop loss due to
climatic extremes on the
household income
The impact of the crop losses due to
any disasters in the last 5 years on the
household income (1-5 scale; 1: no
impact, 5: significant impact)
Adaptive
Capacity
Easiness level in
compensation of the losses
If the farmer could compensate the
losses, how difficult it was (1-5 scale;
1: Not easy at all, 5: extremely easy)

40
In the first method, farmer vulnerability is calculated similar to the formula used in
district level analysis (Formula 1):
Household Level Farmer Vulnerability = Exposure + Sensitivity – Adaptive
Capacity (6)
In the second method, household level farmer vulnerability is calculated as the ratio
of sensitivity to adaptive capacity using the following formula:
Household Level Farmer Vulnerability = Sensitivity / (Adaptive Capacity + 1) (7)
In order to make a multi scale comparison of the driving factors of vulnerability, data
on the following indicators are obtained in the household survey (Table 3-14). The
indicators are either equivalents of the ones used at the district level, or their proxy at
the household level.
Table 3-14. Indicators affecting household level vulnerability
Indicators Explanation
Education level of the
household head
Certain characteristics of the household heads, who
generally position themselves as the decision makers in
the household, have significant impact on sensitivity
and adaptive capacity of the household. Educational
level of household head is found to be a significant
determinant of resilience to climate change in
household (Alauddin and Sarker, 2014; Below et al.,
2012; Deressa et al., 2009; Ghimire et al., 2010; Hisali
et al., 2011; Morzaria-Luna et al., 2014; Notenbaert et
al., 2013; Tesso et al., 2012; Thoai et al., 2018;
Zarafshani et al., 2012).

41
Indicators Explanation
Dependency ratio Dependent population in the household (members
below 15 and above 65) is considered unproductive and
increases vulnerability (Ahsan and Warner, 2014).
Percentage share of
agricultural production in
income
Income diversification improves the resilience of the
farmers, as their income is not solely dependent on
agriculture. Percentage share of agricultural income,
non-agricultural income and access to non- agricultural
income are the widely used indicators of household
level vulnerability (Deressa et al., 2009; Ghimire et al.,
2010; Robinson et al., 2015). In this study, percentage
share of agricultural production in income is used as an
indicator of vulnerability.
Percentage of rain-fed
land
Rain-fed areas are more vulnerable to climatic changes
and extremes, especially to drought. Access to water
resources and irrigation infrastructure reduces
vulnerability of farmers (Gbetibouo and Ringler, 2009;
Hisali et al., 2011; Melkonyan, 2014; Mohmmed et al.,
2018; Monterroso et al., 2014; Murthy et al., 2015;
Zarafshani et al., 2012). Thus, percentage of rain-fed
land in the farm is used as an indicator of vulnerability.
Percentage of land with
good soil quality
Soil content and moisture are highly important factors
that increase resilience of agricultural production.
Higher nutrient and moisture content increases the
resistance of the crop against climatic changes and
extremes, such as drought. Thus, soil type and fertility
are used as indicators of vulnerability (Below et al.,
2012; Luers et al., 2003; Murthy et al., 2015). In this
42
Indicators Explanation
study, self- assessed soil quality is used as an indicator
of the household level vulnerability.
Existence of forest near
by agricultural land
Forests provide various ecosystem services to
agricultural production such as soil protection from
extreme events, hosting pollinators and natural enemies
etc. (Decocq et al., 2016), thus existence of forests is
considered as a resilience indicator and used in
vulnerability studies (Mendoza et al., 2014; Notenbaert
et al., 2013). At district level, percentage of forest land
was used as an indicator and it is transformed into
household level as existence of a forest nearby the
agricultural land.
Crop diversity at different
plots
Crop diversity reduces vulnerability of farmers by
securing certain share of agricultural income. Crops can
be diversified throughout the year or on the same land
at the same time. Highly vulnerable regions are
characterized by low crop diversity (Ahumada-
Cervantes et al., 2017; Hahn et al., 2009; Mohmmed et
al., 2018a; Tesso et al., 2012). Crop diversity at
different plots is used as an indicator in this study.
Total number of livestock
owned
Livestock ownership diversifies household livelihood
and results in a shift in vulnerability category of the
households from higher to lower (Ghimire et al., 2010;
Nkondze et al., 2013).
Number of agricultural
equipment
More access to physical and material resources
increases the flexibility of farmers to cope with a
changing environment (Ghimire et al., 2010).

43
Indicators Explanation
Number of memberships
to agricultural
organizations
Participation to the activities of agricultural
organizations and number of memberships to these
organizations are strong determinants of household’s
resilience to climate change impacts (Ghimire et al.,
2010a; Huynh and Stringer, 2018; Notenbaert et al.,
2013; Piya et al., 2012; Tesso et al., 2012). In this study,
the number of agricultural organizations that the farmer
is registered as a member is used as an indicator.
Number of agricultural
training obtained in
previous year
Extension on crop and livestock provides access to
information required to assess the impacts of climatic
changes, thus have an influence on farmers’
vulnerability (Deressa et al., 2009; Ghimire et al., 2010;
Zarafshani et al., 2012).
Number of subsidies
obtained from the
Ministry
Institutional support and subsidies have significant
impact on crop choice and asset portfolio of the
household (Alauddin and Sarker, 2014). The success of
adaptation strategies rely on financial support from
various organizations (Huynh and Stringer, 2018).
Number of facilities
available
Economic potential and infrastructure of the area have
positive impacts on adaptation (Below et al., 2012).
One of the factors that affects the resilience is
institutional arrangements (Mohmmed et al., 2018). In
this study, infrastructure and economic capacity of the
settlement where farmer lives are measured with the
number of available facilities such as schools, health
centers etc.
Agricultural insurance in
the last 5 years
One of the characteristics of highly vulnerable regions
is low level of agricultural insurance (Mohmmed et al.,

44
Indicators Explanation
2018; Robinson et al., 2015). Insurance schemes can be
used as a way to compensate crop losses associated
climate variability (Antwi-Agyei et al., 2013; Schilling
et al., 2012).
3.2.5. Modelling Household Level Vulnerability and Adaptation Behavior
In order to model the overall household vulnerability and adaptation behavior, and to
determine the highly contributing factors, regression analysis, which aims at
predicting a dependent variable from a number of independent variables, was run.
Both linear (multiple linear regression- MLR) and non-linear (random forest- RF)
regression models were constructed to compare the results in terms of the form of the
relationship between the dependent variable and the predictors, and the model fit. The
dependent variables were the household level vulnerability, which is determined based
on farmer statements, and the number of adaptation techniques used. The independent
variables were household level socio-economic indicators comparable to the ones used
in the district level analysis.
The significance of the MLR model, which fits a linear equation on the data, was
estimated by using F-test, which indicates if the model provides a better fit compared
to an intercept-only model. The overall fit of the model was estimated using the
correlation coefficient (R2), which represents the percentage of the variation in the
outcome that can be explained by the model (Field, 2009).
The random forest is a machine learning technique that randomly selects subsets of
predictors to grow multiple decision trees. The subsets are independent, the predictors
are selected with equal probability and sampling is done with replacement, which
allows predictors to occur in several subsets (Kamińska, 2018). In order to stabilize
variable importance scores, the forests were constructed with 2000 trees (Şen et al.,

45
2017) and the predicted output is obtained by averaging all the trees. The performance
of the model was ensured by the out-of-bag (OBB) procedure (Li et al., 2017) and
importance of each predictor is illustrated via partial dependence plots (Şen et al.,
2017). Mean Squared Error (MSE), which is the averaged squared errors, is used to
measure the model fit in the RF model. Low MSE indicates that model has high
explanatory power.


47
CHAPTER 4
4. RESULTS
In this chapter, the results of vulnerability index analysis and the socioeconomic
survey conducted based on the index results are reported.
4.1. Vulnerability Index Results
4.1.1. Exposure Sub-Index Results
The exposure sub-index is calculated as an average of the number of days that the
maximum temperature exceeds 35 oC, the number of days that the minimum
temperature drops below 0 oC and difference between the monthly averages of
precipitation between 1960 and 2000 and between 2000 and 2015. The normalized
figures for the districts are given in Table 4-1 below.
Table 4-1. Exposure sub-index components
Districts Deviation
from Max.
Temp.
Deviation
from Min.
Temp.
Deviation
from Mean
Precipitation
Exposure
Average
Beyşehir 0,496 0,077 0,000 0,191
Cihanbeyli 1,000 0,385 0,422 0,602
Çumra 0,681 0,332 0,448 0,487
Ereğli 0,783 0,139 0,195 0,372
Hadim 0,000 0,786 0,768 0,518
Ilgın 0,682 0,571 0,175 0,476
Karapınar 0,925 1,000 0,225 0,717
Kulu 0,837 0,929 1,000 0,922
Seydişehir 0,617 0,000 0,920 0,512
Yunak 0,652 0,776 0,360 0,596

48
Figure 4.21 shows the results of the exposure sub-index calculations. The results
showed that Kulu and Karapınar are exposed to climatic extremes and variabilities
more than the other districts, while the least exposed districts are Ereğli and Beyşehir.
The rest of the districts have a medium level exposure to climatic changes and
extremes.
Figure 4.1 Exposure sub-index results for the selected districts
As seen in Figure 4.2 below, Kulu district is equally affected from maximum and
minimum temperature variations and precipitation change. Maximum temperature and
minimum temperature variations affects Karapınar more than changes in monthly
precipitation. Variations in maximum temperature, which is the number of days
exceeding 35 oC, is the dominant component of exposure index in Cihanbeyli, while
temperature variations in Yunak are more effective than the amount of precipitation
change. Ilgın is highly affected from maximum and minimum temperature variations.

49
Hadim and Seydişehir, which are located in southern part of the Province, have
medium level exposure. Hadim is affected from minimum temperature variation and
precipitation variation almost equally, while Seydişehir is affected from maximum
temperature variation and precipitation change. Beyşehir has the least exposure level
and the dominant factor in this exposure level is the maximum temperature variation,
while precipitation change has comparatively no impact.
Figure 4.2 Contributions of the components of exposure for each district
Maximum temperature variation is the dominant factor and almost equal to sum of
minimum temperature variation and change in monthly precipitation in Çumra, while
in Ereğli it exceeds sum of minimum temperature variation and change in monthly
precipitation.
0%
10%
20%
30%
40%
50%
60%
70%
80%
90%
100%
Beyşehir Cihanbeyli Çumra Ereğli Hadim Ilgın Karapınar Kulu Seydişehir Yunak
Exposure
Maximum temperature variation Minimum temperature variation Change in monthly precipitation

50
4.1.1. Sensitivity Sub-Index Results
The sensitivity sub-index is composed of annual precipitation, ratio of rain-fed
agriculture, crop diversity, ratio of farmer population, ratio of forest land, soil quality,
dependency ratio and illiteracy ratio indicators. The normalized figures for the districts
are given in Table 4-2 below.
Table 4-2. Sensitivity sub-index components
Dis
tric
ts
An
nu
al
pre
cip
itati
on
Rati
o of
rain
-fed
agri
cult
ure
Cro
p d
iver
sity
Rati
o
of
farm
er
pop
ula
tion
Rati
o
of
fore
st
lan
d
Soil
qu
ali
ty
Dep
end
ency
rati
o
Illi
tera
cy r
ati
o
Sen
siti
vit
y
aver
age
Beyşehir 0,237 0,310 0,913 0,029 0,273 0,622 0,377 0,219 0,372
Cihanbeyli 0,860 0,937 0,845 0,464 1,000 0,383 0,336 0,516 0,668
Çumra 0,826 0,000 0,000 0,281 0,925 0,117 0,693 0,000 0,355
Ereğli 0,888 0,212 0,061 0,025 0,929 0,513 0,187 0,308 0,390
Hadim 0,000 0,060 0,717 0,318 0,000 1,000 1,000 0,325 0,428
Ilgın 0,753 0,793 0,466 0,322 0,719 0,439 0,621 0,567 0,585
Karapınar 0,884 0,439 0,118 0,431 0,986 0,462 0,781 0,233 0,542
Kulu 0,892 1,000 0,915 0,334 1,000 0,000 0,000 0,596 0,592
Seydişehir 0,024 0,181 0,519 0,000 0,088 0,494 0,205 0,076 0,198
Yunak 1,000 0,903 1,000 1,000 0,998 0,141 0,719 1,000 0,845
The results showed that among the northern districts, Yunak has the highest sensitivity
level (0.85), while Kulu (0.59), Cihanbeyli (0.67) and Ilgın (0.59) have medium level
of sensitivity. Medium level sensitivity group also includes Karapınar (0.54).
Beyşehir, Hadim, Seydişehir, Çumra and Ereğli have the lowest sensitivity levels
(Figure 4.3).
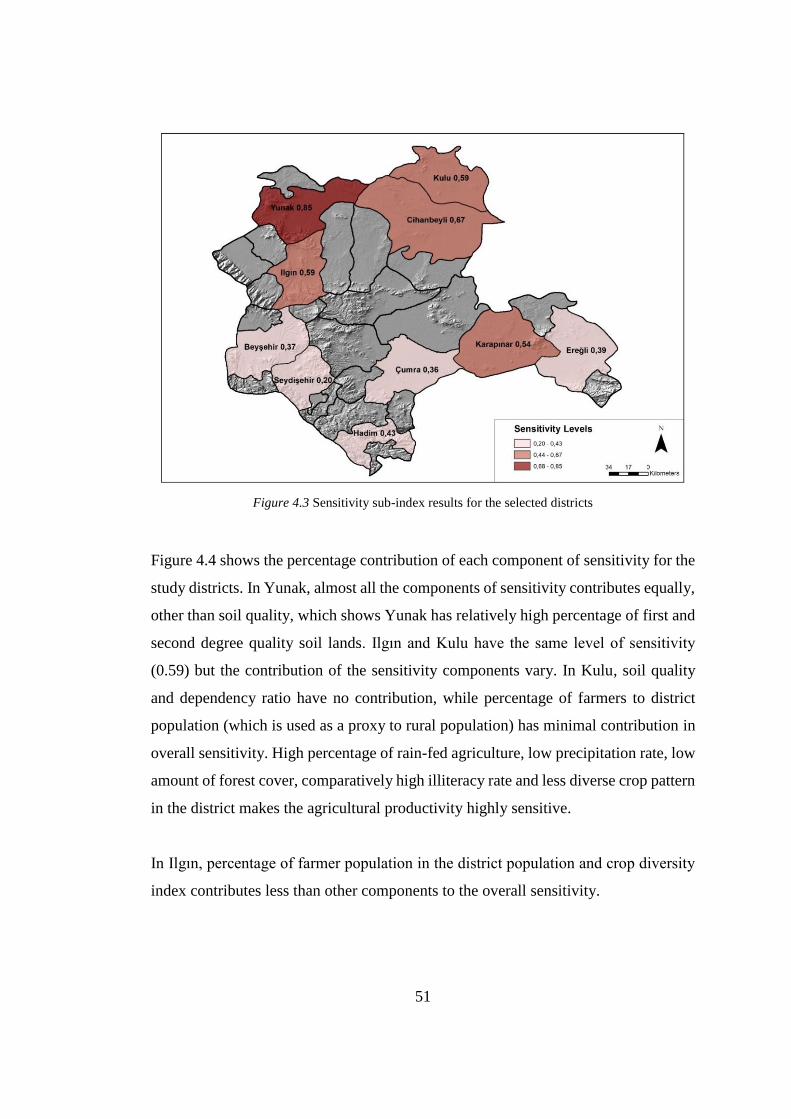
51
Figure 4.3 Sensitivity sub-index results for the selected districts
Figure 4.4 shows the percentage contribution of each component of sensitivity for the
study districts. In Yunak, almost all the components of sensitivity contributes equally,
other than soil quality, which shows Yunak has relatively high percentage of first and
second degree quality soil lands. Ilgın and Kulu have the same level of sensitivity
(0.59) but the contribution of the sensitivity components vary. In Kulu, soil quality
and dependency ratio have no contribution, while percentage of farmers to district
population (which is used as a proxy to rural population) has minimal contribution in
overall sensitivity. High percentage of rain-fed agriculture, low precipitation rate, low
amount of forest cover, comparatively high illiteracy rate and less diverse crop pattern
in the district makes the agricultural productivity highly sensitive.
In Ilgın, percentage of farmer population in the district population and crop diversity
index contributes less than other components to the overall sensitivity.

52
Figure 4.4 Contributions of the components of sensitivity for each district
In Cihanbeyli, dependency ratio and soil quality contributes less to the overall
sensitivity than the other components. In Karapınar, crop diversity index and illiteracy
rate have less share in overall sensitivity. On the other hand, amount of annual
precipitation (279 mm), comparatively less amount of forest cover, high dependency
and low soil quality make the district sensitive to climatic changes.
In Beyşehir, low crop diversity and low soil quality are the major factors contributing
sensitivity, followed by high dependency ratio and farmer population. Similar to
Beyşehir, low crop diversity and soil quality are the two of the major factors in
addition to percentage of rain-fed agriculture and dependency ratio in Seydişehir’s
sensitivity. In Hadim, dependency is also a significant factor in addition to these two
factors. For Çumra, major factors are low annual precipitation, low forest cover and
high dependency ratio, while for Ereğli they are precipitation, low forest cover and
low soil quality.
0%
20%
40%
60%
80%
100%
Beyşehir Cihanbeyli Çumra Ereğli Hadim Ilgın Karapınar Kulu Seydişehir Yunak
Sensitivity
Precipitation Percentage of rain-fed agriculture
Crop diversity index Percentage of farmers to district population
Percentage of forest cover Soil quality
Dependency ratio Illiteracy rate

53
4.1.1. Adaptive Capacity Sub-Index Results
The adaptive capacity sub-index is composed of density of farm animals, number of
agricultural equipment per farmer, density of road network, extension trainings given
per farmer, number of agricultural organizations per farmer, amount of agricultural
subsidies provided per hectare and percentage of agricultural land insured. The
normalized figures for the districts are given in Table 4-3 below.
Table 4-3. Adaptive capacity sub-index components
Dis
tric
ts
Den
sity
of
farm
an
imals
#
of
agri
cult
ura
l
equ
ipm
ent
per
farm
er
Den
sity
of
road
net
work
s
Exte
nsi
on
tra
inin
gs
giv
en
per
farm
er
#
of
agri
cult
ura
l
org
an
izati
on
s p
er f
arm
er
Am
ou
nt
of
agri
. su
bsi
die
s
pro
vid
ed p
er h
ecta
re
%
of
ag
ricu
ltu
ral
lan
d
insu
red
Ad
ap
tive
Cap
aci
ty
Aver
age
Beyşehir 0,188 0,429 0,735 0,311 0,754 0,149 0,020 0,369
Cihanbeyli 0,183 0,192 0,286 0,000 0,000 0,000 0,897 0,223
Çumra 0,556 1,000 1,000 0,025 0,873 0,526 0,525 0,644
Ereğli 1,000 0,181 0,477 1,000 0,865 1,000 0,274 0,685
Hadim 0,000 0,976 0,000 0,782 1,000 0,438 0,016 0,459
Ilgın 0,429 0,449 0,458 0,423 0,649 0,079 0,198 0,384
Karapınar 0,941 0,233 0,188 0,518 0,967 0,465 0,595 0,558
Kulu 0,234 0,000 0,204 0,357 0,164 0,022 1,000 0,283
Seydişehir 0,258 0,687 0,538 0,274 0,759 0,135 0,000 0,379
Yunak 0,045 0,124 0,310 0,023 0,004 0,047 0,919 0,210
The analysis results showed that the northern districts which have found to be highly
exposed to climatic changes have less adaptive capacity to these changes (Figure 4.5).

54
Figure 4.5 Adaptive capacity sub-index results for the selected districts
Cihanbeyli (0,22), Yunak (0,21) and Kulu (0,28) have the lowest adaptive capacity
among the study districts. Cihanbeyli gets the lowest figures for the number of
extension trainings per farmer, the number of agricultural support staff, the number of
agricultural organizations and amount of agricultural subsidies per hectare. The major
factor contributing to its adaptive capacity is the percentage of insured land. Kulu has
the highest percentage of insured land, and the number of agricultural equipment per
farmer is the least contributing factor to its adaptive capacity. In Yunak, the percentage
of insured land is the dominant factor contributing to its adaptive capacity, while the
number of support staff per farmer and the number of extension trainings given per
farmer are the least contributing factors.
For Ilgın, the components contributing to adaptive capacity are number of agricultural
organisations per farmer, road density, number of agricultural equipment per farmer,

55
density of farm animals and extension trainings per farmer. Amount of agricultural
subsidies per hectare is the least contributing factor to the adaptive capacity of Ilgın.
Figure 4.6 Contributions of the components of adaptive capacity for each district
Ilgın, Beyşehir, Seydişehir and Hadim have medium level adaptive capacity. Ilgın has
fairly equally distributed indicators of adaptive capacity except for road density and
amount of agricultural subsidies provided to the farmers. These two factors contribute
the least. Beyşehir’s adaptive capacity is mainly derived from the road density and the
number of agricultural organizations per farmer, while the least contributing factors
are density of farm animals and the amount of subsides provided per farmer.
Seydişehir’s adaptive capacity is based on the equipment per farmer, road density and
the number of agricultural organizations per farmer. In Hadim, number of agricultural
organizations per farmer and by the number of agricultural equipment per farmer are
the major indicators contributing to the adaptive capacity. The number of extension
trainings per farmer are also an indicators increasing its adaptive capacity. The farm
0%
20%
40%
60%
80%
100%
Beyşehir Cihanbeyli Çumra Ereğli Hadim Ilgın Karapınar Kulu Seydişehir Yunak
Adaptive Capacity
Density of farm animals Agricultural equipment per farmer
Road density Extension trainings per farmer
Number of agricultural organisations per farmer Amount of agricultural subsidies per ha
Percentage of insured land

56
animal density and the percentage of insured land are the indicators contributing the
least to its adaptive capacity.
Çumra, Karapınar and Ereğli forms the highest adaptive capacity groups. Among the
ten districts, Ereğli has the highest adaptive capacity, which has the highest figures for
the density of farm animals, the number of extension trainings per farmer and the
amount of agricultural subsidies given per hectare. The least contributing factors to its
adaptive capacity are the number of agricultural equipment per farmer and the
percentage of insured land.
The number of agricultural organizations and the density of farm animals are the two
factors highly contributing to adaptive capacity of Karapınar, followed by the
percentage of insured land the number of extension trainings per farmer. Density of
the road network and the number of agricultural equipment per farmer Extension
trainings given per farmer is the least contributing factor to its adaptive capacity.
In Çumra, dominant indicators contributing to the adaptive capacity are agricultural
equipment per farmer, the number of agricultural organizations per farmer and road
density. The amount of agricultural subsidies given per hectare, the percentage of
insured land and the density of farm animals fairly equally contributes to its adaptive
capacity. The number of extension trainings per farmer is the least contributing factor
to the adaptive capacity of this district.
4.1.1. Overall Vulnerability Index Results
Vulnerability level of each district is determined by calculating arithmetic mean of the
indicators. Exposure, sensitivity and adaptive capacity levels, in addition to the overall
vulnerability of the districts are given in Table 4-4 below. The results show that Kulu,
Yunak and Cihanbeyli districts, which are located in the northern part of Konya, are

57
exposed to temperature and precipitation variation more than the other districts, while
their sensitivity are higher and adaptive capacities are lower.
Table 4-4. Exposure, sensitivity, adaptive capacity and vulnerability levels of the districts
District Exposure Sensitivity Adaptive
Capacity
Overall
Vulnerability
Kulu 0,922 0,592 0,283 1,231
Yunak 0,596 0,845 0,210 1,231
Cihanbeyli 0,602 0,668 0,223 1,047
Karapınar 0,717 0,542 0,558 0,700
Ilgın 0,476 0,585 0,384 0,678
Hadim 0,518 0,428 0,459 0,487
Seydişehir 0,512 0,198 0,379 0,332
Çumra 0,487 0,355 0,644 0,199
Beyşehir 0,191 0,372 0,369 0,194
Ereğli 0,372 0,390 0,685 0,077
Karapınar, Ilgın and Hadim have medium level vulnerabilities, while Seydişehir,
Çumra, Beyşehir and Ereğli have comparatively low overall vulnerability levels.
Figure 4.7 shows the vulnerability groups map of the districts.

58
Figure 4.7 Overall vulnerability index results for the selected districts
Figure 4.8 shows the sub-index and composite vulnerability index results for the ten
districts in an increasing order.

59
Figure 4.8 Levels of the components of overall vulnerability for ten districts
4.2. Household Characteristics, Climatic Observations and Risk Coping
In this chapter, indicators affecting household level vulnerability, climatic
observations of the farmers and adaptation strategies of farmers to climatic changes in
Cihanbeyli, Karapınar and Seydişehir, which are selected as pilot sites for the survey,
are reported.
4.2.1. Demographic Characteristics of the Households
In this section, findings of the survey regarding the certain characteristics of the
household and the respondent farmer are presented. All the respondent farmers were
male and declared themselves as the household head. The average age of the
household head is more than 50 in all the districts (Table 4-5).
0,08
0,19 0,20
0,33
0,49
0,68 0,70
1,05
1,23 1,23
0,00
0,20
0,40
0,60
0,80
1,00
1,20
Exposure Index Sensitivity Index
Adaptive Capacity Index Vulnerability

60
Table 4-5. Demographic characteristics of the households
Vulnerability Variables Cihanbeyli Karapınar Seydişehir
Household Head (Farmer)
Average age of the household
head
52 53 55
Education level of the household
head (dominant group)
Primary
school
(51.8%)
Primary
school
(69.9%)
Primary
school
(66.2%)
Duration of residency in the
village (months)
11.1 11.7 11.0
Farming experience (years) 28.0 29.9 31.4
Household
Average household size (people) 4.9 5.5 3.8
Dependency Ratio 34.6% 30.6% 35.0%
Percentage of family members
working in agriculture
35.3% 40.7% 56.4%
Percentage share of agricultural
income
25%- 50%
(26.2%)
25%- 50%
(24.5%)
Less than
25% (26.2%)
25%- 50%
(26.2%)
Average number of external
workers in the farm (people)
1.2 0.7 3.0
Annual Income (TL)2 15.001-
40.000
(47.6%)
15.001-
40.000
(46.9%)
15.001-
40.000
(60.0%)
The results highlight that majority of the farmers (more than 60% in all districts)
belong to 30-60 age group, while there were no farmers interviewed younger than 18
years old. Farmers in “older than 60 years old” group have more than 30% share in all
the districts (Figure 4.9).
2 Income level is based on the farmer statement.

61
Figure 4.9 Age groups of the farmers in three districts
The dominant education level of the farmers is primary school in all three districts.
The farmers spend at least 11 months in the village where they are engaged in farming
and their average farming experience is more than 28 years.
The average size of the farmer’ families vary between 3.8 (Seydişehir) and 5.5
(Karapınar) and the households in the three districts have a similar dependency ratio
varying between 30.6% and 35.0%. Percentage of the household members working in
agricultural sector is the lowest in Cihanbeyli (35.3%), while it is the highest in
Seydişehir (56.4%). Farms of Seydişehir also have the highest number of external
workers (3.0 people), while Karapınar has the lowest help from outside in agricultural
production with 0.7 people.
8,3%
2,8% 1,5%
61,3%
66,4%
60,0%
30,4% 30,8%
38,5%
0,0%
10,0%
20,0%
30,0%
40,0%
50,0%
60,0%
70,0%
Cihanbeyli Karapınar Seydişehir
18-29 30-60 60<

62
Figure 4.10 Household size
Majority of the farmers belong to low income groups and earns 15.0001-40.000 TL
per annum in all the districts. The total percentage of the lowest income groups is
23.81% in Cihanbeyli, 25.17% in Karapınar and 26.15% in Seydişehir. In Seydişehir,
there are no farmers belonging to the highest two income groups (Figure 4.11).
Figure 4.11 Income groups
1,2% 1,4% 0,9%
15,5% 16,1%13,2%
9,5% 11,2% 9,6%
20,2% 15,4%17,5%17,9% 16,1%
5,3%
35,7%39,9%
53,5%
0,0%
10,0%
20,0%
30,0%
40,0%
50,0%
60,0%
Cihanbeyli Karapınar Seydişehir
1 2 3 4 5 6+
23,81% 25,17% 26,15%
47,62% 46,85%
60,00%
17,26%15,38% 13,85%
5,36%1,40%
0,00%5,95%
11,19%
0,00%
0,00%
10,00%
20,00%
30,00%
40,00%
50,00%
60,00%
70,00%
Cihanbeyli Karapınar Seydişehir
Less than 15.000 TL 15.001- 40.000 TL 40.001- 70.000 TL
70.001-100.000 TL More than 100.0001 TL
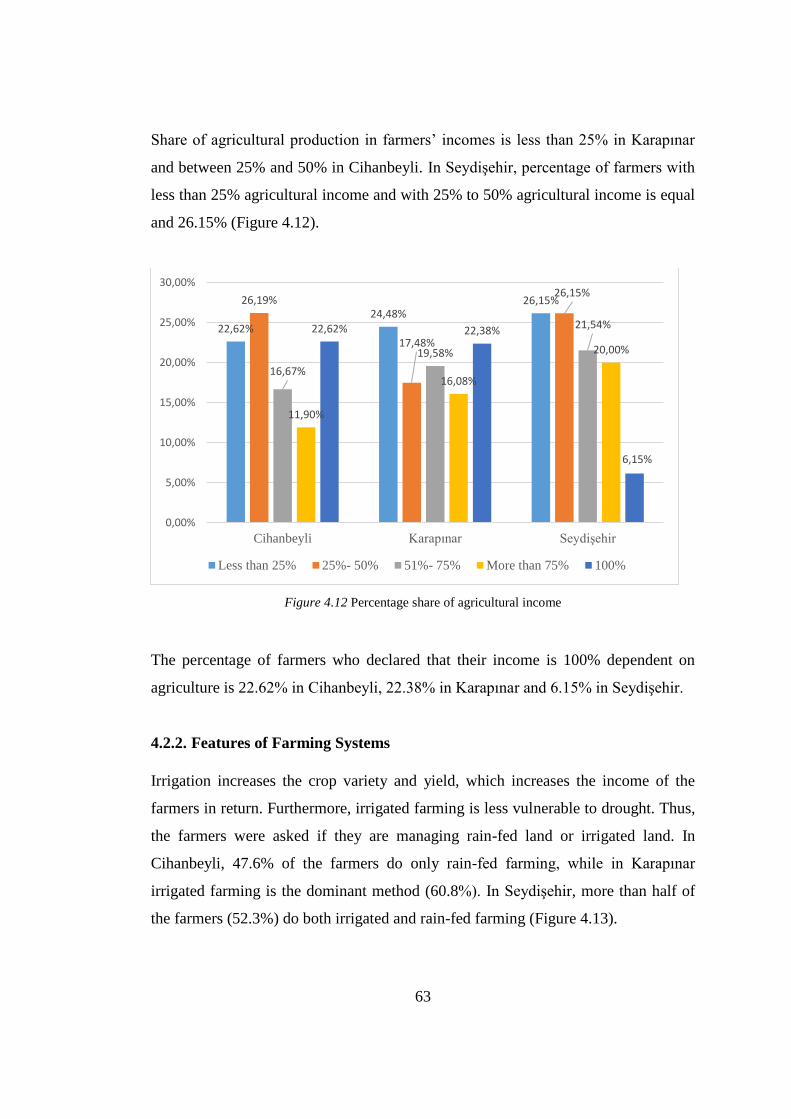
63
Share of agricultural production in farmers’ incomes is less than 25% in Karapınar
and between 25% and 50% in Cihanbeyli. In Seydişehir, percentage of farmers with
less than 25% agricultural income and with 25% to 50% agricultural income is equal
and 26.15% (Figure 4.12).
Figure 4.12 Percentage share of agricultural income
The percentage of farmers who declared that their income is 100% dependent on
agriculture is 22.62% in Cihanbeyli, 22.38% in Karapınar and 6.15% in Seydişehir.
4.2.2. Features of Farming Systems
Irrigation increases the crop variety and yield, which increases the income of the
farmers in return. Furthermore, irrigated farming is less vulnerable to drought. Thus,
the farmers were asked if they are managing rain-fed land or irrigated land. In
Cihanbeyli, 47.6% of the farmers do only rain-fed farming, while in Karapınar
irrigated farming is the dominant method (60.8%). In Seydişehir, more than half of
the farmers (52.3%) do both irrigated and rain-fed farming (Figure 4.13).
22,62%24,48%
26,15%26,19%
17,48%
26,15%
16,67%
19,58%
21,54%
11,90%
16,08%
20,00%
22,62% 22,38%
6,15%
0,00%
5,00%
10,00%
15,00%
20,00%
25,00%
30,00%
Cihanbeyli Karapınar Seydişehir
Less than 25% 25%- 50% 51%- 75% More than 75% 100%

64
Figure 4.13 Percentage of rain-fed and irrigated land ownership
In order to understand the structure of the farming systems, the farmers were asked
questions regarding the size of the land and the number of plots they manage, soil
quality (self-assessment by the farmer) and slope of the land and the number of
equipment they use on the farm. Cihanbeyli has the highest percentage of average land
size (45.5 ha), followed by Karapınar (39.2 ha) and Seydişehir (7.2 ha). Despite the
smallest average land size, Seydişehir has the highest number of plots (12.6), which
makes farming lands more fragmented than the ones in the other districts and reduces
the average parcel size managed by the farmer (7.2). On the other hand, Seydişehir
farming lands have higher soil quality and lower slope than other districts (Table 4-6).
47,62%
23,78% 24,62%22,62%
60,84%
23,08%
29,76%
15,38%
52,31%
0,00%
10,00%
20,00%
30,00%
40,00%
50,00%
60,00%
Cihanbeyli Karapınar Seydişehir
Rainfed only Irrigated only Both rainfed and irrigated

65
Table 4-6. Features of farming systems
Features of farming systems
Cihanbeyli
Karapınar
Seydişehir
Average size of land managed by the
farmer (decares)
400.9 196.8 91.2
Average number of parcels managed
by the farmer
8.3 5.0 12.6
Average size of parcels managed by
the farmer (decares)
48.5 39.2 7.2
Percentage of land with good and
medium soil quality (%)
86.2 82.7 93.0
Percentage of land with low and
medium slope
91.1 89.9 96.8
Percentage of irrigated land 37.4 66.7 46.6
Number of devices used with tractor 5.7 5.5 6.2
When percentage of the irrigated land in the total land managed considered, Karapınar
farmers have the highest figure (66.7%), while Cihanbeyli farmers only irrigate 37.4%
of their agricultural production land. The average number of agricultural equipment
that farmers own in Cihanbeyli is 5.7, in Karapınar it is 5.5, while Seydişehir farmers
have 6.2 equipment on average.
4.2.3. Crop Diversity
Crop diversity is an adaptation strategy to climatic changes and it can be done either
increasing the number of crops cultivated in a year or planting different crops on
different plots. The farmers of Cihanbeyli cultivate 2 crops in a year on average, while
Karapınar farmers cultivate 1.8 and Seydişehir farmers cultivate 2.3 crops. The reason
of cultivating single crop was declared as having no alternative product in rain-fed
farming. The percentage of the farmers diversifying their crop production on different
plots is the highest in Seydişehir (84.6%) fallowed by Karapınar (73.4%) and
Cihanbeyli (66.1%) (Table 4-7).

66
Table 4-7. Crop diversity
Crop Diversity
Cihanbeyli
Karapınar
Seydişehir
Average number of crops cultivated
in a year
2.0 1.8 2.3
Percentage of farmers diversifying
their production on different plots
(%)
66.1 73.4 84.6
The main reason for crop diversification on different plots is given as diversifying/
increasing income in all the districts (Figure 4.14).
Figure 4.14 Reasons of crop diversity on different plots
4.2.4. Observed Climatic Changes
The farmers were asked about the climatic changes they observe in the last ten years.
In all the districts, changing precipitation patterns such as decreasing, irregular or
delayed precipitation and shorter precipitation periods and increasing temperatures are
23,4%
16,9%
25,6%27,2%
22,0%
16,3%
6,3%
16,1%17,4%
43,0%44,9%
40,7%
0,0%
5,0%
10,0%
15,0%
20,0%
25,0%
30,0%
35,0%
40,0%
45,0%
50,0%
Cihanbeyli Karapınar Seydişehir
Crop rotation Reduce risk Animal feed Diversify/increase income

67
highly observed (more than 90% in all the districts). On the other hand, only 14.9%
of the farmers in Cihanbeyli, 7.7% in Karapınar and 7.7% in Seydişehir stated that
they observe increasing precipitation. Regarding the temperatures changes, increasing
temperatures are observed by more than 90% of the farmers in all the districts. Increase
in day and night time temperature difference is observed by 53.0% of the farmers in
Cihanbeyli, 60.1% in Karapınar and 66.2% in Seydişehir (Table 4-8).
Table 4-8 Observed climatic changes
Observed Climatic Changes
% of Respondents Observing the
Related Climatic Change
Cihanbeyli
(n= 168) Karapınar
(n= 143) Seydişehir
(n= 65)
Rainfall
Increasing precipitation 14.9 7.7 7.7
Decreasing precipitation 93.5 90.9 90.8
Irregular precipitation 96.4 92.3 89.2
Delayed precipitation 96.4 95.1 95.4
Shorter precipitation period 94.0 93.7 89.2
Temperature
Increasing temperature 92.9 93.7 90.8
Increase in day-night temperature
difference 53.0 60.1 66.2
Extremes
Increasing # of floods 92.9 93.7 90.8
Increasing # of hails 4.2 2.1 1.5
Increasing # of frost 30.4 30.8 15.4
Increasing # of simoons 57.1 65.0 78.5
Increasing # of storms 62.5 58.0 55.4
The increasing number of simoons is observed by 57.1% of the farmers in Cihanbeyli,
while 30.4% of the farmers stated that they observe increasing number of frost.
Increasing number of storms is observed by 62.5% of the farmers and increasing
number of hails is observed by 4.2%. In Karapınar, increasing number of flood events
are observed by 93.7% of the farmers, followed by 65.0% observing increasing
number of simoons, 58.0% observing increasing number of storms and 30.8%

68
observing increasing number of frost. Increasing number of hail events is observed by
only 2.1% of the farmers in Cihanbeyli.
In Seydişehir, increasing number of floods has the highest percent of observation, like
the other two districts, by 90.8%, followed by increasing number of simoons by
78.5%. Increasing number of storms is observed by 55.4% of the farmers, while only
15.4% states that they observed increasing number of frosts. Hails are least observed
extreme events in all the districts.
The farmers were further asked about their opinions on the cause of climatic changes.
Majority of the farmers in all districts stated that they have no idea about the cause of
the climatic changes. 28.6% of the respondents stated it as human activities including
industrialization and deforestation in Cihanbeyli, 22.4% in Karapınar and 27.7% in
Seydişehir respectively. 22.0% in Cihanbeyli, 20.3% in Karapınar and 20.0% of the
respondents in Seydişehir defined it as global warming, greenhouse gases, melting
glaciers or ozone layer depletion (Table 4-9).
Table 4-9 Causes of climatic changes
Cause of Climatic Changes
% of Respondents
Cihanbeyli
(n= 168) Karapınar
(n= 143) Seydişehir
(n= 65)
Don’t know 35.7 45.5 40.0
Human activities destroying natural
balance/ unconsciousness/
industrialization(chemicals,
fertilizers, fuel use)/ deforestation
28.6 22.4 27.7
Global warming/ greenhouse gases/
glaciers melting/ ozone layer
depletion
22.0 20.3 20.0
God’s will 5.4 2.1 0.0
There is no change 1.2 2.1 3.1
Other 7.1 7.7 9.2
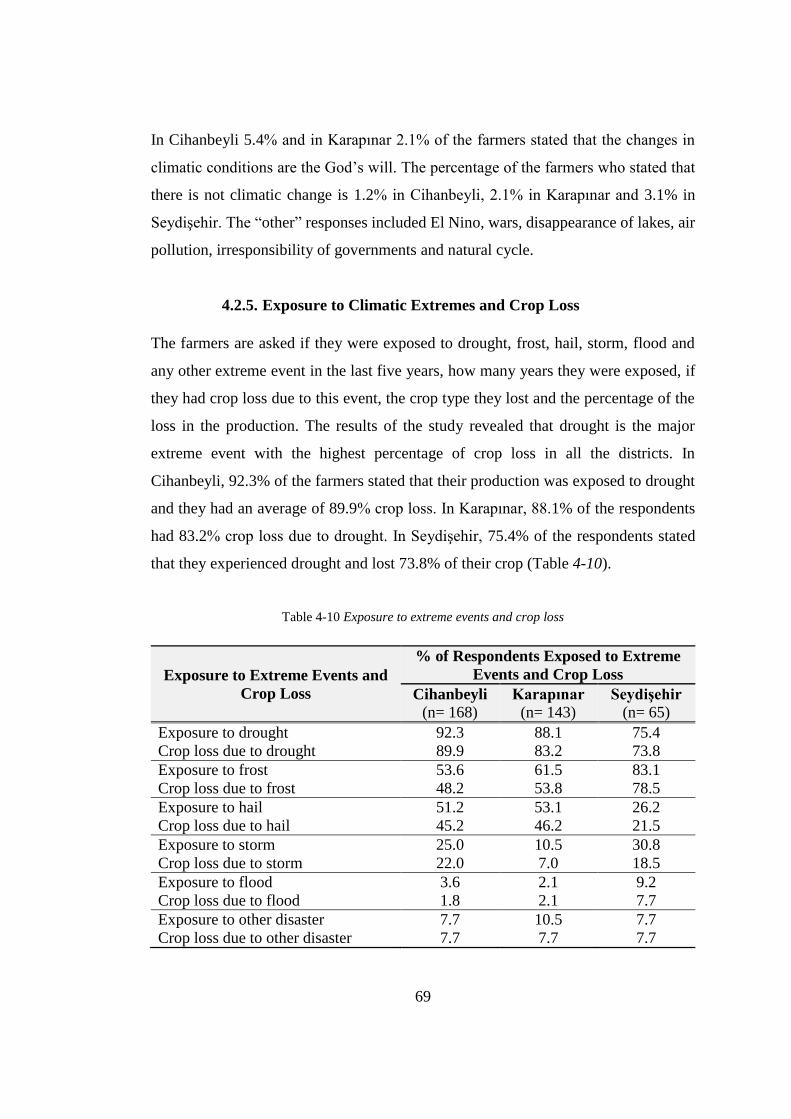
69
In Cihanbeyli 5.4% and in Karapınar 2.1% of the farmers stated that the changes in
climatic conditions are the God’s will. The percentage of the farmers who stated that
there is not climatic change is 1.2% in Cihanbeyli, 2.1% in Karapınar and 3.1% in
Seydişehir. The “other” responses included El Nino, wars, disappearance of lakes, air
pollution, irresponsibility of governments and natural cycle.
4.2.5. Exposure to Climatic Extremes and Crop Loss
The farmers are asked if they were exposed to drought, frost, hail, storm, flood and
any other extreme event in the last five years, how many years they were exposed, if
they had crop loss due to this event, the crop type they lost and the percentage of the
loss in the production. The results of the study revealed that drought is the major
extreme event with the highest percentage of crop loss in all the districts. In
Cihanbeyli, 92.3% of the farmers stated that their production was exposed to drought
and they had an average of 89.9% crop loss. In Karapınar, 88.1% of the respondents
had 83.2% crop loss due to drought. In Seydişehir, 75.4% of the respondents stated
that they experienced drought and lost 73.8% of their crop (Table 4-10).
Table 4-10 Exposure to extreme events and crop loss
Exposure to Extreme Events and
Crop Loss
% of Respondents Exposed to Extreme
Events and Crop Loss
Cihanbeyli
(n= 168) Karapınar
(n= 143) Seydişehir
(n= 65)
Exposure to drought 92.3 88.1 75.4
Crop loss due to drought 89.9 83.2 73.8
Exposure to frost 53.6 61.5 83.1
Crop loss due to frost 48.2 53.8 78.5
Exposure to hail 51.2 53.1 26.2
Crop loss due to hail 45.2 46.2 21.5
Exposure to storm 25.0 10.5 30.8
Crop loss due to storm 22.0 7.0 18.5
Exposure to flood 3.6 2.1 9.2
Crop loss due to flood 1.8 2.1 7.7
Exposure to other disaster 7.7 10.5 7.7
Crop loss due to other disaster 7.7 7.7 7.7

70
The second most experienced weather extreme is frost and Seydişehir has the highest
number of farmers (83.1%) exposed to this event and has the highest crop loss (78.5%)
among the three districts, followed by Karapınar with 61.5% exposure rate and 53.8%
crop loss and Cihanbeyli with 53.6% exposure rate and 48.2% crop loss, accordingly.
Cihanbeyli and Karapınar have close exposure rates to hail (51.2% and 53.1%,
respectively) and crop loss due to the extreme event (45.2% and 46.2%, respectively),
while Seydişehir has the lowest rate of exposure with 26.2% and 21.5% crop loss.
Almost one third of the respondents in Seydişehir stated that their production was
exposed to storm event and they had a crop loss of 18.5% on average, followed by
Cihanbeyli with 25.0% exposure rate and 22.0% crop loss. Karapınar has the lowest
exposure (10.5%) and crop loss (7.0%) rates due to storm event. Flood is the least
experienced extreme event, with the least crop loss in all three districts. Other disasters
experienced by the farmers were simoon, sinkholes and pest attacks.
In order to evaluate the significance of the correlation between the number of exposure
years to climatic extreme in the last five years and percentage of crop loss, Pearson
Correlation (for parametric indicators) method is used. The results show that the
correlation between the exposure to extreme events and crop loss is not statistically
significant in any of the districts (Table 4-11).
Table 4-11 Correlation between exposure to extreme events and percentage of crop loss
District Pearson Correlation
Coefficient
Sig. (2-tailed)
Cihanbeyli 0.063 0.437
Karapınar 0.070 0.421
Seydişehir 0.091 0.484

71
4.2.6. Risk Coping Strategies and Adaptation Methods
The farmers were further asked how they compensated their losses (spontaneous
adaptation) due to the extreme events. In Cihanbeyli, barrowing (19.2%), using
savings/ income from other source (16.7%), taking loan (16.0%), barrowing
agricultural input from retailers (11.5%) and applying for government support (10.9%)
are the mostly used compensation methods. Other than applying for government
support, these methods are also the most preferred ones in the other districts; while
taking a loan has the highest percentage (34.4%) in Karapınar and usage of savings/
salary has the highest figure (22.2%) in Seydişehir (Table 4-12).
Table 4-12 Coping strategies of the farmers after a climate related crop loss
Compensation Method
% of Respondents Applying the
Compensation Method
Cihanbeyli
(n= 156) Karapınar
(n= 131) Seydişehir
(n= 63)
Taking a loan 16.0 34.4 20.6
Borrowing 19.2 17.6 9.5
Mortgaging of properties 7.1 2.3 1.6
Selling properties/animals 5.8 9.2 15.9
Using of savings/ income from other
source
16.7 14.5 22.2
Borrowing materials from retailers 11.5 11.5 15.9
Reducing consumption 8.3 2.3 3.2
Buying food 4.5 2.3 0.0
Help from other family members 7.7 3.8 1.6
Applying for government support 10.9 3.8 3.2
Working outside agricultural sector 5.1 3.1 1.6
Working abroad 1.3 0.0 0.0
Although mentioned by only 1.3% of the respondents, Cihanbeyli is the only district
in which working abroad is a compensation method for the climate related losses. It is
known that Cihanbeyli residents have social and economic relations in especially
central and northern European countries, due to the migrations in 1960s (Kalaycıoğlu
et al., 2010).

72
In order to understand how the respondents adapt to the extreme events (planned
adaptation), they were asked which of the listed methods they started using in the last
five years. All the possible methods were selected from the literature study and the
final list in the questionnaire was determined during the pilot.
Table 4-13 Adaptation techniques of the farmers to climate related risks
Adaptation Method
% of Respondents Applying Risk
Coping Strategy
Cihanbeyli
(n= 168) Karapınar
(n= 143) Seydişehir
(n= 65)
Change of planting time 32.1 46.9 49.2
Change of tillage time 31.0 46.2 49.2
Change of cultivation time 24.4 39.2 47.7
Started crop rotation 33.9 37.8 38.5
Conservation agriculture 25.0 21.0 16.9
Started diversifying crops 39.3 35.0 46.2
Change of crop 57.7 58.0 56.9
Use of efficient irrigation techniques 40.5 62.9 53.8
Drilling well 23.8 32.9 10.8
Use of natural fertilizer 18.5 30.1 20.0
Started fallowing 57.7 35.7 20.0
Started animal husbandry 17.3 25.2 23.1
Selling animals 17.3 28.0 38.5
Started orchard 11.3 16.8 27.7
Started working in non-agricultural
sector 23.8 23.8 18.5
Change of crop cultivated and starting fallowing is the most preferred adaptation
methods in Cihanbeyli with 57.7% for both methods. Karapınar farmers’ most
preferred strategies are using more efficient irrigation techniques (62.9%) and
changing the crop (58.0%) in order to cope with the extreme events, as well as the
farmers of Seydişehir with 53.8% and 56.9% for the same strategies, respectively. A
significant percentage of the farmers in Karapınar and Seydişehir also use changing
planting, tillage and cultivation times as coping strategies with the climatic changes
(Table 4-13). When the total number of adaptive strategies used by the farmers is
examined, it is observed that Karapınar farmers use 5.39 strategies on average,

73
followed by Seydişehir farmers with 5.17 and Cihanbeyli farmers with 4.54 (Figure
4.15.
Figure 4.15 Number of adaptive strategies implemented by the farmers to climatic extremes
4.3. Household Level Vulnerability Results
4.3.1. Mean Exposure, Sensitivity, Adaptive Capacity and Overall
Vulnerability
Exposure figures for the households are calculated by normalizing the average number
of disasters in a year experienced by each farmer. In terms of exposure to climatic
changes and extremes, Karapınar (0.439) has the highest exposure figure, followed by
Cihanbeyli (0.360) and Seydişehir (0.288). This in line with the findings at district
level in terms of ranking.
Sensitivity figures are obtained by normalizing the stated impact of crop loss on
income in 1 to 5 Likert Scale (1- no impact, 5- high impact) for each farmer. Average
sensitivity figures of the districts indicate that crop loss due to a disaster had the
highest impact on the incomes of Cihanbeyli farmers (0.682), followed by Karapınar
4,54
5,39
5,17
4,00
4,20
4,40
4,60
4,80
5,00
5,20
5,40
5,60
Cihanbeyli Karapınar Seydişehir

74
(0.669) and Seydişehir (0.637). This ranking is also in line with the findings at district
level.
Table 4-14 Descriptive statistics for farmer statement based district level vulnerability components
District Summary
Statistics
Exposure Sensitivity Adaptive
Capacity
Cihanbeyli Mean 0.360 0.682 0.239
Minimum 0.000 0.000 0.000
Maximum 1.000 1.000 1.000
Std. Dev. 0.212 0.279 0.333
Karapınar Mean 0.439 0.669 0.222
Minimum 0.000 0.000 0.000
Maximum 1.000 1.000 1.000
Std. Dev. 0.262 0.286 0.306
Seydişehir Mean 0.288 0.637 0.277
Minimum 0.000 0.000 0.000
Maximum 1.000 1.000 1.000
Std. Dev. 0.213 0.226 0.355
Adaptive capacity of the farmers are calculated by normalizing the level of difficulty
in compensating the crop loss on income stated in 1 to 5 Likert Scale (1- not easy, 5-
quite easy). Average household figures for each district show that Seydişehir has the
highest adaptive capacity level (0.277), followed by Cihanbeyli (0.239) and Karapınar
(0.222). At district level analysis, Karapınar had the highest adaptive capacity, while
Cihanbeyli has the lowest.
In order to compare with the district level results, overall vulnerability figure for each
farmer is calculated using two different methods. The first method uses the same
formula used at the district level analysis, in which overall vulnerability is calculated
by summing exposure and sensitivity figures and subtracting adaptive capacity figure
from this sum. According to the results of this method, Karapınar has the highest
figure of overall vulnerability (0.885), calculated by averaging the household figures,
followed by Cihanbeyli (0.803) and Seydişehir (0.648) (Table 4-15).

75
Table 4-15 Descriptive statistics for farmer statement based district level vulnerability components
District Summary
Statistics
Overall
Vulnerability
(Method 1)
Overall
Vulnerability
(Method 2)
Cihanbeyli Mean 0.803 0.586
Minimum -0.670 0.000
Maximum 1.870 1.000
Std. Dev. 0.505 0.293
Karapınar Mean 0.885 0.570
Minimum -0.430 0.000
Maximum 2.000 1.000
Std. Dev. 0.546 0.279
Seydişehir Mean 0.648 0.534
Minimum -0.750 0.000
Maximum 2.000 1.000
Std. Dev. 0.543 0.234
The second method uses the ratio of “the impact of climatic extremes on their income-
sensitivity” to “how difficult it was to compensate the losses- adaptive capacity”. The
results of the second method showed that Cihanbeyli (0.586) has the highest overall
vulnerability figure, followed by Karapınar (0.570) and Seydişehir (0.534). This
ranking is in line with the results of the district level analysis.
In order to evaluate if the exposure, sensitivity, adaptive capacity sub-indexes and
vulnerability levels for the farmers in the three districts are different from each other,
one-way analysis of variance test is conducted on the results of the both methods. The
results of Anova test showed that the sub-indexes and the overall vulnerability levels
for the farmers in the districts are not statistically different from each other (p > 0.05)
in both methods (Table 4-16).

76
Table 4-16 Districts level one-way Analysis of Variance (Anova) results for vulnerability
components
Index Sum of
Squares
Mean
Square
F Sig.
Exposure 0.007 0.003 0.112 0.894
Sensitivity 0.096 0.048 0.642 0.527
Adaptive Capacity 0.133 0.066 0.622 0.537
Vulnerability
(Method 1)
0.324 0.162 0.666 0.514
Vulnerability
(Method 2)
0.125 0.062 0.806 0.448
4.3.2. Modelling Household Level Vulnerability
The farmer level vulnerability figures are calculated using two methods. The average
household vulnerability figures of three districts calculated using two different
methods are given in Table 4-17.
Table 4-17 Vulnerability averages of the farmers in each district
District Vulnerability Score
(Method 1)
Vulnerability Score
(Method 2)
Cihanbeyli 0.803 0.586
Karapınar 0.885 0.570
Seydişehir 0.648 0.534
The results of Method 2 gives a ranking consistent with the district level results, in
which vulnerability is the highest in Cihanbeyli, followed by Karapınar and
Seydişehir. The drivers of farmer vulnerability are examined for both the vulnerability
levels obtained using two different methods in the following section.
4.3.3. The Drivers of the Household Level Farmer Vulnerability
Household level farmer vulnerability is modelled using linear and non-linear methods.
The results of the F-statistics of multiple linear regression model shows that the model
has significant explanatory power, especially for Method 2 figures (p < 0.001) (Table

77
4-18) and district level indicators explain approximately 14% in household level
vulnerability calculated using this method (Table 4-19). However, the amount of the
variation explained by this model (based on the R2) is quite low despite the
significance of the model.
Table 4-18 Significance of regression model for household level vulnerability
Component Sum of
Squares
Mean
Square
F Sig.
Regression model for Method 1 8.46 0.60 2.89 0.0004
Regression model for Method 2 2.89 0.23 4.06 <0.0001
Table 4-19 Regression model summary for household level vulnerability with district level
indicators
R2 Adjusted
R2
Std. Error
of the
Estimate
Regression model for Method 1 0.11 0.07 0.46
Regression model for Method 2 0.14 0.11 0.23
The results of the regression model for Method 1 (Table 4-20) showed that “number
of memberships to agricultural organizations”, “total number of animals owned” and
“dependency ratio of the household” are the significant factors contributing the farmer
vulnerability.
Table 4-20 Significant indicators of household level vulnerability (Method 1) determined by multiple
linear regression
Indicator Estimate Sig.
Intercept 1.026 <0.0001*
Number of memberships to agricultural
organizations
- 0.410 0.0008*
Total number of animals owned - 0.460 0.0263*
Dependency ratio of the household - 0.190 0.0285*
Percentage of land with good soil quality -0.130 0.0549
Percentage of rain-fed land 0.086 0.2282

78
Indicator Estimate Sig.
Agricultural insurance in the last 5 years -0.030 0.2378
Number of facilities available -0.120 0.2700
Number of obtained agricultural training in past year 0.225 0.2740
Crop diversity at different plots -0.020 0.4896
Number of subsidies obtained -0.070 0.5649
Education level of the HH Head -0.070 0.6320
Share of agricultural production in income 0.007 0.9258
Number of agricultural equipment -0,0005 0.9970
Existence of forest near by agricultural land 0,0001 0.9974
* Significant indicators
The results for Method 2 show that “number of memberships to agricultural
organizations”, “dependency ratio of the household”, “percentage of land with good
soil quality” and “percentage of rain-fed land” contribute significantly to MLR model
(Table 4-21).
Table 4-21 Significant indicators of household level vulnerability (Method 2) determined by multiple
linear regression
Indicator Estimate Sig.
Intercept 0,752 <0.0001
Number of memberships to agricultural
organizations
-0,209 0.0005*
Dependency ratio of the household -0,137 0.0012*
Percentage of land with good soil quality -0,069 0.0322*
Percentage of rain-fed land 0,074 0.0379*
Total Number of Animals Owned -0,164 0,1115
Crop diversity at different plots -0,023 0,1293
Agricultural insurance in the last 5 years -0,020 0,1332
Number of facilities available -0,050 0,3621
Number of agricultural equipment -0,050 0,4282
Number of subsidies obtained -0,045 0,4537
Number of obtained agricultural training in past year 0,050 0,6228
Education Level of the HH Head -0,025 0,7161
Existence of forest near by agricultural land -0,004 0,8403
Percentage share of agricultural production in
income
0,004 0,9161
* Significant indicators
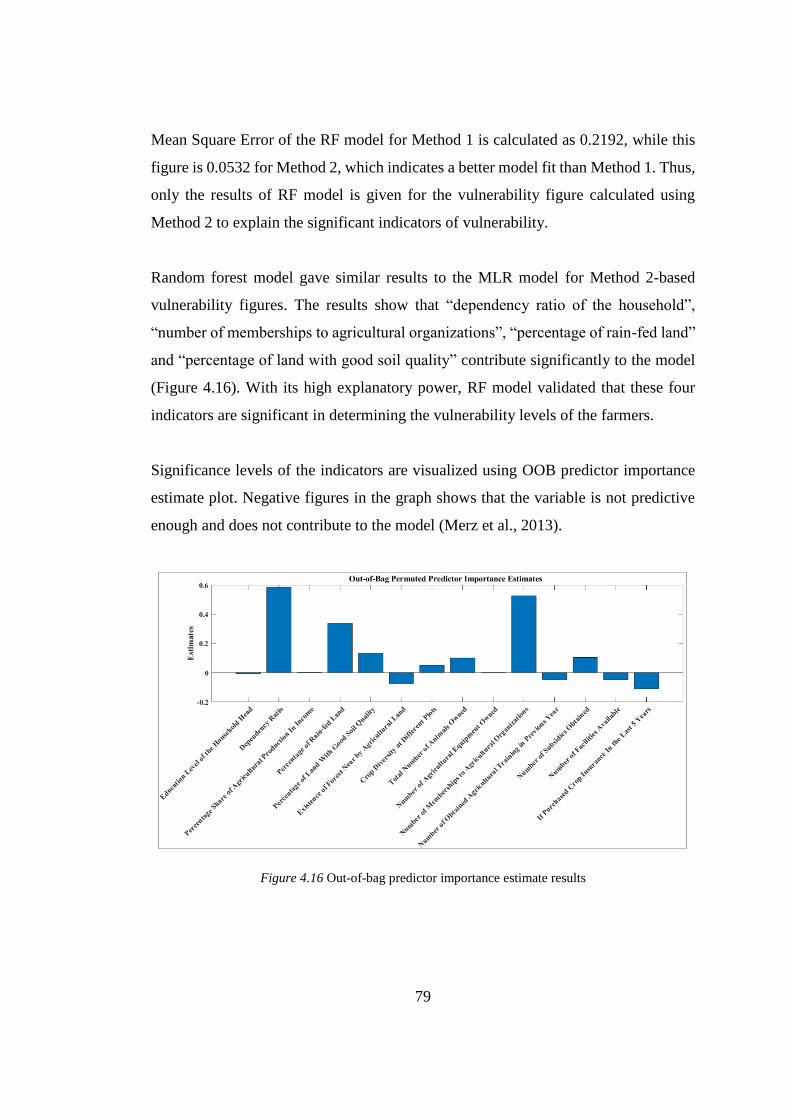
79
Mean Square Error of the RF model for Method 1 is calculated as 0.2192, while this
figure is 0.0532 for Method 2, which indicates a better model fit than Method 1. Thus,
only the results of RF model is given for the vulnerability figure calculated using
Method 2 to explain the significant indicators of vulnerability.
Random forest model gave similar results to the MLR model for Method 2-based
vulnerability figures. The results show that “dependency ratio of the household”,
“number of memberships to agricultural organizations”, “percentage of rain-fed land”
and “percentage of land with good soil quality” contribute significantly to the model
(Figure 4.16). With its high explanatory power, RF model validated that these four
indicators are significant in determining the vulnerability levels of the farmers.
Significance levels of the indicators are visualized using OOB predictor importance
estimate plot. Negative figures in the graph shows that the variable is not predictive
enough and does not contribute to the model (Merz et al., 2013).
Figure 4.16 Out-of-bag predictor importance estimate results

80
In random forest model, the direction of the relationship of household level
vulnerability with the contributing indicators is illustrated using the partial
dependence plot. A positive relation is represented by an ascending line towards right
hand side of the graphic, while a negative relationship is represented by a descending
one towards right hand side.
Figure 4.17 Smoothed partial dependence plot for contributing indicators
The results showed that dependency ratio has a negative impact on vulnerability,
which indicates that increasing number of dependent members in the household
reduces vulnerability level. The results also showed that the number of memberships
to agricultural organizations is the second most significant factor, which reduces
household level vulnerability. Increasing percentage of rain-fed land increases
vulnerability level, while percentage of land with good soil quality has a negative
impact on household level vulnerability.
The number of subsidies has a very limited impact on vulnerability level and it slightly
reduces it. Another factor which has a very limited impact on the farmer vulnerability
is the total number of livestock owned. In the current research, 75% of the farmers

81
who raise livestock stated that the pasture land they use is medium or low quality.
Crop diversity at different plots have the least impact on the farmer vulnerability with
no tendency towards reducing or increasing it.
Education level of the household head, percentage share of agricultural income,
existence of a forest in agricultural production area, the number of agricultural
equipment owned, the agricultural trainings obtained, the facilities available and crop
diversity at different plots have no significant impact on farmer vulnerability at
household level.
4.3.4. Household Level Indicators Correlated with the Adaptive Strategy and
Precautionary Behavior
4.3.4.1. Indicators correlated with adaptive strategy
The adaptive strategies implemented by the farmers against climatic changes and
extremes are summarized in Table 4-13. In order to determine the correlations between
household level indicators and the number of adaptive strategies implemented by the
farmer, correlation analysis is conducted. Results of the analysis show that age of the
farmer has a negative correlation at the 0.05 level with the number of adaptive
strategies implemented (Table 4-22). This indicated that as the age of the farmer
increases, the farmer tends to implement less number of adaptive strategies. Indicators
related to land and land management such as the total amount of land, percentage of
irrigated land, number of agricultural equipment used, the number of water sources
used and sufficiency of irrigation water have significant positive correlation at the 0.01
level with the number of adaptive strategies implemented. Furthermore, the number
of parcels managed by the farmer have a positive correlation at the 0.05 level.

82
Table 4-22 Indicators correlated with adaptive strategy
Parametric Indicators Pearson
Correlation
Coefficient
Sig. (2-
tailed)
Age of farmer - 0.114* 0.032
Total amount of land managed by the farmer 0.168** 0.002
Percentage of irrigated land 0.204** 0.000
Number of parcels managed by the farmer 0.114* 0.033
Number of agricultural equipment 0.210** 0.000
Number of water resources used 0.226** 0.000
Total number of livestock raised 0.142** 0.008
Number of memberships to agricultural
organizations
0.105* 0.049
Number of agricultural training obtained in
the previous year
0.200** 0.000
Non-parametric Indicators Spearman’s Rank
Correlation
Coefficient
Sig. (2-
tailed)
Water sufficiency 0.199** 0.000
Participation to activities of agricultural
organization
0.196** 0.000
Obtained agricultural trainings - 0.273** 0.000
Following agricultural programmes/
publishing
- 0.155** 0.004
* Correlation is significant at the 0.05 level (2-tailed).
** Correlation is significant at the 0.01 level (2-tailed).
Animal husbandry has a positive correlation at 0.01 level, as the number of animals
raised increases, the number of adaptive strategies implemented increases. The
number of memberships to agricultural organizations have a positive correlation
significant at 0.05 level with the number of strategies implemented. The results how
that obtaining agricultural training, the number of trainings obtained in the previous
year and following up agricultural broadcast and publishing increases the number of
adaptive strategies implemented.

83
4.3.4.2. Indicators correlated with the number of precautions taken
The number of precautions taken by the farmer against climatic changes and extremes
is affected from various physical and socio-economic indicators. Results of the
analysis show that percentage share of agricultural income has the highest correlation
figure among all the indicators with 0.221 at 0.01 level, followed by the indicators
related to land and land management such as the total amount of land managed and
the percentage of irrigated land. Age of the farmer (0.01 level), percentage of
household members working in agriculture (0.05) and share of non-agricultural
income sources (0.05 level) have negative correlations with the number of precautions
taken. Household size, education and income level of the farmer have positive
correlation with the precautionary behavior at 0.05 level (Table 4-23).
Water sufficiency, the number of agricultural trainings obtained in the previous year,
the number of subsidies obtained from the Ministry and average size of the parcels
have significant positive correlation at 0.01 level with the number of adaptive
strategies implemented. The number of irrigation water sources used by the farmer
have a positive correlation at the 0.05 level.
Table 4-23 Indicators correlated with the number of precautions taken
Parametric Indicators Pearson
Correlation
Coefficient
Sig. (2-
tailed)
Age of the farmer - 0.171** 0.001
Household size 0.131* 0.014
Percentage of household members working
in agriculture
- 0.111* 0.037
Percentage share of agricultural production
in income
0.221** 0.000
Total amount of land managed by the farmer 0.219** 0.000
Percentage of irrigated land 0.212** 0.000
Average size of parcels managed by the
farmer
0.143** 0.007
Number of water resources used 0.142* 0.008

84
Parametric Indicators Pearson
Correlation
Coefficient
Sig. (2-
tailed)
Total number of livestock raised 0.135* 0.011
Number of memberships to agricultural
organizations
0.139** 0.009
Number of agricultural training obtained in
the previous year
0.160** 0.003
Number of subsidies obtained from the
Ministry
0.152** 0.004
Share of non-agricultural income sources - 0.113* 0.033
Non-parametric Indicators Spearman’s Rank
Correlation
Coefficient
Sig. (2-
tailed)
Education level of farmer 0.106* 0.047
Income group 0.135* 0.011
Water sufficiency 0.188** 0.000
Participation to activities of agricultural
organization
0.150** 0.005
Farmer Registration System Membership - 0.111* 0.038
Contract-based agricultural production - 0.208** 0.000
Existence of non-agricultural income
sources
0.136* 0.011
* Correlation is significant at the 0.05 level (2-tailed).
** Correlation is significant at the 0.01 level (2-tailed).
Number of memberships to agricultural organizations has a positive correlation at 0.05
level, however, participation to activities of agricultural organization significantly
reduces the number of precautions taken. Registering to the Farmer Registration
System and contract-based production has a positive impact on the number of
precautions taken, while an increasing number of livestock raised and existence of
non-agricultural income sources reduces the number of precautions taken.
4.3.5. The Drivers of Adaptation
The factors affecting the number of adaptation methods used are modelled using linear
and non-linear regression. The results of the F-statistics of multiple linear regression
model show that the model has significant explanatory power (p < 0.001) (Table 4-24)
and the indicators explain approximately 15% in household level vulnerability (Table

85
4-25). The amount of the variation explained by this model (based on the R2) is quite
low (14%) despite the significance of the model.
Table 4-24 Significance of regression model for household level vulnerability
Component Sum of
Squares
Mean
Square
F Sig.
Regression model (overall
vulnerability) 2.18 0.145 3.839 <0.0001
Table 4-25 Regression model summary for household level vulnerability
R2 Adjusted
R2
Std. Error of
the Estimate
Regression model (overall vulnerability) 0.138 0.10 0.194
The results also show that “percentage of rain-fed land”, “age of household head” and
“number of obtained agricultural trainings in previous year” contribute significantly
to MLR model on the number of adaptive measures (Table 4-26).
Table 4-26 Significant indicators of household level vulnerability determined by multiple linear
regression
Indicator Estimate Sig.
Intercept 0.458 <0.0001
Percentage of rain-fed land -0.107 0.0003
Age of household head -0.147 0.0149
Number of obtained agricultural trainings in
previous year
0.314 0.0372
The results of the random forest model for the same data set showed that “percentage
of rain-fed land”, “number of subsidies obtained”, “number of memberships to
agricultural organizations”, “the total number of livestock owned”, “number of
agricultural equipment owned”, “age of household head” and “annual income”
contribute significantly to the model (Figure 4.18). Mean Square Error of the RF
model is calculated as 0.0374, which indicates a good model fit. With its high

86
explanatory power, RF model validated that these four indicators are significant in
determining the vulnerability levels of the farmers. Significance levels of the
indicators are visualized using OOB predictor importance estimate plot.
Figure 4.18 Out-of-Bag Predictor Importance Estimate Results
The direction of the relationship of the number of adaptive strategies applied with the
contributing indicators is illustrated using the partial dependence plot (Figure 4.19).
A positive relation is represented by an ascending line towards right hand side of the
graphic, while a negative relationship is represented by a descending one towards right
hand side.

87
Figure 4.19 Smoothed Partial Dependence Plot for Contributing Indicators
The results indicate that “percentage of rain-fed land”, “age of household head”,
“number of memberships to agricultural organizations” and “annual income” have a
negative impact on the number of adaptation methods applied, indicating that increase
in these indicators reduces the number of adaptive strategies applied. The indicators
which increase the number of adaptive strategies applied are “total number of
livestock owned” and “number of agricultural equipment owned”. Despite its
significance, the relationship of “number of subsidies obtained” and the number of
adaptive strategies applied does not have a positive or negative trend.

89
CHAPTER 5
5. DISCUSSION AND RECOMMENDATIONS
In the current study, it is aimed at developing a multi scale (district and household)
methodology to evaluate vulnerability to climate change in agricultural sector. There
are various studies measuring vulnerability at macro scales; however, the findings are
not validated using a higher-resolution data. For example, regional scale vulnerability
analyses are done using aggregated data based on assumptions on vulnerability
indicators; however, the results are not further examined using local data to clarify if
the assumptions were correct. Furthermore, household level vulnerability assessments
do not further discuss if the findings at this scale can be aggregated to estimate upper
scale vulnerability and develop macro scale policies. The current study develops a
methodology using comparable indicators generally used in the studies with bottom-
up and top-down approaches in order to examine scalability of the results.
In the first part of the dissertation, an agricultural vulnerability index is developed for
10 districts of Konya using 18 indicators. The results of the district level vulnerability
analysis showed that there is a geographical division of vulnerability in Konya, the
northern part being the most vulnerable while the southern part being the least
vulnerable. Common features of the highly vulnerable districts are their high exposure
and sensitivity figures and low adaptive capacities. Main cause of high sensitivity is
low precipitation and limited water resources, which increases the percentage of rain-
fed agriculture land and reduces crop diversity. Low adaptive capacity is mainly a
result of low insurance rate and partly due to lack of road infrastructure.
In the second part of the dissertation, a socio-economic research is carried out at
household level in 3 of the districts representing high, moderate and low vulnerability
classes. The vulnerability analysis at district level and household level gave similar

90
results in terms of vulnerability ranking of the districts. Cihanbeyli has the highest
vulnerability level among the tree districts, followed by Karapınar and Seydişehir. The
results of the survey also showed that the factors significantly affecting the household
level farmer vulnerability are “dependency ratio of the household”, “number of
memberships to agricultural organizations”, “percentage of land with good soil
quality” and “percentage of rain-fed land”.
(Ahsan and Warner, 2014) found in their study that dependency ratio significantly
contributes to vulnerability. In the current study, the results showed that dependency
ratio has a negative impact on vulnerability, which indicates that increasing number
of dependent members in the household reduces vulnerability level. This can be
explained by unregistered participation of children and elderly in agricultural labour.
(Gumus and Wingenbach, 2015) states that 44.7% of total employed children work in
agricultural sector. The workforce contribution of the elderly in the household does
not cover only the agricultural production but also the house works such as taking care
of children, cooking etc.
Farming organizations, when have enough capacities to give agricultural extension
services, increase the capacity of the farmers in terms of knowledge on new
technologies and farming techniques and even how to tackle with climatic changes.
Thus, number of memberships to the farming organizations reduces vulnerability of
the farmers (Piya et al., 2012; Tesso et al., 2012). The results of the current study
showed that the number of memberships to agricultural organizations is a significant
factor, which reduces household level vulnerability. In order to improve resilience of
the farmers against climatic changes and extremes, membership and active
participation to the activities of agricultural institutions should be promoted. In
addition to this, capacities of the agricultural organizations should be increased on the
impacts of climate change on agriculture. The farmers can then make an informed
decision on adaptation choices.

91
Rainfall is a significant limiting factor in rain-fed agriculture and climate change
increases the frequency of drought events (Ghimire et al., 2010; Wani et al., 2009;
Zarafshani et al., 2012). The current study showed a positive relationship, meaning
that increasing percentage of rain-fed land increases vulnerability level. Rain-fed
farming is not only a high-risk production method in terms of climate variability, but
also limits crop diversity and the number of adaptive strategies applied. Both at district
and household levels, rain-fed production increases vulnerability, thus existing water
resources should be made available for agricultural irrigation with efficient irrigation
techniques. In case of lacking water resources, conserving soil moisture becomes
critical during drought events. Soil moisture can be conserved by increasing soil
organic matter through conservation agriculture techniques (Li et al., 2011).
Soil fertility is found to be an indicator reducing climate change vulnerability, while
soil degradation increases the vulnerability level (Gbetibouo and Ringler, 2009;
Murthy et al., 2015). In the current study, percentage of land with good soil quality
has a negative impact on household level vulnerability. Konya Province is highly
vulnerable to desertification due to heavy wind erosion and intensive agriculture.
Thus, soil conservation and improvement approaches such as conservation agriculture
should be promoted, especially on rain-fed lands.
The number of subsidies has a very limited impact on vulnerability level and it slightly
reduces it. This is basically due to the fact that farmers can only get the subsidy based
on their production and lose their eligibility for the subsidy in case of a complete crop
loss due to a climatic change or extreme. Another factor which has a very limited
impact on the farmer vulnerability is the total number of livestock owned. Its impact
on vulnerability is negative up to a certain threshold and positive afterwards. In the
current research, 75% of the farmers who raise livestock stated that the pasture land
they use is medium or low quality. Reduction in pasture quality increases the need for
livestock feed purchase, which might be a significant financial burden for a farm with
high numbers of livestock.

92
Crop diversity at different plots have the least impact on the farmer vulnerability with
no tendency towards reducing or increasing it. Education level of the household head,
percentage share of agricultural income, existence of a forest in agricultural
production area, the number of agricultural equipment owned, the agricultural
trainings obtained, the facilities available and crop diversity at different plots have no
impact on farmer vulnerability at household level. Despite its insignificant impact on
farmer vulnerability, equipment ownership has a positive impact on the number of
adaptive strategies implemented by the farmers.
Despite the significance of the Multi Linear Regression models for vulnerability level
of the farmers and the number of adaptive strategies implemented by them, the
explanatory power of the models were low. Thus, a non-linear technique (Random
Forest) was also applied to the data. The explanatory power of the Random Forest
models for vulnerability level of the farmers and the number of adaptive strategies
implemented were quite high. Both MLR and RF analysis indicated the same
indicators as the drivers of vulnerability, which showed that the structure of the data
is linear and also validated the significance of the indicators. On the other hand, the
results of these two techniques for modelling the number of adaptive strategies
implemented by the farmer pointed out different indicators. In this case, the indicators
given by RF model was considered as the significant ones, due to the high explanatory
power of the model. Using two different techniques gave us the opportunity to
understand the structure of the data better and find out the significant indicators with
a model with higher explanatory power. Existing literature has limited number of
models explaining the vulnerability components and adaptation strategies for
households. This study has gone some way towards enhancing our understanding of
climate change vulnerability in agriculture sector.
The current research showed that the indicator approach can be used as a guidance to
comparatively determine the highly vulnerable areas. However, household level

93
analysis also showed that many of the commonly used macro scale indicators explain
a very limited percentage of variation in vulnerability of the farmers. The results given
by two different regression models revealed that there are four indicators significantly
affecting the vulnerability level of farmers. However, these factors explain a very
limited percentage of farmer vulnerability. Other factors controlling household level
vulnerability which have not taken into account in the existing literature should be
studied via further research, including deep interviews and long term observations, at
the household level and models should be developed to upscale the results.
94
CHAPTER 6
6. CONCLUSIONS
Changes in climatic conditions and extremes due to climate change will have negative
impacts on agricultural production and livelihoods of the farmers. This will have
implications on the society in terms of food security, economy, social structure and
welfare. In order to reduce the negative impacts, planned adaptation strategies should
be implemented by the producers and this should be guided and supported by the
country policies. As stated in the Turkey’s National Climate Change Adaptation
Strategy and Action Plan, climate change adaptation in agriculture sector requires a
comprehensive approach considering production, consumption, insurance systems,
subsidy and market policies, productivity and competition, drought and
desertification, conservation of biodiversity, crop and animal health and production,
research and development (Ministry of Environment and Urbanization, 2011). This is
a complex and difficult task which requires significant amount of effort, accurate data
and financial resources. Thus, priority areas should be determined via more research
on vulnerability at both farmer level and administrative levels.
This research presents an index-based vulnerability calculation methodology that can
be used to determine the highly vulnerable areas at district level. The results of the
vulnerability index analysis showed that the northern part of Konya is highly
vulnerable to climate change. The results also showed that there are a number of policy
options to support climate change adaptation in Konya. First of all, rain-fed farming
practices, which cover 67% of the agricultural land of the province, are highly
vulnerable to climate change. Currently, there is no climate-resilience targeted subsidy
system for rain-fed farming, which might lead to reduction or cessation of agricultural
production on these lands due to increasing drought events in the future. Subsidy

95
policies should be reformulated to support rain-fed production, especially in the highly
vulnerable areas.
Increasing the irrigation infrastructure at water-abundant locations can also be a policy
option to increase drought resilience in these areas. However, irrigation projects
should be complemented with trainings on efficient training techniques and climate
change adaptation. Lack of knowledge on these issues might lead to excessive use of
water resources, which could result in soil erosion, salinization, fungal diseases etc. in
return. Furthermore, reducing water losses in agriculture is an important strategy and
requires more implementations at farming conditions. There are available subsidies
aimed at reducing the initial investment cost of modern pressurized irrigation systems
such as drip and sprinkler irrigation in the region (Albayrak et al., 2010). Availability
of these subsidies should be increased, especially for the highly vulnerable farmers.
Drought resistance can also be increased by improving the soil carbon via some
conservation agriculture techniques. In Konya, good soil quality has a negative impact
on household level vulnerability. Due to its vulnerable condition in terms of erosion
and desertification, there are various projects carried out in Konya on sustainable
landuse management and climate change adaptation. Despite the positive impacts of
these attempts, there is room for improvement in research and development in
conservation agriculture. First of all, there is no one-size-fits-all implementation in
agriculture that can solve a specific problem in all the regions in the same way. There
are various socioeconomic, cultural, geographic and climatic factors affecting the
success of an agricultural implementation and these factors vary at different locations.
Thus, success of each conservation practice (e.g. direct seeding, wind breakers,
mulching etc.) should be monitored and practical solutions should be found for the
problems faced during implementation of these practices. Secondly, success of the
implementations require a governance structure with well-defined responsibilities of
the institutions. Training of the farmers, provision of subsidies and grants for
conservation practices, monitoring and reporting of the activities, technology research

96
and development and coordination of all these activities should be shared
responsibilities of different institutions including government authorities, farmer
organizations, NGOs, research centers, academia and the private sector. In this
structure, farmer organizations such as cooperatives, unions and chambers of
agriculture have significant roles. They are more in communication with farmers than
other institutions. This research revealed that memberships to farmer organizations
reduce the vulnerability of the farmers. Thus, in addition to formulating policies to
increase the number of memberships to these organizations, improving their
knowledge on climate change adaptation and their financial and human resources
capacities to transfer this knowledge to the farmers will have significant impacts on
reducing vulnerability of farmers.
Due to the increasing frequency and severity of climatic extremes and gradual changes
in climatic conditions, adaptation activities are highly needed in agricultural practices.
Despite increasing awareness regarding the impacts of climate change on production,
most of the current adaptation practices done by farmers are autonomous emerging as
a response to changes. There are certain precautions that can be taken by the farmers
to reduce climate related losses. Some the precautions require only changes in
implementation of the practices, while some others require investment and long-term
efforts. Thus, farmers should be guided by informative trainings and supported by
financial incentives. Due to the limited resources, successful adaptation can only be
achieved by effective planning and efficient use of scarce resources. The results of
this study can help policy makers to prioritize the policy subjects and implementation
areas, which will result in more influential results.

97
REFERENCES
Abid, M., Schilling, J., Scheffran, J., & Zulfiqar, F. (2016). Climate change
vulnerability, adaptation and risk perceptions at farm level in Punjab, Pakistan.
Science of the Total Environment(547), 447-460.
doi:10.1016/j.scitotenv.2015.11.125
Abson, D. J., Dougill, A. J., & Stringer, L. C. (2012). Using Principal Component
Analysis for information-rich socio-ecological vulnerability mapping in
Southern Africa. Applied Geography(35), 515-524.
Acharya, S. P., Basavaraja, H., Kunnal, L., Mahajanashetti, S., & Bhat, A. (2011).
Crop diversification in Karnataka: An economic analysis. Agricultural
Economics Research Review, 24(2), 351-357.
Ahsan, M. N., & Warner, J. (2014). The Socioeconomic Vulnerability Index: A
Pragmatic Approach for Assesing Climate Change Led Risks- A Case Study
in the South-western coastal Bangladesh. International Journal Of Disaster
Risk Reduction(8), 32-49. doi:10.1016/j.ijdrr.2013.12.009
Ahumada-Cervantes, R., Velázquez-Angulo, G., Rodríguez-Gallegos, H. B., Flores-
Tavizón, E., Félix-Gastélum, R., Romero-González, J., & Granados-Olivas, A.
(2017). An indicator tool for assessing local vulnerability to climate change in
the Mexican agricultural sector. Mitigation and Adaptation Strategies for
Global Change(22), 137- 152. doi:10.1007/s11027-015-9670-z
Alauddin, M., & Sarker, M. A. (2014). Climate change and farm-level adaptation
decisions and strategies in drought-prone and groundwater-depleted areas of
Bangladesh: an empirical investigation. Ecological Economics (106), 204-
213. doi:10.1016/j.ecolecon.2014.07.025
Albayrak, M., Gunes, E., Gulcubuk, B. (2010). The effects of irrigation methods on
input use and productivities of sugarbeet in Central Anatolia, Turkey. African
Journal of Agricultural Research (5), 188-195 doi:
https://doi.org/10.5897/AJAR09.536

98
Al-Wakeel, A., & Wua, J. (2016). K-means based cluster analysis of residential smart
meter measurements. Energy Procedia(88), 754-760.
doi:10.1016/j.egypro.2016.06.066
Antwi-Agyei, P., Fraser, E. D., Doughill, A. J., Stringer, L. C., & Simelton, E. (2012).
Mapping the vulnerability of crop production to drought in Ghana using
rainfall, yield and socioeconomic data. Applied Geography(32), 324-334.
Bär, R., Rouholahnejad, E., Rahman, K., Abbaspour, K. C., & Lehmann, A. (2015).
Climate change and agricultural water resources: A vulnerability assessment
of the Black Sea catchment. Environmental Science & Policy(46), 57-69.
Baz, I., Geymen, A., & Er, S. N. (2009). Development and application of GIS-based
analysis/synthesis modeling techniques for urban planning of Istanbul
Metropolitan Area. Advances in Engineering Software, 128-140.
doi:10.1016/j.advengsoft.2008.03.016
Below, T. B., Mutabazi, K. D., Kirschke, D., Franke, C., Sieber, S., Siebert, R., &
Tscherning, K. (2012). Can farmers' adaptation to climate change be explained
by socio-economic household-level variables? Global Environmental
Change(22), 223-235. doi:10.1016/j.gloenvcha.2011.11.012
Berrouet, L. M., Machado, J., & Villegas-Palacio, C. (2018). Vulnerability of socio—
ecological systems: A conceptual Framework. Ecological Indicators, 84, 632–
647. doi:10.1016/j.ecolind.2017.07.051
Berry, P., Rounsevell, M., Harrison, P., & Audsley, E. (2006). Assessing the
vulnerability of agricultural land use and species to climate change and the role
of policy in facilitating adaptation. Environmental Science & Policy(9), 189-
204.
Bhattacharyya, R. (2008). Crop Diversification: A Search for An Alternative Income
of the Farmers in the State of West Bengal in India. International Conference
of Applied Economics, (s. 83-94).

99
Bradshaw, B., Dolan, H., & Smit, B. (2004). Farm-level adaptation to climatic
variability and change: crop diversification in the Canadian prairies. Climatic
Change, 67(1), 119-141.
Chen, J., Yang, S., Li, H., Zhang, B., & Lv, J. (2013). Research on Geographical
Environment Unit Division Based on the Method of Natural Breaks (Jenks).
The International Archives of the Photogrammetry, Remote Sensing and
Spatial Information Sciences, Volume XL-4/W3, 47-50.
doi:10.5194/isprsarchives-XL-4-W3-47-2013
Corobov, R., Sirodoev, I., Koeppel, S., Denisov, N., & Sirodoev, G. (2013).
Assessment of climate change vulnerability at the local level: a case study on
the Dniester River Basin (Moldova). The Scientific World Journal, 2013, 13
pages. doi:10.1155/2013/173794
Crano, W. D., Brewer, M. B., & Lac, A. (2015). Principles and Methods of Social
Research (Third Edition ed.). New York: Routledge.
Çelik, Y., Bayramoğlu, Z., Gündüz, O., & Karakayacı, Z. (2015). Konya İlinde Farklı
İşletme Tipleri ve Agro-Ekolojik Bölgelere Göre Çiftçilerin Sosyal Güvenlik
Durumu. Türk Tarım ve Doğa Bilimleri Dergisi, 2(1), 60-68.
Das, B., & Mili, N. (2013). Pattern of Crop Diversification and Disparities in
Agriculture: A Case Study of Dibrugarh District, Assam (India). Journal Of
Humanities And Social Science, 6(2), 37-40.
De, U. K., & Chattopadhyay, M. (2014). Crop Diversification in Assam and Use of
Modenr Inputs Under Chaning Climatic Conditions. Journal of Climatology
and Water Forecasting, 2(2).
Decocq, G., Andrieu, E., Brunet, J., Chabrerie, O., De Frenne, P., De Smedt, P.,
Deconchat, M., Diekmann, M., Ehrmann, S., Giffard, B., Mifsud, E.G.,
Hansen, K., Hermy, M., Kolb, A., Lenoir, J., Liira, J., Moldan, F., Prokofieva,
I., Rosenqvist, L., Varela, E., Valdés, A., Verheyen, K., Wulf, M., (2016).
Ecosystem Services from Small Forest Patches in Agricultural Landscapes.
Current Forestry Reports, 2(1), 30-44. doi:10.1007/s40725-016-0028-x
100
Dellal, İ., McCarl, B.A. & Butt, T. (2011). Economic Assessment of Climate Change
on Turkish Agriculture. Journal of Environmental Protection and Ecology,
12(1), 376-385.
Deressa, T. T., Hassan, R. M., Ringler, C., Alemu, T., & Yesuf, M. (2009).
Determinants of farmers' choice of adaptation methods to climate change in
the Nile Basin of Ethiopia. Global Environmental Change(19), 248-255.
doi:10.1016/j.gloenvcha.2009.01.002
Dunteman, G. H. (1989). Principal Component Analysis. California: Sage
Publications.
Fekete, A., Damm, M., & Birkmann, J. (2010). Scales as a challenge for vulnerability
assessment. Natural Hazards, 55(3), 729-747. doi:DOI 10.1007/s11069-009-
9445-5
Field, A. (2009). Discovering Statistics Using SPSS (3 b.). London: Sage Publications
Ltd. doi:978-1-84787-906-6 978-1-84787-907-3
Gbetiouo, G. A., & Ringler, C. (2009). Mapping South African Farming Sector
Vulnerability to Climate Change and Variability: A Subnational Assessment.
International Food Policy Research Institute.
Gerlitz, J.-Y., Macchi, M., Brooks, N., Pandey, R., Banerjee, S., & Jha, S. K. (2017).
The Multidimensional Livelihood Vulnerability Index – an instrument to
measure livelihood vulnerability to change in the Hindu Kush Himalayas.
Climate and Development, 9(2), 124-140.
doi:10.1080/17565529.2016.1145099
Ghimire, Y. N., Shivakoti, G. P., & Perret, S. R. (2010). Household-level vulnerability
to drought in hill agriculture of Nepal: implications for adaptation planning.
The International Journal of Sustainable Development and World Ecology,
17(3), 225-230. doi:10.1080/13504501003737500

101
Gumus, S., & Wingenbach, G. (2015). The Child Labor Problem in Turkish
Agriculture: What Can We Do? Social Indicators Research, 127(3), 1193–
1215. doi:10.1007/s11205-015-0999-1
Hahn, M. B., Riederer, A. M., & Foster, S. O. (2009). The Livelihood Vulnerability
Index: A pragmatic approach to assessing risks from climate variability and
change- A case study in Mozambique. Global Environmental Change(19), 74-
88. doi:10.1016/j.gloenvcha.2008.11.002
Hair, J. F., Black, W. C., Babin, B. J., & Anderson, R. E. (2010). Multivariate Data
Analysis (7th Edition b.). Essex: Pearson Education Limited. doi:978-1-292-
02190-4
Heltberg, R., & Bonch-Osmolovskiy, M. (2011). Mapping Vulnerability to Climate
Change. Sustainable Development Network, Social Development Unit.
Washington DC, USA: The World Bank .
Heltberg, R., Siegel, P. B., & Jorgensen, S. L. (2009). Addressing human vulnerability
to climate change: Toward a 'no-regrets' approach. Global Environmental
Change(19), 89-99. doi:10.1016/j.gloenvcha.2008.11.003
Hinkel, J. (2011). Indicators of vulnerability and adaptive capacity: Towards a
clarification of the science-policy interface. Global Environmental
Change(21), 198-208. doi:10.1016/j.gloenvcha.2010.08.002
Hisali, E., Birungi, P., & Buyinza, F. (2011). Adaptation to Climate Change in
Uganda: Evidence from Micro Level Data. Global Environmental
Change(21), 1245-1261. doi:10.1016/j.gloenvcha.2011.07.005
Hofman, M. E., Hinkel, J., & Wrobel, M. (2011). Classifying knowledge on climate
change impacts, adaptation, and vulnerability in Europe for informing
adaptation research and decision making: A conceptual meta-analysis. Global
Environmental Change(21), 1106-1116. doi:10.1016/j.gloenvcha.2011.03.011

102
Huynh, L. T., & Stringer, L. C. (2018). Multi-scale assessment of social vulnerability
to climate change: An empirical study in coastal Vietnam. Climate Risk
Management, 20, 165-180. doi:10.1016/j.crm.2018.02.003
Idowu, A. O., Ambali, O. I., & Onasanya, A. S. (2014). Living Condition, Livelihood
and Crop Diversification Among Rural Farm Households in Remo Division of
Ogun tate, Nigeria. Asian Journal of Agricultural Extension, 3(6), 619-629.
IPCC (2014a). Climate Change 2014: Impacts, Adaptation and Vulnerability.
Contribution of Working Group II to the Fifth Assessment Report of the
Intergovernmental Panel on Climate Change. (C. Field, V. Barros, D. Dokken,
K. Mach, M. Mastrandrea, T. Bilir, . . . L. White, Dü) Cambridge, United
Kingdom and New York, NY, USA: Cambridge University Press.
IPCC (2014b). Climate Change 2014: Synthesis Report Contribution of Working
Group I, II and III to the Fifth Assessment Report of the Intergovernmental
Panel on Climate Change. Geneva, Switzerland: Core Writing Team, R.K.
Pachauri and L.A.: Meyer (eds).
Johnson, F. A., & Hutton, C. W. (2014). Dependence on agriculture and ecosystem
services for livelihood in Northeast India and Bhutan: vulnerability to climate
change in the Tropical River Basins of the Upper Brahmaputra. Climatic
Change. doi:DOI 10.1007/s10584-012-0573-7
Kalaycıoğlu, S., Çelik, K., & Beşpınar, F. U. (2010). Gitmek mi Zor Kalmak mı?:
Avrupa'ya Erkek Göçü ve Geride Kalan Kadının Gözünden Göç Deneyimi.
Journal of Faculty of Letters, 27(1), 123-146.
Kalkınma Bakanlığı (2014). Tarım Arazilerinin Sürdürülebilir Kullanımı Çalışma
Grubu Raporu. Ankara.
Kamińska, J. A. (2018). The use of random forests in modelling short-term air
pollution effects based on traffic and meteorological conditions: A case study
in Wroclaw. Journal of Environmental Management(217), 164-174.
doi:10.1016/j.jenvman.2018.03.094

103
Kelly, P. M., & Adger, W. N. (2000). Theory and practice in assessing vulnerability
to climate change and facilitating adaptation. Climatic Change, 4(47), 325-
352.
Kijewska, A., & Bluszcz, A. (2016). Research of varying levels of greenhouse gas
emissions in European countries using the k-means method. Atmospheric
Pollution Research(7), 935-944. doi:10.1016/j.apr.2016.05.010
Klingebiel, A. A., & Montgomery, P. H. (1961). Land Capability Classification. Soil
Conservation Service, Agriculture Handbook No 210. Washington D. C.: US
Department of Agriculture (USDA).
Krejcie, R. V., & Morgan, D. W. (1970). Determining Sample Size for Research
Activities. Educational and Psychological Measurement(30), pp. 607-610.
doi:10.1177/001316447003000308
Krishnamurthy, P., Lewis, K., & Choularton, R. (2014). A methodological framework
for rapidly assessing the impacts of climate risk on national-level food security
through a vulnerability index. Global Environmental Change(25), 121-132.
doi:10.1016/j.gloenvcha.2013.11.004
Lee, Y.J. (2014). Social vulnerability indicators as a sustainable planning tool.
Environmental Impact Assessment Review(44), 31-42.
doi:10.1016/j.eiar.2013.08.002
Lelandais, G. E. (2016). Drought, Social Inequalities, Adaptation, and Farmers’
Mobility in the Konya Plain of Turkey. R. McLeman, J. Schade, & T. Faist
(Dü) içinde, Environmental Migration and Social Inequality (s. 91-102).
Switzerland: Springer International Publishing. doi:10.1007/978-3-319-
25796-9_6
Li, B., Yang, G., Wan, R., Hörmann, G., Huang, J., Fohrer, N., & Zhang, L. (2017).
Combining multivariate statistical techniques and random forests model to
assess and diagnose the trophic status of Poyang Lake in China. Ecological
Indicators(83), 74-83.

104
Li, L. Ling, Huang, G. Bao., Zhang, R. Zhi., Bill, B., Guangdi, L., & Chan Kwong, Y.
(2011). Benefits of Conservation Agriculture on Soil and Water Conservation
and Its Progress in China. Agricultural Sciences in China, 10(6), 850-859.
doi:10.1016/S1671-2927(11)60071-0
Luers, A. L., Lobell, D. B., Sklar, L. S., Addams, C. L., & Matson, P. A. (2003). A
Method for Quantifying Vulnerability, Applied to the Agricultural System of
the Yaqui Valley, Mexico. Global Environmental Change(13), 255-267.
doi:10.1016/S0959-3780(03)00054-2
Mallari, A. E. (2016). Climate Change Vulnerability Assessment in the Agriculture
Sector: Typhoon Santi Experience. Procedia - Social and Behavioral Sciences
216(216), 440 – 451.
Melkonyan, A. (2014). Environmental and socio-economic vulnerability of
agricultural sector in Armenia. Science of the Total Environment(488-489),
333-342. doi:10.1016/j.scitotenv.2014.03.126
Mendoza, M. E., The, B. D., Naret, H., Vicente G. Ballaran, J., & Arias, J. K. (2014).
Assessing Vulnerability to Climate Change Impacts in Cambodia, the
Philippines and Vietnam: An Analysis at the Commune and Household Level.
Journal of Environmental Science and Management, 17(2), 78-91.
Mertz, O., Mbow, C., Nielsen, J. Ø., Maiga, A., Diallo, D., Reenberg, A., Diouf, A.,
Barbier, B., Moussa, I.B., Zorom, M., Ouattara, I. and Dabi, Daniel (2010).
Climate factors play a limited role for past adaptation strategies in West Africa.
Ecology and Society, 15(4), 25. doi:10.5751/ES-03774-150425
Merz, B., Kreibich, H., & Lall, U. (2013). Multi-variate flood damage assessment: A
tree-based data-mining approach. Natural Hazards and Earth System
Sciences(13), 53-64. doi:10.5194/nhess-13-53-2013
Mesfin, W., Fufa, B., & Haji, J. (2011). Pattern, Trend and Determinants of Crop
Diversification: Empirical Evidence from Smallholders in Eastern Ethiopia.
Journal of Economics and Sustainable Development, 2(8), 78-89.

105
Ministry of Environment and Urbanization (2011). Turkey’s National Climate Change
Adaptation Strategy and Action Plan, pp: 123.
Mohmmed, A., Li, J., Elarua, J., Elbashier, M. M., Keesstra, S., Artemi, C., Martin,
K., Reuben, M., Teffera, Z. (2018). Assessing drought vulnerability and
adaptation among farmers in Gadaref region, Eastern Sudan. Land Use
Policy(70), 402-413. doi:10.1016/j.landusepol.2017.11.027
Monterroso, A., Conde, C., Gay, C., Gomez, D., & Lopez, J. (2014). Two methods to
assess vulnerability to climate change in the Mexican agricultural sector.
Mitigation and Adaptation Strategies for Global Change(19), 445-461.
doi:10.1007/s11027-012-9442-y
Morzaria-Luna, H. N., Turk-Boyer, P., & Moreno-Baez, M. (2014). Social indicators
of vulnerability for fishing communities in the Northern Gulf of California,
Mexico: Implications for climate change. Marine Policy(45), 182-193.
doi:10.1016/j.marpol.2013.10.013
Mukherjee, S. (2010). Crop Diversification and Risk: An Empirical Analysis of Indian
States. Munich Personal RePEc Archive: https://mpra.ub.uni-muenchen.de/
Murthy, C. S., Laxman, B., & Sai, M. V. (2015). Geospatial analysis of agricultural
drought vulnerability using a composite index based on exposure, sensitivity
and adaptive capacity. International Journal of Disaster Risk Reduction(12),
163-171. doi:10.1016/j.ijdrr.2015.01.004
Mulinde, C., Majaliwa, J.G.M., Twinomuhangi, R., Mfitumukiza, D., Komutunga, E.,
Ampaire, E., Asiimwe, J., Van Asten, P., Jassogne, L. (2019). Perceived
climate risks and adaptation drivers in diverse coffee landscapes of Uganda.
NJAS - Wageningen J. Life Sci. 88, 31–44.
https://doi.org/10.1016/j.njas.2018.12.002

106
Nardo, M., Saisana, M., Saltelli, A., & Tarantola, S. (2005). Tools for Composite
Indicaors Building. Ispra: European Commission Directorate General Koint
Research Centre.
http://publications.jrc.ec.europa.eu/repository/bitstream/JRC31473/EUR%20
21682%20EN.pdf
Nkondze, M. S., Masuku, M. B., & Manyatsi, A. (2013). Factors Affecting
Households Vulnerability to Climate Change in Swaziland: A Case of
Mpolonjeni Area Development Programme (ADP). Journal of Agricultural
Science, 5(10), 108-122. doi:10.5539/jas.v5n10p108
Notenbaert, A., Karanja, S. N., Herrero, M., Felisberto, M., & Moyo, S. (2013).
Derivation of a household-level vulnerability index for empirically testing
measures of adaptive capacity and vulnerability. Regional Environmental
Change, 13(2), 459-470. doi:10.1007/s10113-012-0368-4
OECD. (2008). Handbook on Constructing Composite Indicators: Methodology and
User Guide. Paris: OECD Publications.
Ojo, M. A., Ojo, A. O., Odine, A. I., & Ogaji, A. (2014). Determinants of Crop
Diversification Among Small-Scale Food Crop Farmers in North Central,
Nigeria. Production Agriculture and Technology, 10(2), 1-11.
Pal, S., & Kar, S. (2012). Implications of The Methods Of Agricultural Diversification
In Reference With Malda District: Drawback And Rationale. International
Journal of Food, Agriculture and Veterinary Sciences, 2(2), 97-105.
Patel, N., & Rawat, A. (2015). Comparative Assessment Between Area Based and
Patch Based Gibbs-Martin Diversification Index for Lad Use Pattern Analysis.
Theoretical and Empirical Researches in Urban Management, 10(4), 66-76.
Piya, L., Maharjan, K. L., & Joshi, N. P. (2012). Vulnerability of rural households to
climate change and extremes: Analysis of Chepang households in the Mid-
Hills of Nepal. International Association of Agricultural Economists (IAAE)
Triennial Conference. Foz do Iguaçu, Brazil.

107
Polsky, C., Neff, R., & Yarnal, B. (2007). Building comparable global change
vulnerability assessments: The vulnerability scoping diagram. Global
Environmental Change(17), 472-485. doi:10.1016/j.gloenvcha.2007.01.005
Porter, J. R., & Semenov, M. A. (2005). Crop Responses to Climatic Variation.
Philosophical Transactions of the Royal Society B: Biological Sciences,
360(1463), 2021-2035. doi:10.1098/rstb.2005.1752
Rahman, S. (2009). Whether crop diversification is a desired strategy for agricultural
growth in Bangladesh? Food Policy, 34(4), 340-349.
Robinson, L. W., Ericksen, P. J., Chesterman, S., & Worden, J. S. (2015). Sustainable
intensification in drylands: What resilience and vulnerability can tell us.
Agricultural Systems(135), 133-140. doi:10.1016/j.agsy.2015.01.005
Roy, B. P., & Barman, U. K. (2014). Crop Concentration and Diversification in
Jalpaiguri District of West Bengal: A Case Study. International Journal of
Food, Agriculture and Veterinary Sciences, 4(3), 5-9.
Sajjad, H., & Prasad, S. (2014). Analyzing Spatio-temporal Pattern of Crop
Diversification in Jalandhar District of Punjab, India. Asian Journal of
Agriculture and Rural Development, 4(3), 242-256.
Sanguansat, P. (2012). Principal Component Analysis- Multidisciplinary
Applications. Crotia: Rijeka: InTech.
http://www.intechopen.com/books/principal-component-analysis-
multidisciplinary-applications
Schilling, J., Feier, K. P., Hertig, E., & Scheffran, J. (2012). Climate change,
vulnerability and adaptation in Noth Africa with focus on Morocco.
Agriculture, Ecosystems and Environment(156), 12-26.
doi:10.1016/j.agee.2012.04.021
108
Şen, B., Tavares, J. P., & Bilgin, C. C. (2017). Nest Site Selection Patterns of a Local
Egyptian Vulture Neophron Percnopterus Population in Turkey. Bird
Conservation International(27), 568- 581. doi:10.1017/S0959270916000411
Shah, K. U., Dulal, H. B., Johnson, C., & Baptiste, A. (2013). Understanding
livelihood vulnerability to climate change: Applying the livelihood
vulnerability index in Trinidad and Tobago. Geoforum(47), 125-137.
doi:10.1016/j.geoforum.2013.04.004
Sichoongwe, K., Mapemba, L., Tembo, G., & Ng’ong’ola, D. (2014). The
Determinants and Extent of Crop Diversification Among Smallholder
Farmers: A Case Study of Southern Province Zambia. Journal of Agricultural
Science, 6(11), 150-159.
Singha, K., Choudhary, R., & Vishnu, K. (2014). Growth and Diversification of
Horticulture Crops in Karnataka: An Inter-District Analysis. Sage Open, 1-12.
Tarım Özel İhtisas Komisyonu. (2014). Tarım Arazilerinin Sürdürülebilir Kullanımı
Çalışma Grubu Raporu. Ankara: Kalkınma Bakanlığı.
http://tarim.kalkinma.gov.tr/wp-
content/uploads/2014/12/Tarim_Arazilerinin_Surdurulebilir_Kullanimi_Cali
sma_Grubu_Raporu.pdf
Tessema, Y.A., Joerin, J., Patt, A. (2018). Factors affecting smallholder farmers’
adaptation to climate change through non-technological adjustments.
Environmental Deveveloment (25), 33–42.
https://doi.org/10.1016/j.envdev.2017.11.001
Tesso, G., Emana, B., & Ketema, M. (2012). Analysis of Vulnerability and Resilience
to Climate Change Induced Shocks in North Shewa, Ethiopia. Agricultural
Sciences, 3(6), 871-888. doi:10.4236/as.2012.36106
Thoai, T.Q., Rañola, R.F., Camacho, L.D., Simelton, E. (2018). Determinants of
farmers’ adaptation to climate change in agricultural production in the central
region of Vietnam. Land Use Policy (70), 224–231.
https://doi.org/10.1016/j.landusepol.2017.10.023

109
Trærup, S. L., & Mertz, O. (2011). Rainfall variability and household coping strategies
in northern Tanzania: a motivation for district level strategies. Regional
Environmental Change(11), 471-481. doi:10.1007/s10113-010-0156-y
Trinh, T. Q., Jr, R. F., Camacho, L. D., & Simelton, E. (2018). Determinants of
farmers' adaptation to climate change in agricultural production in the central
region of Vietnam. Land Use Policy(70), 224-231.
doi:10.1016/j.landusepol.2017.10.023
Tubi, A., Fischhendler, I., & Feitelson, E. (2012). The effect of vulnerability on
climate change mitigation policies. Global Environmental Change(22), 472-
482. doi:10.1016/j.gloenvcha.2012.02.004
Turkish Statistical Institute. (2018). Merkezi Dağıtım Sistemi.
https://biruni.tuik.gov.tr/medas/
Turkish Statistical Institute. (2019). Gelir Yöntemi ile GSYH.
tuik.gov.tr/PreIstatistikTablo.do?istab_id=2506
UNDP (2002). Human Development Report 2002: Deepening Democracy in a
Fragmented World. New York: Oxford University Press.
Velavan, C., & Balaji, P. (2012). Crop Diversification in Tamil Nadu- A Temporal
Analysis. Agricultural Situation in India, 655-657.
Wagstaff, K., Cardie, C., Rogers, S., & Schroedl, S. (2001). Constrained K-means
Clustering with Background Knowledge. Proceedings of the Eighteenth
International Conference on Machine Learning, (pp. 577-584).
Waha, K., Müller, C., Bondeau, A., Dietrich, J., Kurukulasuriya, P., Heinke, & Lotze-
Campen, H. (2013). Adaptation to climate change through the choice of
cropping system and sowing date in sub-Saharan Africa. Global
Environmental Change(23), 130-143. doi:10.1016/j.gloenvcha.2012.11.001

110
Wani, S. P., & Oweis, T. (2009). Rainfed Agriculture: Unlocking the Potential. (S. P.
Wani, J. Rockström, & T. Oweis, Dü) Wallingford, UK; Cambridge, MA:
CABI.
Wilhelmi, O. V., & Wilhite, D. A. (2002). Asessing vulnerability to agricultural
drought: A Nebraska case study. Natural Hazards(25), 37-58.
Wiréhn, L., Danielsson, Å. & Neset, T.-S. S. (2015). Assessment of composite index
methods for agricultural vulnerability to climate change. Journal of
Environmental Management(156), 70-80. doi:10.1016/j.jenvman.2015.03.020
Wood, S. A., Jina, A. S., Jain, M., Kristjanson, P., & DeFries, R. S. (2014).
Smallholder farmer cropping decisions related to climate variability across
multiple regions. Global Environmental Change(25), 163-172.
doi:10.1016/j.gloenvcha.2013.12.011
Zarafshani, K., Sharafi, L., Azadi, H., Hosseininia, G., Maeyer, P. D., & Witlox, F.
(2012). Drought vulnerability assessment: The case of wheat farmers in
Western Iran. Global and Planetary Change(98-99), 122-130.
doi:10.1016/j.gloplacha.2012.08.012
Zorom, M., Barbier, B., Mertz, O., & Servat, E. (2013). Diversification and adaptation
strategies to climate variability: a farm typology for the Sahel. Agricultural
Systems (116), 7-15

111
APPENDICES
A. The Questionnaire Applied in the Survey
İlçe …………………………….
Mahalle ……………………………
HANEHALKININ DEMOGRAFİK ÖZELLİKLERİ
1. Hanehalkı reisinin doğum yılı nedir?
___________
2. Hanehalkı reisinin en son öğrenim durumu nedir?
a. Okur-yazar değil
b. İlkokul terk
c. İlkokul mezunu
d. Ortaokul terk
e. Ortaokul mezunu
f. Lise terk
g. Lise mezunu (Normal, Düz, Anadolu)
h. Lise mezunu (Meslek)
i. Üniversite terk
j. Üniversite mezunu (Açıköğretim)
k. Üniversite mezunu (2 yıllık)
l. Üniversite mezunu (Normal öğretim)
m. Lisanüstü veya doktora terk
n. Lisansüstü veya doktora
3. Hanehalkı reisinin cinsiyeti nedir?
a. Erkek
b. Kadın
4. Hanede DÜZENLİ olarak kaç kişi yaşıyor?
___________
5. Hanede bulunan 15 yaş altı kişi sayısı nedir?
___________
6. Hanede bulunan 65 yaş üstü kişi sayısı nedir?
___________

112
7. Tarımsal üretimde düzenli olarak kaç kişi çalışıyor?
___________
8. Tarımsal üretimde hane dışından DÜZENLİ olarak ücretli kaç kişi
çalışıyor?
___________
9. Tarımsal üretimde hane dışından DÜZENLİ OLARAK ücret almadan kaç
kişi çalışıyor?
___________
10. Köyde imece yapılır mı?
a. Evet
b. Hayır
11. Yılın kaç ayı burada yaşıyorsunuz?
a. 1 aydan az
b. 1 ay
c. 2 ay
d. 3 ay
e. 4 ay
f. 5 ay
g. 6 ay
h. 7 ay
i. 8 ay
j. 9 ay
k. 10 ay
l. 11 ay
m. 12 ay [Soru 13]
12. (12 aydan az süre bulunduğu yerde yaşıyorsa) Diğer aylarda nerede
yaşıyorsunuz? [İL ve İLÇE ismi)
___________
13. Yıllık geliriniz ne kadardır?
a. 15.000 TL altı
b. 15.001- 40.000 TL
c. 40.001- 70.000 TL
d. 70.001-100.000 TL
e. 100.0001 TL ve üzeri

113
TARIMSAL ÜRETİMİN ÖZELLİKLERİ
14. Tarımsal üretiminiz kendiniz için mi? Satmak için mi? Yoksa her ikisi için
mi?
a. Hiçbir şekilde tarımsal faaliyette bulunmuyorum [GÖRÜŞME SONA
ERER] b. Sadece kendi tüketimim için
c. Hem kendi tüketimim hem de satış amaçlı
d. Sadece satış amaçlı
15. Kaç yıldır çiftçilik yapıyorsunuz?
___________
16. Gelirinizin ne kadarını tarımdan sağlıyorsunuz?
a. %25’ten az
b. %25-%50
c. %51-%75
d. %76’dan fazla
e. Tamamı
17. Sulu tarım mı, kuru tarım mı yapıyorsunuz?
a. Sadece Kuru Tarım yapıyorum
b. Sadece Sulu Tarım yapıyorum
c. Hem Kuru hem Sulu Tarım yapıyorum.
18. Kuru Tarım için TAMAMINA sahip olduğunuz arazi kaç dekar?
____________
19. Kuru Tarım için TAMAMINA sahip olduğunuz arazi kaç parsel?
___________
20. Kuru Tarım için SAHİBİ OLMADIĞINIZ ama işlettiğiniz HİSSELİ arazi
kaç dekar?
___________
21. Kuru Tarım için SAHİBİ OLMADIĞINIZ ama işlettiğiniz HİSSELİ arazi
kaç parsel?
____________
22. Kuru Tarım için kiraladığınız arazi kaç dekar?
___________
23. Kuru Tarım için kiraladığınız arazi kaç parsel?
____________
24. Kuru Tarım için ortak işlettiğiniz arazi kaç dekar?
____________

114
25. Kuru Tarım için ortak işlettiğiniz arazi kaç parsel?
____________
26. Sizce kuru tarım yaptığınız arazilerin ne kadarı İYİ TOPRAK
KALİTESİNE sahip?
____________ dekar
27. Sizce kuru tarım yaptığınız arazilerin ne kadarı ORTA TOPRAK
KALİTESİNE sahip?
____________ dekar
28. Sizce kuru tarım yaptığınız arazilerin ne kadarı DÜŞÜK TOPRAK
KALİTESİNE sahip?
____________ dekar
29. Sizce kuru tarım yaptığınız arazilerin ne kadarı AZ EĞİMLİ?
____________ dekar
30. Sizce kuru tarım yaptığınız arazilerin ne kadarı ORTA EĞİMLİ?
____________ dekar
31. Sizce kuru tarım yaptığınız arazilerin ne kadarı ÇOK EĞİMLİ (bayır/ sırt)?
____________ dekar
32. KURU TARIM yaptığınız arazilerde yılda dekara ortalama kaç kg alt
gübre ve üst gübre kullanıyorsunuz?
___________ kg/ dekar
33. KURU TARIM yaptığınız arazilerde yılda dekara ortalama kaç kg doğal
gübre kullanıyorsunuz?
___________ kg/ dekar
34. Kuru tarımda dekarda en fazla gelir elde ettiğiniz 1. ürün nedir?
___________
35. Bu ürünün dekarda ortalama verimi nedir?
___________ kg/ dekar
36. Dekarda en fazla gelir elde ettiğiniz 2. ürün nedir?
___________
37. Bu ürünün dekarda ortalama verimi nedir?
___________ kg/ dekar

115
38. Dekarda en fazla gelir elde ettiğiniz 3. ürün nedir?
___________
39. Bu ürünün dekarda ortalama verimi nedir?
___________ kg/ dekar
40. Kişi SADECE kuru tarım yapıyorsa “Evet”i işaretleyin. Hem kuru hem
sulu tarım yapıyorsa “Hayır”ı işaretleyin.
a. Evet
b. Hayır [Soru41]
41. Sulu Tarım için TAMAMINA sahip olduğunuz arazi kaç dekar?
____________
42. Sulu Tarım için TAMAMINA sahip olduğunuz arazi kaç parsel?
___________
43. Sulu Tarım için SAHİBİ OLMADIĞINIZ ama işlettiğiniz HİSSELİ arazi
kaç dekar?
___________
44. Sulu Tarım için SAHİBİ OLMADIĞINIZ ama işlettiğiniz HİSSELİ arazi
kaç parsel?
____________
45. Sulu Tarım için kiraladığınız arazi kaç dekar?
___________
46. Sulu Tarım için kiraladığınız arazi kaç parsel?
____________
47. Sulu Tarım için ortak işlettiğiniz arazi kaç dekar?
____________
48. Sulu Tarım için ortak işlettiğiniz arazi kaç parsel?
____________
49. Sizce sulu tarım yaptığınız arazilerin ne kadarı İYİ TOPRAK
KALİTESİNE sahip?
____________ dekar
50. Sizce sulu tarım yaptığınız arazilerin ne kadarı ORTA TOPRAK
KALİTESİNE sahip?
____________ dekar
51. Sizce sulu tarım yaptığınız arazilerin ne kadarı DÜŞÜK TOPRAK
KALİTESİNE sahip?
____________ dekar
52. Sizce sulu tarım yaptığınız arazilerin ne kadarı AZ EĞİMLİ?
____________ dekar
53. Sizce sulu tarım yaptığınız arazilerin ne kadarı ORTA EĞİMLİ?
____________ dekar

116
54. Sizce sulu tarım yaptığınız arazilerin ne kadarı ÇOK EĞİMLİ (bayır/ sırt)?
____________ dekar
55. SULU TARIM yaptığınız arazilerde yılda dekarda ORTALAMA kaç kg
alt gübre ve üst gübre kullanıyorsunuz?
___________ kg/ dekar
56. SULU TARIM yaptığınız arazilerde yılda dekarda ORTALAMA kaç kg
doğal gübre kullanıyorsunuz?
___________ kg/ dekar
57. Sulu tarımda dekarda en fazla gelir elde ettiğiniz 1. ürün nedir?
___________
58. Bu ürünün dekarda ortalama verimi nedir?
___________ kg/ dekar
59. Dekarda en fazla gelir elde ettiğiniz 2. ürün nedir?
___________
60. Bu ürünün dekarda ortalama verimi nedir?
___________ kg/ dekar
61. Dekarda en fazla gelir elde ettiğiniz 3. ürün nedir?
___________
62. Bu ürünün dekarda ortalama verimi nedir?
___________ kg/ dekar
63. Tarımda ne kadar geleneksel, ne kadar modern yöntemleri
kullanıyorsunuz?
a. Tamamen geleneksel yöntemleri kullanıyorum
b. Tamamen modern yöntemleri kullanıyorum
c. Her ikisini de kullanıyorum
64. Traktörünüz var mı?
a. Evet
b. Hayır [Soru66]
65. Traktörünüzle kullandığınız toplam kaç adet tarım aletiniz var?
____________ adet

117
66. Biçerdöveriniz/ hasat makineniz var mı?
a. Evet
b. Hayır
67. Sahip olmadığınız ama ihtiyacınız olan tarımsal makineleri kiralıyor
musunuz?
a. Evet
b. Hayır [Soru69]
68. Sahip olmadığınız ama ihtiyacınız olan tarımsal makineleri kiralamakta
sıkıntı yaşıyor musunuz?
a. Evet
b. Hayır
c. Bazen
69. Toprak analizi yaptırıyor musunuz?
a. Evet
b. Hayır [Soru72]
70. Toprak analizinin sonucuna göre mi gübre veriyorsunuz?
a. Evet
b. Hayır [Soru72]
71. Toprak analizi sonucuna göre gübre vermemenizin sebebi nedir?
____________
72. Tarım yapılan arazinin yakınında ağaçlandırma alanı/ orman var mı?
a. Evet
b. Hayır [Soru74]
73. Bu alanın araziyi kuraklık, sel, fırtına gibi aşırı iklim olaylarına karşı
koruduğunu düşünüyor musunuz?
a. Evet
b. Hayır
74. Bir yıl içerisinde 1'den fazla ürün ekiyor musunuz?
a. Evet
b. Hayır
75. Bir yıl içerisinde kaç çeşit ürün ekiyorsunuz?
____________ adet [1’den fazla ise Soru75] [1 ise Soru76]

118
76. Yıl içerisinde birden fazla ürün ekmenizin sebebi nedir?
a. Münavebe için
b. Riski azaltmak için
c. Hayvan yemi için
d. Geliri çeşitlendirmek için
e. Diğer
____________
77. Yıl içerisinde tek çeşit ürün ekmenizin sebebi nedir?
a. Kuru tarımda alternatif yok, tek ürün ekilebiliyor
b. Diğer
____________
78. Aynı anda farklı parsellerde farklı ürünler ekiyor musunuz?
a. Evet
b. Hayır [Soru79]
79. Aynı anda farklı ürünler ekmenizin sebepleri nelerdir?
a. Münavebe için
b. Riski azaltmak için
c. Hayvan yemi için
d. Geliri çeşitlendirmek için
e. Diğer
____________
80. (Sulu tarım yapıyorsa) Kullandığınız suyun kaynağı nedir?
a. Yeraltı suyu
b. Akarsu
c. Göl
d. Baraj/ gölet
e. Kanal
f. Diğer
____________
81. Tarımsal üretimde kullandığınız su yeterli mi?
a. Evet
b. Hayır
c. Yıla göre/ iklim koşullarına göre değişiyor
82. Su kullanımı için enerji harcıyor musunuz?
a. Evet
b. Hayır

119
83. Yıllar içerisinde kullanabildiğiniz su miktarında azalma oldu mu?
a. Evet
b. Hayır [Soru85]
84. Suyun azalmasıyla sulama konusunda önlem almaya başladınız mı?
a. Evet
b. Hayır [Soru85]
85. Ne tür önlemler almaya başladınız?
____________
86. Hayvancılık ile uğraşıyor musunuz?
a. Evet
b. Hayır [Soru92]
87. Hayvancılıkla uğraşıyorsanız:
a. Büyükbaş hayvan sayısı…………………………..
b. Küçükbaş hayvan sayısı……………………………
c. Arılı kovan sayısı………………………………………
d. Kanatlı hayvan sayısı………………………………..
e. Diğer
____________
88. Hanede kaç kişi DÜZENLİ olarak hayvan bakımıyla ilgilenir?
_______________
89. Hane dışından olup DÜZENLİ olarak hayvanların bakımıyla ilgilen var
mı?
a. Evet
b. Hayır
90. Hane dışından olup DÜZENLİ olarak hayvanların bakımıyla ilgilen kaç
kişi var?
_______________
91. Merada otlatma yapıyor musunuz?
a. Evet
b. Hayır [Soru92]
92. Mera kalitesi nasıl?
a. İyi
b. Orta

120
c. Kötü
İKLİM DEĞİŞİKLİĞİ KONUSUNDA FARKINDALIK
93. Son 10 yılda iklimde (hava koşullarında) eskiye göre bir değişiklik görüyor
musunuz?
Evet
Hayır
Artan yağış
Azalan yağış (kuraklık)
Düzensiz yağış
Geciken yağış
Yağış döneminin kısalması
Artan sıcaklık
Sel olaylarında artış
Dolu olaylarında artış
Don olaylarında artış
Sıcak rüzgarlarda artış
Fırtınada artış
Gece-gündüz sıcaklık farkının artması
Diğer…
94. İklimdeki bu değişimlerin sebebi nedir sizce?
__________
95. Son beş yılda kuraklık yaşadınız mı?
a. Evet
b. Hayır [Soru99]
96. Son 5 yılın kaç yılı kurak geçti?
__________
97. Kuraklıktan dolayı ürün kaybı yaşadınız mı?
a. Evet
b. Hayır [Soru98]
98. En çok hangi üründe kayıp yaşadınız?
__________
99. Bu üründe ne kadar kayıp yaşadınız %?
__________

121
100. Köyde yağmur duasına çıkıldı mı?
a. Evet
b. Hayır
101. Son 5 yılda Sel yaşadınız mı?
a. Evet
b. Hayır [Soru105]
102. Son 5 yılın kaç yılında sel oldu?
__________
103. Selden dolayı ürün kaybı yaşadınız mı?
c. Evet
d. Hayır [Soru105]
104. En çok hangi üründe kayıp yaşadınız?
__________
105. Bu üründe ne kadar kayıp yaşadınız %?
__________
106. Son 5 yılda DOLU yaşadınız mı?
a. Evet
b. Hayır [Soru110]
107. Son 5 yılın kaç yılında dolu oldu?
__________
108. Doludan dolayı ürün kaybı yaşadınız mı?
e. Evet
f. Hayır [Soru110]
109. En çok hangi üründe kayıp yaşadınız?
__________
110. Bu üründe ne kadar kayıp yaşadınız %?
__________
111. Son 5 yılda DON yaşadınız mı?
a. Evet
b. Hayır [Soru115]

122
112. Son 5 yılın kaç yılında don oldu?
__________
113. Dondan dolayı ürün kaybı yaşadınız mı?
g. Evet
h. Hayır [Soru115]
114. En çok hangi üründe kayıp yaşadınız?
__________
115. Bu üründe ne kadar kayıp yaşadınız %?
__________
116. Son 5 yılda fırtına yaşadınız mı?
a. Evet
b. Hayır [Soru120]
117. Son 5 yılın kaç yılında fırtına oldu?
__________
118. Fırtınadan dolayı ürün kaybı yaşadınız mı?
a. Evet
b. Hayır [Soru120]
119. En çok hangi üründe kayıp yaşadınız?
__________
120. Bu üründe ne kadar kayıp yaşadınız %?
__________
121. Saydıklarım dışında son 5 yılda yaşamış olduğunuz afet oldu mu?
a. Evet
b. Hayır [Soru126]
122. Bu afet nedir? (kar, sam yeli vb.)
__________
123. Bu afeti son 5 yılda kaç kez yaşadınız?
__________
124. Bu afetten dolayı ürün kaybı yaşadınız mı?
a. Evet
b. Hayır [Soru131]

123
125. En çok hangi üründe kayıp yaşadınız?
__________
126. Bu üründe ne kadar kayıp yaşadınız %?
__________
127. Başka bir afet yaşadınız mı?
a. Evet
b. Hayır [Soru131]
128. Bu afeti son 5 yılda kaç kez yaşadınız?
__________
129. Bu afetten dolayı ürün kaybı yaşadınız mı?
a. Evet
b. Hayır
130. En çok hangi üründe kayıp yaşadınız?
__________
131. Bu üründe ne kadar kayıp yaşadınız %?
__________
132. Son beş yılda herhangi bir afet sebebiyle HAYVAN veya EKİPMAN
KAYBINIZ oldu mu?
a. Evet
b. Hayır [Soru134]
133. Toplam EKİPMAN kaybınız ne kadar olmuştur [TL] ?
____________
134. Toplam HAYVAN kaybınız ne kadar olmuştur [TL] ?
____________
135. [SORMADAN YANITLAYINIZ] Görüştüğümüz kişi afetlerden herhangi
birini yaşamışsa EVET'i işaretleyip devam ediyoruz. Afetlerden herhangi
birini yaşamadıysa HAYIR'ı işaretliyoruz.
a. Evet
b. Hayır [Soru139]

124
136. Yaşadığınız kayıpların GELİRİNİZ üzerindeki etkilerini 1’den 5’e kadar
değerlendirir misiniz?
a. 1 Hiç etkilemedi
b. 2
c. 3
d. 4
e. 5 Son derece etkiledi
137. Kayıpları telafi edebildiniz mi?
a. Evet
b. Hayır [Soru139]
138. Kayıpları telafi etmeniz ne kadar kolay oldu 1’den 5’e kadar değerlendirir
misiniz?
a. 1 Hiç kolay olmadı
b. 2
c. 3
d. 4
e. 5 Son derece kolay oldu
139. Kayıpları telafi etmek için aşağıdaki yöntemlerden herhangi birini
kullandınız mı? (birden fazla işaretlenebilir)
a. Kredi çekme
b. Borç alma
c. Malların ipotek edilmesi
d. Malların/ hayvanların satılması
e. Geçmiş birikimlerin/ maaşın kullanılması
f. Esnaftan borç ile malzeme alma
g. Tüketimin azaltılması
h. Gıdayı dışardan temin etme
i. Ailenin dışarıda bulunan üyelerinden yardım alma
j. Devlet desteğine başvurma
k. Tarım sektörü dışında işler yapma
l. Yurtdışında çalışma
140. İklim değişikliğinin olumlu etkilerini hissediyor musunuz?
a. Evet
b. Hayır [Soru141]
141. Hissettiğiniz olumlu etkiler nelerdir?
____________

125
142. Kuraklığa karşı önlem alıyor musunuz?
a. Evet
b. Hayır [Soru143]
143. Kuraklığa karşı aldığınız önlem nedir?
____________
144. Kuraklığa karşı önlem almamanızın sebebi nedir? (Birden fazla seçilebilir)
Evet Hayır
a. Gerek duymamak
b. Yeterli bilgiye sahip olmamak
c. Teknik desteğin yetersiz olması
d. Maliyeti karşılayacak gücünün olmaması
e. Arazisinin küçük olması
f. Sulama imkânlarının yetersiz olması
g. Tarımsal gelirinin az olması
h. Kuraklığı geçici bir durum olarak görmek
i. Sonuçların uzun vadede görülecek olması
j. İşgücü yetersizliği
k. Değişimden/ yeni yöntemlerden çekinmek
l. Bir önlem alınabileceğini düşünmemek
m. Diğer
____________
145. Sel/ su baskınına karşı önlem alıyor musunuz?
a. Evet
b. Hayır [Soru146]

126
146. Sel/ su baskınına karşı aldığınız önlem nedir?
____________
147. Sel/ su baskınına karşı önlem almamanızın sebebi nedir? (Birden fazla
seçilebilir)
a. Gerek duymamak
b. Yeterli bilgiye sahip olmamak
c. Teknik desteğin yetersiz olması
d. Maliyeti karşılayacak gücünün olmaması
e. Arazisinin küçük olması
f. Tarımsal gelirinin az olması
g. Sel/su baskınını geçici bir durum olarak görmek
h. Sonuçların uzun vadede görülecek olması
i. İşgücü yetersizliği
j. Değişimden/ yeni yöntemlerden çekinmek
k. Bir önlem alınabileceğini düşünmemek
l. Diğer
____________
148. Dona karşı önlem alıyor musunuz?
a. Evet
b. Hayır [Soru149]
149. Dona karşı aldığınız önlem nedir?
____________
150. Dona karşı önlem almamanızın sebebi nedir? (Birden fazla seçilebilir)
a. Gerek duymamak
b. Yeterli bilgiye sahip olmamak
c. Teknik desteğin yetersiz olması
d. Maliyeti karşılayacak gücünün olmaması
e. Arazisinin küçük olması
f. Tarımsal gelirinin az olması
g. Donu geçici bir durum olarak görmek
h. Sonuçların uzun vadede görülecek olması
i. İşgücü yetersizliği
j. Değişimden/ yeni yöntemlerden çekinmek
k. Bir önlem alınabileceğini düşünmemek
l. Diğer
____________

127
151. Fırtınaya/ sam yeline karşı önlem alıyor musunuz?
a. Evet
b. Hayır [Soru152]
152. Fırtınaya/ sam yeline karşı aldığınız önlem nedir?
____________
153. Fırtınaya/ sam yeline karşı önlem almamanızın sebebi nedir? (Birden fazla
seçilebilir)
a. Gerek duymamak
b. Yeterli bilgiye sahip olmamak
c. Teknik desteğin yetersiz olması
d. Maliyeti karşılayacak gücünün olmaması
e. Arazisinin küçük olması
f. Tarımsal gelirinin az olması
g. Fırtına/ sam yelini geçici bir durum olarak görmek
h. Sonuçların uzun vadede görülecek olması
i. İşgücü yetersizliği
j. Değişimden/ yeni yöntemlerden çekinmek
k. Bir önlem alınabileceğini düşünmemek
l. Diğer
____________
154. Bunlar dışında önlem aldığınız bir afet var mı?
a. Evet
b. Hayır [Soru159]
155. Bu afet nedir?
____________
156. Nasıl bir önlem alıyorsunuz?
____________
157. Önlem aldığınız başka bir afet var mı?
a. Evet
b. Hayır [Soru159]
158. Bu afet nedir?
____________
159. Nasıl bir önlem alıyorsunuz?
____________

128
160. Son 5 yıl içerisinde aşağıdakilerden herhangi birini yaptınız mı?
a. Ekim zamanında değişiklik
b. Tarlayı ekime hazırlama zamanında değişiklik
c. Hasat zamanında değişiklik
d. Münavebeli tarıma geçilmesi
e. Korumalı toprak işleme
f. Birden fazla ürün ekmeye başlama
g. Ekilen ürünü/ ürünleri değiştirme
h. Damla/ yağmurlama sulamaya geçiş
i. Su kuyusu açtırma
j. Hayvan gübresi uygulamaya başlama
k. Nadas yapmaya başlama
l. Hayvancılık yapmaya başlama
m. Hayvanların satılması
n. Bahçecilik yapmaya başlama
o. Tarım dışı işlerde çalışmaya başlama
161. İklim değişikliği yüzünden tarımdan kazandıklarınız yetmezse ne
yaparsınız? [Birden Fazla İşaretlenebilir]
a. Tarım dışı bir işte çalışmaya başlarım [Soru161]
b. Hayvancılığa başlarım
c. Tarlaları kiralarım
d. Göç ederim
e. Tarımdan başka iş yapamam
f. Diğer [Lütfen Belirtiniz]
____________
162. İş olanaklarının nerelerde mümkün olacağını düşünüyorsunuz?
a. Yaşadığım şehirde
b. Yakınımdaki şehirlerde
c. Yurt dışında
163. Son 10 yılda, çevrenizde iklim değişikliği sebebiyle KESİN göç eden oldu
mu?
a. Evet
b. Hayır [Soru164]
164. İklim değişikliğinin bu göçte yüzde kaç etkili olduğunu düşünüyorsunuz?
a. %25’ten az
b. %25-%50
c. %51-%75
d. %76’dan fazla
e. Tamamen iklim koşulları etkili oldu
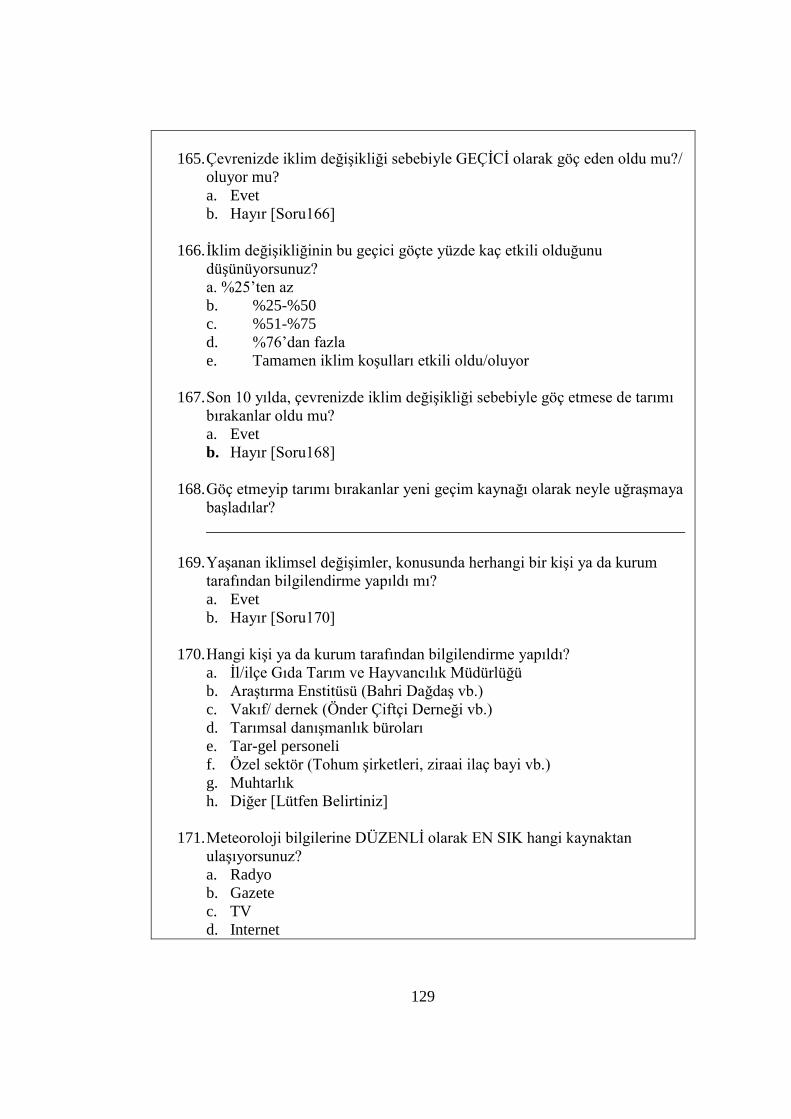
129
165. Çevrenizde iklim değişikliği sebebiyle GEÇİCİ olarak göç eden oldu mu?/
oluyor mu?
a. Evet
b. Hayır [Soru166]
166. İklim değişikliğinin bu geçici göçte yüzde kaç etkili olduğunu
düşünüyorsunuz?
a. %25’ten az
b. %25-%50
c. %51-%75
d. %76’dan fazla
e. Tamamen iklim koşulları etkili oldu/oluyor
167. Son 10 yılda, çevrenizde iklim değişikliği sebebiyle göç etmese de tarımı
bırakanlar oldu mu?
a. Evet
b. Hayır [Soru168]
168. Göç etmeyip tarımı bırakanlar yeni geçim kaynağı olarak neyle uğraşmaya
başladılar?
____________________________________________________________
169. Yaşanan iklimsel değişimler, konusunda herhangi bir kişi ya da kurum
tarafından bilgilendirme yapıldı mı?
a. Evet
b. Hayır [Soru170]
170. Hangi kişi ya da kurum tarafından bilgilendirme yapıldı?
a. İl/ilçe Gıda Tarım ve Hayvancılık Müdürlüğü
b. Araştırma Enstitüsü (Bahri Dağdaş vb.)
c. Vakıf/ dernek (Önder Çiftçi Derneği vb.)
d. Tarımsal danışmanlık büroları
e. Tar-gel personeli
f. Özel sektör (Tohum şirketleri, ziraai ilaç bayi vb.)
g. Muhtarlık
h. Diğer [Lütfen Belirtiniz]
171. Meteoroloji bilgilerine DÜZENLİ olarak EN SIK hangi kaynaktan
ulaşıyorsunuz?
a. Radyo
b. Gazete
c. TV
d. Internet

130
e. TARBİL istasyon verisi
f. Diğer çiftçiler
g. Bilgi alamıyorum
h. Diğer [Lütfen Belirtiniz]
172. Son 5 yılda tarımsal faaliyetleriniz için finansal desteğe ihtiyaç duydunuz
mu?
a. Evet
b. Hayır [Soru175]
173. Finansal destek aldınız mı?
a. Evet
b. Hayır [Soru175]
174. Finansal desteği nerelerden aldınız?
a. Devlet/ özel banka hibe kredisi
b. Kalkınma Ajansı (hibe ve teşvik kredisi)
c. Tarım ve Kırsal Kalkınmayı Destekleme Kurumu (TKDK) hibe desteği
d. Tarım kooperatifi
e. Arkadaş/ akraba borç
f. Esnaftan borca malzeme almak
g. Arkadaş/akraba destek
h. Arkadaş/akraba destek
i. DİĞER [Lütfen Belirtiniz]
175. Aldığınız desteği hangi amaçla kullandınız?
a. Mazot borçları için
b. Gübre borçları için
c. Yem borçları için
d. Tohum almak için
e. Arazi alımı için
f. Hayvan alımı için
g. Tarımsal ekipman alımı için
h. Tarımsal sulama için
i. Tarım dışı ihtiyaçlar için
j. Diğer [Lütfen Belirtiniz]
176. Sizce tarımsal kredi olanakları yeterli mi?
a. Evet
b. Hayır

131
FİZİKSEL VE SOSYAL ALTYAPI
177. Yaşadığınız yerde aşağıdakilerden hangileri bulunuyor?
a. İlköğretim okulu
b. Lise
c. Cami
d. Çalışan sağlık ocağı
e. Çalışmayan sağlık ocağı
f. Spor tesisi
g. Veteriner
h. Gübre, ilaç bayisi
i. Diğer [Lütfen Belirtiniz]
178. Aşağıdaki kuruluşlardan hangilerine üyesiniz?
a. Ziraat odası
b. Üretim kooperatifi
c. Sulama kooperatifi
d. Tarım Kredi kooperatifi
e. Birlik
f. Önder Çiftçi Derneği
g. Diğer [Lütfen Belirtiniz]
179. SORMADAN YANITLAYINIZ HİÇBİR ÜYELİĞİ YOKSA "YOK"
varsa "VAR"ı işaretleyin.
a. Yok [Soru181]
b. Var
180. Bu kuruluşların düzenlediği faaliyetlerden DÜZENLİ olarak hangilerine
katılıyorsunuz?
a. Kuruluş faaliyet düzenlemiyor
b. Toplantı
c. Eğitim
d. Seçim
e. Gezi (sosyal faaliyet)
f. Tanıtım gezisi (Fuar)
g. Diğer [Lütfen Belirtiniz]
181. Üye olmama sebebiniz nedir?
a. Yaşadığı yerde bu kuruluşlar yok
b. Kuruluşlar yaşadığı yere uzak
c. Kuruluşlar aktif çalışmıyor
d. Diğer [Lütfen Belirtiniz]

132
182. Şimdiye kadar bir tarımsal eğitime katıldınız mı? (Targel personelinden
vb.)?
a. Evet
b. Hayır [Soru1832]
183. Geçen yıl kaç tarımsal eğitime katıldınız?
_______________
184. Tarımsal programları/ yayınları takip ediyor musunuz?
a. Evet
b. Hayır [Soru185]
185. Tarımsal programları en çok nereden takip ediyorsunuz?
a. Televizyon
b. İnternet
c. Radyo
d. Diğer [Lütfen Belirtiniz]
186. ÇKS kaydınız var mı?
a. Evet
b. Hayır [Soru189]
187. Gıda Tarım ve Hayvancılık Bakanlığı tarafından verilen tarımsal
desteklerden faydalanıyor musunuz?
a. Evet
b. Hayır [Soru189]
188. Tarımsal destek alınan toplam arazi büyüklüğü ne kadar?
_______________ dekar
189. Hangi desteklerden faydalanıyorsunuz? (birden fazla işaretlenebilir)
a. Havza bazlı fark ödemesi (yağlık ayçiçeği, dane mısır, soya fasülyesi,
aspir, kanola, dane mısır, hububat, nohut, mercimek vb.)
b. Alan bazlı destekler (mazot, gübre, toprak analizi, organik tarım, iyi
tarım vb.)
c. ÇATAK
d. Yem bitkileri desteklemesi
e. Sertifikalı tohum kullanımı desteklemesi
f. Sertifikalı fidan/fide ve standart fidan kullanımı desteklemesi
g. Sertifikalı tohumluk üretimi desteklemesi
h. Biyolojik ve biyoteknik mücadele desteklemesi
i. Makine/ekipman desteği
j. Hayvancılık desteği

133
k. Diğer [Lütfen Belirtiniz]
190. Belediye, kaymakamlık gibi kurumlardan yardım alıyor musunuz?
a. Evet
b. Hayır [Soru192]
191. Ne tür yardımlar almaktasınız?
a. Yiyecek yardımı
b. Geçim temin edici yardımlar (iş kurmak için ekipman vb.)
c. Barınma yardımı
d. Eğitim yardımı (kitap, kırtasiye vb.)
e. Nakdi yardım
f. Yakacak yardımı
g. Diğer (ayni sağlık, düğün vb.)
h. Diğer [Lütfen Belirtiniz]
192. Aldığınız bu destek toplam gelirinizin ne kadarını oluşturuyor?
a. %25’ten az
b. %26-%50
c. %51-%75
d. %76’dan fazla
193. Sözleşmeli üretim yapıyor musunuz?
a. Evet
b. Hayır
194. Hanenin tarım dışı geliri var mı?
a. Evet
b. Hayır [Soru195]
195. Tarım dışı gelir(ler) toplam gelirin yüzde kaçını oluşturuyor?
a. %25’ten az
b. %26-%50
c. %51-%75
d. %76’dan fazla
196. Son 5 yıl içerisinde tarım sigortası yaptırdınız mı?
a. Evet
b. Hayır [Soru197]
197. Yaşadığınız bir afetten dolayı tarım sigortasından tazminat aldınız mı?
a. Evet
b. Hayır
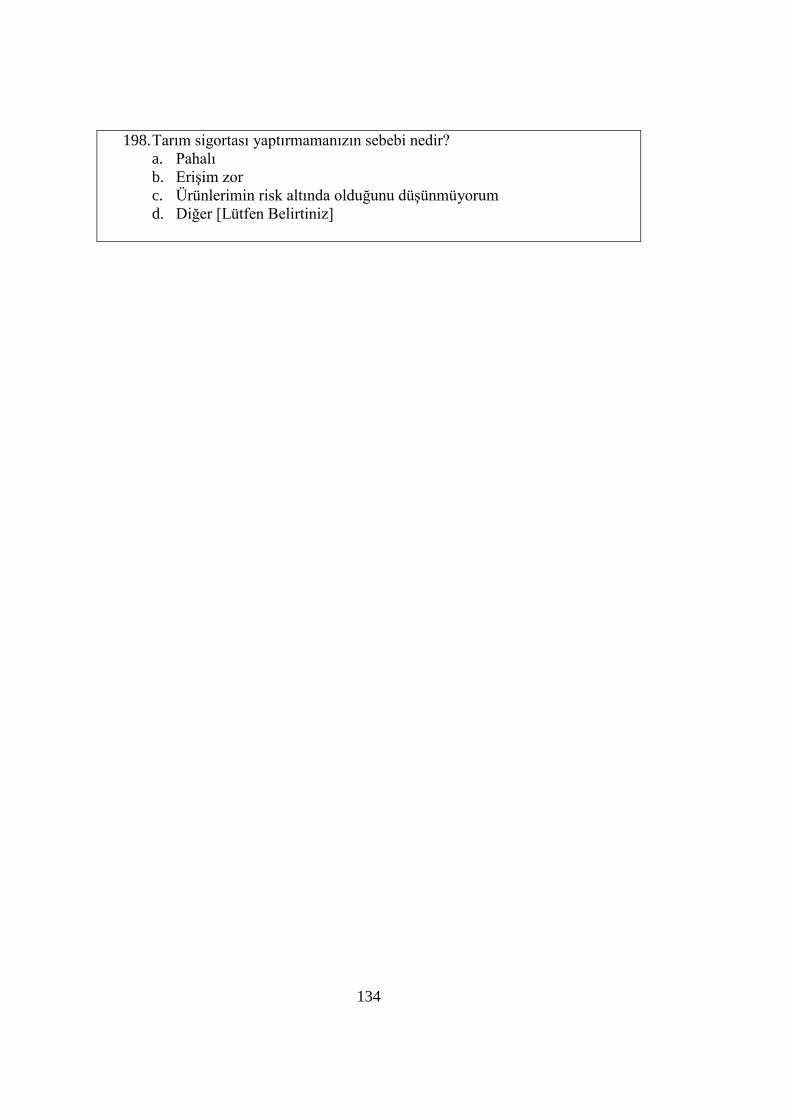
134
198. Tarım sigortası yaptırmamanızın sebebi nedir?
a. Pahalı
b. Erişim zor
c. Ürünlerimin risk altında olduğunu düşünmüyorum
d. Diğer [Lütfen Belirtiniz]

135
B. The Results of the Socio-Economic Survey
Table B-1 Demographic features of the households
Vulnerability Variables Cihanbeyli Karapınar Seydişehir
Age 52 53 55
Education Primary school
(52.9%)
Primary school
(69.9%)
Primary school
(65.7%)
Sex All male All male All male
Average Household Size 4.9 5.5 3.8
Dependency Ratio 34.8% 30.7% 34.4%
Family members working
in agriculture
35.2% 41% 56.6%
External help for
agricultural production
Average 1.2
person
Average 0.7
person
Average 2.9
people
Duration of residency 11.1 months 11.7 months 10.8 months
Annual Income 15.001- 40.000
TL
15.001- 40.000
TL
15.001- 40.000
TL
Aim of agricultural
production
Selling and
consumption
Selling and
consumption
Selling and
consumption
Years of farming
experience
28.6 29.7 31.7
Percentage share of
agricultural production in
income
25%- 50%
Less than 25% Less than 25%
Table B-2. Age Groups of the Respondents
Age Groups Cihanbeyli Karapınar Seydişehir
# % # % # %
<18 0 0,0 0 0,0 0 0,0
18-30 14 8,0 4 2,7 1 1,5
30-60 106 60,9 96 65,8 41 61,2
60< 54 31,0 46 31,5 25 37,3
Table B-3. Education Levels of the Respondents
Education Level Cihanbeyli Karapınar Seydişehir
# % # % # %
Illiterate 2 1,1 0 0,0 0 0,0
Abandoned primary
school 7 4,0 4 2,7 0 0,0

136
Education Level Cihanbeyli Karapınar Seydişehir
# % # % # %
Primary school
graduate 92 52,9 102 69,9 44 65,7
Abandoned
secondary school 8 4,6 5 3,4 3 4,5
Secondary school
graduate 22 12,6 15 10,3 5 7,5
Abandoned high
school 8 4,6 4 2,7 0 0,0
High school
graduate (regular,
Anatolian)
23 13,2 9 6,2 6 9,0
High school
graduate
(vocational)
4 2,3 0 0,0 3 4,5
Abandoned
university 2 1,1 0 0,0 2 3,0
University graduate
(open university) 1 0,6 0 0,0 1 1,5
University graduate
(2-year license) 1 0,6 1 0,7 1 1,5
University graduate
(regular) 4 2,3 5 3,4 2 3,0
Abandoned post
graduate/ doctorate 2 1,1 0 0,0 0 0,0
Post-graduate 7 4,0 1 0,7 0 0,0
Table B-4. Household Size of the Respondents
Household
Size
Cihanbeyli Karapınar Seydişehir
# % # % # %
1 2 1,1 2 1,4 1 0,8
2 27 15,5 24 16,4 15 12,7
3 17 9,8 16 11,0 12 10,2
4 35 20,1 22 15,1 21 17,8
5 32 18,4 24 16,4 6 5,1
6+ 61 35,1 58 39,7 63 53,4

137
Table B-5. Income Levels of the Respondents
Income Levels Cihanbeyli Karapınar Seydişehir
# % # % # %
Less than 15.000 TL 40 23,0 36 24,7 17 25,4
15.001- 40.000 TL 85 48,9 68 46,6 40 59,7
40.001- 70.000 TL 30 17,2 22 15,1 9 13,4
70.001- 100.000 TL 9 5,2 3 2,1 1 1,5
More than 100.0001
TL 10 5,7 17 11,6 0 0,0
Table B-6. Percentage Share of Agricultural Income
Percentage share of
agricultural income
Cihanbeyli Karapınar Seydişehir
# % # % # %
Less than 25% 39 22,4 35 24,0 18 26,9
25%- 50% 45 25,9 25 17,1 17 25,4
51%- 75% 28 16,1 29 19,9 14 20,9
More than 75% 22 12,6 25 17,1 13 19,4
100% 40 23,0 32 21,9 5 7,5
Table B-7. Features of the Farming Systems
Cihanbeyli Karapınar Seydişehir
Total amount of land
managed by the farmer
396,1 decares 209,9 decares 90,7 decares
Irrigated/Total 38,2% 67,4% 46,7%
# of parcels managed by
the farmer
8,5 5,1 12,8
Average size of parcels
managed by the farmer
46,5 decares 41,2 decares 9,4 decares
Percentage of land with
good and medium soil
quality
86,7% 83,1% 92,5%
Percentage of land with
low and medium slope
91,0% 89,9% 96,8%
Traditional/ modern/
both
Traditional
(8,1%)
Modern (86,2%)
Both (5,7%)
Traditional
(6,9%)
Modern (75,3%)
Both (17,8%)
Traditional
(7,5%)
Modern (76,1%)
Both (16,4%)
Number of devices used
with tractor
5,7 5,6 6,2

138
Table B-8. Irrigated vs Rain-fed Farming Land
Irrigation Cihanbeyli Karapınar Seydişehir
# % # % # %
Rain-fed only 81 46,6 34 23,3 17 25,4
Irrigated only 41 23,6 90 61,6 16 23,9
Both rain-fed and
irrigated 52 29,9 22 15,1 34 50,7
Table B-9. Soil Analysis and Fertilization
Cihanbeyli Karapınar Seydişehir
Having soils analyzed? Yes: 89.7%
No: 10.3%
Yes: 74.0%
No: 26.0%
Yes: 20.9%
No: 79.1%
Fertilization according to
soil analysis results
Yes: 71.8%
No: 28.2%
Yes: 74.1%
No: 25.9%
Yes:
100.0%
No: 0.0%
Reasons of not fertilizing
according to analysis
results
Analysis results are no trustable
Analysis results do not prescribe enough amount of
fertilizer
Trust to traditional knowledge
Economic incapability
To benefit from subsidies
Table B-10. Crop Diversification
Cihanbeyli Karapınar Seydişehir
# of crops in a year 2,0 1,8 2,2
Reason of crop diversity at
different plots
# % # % # %
Crop rotation 37 22,8% 21 17,1% 22 25,6%
Reduce risk 44 27,2% 29 23,6% 14 16,3%
Animal feed 10 6,2% 19 15,4% 15 17,4%
Diversify/increase
income 71 43,8% 54 43,9% 35 40,7%
Crop diversity on different
plots
Yes 66,1% 74,0% 82,1%
No 33,9% 26,0% 17,9%
Reason of single crop No alternative in rain-fed farming

139
Table B-11. Water Resources
Cihanbeyli Karapınar Seydişehir
Water source # % # % # %
Groundwater 90 92,8 111
100 14 18,9
Surface water (river, lake,
pond, canal)
5 5,2 0 0 60 81,1
Is water enough # % # % # %
Yes 58 63,0 85 76,6 31 59,6
No 21 22,8 12 10,8 5 9,6
Changes depending on
the climatic conditions 13 14,1 14 12,6 16 30,8
Energy consumed for irrigation # % # % # %
Yes 90 97,8 108 97,3 46 88,5
No 2 2,2 3 2,7 6 11,5
Reduction in irrigation water # % # % # %
Yes 63 68,5 92 82,9 37 71,2
No 29 31,5 19 17,1 15 28,8
Precaution against irrigation
water reduction
# % # % # %
Yes 28 44,4 59 64,1 9 24,3
No 35 55,6 33 35,9 28 75,7
Table B-12. Animal Husbandry
Cihanbeyli Karapınar Seydişehir
Average number of animals
per farmer
9,8 16,1 6,0
Pasture quality # % # % # %
Good 8 26,7 6 18,2 5 31,3
Medium 13 43,3 15 45,5 8 50,0
Bad 9 30,0 12 36,3 3 18,8
Table B-13. Social Setting
Cihanbeyli Karapınar Seydişehir
# of facilities available 4,3 4,6 3,5
# of memberships to agricultural
organizations
2,0 2,4 2,8
# of activities participated 1,2 1,5 1,7

140
Cihanbeyli Karapınar Seydişehir
# of obtained agricultural training in past
year
1,1 1,6 0,9
Source of agricultural programmes? # % # % # %
Television 121 90,3 125 98,4 63 100
Internet 13 9,7 2 1,6 0 0
Radio 0 0 0 0 0 0
Other 0 0 0 0 0 0
Table B-14. Agricultural Subsidies
Cihanbeyli Karapınar Seydişehir
Registry to Farmer
Registration System
# % # % # %
Yes 153 87,9 129 88,4 52 77,6
No 21 12,1 17 11,6 15 22,4
Obtaining agricultural
support of the Ministry?
(among the registered
farmers)
# % # % # %
Yes 86 56,2 73 56,6 37 50,7
No 67 43,8 56 43,4 36 49,3
# of agricultural subsidies
obtained
# % # % # %
1 16 18,6 18 24,7 5 13,5
2 33 38,4 22 30,1 10 27,0
3 20 23,3 21 28,8 16 43,3
4 9 10,5 10 13,7 6 16,2
5 5 5,8 2 2,7 0 0
6 2 2,3 0 0 0 0
7 1 1,1 0 0 0 0
Type of Subsidies Obtained # % # % # %
Basin-based difference
payment 40 46,5 38 52,1 18 48,6
Area-based subsidies 79 91,9 69 94,5 36 97,3
ÇATAK 1 1,2 0 0,0 0 0,0
Animal feed subsidy 7 8,1 5 6,8 0 0,0
Certified seed subsidy 48 55,8 32 43,8 28 75,7
Certified sapling/seedling and
standard sapling subsidy 3 3,5 4 5,5 0 0,0
Certified seed production
subsidy 18 20,9 10 13,7 5 13,5

141
Cihanbeyli Karapınar Seydişehir
Biological and biotechnical
pest control subsidy 0 0,0 0 0,0 0 0,0
Machinery/ equipment
subsidy 8 9,3 4 5,5 3 8,1
Animal husbandry subsidy 16 18,6 12 16,4 6 16,2
Table B-15. Other Livelihood Options
Cihanbeyli Karapınar Seydişehir
Support from municipality/
district governorship
# % # % # %
Yes 1 0,6 3 2,1 1 1,5
No 173 99,4 143 97,9 66 98,5
Contract-based agricultural
production
# % # % # %
Yes 45 25,9 16 11,0 27 40,3
No 129 74,1 130 89,0 40 59,7
Non-agricultural income
sources
# % # % # %
Yes 122 70,1 103 70,5 55 82,1
No 52 29,9 43 29,5 12 17,9
Share of non-agricultural
income sources in total
income
# % # % # %
Less than 25% 23 18,9 17 16,5 3 5,5
26%- 50% 55 45,0 27 26,2 18 32,7
51%- 75% 29 23,8 46 44,7 29 52,7
More than 76% 15 12,3 13 12,6 5 9,1
Table B-16. Agricultural Insurance
Cihanbeyli Karapınar Seydişehir
Agricultural insurance in
the last 5 years # % # % # %
Yes 125 71,8 61 41,8 10 14,9
No 49 28,2 85 58,2 57 85,1
Insurance indemnity due to
a disaster # % # % # %
Yes 50 40,0 4 6,6 1 10,0
No 75 60,0 57 93,4 9 90,0

142
Cihanbeyli Karapınar Seydişehir
Causes of not having
insurance # % # % # %
Fatalistic behaviour 4 25 3 10 0 0
Do not possess the
deed title
2 13 4 13 4 22
The insurance do
not compensate
losses
5 31 3 10 3 17
Did not consider
necessary
1 6 5 16 10 56
Missed the deadline 2 13 14 45 1 6
Do not know 2 13 2 6 0 0
Table B-17. Observed Climatic Changes
Cihanbeyli Karapınar Seydişehir
# % # % # %
Increasing
precipitation 28 16,1 12 8,2 5 7,5
Decreasing
precipitation (drought) 160 92,0 133 91,1 61 91,0
Irregular precipitation 168 96,6 135 92,5 60 89,6
Delayed precipitation 166 95,4 139 95,2 64 95,5
Shorter precipitation
period 164 94,3 136 93,2 60 89,6
Increasing
temperature 161 92,5 137 93,8 61 91,0
Increasing # of floods 8 4,6 3 2,1 1 1,5
Increasing # of hails 52 29,9 44 30,1 10 14,9
Increasing # of frost 100 57,5 95 65,1 53 79,1
Increasing # of
simoons 108 62,1 84 57,5 37 55,2
Increasing # of storms 59 33,9 37 25,3 33 49,3
Increase in day-night
temperature difference 91 52,3 89 61,0 44 65,7
Other 0 0,0 0 0,0 0 0,0

143
Table B-18. Reason of Climatic Changes
Cihanbeyli Karapınar Seydişehir
# % # % # %
Don’t know 61 35,1 66 45,2 27 40,3
Global Warming 29 16,7 25 17,1 4 6,0
Human Activities Destroying
Natural Balance 25 14,4 9 6,2 4 6,0
Industrialization (chemicals,
fertilizers, fuel use) 13 7,5 6 4,1 10 14,9
No afforestation/ deforestation 8 4,6 3 2,1 2 3,0
No change 2 1,1 3 2,1 2 3,0
Ozone layer depletion 4 2,3 4 2,7 5 7,5
God’s will 9 5,2 3 2,1 0 0,0
Greenhouse gases 3 1,7 1 0,7 0 0,0
Glaciers melting 2 1,1 0 0,0 4 6,0
Unconsciousness 5 2,9 2 1,4 2 3,0
Natural cycle 5 2,9 0 0,0 1 1,5
Agriculture (chemicals,
fertilizers, excess usage of water-
moisture)
0 0,0 13 8,9 0 0,0
Other 7 4,0 11 7,5 5 7,5
Table B-19. Exposure to Climatic Changes and Livelihood Strategies
Exposure Cihanbeyli Karapınar Seydişehir
# % # % # %
Exposure to drought 160 92,0 129 88,4 51 76,1
Crop loss due to drought 156 89,7 122 83,6 50 74,6
Exposure to flood 6 3,4 3 2,1 6 9,0
Crop loss due to flood 3 1,7 3 2,1 5 7,5
Exposure to hail 89 51,1 76 52,1 17 25,4
Crop loss due to hail 79 45,4 66 45,2 0 0,0
Exposure to frost 92 52,9 91 62,3 55 82,1
Crop loss due to frost 83 47,7 80 54,8 52 77,6
Exposure to storm 42 24,1 15 10,3 21 31,3
Crop loss due to storm 37 21,3 10 6,8 12 17,9
Exposure to other
disaster 13 7,5 16 11,0 5 7,5
Crop loss due to other
disaster 13 7,5 12 8,2 5 7,5
Equipment loss 0 0,0 0 0,0 1 1,5

144
Table B-20. Adaptation Methods
Adaptation Methods Cihanbeyli Karapınar Seydişehir
# % # % # %
Take a loan 25 14,4 46 31,5 13 19,4
Borrowing 30 17,2 23 15,8 6 9,0
Mortgage of properties 11 6,3 3 2,1 1 1,5
Selling
properties/animals 9 5,2 12 8,2 10 14,9
Usage of savings/
salary 26 14,9 19 13,0 14 20,9
Borrowing materials
from retailers 18 10,3 15 10,3 10 14,9
Reduction in
consumption 13 7,5 3 2,1 2 3,0
Buying food 7 4,0 3 2,1 0 0,0
Help from other family
members 12 6,9 5 3,4 1 1,5
Applying for
government support 17 9,8 5 3,4 2 3,0
Working outside
agricultural sector 8 4,6 4 2,7 1 1,5
Working abroad 2 1,1 0 0,0 0 0,0
Table B-21. Precautions Taken Against Drought
Precaution Cihanbeyli Karapınar Seydişehir
# % # % # %
Afforestation 1 0,6 6 4,1 1 1,5
More irrigation 8 4,6 2 1,4 0 0,0
Efficient irrigation 10 5,7 20 13,7 8 11,9
Opening up/
deepening well 5 2,9 6 4,1 0 0,0
Insurance 10 5,7 3 2,1 0 0,0
Early usage of
fertilizers and
chemicals
2 1,1 0 0,0 0 0,0
Fertilization 0 0,0 1 0,7 0 0,0
Drought resistant
crops 0 0,0 1 0,7 0 0,0

145
Table B-22. Reason of Not Taking Precaution Against Drought
Cihanbeyli Karapınar Seydişehir
# % # % # %
Find unnecessary 33 19,0 32 21,9 10 14,9
Lack of information 17 9,8 15 10,3 5 7,5
Lack of technical
support 14 8,0 6 4,1 4 6,0
Cannot afford 17 9,8 4 2,7 2 3,0
Small size of farm
land 2 1,1 1 0,7 2 3,0
Lack of irrigation
opportunity 44 25,3 31 21,2 6 9,0
Low agricultural
income 4 2,3 3 2,1 0 0,0
Think drought
temporary 3 1,7 0 0,0 0 0,0
Too long to see the
results 2 1,1 2 1,4 0 0,0
Lack of labour 4 2,3 0 0,0 0 0,0
Abstain from change/
new methods 2 1,1 4 2,7 0 0,0
No precaution can be
taken 82 47,1 65 44,5 35 52,2
Other 4 2,3 2 1,4 1 1,5
Table B-23. Precautions Taken Against Flood
Precaution Cihanbeyli Karapınar Seydişehir
# % # % # %
Channel/ embankment
construction 2 1,1 1 0,7 1 1,5
Insurance 2 1,1 0 0,0 0 0,0
Table B-24. Reason of Not Taking Precaution Against Flood
Cihanbeyli Karapınar Seydişehir
# % # % # %
Find unnecessary 125 71,8 106 72,6 42 62,7
Lack of information 3 1,7 2 1,4 2 3,0
Lack of technical support 0 0,0 0 0,0 1 1,5
cannot afford 0 0,0 0 0,0 0 0,0
small size of farm land 0 0,0 0 0,0 1 1,5

146
low agricultural income 0 0,0 0 0,0 0 0,0
think drought temporary 0 0,0 1 0,7 0 0,0
too long to see the results 0 0,0 0 0,0 0 0,0
lack of labour 1 0,6 0 0,0 0 0,0
abstain from change/ new
methods 0 0,0 0 0,0 0 0,0
no precaution can be taken 16 9,2 11 7,5 11 16,4
other 4 2,3 0 0,0 0 0,0
Table B-25. Precautions Taken Against Frost
Precaution Cihanbeyli Karapınar Seydişehir
# % # % # %
Late planting 2 1,1 1 0,7 0 0,0
Over fertilization 6 3,4 2 1,4 0 0,0
Insurance 2 1,1 0 0,0 0 0,0
Burning fire 0 0,0 1 0,7 0 0,0
Frost cover 0 0,0 0 0,0 1 1,5
Table B-26. Reason of Not Taking Precaution Against Frost
Cihanbeyli Karapınar Seydişehir
# % # % # %
Find unnecessary 60 34,5 42 28,8 12 17,9
Lack of information 11 6,3 7 4,8 2 3,0
Lack of technical
support 9 5,2 2 1,4 1 1,5
Cannot afford 12 6,9 1 0,7 1 1,5
Small size of farm
land 3 1,7 0 0,0 0 0,0
Low agricultural
income 3 1,7 0 0,0 0 0,0
Think drought
temporary 1 0,6 0 0,0 0 0,0
Too long to see the
results 0 0,0 1 0,7 0 0,0
Lack of labour 0 0,0 0 0,0 0 0,0
Abstain from change/
new methods 1 0,6 0 0,0 0 0,0
No precaution can be
taken 92 52,9 81 55,5 49 73,1
Other 6 3,4 3 2,1 1 1,5

147
Table B-27. Precautions Taken Against Storm/ Simoon
Precaution Cihanbeyli Karapınar Seydişehir
# % # % # %
Additional irrigation 2 1,1 0 0,0 0 0,0
Insurance 1 0,6 0 0,0 0 0,0
Wind breakers 0 0,0 1 0,7 0 0,0
Table B-28. Reason of Not Taking Precaution Against Storm/ Simoon
Cihanbeyli Karapınar Seydişehir
# % # % # %
Find unnecessary 66 37,9 51 34,9 16 23,9
Lack of information 12 6,9 8 5,5 2 3,0
Lack of technical
support 3 1,7 3 2,1 1 1,5
Cannot afford 6 3,4 2 1,4 3 4,5
Small size of farm
land 1 0,6 0 0,0 1 1,5
Low agricultural
income 1 0,6 0 0,0 0 0,0
Think drought
temporary 0 0,0 0 0,0 0 0,0
Too long to see the
results 1 0,6 0 0,0 0 0,0
Lack of labour 1 0,6 0 0,0 0 0,0
Abstain from
change/ new
methods 2 1,1 0 0,0 0 0,0
No precaution can
be taken 79 45,4 61 41,8 36 53,7
Other 6 3,4 1 0,7 0 0,0
Table B-29. Adaptation to Climatic Changes
Adaptation Method Cihanbeyli Karapınar Seydişehir
# % # % # %
Change of planting time 58 33,3 69 47,3 33 49,3
Change of tillage time 54 31,0 68 46,6 33 49,3
Change of cultivation time 43 24,7 58 39,7 32 47,8
Started crop rotation 60 34,5 55 37,7 25 37,3
Conservation agriculture 44 25,3 31 21,2 11 16,4
Started diversifying crops 68 39,1 53 36,3 30 44,8

148
Adaptation Method Cihanbeyli Karapınar Seydişehir
Change of crop 102 58,6 85 58,2 38 56,7
Use of efficient irrigation
techniques 71 40,8 93 63,7 35 52,2
Drilling well 41 23,6 48 32,9 8 11,9
Use of natural fertilizer 33 19,0 44 30,1 14 20,9
Started fallowing 101 58,0 51 34,9 14 20,9
Started animal husbandry 29 16,7 37 25,3 15 22,4
Selling animals 30 17,2 41 28,1 25 37,3
Started orchard 20 11,5 24 16,4 18 26,9
Started working in non-
agricultural sector 41 23,6 34 23,3 13 19,4
Table B-30. Share of Climate Change in Permanent Migration
Cihanbeyli Karapınar Seydişehir
# % # % # %
Less than 25% 20 24,7 41 53,2 12 48,0
25%- 50% 38 46,9 21 27,3 9 36,0
51%- 75% 14 17,3 13 16,9 3 12,0
More than 76% 8 9,9 2 2,6 1 4,0
Completely 1 1,2 0 0,0 0 0,0
TOTAL 81 100 77 100 25 100
Table B-31. Share of Climate Change in Temporary Migration
Cihanbeyli Karapınar Seydişehir
# % # % # %
Less than 25% 35 49,3 35 66,0 12 66,7
25%- 50% 28 39,4 13 24,5 3 16,7
51%- 75% 7 9,9 3 5,7 1 5,6
More than 76% 1 1,4 2 3,8 2 11,0
Completely 0 0,0 0 0,0 0 0,0
TOTAL 71 100 53 100 18 100

149
CURRICULUM VITAE
PERSONAL INFORMATION
Surname, Name : Kuş, Melike
Nationality : Turkish (TC)
Date and Place of Birth : 15 September 1979, Antalya
Phone : +90 507 380 96 60
E-mail : [email protected]
EDUCATION
Degree Institution Year of Graduation
MS Hacettepe Environmental Engineering 2011
MS Southampton Environmental Assessment 2009
BS METU City and Regional Planning 2002
High School Karatay High School, Antalya 1997
WORK EXPERIENCE
Year Place Enrollment
2013-Present Nature Conservation Centre Programme Coordinator
2011 Dec FutureCamp Turkey Carbon Reduction Consultant
2011 May University of Southampton Environmental Consultant
2008 Sept TÇT Environmental Technologies Environmental Consultant
2007 April Alter International Environmental Consultant
FOREIGN LANGUAGES
Advanced English
PUBLICATIONS
1. Büyük, G., Kırpık, M., Çelik, A., Kuş, M., Akça, E., Zeydanlı, U. (2017).
Adıyaman İlinin Hayvansal Atık Kaynaklı Vermikompost Üretim Potansiyeli,
ADYÜTAYAM, 5(2), 31-37

150
2. Kus, M., Akan, P., Koksal, M. A., & Gullu, G. (2017). Determining residential
energy consumption-based CO2 emissions and examining the factors affecting the
variation in Ankara, Turkey. International conference on advances in energy systems
and environmental engineering (ASEE17). Wroclaw, Poland. DOI:
10.1051/e3sconf/20172200094
3. Kuş, M., Ülgen, H., Güneş, Y., Kırış, R., Özel, A., & Zeydanlı, U. S. (2017).
Carbon Certification of Afforestation and Reforestation Areas in Turkey. Carbon
Management, Technologies, and Trends in Mediterranean Ecosystems (s. 131-137).
Springer. doi:10.1007/978-3-319-45035-3_9
4. Akça, E., Çullu, M. A., Kuş, M., & Zeydanlı, U. (2016). Night Irrigation:
Learning from Traditions for Efficient Water Use in Semi-Arid Region, Southeast
Turkey. EUROSOIL. İstanbul.
5. Kuş, M. (2016). Sürdürülebilir Arazi Yönetiminde “İş Dünyası-Sivil Toplum-
Devlet” İşbirliği Modeli. ECOIQ, s. 110-113.
6. Maddox, P.; Doran, C.; Williams, I.D. and Kus, M. (2011), The role of
intergenerational influence in waste education programmes: the THAW Project,
Waste Management, 31(12), 2590-2600, doi:10.1016/j.wasman.2011.07.023.ISSN:
0956-053X, WOS:000297485700026
7. Kus, M. (2011), Evaluation of biomass potential of Turkey within the frame of
carbon financing, 17th International Energy and Environment Fair and Conference
Proceedings Book, (pp. 198-201), Istanbul.
8. Kus, M. (2011), Energy generation from biomass and carbon financing,
Renewable Energy Resources, Biomass Workshop and Exposition Proceedings Book,
(pp. 84-88), Bursa.