eli lilly and company 2016 financial report
TRANSCRIPT

ELI LILLY AND COMPANY2016 FINANCIAL REPORT
NOTICE OF 2017 ANNUAL MEETINGPROXY STATEMENT

2012
12.5% 14.1%
7.5%
6.8%
6.8%
27.8% 29.5%
18.5%
16.1%
13.7%
2013 2014 2015 2016
Return on Assets (ROA) Return on Shareholders’ Equity (ROE)
ELI LILLY AND COMPANY AND SUBSIDIARIES (Dollars in millions, except per-share data)
2016 2015 Change %
REVENUE $ 21,222.1 $ 19,958.7 6
RESEARCH AND DEVELOPMENT 5,243.9 4,796.4 9
RESEARCH AND DEVELOPMENT AS A PERCENT OF REVENUE 24.7% 24.0%
NET INCOME $ 2,737.6 $ 2,408.4 14
EARNINGS PER SHARE—DILUTED 2.58 2.26 14
RECONCILING ITEMS1:
Venezuela devaluation charge 0.19 —
Novartis Animal Health inventory step-up — 0.10
Amortization of intangible assets 0.44 0.39
Acquired in-process research and development 0.02 0.33
Asset impairment, restructuring, and other special charges 0.29 0.25
Net charge related to repurchase of debt — 0.09
NON-GAAP EARNINGS PER SHARE—DILUTED2 3.52 3.43 3
DIVIDENDS PAID PER SHARE 2.04 2.00
CAPITAL EXPENDITURES 1,037.0 1,066.2 (3)
EMPLOYEES 41,975 41,275 2
1. For more information on these reconciling items, see the Financial Results section of the Executive Overview on page F23 of the Financial Report. 2. Numbers may not add due to rounding.
Revenue Growth Across Therapeutic Areas
($ MILLIONS, PERCENT GROWTH)
Return on Assets andShareholders’ Equity
Total ShareholderReturn
ROE increased in 2016 as a result of an increase of net income mainly due to higher sales for Trulicity and other new pharmaceutical products
and lower acquired in-process research and development charges.Revenue in Endocrinology increased 15 percent primarily driven by growth of Trulicity, Forteo, Jardiance, Trajenta, and Basaglar.
Oncology grew 6 percent primarily due to higher volumes for Cyramza and Erbitux, partially offset by lower volumes for Alimta,
and Cardiovascular grew 5 percent mostly due to higher realized price for Cialis. Revenue in Neuroscience decreased 7 percent driven by lower
volumes for Zyprexa and Cymbalta due to loss of patent protection.
Over the past five years, Lilly’s annualized total shareholder return has averaged 17 percent, compared to 15 percent for the S&P benchmark,
due to the increase in the stock price and steady dividend stream.
2016 Financial HighlightsYear Ended December 31
Endocrinology
Cardiovascular
Neuroscience
Animal Health
Oncology
Other
$8,082.8+15%
$2,720.3-7%
$3,721.8+6%
$3,225.4+5%
$3,158.2-1%
$313.6+38%
Lilly S&P 500
2012 2013 2014 2015
24.0%
7.2%
-10.4
%
25.4%
39.8%
16.3%
32.4%
12.0%
1.4%
13.7%
2016

Table of Contents
YEAR IN REVIEW2016 Financial Highlights .....................................................................................Inside front coverCorporate Information ..........................................................................................Inside back cover
FINANCIAL REPORTForward-Looking Statements ...................................................................................................... F1Business........................................................................................................................................ F2Risk Factors ................................................................................................................................ F16Management’s Discussion and Analysis of Results of Operations and Financial Condition......F22Consolidated Statements of Operations .................................................................................... F44Consolidated Statements of Comprehensive Income ................................................................ F45Consolidated Balance Sheets ..................................................................................................... F46Consolidated Statements of Shareholders’ Equity..................................................................... F47Consolidated Statements of Cash Flows .................................................................................... F48Notes to Consolidated Financial Statements ............................................................................. F49Management’s Reports ............................................................................................................... F98Reports of Independent Registered Public Accounting Firm ................................................... F100Selected Financial Data ............................................................................................................ F102Trademarks Used in this Report ............................................................................................... F104
PROXYNotice of Annual Meeting of Shareholders ..................................................................................P1Proxy Statement Summary ...........................................................................................................P2Governance ...................................................................................................................................P9Ownership of Company Stock .....................................................................................................P32Compensation .............................................................................................................................P33Audit Matters ..............................................................................................................................P59Directors’ Deferral Plan ..............................................................................................................P62Shareholder Proposals ...............................................................................................................P64Other Information .......................................................................................................................P66Appendix A ..................................................................................................................................P70Appendix B ..................................................................................................................................P72Annual Meeting Admission Ticket ..............................................................................................P88

1
Forward-Looking StatementsThis Annual Report includes forward-looking statements within the meaning of Section 27A of the Securities Act of 1933 and Section 21E of the Securities Exchange Act of 1934 (Exchange Act). Forward-looking statements include all statements that do not relate solely to historical or current facts, and can generally be identified by the use of words such as “may,” “believe,” “will,” “expect,” “project,” “estimate,” “intend,” “anticipate,” “plan,” “continue,” or similar expressions.
In particular, information appearing under “Business,” “Risk Factors” and “Management's Discussion and Analysis of Financial Condition and Results of Operations” includes forward-looking statements. Forward-looking statements inherently involve many risks and uncertainties that could cause actual results to differ materially from those projected in these statements. Where, in any forward-looking statement, we express an expectation or belief as to future results or events, it is based on management's current plans and expectations, expressed in good faith and believed to have a reasonable basis. However, we can give no assurance that any such expectation or belief will result or will be achieved or accomplished. The following include some but not all of the factors that could cause actual results or events to differ materially from those anticipated:
• the timing of anticipated regulatory approvals and launches of new products;• market uptake of recently launched products;• competitive developments affecting current products;• the expiration of intellectual property protection for certain of our products;• our ability to protect and enforce patents and other intellectual property;• the impact of actions of governmental and private payers affecting pricing of, reimbursement for, and
access to pharmaceuticals;• regulatory compliance problems or government investigations;• regulatory actions regarding currently marketed products;• unexpected safety or efficacy concerns associated with our products;• issues with product supply stemming from manufacturing difficulties or disruptions;• regulatory changes or other developments;• changes in patent law or regulations related to data-package exclusivity;• litigation involving past, current, or future products as we are largely self-insured;• unauthorized disclosure or misappropriation of trade secrets or other confidential data stored in our
information systems, networks, and facilities, or those of third parties with whom we share our data;• changes in tax law;• changes in foreign currency exchange rates, interest rates, and inflation;• asset impairments and restructuring charges;• changes in accounting standards promulgated by the Financial Accounting Standards Board and the
Securities and Exchange Commission;• acquisitions and business development transactions and related integration costs; • information technology system inadequacies or operating failures;• reliance on third-party relationships and outsourcing arrangements; and• the impact of global macroeconomic conditions.
Investors should not place undue reliance on forward-looking statements. You should carefully read the factors described in the “Risk Factors” section of this Annual Report for a description of certain risks that could, among other things, cause our actual results to differ from these forward-looking statements.
All forward-looking statements speak only as of the date of this report and are expressly qualified in their entirety by the cautionary statements included in this report. Except as is required by law, we expressly disclaim any obligation to publicly release any revisions to forward-looking statements to reflect events after the date of this report.
FINAN
CIAL
REPO
RT
F1

FINANCIAL REPORT
F22
BusinessEli Lilly and Company (the “company” or “registrant” or "Lilly") was incorporated in 1901 in Indiana to succeed to the drug manufacturing business founded in Indianapolis, Indiana, in 1876 by Colonel Eli Lilly. We discover, develop, manufacture, and market products in two business segments—human pharmaceutical products and animal health products.
The mission of our human pharmaceutical business is to make medicines that help people live longer, healthier, more active lives. Our vision is to make a significant contribution to humanity by improving global health in the 21st century. Most of the products we sell today were discovered or developed by our own scientists, and our success depends to a great extent on our ability to continue to discover, develop, and bring to market innovative new medicines.
Our animal health business, operating through our Elanco division, develops, manufactures, and markets products for both food animals and companion animals. Elanco food animal products help the food industry produce an abundant supply of safe, nutritious and affordable food. Elanco companion animal products help pets live longer, healthier, happier lives.
We manufacture and distribute our products through facilities in the United States (U.S.), Puerto Rico, and 14 other countries. Our products are sold in approximately 125 countries.
Human Pharmaceutical Products
Our human pharmaceutical products include:
Endocrinology products, including:
• Humalog®, Humalog Mix 75/25®, and Humalog Mix 50/50™, insulin analogs for the treatment of diabetes
• Humulin®, human insulin of recombinant DNA origin for the treatment of diabetes
• Trulicity®, for the treatment of type 2 diabetes (approved in the U.S. and Europe in 2014 and Japan in 2015)
• Trajenta®, for the treatment of type 2 diabetes
• Jentadueto®, a combination tablet of linagliptin (Trajenta) and metformin hydrochloride for use in the treatment of type 2 diabetes
• Jardiance®, for the treatment of type 2 diabetes (approved in the U.S., Europe, and Japan in 2014, cardiovascular data included in the European label in 2016) and to reduce the risk of cardiovascular death in adult patients with type 2 diabetes and established cardiovascular disease (approved in the U.S. in 2016)
• Glyxambi®, a combination tablet of linagliptin and empagliflozin (Jardiance) for the treatment of type 2 diabetes (approved in the U.S. in 2015 and Europe in 2016)
• Synjardy®, a combination tablet of empagliflozin and metformin hydrochloride for the treatment of type 2 diabetes (approved in the U.S. and Europe in 2015), extended release formulation approved in the U.S. in 2016
• Basaglar® (insulin glargine injection), a long-acting human insulin analog for the treatment of diabetes (launched in the U.S. in 2016 and in Japan and Europe in 2015 under the trade name Abasaglar™)
• Forteo®, for the treatment of osteoporosis in postmenopausal women and men at high risk for fracture and for glucocorticoid-induced osteoporosis in men and postmenopausal women
• Evista®, for the prevention and treatment of osteoporosis in postmenopausal women and for the reduction of the risk of invasive breast cancer in postmenopausal women with osteoporosis and postmenopausal women at high risk for invasive breast cancer
• Humatrope®, for the treatment of human growth hormone deficiency and certain pediatric growth conditions

FINAN
CIAL
REPO
RT
F33
• Axiron®, a topical solution of testosterone, applied by underarm applicator, for replacement therapy in men for certain conditions associated with a deficiency or absence of testosterone
Neuroscience products, including:
• Cymbalta®, for the treatment of major depressive disorder, diabetic peripheral neuropathic pain, generalized anxiety disorder, fibromyalgia, and chronic musculoskeletal pain due to chronic low back pain or chronic pain due to osteoarthritis
• Zyprexa®, for the treatment of schizophrenia, acute mixed or manic episodes associated with bipolar I disorder, and bipolar maintenance
• Strattera®, for the treatment of attention-deficit hyperactivity disorder
• Prozac®, for the treatment of major depressive disorder, obsessive-compulsive disorder, bulimia nervosa, and panic disorder
• Amyvid®, a radioactive diagnostic agent for positron emission tomography (PET) imaging of beta-amyloid neuritic plaques in the brains of adult patients with cognitive impairment who are being evaluated for Alzheimer's disease and other causes of cognitive decline
Oncology products, including:
• Alimta®, for the first-line treatment, in combination with another agent, of advanced non-small cell lung cancer (NSCLC) for patients with non-squamous cell histology; for the second-line treatment of advanced non-squamous NSCLC; as monotherapy for the maintenance treatment of advanced non-squamous NSCLC in patients whose disease has not progressed immediately following chemotherapy treatment; and in combination with another agent, for the treatment of malignant pleural mesothelioma
• Erbitux®, indicated both as a single agent and with another chemotherapy agent for the treatment of certain types of colorectal cancers; and as a single agent, in combination with chemotherapy, or in combination with radiation therapy for the treatment of certain types of head and neck cancers
• Cyramza®, for the treatment of various cancers, with approvals as follows:
approved in 2014 in the U.S. and the European Union (EU), and in Japan in 2015, both as a single agent and in combination with another agent as a second-line treatment of advanced or metastatic gastric cancer
approved in 2014 in the U.S., and in the EU in 2016, in combination with another agent as a second-line treatment of metastatic NSCLC
approved in 2015 in the U.S., and in the EU in 2016, as a second-line treatment of metastatic colorectal cancer
• Gemzar®, for the treatment of pancreatic cancer; in combination with other agents, for the treatment of metastatic breast cancer, NSCLC, and advanced or recurrent ovarian cancer; and in the EU for the treatment of bladder cancer
• Portrazza®, approved in 2015 in the U.S. for use in combination with other agents as a first-line treatment of metastatic squamous NSCLC, and approved in 2016 in the EU for use in combination with other agents as a first-line treatment for epidermal growth factor receptor expressing squamous NSCLC
• Lartruvo™, approved in the U.S., and conditionally approved in the EU, in 2016 for use in combination with another agent for the treatment of soft tissue carcinoma
Immunology products, including:
• Olumiant®, approved in the EU in 2017 for the treatment of adults with moderately-to-severely active rheumatoid arthritis (RA)
• Taltz®, for the treatment of moderate-to-severe plaque psoriasis (approved the U.S. and EU in 2016) and psoriatic arthritis (approved in Japan in 2016)

FINANCIAL REPORT
F44
Cardiovascular products, including:
• Cialis®, for the treatment of erectile dysfunction and benign prostatic hyperplasia
• Effient®, for the reduction of thrombotic cardiovascular events (including stent thrombosis) in patients with acute coronary syndrome who are managed with an artery-opening procedure known as percutaneous coronary intervention (PCI), including patients undergoing angioplasty, atherectomy, or stent placement
Animal Health Products
Our products for food animals include:
• Rumensin®, a cattle feed additive that improves feed efficiency and growth and also controls and prevents coccidiosis
• Coban®, Maxiban®, and Monteban®, anticoccidial agents for use in poultry
• Posilac®, a protein supplement to improve milk productivity in dairy cows
• Optaflexx® and Paylean®, leanness and performance enhancers for cattle and swine, respectively
• Tylan®, an antibiotic used to control certain diseases in cattle, swine, and poultry
• Denagard®, an antibiotic for the control and treatment of respiratory and enteric diseases in swine and poultry
Our products for companion animals include:
• Trifexis®, a monthly chewable tablet for dogs that kills fleas, prevents flea infestations, prevents heartworm disease, and controls intestinal parasite infections
• Comfortis®, a chewable tablet that kills fleas and prevents flea infestations on dogs
On January 3, 2017 we completed the acquisition of Boehringer Ingelheim Vetmedica, Inc.'s U.S. feline, canine, and rabies vaccines portfolio—as well as a fully integrated manufacturing and research and development site and several pipeline assets—in an all-cash transaction for approximately $885 million, subject to final inventory quantities purchased and other adjustments. The acquisition diversifies Elanco's U.S. companion animal portfolio by adding vaccines for a range of common concerns such as bordetella, Lyme disease, rabies, and parvovirus. Acquired products include:
• Duramune® and Duramune® Ultra™, vaccines to prevent a variety of infectious diseases in dogs, including canine distemper
• Duramune Lyme®, a vaccine to prevent Lyme disease in dogs
• Bronchi-Shield®, a vaccine to prevent certain bronchial infections in dogs
• Fel-O-Vax®, ULTRA™ Fel-O-Vax®, and Fel-O-Guard®, vaccines to prevent a variety of infectious diseases in cats, including feline leukemia
• Rabvac®, a vaccine to prevent rabies in dogs, cats, and horses
Marketing
We sell most of our products worldwide. We adapt our marketing methods and product emphasis in various countries to meet local customer needs.
Human Pharmaceuticals—United States
In the U.S., we distribute human pharmaceutical products principally through independent wholesale distributors, with some sales directly to pharmacies. In 2016, 2015, and 2014, three wholesale distributors in the U.S.—McKesson Corporation, AmerisourceBergen Corporation, and Cardinal Health, Inc.—each accounted for between 8 percent and 17 percent of our consolidated total revenue. No other distributor accounted for more than 10 percent of consolidated total revenue in any of those years.

FINAN
CIAL
REPO
RT
F55
We promote our major human pharmaceutical products in the U.S. through sales representatives who call upon physicians and other health care professionals. We advertise in medical journals, distribute literature and samples of certain products to physicians, and exhibit at medical meetings. In addition, we advertise certain products directly to consumers in the U.S., and we maintain websites with information about our major products. We supplement our employee sales force with contract sales organizations as appropriate to leverage our own resources and the strengths of our partners in various markets.
We maintain special business groups to service wholesalers, pharmacy benefit managers, managed care organizations, government and long-term care institutions, hospitals, and certain retail pharmacies. We enter into arrangements with these organizations providing for discounts or rebates on our products.
Human Pharmaceuticals—Outside the United States
Outside the U.S, we promote our human pharmaceutical products primarily through sales representatives. While the products marketed vary from country to country, endocrinology products constitute the largest single group in consolidated revenue. Distribution patterns vary from country to country. In most countries in which we operate, we maintain our own sales organizations, but in some smaller countries we market our products through independent distributors.
Human Pharmaceutical Marketing Collaborations
Certain of our human pharmaceutical products are marketed in arrangements with other pharmaceutical companies, including the following:
• We and Boehringer Ingelheim have a diabetes alliance under which we jointly develop and commercialize Trajenta, Jentadueto, Jardiance, Glyxambi, Synjardy, and Basaglar in major markets.
• We co-promote Cymbalta in Japan with Shionogi & Co. Ltd.
• Through September 30, 2015, Erbitux was marketed in the U.S. and Canada by Bristol-Myers Squibb Company and E.R. Squibb (collectively, BMS). Effective October 1, 2015, BMS transferred to us all commercialization rights for Erbitux in those two countries. Outside the U.S. and Canada, Erbitux is commercialized by Merck KGaA, and we receive royalties from Merck KGaA.
• Effient is co-promoted with us by Daiichi Sankyo Co., Ltd. (Daiichi Sankyo) in the U.S., Brazil, Mexico, and certain other countries. Through the end of 2015, we also co-promoted Effient with Daiichi Sankyo in major European markets. Effective January 2016, Daiichi Sankyo has been exclusively promoting Effient in major European markets; however, the economic results for these countries will continue to be shared in the same proportion as under the previous arrangement. We retain sole marketing rights in Canada, Australia, Russia, and certain other countries. Daiichi Sankyo retains sole marketing rights in Japan and certain other countries.
For additional information, see "Financial Statements and Supplementary Data—Note 4, Collaborations and Other Arrangements."
Animal Health Products
Our Elanco animal health business unit employs field salespeople throughout the U.S. and has an extensive sales force outside the U.S. Elanco sells its products primarily to wholesale distributors. Elanco promotes its products primarily to producers and veterinarians for food animal products and to veterinarians for companion animal products. Elanco also advertises certain companion animal products directly to pet owners in markets where it is consistent with allowable promotional practices.

FINANCIAL REPORT
F66
Competition
Our human pharmaceutical products compete globally with products of many other companies in highly competitive markets. Our animal health products compete globally with products of animal health care companies as well as pharmaceutical, chemical, and other companies that operate animal health businesses.
Important competitive factors for both human pharmaceutical and animal health products include effectiveness, safety, and ease of use; price and demonstrated cost-effectiveness; marketing effectiveness; and research and development of new products, processes, and uses. Most new products that we introduce must compete with other branded or generic products already on the market or products that are later developed by competitors. If competitors introduce new products or delivery systems with therapeutic or cost advantages, our products can be subject to decreased sales, progressive price reductions, or both.
We believe our long-term competitive success depends upon discovering and developing (either alone or in collaboration with others) or acquiring innovative, cost-effective human pharmaceutical and animal health products that provide improved outcomes and deliver value to payers, and continuously improving the productivity of our operations in a highly competitive environment. There can be no assurance that our efforts will result in commercially successful products, and it is possible that our products will be or become uncompetitive from time to time as a result of products developed by our competitors.
Generic Pharmaceuticals
One of the biggest competitive challenges we face is from generic pharmaceuticals. In the U.S. and the EU, the regulatory approval process for human pharmaceuticals (other than biological products (biologics)) exempts generics from costly and time-consuming clinical trials to demonstrate their safety and efficacy, allowing generic manufacturers to rely on the safety and efficacy of the innovator product. Therefore, generic manufacturers generally invest far less than we do in research and development and can price their products much lower than our branded products. Accordingly, when a branded non-biologic human pharmaceutical loses its market exclusivity, it normally faces intense price competition from generic forms of the product. Public and private payers typically encourage the use of generics as alternatives to brand-name drugs in their healthcare programs. Laws in the U.S. generally allow, and in many cases require, pharmacists to substitute generic drugs that have been rated under government procedures to be essentially equivalent to a brand-name drug. Where substitution is mandatory, it must be made unless the prescribing physician expressly forbids it. In many countries outside the U.S., intellectual property protection is weak, and we must compete with generic or counterfeit versions of our products. Many of our animal health products also compete with generics.
Biosimilars
Several of our current products, including Cyramza, Erbitux, Trulicity, Portrazza, and Taltz, and many of the new molecular entities (NMEs) in our research pipeline are biologics. Competition for Lilly’s biologics may be affected by the approval of follow-on biologics, also known as biosimilars. A biosimilar is a subsequent version of an an approved innovator biologic that, due to its physical/structural similarity to the original product, is approved based on an abbreviated data package that relies in part on the full testing required of the originator product. Globally, governments have or are developing regulatory pathways to approve biosimilars as alternatives to innovator-developed biologics, but the patent for the existing, branded product must expire in a given market before biosimilars may enter that market. The extent to which a biosimilar, once approved, will be substituted for the innovator biologic in a way that is similar to traditional generic substitution for non-biologic products, is not yet entirely clear, and will depend on a number of regulatory and marketplace factors that are still developing.
Biosimilars may present both competitive challenges and opportunities. For example, with our partner Boehringer Ingelheim, we developed Basaglar, a new insulin glargine product which has the same amino acid sequence as the product currently marketed by a competitor. This product has launched as a follow-on biologic in the U.S., and as a biosimilar in the EU, and Japan.

FINAN
CIAL
REPO
RT
F77
U.S. Private Sector Payer Consolidation
In the U.S. private sector, consolidation and integration among healthcare providers is also a major factor in the competitive marketplace for human pharmaceuticals. Health plans and pharmaceutical benefit managers have been consolidating into fewer, larger entities, thus enhancing their purchasing strength and importance.
Payers typically maintain formularies which specify coverage (the conditions under which drugs are included on a plan's formulary) and reimbursement (the associated out-of-pocket cost to the consumer). Formulary placement can lead to reduced usage of a drug for the relevant patient population due to coverage restrictions, such as prior authorizations and formulary exclusions, or due to reimbursement limitations which result in higher consumer out-of-pocket cost, such as non-preferred co-pay tiers, increased co-insurance levels, and higher deductibles. Consequently, pharmaceutical companies compete for formulary placement not only on the basis of product attributes such as efficacy, safety profile, or patient ease of use, but also by providing rebates. Price is an increasingly important factor in formulary decisions, particularly in treatment areas in which the payer has taken the position that multiple branded products are therapeutically comparable. These downward pricing pressures could negatively affect our future consolidated results of operations.
Patents, Trademarks, and Other Intellectual Property Rights
Overview
Intellectual property protection is critical to our ability to successfully commercialize our life sciences innovations and invest in the search for new medicines. We own, have applied for, or are licensed under, a large number of patents in the U.S. and many other countries relating to products, product uses, formulations, and manufacturing processes. In addition, as discussed below, for some products we have additional effective intellectual property protection in the form of data protection under pharmaceutical regulatory laws.
The patent protection anticipated to be of most relevance to human pharmaceuticals is provided by national patents claiming the active ingredient (the compound patent), particularly those in major markets such as the U.S., various European countries, and Japan. These patents may be issued based upon the filing of international patent applications, usually filed under the Patent Cooperation Treaty (PCT). Patent applications covering the compounds are generally filed during the Discovery Research Phase of the drug discovery process, which is described in the “Research and Development” section below. In general, national patents in each relevant country are available for a period of 20 years from the filing date of the PCT application, which is often years prior to the launch of a commercial product. Further patent term adjustments and restorations may extend the original patent term:
• Patent term adjustment is a statutory right available to all U.S. patent applicants to provide relief in the event that a patent is delayed during examination by the United States Patent and Trademark Office (USPTO).
• Patent term restoration is a statutory right provided to U.S. patents that claim inventions subject to review by the U.S. Food and Drug Administration (FDA). A single patent for a human pharmaceutical product may be eligible for patent term restoration to make up for a portion of the time invested in clinical trials and the FDA review process. Patent term restoration is limited by a formula and cannot be calculated until product approval due to uncertainty about the duration of clinical trials and the time it takes the FDA to review an application. There is a five-year cap on any restoration, and no patent may be extended for more than 14 years beyond FDA approval. Some countries outside the U.S. also offer forms of patent term restoration. For example, Supplementary Protection Certificates are sometimes available to extend the life of a European patent up to an additional five years. Similarly, in Japan, Korea, and Australia, patent terms can be extended up to five years, depending on the length of regulatory review and other factors.

FINANCIAL REPORT
F88
Loss of effective patent protection for human pharmaceuticals typically results in the loss of effective market exclusivity for the product, which often results in severe and rapid decline in revenues for the product. However, in some cases the innovator company may be protected from approval of generic or other follow-on versions of a new medicine beyond the expiration of the compound patent through manufacturing trade secrets, later-expiring patents on methods of use or formulations, or data protection that may be available under pharmaceutical regulatory laws. The primary forms of data protection are as follows:
• Regulatory authorities in major markets generally grant data package protection for a period of years following new drug approvals in recognition of the substantial investment required to complete clinical trials. Data package protection prohibits other manufacturers from submitting regulatory applications for marketing approval based on the innovator company’s regulatory submission data for the drug. The base period of data package protection depends on the country. For example, the period is five years in the U.S. (12 years for new biologics as described below), 10 years in the EU, and eight years in Japan. The period begins on the date of product approval and runs concurrently with the patent term for any relevant patent.
• Under the Biologics Price Competition and Innovation Act of 2010, the FDA has the authority to approve biosimilars. A competitor seeking approval of a biosimilar must file an application to show its molecule is highly similar to an approved innovator biologic and include a certain amount of safety and efficacy data which the FDA will determine on a case-by-case basis. Under the data protection provisions of this law, the FDA cannot approve a biosimilar application until 12 years after initial marketing approval of the innovator biologic, subject to certain conditions.
• In the U.S., the FDA has the authority to grant additional data protection for approved drugs where the sponsor conducts specified testing in pediatric or adolescent populations within a specified time period. If granted, this “pediatric exclusivity” provides an additional six months of exclusivity, which is added to the term of data protection as well as to the term of any relevant patents, to the extent these protections have not already expired. While the term of the pediatric exclusivity attaches to the term of any relevant patent, pediatric exclusivity is a regulatory exclusivity, a bar to generic approval, not a patent right.
• Under the U.S. orphan drug law, a specific use of a drug or biologic can receive "orphan" designation if it is intended to treat a disease or condition affecting fewer than 200,000 people in the U.S., or affecting more than 200,000 people but not reasonably expected to recover its development and marketing costs through U.S. sales. Among other benefits, orphan designation entitles the particular use of the drug to seven years of market exclusivity, meaning that the FDA cannot (with limited exceptions) approve another marketing application for the same drug for the same indication until expiration of the seven-year period. Unlike pediatric exclusivity, the orphan exclusivity period is independent of and runs in parallel with any applicable patents.
Outside the major markets, the adequacy and effectiveness of intellectual property protection for human pharmaceuticals varies widely, and in a number of these markets we are unable to patent our products or to enforce the patents we receive for our products. Under the Trade-Related Aspects of Intellectual Property Agreement (TRIPs) administered by the World Trade Organization, more than 140 countries have agreed to provide non-discriminatory protection for most pharmaceutical inventions and to assure that adequate and effective rights are available to patent owners. Implementation of this agreement differs between developed and developing countries, with many developing countries limiting protection for biopharmaceutical products under their interpretation of “flexibilities” allowed under the agreement. Thus, certain types of patents, such as those on new uses of compounds or new forms of molecules, are not available in many developing countries. Further, many developing countries, and some developed countries, do not provide effective data package protection even though it is specified in TRIPs.
Certain of our Elanco animal health products are covered by patents or other forms of intellectual property protection. Historically, upon loss of effective market exclusivity for our animal health products, we have not generally experienced the rapid and severe declines in revenues that are common in the human pharmaceutical segment.

FINAN
CIAL
REPO
RT
F99
There is no assurance that the patents we are seeking will be granted or that the patents we hold will be found valid and enforceable if challenged. Moreover, patents relating to particular products, uses, formulations, or processes do not preclude other manufacturers from employing alternative processes or marketing alternative products or formulations that compete with our patented products. In addition, competitors or other third parties may assert claims that our activities infringe patents or other intellectual property rights held by them, or allege a third-party right of ownership in our existing intellectual property.
Our Intellectual Property Portfolio
We consider intellectual property protection for certain products, processes, uses, and formulations—particularly with respect to those products discussed below—to be important to our operations. For many of our products, in addition to the compound patent, we hold other patents on manufacturing processes, formulations, or uses that may extend exclusivity beyond the expiration of the compound patent.
The most relevant U.S. patent protection or data protection for our top-selling or recently launched patent-protected marketed products is as follows:
• Alimta is protected by a vitamin regimen patent (2021) plus pediatric exclusivity (2022).
• Cialis is protected by compound and use patents (November 2017).
• Cyramza is protected by biologics data package protection (2026).
• Effient is protected by a compound patent (April 2017) plus pediatric exclusivity (October 2017) and patents covering methods of using Effient with aspirin (2023), although the method patents were held unpatentable in an inter partes review and we are appealing those decisions (for further information see "Financial Statements and Supplementary Data—Note 15, Contingencies").
• Forteo is protected by patents primarily covering its formulation and related processes (December 2018) and use patents (August 2019).
• Jardiance, and the related combination products Glyxambi and Synjardy, are protected by ---a compound patent (2025 not including possible patent extension).
• Lartruvo is protected by a compound patent (2027, not including possible patent extension) and by biologics data package protection (2028).
• Portrazza is protected by a compound patent (2025 not including possible patent extension), and by biologics data package protection (2027).
• Strattera is protected by a patent covering its use in treating attention deficit-hyperactivity disorder (2016) plus pediatric exclusivity (May 2017).
• Taltz is protected by a compound patent (2026 not including possible patent extension) and by biologic data package protection (2028).
• Trajenta and Jentadueto are protected by a compound patent (2023), and Boehringer Ingelheim has applied for a patent extension to 2025 under the patent restoration laws.
• Trulicity is protected by a compound patent (2024 not including possible patent extension) and by biologics data package protection (2026).

FINANCIAL REPORT
F1010
Outside the U.S., important patent protection or data protection includes:
• Alimta in major European countries (vitamin regimen patent 2021) and Japan (patents covering use to treat cancer concomitantly with vitamins 2021)
• Cialis in major European countries (compound patent November 2017)
• Cymbalta in Japan (data package protection January 2018)
• Forteo in Japan (data package protection July 2018; patent covering its formulation and related process August 2019).
• Lartruvo in major European countries (compound patent and data package protection 2026, not including possible patent extension)
• Olumiant® in major European countries (compound patent 2029, not including possible patent extension)
• Taltz in major European countries (compound patent and data package protection 2026, not including possible patent extension)
Baricitinib (Olumiant), has been submitted for regulatory review in the U.S. and Japan and is protected by a compound patent in the U.S. and Japan until 2030 (not including possible patent extension) and 2029 (not including possible patent extension), respectively. Additional information about this molecule is provided in "Management’s Discussion and Analysis—Executive Overview—Late-Stage Pipeline.”
Worldwide, we sell all of our major products under trademarks that we consider in the aggregate to be important to our operations. Trademark protection varies throughout the world, with protection continuing in some countries as long as the mark is used, and in other countries as long as it is registered. Registrations are normally for fixed but renewable terms.
Patent Licenses
Most of our major products are not subject to significant license agreements. The compound patent for Cialis is the subject of a license agreement with GlaxoSmithKline (Glaxo), which assigns to us exclusively all rights in the compound. The agreement calls for royalties of a single-digit percentage of net sales. The agreement is not subject to termination by Glaxo for any reason other than a material breach by Lilly of the royalty obligation, after a substantial cure period.
Patent Challenges
In the U.S., the Drug Price Competition and Patent Term Restoration Act of 1984, commonly known as the Hatch-Waxman Act, authorizes the FDA to approve generic versions of innovative human pharmaceuticals (other than biologics) without completion of safety and efficacy studies, i.e., a complete New Drug Application (NDA) by filing an Abbreviated New Drug Application (ANDA). In an ANDA, the generic manufacturer must demonstrate only “bioequivalence” between the generic version and the NDA-approved drug—not safety and efficacy. Establishing bioequivalence is generally straightforward and inexpensive for the generic company.
Absent a patent challenge, the FDA cannot approve an ANDA until after the innovator’s patents expire. However, after the innovator has marketed its product for four years, a generic manufacturer may file an ANDA alleging that one or more of the patents listed in the innovator’s NDA are invalid or not infringed. This allegation is commonly known as a “Paragraph IV certification.” The innovator must then file suit against the generic manufacturer to protect its patents. The FDA is then prohibited from approving the generic company’s application for a 30-month period (which can be shortened or extended by the trial court judge hearing the patent challenge). If one or more of the NDA-listed patents are challenged, the first filer(s) of a Paragraph IV certification may be entitled to a 180-day period of market exclusivity over all other generic manufacturers.
Generic manufacturers use Paragraph IV certifications extensively to challenge patents on innovative human pharmaceuticals. In addition, generic companies have shown willingness to launch “at risk,” i.e., after receiving ANDA approval but before final resolution of their patent challenge. We are currently in litigation with numerous generic manufacturers in Hatch-Waxman litigation involving Forteo, Alimta, and Effient, among other products. For more information on Hatch-Waxman litigation involving the company, see “Financial Statements and Supplementary Data—Note 15, Contingencies.”

FINAN
CIAL
REPO
RT
F1111
In addition, there is a procedure in U.S. patent law known as inter partes review (IPR), which allows any member of the public to file a petition with the USPTO seeking the review of any issued U.S. patent. IPRs are conducted before Administrative Patent Judges in the USPTO using a lower standard of proof than used in federal district court. In addition, the challenged patents are not accorded the presumption of validity as they are in Federal District Court. We are now seeing instances where generic drug companies and some investment funds are attempting to invalidate our patents by filing IPR challenges in the USPTO. For more information, see “Financial Statements and Supplementary Data—Note 15, Contingencies.”
Outside the U.S., the legal doctrines and processes by which pharmaceutical patents can be challenged vary widely. In recent years, we have experienced an increase in patent challenges from generic manufacturers in many countries outside the U.S., and we expect this trend to continue. For more information on administrative challenges and litigation involving our Alimta patents in Europe and Japan, see “Financial Statements and Supplementary Data—Note 15, Contingencies.”
Government Regulation of Our Operations
Our operations are regulated extensively by numerous national, state, and local agencies. The lengthy process of laboratory and clinical testing, data analysis, manufacturing development, and regulatory review necessary for governmental approvals is extremely costly and can significantly delay product introductions. Promotion, marketing, manufacturing, and distribution of human pharmaceutical and animal health products are extensively regulated in all major world markets. We conduct extensive post-marketing surveillance of the safety of the products we sell. In addition, our operations are subject to complex federal, state, local, and foreign laws and regulations concerning the environment, occupational health and safety, and privacy. Animal health product regulations address the administration of the product in or on the animal, and in the case of food animal products, the impact on humans who consume the food as well as the impact on the environment at the production site. Compliance with the laws and regulations affecting the manufacture and sale of current products and the discovery, development, and introduction of new products will continue to require substantial effort, expense, and capital investment.
Of particular importance is the FDA in the U.S. Pursuant to the Federal Food, Drug, and Cosmetic Act, the FDA has jurisdiction over all of our human pharmaceutical products and certain animal health products in the U.S. and administers requirements covering the testing, safety, effectiveness, manufacturing, quality control, distribution, labeling, marketing, advertising, dissemination of information, and post-marketing surveillance of those products. The U.S. Department of Agriculture and the U.S. Environmental Protection Agency also regulate some animal health products.
The FDA extensively regulates all aspects of manufacturing quality for human pharmaceuticals under its current Good Manufacturing Practices (cGMP) regulations. Outside the U.S., our products and operations are subject to similar regulatory requirements, notably by the European Medicines Agency in the EU and the Ministry of Health, Labor and Welfare in Japan. Specific regulatory requirements vary from country to country. We make substantial investments of capital and operating expenses to implement comprehensive, company-wide quality systems in our manufacturing, product development, and process development operations to ensure sustained compliance with cGMP and similar regulations. However, in the event we fail to adhere to these requirements in the future, we could be subject to interruptions in production, fines and penalties, and delays in new product approvals. Certain of our products are manufactured by third parties, and their failure to comply with these regulations could adversely affect us through failure to supply product to us or delays in new product approvals.
The marketing, promotional, and pricing practices of human pharmaceutical manufacturers, as well as the manner in which manufacturers interact with purchasers and prescribers, are subject to various other U.S. federal and state laws, including the federal anti-kickback statute and the False Claims Act and state laws governing kickbacks, false claims, unfair trade practices, and consumer protection. These laws are administered by, among others, the Department of Justice (DOJ), the Office of Inspector General of the Department of Health and Human Services, the Federal Trade Commission, the Office of Personnel Management, and state attorneys general. Over the past several years, the FDA, the DOJ, and many of these other agencies have increased their enforcement activities with respect to pharmaceutical companies and increased the inter-agency coordination of enforcement activities. Several claims brought by these agencies against Lilly and other companies under these and other laws have resulted in corporate criminal sanctions and very substantial civil settlements.

FINANCIAL REPORT
F1212
The U.S. Foreign Corrupt Practices Act of 1977 (FCPA) prohibits certain individuals and entities, including U.S. publicly traded companies, from promising, offering, or giving anything of value to foreign officials with the corrupt intent of influencing the foreign official for the purpose of helping the company obtain or retain business or gain any improper advantage. The FCPA also imposes specific recordkeeping and internal controls requirements on U.S. publicly traded companies. As noted above, outside the U.S., our business is heavily regulated and therefore involves significant interaction with foreign officials. Additionally, in many countries outside the U.S., the health care providers who prescribe human pharmaceuticals are employed by the government and the purchasers of human pharmaceuticals are government entities; therefore, our interactions with these prescribers and purchasers are subject to regulation under the FCPA.
In addition to the U.S. application and enforcement of the FCPA, the various jurisdictions in which we operate and supply our products have laws and regulations aimed at preventing and penalizing corrupt and anticompetitive behavior. In recent years, several jurisdictions, including China, Brazil, and the United Kingdom (U.K.), have enhanced their laws and regulations in this area, increased their enforcement activities, and/or increased the level of cross-border coordination and information sharing.
It is possible that we could become subject to additional administrative and legal proceedings and actions, which could include claims for civil penalties (including treble damages under the False Claims Act), criminal sanctions, and administrative remedies, including exclusion from U.S. federal and other health care programs. It is possible that an adverse outcome in future actions could have a material adverse impact on our consolidated results of operations, liquidity, and financial position.
Regulations and Private Payer Actions Affecting Human Pharmaceutical Pricing, Reimbursement, and Access
In the U.S., we are required to provide rebates to the federal government and respective state governments on their purchases of our human pharmaceuticals under state Medicaid and Medicaid Managed Care programs (minimum of 23.1 percent plus adjustments for price increases over time) and rebates to private payers who cover patients in certain types of health care facilities that serve low-income and uninsured patients (known as 340B facilities). No rebates are required at this time in the Medicare Part B (physician and hospital outpatient) program where reimbursement is set on an "average selling price plus 4.3 percent" formula. Drug manufacturers are required to provide a discount of 50 percent of the cost of branded prescription drugs for Medicare Part D participants who are in the “doughnut hole” (the coverage gap in Medicare prescription drug coverage). Additionally, an annual fee is imposed on pharmaceutical manufacturers and importers that sell branded prescription drugs to specified government programs.
Rebates are also negotiated in the private sector. We give rebates to private payers who provide prescription drug benefits to seniors covered by Medicare and to private payers who provide prescription drug benefits to their customers. These rebates are affected by the introduction of competitive products and generics in the same class.
In most international markets, we operate in an environment of government-mandated cost-containment programs, which may include price controls, international reference pricing (to other countries’ prices), discounts and rebates, therapeutic reference pricing (to other, often generic, pharmaceutical choices), restrictions on physician prescription levels, and mandatory generic substitution.
Globally, public and private payers are increasingly restricting access to human pharmaceuticals based on assessments of comparative effectiveness and value, including through the establishment of formal health technology assessment processes. In addition, third party organizations, including professional associations, academic institutions, and non-profit entities associated with payers, are conducting and publishing comparative effectiveness and cost/benefit analyses on medicines, the impact of which are uncertain at this time.
We cannot predict the extent to which our business may be affected by these or other potential future legislative, regulatory, or payer developments. However, in general we expect that state, federal, and international legislative and regulatory developments could have further negative effects on pricing and reimbursement for our human pharmaceutical products.

FINAN
CIAL
REPO
RT
F1313
Research and Development
Our commitment to research and development dates back more than 140 years. We invest heavily in research and development because we believe it is critical to our long-term competitiveness. At the end of 2016, we employed approximately 9,300 people in human pharmaceutical and animal health research and development activities, including a substantial number of physicians, scientists holding graduate or postgraduate degrees, and highly skilled technical personnel. Our research and development expenses were $5.24 billion in 2016, $4.80 billion in 2015, and $4.73 billion in 2014.
Our internal human pharmaceutical research focuses primarily on the areas of cancer, diabetes, neurodegeneration, immunology, and pain. We have a strong biotechnology research program, with more than half of our clinical-stage pipeline currently consisting of biologics. In addition to discovering and developing NMEs, we seek to expand the value of existing products through new uses, formulations, and therapeutic approaches that provide additional value to patients.
To supplement our internal efforts, we collaborate with others, including academic institutions and research-based pharmaceutical and biotechnology companies. We use the services of physicians, hospitals, medical schools, and other research organizations worldwide to conduct clinical trials to establish the safety and effectiveness of our human pharmaceutical products. We actively invest in external research and technologies that hold the promise to complement and strengthen our own efforts. These investments can take many forms, including licensing arrangements, co-development and co-marketing agreements, co-promotion arrangements, joint ventures, and acquisitions.
Our Elanco animal health innovation strategy is focused on identifying and developing promising technologies and potential products from internal and external sources to meet unmet veterinary needs. Our animal health scientists also leverage discoveries from our human health laboratories to develop products to enhance the health and wellbeing of farm animals and pets.
Human pharmaceutical development is time-consuming, expensive, and risky. On average, only one out of many thousands of molecules discovered by researchers ultimately becomes an approved medicine. The process from discovery to regulatory approval can take over a decade. Drug candidates can fail at any stage of the process, and even late-stage drug candidates sometimes fail to receive regulatory approval or achieve commercial success. After approval and launch of a product, we expend considerable resources on post-marketing surveillance and additional clinical studies to collect data and understand the benefits and potential risks of medicines as they are used as therapeutics. The following describes in more detail the research and development process for human pharmaceutical products:

FINANCIAL REPORT
F1414
Phases of New Drug Development
• Discovery Research Phase
The earliest phase of new drug research and development, the discovery phase, can take many years. Scientists identify, design, and synthesize promising molecules, screening tens of thousands of molecules for their effect on biological targets that appear to play an important role in one or more diseases. Targets can be part of the body, such as a protein, receptor, or gene; or foreign, such as a virus or bacteria. Some targets have been proven to affect disease processes, but often the target is unproven and may later prove to be irrelevant to the disease or to yield insufficient clinical benefit. Molecules that have the desired effect on the target and meet other design criteria become candidate molecules and move to the next phase of development. The probability of any one candidate molecule becoming a commercial product is extremely low.
• Early Development Phase
The early development phase involves refining candidate molecules, understanding how to manufacture them efficiently, and completing initial testing for safety and efficacy. Safety testing is done first in laboratory tests and animals as necessary, to identify toxicity and other potential safety issues that would preclude use in humans. In general, the first human tests (often referred to as Phase I) are conducted in small groups of healthy volunteers or patients to assess safety and find the potential dosing range. After a safe dose has been established, the drug is typically administered to small populations of patients (Phase II) to look for initial signs of efficacy in treating the targeted disease, or biomarkers of the disease, and to continue to assess safety. In parallel, scientists work to identify safe, effective, and economical manufacturing processes. Long-term animal studies continue to test for potential safety issues. Of the molecules that enter the early development phase, approximately 10 percent move on to the product phase. The early development phase can take several years to complete.
• Product Phase
Product phase (Phase III) molecules have already demonstrated safety and, typically, shown initial evidence of efficacy. As a result, these molecules generally have a higher likelihood of success. The molecules are tested in much larger patient populations to demonstrate efficacy to a predetermined level of statistical significance and to continue to develop the safety profile. These trials are generally global in nature and are designed to generate the data necessary to submit the molecule to regulatory agencies for marketing approval. The potential new drug is generally compared with existing competitive therapies, placebo, or both. The resulting data is compiled and may be submitted to regulatory agencies around the world. Phase III testing varies by disease state, but can often last from three to four years.
• Submission Phase
Once a molecule is submitted to regulatory agencies, the time to final marketing approval can vary from several months to several years, depending on variables such as the disease state, the strength and complexity of the data presented, the novelty of the target or compound, and the time required for the agency(ies) to evaluate the submission. There is no guarantee that a potential medicine will receive marketing approval, or that decisions on marketing approvals or indications will be consistent across geographic areas.
We believe our investments in research, both internally and in collaboration with others, have been rewarded by the large number of new molecules and new indications for existing molecules that we have in all stages of development. We currently have approximately 45 drug candidates across all stages of human testing and a larger number of projects in preclinical development. Among our new investigational molecules currently in the product phase of development or awaiting regulatory approval or launch are potential therapies for various cancers, Alzheimer’s disease, pain, migraine, rheumatoid arthritis, psoriatic arthritis, and severe hypoglycemia. We are studying many other drug candidates in the earlier stages of development in our chosen priority areas. We are also developing new uses, formulations, or delivery methods for many of these molecules as well as several currently marketed products. See "Management's Discussion and Analysis—Executive Overview—Late-Stage Pipeline," for more information on certain of our product candidates.

FINAN
CIAL
REPO
RT
F1515
Raw Materials and Product Supply
Most of the principal materials we use in our manufacturing operations are available from more than one source. However, we obtain certain raw materials primarily from only one source. In the event one of these suppliers was unable to provide the materials or product, we generally seek to maintain sufficient inventory to supply the market until an alternative source of supply can be implemented. However, in the event of an extended failure of a supplier, it is possible that we could experience an interruption in supply until we established new sources or, in some cases, implemented alternative processes.
The majority of our revenue comes from products produced in our own facilities. Our principal active ingredient manufacturing occurs at sites we own in the U.S., Ireland, Puerto Rico, and the U.K. Finishing operations, including formulation, filling, assembling, delivery device manufacturing, and packaging, take place at a number of sites throughout the world. We utilize third parties for certain active ingredient manufacturing and finishing operations.
We manage our supply chain (including our own facilities, contracted arrangements, and inventory) in a way that should allow us to meet all expected product demand while maintaining flexibility to reallocate manufacturing capacity to improve efficiency and respond to changes in supply and demand. To maintain a stable supply of our products, we use a variety of techniques including comprehensive quality systems, inventory management, and back-up sites.
However, human pharmaceutical and animal health production processes are complex, highly regulated, and vary widely from product to product. Shifting or adding manufacturing capacity can be a very lengthy process requiring significant capital expenditures, process modifications, and regulatory approvals. Accordingly, if we were to experience extended plant shutdowns at one of our own facilities, extended failure of a contract supplier, or extraordinary unplanned increases in demand, we could experience an interruption in supply of certain products or product shortages until production could be resumed or expanded.
Quality Assurance
Our success depends in great measure upon customer confidence in the quality of our products and in the integrity of the data that support their safety and effectiveness. Product quality arises from a total commitment to quality in all parts of our operations, including research and development, purchasing, facilities planning, manufacturing, distribution, and dissemination of information about our medicines.
Quality of production processes involves strict control of ingredients, equipment, facilities, manufacturing methods, packaging materials, and labeling. We perform tests at various stages of production processes and on the final product to assure that the product meets all regulatory requirements and Lilly internal standards. These tests may involve chemical and physical chemical analyses, microbiological testing, testing in animals, or a combination thereof. Additional assurance of quality is provided by corporate quality-assurance groups that audit and monitor all aspects of quality related to human pharmaceutical and animal health manufacturing procedures and systems in company operations and at third-party suppliers.

FINANCIAL REPORT
F1616
Risk FactorsIn addition to the other information contained in this Annual Report, the following risk factors should be considered carefully in evaluating our company. It is possible that our business, financial condition, liquidity, or results of operations could be materially adversely affected by any of these risks. Certain of these risks could also adversely affect the company's reputation.
• Pharmaceutical research and development is very costly and highly uncertain; we may not succeed in developing or acquiring commercially successful products sufficient in number or value to replace revenues of products that have lost or will soon lose intellectual property protection.
There are many difficulties and uncertainties inherent in human pharmaceutical research and development and the introduction of new products. There is a high rate of failure inherent in new drug discovery and development. To bring a drug from the discovery phase to market can take over a decade and often costs in excess of $2 billion (DiMasi JA, Grabowski HG, Hansen RA. Innovation in the pharmaceutical industry: new estimates of R&D costs, Journal of Health Economics 2016;47:20-33.). Failure can occur at any point in the process, including in later stages after substantial investment. As a result, most funds invested in research programs will not generate financial returns. New product candidates that appear promising in development may fail to reach the market or may have only limited commercial success because of efficacy or safety concerns, inability to obtain necessary regulatory approvals or payer reimbursement or coverage, limited scope of approved uses, difficulty or excessive costs to manufacture, or infringement of the patents or intellectual property rights of others. Regulatory agencies are establishing increasingly high hurdles for the efficacy and safety of new products; delays and uncertainties in drug approval processes can result in delays in product launches and lost market opportunity. In addition, it can be very difficult to predict revenue growth rates of new products.
We cannot state with certainty when or whether our products now under development will be approved or launched; whether, if initially granted, such approval will be maintained; whether we will be able to develop, license, or otherwise acquire additional product candidates or products; or whether our products, once launched, will be commercially successful. We must maintain a continuous flow of successful new products and successful new indications or brand extensions for existing products sufficient both to cover our substantial research and development costs and to replace revenues that are lost as profitable products lose intellectual property exclusivity or are displaced by competing products or therapies. Failure to do so in the short-term or long-term would have a material adverse effect on our business, results of operations, cash flows, financial position, and prospects. See “Management’s Discussion and Analysis—Executive Overview—Late-Stage Pipeline,” for more details.

FINAN
CIAL
REPO
RT
F1717
• We depend on products with intellectual property protection for most of our revenues, cash flows, and earnings; we have lost or will lose effective intellectual property protection for many of those products in the next several years, which has resulted and is likely to continue to result in rapid and severe declines in revenues.
A number of our top-selling human pharmaceutical products have recently lost, or will lose in the next several years, significant patent protection and/or data protection in the U.S. as well as key countries outside the U.S., as illustrated in the tables below:
Product
U.S. Revenues
(2016)($ in millions)
Percent of Worldwide Revenues
(2016) Patent / Data Protection - U.S.
Cialis $ 1,469.5 7% Compound and use patents November 2017Alimta 1,101.0 5% Vitamin regimen patent plus pediatric exclusivity 2022
Forteo 770.5 4% Formulation and related process patents December 2018;use patents August 2019
Strattera 534.9 3% Use patent plus pediatric exclusivity May 2017Effient 465.6 2% Compound patent plus pediatric exclusivity October 2017;
use patents 2023
Product
Revenues Outside U.S.
(2016)($ in millions)
Percent of Worldwide Revenues
(2016) Patent / Data Protection - Major Europe / Japan
Alimta $ 1,182.3 6% Major European countries: vitamin regimen patent 2021Japan: use patents to treat cancer concomitantly with vitamins 2021
Cialis 1,002.1 5% Major European countries: compound patent November 2017Forteo 729.4 3% Japan: data package protection July 2018; formulation and
related process patent August 2019Cymbalta 661.2 3% Japan: data package protection January 2018Zyprexa 655.5 3% No remaining patent protection
Certain other significant products no longer have effective exclusivity through patent protection or data protection. For non-biologic products, loss of exclusivity (whether by expiration or as a consequence of litigation) typically results in the entry of one or more generic competitors, leading to a rapid and severe decline in revenues, especially in the U.S. Historically, outside the U.S. the market penetration of generics following loss of exclusivity has not been as rapid or pervasive as in the U.S.; however, generic market penetration is increasing in many markets outside the U.S., including Japan, Europe, and many countries in the emerging markets. For biologic (such as Humalog, Humulin, Erbitux, Cyramza, Trulicity, and Taltz), loss of exclusivity may or may not result in the near-term entry of competitor versions (i.e., biosimilars) due to development timelines, manufacturing challenges, and/or uncertainties in the regulatory pathways for approval of the competitor versions. See “Management’s Discussion and Analysis—Executive Overview—Other Matters,” and "Business—Patents, Trademarks, and Other Intellectual Property Rights," for more details.

FINANCIAL REPORT
F1818
• Our long-term success depends on intellectual property protection; if our intellectual property rights are invalidated, circumvented, or weakened, our business will be adversely affected.
Our long-term success depends on our ability to continually discover, develop, and commercialize innovative new pharmaceutical products. Without strong intellectual property protection, we would be unable to generate the returns necessary to support the enormous investments in research and development and capital as well as other expenditures required to bring new drugs to the market.
Intellectual property protection varies throughout the world and is subject to change over time. In the U.S., the Hatch-Waxman Act provides generic companies powerful incentives to seek to invalidate our human pharmaceutical patents; as a result, we expect that our U.S. patents on major pharmaceutical products will continue to be routinely challenged in litigation and administrative proceedings, and may not be upheld. In addition, a new IPR process allows competitors to request review of issued patents by the USPTO without the protections of the Hatch-Waxman Act. As a result, our patents may be invalided via this review process. Although such a decision can be appealed to the courts, in certain circumstances a loss in such a proceeding could result in a competitor entering the market, while a win provides no precedential value -- the same patent can still be challenged by other competitors. We face many generic manufacturer challenges to our patents outside the U.S. as well. The entry of generic competitors typically results in rapid and severe declines in revenues. In addition, competitors or other third parties may claim that our activities infringe patents or other intellectual property rights held by them. If successful, such claims could result in our being unable to market a product in a particular territory or being required to pay damages for past infringement or royalties on future sales. See “Business—Patents, Trademarks, and Other Intellectual Property Rights” and "Financial Statements and Supplementary Data—Note 15, Contingencies," for more details.
• Our human pharmaceutical business is subject to increasing government price controls and other public and private restrictions on pricing, reimbursement, and access for our drugs, which could have a material adverse effect on our business.
Public and private payers are taking increasingly aggressive steps to control their expenditures for human pharmaceuticals by placing restrictions on pricing and reimbursement for, and patient access to, our medications. These pressures could negatively affect our future revenues and net income.
We expect pricing, reimbursement, and access pressures from both governments and private payers inside and outside the U.S. to become more severe. For more details, see “Business—Regulations and Private Payer Actions Affecting Human Pharmaceutical Pricing, Reimbursement, and Access” and “Management’s Discussion and Analysis—Executive Overview—Other Matters.”
• We face intense competition from multinational pharmaceutical companies, biotechnology companies, and lower-cost generic and biosimilar manufacturers, and such competition could have a material adverse effect on our business.
We compete with a large number of multinational pharmaceutical companies, biotechnology companies, and generic pharmaceutical companies. To compete successfully, we must continue to deliver to the market innovative, cost-effective products that meet important medical needs. Our product revenues can be adversely affected by the introduction by competitors of branded products that are perceived as superior by the marketplace, by generic or biosimilar versions of our branded products, and by generic or biosimilar versions of other products in the same therapeutic class as our branded products. Our revenues can also be adversely affected by treatment innovations that eliminate or minimize the need for treatment with our drugs. See “Business—Competition,” for more details.

FINAN
CIAL
REPO
RT
F1919
• Changes in foreign currency rates or devaluation of a foreign currency can materially affect our revenue, cost of sales, and operating expenses.
As a global company with substantial operations outside the U.S., we face foreign currency risk exposure from fluctuating currency exchange rates. While we manage a portion of these exposures through hedging and other risk management techniques, significant fluctuations in currency rates can have a material impact, either positive or negative, on our revenue, cost of sales, and operating expenses. In the event of an extreme devaluation of local currency, the price of our products could become unsustainable in the relevant market. See “Management’s Discussion and Analysis—Financial Condition” for more details.
• Unanticipated changes in our tax rates or exposure to additional tax liabilities could increase our income taxes and decrease our net income.
We are subject to income taxes in the U.S. and numerous foreign jurisdictions. Changes in the relevant tax laws, regulations, administrative practices, principles, and interpretations could adversely affect our future effective tax rates. The U.S. and a number of other countries are actively considering or enacting changes in this regard. Changes to key elements of the U.S. or international tax framework could have a material adverse effect on our consolidated operating results and cash flows. See “Management’s Discussion and Analysis—Executive Overview—Other Matters” and "Financial Statements and Supplementary Data—Note 13, Income Taxes," for more details.
• Failure, inadequacy, or breach of our information technology systems, infrastructure, and business information could result in material harm to our business and reputation.
A great deal of confidential information owned by both us and our alliances is stored in our information systems, networks, and facilities or those of third parties. This includes valuable trade secrets and intellectual property, corporate strategic plans, marketing plans, customer information, and personally identifiable information, such as employee and patient information (collectively, “confidential information”). We also rely to a large extent on the efficient and uninterrupted operation of complex information technology systems and infrastructure (together “IT systems”), some of which are within the company’s control and some of which are within the control of third parties, to accumulate, process, store, and transmit large amounts of confidential information and other data. Maintaining the confidentiality, integrity and availability of our IT systems and confidential information is vital to our business.
IT systems are potentially vulnerable to system inadequacies, operating failures, service interruptions or failures, security breaches, malicious intrusions, or cyber-attacks from a variety of sources. Cyber- attacks are growing in their frequency, sophistication, and intensity, and are becoming increasingly difficult to detect, mitigate, or prevent. Cyber-attacks come in many forms, including the deployment of harmful malware, denial-of-service attacks, the use of social engineering, and other means to compromise the confidentiality, integrity and availability of our IT systems, confidential information, and other data. Breaches resulting in the loss, theft, destruction, or unauthorized disclosure or use of confidential information can occur in a variety of ways, including but not limited to, negligent or wrongful conduct by employees or others with permitted access to our systems and information, or wrongful conduct by hackers, competitors, certain governments, or other current or former company personnel. Our third party partners face similar risks.
The failure or inadequacy of our IT systems or the loss, theft, destruction, or unauthorized disclosure or use of confidential information could impair our ability to secure and maintain intellectual property rights, damage our operations, customer relationships, and reputation, and cause us to lose trade secrets or other competitive advantages. Unauthorized disclosure of personally identifiable information could expose us to sanctions for violations of data privacy laws and regulations and could damage public trust in our company.
To date, system inadequacies, operating failures, service interruptions or failures, security breaches, malicious intrusions, cyber-attacks, and the loss, theft, destruction, or unauthorized disclosure or use of confidential information have not had a material impact on our consolidated results of operations. We have implemented measures to prevent, respond to, and minimize these risks. However, these measures may not be successful. If they are not successful, any of these events could result in material financial, legal, business, or reputational harm to our business and reputation.

FINANCIAL REPORT
F2020
• Significant economic downturns could adversely affect our business and operating results.
While human pharmaceuticals and companion animal health products have not generally been sensitive to overall economic cycles, prolonged economic slowdowns could lead to decreased utilization of our products, affecting our sales volume. Our food animal business may be affected by depressed prices for our customers’ end products. Declining tax revenues attributable to economic downturns increase the pressure on governments to reduce human health care spending, leading to increasing government efforts to control drug prices and utilization. Additionally, some customers, including governments or other entities reliant upon government funding, may be unable to pay in a timely manner for our products. Also, if our customers, suppliers, or collaboration partners experience financial difficulties, we could experience slower customer collections, greater bad debt expense, and performance defaults by suppliers or collaboration partners. Similarly, in the event of a significant economic downturn, we could have difficulty accessing credit markets.
• Pharmaceutical products can develop unexpected safety or efficacy concerns, which could have a material adverse effect on revenues and income.
Human pharmaceutical products receive regulatory approval based on data obtained in controlled clinical trials of limited duration. After approval, the products are used for longer periods of time by much larger numbers of patients; we and others (including regulatory agencies and private payers) collect extensive information on the efficacy and safety of our marketed products by continuously monitoring the use of our products in the marketplace. In addition, we or others may conduct post-marketing clinical studies on efficacy and safety of our marketed products. New safety or efficacy data from both market surveillance and post-marketing clinical studies may result in product label changes that could reduce the product's market acceptance and result in declining sales. Serious safety or efficacy issues that arise after product approval could result in voluntary or mandatory product recalls or withdrawals from the market. Safety issues could also result in costly product liability claims.
• We face many product liability claims and are self-insured; we could face large numbers of claims in the future, which could adversely affect our business.
We are subject to a substantial number of product liability claims involving Actos®, Axiron, Byetta®, Cialis, Cymbalta, and Prozac among other products. See “Financial Statements and Supplementary Data—Note 15, Contingencies” for more information on our current product liability litigation. Because of the nature of pharmaceutical products, we could become subject to large numbers of product liability claims for these or other products in the future, which could require substantial expenditures to resolve and, if involving marketed products, could adversely affect sales of the product. Due to a very restrictive market for product liability insurance, we are self-insured for product liability losses for all our currently marketed products.
• Regulatory compliance problems could be damaging to the company.
The marketing, promotional, and pricing practices of human pharmaceutical manufacturers, as well as the manner in which manufacturers interact with purchasers, prescribers, and patients, are subject to extensive regulation. Many companies, including us, have been subject to claims related to these practices asserted by federal, state, and foreign governmental authorities, private payers, and consumers. These claims have resulted in substantial expense and other significant consequences to us. It is possible that we could become subject to such investigations and that the outcome could include criminal charges and fines, penalties, or other monetary or non-monetary remedies, including exclusion from U.S. federal and other health care programs. In addition, regulatory issues concerning compliance with cGMP regulations (and comparable foreign regulations) for pharmaceutical products can lead to product recalls and seizures, fines and penalties, interruption of production leading to product shortages, and delays in the approvals of new products pending resolution of the issues. See “Business—Government Regulation of Our Operations” for more details.

FINAN
CIAL
REPO
RT
F2121
• Manufacturing difficulties or disruptions could lead to product supply problems.
Pharmaceutical and animal health manufacturing is complex and highly regulated. Manufacturing difficulties at our facilities or contracted facilities, or the failure or refusal of a contract manufacturer to supply contracted quantities, could result in product shortages, leading to lost revenue. Such difficulties or disruptions could result from quality or regulatory compliance problems, natural disasters, mechanical or information technology system failures, or inability to obtain sole-source raw or intermediate materials. In addition, given the difficulties in predicting sales of new products and the very long lead times necessary for the expansion and regulatory qualification of pharmaceutical manufacturing capacity, it is possible that we could have difficulty meeting demand for new products. See “Business—Raw Materials and Product Supply” for more details.
• Reliance on third-party relationships and outsourcing arrangements could adversely affect our business.
We utilize third parties, including suppliers, distributors, alliances with other pharmaceutical and biotechnology companies, and third-party service providers, for selected aspects of product development, manufacture, commercialization, support for information technology systems, product distribution, and certain financial transactional processes. For example, we outsource the day-to-day management and oversight of our clinical trials to contract research organizations. Outsourcing these functions involves the risk that the third parties may not perform to our standards or legal requirements, may not produce reliable results, may not perform in a timely manner, may not maintain the confidentiality of our proprietary information, or may fail to perform at all. Failure of these third parties to meet their contractual, regulatory, confidentiality, or other obligations to us could have a material adverse effect on our business.
• Our animal health segment faces risks related to increased generic competition, food and animal safety concerns, factors affecting global agricultural markets, and other risks.
The animal health operating segment may be impacted by, among other things, increased sales of companion animal products by non-veterinarian retail outlets; emerging restrictions and bans on the use of antibacterials in food-producing animals; perceived adverse effects on human health linked to the consumption of food derived from animals that utilize our products; increased regulation or decreased governmental support relating to the raising, processing, or consumption of food-producing animals; an outbreak of infectious disease carried by animals; adverse weather conditions and the availability of natural resources; adverse global economic conditions affecting agricultural markets; and failure of our research and development, acquisition, and licensing efforts to generate new products. The failure to manage these risks could have a material adverse effect on our revenues and income.

FINANCIAL REPORT
F2222
Management’s Discussion and Analysis of Results of Operations and Financial ConditionRESULTS OF OPERATIONS(Tables present dollars in millions, except per-share data)
General
Management’s discussion and analysis of results of operations and financial condition, is intended to assist the reader in understanding and assessing significant changes and trends related to the results of operations and financial position of our consolidated company. This discussion and analysis should be read in conjunction with the consolidated financial statements and accompanying footnotes in this Annual Report. Certain statements in this section of the Annual Report constitute forward-looking statements. Various risks and uncertainties, including those discussed in "Forward-Looking Statements" and “Risk Factors,” may cause our actual results and cash generated from operations to differ materially from these forward-looking statements.
Executive Overview
David A. Ricks assumed the role of president and chief executive officer effective January 1, 2017, replacing John C. Lechleiter, who retired at the end of 2016. Lechleiter will remain chairman of our board of directors through May 31, 2017, and Ricks will assume the role of chairman effective June 1, 2017. Ricks joined the board of directors on January 1, 2017.
The remainder of this section provides an overview of our financial results, recent product and late-stage pipeline developments, and other matters affecting our company and the pharmaceutical industry. Earnings per share (EPS) data is presented on a diluted basis.
Financial Results
The following table summarizes our key operating results:
Year EndedDecember 31,
PercentChange2016 2015
Revenue . . . . . . . . . . . . . . . . . . . . . . . . . . . . . . . . . . . . . . . . . . . . . . . $21,222.1 $19,958.7 6Gross margin . . . . . . . . . . . . . . . . . . . . . . . . . . . . . . . . . . . . . . . . . . . . 15,567.2 14,921.5 4Gross margin as a percent of revenue . . . . . . . . . . . . . . . . . . . . . . . . 73.4% 74.8%Operating expense (1) . . . . . . . . . . . . . . . . . . . . . . . . . . . . . . . . . . . . . $11,695.9 $11,329.4 3Acquired in-process research and development . . . . . . . . . . . . . . . . . 30.0 535.0 NMAsset impairment, restructuring, and other special charges . . . . . . . . 382.5 367.7 4Effective tax rate . . . . . . . . . . . . . . . . . . . . . . . . . . . . . . . . . . . . . . . . . 18.9% 13.7%Net income . . . . . . . . . . . . . . . . . . . . . . . . . . . . . . . . . . . . . . . . . . . . . 2,737.6 2,408.4 14Earnings per share . . . . . . . . . . . . . . . . . . . . . . . . . . . . . . . . . . . . . . . 2.58 2.26 14
(1) Operating expense consists of research and development and marketing, selling, and administrative expenses.
NM - not meaningful
Revenue and gross margin increased in 2016. The increase in operating expense in 2016 was due to an increase in research and development expense, partially offset by a decrease in marketing, selling, and administrative expense. Net income and EPS increased in 2016 as a higher gross margin and lower acquired in-process research and development (IPR&D) charges, were partially offset by higher operating expense, a higher effective tax rate, and lower other income.
FINAN
CIAL
REPO
RT
F2323
The following highlighted items affect comparisons of our 2016 and 2015 financial results:
2016
Acquired IPR&D (Note 3 to the consolidated financial statements)
• We recognized acquired IPR&D charges of $30.0 million (pretax), or $0.02 per share, related to upfront fees paid in connection with a collaboration agreement with AstraZeneca.
Asset Impairment, Restructuring, and Other Special Charges (Note 5 to the consolidated financial statements)
• We recognized charges of $382.5 million (pretax), or $0.29 per share, related to integration and severance costs related to the acquisition of Novartis Animal Health (Novartis AH), other global severance costs, and asset impairments primarily related to the closure of an animal health manufacturing facility in Ireland.
Other–Net, (Income) Expense (Note 17 to the consolidated financial statements)
• We recognized charges of $203.9 million (pretax), or $0.19 per share, related to the impact of the Venezuelan financial crisis, including the significant deterioration of the bolívar.
2015
Acquisitions (Note 3 to the consolidated financial statements)
• We recognized expense of $153.0 million (pretax), or $0.10 per share, related to the fair value adjustments to Novartis AH acquisition date inventory that was sold.
Acquired IPR&D (Notes 3 and 4 to the consolidated financial statements)
• We recognized acquired IPR&D charges of $535.0 million (pretax), or $0.33 per share, related to upfront fees paid in connection with various collaboration agreements primarily with Pfizer Inc. (Pfizer), as well as the consideration paid to acquire the worldwide rights to Locemia Solutions' (Locemia) intranasal glucagon.
Asset Impairment, Restructuring, and Other Special Charges (Note 5 to the consolidated financial statements)
• We recognized charges of $367.7 million (pretax), or $0.25 per share, related to severance costs, integration costs, and intangible asset impairments.
Debt Repurchase (Notes 7 and 10 to the consolidated financial statements)
• We recognized net charges of $152.7 million (pretax), or $0.09 per share, attributable to the debt extinguishment loss of $166.7 million from the purchase and redemption of certain fixed-rate notes, partially offset by net gains from non-hedging interest rate swaps and foreign currency transactions associated with the related issuance of lower interest rate euro-denominated notes.

FINANCIAL REPORT
F2424
Late-Stage Pipeline
Our long-term success depends to a great extent on our ability to continue to discover and develop innovative pharmaceutical products and acquire or collaborate on molecules currently in development by other biotechnology or pharmaceutical companies. We currently have approximately 45 potential new drugs in human testing or under regulatory review, and a larger number of projects in preclinical research.
The following new molecular entities (NMEs) were approved by regulatory authorities in at least one of the major geographies for use in the diseases described. The quarter in which each NME initially was approved in any major geography for any indication is shown in parentheses:
Baricitinib (Olumiant®) (Q1 2017)—a Janus tyrosine kinase inhibitor for the treatment of moderate-to-severe active rheumatoid arthritis (in collaboration with Incyte Corporation).
Ixekizumab* (Taltz®) (Q1 2016)—a neutralizing monoclonal antibody to interleukin-17A for the treatment of moderate-to-severe plaque psoriasis and psoriatic arthritis.
Necitumumab* (Portrazza®) (Q4 2015)—an anti-epidermal growth factor receptor monoclonal antibody for the treatment of metastatic squamous non-small cell lung cancer (NSCLC).
Olaratumab* (Lartruvo™) (Q4 2016)—a human lgG1 monoclonal antibody for the treatment of advanced soft tissue sarcoma.
The following NMEs and diagnostic agent are currently in Phase III clinical trial testing for potential use in the diseases described. The quarter in which each NME and diagnostic agent initially entered Phase III for any indication is shown in parentheses:
Abemaciclib (Q3 2014)—a small molecule cell-cycle inhibitor, selective for cyclin-dependent kinases 4 and 6 for the treatment of metastatic breast cancer and NSCLC.
BACE inhibitor (Q2 2016)—an oral beta-secretase cleaving enzyme (BACE) inhibitor for the treatment of early and mild Alzheimer's disease (in collaboration with AstraZeneca).
Flortaucipir** (Q3 2015)—a positron emission tomography (PET) tracer intended to image tau (or neurofibrillary) tangles in the brain, which are an indicator of Alzheimer's disease.
Galcanezumab* (Q2 2015)—a once-monthly subcutaneously injected calcitonin gene-related peptide (CGRP) antibody for the treatment of cluster headache and migraine prevention.
Nasal glucagon* (Q3 2013)—a glucagon nasal powder formulation for the treatment of severe hypoglycemia in patients with diabetes treated with insulin.
Solanezumab* (Q2 2009)—an anti-amyloid beta monoclonal antibody for the treatment of preclinical Alzheimer’s disease. Based upon the results of our Phase III study of patients with mild dementia due to Alzheimer's disease, we will not pursue regulatory submissions for solanezumab for the treatment of mild dementia due to Alzheimer's disease and we will not pursue development of solanezumab for the treatment of prodromal Alzheimer's disease.
Tanezumab* (Q3 2008)—an anti-nerve growth factor monoclonal antibody for the treatment of osteoarthritis pain, chronic low back pain, and cancer pain (in collaboration with Pfizer).
* Biologic molecule subject to the United States (U.S.) Biologics Price Competition and Innovation Act
** Diagnostic agent
The following table reflects the status of each NME and diagnostic agent within our late-stage pipeline and recently approved products, including developments since January 1, 2016:
Compound Indication U.S. Europe Japan DevelopmentsEndocrinologyNasalglucagon
Severehypoglycemia Phase III Development of commercial
manufacturing process is ongoing.

FINAN
CIAL
REPO
RT
F2525
Compound Indication U.S. Europe Japan DevelopmentsImmunology
Olumiant Rheumatoidarthritis Submitted Approved Submitted
Submitted to regulatory authorities inthe U.S. and Japan in first quarter of2016. Approved in Europe in firstquarter of 2017.
Taltz
Axialspondylo-arthritis
Phase III Initiated Phase III study in May 2016.
Psoriasis Launched
Approved and launched in the U.S. infirst and second quarters of 2016,respectively. Approved and launched inEurope in second and third quarters of2016, respectively. Approved andlaunched in Japan in third and fourthquarters of 2016, respectively.
Psoriaticarthritis Phase III Launched
Approved and launched in Japan inthird and fourth quarters of 2016,respectively. Announced in October2016 top-line results of Phase III trialthat met primary endpoints. Submissionto the U.S. Food and DrugAdministration (FDA) in the first half of2017.
Neuroscience
BACE inhibitorEarly and mildAlzheimer'sdisease
Phase III
Moved into the Phase III portion of thePhase II/III seamless study in April 2016 and initiated Phase III study in mild Alzheimer's disease in August 2016. Granted Fast Track Designation(1) from the FDA in August 2016.
Flortaucipir Alzheimer'sdisease Phase III Phase III study is ongoing.
Galcanezumab
Clusterheadache Phase III Phase III studies are ongoing.
Migraineprevention Phase III Initiated first Phase III study in January
2016.
Solanezumab
MildAlzheimer'sdisease
TerminatedAnnounced in November 2016 top-lineresults of Phase III trial that did notmeet primary endpoints. Furtherdevelopment has been discontinued.
PreclinicalAlzheimer'sdisease
Phase III Phase III study to continue.
ProdromalAlzheimer'sdisease
Terminated Further development has beendiscontinued.
Tanezumab
Osteoarthritispain Phase III
Phase III studies are ongoing.Chronic lowback pain Phase III
Cancer pain Phase III

FINANCIAL REPORT
F2626
Compound Indication U.S. Europe Japan DevelopmentsOncology
AbemaciclibMetastaticbreast cancer Phase III
Phase III studies are ongoing.
NSCLC Phase III
Lartruvo Soft tissuesarcoma Launched Phase III
Granted accelerated approval(2) by the FDA in fourth quarter of 2016 based on phase II data. Launched in the U.S. in the fourth quarter of 2016. Granted conditional approval(3) and launched in Europe in fourth quarter of 2016. Phase III study is ongoing.
PortrazzaMetastaticsquamousNSCLC(first-line)
Launched Phase Ib/IIApproved and launched in Europe infirst and second quarters of 2016,respectively.
(1) The FDA's fast track program is designed to expedite the development and review of new therapies to treat serious conditions and address unmet medical needs.
(2) Continued approval for this indication may be contingent on verification and description of clinical benefit in a confirmatory Phase III trial.
(3) As part of a conditional marketing authorization, results from an ongoing Phase III study will need to be provided. This study is fully enrolled. Until availability of the full data, the Committee for Medicinal Products for Human Use will review the benefits and risks of Lartruvo annually to determine whether the conditional marketing authorization can be maintained.
There are many difficulties and uncertainties inherent in pharmaceutical research and development and the introduction of new products. A high rate of failure is inherent in new drug discovery and development. The process to bring a drug from the discovery phase to regulatory approval can take over a decade and cost more than $2 billion (DiMasi JA, Grabowski HG, Hansen RA. Innovation in the pharmaceutical industry: new estimates of R&D costs, Journal of Health Economics 2016;47:20-33.). Failure can occur at any point in the process, including late in the process after substantial investment. As a result, most research programs will not generate financial returns. New product candidates that appear promising in development may fail to reach the market or may have only limited commercial success. Delays and uncertainties in the regulatory approval processes in the U.S. and in other countries can result in delays in product launches and lost market opportunities. Consequently, it is very difficult to predict which products will ultimately be approved.
We manage research and development spending across our portfolio of molecules, and a delay in, or termination of, any one project will not necessarily cause a significant change in our total research and development spending. Due to the risks and uncertainties involved in the research and development process, we cannot reliably estimate the nature, timing, and costs of the efforts necessary to complete the development of our research and development projects, nor can we reliably estimate the future potential revenue that will be generated from a successful research and development project. Each project represents only a portion of the overall pipeline, and none is individually material to our consolidated research and development expense. While we do accumulate certain research and development costs on a project level for internal reporting purposes, we must make significant cost estimations and allocations, some of which rely on data that are neither reproducible nor validated through accepted control mechanisms. Therefore, we do not have sufficiently reliable data to report on total research and development costs by project, by preclinical versus clinical spend, or by therapeutic category.

FINAN
CIAL
REPO
RT
F2727
Other Matters
Patent Matters
We depend on patents or other forms of intellectual-property protection for most of our revenues, cash flows, and earnings. The loss of U.S. patent exclusivity for Evista® in March 2014 resulted in the immediate entry of generic competitors. We lost our data package protection for Cymbalta® in major European countries in 2014. In 2015, we saw the entry of generic competition in all major European markets. The loss of exclusivity for Evista in the U.S. and Cymbalta in the European markets has caused a rapid and severe decline in revenue for the affected products, which over time has, in the aggregate, had a material adverse effect on our consolidated results of operations and cash flows. We also lost patent exclusivity for the schizophrenia and bipolar mania indications in December 2015 and April 2016, respectively, for Zyprexa® in Japan. Generic versions of Zyprexa were launched in Japan in June 2016. The loss of exclusivity for Zyprexa in Japan has caused a rapid and severe decline in revenue for the product.
Additionally, as described in Note 15 to the consolidated financial statements, the Alimta® vitamin regimen patents, which provide us with patent protection for Alimta through June 2021 in Japan and major European countries, and through May 2022 in the U.S., have been challenged in each of these jurisdictions. Our vitamin regimen patents have also been challenged in other smaller European jurisdictions. Our compound patent for Alimta expired in the U.S. in January 2017, and expired in major European countries and Japan in December 2015. We expect that the entry of generic competition for Alimta following the loss of effective patent protection will cause a rapid and severe decline in revenue for the product, which will, in the aggregate, have a material adverse effect on our consolidated results of operations and cash flows. While the U.S. Court of Appeals recently ruled in our favor regarding the validity and infringement of the vitamin regimen patent, that patent remains the subject of inter partes review challenges as further described in Note 15 to the consolidated financial statements. We are aware that at least two generic pemetrexed products have launched in a major European market. Notwithstanding our patents, generic versions of Alimta were also approved in Japan in February 2016. As described in Note 15 to the consolidated financial statements, each manufacturer of the generic version of Alimta has agreed not to proceed to pricing approval.
We will lose our patent protection for Strattera® in the U.S. in May 2017, and Cialis® in the U.S. and major European markets in November 2017. We will also lose exclusivity for Effient® in the U.S. in October 2017, and we have authorized one generic manufacturer to enter the market as early as mid-August 2017. We expect that the entry of generic competition into these markets following the loss of exclusivity will cause a rapid and severe decline in revenue for the affected products, which will, in the aggregate, have a material adverse effect on our consolidated results of operations and cash flows.
The compound patent for Humalog® (insulin lispro) has expired in major markets. Thus far, the loss of compound patent protection for Humalog has not resulted in a rapid and severe decline in revenue. Global regulators have different legal pathways to approve similar versions of insulin lispro and to date none have been approved in the U.S. or Europe. Other manufacturers have efforts underway to bring to market a similar version of insulin lispro and we are aware that a competitor's insulin lispro product has been accepted for regulatory review by the European Medicines Agency. It is difficult to predict the impact of these products entering the market.
Foreign Currency Exchange Rates
As a global company with substantial operations outside the U.S., we face foreign currency risk exposure from fluctuating currency exchange rates, primarily the U.S. dollar against the euro, Japanese yen, and British pound; and the British pound and Swiss franc against the euro. While we manage a portion of these exposures through hedging and other risk management techniques, significant fluctuations in currency rates can have a substantial impact, either positive or negative, on our revenue, cost of sales, and operating expenses. Over the past two years, we have seen significant foreign currency rate fluctuations between the U.S. dollar and several other foreign currencies, including the euro, British pound, and Japanese yen. While there is uncertainty in the future movements in foreign exchange rates, these fluctuations could negatively impact our future consolidated results of operations.

FINANCIAL REPORT
F2828
The impact of the Venezuelan financial crisis, including the significant deterioration of the bolívar, resulted in a charge of $203.9 million in 2016. See Note 17 to the consolidated financial statements for additional information related to the charge. As of December 31, 2016, our Venezuelan subsidiaries represented a de minimis portion of our consolidated assets and liabilities. We continue to monitor other deteriorating economies and it is possible that additional charges may be recorded in the future. Any additional charges are not expected to have a material adverse effect on our future consolidated results of operations.
Trends Affecting Pharmaceutical Pricing, Reimbursement, and Access
United States
In the U.S., public concern over access to and affordability of pharmaceuticals continues to drive the regulatory and legislative debate. These policy and political issues increase the risk that taxes, fees, rebates, or other federal and state measures may be enacted. Key health policy proposals affecting biopharmaceuticals include a reduction in biologic data exclusivity, modifications to Medicare Parts B and D, language that would allow the Department of Health and Human Services to negotiate prices for biologics and drugs in Medicare, proposals that would require biopharmaceutical manufacturers to disclose proprietary drug pricing information, and state-level proposals to reduce the cost of pharmaceuticals purchased by government health care programs. Savings projected under these proposals are targeted as a means to fund both health care expenditures and non-health care initiatives, or to manage federal and state budgets.
In the private sector, consolidation and integration among healthcare providers is also a major factor in the competitive marketplace for human pharmaceuticals. Health plans, pharmaceutical benefit managers, wholesalers, and other supply chain stakeholders have been consolidating into fewer, larger entities, thus enhancing their purchasing strength and importance. Payers typically maintain formularies which specify coverage (the conditions under which drugs are included on a plan's formulary) and reimbursement (the associated out-of-pocket cost to the consumer). Formulary placement can lead to reduced usage of a drug for the relevant patient population due to coverage restrictions, such as prior authorizations and formulary exclusions, or due to reimbursement limitations which result in higher consumer out-of-pocket cost, such as non-preferred co-pay tiers, increased co-insurance levels and higher deductibles. Consequently, pharmaceutical companies compete for formulary placement not only on the basis of product attributes such as greater efficacy, fewer side effects, or greater patient ease of use, but also by providing rebates. Price is an increasingly important factor in formulary decisions, particularly in treatment areas in which the payer has taken the position that multiple branded products are therapeutically comparable. These downward pricing pressures could negatively affect future consolidated results of operations.
The main coverage expansion provisions of the Affordable Care Act (ACA) are currently in effect through both state-based exchanges and the expansion of Medicaid. An emerging trend has been the prevalence of benefit designs containing high out-of-pocket costs for patients, particularly for pharmaceuticals. In addition to the coverage expansions, many employers in the commercial market, driven in part by ACA changes such as the 2020 implementation of the excise tax on employer-sponsored health care coverage for which there is an excess benefit (the so-called "Cadillac tax"), continue to evaluate strategies such as private exchanges and wider use of consumer-driven health plans to reduce their healthcare liabilities over time. President Trump, the new administration, and Congress have identified repealing and replacing the ACA as a top priority. The proposed timeframe remains unclear. Further, provisions included in legislation repealing the ACA and any potential replacement program have yet to be determined and could have a material adverse effect on our consolidated results of operations and cash flows. At the same time, the broader paradigm shift towards performance-based reimbursement and the launch of several value-based purchasing initiatives have placed demands on the pharmaceutical industry to offer products with proven real-world outcomes data and a favorable economic profile.

FINAN
CIAL
REPO
RT
F2929
International
International operations also are generally subject to extensive price and market regulations. Cost-containment measures exist in a number of countries, including additional price controls and mechanisms to limit reimbursement for our products. Such policies are expected to increase in impact and reach, given the pressures on national and regional health care budgets that come from a growing aging population and ongoing economic challenges. In addition, governments in many emerging markets are becoming increasingly active in expanding health care system offerings. Given the budget challenges of increasing health care coverage for citizens, policies may be proposed that promote generics and biosimilars only and reduce current and future access to branded human pharmaceutical products.
Tax Matters
We are subject to income taxes in the U.S. and numerous foreign jurisdictions. Changes in the relevant tax laws, regulations, administrative practices, principles, and interpretations could adversely affect our future effective tax rates. The U.S. and a number of other countries are actively considering or enacting changes in this regard. For example, the Trump administration has stated that one of its top priorities is comprehensive tax reform. The tax rates and the manner in which U.S. companies are taxed could be altered by any such potential tax reform and could have a material adverse effect on our consolidated results of operations and cash flows. Additionally, the Organisation for Economic Co-operation and Development issued its final recommendations of international tax reform proposals to influence international tax policy in major countries in which we operate. Other institutions have also become more active regarding tax-related matters, including the European Commission, the United Nations, the Group of Twenty, and the European Parliament. While outcomes of these initiatives continue to develop and remain uncertain, changes to key elements of the U.S. or international tax framework could have a material adverse effect on our consolidated results of operations and cash flows.
Acquisitions
See Note 3 to the consolidated financial statements for discussion regarding the following acquisitions:
• Our agreement to purchase CoLucid Pharmaceuticals, Inc. (CoLucid) for $46.50 per share or approximately $960 million, which we expect to complete in the first quarter of 2017.
• Our acquisition of Boehringer Ingelheim Vetmedica, Inc.'s U.S. feline, canine, and rabies vaccine portfolio, completed on January 3, 2017, in an all-cash transaction for approximately $885 million.
• Our acquisition of Novartis AH, completed on January 1, 2015, in an all-cash transaction for $5.28 billion.
Operating Results—2016
Revenue
The following table summarizes our revenue activity by region:
Year EndedDecember 31,
2016 2015 Percent Change
U.S. (1) . . . . . . . . . . . . . . . . . . . . . . . . . . . . . . . . . . . . . . . $ 11,506.2 $ 10,097.4 14Outside U.S. . . . . . . . . . . . . . . . . . . . . . . . . . . . . . . . . . . . 9,715.9 9,861.3 (1)Revenue . . . . . . . . . . . . . . . . . . . . . . . . . . . . . . . . . . . . . $ 21,222.1 $ 19,958.7 6
Numbers may not add due to rounding.(1) U.S. revenue includes revenue in Puerto Rico.

FINANCIAL REPORT
F3030
The following are components of the change in revenue compared to the prior year:
2016 vs. 2015
U.S. Outside U.S. Consolidated
Volume . . . . . . . . . . . . . . . . . . . . . . . . . . . . . . . . . . . . . . . . . . . . . . . . 12% 2 % 7%Price . . . . . . . . . . . . . . . . . . . . . . . . . . . . . . . . . . . . . . . . . . . . . . . . . . 2% (3)% —%Foreign exchange rates . . . . . . . . . . . . . . . . . . . . . . . . . . . . . . . . . . . —% (1)% —%Percent change . . . . . . . . . . . . . . . . . . . . . . . . . . . . . . . . . . . . . . . . . 14% (1)% 6%
Numbers may not add due to rounding.
In the U.S., the volume increase in 2016 was driven by sales of several pharmaceutical products, including Trulicity®, Humalog, Erbitux® (due to the transfer of commercialization rights to us in the U.S. and Canada effective October 1, 2015), Taltz, and Jardiance®, partially offset by decreased volume for Zyprexa. U.S. revenue also benefited from reductions to the Cymbalta reserve for expected product returns of approximately $175 million in 2016, favorably affecting both volume and price.
Outside the U.S., the volume increase in 2016 was driven by sales of several new pharmaceutical products, including Cyramza and Trulicity, partially offset by the losses of exclusivity for Cymbalta in Europe and Canada, Zyprexa in Japan, as well as Alimta in several countries.
The following table summarizes our revenue activity in 2016 compared with 2015:
Year EndedDecember 31,
2016 2015
Product U.S.(1) Outside U.S. Total TotalPercentChange
Humalog . . . . . . . . . . . . . . . . . . . . . . . $ 1,685.2 $ 1,083.6 $ 2,768.8 $ 2,841.9 (3)Cialis . . . . . . . . . . . . . . . . . . . . . . . . . . 1,469.5 1,002.1 2,471.6 2,310.7 7Alimta . . . . . . . . . . . . . . . . . . . . . . . . . . 1,101.0 1,182.3 2,283.3 2,493.1 (8)Forteo® . . . . . . . . . . . . . . . . . . . . . . . . . 770.5 729.4 1,500.0 1,348.3 11Humulin® . . . . . . . . . . . . . . . . . . . . . . . 861.8 504.1 1,365.9 1,307.4 4Cymbalta . . . . . . . . . . . . . . . . . . . . . . . 269.3 661.2 930.5 1,027.6 (9)Trulicity . . . . . . . . . . . . . . . . . . . . . . . . 737.6 187.9 925.5 248.7 NMStrattera . . . . . . . . . . . . . . . . . . . . . . . . 534.9 319.8 854.7 784.0 9Zyprexa . . . . . . . . . . . . . . . . . . . . . . . . 69.8 655.5 725.3 940.3 (23)Erbitux . . . . . . . . . . . . . . . . . . . . . . . . . 581.1 105.9 687.0 485.0 42Cyramza . . . . . . . . . . . . . . . . . . . . . . . 270.1 344.0 614.1 383.8 60Effient. . . . . . . . . . . . . . . . . . . . . . . . . . 465.6 69.6 535.2 523.0 2Trajenta® (2) . . . . . . . . . . . . . . . . . . . . . 165.9 270.7 436.6 356.8 22Other human pharmaceutical products 959.4 1,006.1 1,965.4 1,727.1 14Animal health products . . . . . . . . . . . . 1,564.5 1,593.7 3,158.2 3,181.0 (1)
Revenue . . . . . . . . . . . . . . . . . . . . . $ 11,506.2 $ 9,715.9 $ 21,222.1 $ 19,958.7 6
Numbers may not add due to rounding.(1) U.S. revenue includes revenue in Puerto Rico.(2) Trajenta revenue includes Jentadueto®.
NM - not meaningful
Revenue of Humalog, our injectable human insulin analog for the treatment of diabetes, decreased 5 percent in the U.S., driven by lower realized prices, partially offset by increased demand. Revenue outside the U.S. increased 1 percent, driven by increased volume and, to a lesser extent, higher realized prices, partially offset by the unfavorable impact of foreign exchange rates.

FINAN
CIAL
REPO
RT
F3131
Revenue of Cialis, a treatment for erectile dysfunction and benign prostatic hyperplasia, increased 17 percent in the U.S., driven by higher realized prices. We will lose our patent protection for Cialis in the U.S. in November 2017. We expect that the entry of generic competition following the loss of exclusivity will cause a rapid and severe decline in revenue. Revenue outside the U.S. decreased 5 percent, driven by the unfavorable impact of foreign exchange rates and decreased volume, partially offset by higher realized prices.
Revenue of Alimta, a treatment for various cancers, decreased 5 percent in the U.S., driven by decreased demand due to competitive pressure. Revenue outside the U.S. decreased 11 percent, driven primarily by the loss of exclusivity in several countries. We have faced and remain exposed to generic entry in multiple countries that has eroded revenue and is likely to continue to erode revenue from current levels.
Revenue of Forteo, an injectable treatment for osteoporosis in postmenopausal women and men at high risk for fracture and for glucocorticoid-induced osteoporosis in men and postmenopausal women, increased 26 percent in the U.S., driven by higher realized prices. Revenue outside the U.S. decreased 1 percent, driven by lower realized prices, largely offset by increased volume and the favorable impact of foreign exchange rates.
Revenue of Humulin, an injectable human insulin for the treatment of diabetes, increased 13 percent in the U.S., driven by increased demand and, to a lesser extent, higher realized prices. The increase in realized prices resulted from a change in estimate of a government rebate in the first quarter of 2016. Revenue outside the U.S. decreased 7 percent, driven by the unfavorable impact of foreign exchange rates and, to a lesser extent, decreased volume and lower realized prices.
Revenue of Cymbalta, a product for the treatment of major depressive disorder, diabetic peripheral neuropathic pain, generalized anxiety disorder, chronic musculoskeletal pain, and the management of fibromyalgia, was $269.3 million in the U.S. in 2016, compared to $144.6 million in 2015. U.S. revenue benefited from reductions to the Cymbalta reserve for expected product returns of approximately $175 million in 2016. Revenue outside the U.S. decreased 25 percent, driven by the loss of exclusivity.
Revenue of Trulicity, a treatment for type 2 diabetes, was $737.6 million in the U.S., driven by growth in the GLP-1 market and increased share of market for Trulicity. Revenue outside the U.S. was $187.9 million.
Revenue of Strattera, a treatment for attention-deficit hyperactivity disorder, increased 7 percent in the U.S., driven by higher realized prices, partially offset by decreased volume. We will lose our patent protection for Strattera in the U.S. in May 2017. We expect that the entry of generic competition following the loss of effective patent protection will cause a rapid and severe decline in revenue. Revenue outside the U.S. increased 13 percent, driven by increased volume and, to a lesser extent, the favorable impact of foreign exchange rates, partially offset by lower realized prices.
Revenue of Zyprexa, a treatment for schizophrenia, acute mixed or manic episodes associated with bipolar I disorder, and bipolar maintenance, decreased 16 percent outside the U.S., driven primarily by decreased volumes in Japan due to the entry of generic competition in June 2016 following the loss of patent exclusivity. Zyprexa revenue in Japan was $332.3 million in 2016, compared with $415.9 million in 2015.
Revenue of Erbitux, a treatment for various cancers, increased to $581.1 million in the U.S. in 2016, compared to $386.7 million in 2015. The increase was due to the transfer of commercialization rights to us in the U.S. and Canada which occurred on October 1, 2015.
Revenue of animal health products in the U.S. increased 1 percent, primarily due to uptake of new companion animal products, partially offset by decreased revenue for food animal products. Animal health product revenue outside the U.S. decreased 3 percent driven by the unfavorable impact of foreign exchange rates.
Gross Margin, Costs, and Expenses
Gross margin as a percent of total revenue was 73.4 percent in 2016, a decrease of 1.4 percentage points compared with 2015 primarily due to a lower benefit from foreign exchange rates on international inventories sold.
Research and development expense increased 9 percent to $5.24 billion in 2016, driven primarily by higher late-stage clinical development costs and, to a lesser extent, higher charges related to development milestone payments.

FINANCIAL REPORT
F3232
Marketing, selling, and administrative expense decreased 1 percent to $6.45 billion in 2016, as reduced spending on late-life-cycle products was largely offset by expenses related to new products.
We recognized an acquired IPR&D charge of $30.0 million in 2016 associated with the agreement with AstraZeneca to co-develop MEDI1814. There were $535.0 million of acquired IPR&D charges in 2015 resulting from business development activity, primarily a collaboration with Pfizer and the acquisition of worldwide rights to Locemia's intranasal glucagon. See Notes 3 and 4 to the consolidated financial statements for additional information.
We recognized asset impairment, restructuring, and other special charges of $382.5 million in 2016. The charges are primarily associated with integration and severance costs related to the acquisition of Novartis AH, other global severance costs associated with actions taken to reduce cost structure, and asset impairments primarily related to the closure of an animal health manufacturing facility in Ireland. In 2015, we recognized $367.7 million of asset impairment, restructuring, and other special charges related to severance costs, integration costs for Novartis AH, and asset impairments. See Note 5 to the consolidated financial statements for additional information.
Other—net, (income) expense was expense of $84.8 million in 2016, compared with income of $100.6 million in 2015. Other expense in 2016 included a $203.9 million charge related to the impact of the Venezuelan financial crisis, including the significant deterioration of the bolívar, partially offset by net gains of $101.6 million on investments. Other income in 2015 included net gains of $236.7 million on investments, partially offset by a net charge of $152.7 million related to the repurchase of $1.65 billion of debt. See Note 17 to the consolidated financial statements for additional information.
Our effective tax rate was 18.9 percent in 2016, compared with 13.7 percent in 2015. The increase in the effective tax rate for 2016 reflects several factors in both years: in 2016, the unfavorable tax effect of the charge related to the impact of the Venezuelan financial crisis and certain asset impairment, restructuring, and other special charges; and in 2015, the favorable tax impact of the acquired IPR&D charges, net charges related to the repurchase of debt, and asset impairment, restructuring, and other special charges. The increase in the effective tax rate for 2016 was partially offset by a net discrete tax benefit.
Operating Results—2015
Financial Results
The following table summarizes our key operating results:
Year EndedDecember 31,
PercentChange2015 2014
Revenue $19,958.7 $19,615.6 2Gross margin 14,921.5 14,683.1 2Gross margin as percent of revenue 74.8% 74.9%Operating expense (1) $11,329.4 $11,354.4 —Acquired in-process research and development 535.0 200.2 NMAsset impairment, restructuring, and other special charges 367.7 468.7 (22)Net income 2,408.4 2,390.5 1Earnings per share 2.26 2.23 1
(1) Operating expense consists of research and development and marketing, selling, and administrative expense.
NM - not meaningful
Revenue and gross margin increased slightly in 2015. Operating expense in 2015 remained essentially flat as a decrease in marketing, selling, and administrative expense was largely offset by increased research and development expense. Net income and EPS increased slightly in 2015 as a higher gross margin, lower income taxes, and decreased asset impairment, restructuring, and other special charges were largely offset by increased acquired IPR&D charges and lower other income.

FINAN
CIAL
REPO
RT
F3333
Certain items affect the comparisons of our 2015 and 2014 results. The 2015 highlighted items are summarized in the "Results of Operations—Executive Overview" section. The 2014 highlighted items are summarized as follows:
Acquired IPR&D (Notes 3 and 4 to the consolidated financial statements)
• We recognized acquired IPR&D charges of $200.2 million (pretax), or $0.12 per share, related to acquired IPR&D from various collaboration agreements.
Collaborations (Note 4 to the consolidated financial statements)
• We recognized income of $92.0 million (pretax), or $0.06 per share, related to the transfer of our linagliptin and empagliflozin commercial rights in certain countries to Boehringer Ingelheim.
Asset Impairment, Restructuring, and Other Special Charges (Note 5 to the consolidated financial statements)
• We recognized charges of $468.7 million (pretax), or $0.38 per share, related to severance costs associated with our ongoing cost containment efforts to reduce our cost structure and global workforce, and asset impairments primarily associated with the closure of a manufacturing site in Puerto Rico.
Other
• We recognized a marketing, selling, and administrative expense of $119.0 million (non-tax deductible), or $0.11 per share, for an extra year of the U.S. Branded Prescription Drug Fee (U.S. Drug Fee) due to final regulations issued by the Internal Revenue Service which required us to accelerate into 2014 the recording of an expense for the 2015 fee.
Revenue
The following table summarizes our revenue activity by region:
Year EndedDecember 31,
2015 2014 Percent Change
U.S. (1) $ 10,097.4 $ 9,134.1 11Outside U.S. 9,861.3 10,481.5 (6)Revenue $ 19,958.7 $ 19,615.6 2
Numbers may not add due to rounding.(1) U.S. revenue includes revenue in Puerto Rico.
The following are components of the change in revenue compared to the prior year:
2015 vs. 2014
U.S. Outside U.S. Consolidated
Volume 6% 9 % 8 %Price 5% (2)% 1 %Foreign exchange rates —% (13)% (7)%Percent change 11% (6)% 2 %
Numbers may not add due to rounding.
In the U.S., the volume increase in 2015 was driven by the inclusion of revenue from Novartis AH and increased volumes for several pharmaceutical products, partially offset by the residual impact of the loss of exclusivity for Cymbalta and Evista.
Outside the U.S., the volume increase in 2015 was driven by the inclusion of revenue from Novartis AH and increased volumes for several pharmaceutical products. On a pro forma basis, which reflects the 2014 revenue of Novartis AH as described in Note 3 to the consolidated financial statements, our consolidated volume in 2015 would have increased by 2 percent compared with 2014.

FINANCIAL REPORT
F3434
The following table summarizes our revenue activity in 2015 compared with 2014:
Year EndedDecember 31,
2015 2014
Product U.S.(1) Outside U.S. Total TotalPercentChange
Humalog . . . . . . . . . . . . . . . . . . . . . . . $ 1,772.3 $ 1,069.6 $ 2,841.9 $ 2,785.2 2Alimta . . . . . . . . . . . . . . . . . . . . . . . . . . 1,162.4 1,330.7 2,493.1 2,792.0 (11)Cialis . . . . . . . . . . . . . . . . . . . . . . . . . . 1,256.8 1,053.9 2,310.7 2,291.0 1Forteo . . . . . . . . . . . . . . . . . . . . . . . . . 612.4 735.9 1,348.3 1,322.0 2Humulin . . . . . . . . . . . . . . . . . . . . . . . . 764.4 543.0 1,307.4 1,400.1 (7)Cymbalta . . . . . . . . . . . . . . . . . . . . . . . 144.6 883.0 1,027.6 1,614.7 (36)Zyprexa . . . . . . . . . . . . . . . . . . . . . . . . 156.7 783.6 940.3 1,037.3 (9)Strattera . . . . . . . . . . . . . . . . . . . . . . . . 502.1 281.9 784.0 738.5 6Effient. . . . . . . . . . . . . . . . . . . . . . . . . . 417.6 105.4 523.0 522.2 —Erbitux . . . . . . . . . . . . . . . . . . . . . . . . . 386.7 98.3 485.0 373.3 30Cyramza . . . . . . . . . . . . . . . . . . . . . . . 277.7 106.1 383.8 75.6 NMTrulicity . . . . . . . . . . . . . . . . . . . . . . . . 207.7 41.0 248.7 10.2 NMEvista . . . . . . . . . . . . . . . . . . . . . . . . . . 61.7 175.6 237.3 419.8 (43)Other human pharmaceutical products 833.1 1,013.5 1,846.6 1,887.1 (2)Animal health products . . . . . . . . . . . . 1,541.2 1,639.8 3,181.0 2,346.6 36
Revenue . . . . . . . . . . . . . . . . . . . . . $ 10,097.4 $ 9,861.3 $ 19,958.7 $ 19,615.6 2
Numbers may not add due to rounding.(1) U.S. revenue includes revenue in Puerto Rico.
NM - not meaningful
Revenue of Humalog increased 9 percent in the U.S., driven by higher realized prices and, to a lesser extent, increased volume. Revenue outside the U.S. decreased 8 percent, driven by the unfavorable impact of foreign exchange rates, partially offset by higher volume.
Revenue of Alimta decreased 5 percent in the U.S., driven by decreased demand and, to a lesser extent, lower realized prices. Revenue outside the U.S. decreased 15 percent, driven by the unfavorable impact of foreign exchange rates and, to a lesser extent, lower realized prices, partially offset by increased volume.
Revenue of Cialis increased 21 percent in the U.S., driven by higher realized prices. Revenue outside the U.S. decreased 16 percent, driven by the unfavorable impact of foreign exchange rates.
Revenue of Forteo increased 14 percent in the U.S., driven by higher realized prices, partially offset by decreased volume. Revenue outside the U.S. decreased 6 percent, driven by the unfavorable impact of foreign exchange rates, partially offset by increased volume.
Revenue of Humulin increased 7 percent in the U.S., driven by higher realized prices and, to a lesser extent, wholesaler buying patterns, partially offset by decreased demand. Revenue outside the U.S. decreased 21 percent, driven by decreased volume, primarily due to the loss of a government contract in Brazil, and the unfavorable impact of foreign exchange rates.
Revenue of Cymbalta decreased 66 percent in the U.S. due to the loss of U.S. patent exclusivity in December 2013. Revenue outside the U.S. decreased 26 percent, driven by the unfavorable impact of foreign exchange rates and the loss of exclusivity in Europe in 2014.

FINAN
CIAL
REPO
RT
F3535
Revenue of Zyprexa increased 31 percent in the U.S., driven by adjustments to the return reserve resulting from the expiration of the period to return expired product for credit. Revenue outside the U.S. decreased 15 percent, driven primarily by the unfavorable impact of foreign exchange rates. We lost patent exclusivity for Zyprexa in Japan in December 2015. Zyprexa revenue in Japan was $415.9 million in 2015, compared with $466.2 million in 2014. The revenue decrease in Japan was due to the unfavorable impact of foreign exchange rates.
Revenue of Strattera increased 11 percent in the U.S., driven by higher realized prices and, to a lesser extent, increased demand. Revenue outside the U.S. decreased 1 percent, driven by the unfavorable impact of foreign exchange rates, largely offset by increased volume.
Revenue of Effient, a product for the reduction of thrombotic cardiovascular events (including stent thrombosis) in patients with acute coronary syndrome who are managed with an artery-opening procedure known as percutaneous coronary intervention, including patients undergoing angioplasty, atherectomy, or stent placement, increased 6 percent in the U.S., driven by higher realized prices, partially offset by decreased demand. Revenue outside the U.S. decreased 17 percent, driven primarily by the unfavorable impact of foreign exchange rates.
Revenue of Evista, a product for the prevention and treatment of osteoporosis in postmenopausal women and for reduction of risk of invasive breast cancer in postmenopausal women with osteoporosis and postmenopausal women at high risk for invasive breast cancer, decreased 70 percent in the U.S., due to the loss of patent exclusivity in March 2014. Revenue outside the U.S. decreased 17 percent, driven primarily by the unfavorable impact of foreign exchange rates.
Revenue of animal health products in the U.S. increased 21 percent and animal health product revenue outside the U.S. increased 53 percent. The increases were driven by the inclusion of revenue from Novartis AH.
On a pro forma basis, which reflects the 2014 revenue of Novartis AH as described in Note 3 to the consolidated financial statements, revenue of animal health products in the U.S. would have decreased 1 percent, driven primarily by decreased volume in food animal products. Revenue outside the U.S. would have decreased 13 percent, driven by the unfavorable impact of foreign exchange rates and decreased volume in companion animal products, partially offset by higher realized prices and volume for food animal products.
Gross Margin, Costs, and Expenses
Gross margin as a percent of total revenue was 74.8 percent in 2015, essentially flat compared with 2014 as the unfavorable impacts of the inclusion of Novartis AH and inventory step-up and amortization costs were offset by the favorable impact of foreign exchange rates on international inventories sold.
Research and development expense increased 1 percent to $4.80 billion in 2015, driven primarily by higher late-stage clinical development costs, the inclusion of Novartis AH, and an increase in charges associated with the termination of late-stage molecules, primarily evacetrapib and basal insulin peglispro, of approximately $135 million, partially offset by the favorable impact of foreign exchange rates.
Marketing, selling, and administrative expense decreased 1 percent to $6.53 billion in 2015, due to the favorable impact of foreign exchange rates and a 2014 charge associated with the U.S. Drug Fee, partially offset by the inclusion of Novartis AH and expenses related to new product launches.
We recognized acquired IPR&D charges of $535.0 million in 2015 resulting from various collaboration agreements, primarily with Pfizer, as well as the consideration paid to acquire the worldwide rights to Locemia's intranasal glucagon. There were $200.2 million of acquired IPR&D charges in 2014 related to various collaboration agreements, including charges associated with the transfer of commercial rights to us, from Boehringer Ingelheim, of the new insulin glargine product in certain countries where it was not yet approved. See Notes 3 and 4 to the consolidated financial statements for additional information.

FINANCIAL REPORT
F3636
We recognized asset impairment, restructuring, and other special charges of $367.7 million in 2015. The charges relate to severance costs, integration costs for Novartis AH, and asset impairments. In 2014, we recognized charges of $468.7 million for asset impairment, restructuring, and other special charges. The charges included severance costs, asset impairments primarily associated with the closure of a manufacturing site in Puerto Rico, and integration costs for the then-pending acquisition of Novartis AH. See Note 5 to the consolidated financial statements for additional information.
Other—net, (income) expense was income of $100.6 million in 2015, compared with income of $340.5 million in 2014. Other income in 2015 included net gains of $236.7 million on investments, partially offset by a net charge of $152.7 million related to the repurchase of $1.65 billion of debt. Other income in 2014 included net gains of $216.4 million on investments and $92.0 million of income associated with the transfer of commercial rights to linagliptin and empagliflozin in certain countries from us to Boehringer Ingelheim. See Notes 4 and 17 to the consolidated financial statements for additional information.
Our effective tax rate was 13.7 percent in 2015, compared with 20.3 percent in 2014. The effective tax rate for 2014 reflects the impact of a $119.0 million nondeductible charge associated with the U.S. Drug Fee. The decrease in the tax rate for 2015 compared with 2014 is primarily due to a favorable tax impact of the net charges related to the repurchase of debt, acquired IPR&D, and asset impairment, restructuring, and other special charges. See Note 13 to the consolidated financial statements for additional information.
FINANCIAL CONDITION
As of December 31, 2016, cash and cash equivalents was $4.58 billion, an increase of $915.7 million, compared with $3.67 billion at December 31, 2015. Refer to the Consolidated Statements of Cash Flows for additional details on the significant sources and uses of cash for the years ended December 31, 2016 and December 31, 2015.
In addition to our cash and cash equivalents, we held total investments of $6.66 billion and $4.43 billion as of December 31, 2016 and December 31, 2015, respectively. See Note 7 to the consolidated financial statements for additional details.
As of December 31, 2016, total debt was $10.31 billion, an increase of $2.33 billion compared with $7.98 billion at December 31, 2015. This increase is primarily due to the net issuance of $1.30 billion of short-term commercial paper borrowings and the $1.21 billion issuance of Swiss Franc debt. At December 31, 2016, we had a total of $2.87 billion of unused committed bank credit facilities, $2.70 billion of which is available to support our commercial paper program. See Note 10 to the consolidated financial statements for additional details. We believe that amounts accessible through existing commercial paper markets should be adequate to fund short-term borrowing needs.
In January 2017, we completed our acquisition of Boehringer Ingelheim Vetmedica, Inc.'s U.S. feline, canine, and rabies vaccine portfolio in an all-cash transaction for approximately $885 million, including the estimated cost of inventory, which was funded through the issuance of commercial paper. In January 2017, we announced an agreement to acquire CoLucid for $46.50 per share or approximately $960 million. We anticipate issuing debt to fund the transaction, which is expected to close by the end of the first quarter of 2017. See Note 3 to the consolidated financial statements for additional information.
For the 131st consecutive year, we distributed dividends to our shareholders. Dividends of $2.04 per share and $2.00 per share were paid in 2016 and 2015, respectively. In the fourth quarter of 2016, effective for the dividend to be paid in the first quarter of 2017, the quarterly dividend was increased to $0.52 per share, resulting in an indicated annual rate for 2017 of $2.08 per share.
Capital expenditures of $1.04 billion during 2016 were $29.2 million less than in 2015. We expect 2017 capital expenditures to be approximately $1.2 billion.
In 2016, we repurchased $540.1 million of shares under the $5.00 billion share repurchase program previously announced in October 2013. See Note 12 to the consolidated financial statements for additional details.
See "Results of Operations—Executive Overview—Other Matters" for information regarding recent and upcoming losses of patent protection for Evista (U.S.), Cymbalta (Europe), Alimta (U.S., Europe, and Japan), Zyprexa (Japan), Strattera (U.S.), Effient (U.S.), and Cialis (U.S. and Europe).

FINAN
CIAL
REPO
RT
F3737
At December 31, 2016, we had an aggregate of $9.77 billion of cash and investments at our foreign subsidiaries. A significant portion of this amount would be subject to tax payments if such cash and investments were repatriated to the U.S. We record U.S. deferred tax liabilities for certain unremitted earnings, but when foreign earnings are expected to be indefinitely reinvested outside the U.S., no accrual for U.S. income taxes is provided. We believe cash provided by operating activities in the U.S. and planned repatriations of foreign earnings for which tax has been provided should be sufficient to fund our domestic operating needs, dividends paid to shareholders, share repurchases, and capital expenditures.
Both domestically and abroad, we continue to monitor the potential impacts of the economic environment; the creditworthiness of our wholesalers and other customers, including foreign government-backed agencies and suppliers; the uncertain impact of health care legislation; and various international government funding levels.
In the normal course of business, our operations are exposed to fluctuations in interest rates and currency values. These fluctuations can vary the costs of financing, investing, and operating. We address a portion of these risks through a controlled program of risk management that includes the use of derivative financial instruments. The objective of controlling these risks is to limit the impact on earnings of fluctuations in interest and currency exchange rates. All derivative activities are for purposes other than trading.
Our primary interest rate risk exposure results from changes in short-term U.S. dollar interest rates. In an effort to manage interest rate exposures, we strive to achieve an acceptable balance between fixed and floating rate debt positions and may enter into interest rate derivatives to help maintain that balance. Based on our overall interest rate exposure at December 31, 2016 and 2015, including derivatives and other interest rate risk-sensitive instruments, a hypothetical 10 percent change in interest rates applied to the fair value of the instruments as of December 31, 2016 and 2015, respectively, would not have a material impact on earnings, cash flows, or fair values of interest rate risk-sensitive instruments over a one-year period.
Our foreign currency risk exposure results from fluctuating currency exchange rates, primarily the U.S. dollar against the euro, Japanese yen, and British pound; and the British pound and Swiss franc against the euro. We face foreign currency exchange exposures when we enter into transactions arising from subsidiary trade and loan payables and receivables denominated in foreign currencies. We also face currency exposure that arises from translating the results of our global operations to the U.S. dollar at exchange rates that have fluctuated from the beginning of the period. We may enter into foreign currency forward or option derivative contracts to reduce the effect of fluctuating currency exchange rates (principally the euro, the Japanese yen, and the British pound). Our corporate risk-management policy outlines the minimum and maximum hedge coverage of such exposures. Gains and losses on these derivative contracts offset, in part, the impact of currency fluctuations on the existing assets and liabilities. We periodically analyze the fair values of the outstanding foreign currency derivative contracts to determine their sensitivity to changes in foreign exchange rates. A hypothetical 10 percent change in exchange rates (primarily against the U.S. dollar) applied to the fair values of our outstanding foreign currency derivative contracts as of December 31, 2016 and 2015, would not have a material impact on earnings, cash flows, or financial position over a one-year period. This sensitivity analysis does not consider the impact that hypothetical changes in exchange rates would have on the underlying foreign currency denominated transactions.
Off-Balance Sheet Arrangements and Contractual Obligations
We have no off-balance sheet arrangements that have a material current effect or that are reasonably likely to have a material future effect on our financial condition, changes in financial condition, revenues or expenses, results of operations, liquidity, capital expenditures, or capital resources. We acquire and collaborate on potential products still in development and enter into research and development arrangements with third parties that often require milestone and royalty payments to the third party contingent upon the occurrence of certain future events linked to the success of the asset in development. Milestone payments may be required contingent upon the successful achievement of an important point in the development life cycle of the pharmaceutical product (e.g., approval for marketing by the appropriate regulatory agency or upon the achievement of certain sales levels). If required by the arrangement, we may make royalty payments based upon a percentage of the sales of the pharmaceutical product in the event that regulatory approval for marketing is obtained. Because of the contingent nature of these payments, they are not included in the table of contractual obligations below.
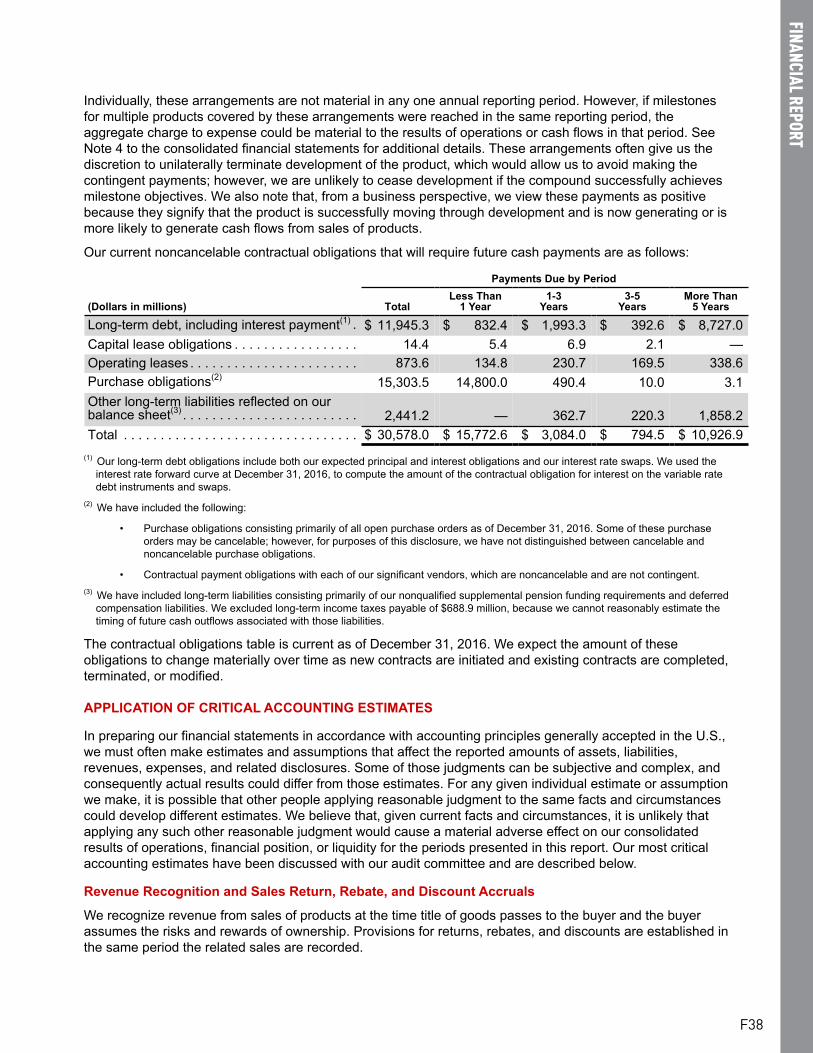
FINANCIAL REPORT
F3838
Individually, these arrangements are not material in any one annual reporting period. However, if milestones for multiple products covered by these arrangements were reached in the same reporting period, the aggregate charge to expense could be material to the results of operations or cash flows in that period. See Note 4 to the consolidated financial statements for additional details. These arrangements often give us the discretion to unilaterally terminate development of the product, which would allow us to avoid making the contingent payments; however, we are unlikely to cease development if the compound successfully achieves milestone objectives. We also note that, from a business perspective, we view these payments as positive because they signify that the product is successfully moving through development and is now generating or is more likely to generate cash flows from sales of products.
Our current noncancelable contractual obligations that will require future cash payments are as follows:
Payments Due by Period
(Dollars in millions) TotalLess Than
1 Year1-3
Years3-5
YearsMore Than
5 Years
Long-term debt, including interest payment(1) . $ 11,945.3 $ 832.4 $ 1,993.3 $ 392.6 $ 8,727.0Capital lease obligations . . . . . . . . . . . . . . . . . 14.4 5.4 6.9 2.1 —Operating leases . . . . . . . . . . . . . . . . . . . . . . . 873.6 134.8 230.7 169.5 338.6Purchase obligations(2) 15,303.5 14,800.0 490.4 10.0 3.1Other long-term liabilities reflected on our balance sheet(3) . . . . . . . . . . . . . . . . . . . . . . . . 2,441.2 — 362.7 220.3 1,858.2Total . . . . . . . . . . . . . . . . . . . . . . . . . . . . . . . . $ 30,578.0 $ 15,772.6 $ 3,084.0 $ 794.5 $ 10,926.9
(1) Our long-term debt obligations include both our expected principal and interest obligations and our interest rate swaps. We used the interest rate forward curve at December 31, 2016, to compute the amount of the contractual obligation for interest on the variable rate debt instruments and swaps.
(2) We have included the following:
• Purchase obligations consisting primarily of all open purchase orders as of December 31, 2016. Some of these purchase orders may be cancelable; however, for purposes of this disclosure, we have not distinguished between cancelable and noncancelable purchase obligations.
• Contractual payment obligations with each of our significant vendors, which are noncancelable and are not contingent.(3) We have included long-term liabilities consisting primarily of our nonqualified supplemental pension funding requirements and deferred
compensation liabilities. We excluded long-term income taxes payable of $688.9 million, because we cannot reasonably estimate the timing of future cash outflows associated with those liabilities.
The contractual obligations table is current as of December 31, 2016. We expect the amount of these obligations to change materially over time as new contracts are initiated and existing contracts are completed, terminated, or modified.
APPLICATION OF CRITICAL ACCOUNTING ESTIMATES
In preparing our financial statements in accordance with accounting principles generally accepted in the U.S., we must often make estimates and assumptions that affect the reported amounts of assets, liabilities, revenues, expenses, and related disclosures. Some of those judgments can be subjective and complex, and consequently actual results could differ from those estimates. For any given individual estimate or assumption we make, it is possible that other people applying reasonable judgment to the same facts and circumstances could develop different estimates. We believe that, given current facts and circumstances, it is unlikely that applying any such other reasonable judgment would cause a material adverse effect on our consolidated results of operations, financial position, or liquidity for the periods presented in this report. Our most critical accounting estimates have been discussed with our audit committee and are described below.
Revenue Recognition and Sales Return, Rebate, and Discount Accruals
We recognize revenue from sales of products at the time title of goods passes to the buyer and the buyer assumes the risks and rewards of ownership. Provisions for returns, rebates, and discounts are established in the same period the related sales are recorded.

FINAN
CIAL
REPO
RT
F3939
Sales Returns - Background and Uncertainties
We regularly review the supply levels of our significant products sold to major wholesalers in the U.S. and in major markets outside the U.S., primarily by reviewing periodic inventory reports supplied by our major wholesalers and available prescription volume information for our products, or alternative approaches. We attempt to maintain U.S. wholesaler inventory levels at an average of approximately one month or less on a consistent basis across our product portfolio. Causes of unusual wholesaler buying patterns include actual or anticipated product-supply issues, weather patterns, anticipated changes in the transportation network, redundant holiday stocking, and changes in wholesaler business operations. In the U.S., the current structure of our arrangements does not provide an incentive for speculative wholesaler buying and provides us with data on inventory levels at our wholesalers. When we believe wholesaler purchasing patterns have caused an unusual increase or decrease in the revenue of a major product compared with underlying demand, we disclose this in our product revenue discussion if we believe the amount is material to the product revenue trend; however, we are not always able to accurately quantify the amount of stocking or destocking in the retail channel. Wholesaler stocking and destocking activity historically has not caused any material changes in the rate of actual product returns.
When sales occur, we estimate a reserve for future product returns related to those sales. This estimate is based on several factors, including: historical return rates, expiration date by product (generally, 24 to 36 months after the initial sale of a product to our customer), and estimated levels of inventory in the wholesale and retail channels, among others, as well as any other specifically-identified anticipated returns due to known factors such as the loss of patent exclusivity, product recalls and discontinuances, or a changing competitive environment. We maintain a returns policy that allows U.S. pharmaceutical customers to return product for dating issues within a specified period prior to and subsequent to the product's expiration date. Following the loss of exclusivity for a patent-dependent product, we expect to experience an elevated level of product returns as product inventory remaining in the wholesale and retail channels expires. Adjustments to the returns reserve have been and may in the future be required based on revised estimates to our assumptions, which would have an impact on our consolidated results of operations. We record the return amounts as a deduction to arrive at our net product sales. Once the product is returned, it is destroyed. Actual product returns have been less than 2 percent of our net revenue over the past three years and have not fluctuated significantly as a percentage of revenue.
Sales Rebates and Discounts - Background and Uncertainties
We establish sales rebate and discount accruals in the same period as the related sales. The rebate and discount amounts are recorded as a deduction to arrive at our net product revenue. Sales rebates and discounts that require the use of judgment in the establishment of the accrual include managed care, Medicare, Medicaid, chargebacks, long-term care, hospital, patient assistance programs, and various other programs. We base these accruals primarily upon our historical rebate and discount payments made to our customer segment groups and the provisions of current rebate and discount contracts.
The largest of our sales rebate and discount amounts are rebates associated with sales covered by managed care, Medicare, and Medicaid contracts. In determining the appropriate accrual amount, we consider our historical managed care, Medicare, and Medicaid rebate payments by product as a percentage of our historical sales as well as any significant changes in sales trends (e.g., patent expiries and product launches), an evaluation of the current managed care, Medicare, and Medicaid contracts, the percentage of our products that are sold via managed care, Medicare, and Medicaid contracts, and our product pricing. Although we accrue a liability for managed care, Medicare, and Medicaid rebates at the time we record the sale (when the product is shipped), the managed care, Medicare, and Medicaid rebate related to that sale is paid up to six months later. Because of this time lag, in any particular period our rebate adjustments may incorporate revisions of accruals for several periods.
Most of our rebates outside the U.S. are contractual or legislatively mandated and are estimated and recognized in the same period as the related sales. In some large European countries, government rebates are based on the anticipated budget for pharmaceutical payments in the country. A best estimate of these rebates, updated as governmental authorities revise budgeted deficits, is recognized in the same period as the related sale. If our estimates are not reflective of the actual pharmaceutical costs incurred by the government, we adjust our rebate reserves.

FINANCIAL REPORT
F4040
Financial Statement Impact
We believe that our accruals for sales returns, rebates, and discounts are reasonable and appropriate based on current facts and circumstances. Our global rebate and discount liabilities are included in sales rebates and discounts on our consolidated balance sheet. Our global sales return liability is included in other current liabilities and other noncurrent liabilities on our consolidated balance sheet. As of December 31, 2016, a 5 percent change in our global sales return, rebate, and discount liability would have led to an approximate $214 million effect on our income before income taxes.
The portion of our global sales return, rebate, and discount liability resulting from sales of our products in the U.S. was 85 percent and 87 percent as of December 31, 2016 and 2015, respectively.
The following represents a roll-forward of our most significant U.S. pharmaceutical sales return, rebate, and discount liability balances, including managed care, Medicare, and Medicaid:
(Dollars in millions) 2016 2015Sales return, rebate, and discount liabilities, beginning of year . . . . . . . . . . . . . . . . . $ 2,558.6 $ 2,241.4
Reduction of net sales due to sales returns, discounts, and rebates(1) . . . . . . . . . 8,732.8 6,245.1Cash payments of discounts and rebates . . . . . . . . . . . . . . . . . . . . . . . . . . . . . . . (7,689.6) (5,927.9)
Sales return, rebate, and discount liabilities, end of year . . . . . . . . . . . . . . . . . . . . . $ 3,601.8 $ 2,558.6(1) Adjustments of the estimates for these returns, rebates, and discounts to actual results were less than 1.0 percent of consolidated net
sales for each of the years presented.
Product Litigation Liabilities and Other Contingencies
Background and Uncertainties
Product litigation liabilities and other contingencies are, by their nature, uncertain and are based upon complex judgments and probabilities. The factors we consider in developing our product litigation liability reserves and other contingent liability amounts include the merits and jurisdiction of the litigation, the nature and the number of other similar current and past litigation cases, the nature of the product and the current assessment of the science subject to the litigation, and the likelihood of settlement and current state of settlement discussions, if any. In addition, we accrue for certain product liability claims incurred, but not filed, to the extent we can formulate a reasonable estimate of their costs based primarily on historical claims experience and data regarding product usage. We accrue legal defense costs expected to be incurred in connection with significant product liability contingencies when both probable and reasonably estimable.
We also consider the insurance coverage we have to diminish the exposure for periods covered by insurance. In assessing our insurance coverage, we consider the policy coverage limits and exclusions, the potential for denial of coverage by the insurance company, the financial condition of the insurers, and the possibility of and length of time for collection. Due to a very restrictive market for product liability insurance, we are self-insured for product liability losses for all our currently marketed products. In addition to insurance coverage, we also consider any third-party indemnification to which we are entitled, including the nature of the indemnification, the financial condition of the indemnifying party, and the possibility of and length of time for collection.
Financial Statement Impact
The litigation accruals and environmental liabilities and the related estimated insurance recoverables have been reflected on a gross basis as liabilities and assets, respectively, on our consolidated balance sheets.
Impairment of Indefinite-Lived and Long-Lived Assets
Background and Uncertainties
We review the carrying value of long-lived assets (both intangible and tangible) for potential impairment on a periodic basis and whenever events or changes in circumstances indicate the carrying value of an asset (or asset group) may not be recoverable. We identify impairment by comparing the projected undiscounted cash flows to be generated by the asset (or asset group) to its carrying value. If an impairment is identified, a loss is recorded equal to the excess of the asset’s net book value over its fair value, and the cost basis is adjusted.

FINAN
CIAL
REPO
RT
F4141
Goodwill and indefinite-lived intangible assets are reviewed for impairment at least annually and when certain impairment indicators are present. When required, a comparison of fair value to the carrying amount of assets is performed to determine the amount of any impairment.
Several methods may be used to determine the estimated fair value of acquired IPR&D, all of which require multiple assumptions. We utilize the “income method,” as described in Note 8 to the consolidated financial statements.
For acquired IPR&D assets, the risk of failure has been factored into the fair value measure and there can be no certainty that these assets ultimately will yield a successful product, as discussed previously in “Results of Operations—Executive Overview—Late-Stage Pipeline." The nature of the pharmaceutical business is high-risk and requires that we invest in a large number of projects to maintain a successful portfolio of approved products. As such, it is likely that some acquired IPR&D assets will become impaired in the future.
Estimates of future cash flows, based on what we believe to be reasonable and supportable assumptions and projections, require management’s judgment. Actual results could vary materially from these estimates.
Retirement Benefits Assumptions
Background and Uncertainties
Defined benefit pension plan and retiree health benefit plan costs include assumptions for the discount rate, expected return on plan assets, and retirement age. These assumptions have a significant effect on the amounts reported. In addition to the analysis below, see Note 14 to the consolidated financial statements for additional information regarding our retirement benefits.
Annually, we evaluate the discount rate and the expected return on plan assets in our defined benefit pension and retiree health benefit plans. We use an actuarially determined, plan-specific yield curve of high quality, fixed income debt instruments to determine the discount rates. In evaluating the expected return on plan assets, we consider many factors, with a primary analysis of current and projected market conditions, asset returns and asset allocations (approximately 80 percent of which are growth investments); and the views of leading financial advisers and economists. We may also review our historical assumptions compared with actual results, as well as the discount rates and expected return on plan assets of other companies, where applicable. In evaluating our expected retirement age assumption, we consider the retirement ages of our past employees eligible for pension and medical benefits together with our expectations of future retirement ages.
Financial Statement Impact
If the 2016 discount rate for the U.S. defined benefit pension and retiree health benefit plans (U.S. plans) were to change by a quarter percentage point, income before income taxes would change by $34.6 million. As of January 1, 2016, we changed the method used to estimate the service and interest cost components of the net periodic pension and retiree health benefit plan costs. Prior to this change, the service and interest costs were determined using a single weighted-average discount rate based on yield curves of high quality, fixed income debt instruments used to measure the benefit obligation at the beginning of the period. This new method uses the spot yield curve approach to estimate the service and interest costs by applying the specific spot rates along the yield curve to the projected cash outflows of our obligations. The new method provides a more precise measure of interest and service costs by improving the correlation between the projected benefit cash flows and the specific spot yield curve rates. The change does not affect the measurement of the total benefit obligations as the change in service and interest costs is recorded in the actuarial gains and losses recorded in accumulated other comprehensive loss. We accounted for this as a change in estimate prospectively beginning in 2016.
If the 2016 expected return on plan assets for U.S. plans were to change by a quarter percentage point, income before income taxes would change by $23.4 million. If our assumption regarding the 2016 expected age of future retirees for U.S. plans were adjusted by one year, our income before income taxes would be affected by $43.8 million. The U.S. plans, including Puerto Rico, represent approximately 75 percent and 80 percent of the total projected benefit obligation and total plan assets, respectively, at December 31, 2016.

FINANCIAL REPORT
F4242
Income Taxes
Background and Uncertainties
We prepare and file tax returns based on our interpretation of tax laws and regulations and record estimates based on these judgments and interpretations. In the normal course of business, our tax returns are subject to examination by various taxing authorities, which may result in future tax, interest, and penalty assessments by these authorities. Inherent uncertainties exist in estimates of many tax positions due to changes in tax law resulting from legislation, regulation, and/or as concluded through the various jurisdictions’ tax court systems. We recognize the tax benefit from an uncertain tax position only if it is more likely than not that the tax position will be sustained on examination by the taxing authorities, based on the technical merits of the position. The tax benefits recognized in the financial statements from such a position are measured based on the largest benefit that has a greater than 50 percent likelihood of being realized upon ultimate resolution. The amount of unrecognized tax benefits is adjusted for changes in facts and circumstances. For example, adjustments could result from significant amendments to existing tax law, the issuance of regulations or interpretations by the taxing authorities, new information obtained during a tax examination, or resolution of an examination. We believe our estimates for uncertain tax positions are appropriate and sufficient to pay assessments that may result from examinations of our tax returns. We recognize both accrued interest and penalties related to unrecognized tax benefits in income tax expense.
We have recorded valuation allowances against certain of our deferred tax assets, primarily those that have been generated from net operating losses and tax credit carryforwards in certain taxing jurisdictions. In evaluating whether we would more likely than not recover these deferred tax assets, we have not assumed any future taxable income or tax planning strategies in the jurisdictions associated with these carryforwards where history does not support such an assumption. Implementation of tax planning strategies to recover these deferred tax assets or future income generation in these jurisdictions could lead to the reversal of these valuation allowances and a reduction of income tax expense.
Financial Statement Impact
As of December 31, 2016, a 5 percent change in the amount of the uncertain tax positions and the valuation allowance would result in a change in net income of $19.1 million and $32.4 million, respectively.
Acquisitions
Background and Uncertainties
To determine whether acquisitions or licensing transactions should be accounted for as a business combination or as an asset acquisition, we make certain judgments, which include assessing whether the acquired set of activities and assets would meet the definition of a business under the relevant accounting rules. As discussed further in Note 2 to the consolidated financial statements, a modified definition of a business is effective for our acquisitions subsequent to October 1, 2016.
If the acquired set of activities and assets meets the definition of a business, assets acquired and liabilities assumed are required to be recorded at their respective fair values as of the acquisition date. The excess of the purchase price over the fair value of the acquired net assets, where applicable, is recorded as goodwill. If the acquired set of activities and assets does not meet the definition of a business, the transaction is recorded as an acquisition of assets and, therefore, any acquired IPR&D that does not have an alternative future use is charged to expense at the acquisition date, and goodwill is not recorded. Refer to Note 3 to the consolidated financial statements for additional information.
The judgments made in determining estimated fair values assigned to assets acquired and liabilities assumed in a business combination, as well as estimated asset lives, can materially affect our consolidated results of operations. The fair values of intangible assets, including acquired IPR&D, are determined using information available near the acquisition date based on expectations and assumptions that are deemed reasonable by management. Depending on the facts and circumstances, we may deem it necessary to engage an independent valuation expert to assist in valuing significant assets and liabilities.
The fair values of identifiable intangible assets are primarily determined using an "income method," as described in Note 8 to the consolidated financial statements.

FINAN
CIAL
REPO
RT
F4343
The fair value of any contingent consideration liability that results from a business combination is determined using a market approach based on quoted market values, significant other observable inputs for identical or comparable assets or liabilities, or a discounted cash flow analysis. Estimating the fair value of contingent consideration requires the use of significant estimates and judgments, including, but not limited to, revenue and the discount rate.
Financial Statement Impact
As of December 31, 2016, a 5 percent change in the contingent consideration liability would result in a change in income before income taxes of $22.9 million.
LEGAL AND REGULATORY MATTERS
Information relating to certain legal proceedings can be found in Note 15 to the consolidated financial statements and is incorporated here by reference.
FINANCIAL EXPECTATIONS FOR 2017
For the full year of 2017, we expect EPS to be in the range of $2.69 to $2.79, which reflects the estimated acquired IPR&D charge related to the planned acquisition of CoLucid. We anticipate that total revenue will be between $21.8 billion and $22.3 billion. Excluding the impact of foreign exchange rates, we expect revenue growth from animal health products and a number of established pharmaceutical products including Trajenta, Forteo, and Humalog, as well as higher revenue from new products including Trulicity, Taltz, Basaglar®, Cyramza, Jardiance, and Lartruvo.
We anticipate that gross margin as a percent of revenue will be approximately 73.5 percent in 2017. Research and development expenses are expected to be in the range of $4.9 billion to $5.1 billion. Marketing, selling, and administrative expenses are expected to be in the range of $6.4 billion to $6.6 billion. Other—net, (income) expense is expected to be income of up to $100 million.
The 2017 tax rate is expected to be approximately 24.5 percent which reflects the non-deductibility for tax purposes of the estimated acquired IPR&D charge related to the planned acquisition of CoLucid.
Capital expenditures are expected to be approximately $1.2 billion.
Amortization and inventory step-up costs associated with the acquisition of Boehringer Ingelheim Vetmedica, Inc.'s U.S. feline, canine, and rabies vaccines portfolio included in our 2017 financial guidance are subject to final inventory quantities purchased and acquisition accounting adjustments. The acquired IPR&D charge related to the planned acquisition of CoLucid included in our 2017 financial guidance is subject to final accounting upon completion of the acquisition.

FINANCIAL REPORT
F4444
Financial Statements and Supplementary Data
Consolidated Statements of OperationsELI LILLY AND COMPANY AND SUBSIDIARIES(Dollars in millions and shares in thousands, except per-share data) Year Ended December 31 2016 2015 2014
Revenue . . . . . . . . . . . . . . . . . . . . . . . . . . . . . . . . . . . . . . . . . . . . $ 21,222.1 $ 19,958.7 $ 19,615.6Costs, expenses, and other:
Cost of sales . . . . . . . . . . . . . . . . . . . . . . . . . . . . . . . . . . . . . . . . 5,654.9 5,037.2 4,932.5Research and development . . . . . . . . . . . . . . . . . . . . . . . . . . . . . 5,243.9 4,796.4 4,733.6Marketing, selling, and administrative . . . . . . . . . . . . . . . . . . . . . 6,452.0 6,533.0 6,620.8Acquired in-process research and development (Notes 3 and 4)
30.0 535.0 200.2Asset impairment, restructuring, and other special charges (Note 5) . . . . . . . . . . . . . . . . . . . . . . . . . . . . . . . . . . . . . . . . . . . . 382.5 367.7 468.7Other—net, (income) expense (Note 17) . . . . . . . . . . . . . . . . . . 84.8 (100.6) (340.5)
17,848.1 17,168.7 16,615.3Income before income taxes . . . . . . . . . . . . . . . . . . . . . . . . . . . . . 3,374.0 2,790.0 3,000.3Income taxes (Note 13) . . . . . . . . . . . . . . . . . . . . . . . . . . . . . . . . . 636.4 381.6 609.8Net income . . . . . . . . . . . . . . . . . . . . . . . . . . . . . . . . . . . . . . . . . . $ 2,737.6 $ 2,408.4 $ 2,390.5
Earnings per share: . . . . . . . . . . . . . . . . . . . . . . . . . . . . . . . . . . . .Basic . . . . . . . . . . . . . . . . . . . . . . . . . . . . . . . . . . . . . . . . . . . . . . $ 2.59 $ 2.27 $ 2.23Diluted . . . . . . . . . . . . . . . . . . . . . . . . . . . . . . . . . . . . . . . . . . . . . $ 2.58 $ 2.26 $ 2.23
Shares used in calculation of earnings per share: . . . . . . . . . . . . .Basic . . . . . . . . . . . . . . . . . . . . . . . . . . . . . . . . . . . . . . . . . . . . . . 1,058,324 1,061,913 1,069,932Diluted . . . . . . . . . . . . . . . . . . . . . . . . . . . . . . . . . . . . . . . . . . . . . 1,061,825 1,065,720 1,074,286
See notes to consolidated financial statements.
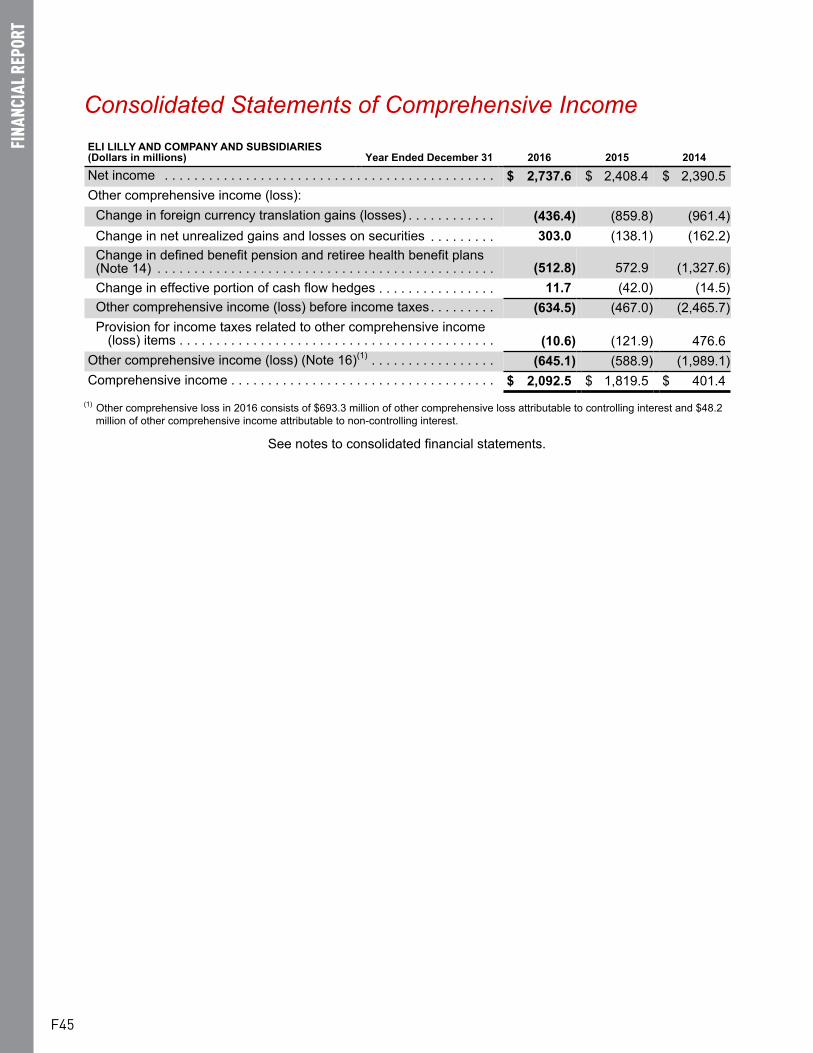
FINAN
CIAL
REPO
RT
F4545
Consolidated Statements of Comprehensive IncomeELI LILLY AND COMPANY AND SUBSIDIARIES(Dollars in millions) Year Ended December 31 2016 2015 2014
Net income . . . . . . . . . . . . . . . . . . . . . . . . . . . . . . . . . . . . . . . . . . . . . $ 2,737.6 $ 2,408.4 $ 2,390.5Other comprehensive income (loss):
Change in foreign currency translation gains (losses) . . . . . . . . . . . . (436.4) (859.8) (961.4)Change in net unrealized gains and losses on securities . . . . . . . . . 303.0 (138.1) (162.2)Change in defined benefit pension and retiree health benefit plans(Note 14) . . . . . . . . . . . . . . . . . . . . . . . . . . . . . . . . . . . . . . . . . . . . . . (512.8) 572.9 (1,327.6)Change in effective portion of cash flow hedges . . . . . . . . . . . . . . . . 11.7 (42.0) (14.5)Other comprehensive income (loss) before income taxes. . . . . . . . . (634.5) (467.0) (2,465.7)Provision for income taxes related to other comprehensive income
(loss) items . . . . . . . . . . . . . . . . . . . . . . . . . . . . . . . . . . . . . . . . . . . (10.6) (121.9) 476.6Other comprehensive income (loss) (Note 16)(1) . . . . . . . . . . . . . . . . . (645.1) (588.9) (1,989.1)Comprehensive income . . . . . . . . . . . . . . . . . . . . . . . . . . . . . . . . . . . . $ 2,092.5 $ 1,819.5 $ 401.4
(1) Other comprehensive loss in 2016 consists of $693.3 million of other comprehensive loss attributable to controlling interest and $48.2 million of other comprehensive income attributable to non-controlling interest.
See notes to consolidated financial statements.

FINANCIAL REPORT
F4646
Consolidated Balance SheetsELI LILLY AND COMPANY AND SUBSIDIARIES(Dollars in millions, shares in thousands) December 31 2016 2015
AssetsCurrent Assets
Cash and cash equivalents (Note 7) . . . . . . . . . . . . . . . . . . . . . . . . . . . . . . . . $ 4,582.1 $ 3,666.4Short-term investments (Note 7) . . . . . . . . . . . . . . . . . . . . . . . . . . . . . . . . . . . 1,456.5 785.4Accounts receivable, net of allowances of $40.3 (2016) and $44.3 (2015) . . . 4,029.4 3,513.0Other receivables . . . . . . . . . . . . . . . . . . . . . . . . . . . . . . . . . . . . . . . . . . . . . . . 736.9 558.6Inventories (Note 6) . . . . . . . . . . . . . . . . . . . . . . . . . . . . . . . . . . . . . . . . . . . . . 3,561.9 3,445.8Prepaid expenses and other . . . . . . . . . . . . . . . . . . . . . . . . . . . . . . . . . . . . . . 734.6 604.4
Total current assets . . . . . . . . . . . . . . . . . . . . . . . . . . . . . . . . . . . . . . . . . . . . . . . 15,101.4 12,573.6Other Assets
Investments (Note 7) . . . . . . . . . . . . . . . . . . . . . . . . . . . . . . . . . . . . . . . . . . . . 5,207.5 3,646.6Goodwill (Note 8) . . . . . . . . . . . . . . . . . . . . . . . . . . . . . . . . . . . . . . . . . . . . . . . 3,972.7 4,039.9Other intangibles, net (Note 8) . . . . . . . . . . . . . . . . . . . . . . . . . . . . . . . . . . . . . 4,357.9 5,034.8Sundry . . . . . . . . . . . . . . . . . . . . . . . . . . . . . . . . . . . . . . . . . . . . . . . . . . . . . . . 1,913.8 2,220.5
Total other assets . . . . . . . . . . . . . . . . . . . . . . . . . . . . . . . . . . . . . . . . . . . . . . . . . 15,451.9 14,941.8Property and equipment, net (Note 9) . . . . . . . . . . . . . . . . . . . . . . . . . . . . . . . . . 8,252.6 8,053.5Total assets . . . . . . . . . . . . . . . . . . . . . . . . . . . . . . . . . . . . . . . . . . . . . . . . . . . . . $ 38,805.9 $ 35,568.9Liabilities and EquityCurrent Liabilities
Short-term borrowings and current maturities of long-term debt (Note 10) . . . $ 1,937.4 $ 6.1Accounts payable . . . . . . . . . . . . . . . . . . . . . . . . . . . . . . . . . . . . . . . . . . . . . . . 1,349.3 1,338.2Employee compensation . . . . . . . . . . . . . . . . . . . . . . . . . . . . . . . . . . . . . . . . . 896.9 967.0Sales rebates and discounts . . . . . . . . . . . . . . . . . . . . . . . . . . . . . . . . . . . . . . 3,914.9 2,560.1Dividends payable . . . . . . . . . . . . . . . . . . . . . . . . . . . . . . . . . . . . . . . . . . . . . . 548.1 539.0Income taxes payable (Note 13) . . . . . . . . . . . . . . . . . . . . . . . . . . . . . . . . . . . 119.1 358.9Other current liabilities . . . . . . . . . . . . . . . . . . . . . . . . . . . . . . . . . . . . . . . . . . . 2,220.9 2,460.3
Total current liabilities . . . . . . . . . . . . . . . . . . . . . . . . . . . . . . . . . . . . . . . . . . . . . . 10,986.6 8,229.6Other Liabilities
Long-term debt (Note 10) . . . . . . . . . . . . . . . . . . . . . . . . . . . . . . . . . . . . . . . . . 8,367.8 7,972.4Accrued retirement benefits (Note 14) . . . . . . . . . . . . . . . . . . . . . . . . . . . . . . . 2,453.9 2,160.3Long-term income taxes payable (Note 13) . . . . . . . . . . . . . . . . . . . . . . . . . . . 688.9 868.9Other noncurrent liabilities . . . . . . . . . . . . . . . . . . . . . . . . . . . . . . . . . . . . . . . . 2,228.2 1,747.4
Total other liabilities . . . . . . . . . . . . . . . . . . . . . . . . . . . . . . . . . . . . . . . . . . . . . . . 13,738.8 12,749.0
Commitments and Contingencies (Note 15)
Eli Lilly and Company Shareholders' Equity (Notes 11 and 12)Common stock—no par value Authorized shares: 3,200,000 Issued shares: 1,101,586 (2016) and 1,106,063 (2015) . . . . . . . . . . . . . . . . 688.5 691.3Additional paid-in capital . . . . . . . . . . . . . . . . . . . . . . . . . . . . . . . . . . . . . . . . . 5,640.6 5,552.1Retained earnings . . . . . . . . . . . . . . . . . . . . . . . . . . . . . . . . . . . . . . . . . . . . . . 16,046.3 16,011.8Employee benefit trust . . . . . . . . . . . . . . . . . . . . . . . . . . . . . . . . . . . . . . . . . . . (3,013.2) (3,013.2)Accumulated other comprehensive loss (Note 16) . . . . . . . . . . . . . . . . . . . . . . (5,274.0) (4,580.7)Cost of common stock in treasury . . . . . . . . . . . . . . . . . . . . . . . . . . . . . . . . . . (80.5) (90.0)
Total Eli Lilly and Company shareholders' equity . . . . . . . . . . . . . . . . . . . . . . . . . 14,007.7 14,571.3Noncontrolling interests . . . . . . . . . . . . . . . . . . . . . . . . . . . . . . . . . . . . . . . . . . . . 72.8 19.0Total equity . . . . . . . . . . . . . . . . . . . . . . . . . . . . . . . . . . . . . . . . . . . . . . . . . . . . . . 14,080.5 14,590.3Total liabilities and equity . . . . . . . . . . . . . . . . . . . . . . . . . . . . . . . . . . . . . . . . . . . $ 38,805.9 $ 35,568.9
See notes to consolidated financial statements.

FINAN
CIAL
REPO
RT
F4747
Consolidated Statements of Shareholders' Equity
ELI LILLY AND COMPANY AND SUBSIDIARIES(Dollars in millions, shares in thousands)
Common StockAdditional
Paid-inCapital
RetainedEarnings
AccumulatedOther
ComprehensiveLoss
Common Stock inTreasury
EmployeeBenefitTrust
Shareholders'EquityShares Amount Shares Amount
Balance at January 1, 2014 . . . . 1,117,628 $ 698.5 $ 5,050.0 $16,992.4 $ (2,002.7) 833 $ (93.6) $ (3,013.2) $ 17,631.4
Net income . . . . . . . . . . . . . . . . . 2,390.5 2,390.5Other comprehensive income(loss), net of tax . . . . . . . . . . . . . (1,989.1) (1,989.1)
Cash dividends declared pershare: $1.97 . . . . . . . . . . . . . . . . (2,108.1) (2,108.1)
Retirement of treasury shares . . (12,579) (7.9) (792.1) (12,579) 800.0 —
Purchase of treasury shares . . . 12,579 (800.0) (800.0)
Issuance of stock underemployee stock plans, net . . . . . 6,388 4.0 86.3 (23) 2.2 92.5
Stock-based compensation . . . . 156.0 156.0
Balance at December 31, 2014 . 1,111,437 694.6 5,292.3 16,482.7 (3,991.8) 810 (91.4) (3,013.2) 15,373.2
Net income . . . . . . . . . . . . . . . . . 2,408.4 2,408.4Other comprehensive income(loss), net of tax . . . . . . . . . . . . . (588.9) (588.9)Cash dividends declared pershare: $2.01 . . . . . . . . . . . . . . . . (2,136.0) (2,136.0)
Retirement of treasury shares . . (9,877) (6.2) (743.3) (9,877) 749.5 —
Purchase of treasury shares . . . 9,877 (749.5) (749.5)
Issuance of stock underemployee stock plans, net . . . 4,503 2.9 42.0 (14) 1.4 46.3
Stock-based compensation . . . . 217.8 217.8
Balance at December 31, 2015 . 1,106,063 691.3 5,552.1 16,011.8 (4,580.7) 796 (90.0) (3,013.2) 14,571.3
Net income . . . . . . . . . . . . . . . . . 2,737.6 2,737.6Other comprehensive income(loss), net of tax . . . . . . . . . . . . . (693.3) (693.3)Cash dividends declared pershare: $2.05 . . . . . . . . . . . . . . . . (2,167.6) (2,167.6)Retirement of treasury shares . . (7,306) (4.6) (535.5) (7,306) 540.1 —Purchase of treasury shares . . . (60.0) 7,306 (540.1) (600.1)Issuance of stock under
employee stock plans, net . . . 2,829 1.8 (106.8) (85) 9.5 (95.5)Stock-based compensation . . . . 255.3 255.3
Balance at December 31, 2016 . 1,101,586 $ 688.5 $ 5,640.6 $16,046.3 $ (5,274.0) 711 $ (80.5) $ (3,013.2) $ 14,007.7
See notes to consolidated financial statements.

FINANCIAL REPORT
F4848
Consolidated Statements of Cash FlowsELI LILLY AND COMPANY AND SUBSIDIARIES(Dollars in millions) Year Ended December 31 2016 2015 2014
Cash Flows from Operating ActivitiesNet income . . . . . . . . . . . . . . . . . . . . . . . . . . . . . . . . . . . . . . . . . . . . . $ 2,737.6 $ 2,408.4 $ 2,390.5
Adjustments to Reconcile Net Incometo Cash Flows from Operating Activities:
Depreciation and amortization . . . . . . . . . . . . . . . . . . . . . . . . . . . 1,496.6 1,427.7 1,379.0Change in deferred income taxes . . . . . . . . . . . . . . . . . . . . . . . . . 439.5 (748.4) 36.8Stock-based compensation expense . . . . . . . . . . . . . . . . . . . . . . 255.3 217.8 156.0Acquired in-process research and development . . . . . . . . . . . . . 30.0 535.0 200.2Net proceeds from (payments for) terminations of interest rateswaps . . . . . . . . . . . . . . . . . . . . . . . . . . . . . . . . . . . . . . . . . . . . . . (3.4) (186.1) 340.7Other non-cash operating activities, net . . . . . . . . . . . . . . . . . . . . 379.5 449.4 280.7Other changes in operating assets and liabilities, net ofacquisitions and divestitures:
Receivables—(increase) decrease. . . . . . . . . . . . . . . . . . . . . . . (709.4) (304.5) 117.4Inventories—(increase) decrease. . . . . . . . . . . . . . . . . . . . . . . . (328.2) (736.3) (307.1)Other assets—(increase) decrease . . . . . . . . . . . . . . . . . . . . . . (265.5) (288.5) 673.2Accounts payable and other liabilities—increase (decrease) . . . 819.0 190.1 (809.0)
Net Cash Provided by Operating Activities . . . . . . . . . . . . . . . . . . 4,851.0 2,964.6 4,458.4Cash Flows from Investing Activities
Purchases of property and equipment . . . . . . . . . . . . . . . . . . . . . (1,037.0) (1,066.2) (1,162.6)Disposals of property and equipment . . . . . . . . . . . . . . . . . . . . . . 73.4 92.6 15.3Cash released (restricted) for pending acquisition (Note 3) . . . . . — 5,405.6 (5,405.6)Proceeds from sales and maturities of short-term investments . . 1,642.0 2,161.8 4,054.1Purchases of short-term investments . . . . . . . . . . . . . . . . . . . . . . (1,327.4) (842.2) (1,637.8)Proceeds from sales of noncurrent investments. . . . . . . . . . . . . . 2,086.0 3,068.4 11,009.4Purchases of noncurrent investments . . . . . . . . . . . . . . . . . . . . . (4,346.0) (3,226.5) (9,802.7)Proceeds from sale of product rights . . . . . . . . . . . . . . . . . . . . . . — 410.0 —Purchase of product rights . . . . . . . . . . . . . . . . . . . . . . . . . . . . . . — — (308.3)Purchases of in-process research and development . . . . . . . . . . (55.0) (560.0) (95.0)Cash paid for acquisitions, net of cash acquired (Note 3) . . . . . . (45.0) (5,283.1) (551.4)Other investing activities, net . . . . . . . . . . . . . . . . . . . . . . . . . . . . (130.1) (133.6) (24.5)
Net Cash Provided by (Used for) Investing Activities . . . . . . . . . . (3,139.1) 26.8 (3,909.1)Cash Flows from Financing Activities
Dividends paid . . . . . . . . . . . . . . . . . . . . . . . . . . . . . . . . . . . . . . . (2,158.5) (2,127.3) (2,101.2)Net change in short-term borrowings . . . . . . . . . . . . . . . . . . . . . . 1,293.2 (2,680.6) 2,680.6Proceeds from issuance of long-term debt . . . . . . . . . . . . . . . . . . 1,206.6 4,454.7 992.9Repayments of long-term debt . . . . . . . . . . . . . . . . . . . . . . . . . . . (0.2) (1,955.7) (1,034.8)Purchases of common stock . . . . . . . . . . . . . . . . . . . . . . . . . . . . (600.1) (749.5) (800.0)Other financing activities, net . . . . . . . . . . . . . . . . . . . . . . . . . . . . (300.8) (52.6) 96.1
Net Cash Used for Financing Activities . . . . . . . . . . . . . . . . . . . . . (559.8) (3,111.0) (166.4)Effect of exchange rate changes on cash and cash equivalents. . . . . (236.4) (85.6) (341.5)Net increase (decrease) in cash and cash equivalents . . . . . . . . . . . . 915.7 (205.2) 41.4Cash and cash equivalents at beginning of year . . . . . . . . . . . . . . . . 3,666.4 3,871.6 3,830.2Cash and Cash Equivalents at End of Year . . . . . . . . . . . . . . . . . . $ 4,582.1 $ 3,666.4 $ 3,871.6
See notes to consolidated financial statements.

FINAN
CIAL
REPO
RT
F4949
Notes to Consolidated Financial StatementsELI LILLY AND COMPANY AND SUBSIDIARIES(Tables present dollars in millions, except per-share data)
Note 1: Summary of Significant Accounting Policies
Basis of presentation
The accompanying consolidated financial statements have been prepared in accordance with accounting principles generally accepted in the United States (GAAP). The accounts of all wholly-owned and majority-owned subsidiaries are included in the consolidated financial statements. Where our ownership of consolidated subsidiaries is less than 100 percent, the noncontrolling shareholders’ interests are reflected as a separate component of equity. All intercompany balances and transactions have been eliminated.
The preparation of financial statements in conformity with GAAP requires management to make estimates and assumptions that affect the reported amounts of assets, liabilities, revenues, expenses, and related disclosures at the date of the financial statements and during the reporting period. Actual results could differ from those estimates. We issued our financial statements by filing with the Securities and Exchange Commission and have evaluated subsequent events up to the time of the filing.
Certain reclassifications have been made to prior periods in the consolidated financial statements and accompanying notes to conform with the current presentation.
All per-share amounts, unless otherwise noted in the footnotes, are presented on a diluted basis, that is, based on the weighted-average number of outstanding common shares plus the effect of incremental shares from our stock-based compensation programs.
Revenue recognition
We recognize revenue from sales of products at the time title of goods passes to the buyer and the buyer assumes the risks and rewards of ownership. Provisions for returns, discounts, and rebates are established in the same period the related sales are recognized.
In arrangements involving the delivery of more than one element (e.g., research and development, marketing and selling, manufacturing, and distribution), each required deliverable is evaluated to determine whether it qualifies as a separate unit of accounting. Our determination is based on whether the deliverable has "standalone value" to the customer. If a deliverable does not qualify as a separate unit of accounting, it is combined with the other applicable undelivered item(s) within the arrangement and these combined deliverables are treated as a single unit of accounting. The arrangement's consideration that is fixed or determinable is then allocated to each separate unit of accounting based on the relative selling price of each deliverable.
Initial fees we receive in collaborative and other similar arrangements from the partnering of our compounds under development are generally deferred and amortized into income through the expected product approval date. Initial fees may also be received for out-licensing agreements that include both an out-license of our marketing rights to commercialized products and a related commitment to supply the products. When we have determined that the marketing rights do not have standalone value, the initial fees received are generally deferred and amortized to income as net product sales over the term of the supply agreement.
Royalty revenue from licensees, which is based on third-party sales of licensed products and technology, is recorded as earned in accordance with the contract terms when third-party sales can be reasonably measured and collection of the funds is reasonably assured. This royalty revenue is included in collaboration and other revenue.
Profit-sharing due from our collaboration partners, which is based upon gross margins reported to us by our partners, is recognized as collaboration and other revenue as earned.

FINANCIAL REPORT
F5050
Developmental milestone payments earned by us are generally recorded in other–net, (income) expense. We immediately recognize the full amount of developmental milestone payments due to us upon the achievement of the milestone event if the event is objectively determinable and the milestone is substantive in its entirety. A milestone is considered substantive if the consideration earned 1) relates solely to past performance, 2) is commensurate with the enhancement in the pharmaceutical or animal health product's value associated with the achievement of the important event in its development life cycle, and 3) is reasonable relative to all of the deliverables and payment terms within the arrangement. If a milestone payment to us is part of a multiple-element commercialization arrangement and is triggered by the initiation of the commercialization period (e.g., regulatory approval for marketing or launch of the product) or the achievement of a sales-based threshold, we amortize the payment to income as we perform under the terms of the arrangement. See Note 4 for specific agreement details.
Research and development expenses and acquired in-process research and development
Research and development expenses include the following:
• Research and development costs, which are expensed as incurred.
• Milestone payment obligations incurred prior to regulatory approval of the product, which are accrued when the event requiring payment of the milestone occurs.
Acquired in-process research and development (IPR&D) expense includes the initial costs of IPR&D projects, acquired directly in a transaction other than a business combination, that do not have an alternative future use.
Earnings per share
We calculate basic earnings per share (EPS) based on the weighted-average number of common shares outstanding and incremental shares from potential participating securities. We calculate diluted EPS based on the weighted-average number of common shares outstanding, including incremental shares from our stock-based compensation programs.
Foreign Currency Translation
Operations in our subsidiaries outside the United States (U.S.) are recorded in the functional currency of each subsidiary which is determined by a review of the environment where each subsidiary primarily generates and expends cash. The results of operations for our subsidiaries outside the U.S. are translated from functional currencies into U.S. dollars using the weighted average currency rate for the period. Assets and liabilities are translated using the period end exchange rates. The U.S. dollar effects that arise from translating the net assets of these subsidiaries are recorded in other comprehensive income (loss).
Other significant accounting policies
Our other significant accounting policies are described in the remaining appropriate notes to the consolidated financial statements.

FINAN
CIAL
REPO
RT
F5151
Note 2: Implementation of New Financial Accounting Pronouncements
During 2016, we elected to early adopt Accounting Standards Update 2016-09, Compensation - Stock Compensation: Improvements to Employee Share-Based Payment Accounting which changes the accounting and reporting for certain aspects of share-based payments to employees. This standard requires us to reflect any adjustments relating to share-based payments to employees as of January 1, 2016, the beginning of the annual period that includes the interim period of adoption. The following table provides a brief description of the changes to the presentation of the financial statements and the impact of adoption:
Description of changes Method of adoptionEffect on the financial statements or othersignificant matters
All excess tax benefits and taxdeficiencies are recognized in thestatement of operations as a discrete itemin the reporting period in which they occur.
Prospective We recognized $39.5 million of excess taxbenefits in income taxes in 2016. Wecannot predict the impact on ourconsolidated financial statements in futurereporting periods following adoption asthis will be dependent upon variousfactors including the number of sharesissued and changes in the price of ourstock between the grant date andsettlement date.
Excess tax benefits and deficiencies onthe statement of cash flows are classifiedas an operating activity.
Retrospective We reclassified $72.5 million of excess taxbenefits in 2015 and $2.1 million of excesstax deficiencies in 2014 from cash flowsfrom financing activities to cash flows fromoperating activities on the consolidatedstatements of cash flows.
Employee taxes paid when an employer withholds shares for tax-withholding purposes on the statement of cash flows are classified as a financing activity.
Retrospective We reclassified $119.3 million and $93.4million in 2015 and 2014, respectively, ofemployee taxes paid from cash flows fromoperating activities to cash flows fromfinancing activities on the consolidatedstatements of cash flows.
As of December 31, 2016, we adopted Accounting Standards Update 2015-07, Disclosures for Investments in Certain Entities that Calculate Net Asset Value per Share (or Its Equivalent). This standard removed the requirement to categorize within the fair value hierarchy all investments for which fair value is measured using the net asset value (NAV) per share as a practical expedient. This standard was adopted retrospectively and only impacted the disclosure of our benefit plan investments in Note 14.
As of October 1, 2016, we adopted Accounting Standards Update 2017-01, Clarifying the Definition of a Business. This definition is used in determining whether acquisitions are accounted for as business combinations or as the acquisition of assets. This standard modifies the definition of a business, including providing a screen to determine when an acquired set of assets and activities is not a business. The screen requires that when substantially all of the fair value of the gross assets acquired is concentrated in a single identifiable asset or a group of similar identifiable assets, the set is not a business. The standard also makes other modifications to clarify what must be included in an acquired set for it to be a business and how to evaluate the set to determine whether it is a business. Our acquisitions subsequent to October 1, 2016, are subject to the application of the modified definition. The new definition would also be used to evaluate whether any disposals represent the disposal of a business.

FINANCIAL REPORT
F5252
The following table provides a brief description of accounting standards that have not yet been adopted and could have a material effect on our financial statements:
Standard Description Effective Date
Effect on the financialstatements or othersignificant matters
Accounting Standards Update 2014-09, Revenue from Contracts with Customers
This standard will replace existingrevenue recognition standards andwill require entities to recognizerevenues to depict the transfer ofpromised goods or services tocustomers in an amount thatreflects the consideration to whichthe entity expects to be entitled inexchange for those goods orservices. An entity can apply thenew revenue standardretrospectively to each priorreporting period presented or withthe cumulative effect of initiallyapplying the standard recognizedat the date of initial application inretained earnings. We currentlyplan to use the latter approach.
This standard iseffective January1, 2018, but weare permitted toadopt thisstandard one yearearlier if wechoose. We intendto adopt thisstandard onJanuary 1, 2018.
We are in the process of evaluating the impact of the adoption of the standard. We have identified two revenue streams from our contracts with customers: 1) product sales and 2) licensing arrangements.
While our evaluation of our contracts for product sales is not yet complete, based upon the results of our work to date we currently do not expect the application of the new standard to these contracts to have a material impact to our consolidated financial statements either at initial implementation or on an ongoing basis.
We are in the process of reviewing arrangements in which we have licensed or sold intellectual property and are not yet able to estimate the anticipated impact to our consolidated financial statements from the application of the new standard to our arrangements as we continue to interpret and apply the principles in the new standard to our arrangements.
Accounting Standards Update 2016-01, Financial Instruments - Overall: Recognition and Measurement of Financial Assets and Financial Liabilities
This standard will require entitiesto recognize changes in the fairvalue of equity investments withreadily determinable fair values innet income (except forinvestments accounted for underthe equity method of accounting orthose that result in consolidation ofthe investee). An entity shouldapply the new standard through acumulative effect adjustment toretained earnings as of thebeginning of the fiscal year ofadoption.
This standard iseffective January1, 2018. Earlyadoption of themajority of theamendments inthis standard is notpermitted,however, earlyapplication ofcertainamendments ispermitted. Weintend to fullyadopt thisstandard onJanuary 1, 2018.
We are unable toestimate the impact ofadopting this standard asthe significance of theimpact will depend uponour equity investments asof the date of adoption.

FINAN
CIAL
REPO
RT
F5353
Standard Description Effective Date
Effect on the financialstatements or othersignificant matters
Accounting Standards Update 2016-02, Leases
This standard was issued toincrease transparency andcomparability amongorganizations by recognizing leaseassets and lease liabilities,including leases classified asoperating leases under currentGAAP, on the balance sheet andrequiring additional disclosuresabout leasing arrangements. Thisstandard requires a modifiedretrospective approach toadoption.
This standard iseffective January1, 2019, with earlyadoptionpermitted. Weintend to adoptthis standard onJanuary 1, 2019.
We are in the process ofdetermining the potentialimpact on ourconsolidated financialstatements.
AccountingStandards Update2016-16, IncomeTaxes: Intra-EntityTransfers of AssetsOther Than Inventory
This standard will require entities to recognize the income tax consequences of intra-entity transfers of assets other than inventory at the time of transfer. This standard requires a modifiedretrospective approach to adoption.
This standard is effective January1, 2018, with early adoption permitted. We intend to adopt this standard on January 1, 2018.
We are continuing toassess the potentialimpact of this standard onour consolidated financialstatements and currentlyestimate that thecumulative effect ofinitially applying thestandard would result inan increase to theopening balance ofretained earnings ofapproximately $2 billionon January 1, 2018. Thisestimate is subject tochange based upon 2017intra-entity transfers ofassets other thaninventory and ongoingassessments of the futuredeductibility andrealizability of thedeferred tax assets thatwould result fromimplementation.
Note 3: Acquisitions
During 2015 and 2014, we completed the acquisitions of Novartis Animal Health (Novartis AH) and Lohmann SE (Lohmann AH), respectively. Additionally, on October 1, 2015, Bristol-Myers Squibb Company and E.R. Squibb (collectively, BMS) transferred to us their commercialization rights with respect to Erbitux® in the U.S. and Canada (collectively, North America) through a modification of our existing arrangement. We also had an immaterial acquisition of a business in April 2016. These transactions were accounted for as business combinations under the acquisition method of accounting. See Note 4 for additional information related to the Erbitux arrangement. The assets acquired and liabilities assumed were recorded at their respective fair values as of the acquisition date in our consolidated financial statements. The determination of estimated fair value required management to make significant estimates and assumptions. The excess of the purchase price over the fair value of the acquired net assets, where applicable, has been recorded as goodwill. The results of operations of these acquisitions are included in our consolidated financial statements from the dates of acquisition.
During 2016, we announced an agreement to acquire Boehringer Ingelheim Vetmedica, Inc.'s U.S. feline, canine, and rabies vaccine portfolio which was subsequently completed in January 2017. Details of this transaction are discussed below in Acquisitions of Businesses.

FINANCIAL REPORT
F5454
In addition to the acquisitions of businesses, we also acquired assets in development in 2016, 2015, and 2014 which are further discussed in this note below in Asset Acquisitions. Upon acquisition, the acquired IPR&D related to these products was immediately written off as an expense because the products had no alternative future use. For the years ended December 31, 2016, 2015, and 2014, we recorded acquired IPR&D charges of $30.0 million, $535.0 million, and $200.2 million, respectively. The 2016 charge was associated with the transaction discussed in this note below in Asset Acquisitions. The 2015 charges were associated with the transactions discussed in this note below in Asset Acquisitions and the upfront fee of $200.0 million related to tanezumab. The 2014 charges were associated with the transactions discussed below in Asset Acquisitions and a $55.2 million charge related to the transfer to us of Boehringer Ingelheim's rights to co-promote our new insulin glargine product in countries where it was not yet approved. See Note 4 for additional information related to the tanezumab and Boehringer Ingelheim arrangements.
In January 2017, we announced an agreement to acquire CoLucid Pharmaceuticals, Inc. (CoLucid), including its Phase III molecule, lasmiditan, an oral therapy for the acute treatment of migraine. Substantially all of the value of CoLucid is related to lasmiditan, its only significant asset, and we expect to account for the transaction as the acquisition of an asset. Under the terms of the agreement, we will acquire all of shares of CoLucid for a purchase price of $46.50 per share or approximately $960 million. The transaction is expected to close in the first quarter of 2017, subject to clearance under the Hart-Scott-Rodino Antitrust Improvements Act and other customary closing conditions. In addition, a shareholder lawsuit has been filed seeking to enjoin the closing of the transaction. We expect an acquired IPR&D charge of approximately $850 million (no tax benefit) in the first quarter of 2017. The amount will not be finalized until after the completion of the acquisition.
Acquisitions of Businesses
Subsequent Event - Boehringer Ingelheim Vetmedica, Inc. Vaccine Portfolio Acquisition
Overview of Transaction
On January 3, 2017, we acquired Boehringer Ingelheim Vetmedica, Inc.'s U.S. feline, canine, and rabies vaccine portfolio in an all-cash transaction for approximately $885 million, subject to final inventory quantities purchased and other adjustments. Under the terms of the agreement, we acquired a manufacturing and research and development site, a U.S. vaccine portfolio including vaccines used for the treatment of bordetella, Lyme disease, rabies, and parvovirus, among others, as well as several pipeline assets. The accounting impact of this acquisition and the results of the operations will be included in our financial statements beginning on January 3, 2017.
Assets Acquired and Liabilities Assumed
The initial accounting for this acquisition is incomplete. Significant, relevant information needed to complete the initial accounting is not available because the valuation of assets acquired and liabilities assumed is not complete. As a result, determining these values is not practicable and we are unable to disclose these values or provide other related disclosures at this time.
Novartis AH Acquisition
Overview of Transaction
On January 1, 2015, we acquired from Novartis AG all of the shares of certain Novartis subsidiaries and the assets and liabilities of other Novartis subsidiaries that were exclusively related to the Novartis AH business in an all-cash transaction for a total purchase price of $5.28 billion, $5.41 billion of which was funded by cash held in escrow at December 31, 2014.
As a condition to the clearance of the transaction under the Hart-Scott-Rodino Antitrust Improvements Act, following the closing of the acquisition of Novartis AH, we divested certain animal health assets in the U.S. related to the Sentinel® canine parasiticide franchise to Virbac Corporation for approximately $410 million.

FINAN
CIAL
REPO
RT
F5555
The acquired Novartis AH business consisted of the research and development, manufacture, marketing, sale and distribution of veterinary products to prevent and treat diseases in pets, farm animals, and farmed fish. Under the terms of the agreement, we acquired manufacturing sites, research and development facilities, a global commercial infrastructure and portfolio of products, a pipeline of projects in development, and employees.
Assets Acquired and Liabilities Assumed
The following table summarizes the amounts recognized for assets acquired and liabilities assumed as of the acquisition date:
Estimated Fair Value at January 1, 2015
Inventories . . . . . . . . . . . . . . . . . . . . . . . . . . . . . . . . . . . . . . . . . . . . . . . . . . . . . . . . . . . . . . . . . . $ 380.2Acquired in-process research and development . . . . . . . . . . . . . . . . . . . . . . . . . . . . . . . . . . . . . 298.0Marketed products(1) . . . . . . . . . . . . . . . . . . . . . . . . . . . . . . . . . . . . . . . . . . . . . . . . . . . . . . . . . . 1,953.0Property and equipment . . . . . . . . . . . . . . . . . . . . . . . . . . . . . . . . . . . . . . . . . . . . . . . . . . . . . . . 199.9Assets held for sale (primarily the U.S. Sentinel rights) . . . . . . . . . . . . . . . . . . . . . . . . . . . . . . . . 422.7Accrued retirement benefits . . . . . . . . . . . . . . . . . . . . . . . . . . . . . . . . . . . . . . . . . . . . . . . . . . . . . (108.7)Deferred income taxes . . . . . . . . . . . . . . . . . . . . . . . . . . . . . . . . . . . . . . . . . . . . . . . . . . . . . . . . (60.1)Other assets and liabilities - net . . . . . . . . . . . . . . . . . . . . . . . . . . . . . . . . . . . . . . . . . . . . . . . . . . (73.0)Total identifiable net assets . . . . . . . . . . . . . . . . . . . . . . . . . . . . . . . . . . . . . . . . . . . . . . . . . . . . . 3,012.0Goodwill(2) . . . . . . . . . . . . . . . . . . . . . . . . . . . . . . . . . . . . . . . . . . . . . . . . . . . . . . . . . . . . . . . . . . 2,271.1Total consideration transferred - net of cash acquired . . . . . . . . . . . . . . . . . . . . . . . . . . . . . . . . . $ 5,283.1
(1) These intangible assets, which are being amortized to cost of sales on a straight-line basis over their estimated useful lives, were expected to have a weighted average useful life of 19 years.
(2) The goodwill recognized from this acquisition is attributable primarily to expected synergies from combining the operations of Novartis AH with our legacy animal health business, future unidentified projects and products, and the assembled workforce of Novartis AH. Approximately $1.0 billion of the goodwill associated with this acquisition is deductible for tax purposes.
Actual and Supplemental Pro Forma Information
Our consolidated statement of operations for the year ended December 31, 2015 includes Novartis AH revenue of $1.02 billion. For 2015, Novartis AH was partially integrated into our animal health segment and as a result of these integration efforts, certain parts of the animal health business were operating on a combined basis, and we could not distinguish the operations between Novartis AH and our legacy animal health business.

FINANCIAL REPORT
F5656
The following unaudited pro forma financial information presents the combined consolidated results of our operations with Novartis AH as if the portion of Novartis AH that we retained after the sale to Virbac had been acquired as of January 1, 2014. We have adjusted the historical consolidated financial information to give effect to pro forma events that are directly attributable to the acquisition. The unaudited pro forma financial information is not necessarily indicative of what our consolidated results of operations would have been had we completed the acquisition at the beginning of 2014. In addition, the unaudited pro forma financial information does not attempt to project the future results of operations of our combined company.
Unaudited Pro Forma Consolidated Results2015 2014
Revenue . . . . . . . . . . . . . . . . . . . . . . . . . . . . . . . . . . . . . . . . . . . . . . . $ 19,958.7 $ 20,696.7Net income . . . . . . . . . . . . . . . . . . . . . . . . . . . . . . . . . . . . . . . . . . . . . . 2,518.1 2,127.9Diluted earnings per share . . . . . . . . . . . . . . . . . . . . . . . . . . . . . . . . . . 2.36 1.98
The unaudited pro forma financial information above reflects primarily the following pro forma pretax adjustments:
• Additional amortization expense of approximately $104 million for the year ended December 31, 2014, related to the fair value of identifiable intangible assets acquired.
• Additional cost of sales in 2014, and a corresponding reduction in cost of sales in 2015, of approximately $153 million related to the fair value adjustments to acquisition date inventory that was sold in the year ended December 31, 2015.
• A decrease to pro forma net income of approximately $112 million in the year ended December 31, 2014, associated with an increase to interest expense related to the incremental debt that we issued to partially finance the acquisition and a reduction of interest income associated with investments which would have been used to partially fund the acquisition.
In addition, all of the above adjustments were adjusted for the applicable tax impact. The taxes associated with the adjustments above reflect the statutory tax rates in the various jurisdictions where the fair value adjustments occurred.
Lohmann AH Acquisition
On April 30, 2014, we acquired Lohmann AH, a privately-held company headquartered in Cuxhaven, Germany, through a stock purchase for a total purchase price of $591.2 million, comprised of $551.4 million of net cash plus $39.8 million of assumed debt. Lohmann AH was a global leader in poultry vaccines. As part of this transaction, we acquired the rights to a range of vaccines, commercial capabilities, and manufacturing sites in Germany and the U.S. The acquisition was not material to our consolidated financial statements.
The following table summarizes the amounts recognized for assets acquired and liabilities assumed as of the acquisition date:
Estimated Fair Value at April 30, 2014
Marketed products . . . . . . . . . . . . . . . . . . . . . . . . . . . . . . . . . . . . . . . . . . . . . . . . . . . . . . . . . . . . $ 275.4Other intangible assets . . . . . . . . . . . . . . . . . . . . . . . . . . . . . . . . . . . . . . . . . . . . . . . . . . . . . . . . 23.9Property and equipment . . . . . . . . . . . . . . . . . . . . . . . . . . . . . . . . . . . . . . . . . . . . . . . . . . . . . . . 81.9Deferred income taxes . . . . . . . . . . . . . . . . . . . . . . . . . . . . . . . . . . . . . . . . . . . . . . . . . . . . . . . . (92.7)Other assets and liabilities - net . . . . . . . . . . . . . . . . . . . . . . . . . . . . . . . . . . . . . . . . . . . . . . . . . . 51.1Total identifiable net assets . . . . . . . . . . . . . . . . . . . . . . . . . . . . . . . . . . . . . . . . . . . . . . . . . . . . . 339.6Goodwill(1) . . . . . . . . . . . . . . . . . . . . . . . . . . . . . . . . . . . . . . . . . . . . . . . . . . . . . . . . . . . . . . . . . . 251.6Total consideration transferred - net of cash acquired . . . . . . . . . . . . . . . . . . . . . . . . . . . . . . . . . $ 591.2
(1) Goodwill associated with this acquisition is not deductible for tax purposes.

FINAN
CIAL
REPO
RT
F5757
Asset Acquisitions
The following table summarizes our asset acquisitions during 2016, 2015, and 2014, which are discussed in detail below.
Counterparty Compound(s) or TherapyAcquisition
MonthPhase of
Development(1)Acquired IPR&D
Expense
AstraZenecaAntibody selective for
MEDI1814December
2016 Phase I $ 30.0
Innovent Biologics, Inc.(Innovent)
Monoclonal antibody targeting protein CD-20
Immuno-oncology molecule
cMet monoclonal antibody
March2015 Pre-clinical(2) 56.0
Hanmi Pharmaceutical Co., Ltd.(Hanmi) BTK Inhibitor - HM71224 April 2015 Phase I 50.0
BioNTech AG (BioNTech) Cancer immunotherapies May 2015 Pre-clinical 30.0
Locemia Solutions Intranasal glucagon October2015 Phase III 149.0
Undisclosed Technology collaboration December2015 N/A 25.0
Halozyme Therapeutics, Inc.(Halozyme)
Recombinant humanhyaluronidase enzyme -rHuPH20
December2015 N/A 25.0
Immunocore Limited(Immunocore) T cell-based cancer therapies July 2014 Pre-clinical 45.0
AstraZeneca(3) Oral beta-secretase cleavingenzyme inhibitor - AZD3293
September2014 Phase I 50.0
Adocia BioChaperone Lispro December2014 Phase I 50.0
(1) The phase of development presented is as of the date of the arrangement. (2) Prior to acquisition, Innovent's monoclonal antibody targeting protein CD-20 had received investigational new drug approval in China
to begin Phase I development. (3) See Note 4 for additional information on our collaboration with AstraZeneca related to this oral beta-secretase cleaving enzyme
(BACE) inhibitor.
In connection with the arrangements described herein, our partners may be entitled to future royalties and/or commercial milestones based on sales should these products be approved for commercialization and/or milestones based on the successful progress of the compounds through the development process.
Our global collaboration agreement with AstraZeneca is to co-develop AstraZeneca's MEDI1814 compound being investigated for the treatment of Alzheimer's disease.
Our collaboration agreement with Innovent is to develop and commercialize a portfolio of cancer treatments. In China, we will be responsible for the commercialization efforts, while Innovent will lead the development and manufacturing efforts. Innovent also has co-promotion rights in China. We will be responsible for development, manufacturing, and commercialization efforts of Innovent's pre-clinical immuno-oncology molecules outside of China. Separate from the collaboration, we will continue the development of our cMet monoclonal antibody gene outside of China.
Our collaboration agreement with Hanmi is to develop and commercialize Hanmi's compound being investigated for the treatment of autoimmune and other diseases. We have rights to the molecule for all indications on a worldwide basis excluding Korea. We will be responsible for leading development, regulatory, manufacturing, and commercial efforts in our territories.

FINANCIAL REPORT
F5858
Our research collaboration with BioNTech is to discover novel cancer immunotherapies.
Our global collaboration and license agreement with Halozyme is to develop and commercialize products combining our proprietary compounds with Halozyme's ENHANZE™ platform to aid in the dispersion and absorption of other injected therapeutic drugs.
Our co-discovery and co-development collaboration with Immunocore is to research and potentially develop pre-clinical novel T cell-based cancer therapies.
Our collaboration agreement with Adocia was for the worldwide development and commercialization of Adocia's ultra-rapid insulin, a molecule being developed for the treatment of patients with type 1 and type 2 diabetes. In 2017, this collaboration was terminated, and as a result, all rights we received under the agreement have reverted back to Adocia.
Note 4: Collaborations and Other Arrangements
We often enter into collaborative and other similar arrangements to develop and commercialize drug candidates. Collaborative activities may include research and development, marketing and selling (including promotional activities and physician detailing), manufacturing, and distribution. These arrangements often require milestone and royalty or profit-share payments, contingent upon the occurrence of certain future events linked to the success of the asset in development, as well as expense reimbursements or payments to the collaboration partner. Elements within a collaboration are separated into individual units of accounting if they have standalone value from other elements within the arrangement. In these situations, the arrangement consideration is allocated to the elements on a relative selling price basis. Revenues related to products we sell pursuant to these arrangements are included in net product revenues, while other sources of revenue (e.g., royalties and profit sharing due from our partner) are included in collaboration and other revenue.
The following table summarizes our collaboration and other revenue, which is included in revenue in the consolidated statements of operations:
2016 2015 2014
Collaboration and other revenue . . . . . . . . . . . . . . . . . . . . . . . . $ 833.7 $ 808.1 $ 788.4
Operating expenses for costs incurred pursuant to these arrangements are reported in their respective expense line item, net of any payments due to or reimbursements due from our collaboration partners, with such reimbursements being recognized at the time the party becomes obligated to pay. Each collaboration is unique in nature, and our more significant arrangements are discussed below.

FINAN
CIAL
REPO
RT
F5959
Boehringer Ingelheim Diabetes Collaboration
We and Boehringer Ingelheim have a global agreement to jointly develop and commercialize a portfolio of diabetes compounds. Currently, included in the collaboration are Boehringer Ingelheim’s oral diabetes products: Trajenta®, Jentadueto®, Jardiance®, Glyxambi®, and Synjardy®, as well as our basal insulin: Basaglar®.
The table below summarizes significant regulatory and commercialization events and milestones (received) paid for the compounds included in this collaboration:
Product FamilyProduct Status
Milestones (Deferred) Capitalized(1)
U.S. Europe Japan Year Amount
Trajenta(2) Launched 2011 Launched 2011 Launched 2011
2016 $ —2015 —2014 —
Cumulative(4) 446.4
Jardiance(3) Launched 2014 Launched 2014 Launched 2015
2016 —2015 —2014 299.5
Cumulative(4) 299.5
Basaglar Launched 2016 Launched 2015 Launched 2015
2016 (187.5)2015 —2014 (62.5)
Cumulative(4) (250.0)(1) In connection with the regulatory approvals of Basaglar in the U.S., Europe, and Japan, milestone payments received were recorded
as deferred revenue and are being amortized through the term of the collaboration (2029) to collaboration and other revenue. In connection with the regulatory approvals of Trajenta and Jardiance, milestone payments made were capitalized as intangible assets and are being amortized to cost of sales.
(2) Jentadueto is included in the Trajenta family of product results.(3) Glyxambi and Synjardy are included in the Jardiance family of product results.(4) The cumulative amount represents the total initial amounts that were (deferred) or capitalized from the start of this collaboration
through the end of the reporting period.
In October 2014, we and Boehringer Ingelheim agreed upon certain changes to the operational and financial structure of our diabetes collaboration. Under the revised agreement the companies have continued their co-promotion work in 17 countries, representing over 90 percent of the collaboration’s anticipated market opportunity. In the other countries, the companies exclusively commercialize the respective molecules they brought to the collaboration. The modifications became effective at the end of 2014 and changed the financial terms related to the modified countries; however, the financial impact resulting from the revised terms of the agreement in these countries has not been and is not anticipated to be material. As a result of these changes, we recorded a gain of $92.0 million in 2014 related to the transfer to Boehringer Ingelheim of our license rights to co-promote linagliptin (Trajenta) and empagliflozin (Jardiance) in these countries, which was recorded as income in other–net, (income) expense. We also incurred a charge of $55.2 million related to the transfer to us of Boehringer Ingelheim's rights to co-promote Basaglar in countries where it was not yet approved, which was recorded as acquired IPR&D expense.

FINANCIAL REPORT
F6060
With the exception of the countries affected by the amendment to the collaboration agreement, the companies share equally the ongoing development costs, commercialization costs and gross margin for any product resulting from the collaboration. We record our portion of the gross margin associated with Boehringer Ingelheim's compounds as collaboration and other revenue. We record our sales of Basaglar to third parties as net product revenue with the payments made to Boehringer Ingelheim for their portion of the gross margin recorded as cost of sales. For all compounds under this collaboration, we record our portion of the development and commercialization costs as research and development expense and marketing, selling, and administrative expense, respectively. Each company is entitled to potential performance payments depending on the sales of the molecules it contributes to the collaboration. These performance payments result in the owner of the molecule retaining a greater share of the agreed upon gross margin of that product.
The following table summarizes our collaboration and other revenue recognized with respect to the Trajenta and Jardiance families of products and revenue recognized with respect to Basaglar:
2016 2015 2014
Trajenta . . . . . . . . . . . . . . . . . . . . . . . . . . . . . . . . . . . . . . . . . . . . . . $ 436.6 $ 356.8 $ 328.8Jardiance . . . . . . . . . . . . . . . . . . . . . . . . . . . . . . . . . . . . . . . . . . . . 201.9 60.2 —Basaglar . . . . . . . . . . . . . . . . . . . . . . . . . . . . . . . . . . . . . . . . . . . . . 86.1 11.1 —
Erbitux
We have several collaborations with respect to Erbitux. The most significant collaborations are or, where applicable, were in Japan, and prior to the transfer of commercialization rights in the fourth quarter of 2015, the U.S. and Canada (Bristol-Myers Squibb Company); and worldwide except North America (Merck KGaA). Certain rights to Erbitux outside North America will remain with Merck KGaA (Merck) upon expiration of that agreement.
The following table summarizes our revenue recognized with respect to Erbitux:
2016 2015 2014Net product revenues - BMS . . . . . . . . . . . . . . . . . . . . . . . . . . . . . . $ — $ 23.3 $ 46.1Net product revenues - third party . . . . . . . . . . . . . . . . . . . . . . . . . . 587.0 152.3 —Collaboration and other revenue . . . . . . . . . . . . . . . . . . . . . . . . . . . 100.0 309.4 327.2Revenue . . . . . . . . . . . . . . . . . . . . . . . . . . . . . . . . . . . . . . . . . . . . . $ 687.0 $ 485.0 $ 373.3
Bristol-Myers Squibb Company
Pursuant to commercial agreements with BMS, we had been co-developing Erbitux in North America with BMS exclusively. A separate agreement grants co-exclusive rights among Merck, BMS, and us in Japan and expires in 2032. On October 1, 2015, BMS transferred their commercialization rights to us with respect to Erbitux in North America pursuant to a modification of our existing arrangement, and we began selling Erbitux at that time. This modification did not affect our rights with respect to Erbitux in other jurisdictions. In connection with the modification of terms, we provide consideration to BMS based upon a tiered percentage of net sales of Erbitux in North America estimated to average 38 percent through September 2018. The transfer of the commercialization rights was accounted for as an acquisition of a business.
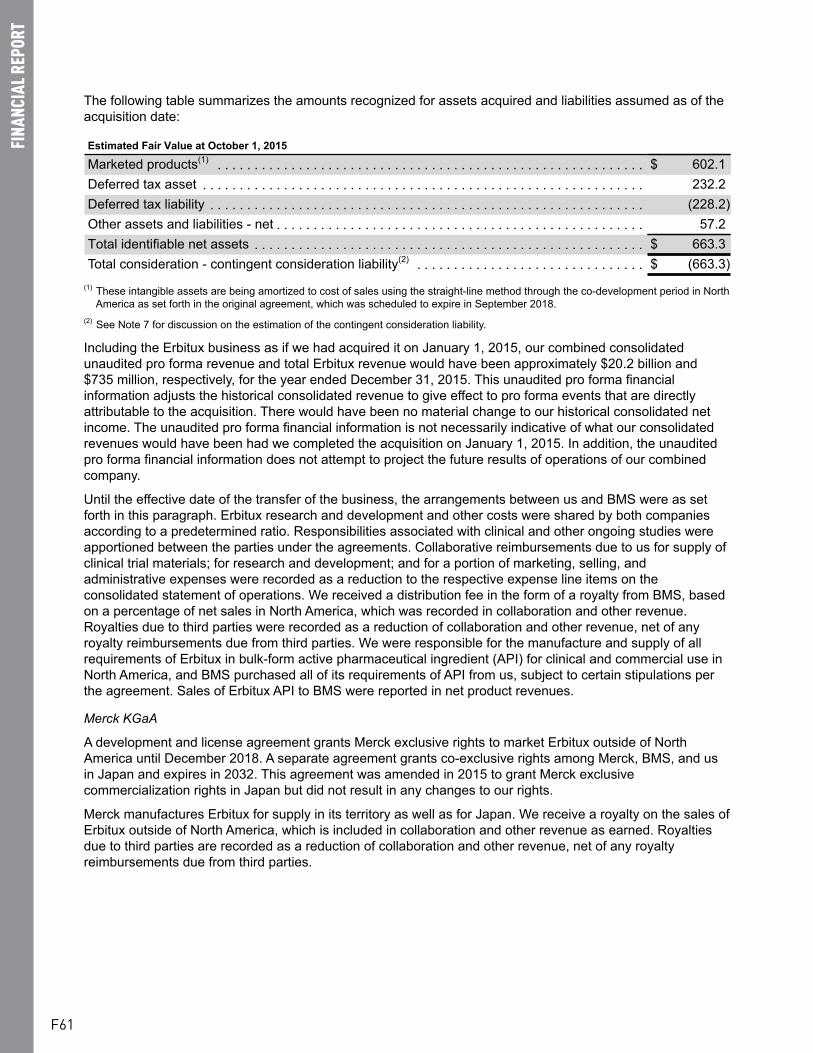
FINAN
CIAL
REPO
RT
F6161
The following table summarizes the amounts recognized for assets acquired and liabilities assumed as of the acquisition date:
Estimated Fair Value at October 1, 2015
Marketed products(1) . . . . . . . . . . . . . . . . . . . . . . . . . . . . . . . . . . . . . . . . . . . . . . . . . . . . . . . . . . $ 602.1Deferred tax asset . . . . . . . . . . . . . . . . . . . . . . . . . . . . . . . . . . . . . . . . . . . . . . . . . . . . . . . . . . . . 232.2Deferred tax liability . . . . . . . . . . . . . . . . . . . . . . . . . . . . . . . . . . . . . . . . . . . . . . . . . . . . . . . . . . . (228.2)Other assets and liabilities - net . . . . . . . . . . . . . . . . . . . . . . . . . . . . . . . . . . . . . . . . . . . . . . . . . . 57.2Total identifiable net assets . . . . . . . . . . . . . . . . . . . . . . . . . . . . . . . . . . . . . . . . . . . . . . . . . . . . . $ 663.3Total consideration - contingent consideration liability(2) . . . . . . . . . . . . . . . . . . . . . . . . . . . . . . . $ (663.3)
(1) These intangible assets are being amortized to cost of sales using the straight-line method through the co-development period in North America as set forth in the original agreement, which was scheduled to expire in September 2018.
(2) See Note 7 for discussion on the estimation of the contingent consideration liability.
Including the Erbitux business as if we had acquired it on January 1, 2015, our combined consolidated unaudited pro forma revenue and total Erbitux revenue would have been approximately $20.2 billion and $735 million, respectively, for the year ended December 31, 2015. This unaudited pro forma financial information adjusts the historical consolidated revenue to give effect to pro forma events that are directly attributable to the acquisition. There would have been no material change to our historical consolidated net income. The unaudited pro forma financial information is not necessarily indicative of what our consolidated revenues would have been had we completed the acquisition on January 1, 2015. In addition, the unaudited pro forma financial information does not attempt to project the future results of operations of our combined company.
Until the effective date of the transfer of the business, the arrangements between us and BMS were as set forth in this paragraph. Erbitux research and development and other costs were shared by both companies according to a predetermined ratio. Responsibilities associated with clinical and other ongoing studies were apportioned between the parties under the agreements. Collaborative reimbursements due to us for supply of clinical trial materials; for research and development; and for a portion of marketing, selling, and administrative expenses were recorded as a reduction to the respective expense line items on the consolidated statement of operations. We received a distribution fee in the form of a royalty from BMS, based on a percentage of net sales in North America, which was recorded in collaboration and other revenue. Royalties due to third parties were recorded as a reduction of collaboration and other revenue, net of any royalty reimbursements due from third parties. We were responsible for the manufacture and supply of all requirements of Erbitux in bulk-form active pharmaceutical ingredient (API) for clinical and commercial use in North America, and BMS purchased all of its requirements of API from us, subject to certain stipulations per the agreement. Sales of Erbitux API to BMS were reported in net product revenues.
Merck KGaA
A development and license agreement grants Merck exclusive rights to market Erbitux outside of North America until December 2018. A separate agreement grants co-exclusive rights among Merck, BMS, and us in Japan and expires in 2032. This agreement was amended in 2015 to grant Merck exclusive commercialization rights in Japan but did not result in any changes to our rights.
Merck manufactures Erbitux for supply in its territory as well as for Japan. We receive a royalty on the sales of Erbitux outside of North America, which is included in collaboration and other revenue as earned. Royalties due to third parties are recorded as a reduction of collaboration and other revenue, net of any royalty reimbursements due from third parties.

FINANCIAL REPORT
F6262
Effient®
We are in a collaborative arrangement with Daiichi Sankyo Co., Ltd. (Daiichi Sankyo) to develop, market, and promote Effient. Marketing rights for major territories are shown below. We and Daiichi Sankyo each have exclusive marketing rights in certain other territories.
Territory Marketing Rights Selling Party
U.S. Co-promotion Lilly
Major European markets Co-promotion Pre-January 1, 2016, LillyPost-January 1, 2016, Daiichi Sankyo
Japan Exclusive Daiichi Sankyo
Beginning January 1, 2016, while major European markets continue to be a co-promotion territory under the terms of our arrangement, Daiichi Sankyo exclusively promotes Effient in these markets. The economic results for the major European markets continue to be shared in the same proportion as they were previously.
The parties share approximately 50/50 in the profits, as well as in the costs of development and marketing in the co-promotion territories. A third party manufactures bulk product, and we continue to produce the finished product for our exclusive and co-promotion territories, including the major European markets.
We record net product revenue in our exclusive and co-promotion territories where we are the selling party. Profit-share payments due to Daiichi Sankyo for co-promotion countries where we are the selling party are recorded as marketing, selling, and administrative expenses. Beginning January 1, 2016, any profit-share payments due to us from Daiichi Sankyo for the major European markets are recorded as collaboration and other revenue. We also record our share of the expenses in these co-promotion territories as marketing, selling, and administrative expenses. In our exclusive territories, we pay Daiichi Sankyo a royalty specific to these territories. All royalties due to Daiichi Sankyo and the third-party manufacturer are recorded in cost of sales.
The following table summarizes our revenue recognized with respect to Effient:
2016 2015 2014
Revenue . . . . . . . . . . . . . . . . . . . . . . . . . . . . . . . . . . . . . . . . . . . . . $ 535.2 $ 523.0 $ 522.2
Olumiant®
We have a worldwide license and collaboration agreement with Incyte Corporation (Incyte) which provides us the development and commercialization rights to its Janus tyrosine kinase inhibitor compound, now known as baricitinib (trade name Olumiant), and certain follow-on compounds, for the treatment of inflammatory and autoimmune diseases. Incyte has the right to receive tiered, double-digit royalty payments on future global sales with rates ranging up to 20 percent if the product is successfully commercialized. The agreement provides Incyte with options to co-develop these compounds on an indication-by-indication basis by funding 30 percent of the associated development costs from the initiation of a Phase IIb trial through regulatory approval in exchange for increased tiered royalties ranging up to percentages in the high twenties. Incyte exercised its option to co-develop Oluminant in rheumatoid arthritis and psoriatic arthritis in 2010 and 2017, respectively. The agreement calls for payments by us to Incyte associated with certain development, success-based regulatory, and sales-based milestones. In 2016, we incurred milestone-related expenses of $55.0 million in connection with regulatory submissions in the U.S. and Europe which were recorded as research and development expenses. In 2017, we capitalized as an intangible asset a $65.0 million milestone in connection with the regulatory approval in Europe, which will be amortized to cost of sales beginning upon product launch. After receipt of this milestone payment, Incyte will be eligible to receive up to $295.0 million of additional payments from us contingent upon certain development and success-based regulatory milestones, of which $115.0 million relates to regulatory decisions for a first indication. Incyte is also eligible to receive up to $150.0 million of potential sales-based milestones.

FINAN
CIAL
REPO
RT
F6363
Tanezumab
We have a collaboration agreement with Pfizer Inc. (Pfizer) to jointly develop and globally commercialize tanezumab for the treatment of osteoarthritis pain, chronic low back pain and cancer pain. Under the agreement, the companies share equally the ongoing development costs and, if successful, in gross margins and certain commercialization expenses. Following the U.S. Food and Drug Administration's (FDA's) decision in March 2015 to lift the partial clinical hold on tanezumab, certain Phase III trials resumed in July 2015. Upon the FDA's lifting of the partial clinical hold and the decision to continue the collaboration with Pfizer, we paid an upfront fee of $200.0 million which was expensed as acquired IPR&D. As of December 31, 2016, Pfizer is eligible to receive up to $350.0 million in success-based regulatory milestones and up to $1.23 billion in a series of sales-based milestones, contingent upon the commercial success of tanezumab.
BACE Inhibitor
In September 2014, we entered into a collaboration agreement with AstraZeneca for the worldwide co-development and co-commercialization of AstraZeneca’s AZD3293, a BACE inhibitor being investigated for the potential treatment of Alzheimer’s disease. We are responsible for leading development efforts, while AstraZeneca will be responsible for manufacturing efforts. If successful, both parties will take joint responsibility for commercialization. Under the agreement, both parties share equally in the ongoing development costs and, if successful, in gross margins and certain other costs associated with commercialization of the molecule. We expensed $50.0 million as acquired IPR&D at the inception of this arrangement. As a result of the molecule moving into Phase III testing, we incurred a $100.0 million developmental milestone, which was recorded as research and development expense in 2016. As of December 31, 2016, AstraZeneca is eligible to receive up to $350.0 million of additional payments from us contingent upon the achievement of certain development and success-based regulatory milestones.
Summary of Commission and Profit-Share Payments
The following table summarizes our aggregate amount of marketing, selling, and administrative expense associated with our commission and profit-sharing obligations for the collaborations and other arrangements described above:
2016 2015 2014
Marketing, selling, and administrative . . . . . . . . . . . . . . . . . . . . . . . $ 194.9 $ 213.2 $ 211.2

FINANCIAL REPORT
F6464
Note 5: Asset Impairment, Restructuring, and Other Special Charges
The components of the charges included in asset impairment, restructuring, and other special charges in our consolidated statements of operations are described below.
2016 2015 2014Severance: Human pharmaceutical products . . . . . . . . . . . . . . . . . . . . . . . . . $ 85.9 $ 81.5 $ 225.5 Animal health . . . . . . . . . . . . . . . . . . . . . . . . . . . . . . . . . . . . . . . . 40.8 59.5 —Total severance . . . . . . . . . . . . . . . . . . . . . . . . . . . . . . . . . . . . . . . . 126.7 141.0 225.5Asset impairment (gains from facility sales) and other specialcharges: Human pharmaceutical products . . . . . . . . . . . . . . . . . . . . . . . . . (13.0) 24.6 204.4 Animal health . . . . . . . . . . . . . . . . . . . . . . . . . . . . . . . . . . . . . . . . 268.8 202.1 38.8Total asset impairment and other special charges . . . . . . . . . . . . . 255.8 226.7 243.2Asset impairment, restructuring, and other special charges . . . . . . $ 382.5 $ 367.7 $ 468.7
Severance costs recognized during the years ended December 31, 2016, 2015 and 2014 resulted primarily from actions taken to reduce our cost structure, as well as the integration of Novartis AH in 2016 and 2015. Substantially all of the severance costs incurred during the year ended December 31, 2016 are expected to be paid by the end of 2017, and substantially all of the severance costs incurred during the years ended December 31, 2015 and 2014 have been paid.
Asset impairment and other special charges recognized during years ended December 31, 2016 and 2015 resulted primarily from integration costs and asset impairments due to product rationalization and site closures resulting from our acquisition and integration of Novartis AH, including the closure of a manufacturing facility in Ireland in 2016.
Asset impairment and other special charges recognized during the year ended December 31, 2014 resulted primarily from a $180.8 million asset impairment charge related to our decision to close and sell a manufacturing plant located in Puerto Rico. The manufacturing plant was written down to its estimated fair value, which was based primarily on recent sales of similar assets.
Note 6: Inventories
We state all inventories at the lower of cost or market. We use the last-in, first-out (LIFO) method for the majority of our inventories located in the continental U.S. Other inventories are valued by the first-in, first-out (FIFO) method. FIFO cost approximates current replacement cost.
Inventories at December 31 consisted of the following:
2016 2015Finished products . . . . . . . . . . . . . . . . . . . . . . . . . . . . . . . . . . . . . . . . . . . . . . . . . $ 987.3 $ 1,053.4Work in process . . . . . . . . . . . . . . . . . . . . . . . . . . . . . . . . . . . . . . . . . . . . . . . . . . . 2,117.2 2,058.1Raw materials and supplies . . . . . . . . . . . . . . . . . . . . . . . . . . . . . . . . . . . . . . . . . . 435.3 403.0Total (approximates replacement cost) 3,539.8 3,514.5Increase (reduction) to LIFO cost . . . . . . . . . . . . . . . . . . . . . . . . . . . . . . . . . . . . . 22.1 (68.7)Inventories . . . . . . . . . . . . . . . . . . . . . . . . . . . . . . . . . . . . . . . . . . . . . . . . . . . . . . . $ 3,561.9 $ 3,445.8
Inventories valued under the LIFO method comprised $1.43 billion and $1.30 billion of total inventories at December 31, 2016 and 2015, respectively.

FINAN
CIAL
REPO
RT
F6565
Note 7: Financial Instruments
Financial instruments that potentially subject us to credit risk consist principally of trade receivables and interest-bearing investments. Wholesale distributors of life-science products account for a substantial portion of our trade receivables; collateral is generally not required. The risk associated with this concentration is mitigated by our ongoing credit-review procedures and insurance. A large portion of our cash is held by a few major financial institutions. We monitor our exposures with these institutions and do not expect any of these institutions to fail to meet their obligations. Major financial institutions represent the largest component of our investments in corporate debt securities. In accordance with documented corporate risk-management policies, we monitor the amount of credit exposure to any one financial institution or corporate issuer. We are exposed to credit-related losses in the event of nonperformance by counterparties to risk-management instruments but do not expect any counterparties to fail to meet their obligations given their high credit ratings.
We consider all highly liquid investments with a maturity of three months or less from the date of purchase to be cash equivalents. The cost of these investments approximates fair value.
Substantially all of our investments in debt and marketable equity securities are classified as available-for-sale. Investment securities with maturity dates of less than one year from the date of the balance sheet are classified as short-term. Available-for-sale securities are carried at fair value with the unrealized gains and losses, net of tax, reported in other comprehensive income (loss). The credit portion of unrealized losses on our debt securities considered to be other-than-temporary is recognized in earnings. The remaining portion of the other-than-temporary impairment on our debt securities is then recorded, net of tax, in other comprehensive income (loss). The entire amount of other-than-temporary impairment on our equity securities is recognized in earnings. We do not evaluate cost-method investments for impairment unless there is an indicator of impairment. We review these investments for indicators of impairment on a regular basis.
Investments in companies over which we have significant influence but not a controlling interest are accounted for using the equity method with our share of earnings or losses reported in other–net, (income) expense. We own no investments that are considered to be trading securities.
Our derivative activities are initiated within the guidelines of documented corporate risk-management policies and offset losses and gains on the assets, liabilities, and transactions being hedged. Management reviews the correlation and effectiveness of our derivatives on a quarterly basis.
For derivative instruments that are designated and qualify as fair value hedges, the derivative instrument is marked to market with gains and losses recognized currently in income to offset the respective losses and gains recognized on the underlying exposure. For derivative instruments that are designated and qualify as cash flow hedges, the effective portion of gains and losses is reported as a component of accumulated other comprehensive loss and reclassified into earnings in the same period the hedged transaction affects earnings. For derivative and non-derivative instruments that are designated and qualify as net investment hedges, the effective portion of foreign currency translation gains or losses due to spot rate fluctuations are reported as a component of accumulated other comprehensive loss. Hedge ineffectiveness is immediately recognized in earnings. Derivative contracts that are not designated as hedging instruments are recorded at fair value with the gain or loss recognized in current earnings during the period of change.
We may enter into foreign currency forward or option contracts to reduce the effect of fluctuating currency exchange rates (principally the euro, British pound, Japanese yen, and the Swiss franc). Foreign currency derivatives used for hedging are put in place using the same or like currencies and duration as the underlying exposures. Forward and option contracts are principally used to manage exposures arising from subsidiary trade and loan payables and receivables denominated in foreign currencies. These contracts are recorded at fair value with the gain or loss recognized in other–net, (income) expense. We may enter into foreign currency forward and option contracts and currency swaps as fair value hedges of firm commitments. Forward contracts generally have maturities not exceeding 12 months. At December 31, 2016, we had outstanding foreign currency forward commitments to purchase 1.24 billion U.S. dollars and sell 1.17 billion euro; commitments to purchase 2.13 billion euro and sell 2.24 billion U.S. dollars; commitments to purchase 246.0 million British pounds and sell 292.8 million euro; commitments to purchase 219.2 million U.S. dollars and sell 172.8 million British pounds, commitments to purchase 609.8 million U.S. dollars and sell 70.44 billion Japanese yen, and commitments to purchase 185.9 million Swiss francs and sell 183.3 million U.S. dollars, which will all settle within 30 days.

FINANCIAL REPORT
F6666
Foreign currency exchange risk is also managed through the use of foreign currency debt and cross-currency interest rate swaps. Our foreign currency-denominated notes issued in May 2016 and June 2015 and discussed in Note 10, which had carrying amounts of $3.34 billion and $2.27 billion as of December 31, 2016 and 2015, respectively, have been designated as, and are effective as, economic hedges of net investments in certain of our euro-denominated and Swiss franc-denominated foreign operations. Our cross-currency interest rate swaps that convert a portion of our U.S. dollar-denominated floating rate debt to euro-denominated floating rate debt have also been designated as, and are effective as, economic hedges of net investments in certain of our euro-denominated foreign operations.
In the normal course of business, our operations are exposed to fluctuations in interest rates which can vary the costs of financing, investing, and operating. We address a portion of these risks through a controlled program of risk management that includes the use of derivative financial instruments. The objective of controlling these risks is to limit the impact of fluctuations in interest rates on earnings. Our primary interest-rate risk exposure results from changes in short-term U.S. dollar interest rates. In an effort to manage interest-rate exposures, we strive to achieve an acceptable balance between fixed- and floating-rate debt and investment positions and may enter into interest rate swaps or collars to help maintain that balance.
Interest rate swaps or collars that convert our fixed-rate debt to a floating rate are designated as fair value hedges of the underlying instruments. Interest rate swaps or collars that convert floating-rate debt to a fixed rate are designated as cash flow hedges. Interest expense on the debt is adjusted to include the payments made or received under the swap agreements. Cash proceeds from or payments to counterparties resulting from the termination of interest rate swaps are classified as operating activities in our consolidated statement of cash flows. At December 31, 2016, substantially all of our total long-term debt is at a fixed rate. We have converted approximately 35 percent of our long-term fixed-rate notes to floating rates through the use of interest rate swaps.
We may enter into forward contracts and designate them as cash flow hedges to limit the potential volatility of earnings and cash flow associated with forecasted sales of available-for-sale securities.
We also may enter into forward-starting interest rate swaps, which we designate as cash flow hedges, as part of any anticipated future debt issuances in order to reduce the risk of cash flow volatility from future changes in interest rates. Upon completion of a debt issuance and termination of the swap, the change in fair value of these instruments is recorded as part of other comprehensive income (loss) and is amortized to interest expense over the life of the underlying debt.
The Effect of Risk Management Instruments on the Consolidated Statement of Operations
The following effects of risk-management instruments were recognized in other–net, (income) expense:
2016 2015 2014
Fair value hedges:Effect from hedged fixed-rate debt . . . . . . . . . . . . . . . . . . . . . . . . $ (30.8) $ (11.9) $ 156.9Effect from interest rate contracts . . . . . . . . . . . . . . . . . . . . . . . . . 30.8 11.9 (156.9)
Cash flow hedges:Effective portion of losses on equity contracts reclassified from
accumulated other comprehensive loss . . . . . . . . . . . . . . . . . . — — 129.0Effective portion of losses on interest rate contracts reclassified
from accumulated other comprehensive loss . . . . . . . . . . . . . . 15.0 13.7 9.0Net (gains) losses on foreign currency exchange contracts not
designated as hedging instruments . . . . . . . . . . . . . . . . . . . . . . . 78.8 (28.2) (20.4)
During the years ended December 31, 2016, 2015, and 2014, net losses related to ineffectiveness, as well as net losses related to the portion of our risk-management hedging instruments, fair value hedges, and cash flow hedges that were excluded from the assessment of effectiveness, were not material.

FINAN
CIAL
REPO
RT
F6767
The Effect of Risk-Management Instruments on Other Comprehensive Income (Loss)
The effective portion of risk-management instruments that was recognized in other comprehensive income (loss) is as follows:
2016 2015 2014
Cash flow hedges: Equity contracts $ — $ — $ 149.6 Forward-starting interest rate swaps (3.4) (56.7) (164.7)Net investment hedges: Foreign currency-denominated notes 137.5 — — Cross-currency interest rate swaps 32.5 — — Foreign currency exchange contracts 31.9 — —
Fair Value Hedges
There were no material terminations of interest rate swaps in 2016. During the years ended December 31, 2015 and 2014, we terminated certain interest rate swaps designated as fair value hedges with an aggregate notional amount of $876.0 million and $1.30 billion, respectively. The termination of certain interest rate swaps in 2015 was in connection with the note purchase and redemption discussed in Note 10. As a result of the terminations, we received cash of $20.2 million and $340.7 million in 2015 and 2014, respectively, which represented the fair value of the interest rate swaps at the time of termination. In 2015, the related fair value adjustment was recorded as an increase to the carrying value of the underlying notes and was included as a component of the debt extinguishment loss. In 2014, the related fair value was recorded as an increase to the carrying value of the underlying notes and is being amortized into earnings as a reduction of interest expense over the remaining life of the underlying debt.
Cash Flow Hedges
Upon issuance of the underlying fixed-rate notes in March 2015, which are discussed in Note 10, we terminated forward-starting interest rate contracts in designated cash flow hedging instruments with an aggregate notional amount of $1.35 billion and paid $206.3 million in cash to the counterparties for settlement. The settlement amount represented the fair value of the forward-starting interest rate contracts at the time of termination and was recorded in other comprehensive income (loss).
During the year ended December 31, 2014, we sold all of the underlying equity securities that had been in designated cash flow hedging relationships. At the time of the sales, we reclassified to earnings the accumulated other comprehensive loss related to the cash flow hedges and the previously unrealized gains on the underlying equity securities.
During the next 12 months, we expect to reclassify from accumulated other comprehensive loss to earnings $15.1 million of pretax net losses on cash flow hedges of the variability in expected future interest payments on our floating rate debt.

FINANCIAL REPORT
F6868
Fair Value of Financial Instruments
The following tables summarize certain fair value information at December 31 for assets and liabilities measured at fair value on a recurring basis, as well as the carrying amount and amortized cost of certain other investments:
Fair Value Measurements Using
DescriptionCarryingAmount Cost (1)
Quoted Prices in Active
Markets for Identical Assets
(Level 1)
SignificantOther
ObservableInputs
(Level 2)
SignificantUnobservable
Inputs(Level 3)
FairValue
December 31, 2016Cash equivalents $ 2,986.8 $ 2,986.8 $ 2,699.4 $ 287.4 $ — $ 2,986.8Short-term investments:
U.S. government and agencysecurities $ 232.5 $ 232.6 $ 232.5 $ — $ — $ 232.5
Corporate debt securities 1,219.2 1,219.1 — 1,219.2 — 1,219.2Asset-backed securities 4.3 4.3 — 4.3 — 4.3Other securities 0.5 0.5 — 0.5 — 0.5Short-term investments $ 1,456.5
Noncurrent investments:U.S. government and agency
securities $ 318.9 $ 323.8 $ 318.9 $ — $ — $ 318.9Corporate debt securities 3,062.2 3,074.3 — 3,062.2 — 3,062.2Mortgage-backed securities 183.1 185.4 — 183.1 — 183.1Asset-backed securities 502.7 503.5 — 502.7 — 502.7Other securities 153.7 77.6 — — 153.7 153.7Marketable equity securities 418.2 91.9 418.2 — — 418.2Cost and equity method
investments(2) 568.7Noncurrent investments $ 5,207.5
December 31, 2015Cash equivalents $ 1,644.4 $ 1,644.4 $ 1,637.0 $ 7.4 $ — $ 1,644.4
Short-term investments:U.S. government and agency
securities $ 153.2 $ 153.4 $ 153.2 $ — $ — $ 153.2Corporate debt securities 625.8 626.9 — 625.8 — 625.8Asset-backed securities 3.3 3.3 — 3.3 — 3.3Other securities 3.1 3.1 — 3.1 — 3.1Short-term investments $ 785.4
Noncurrent investments:U.S. government and agency
securities $ 284.5 $ 286.0 $ 283.5 $ 1.0 $ — $ 284.5Corporate debt securities 1,962.6 1,995.8 — 1,962.6 — 1,962.6Mortgage-backed securities 153.3 154.7 — 153.3 — 153.3Asset-backed securities 441.9 443.1 — 441.9 — 441.9Other securities 137.1 97.3 — 4.1 133.0 137.1Marketable equity securities 128.9 74.8 128.9 — — 128.9Cost and equity method
investments(2) 538.3Noncurrent investments $ 3,646.6
(1) For available-for-sale debt securities, amounts disclosed represent the securities' amortized cost.(2) Fair value disclosures are not applicable for cost method and equity method investments.
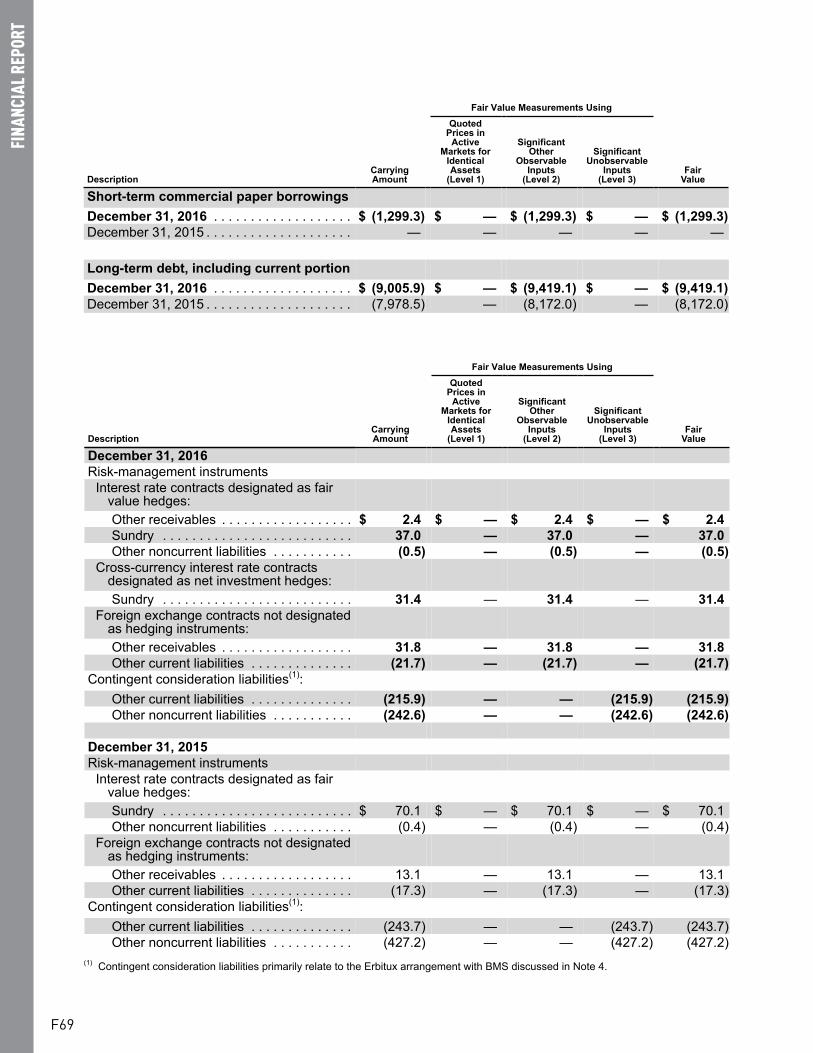
FINAN
CIAL
REPO
RT
F6969
Fair Value Measurements Using
DescriptionCarryingAmount
Quoted Prices in
Active Markets for
Identical Assets
(Level 1)
SignificantOther
ObservableInputs
(Level 2)
SignificantUnobservable
Inputs(Level 3)
FairValue
Short-term commercial paper borrowingsDecember 31, 2016 . . . . . . . . . . . . . . . . . . . $ (1,299.3) $ — $ (1,299.3) $ — $ (1,299.3)December 31, 2015 . . . . . . . . . . . . . . . . . . . . — — — — —
Long-term debt, including current portionDecember 31, 2016 . . . . . . . . . . . . . . . . . . . $ (9,005.9) $ — $ (9,419.1) $ — $ (9,419.1)December 31, 2015 . . . . . . . . . . . . . . . . . . . . (7,978.5) — (8,172.0) — (8,172.0)
Fair Value Measurements Using
DescriptionCarryingAmount
Quoted Prices in
Active Markets for
Identical Assets
(Level 1)
SignificantOther
ObservableInputs
(Level 2)
SignificantUnobservable
Inputs(Level 3)
FairValue
December 31, 2016Risk-management instruments
Interest rate contracts designated as fairvalue hedges:Other receivables . . . . . . . . . . . . . . . . . . $ 2.4 $ — $ 2.4 $ — $ 2.4Sundry . . . . . . . . . . . . . . . . . . . . . . . . . . 37.0 — 37.0 — 37.0Other noncurrent liabilities . . . . . . . . . . . (0.5) — (0.5) — (0.5)
Cross-currency interest rate contractsdesignated as net investment hedges:Sundry . . . . . . . . . . . . . . . . . . . . . . . . . . 31.4 — 31.4 — 31.4
Foreign exchange contracts not designatedas hedging instruments:Other receivables . . . . . . . . . . . . . . . . . . 31.8 — 31.8 — 31.8Other current liabilities . . . . . . . . . . . . . . (21.7) — (21.7) — (21.7)
Contingent consideration liabilities(1):Other current liabilities . . . . . . . . . . . . . . (215.9) — — (215.9) (215.9)Other noncurrent liabilities . . . . . . . . . . . (242.6) — — (242.6) (242.6)
December 31, 2015Risk-management instruments
Interest rate contracts designated as fairvalue hedges:Sundry . . . . . . . . . . . . . . . . . . . . . . . . . . $ 70.1 $ — $ 70.1 $ — $ 70.1Other noncurrent liabilities . . . . . . . . . . . (0.4) — (0.4) — (0.4)
Foreign exchange contracts not designatedas hedging instruments:Other receivables . . . . . . . . . . . . . . . . . . 13.1 — 13.1 — 13.1Other current liabilities . . . . . . . . . . . . . . (17.3) — (17.3) — (17.3)
Contingent consideration liabilities(1):Other current liabilities . . . . . . . . . . . . . . (243.7) — — (243.7) (243.7)Other noncurrent liabilities . . . . . . . . . . . (427.2) — — (427.2) (427.2)
(1) Contingent consideration liabilities primarily relate to the Erbitux arrangement with BMS discussed in Note 4.

FINANCIAL REPORT
F7070
Risk-management instruments above are disclosed on a gross basis. There are various rights of setoff associated with certain of the risk-management instruments above that are subject to an enforceable master netting arrangement or similar agreements. Although various rights of setoff and master netting arrangements or similar agreements may exist with the individual counterparties to the risk-management instruments above, individually, these financial rights are not material.
We determine our Level 1 and Level 2 fair value measurements based on a market approach using quoted market values, significant other observable inputs for identical or comparable assets or liabilities, or discounted cash flow analyses. Level 3 fair value measurements for other investment securities are determined using unobservable inputs, including the investments' cost adjusted for impairments and price changes from orderly transactions. The fair value of cost and equity method investments is not readily available.
Contingent consideration liabilities primarily include contingent consideration related to Erbitux for which the fair value was estimated using a discounted cash flow analysis and Level 3 inputs, including projections representative of a market participant view for net sales in North America through September 2018 and an estimated discount rate. The amount to be paid is calculated as a tiered percentage of net sales (see Note 4) and will, therefore, vary directly with increases and decreases in net sales of Erbitux in North America. There is no cap on the amount that may be paid pursuant to this arrangement. The decreases in the fair value of the contingent consideration liability during December 31, 2016 was due to cash payments of $231.0 million related to Erbitux. The change in the fair value of the contingent consideration liabilities recognized in earnings during the years ended December 31, 2016 and 2015 due to changes in time value of money were not material.
The table below summarizes the contractual maturities of our investments in debt securities measured at fair value as of December 31, 2016:
Maturities by Period
TotalWithin1 Year
After 1 YearThrough 5
Years
After 5 Years
Through 10 Years
After10 Years
Fair value of debt securities . . . . . . . . . . . . . . $ 5,522.9 $ 1,456.0 $ 3,762.2 $ 89.0 $ 215.7
A summary of the fair value of available-for-sale securities in an unrealized gain or loss position and the amount of unrealized gains and losses (pretax) in accumulated other comprehensive loss follows:
2016 2015Unrealized gross gains . . . . . . . . . . . . . . . . . . . . . . . . . . . . . . . . . . . . . . . . . . . . . $ 352.6 $ 68.0Unrealized gross losses . . . . . . . . . . . . . . . . . . . . . . . . . . . . . . . . . . . . . . . . . . . . 34.1 52.5Fair value of securities in an unrealized gain position . . . . . . . . . . . . . . . . . . . . . . 1,869.7 764.5Fair value of securities in an unrealized loss position . . . . . . . . . . . . . . . . . . . . . . 3,262.3 2,933.4
We periodically assess our investment securities for other-than-temporary impairment losses. Other-than-temporary impairment losses recognized during the year ended December 31, 2016, December 31, 2015, and December 31, 2014 totaled $53.0 million, $42.6 million and $12.5 million, respectively. Other-than-temporary impairment losses recognized during these years related primarily to our cost and equity method investments.
For fixed-income securities, the amount of credit losses are determined by comparing the difference between the present value of future cash flows expected to be collected on these securities and the amortized cost. Factors considered in assessing the credit losses include the position in the capital structure, vintage and amount of collateral, delinquency rates, current credit support, and geographic concentration.
For equity securities, factors considered in assessing other-than-temporary impairment losses include the length of time and the extent to which the fair value has been less than cost, the financial condition and near term prospects of the issuer, our intent and ability to retain the securities for a period of time sufficient to allow for recovery in fair value, and general market conditions and industry specific factors.

FINAN
CIAL
REPO
RT
F7171
As of December 31, 2016, the securities in an unrealized loss position include primarily fixed-rate debt securities of varying maturities. The value of fixed-income securities is sensitive to changes in the yield curve and other market conditions. Approximately 95 percent of the securities in a loss position are investment-grade debt securities. As of December 31, 2016, we do not intend to sell, and it is not more likely than not that we will be required to sell, the securities in a loss position before the market values recover or the underlying cash flows have been received, and there is no indication of default on interest or principal payments for any of our debt securities.
Activity related to our investment portfolio, substantially all of which related to available-for-sale securities, was as follows:
2016 2015 2014Proceeds from sales . . . . . . . . . . . . . . . . . . . . . . . . . . . . . . . . . . . . $ 3,240.5 $ 4,733.3 $ 14,609.5Realized gross gains on sales . . . . . . . . . . . . . . . . . . . . . . . . . . . . 30.7 255.1 353.5Realized gross losses on sales . . . . . . . . . . . . . . . . . . . . . . . . . . . . 14.6 10.3 29.4
Realized gains and losses on sales of investments are computed based upon specific identification of the initial cost adjusted for any other-than-temporary declines in fair value that were recorded in earnings.
Accounts Receivable Factoring Arrangements
We have entered into accounts receivable factoring agreements with financial institutions to sell certain of our non-U.S. accounts receivable. These transactions are accounted for as sales and result in a reduction in accounts receivable because the agreements transfer effective control over and risk related to the receivables to the buyers. Our factoring agreements do not allow for recourse in the event of uncollectibility, and we do not retain any interest in the underlying accounts receivable once sold. We derecognized $661.6 million and $670.6 million of accounts receivable as of December 31, 2016 and 2015, respectively, under these factoring arrangements. The cost of factoring such accounts receivable on our consolidated results of operations for the years ended December 31, 2016, 2015, and 2014 was not material.
Note 8: Goodwill and Other Intangibles
Goodwill
Goodwill by segment at December 31 was as follows:
2016 2015Human pharmaceutical products . . . . . . . . . . . . . . . . . . . . . . . . . . . . . . . . . . . . . . $ 1,366.4 $ 1,366.5Animal health . . . . . . . . . . . . . . . . . . . . . . . . . . . . . . . . . . . . . . . . . . . . . . . . . . . . . 2,606.3 2,673.4Total goodwill . . . . . . . . . . . . . . . . . . . . . . . . . . . . . . . . . . . . . . . . . . . . . . . . . . . . . $ 3,972.7 $ 4,039.9
Goodwill results from excess consideration in a business combination over the fair value of identifiable net assets acquired. Goodwill is not amortized but is reviewed for impairment at least annually and when impairment indicators are present. When required, a comparison of implied fair value to the carrying amount of goodwill is performed to determine the amount of any impairment. The decrease in goodwill for the animal health segment is primarily the result of foreign exchange translation adjustments.
No impairments occurred with respect to the carrying value of goodwill for the years ended December 31, 2016, 2015, and 2014.

FINANCIAL REPORT
F7272
Other Intangibles
The components of intangible assets other than goodwill at December 31 were as follows:
2016 2015
Description
CarryingAmount,
GrossAccumulatedAmortization
CarryingAmount,
Net
CarryingAmount,
GrossAccumulatedAmortization
CarryingAmount,
Net
Finite-lived intangibleassets:
Marketed products . . . . . $ 7,400.2 $ (3,301.4) $ 4,098.8 $ 7,528.0 $ (2,756.6) $ 4,771.4Other. . . . . . . . . . . . . . . . 150.7 (71.8) 78.9 151.1 (65.3) 85.8
Total finite-livedintangible assets . . . . 7,550.9 (3,373.2) 4,177.7 7,679.1 (2,821.9) 4,857.2
Indefinite-lived intangibleassets:
Acquired in-processresearch anddevelopment . . . . . . . . 180.2 — 180.2 177.6 — 177.6
Other intangibles . . . . . $ 7,731.1 $ (3,373.2) $ 4,357.9 $ 7,856.7 $ (2,821.9) $ 5,034.8
Marketed products consist of the amortized cost of the rights to assets acquired in business combinations and approved for marketing in a significant global jurisdiction (U.S., Europe, and Japan) and capitalized milestone payments. For transactions other than a business combination, we capitalize milestone payments incurred at or after the product has obtained regulatory approval for marketing.
Other finite-lived intangibles consist primarily of the amortized cost of licensed platform technologies that have alternative future uses in research and development, manufacturing technologies, and customer relationships from business combinations.
Acquired IPR&D consists of the related costs capitalized, adjusted for subsequent impairments, if any. The costs of acquired IPR&D projects acquired directly in a transaction other than a business combination are capitalized if the projects have an alternative future use; otherwise, they are expensed immediately. The fair values of acquired IPR&D projects acquired in business combinations are capitalized as other intangible assets.
Several methods may be used to determine the estimated fair value of other intangibles acquired in a business combination. We utilize the “income method,” which is a Level 3 fair value measurement and applies a probability weighting that considers the risk of development and commercialization to the estimated future net cash flows that are derived from projected revenues and estimated costs. These projections are based on factors such as relevant market size, patent protection, historical pricing of similar products, and expected industry trends. The estimated future net cash flows are then discounted to the present value using an appropriate discount rate. This analysis is performed for each asset independently. The acquired IPR&D assets are treated as indefinite-lived intangible assets until completion or abandonment of the projects, at which time the assets are tested for impairment and amortized over the remaining useful life or written off, as appropriate.
See Note 3 for further discussion of intangible assets acquired in recent business combinations and Note 4 for additional discussion of recent capitalized milestone payments.
Other indefinite-lived intangible assets are reviewed for impairment at least annually and when impairment indicators are present. When required, a comparison of fair value to the carrying amount of assets is performed to determine the amount of any impairment. When determining the fair value of indefinite-lived acquired IPR&D assets for impairment testing purposes, we utilize the "income method" discussed above. Finite-lived intangible assets are reviewed for impairment when an indicator of impairment is present. No material impairments occurred with respect to the carrying value of other intangible assets for the years ended December 31, 2016, 2015 and 2014.
Intangible assets with finite lives are capitalized and are amortized over their estimated useful lives, ranging from 3 to 20 years. As of December 31, 2016, the remaining weighted-average amortization period for finite-lived intangible assets is approximately 12 years.

FINAN
CIAL
REPO
RT
F7373
Amortization expense related to finite-lived intangible assets was as follows:
2016 2015 2014
Amortization expense . . . . . . . . . . . . . . . . . . . . . . . . . . . . . . . . . . . $ 687.9 $ 631.8 $ 535.9
The estimated amortization expense for each of the next five years associated with our finite-lived intangible assets as of December 31, 2016 is as follows:
2017 2018 2019 2020 2021
Estimated amortization expense . . . . . . . . . . . . . . . . . $ 649.6 $ 491.7 $ 314.1 $ 312.8 $ 311.0
Amortization expense is included in either cost of sales, marketing, selling, and administrative or research and development depending on the nature of the intangible asset being amortized.
Note 9: Property and Equipment
Property and equipment is stated on the basis of cost. Provisions for depreciation of buildings and equipment are computed generally by the straight-line method at rates based on their estimated useful lives (12 to 50 years for buildings and 3 to 25 years for equipment). We review the carrying value of long-lived assets for potential impairment on a periodic basis and whenever events or changes in circumstances indicate the carrying value of an asset may not be recoverable. Impairment is determined by comparing projected undiscounted cash flows to be generated by the asset to its carrying value. If an impairment is identified, a loss is recorded equal to the excess of the asset’s net book value over its fair value, and the cost basis is adjusted.
At December 31, property and equipment consisted of the following:
2016 2015Land . . . . . . . . . . . . . . . . . . . . . . . . . . . . . . . . . . . . . . . . . . . . . . . . . . . . . . . . . . . $ 197.6 $ 220.6Buildings . . . . . . . . . . . . . . . . . . . . . . . . . . . . . . . . . . . . . . . . . . . . . . . . . . . . . . . . 6,917.8 6,786.5Equipment . . . . . . . . . . . . . . . . . . . . . . . . . . . . . . . . . . . . . . . . . . . . . . . . . . . . . . . 7,864.7 7,988.5Construction in progress . . . . . . . . . . . . . . . . . . . . . . . . . . . . . . . . . . . . . . . . . . . . 1,797.5 1,665.3
16,777.6 16,660.9Less accumulated depreciation . . . . . . . . . . . . . . . . . . . . . . . . . . . . . . . . . . . . . . . (8,525.0) (8,607.4)Property and equipment, net . . . . . . . . . . . . . . . . . . . . . . . . . . . . . . . . . . . . . . . . . $ 8,252.6 $ 8,053.5
Depreciation expense related to property and equipment and rental expense for all leases, including contingent rentals (not material), was as follows:
2016 2015 2014
Depreciation expense . . . . . . . . . . . . . . . . . . . . . . . . . . . . . . . . . . . $ 716.2 $ 717.6 $ 759.1Rental expense . . . . . . . . . . . . . . . . . . . . . . . . . . . . . . . . . . . . . . . . 221.0 225.7 227.3
The future minimum rental commitments under non-cancelable operating leases are as follows:
2017 2018 2019 2020 2021After2021
Lease commitments . . . . . . . . . . . . . . . . . . . . $ 134.8 $ 120.9 $ 109.9 $ 93.3 $ 75.3 $ 339.4
Capitalized interest costs were not material for the years ended December 31, 2016, 2015, and 2014.
Assets under capital leases included in property and equipment, net on the consolidated balance sheets, capital lease obligations entered into, and future minimum rental commitments are not material.

FINANCIAL REPORT
F7474
Note 10: Borrowings
Debt at December 31 consisted of the following:
2016 2015Short-term commercial paper borrowings . . . . . . . . . . . . . . . . . . . . . . . . . . . . . . . $ 1,299.3 $ —0.00 to 7.13 percent long-term notes (due 2017-2045) . . . . . . . . . . . . . . . . . . . . . 8,776.5 7,700.1Other long-term debt, including capitalized leases . . . . . . . . . . . . . . . . . . . . . . . . 14.4 23.1Unamortized debt issuance costs . . . . . . . . . . . . . . . . . . . . . . . . . . . . . . . . . . . . . (37.5) (37.1)Fair value adjustment on hedged long-term notes . . . . . . . . . . . . . . . . . . . . . . . . 252.5 292.4Total debt . . . . . . . . . . . . . . . . . . . . . . . . . . . . . . . . . . . . . . . . . . . . . . . . . . . . . . . . 10,305.2 7,978.5Less current portion . . . . . . . . . . . . . . . . . . . . . . . . . . . . . . . . . . . . . . . . . . . . . . . . (1,937.4) (6.1)Long-term debt . . . . . . . . . . . . . . . . . . . . . . . . . . . . . . . . . . . . . . . . . . . . . . . . . . . $ 8,367.8 $ 7,972.4
The weighted-average effective borrowing rate on outstanding commercial paper at December 31, 2016 was 0.59 percent.
At December 31, 2016, we had a total of $2.87 billion of unused committed bank credit facilities, which consisted primarily of a $1.20 billion credit facility that expires in August 2021 and a $1.50 billion 364-day facility that expires in December 2017, both of which are available to support our commercial paper program. There were no amounts outstanding under the revolving credit facilities during the years ended December 31, 2016 and 2015. Compensating balances and commitment fees are not material, and there are no conditions that are probable of occurring under which the lines may be withdrawn.
In May 2016, we issued Swiss franc-denominated notes consisting of Fr.200.0 million of 0.00 percent fixed-rate notes due in May 2018, Fr.600.0 million of 0.15 percent fixed-rate notes due in May 2024, and Fr.400.0 million of 0.45 percent fixed-rate notes due in May 2028, with interest to be paid annually. We are using the net cash proceeds of the offering of $1.21 billion for general corporate purposes, which may include the repayment or redemption prior to maturity of certain of our U.S. dollar denominated fixed-rate notes due March 2017.
In June 2015, we issued euro-denominated notes consisting of €600.0 million of 1.00 percent fixed-rate notes due in June 2022, €750.0 million of 1.63 percent fixed-rate notes due in June 2026, and €750.0 million of 2.13 percent fixed-rate notes due in June 2030 with interest to be paid annually. The net cash proceeds of the offering of $2.27 billion were used primarily to purchase and redeem certain higher interest rate U.S. dollar-denominated notes and to repay outstanding commercial paper. We paid $1.95 billion to purchase and redeem notes with an aggregate principal amount of $1.65 billion and a net carrying value of $1.78 billion in June 2015, resulting in a pretax debt extinguishment loss of $166.7 million, which was included in other–net, (income) expense in our consolidated statement of operations during the year ended December 31, 2015.
In March 2015, we issued $600.0 million of 1.25 percent fixed-rate notes due in March 2018, $800.0 million of 2.75 percent fixed-rate notes due in June 2025, and $800.0 million of 3.70 percent fixed-rate notes due in March 2045 with interest to be paid semi-annually. The proceeds from the issuance of the notes were used primarily to repay outstanding commercial paper issued in connection with our January 2015 acquisition of Novartis AH.
In February 2014, we issued $600.0 million of 1.95 percent and $400.0 million of 4.65 percent fixed-rate notes with interest to be paid semi-annually and maturity dates in March 2019, and June 2044, respectively. Current maturities of long-term notes of $1.00 billion were repaid in March 2014.
The aggregate amounts of maturities on long-term debt for the next five years are as follows:
2017 2018 2019 2020 2021
Maturities on long-term debt . . . . . . . . . . . . . . . . . . . . $ 635.3 $ 999.2 $ 603.0 $ 1.6 $ 0.5
We have converted approximately 35 percent of our long-term fixed-rate notes to floating rates through the use of interest rate swaps. The weighted-average effective borrowing rates based on long-term debt obligations and interest rates at December 31, 2016 and 2015, including the effects of interest rate swaps for hedged debt obligations, were 2.51 percent and 2.67 percent, respectively.

FINAN
CIAL
REPO
RT
F7575
The aggregate amount of cash payments for interest on borrowings, net of capitalized interest, are as follows:
2016 2015 2014
Cash payments for interest on borrowings . . . . . . . . . . . . . . . . . . . $ 146.4 $ 129.6 $ 140.4
In accordance with the requirements of derivatives and hedging guidance, the portion of our fixed-rate debt obligations that is hedged as a fair value hedge, is reflected in the consolidated balance sheets as an amount equal to the sum of the debt’s carrying value plus the fair value adjustment representing changes in fair value of the hedged debt attributable to movements in market interest rates subsequent to the inception of the hedge.
Note 11: Stock-Based Compensation
Our stock-based compensation expense consists of performance awards (PAs), shareholder value awards (SVAs), and restricted stock units (RSUs). We recognize the fair value of stock-based compensation as expense over the requisite service period of the individual grantees, which generally equals the vesting period. We provide newly issued shares of our common stock and treasury stock to satisfy the issuance of PA, SVA, and RSU shares.
Stock-based compensation expense and the related tax benefits were as follows:
2016 2015 2014
Stock-based compensation expense . . . . . . . . . . . . . . . . . . . . . . . $ 255.3 $ 217.8 $ 156.0Tax benefit. . . . . . . . . . . . . . . . . . . . . . . . . . . . . . . . . . . . . . . . . . . . 89.4 76.2 54.6
At December 31, 2016, additional stock-based compensation awards may be granted under the 2002 Lilly Stock Plan for not more than 99.6 million shares.
Performance Award Program
PAs are granted to officers and management and are payable in shares of our common stock. The number of PA shares actually issued, if any, varies depending on the achievement of certain pre-established earnings-per-share targets over a two-year period. PA shares are accounted for at fair value based upon the closing stock price on the date of grant and fully vest at the end of the measurement period. The fair values of PAs granted for the years ended December 31, 2016, 2015, and 2014 were $72.00, $70.34, and $48.81, respectively. The number of shares ultimately issued for the PA program is dependent upon the earnings achieved during the vesting period. Pursuant to this program, approximately 0.5 million shares, 0.5 million shares, and 0.7 million shares were issued during the years ended December 31, 2016, 2015, and 2014, respectively. Approximately 1.3 million shares are expected to be issued in 2017. As of December 31, 2016, the total remaining unrecognized compensation cost related to nonvested PAs was $43.7 million, which will be amortized over the weighted-average remaining requisite service period of 12 months.

FINANCIAL REPORT
F7676
Shareholder Value Award Program
SVAs are granted to officers and management and are payable in shares of our common stock. The number of shares actually issued, if any, varies depending on our stock price at the end of the three-year vesting period compared to pre-established target stock prices. We measure the fair value of the SVA unit on the grant date using a Monte Carlo simulation model. The model utilizes multiple input variables that determine the probability of satisfying the market condition stipulated in the award grant and calculates the fair value of the award. Expected volatilities utilized in the model are based on implied volatilities from traded options on our stock, historical volatility of our stock price, and other factors. Similarly, the dividend yield is based on historical experience and our estimate of future dividend yields. The risk-free interest rate is derived from the U.S. Treasury yield curve in effect at the time of grant. The weighted-average fair values of the SVA units granted during the years ended December 31, 2016, 2015, and 2014 were $48.68, $54.81, and $41.97, respectively, determined using the following assumptions:
(Percents) 2016 2015 2014Expected dividend yield . . . . . . . . . . . . . . . . . . . . . . . . . . . . . . . 2.00% 2.50% 3.50%Risk-free interest rate . . . . . . . . . . . . . . . . . . . . . . . . . . . . . . . . 0.92 0.79 .08-.71Volatility . . . . . . . . . . . . . . . . . . . . . . . . . . . . . . . . . . . . . . . . . . . 21.68 20.37 18.87-21.56
Pursuant to this program, approximately 1.0 million shares, 1.4 million shares, and 1.4 million shares were issued during the years ended December 31, 2016, 2015, and 2014, respectively. Approximately 1.2 million shares are expected to be issued in 2017. As of December 31, 2016, the total remaining unrecognized compensation cost related to nonvested SVAs was $65.1 million, which will be amortized over the weighted-average remaining requisite service period of 20 months.
Restricted Stock Units
RSUs are granted to certain employees and are payable in shares of our common stock. RSU shares are accounted for at fair value based upon the closing stock price on the date of grant. The corresponding expense is amortized over the vesting period, typically three years. The fair values of RSU awards granted during the years ended December 31, 2016, 2015, and 2014 were $71.46, $71.69, and $52.72, respectively. The number of shares ultimately issued for the RSU program remains constant with the exception of forfeitures. Pursuant to this program, 1.3 million, 0.9 million, and 1.2 million shares were granted and approximately 0.6 million, 0.9 million, and 0.9 million shares were issued during the years ended December 31, 2016, 2015, and 2014, respectively. Approximately 0.7 million shares are expected to be issued in 2017. As of December 31, 2016, the total remaining unrecognized compensation cost related to nonvested RSUs was $103.3 million, which will be amortized over the weighted-average remaining requisite service period of 22 months.
Note 12: Shareholders' Equity
During 2016, 2015, and 2014, we repurchased $540.1 million, $749.5 million and $800.0 million, respectively, of shares associated with our $5.00 billion share repurchase program announced in 2013. As of December 31, 2016, there were $2.41 billion of shares remaining in that program. Our share repurchases are facilitated through payments to a financial institution that purchases the shares on our behalf. As of December 31, 2016, we had paid $60.0 million to a financial institution for shares that were subsequently repurchased in the first quarter of 2017.
We have 5.0 million authorized shares of preferred stock. As of December 31, 2016 and 2015, no preferred stock was issued.
We have an employee benefit trust that held 50.0 million shares of our common stock at both December 31, 2016 and 2015, to provide a source of funds to assist us in meeting our obligations under various employee benefit plans. The cost basis of the shares held in the trust was $3.01 billion at both December 31, 2016 and 2015, and is shown as a reduction of shareholders’ equity. Any dividend transactions between us and the trust are eliminated. Stock held by the trust is not considered outstanding in the computation of EPS. The assets of the trust were not used to fund any of our obligations under these employee benefit plans during the years ended December 31, 2016, 2015, and 2014.

FINAN
CIAL
REPO
RT
F7777
Note 13: Income Taxes
Deferred taxes are recognized for the future tax effects of temporary differences between financial and income tax reporting based on enacted tax laws and rates. Federal income taxes are provided on the portion of the income of foreign subsidiaries that is expected to be remitted to the U.S. and be taxable. When foreign earnings are expected to be indefinitely reinvested outside the U.S., no accrual for U.S. income taxes is provided.
We recognize the tax benefit from an uncertain tax position only if it is more likely than not that the tax position will be sustained on examination by the taxing authorities, based on the technical merits of the position. The tax benefits recognized in the financial statements from such a position are measured based on the largest benefit that has a greater than 50 percent likelihood of being realized upon ultimate resolution.
Following is the composition of income tax expense:
2016 2015 2014Current:
Federal . . . . . . . . . . . . . . . . . . . . . . . . . . . . . . . . . . . . . . . . . . . . . $ (57.0) $ 660.5 $ 168.9Foreign . . . . . . . . . . . . . . . . . . . . . . . . . . . . . . . . . . . . . . . . . . . . . 378.9 422.0 406.2State . . . . . . . . . . . . . . . . . . . . . . . . . . . . . . . . . . . . . . . . . . . . . . . (125.0) 47.5 (2.1)
Total current tax expense . . . . . . . . . . . . . . . . . . . . . . . . . . . . . 196.9 1,130.0 573.0Deferred:
Federal . . . . . . . . . . . . . . . . . . . . . . . . . . . . . . . . . . . . . . . . . . . . . 517.0 (689.6) (83.3)Foreign . . . . . . . . . . . . . . . . . . . . . . . . . . . . . . . . . . . . . . . . . . . . . (83.3) (66.0) 120.2State . . . . . . . . . . . . . . . . . . . . . . . . . . . . . . . . . . . . . . . . . . . . . . . 5.8 7.2 (0.1)
Total deferred tax (benefit) expense . . . . . . . . . . . . . . . . . . . . . 439.5 (748.4) 36.8Income taxes . . . . . . . . . . . . . . . . . . . . . . . . . . . . . . . . . . . . . . . . . . $ 636.4 $ 381.6 $ 609.8
Significant components of our deferred tax assets and liabilities as of December 31 are as follows:
2016 2015Deferred tax assets:
Compensation and benefits . . . . . . . . . . . . . . . . . . . . . . . . . . . . . . . . . . . . . . . . . $ 1,126.0 $ 1,034.6Purchases of intangible assets . . . . . . . . . . . . . . . . . . . . . . . . . . . . . . . . . . . . . . 620.3 613.8Tax credit carryforwards and carrybacks . . . . . . . . . . . . . . . . . . . . . . . . . . . . . . . 458.9 294.2Tax loss carryforwards and carrybacks . . . . . . . . . . . . . . . . . . . . . . . . . . . . . . . . 327.3 247.8Contingent consideration . . . . . . . . . . . . . . . . . . . . . . . . . . . . . . . . . . . . . . . . . . . 142.7 214.6Product return reserves . . . . . . . . . . . . . . . . . . . . . . . . . . . . . . . . . . . . . . . . . . . . 128.1 212.1Other comprehensive loss on hedging transactions . . . . . . . . . . . . . . . . . . . . . . 123.3 129.7Debt . . . . . . . . . . . . . . . . . . . . . . . . . . . . . . . . . . . . . . . . . . . . . . . . . . . . . . . . . . . 95.3 111.3Other . . . . . . . . . . . . . . . . . . . . . . . . . . . . . . . . . . . . . . . . . . . . . . . . . . . . . . . . . . 587.3 679.4
Total gross deferred tax assets . . . . . . . . . . . . . . . . . . . . . . . . . . . . . . . . . . . . 3,609.2 3,537.5Valuation allowances . . . . . . . . . . . . . . . . . . . . . . . . . . . . . . . . . . . . . . . . . . . . . . (648.3) (590.3)
Total deferred tax assets . . . . . . . . . . . . . . . . . . . . . . . . . . . . . . . . . . . . . . . . . 2,960.9 2,947.2Deferred tax liabilities:
Inventories . . . . . . . . . . . . . . . . . . . . . . . . . . . . . . . . . . . . . . . . . . . . . . . . . . . . . . (955.5) (771.3)Unremitted earnings . . . . . . . . . . . . . . . . . . . . . . . . . . . . . . . . . . . . . . . . . . . . . . (673.6) (218.8)Intangibles . . . . . . . . . . . . . . . . . . . . . . . . . . . . . . . . . . . . . . . . . . . . . . . . . . . . . . (604.2) (792.3)Property and equipment . . . . . . . . . . . . . . . . . . . . . . . . . . . . . . . . . . . . . . . . . . . (398.6) (411.6)Financial instruments . . . . . . . . . . . . . . . . . . . . . . . . . . . . . . . . . . . . . . . . . . . . . (279.3) (144.0)Prepaid employee benefits . . . . . . . . . . . . . . . . . . . . . . . . . . . . . . . . . . . . . . . . . (265.3) (317.8)
Total deferred tax liabilities . . . . . . . . . . . . . . . . . . . . . . . . . . . . . . . . . . . . . . . (3,176.5) (2,655.8)Deferred tax assets (liabilities) - net . . . . . . . . . . . . . . . . . . . . . . . . . . . . . . . . . . . $ (215.6) $ 291.4
The deferred tax asset and related valuation allowance amounts for U.S. federal and state net operating losses and tax credits shown above have been reduced for differences between financial reporting and tax return filings.

FINANCIAL REPORT
F7878
At December 31, 2016, based on filed tax returns we have tax credit carryforwards and carrybacks of $738.4 million available to reduce future income taxes; $178.7 million, if unused, will expire by 2026; $53.6 million, if unused, will expire by 2036. The remaining portion of the tax credit carryforwards is related to federal tax credits of $96.1 million, international tax credits of $106.2 million, and state tax credits of $303.8 million, all of which are substantially reserved.
At December 31, 2016, based on filed tax returns we had net operating losses and other carryforwards for international and U.S. federal income tax purposes of $856.0 million: $142.6 million will expire by 2021; $462.5 million will expire between 2022 and 2036; and $250.9 million of the carryforwards will never expire. Net operating losses and other carryforwards for international and U.S. federal income tax purposes are partially reserved. Deferred tax assets related to state net operating losses of $102.0 million and other state carryforwards of $5.0 million are fully reserved.
Domestic and Puerto Rican companies contributed approximately 70 percent, 35 percent, and 20 percent for the years ended December 31, 2016, 2015, and 2014, respectively, to consolidated income before income taxes. We have a subsidiary operating in Puerto Rico under a tax incentive grant effective through the end of 2016. A similar, new tax incentive grant began in 2017 and will be in effect for 15 years.
At December 31, 2016, U.S. income taxes have not been provided on approximately $28.0 billion of unremitted earnings of foreign subsidiaries as we consider these unremitted earnings to be indefinitely invested for continued use in our foreign operations. Additional tax provisions will be required if these earnings are repatriated in the future to the U.S. Due to complexities in the tax laws and assumptions that we would have to make, it is not practicable to determine the amount of the related unrecognized deferred income tax liability.
Cash payments of income taxes were as follows:
2016 2015 2014
Cash payments of income taxes . . . . . . . . . . . . . . . . . . . . . . . . . . . $ 700.6 $ 969.0 $ 729.7
Following is a reconciliation of the income tax expense applying the U.S. federal statutory rate to income before income taxes to reported income tax expense:
2016 2015 2014Income tax at the U.S. federal statutory tax rate . . . . . . . . . . . . . . . $ 1,180.9 $ 976.5 $ 1,050.1Add (deduct):
International operations, including Puerto Rico. . . . . . . . . . . . . . . (313.7) (565.2) (344.8)General business credits . . . . . . . . . . . . . . . . . . . . . . . . . . . . . . . (58.3) (69.2) (44.3)Other . . . . . . . . . . . . . . . . . . . . . . . . . . . . . . . . . . . . . . . . . . . . . . . (172.5) 39.5 (51.2)
Income taxes . . . . . . . . . . . . . . . . . . . . . . . . . . . . . . . . . . . . . . . . . . $ 636.4 $ 381.6 $ 609.8

FINAN
CIAL
REPO
RT
F7979
A reconciliation of the beginning and ending amount of gross unrecognized tax benefits is as follows:
2016 2015 2014Beginning balance at January 1 . . . . . . . . . . . . . . . . . . . . . . . . . . . $ 1,066.6 $ 1,338.8 $ 1,136.4Additions based on tax positions related to the current year. . . . . . 73.4 131.3 126.4Additions for tax positions of prior years . . . . . . . . . . . . . . . . . . . . . 14.8 116.6 132.6Reductions for tax positions of prior years . . . . . . . . . . . . . . . . . . . (15.2) (45.2) (32.1)Settlements . . . . . . . . . . . . . . . . . . . . . . . . . . . . . . . . . . . . . . . . . . . (171.9) (446.2) (4.2)Lapses of statutes of limitation . . . . . . . . . . . . . . . . . . . . . . . . . . . . (110.0) (4.0) (3.5)Changes related to the impact of foreign currency translation . . . . (4.3) (24.7) (16.8)Ending balance at December 31 . . . . . . . . . . . . . . . . . . . . . . . . . . . $ 853.4 $ 1,066.6 $ 1,338.8
The total amount of unrecognized tax benefits that, if recognized, would affect our effective tax rate was $382.8 million and $404.1 million at December 31, 2016 and 2015, respectively.
We file income tax returns in the U.S. federal jurisdiction and various state, local, and non-U.S. jurisdictions. We are no longer subject to U.S. federal, state and local, or non-U.S. income tax examinations in most major taxing jurisdictions for years before 2009.
The U.S. examination of tax years 2010-2012 commenced during the fourth quarter of 2013. In December 2015, we executed a closing agreement with the Internal Revenue Service which effectively settled certain matters for tax years 2010-2012. Accordingly, we reduced our gross uncertain tax positions by approximately $320 million in 2015. During 2016, we effectively settled the remaining matters related to tax years 2010-2012. As a result of this resolution, our gross uncertain tax positions were further reduced by approximately $140 million, and our consolidated results of operations benefited from an immaterial reduction in income tax expense. During 2016, we made cash payments of approximately $150 million related to tax years 2010-2012 after application of available tax credit carryforwards and carrybacks. The U.S. examination of tax years 2013-2015 began in 2016. Because the examination of tax years 2013-2015 is still in the early stages, the resolution of matters in this audit period will likely extend beyond the next 12 months.
We recognize both accrued interest and penalties related to unrecognized tax benefits in income tax expense. We recognized income tax (benefit) expense related to interest and penalties as follows:
2016 2015 2014
Income tax (benefit) expense . . . . . . . . . . . . . . . . . . . . . . . . . . . . . $ (52.5) $ 13.2 $ 35.9
At December 31, 2016 and 2015, our accruals for the payment of interest and penalties totaled $134.9 million and $216.3 million, respectively.

FINANCIAL REPORT
F8080
Note 14: Retirement Benefits
We use a measurement date of December 31 to develop the change in benefit obligation, change in plan assets, funded status, and amounts recognized in the consolidated balance sheets at December 31 for our defined benefit pension and retiree health benefit plans, which were as follows:
Defined BenefitPension Plans
Retiree HealthBenefit Plans
2016 2015 2016 2015Change in benefit obligation:
Benefit obligation at beginning of year . . . . . . . . . . . . . $ 11,719.2 $ 12,012.4 $ 1,467.4 $ 1,553.5Benefit obligation assumed in Novartis AH acquisition . — 334.7 — 9.9Service cost . . . . . . . . . . . . . . . . . . . . . . . . . . . . . . . . . 277.7 315.7 39.1 45.1Interest cost . . . . . . . . . . . . . . . . . . . . . . . . . . . . . . . . . 420.8 476.8 53.2 62.6Actuarial (gain) loss . . . . . . . . . . . . . . . . . . . . . . . . . . . . 806.5 (812.4) 50.9 (113.5)Benefits paid . . . . . . . . . . . . . . . . . . . . . . . . . . . . . . . . . (454.5) (437.8) (59.8) (77.5)Plan amendments . . . . . . . . . . . . . . . . . . . . . . . . . . . . . — (0.4) (35.8) —Foreign currency exchange rate changes and other
adjustments . . . . . . . . . . . . . . . . . . . . . . . . . . . . . . . . (313.8) (169.8) (20.4) (12.7)Benefit obligation at end of year . . . . . . . . . . . . . . . . . . 12,455.9 11,719.2 1,494.6 1,467.4
Change in plan assets:Fair value of plan assets at beginning of year . . . . . . . . 9,995.6 9,835.7 1,943.7 1,918.7Fair value of plan assets assumed in Novartis AH
acquisition . . . . . . . . . . . . . . . . . . . . . . . . . . . . . . . . . — 235.9 — —Actual return on plan assets . . . . . . . . . . . . . . . . . . . . . 853.4 90.4 68.9 85.1Employer contribution . . . . . . . . . . . . . . . . . . . . . . . . . . 110.2 404.1 8.4 17.4Benefits paid . . . . . . . . . . . . . . . . . . . . . . . . . . . . . . . . . (454.5) (437.8) (59.8) (77.5)Foreign currency exchange rate changes and other
adjustments . . . . . . . . . . . . . . . . . . . . . . . . . . . . . . . . (325.0) (132.7) — —Fair value of plan assets at end of year . . . . . . . . . . . . 10,179.7 9,995.6 1,961.2 1,943.7
Funded status . . . . . . . . . . . . . . . . . . . . . . . . . . . . . . . . . (2,276.2) (1,723.6) 466.6 476.3Unrecognized net actuarial loss . . . . . . . . . . . . . . . . . . . 4,915.7 4,552.7 458.8 347.9Unrecognized prior service (benefit) cost . . . . . . . . . . . . 21.7 32.5 (525.1) (574.8)Net amount recognized . . . . . . . . . . . . . . . . . . . . . . . . . . $ 2,661.2 $ 2,861.6 $ 400.3 $ 249.4
Amounts recognized in the consolidated balance sheetconsisted of:
Sundry . . . . . . . . . . . . . . . . . . . . . . . . . . . . . . . . . . . . . . $ 29.7 $ 261.6 $ 689.3 $ 722.1Other current liabilities . . . . . . . . . . . . . . . . . . . . . . . . . (68.0) (63.8) (6.7) (6.9)Accrued retirement benefits . . . . . . . . . . . . . . . . . . . . . (2,237.9) (1,921.4) (216.0) (238.9)Accumulated other comprehensive (income) loss
before income taxes . . . . . . . . . . . . . . . . . . . . . . . . . . 4,937.4 4,585.2 (66.3) (226.9)Net amount recognized . . . . . . . . . . . . . . . . . . . . . . . . . $ 2,661.2 $ 2,861.6 $ 400.3 $ 249.4
The unrecognized net actuarial loss and unrecognized prior service cost (benefit) have not yet been recognized in net periodic pension costs and are included in accumulated other comprehensive loss at December 31, 2016.

FINAN
CIAL
REPO
RT
F8181
During 2017, we expect the following components of accumulated other comprehensive loss to be recognized as components of net periodic benefit cost:
Defined BenefitPension Plans
Retiree HealthBenefit Plans
Unrecognized net actuarial loss . . . . . . . . . . . . . . . . . . . . . . . . . . . . . . . $ 289.5 $ 16.1Unrecognized prior service (benefit) cost . . . . . . . . . . . . . . . . . . . . . . . . 5.4 (90.0)Total . . . . . . . . . . . . . . . . . . . . . . . . . . . . . . . . . . . . . . . . . . . . . . . . . . . . $ 294.9 $ (73.9)
We do not expect any plan assets to be returned to us in 2017.
The following represents our weighted-average assumptions as of December 31:
Defined BenefitPension Plans
Retiree HealthBenefit Plans
(Percents) 2016 2015 2014 2016 2015 2014Discount rate for benefit obligation . . . . . . . . . . . . . . . . . . . . . . . 3.9% 4.3% 4.0% 4.3% 4.5% 4.1%Discount rate for net benefit costs . . . . . . . . . . . . . . . . . . . . . . . 4.3 4.0 4.9 4.5 4.1 5.0Rate of compensation increase for benefit obligation . . . . . . . . . 3.4 3.4 3.4Rate of compensation increase for net benefit costs . . . . . . . . . 3.4 3.4 3.4Expected return on plan assets for net benefit costs . . . . . . . . . 7.4 7.4 8.1 8.0 8.0 8.5
We annually evaluate the expected return on plan assets in our defined benefit pension and retiree health benefit plans. In evaluating the expected rate of return, we consider many factors, with a primary analysis of current and projected market conditions; asset returns and asset allocations; and the views of leading financial advisers and economists. We may also review our historical assumptions compared with actual results, as well as the assumptions and trend rates utilized by similar plans, where applicable.
Given the design of our retiree health benefit plans, healthcare-cost trend rates do not have a material impact on our financial condition or results of operations.
The following benefit payments, which reflect expected future service, as appropriate, are expected to be paid as follows:
2017 2018 2019 2020 2021 2022-2026Defined benefit pension plans . . $ 464.5 $ 471.3 $ 486.1 $ 505.3 $ 526.9 $ 3,016.3Retiree health benefit plans. . . . 72.8 75.5 78.1 80.8 83.9 465.6
Amounts relating to defined benefit pension plans with projected benefit obligations in excess of plan assets were as follows at December 31:
2016 2015
Projected benefit obligation . . . . . . . . . . . . . . . . . . . . . . . . . . . . . . . . . . . . . . . . . . . . . $ 10,597.0 $ 10,054.1Fair value of plan assets . . . . . . . . . . . . . . . . . . . . . . . . . . . . . . . . . . . . . . . . . . . . . . . 8,291.2 8,069.7
Amounts relating to defined benefit pension plans and retiree health benefit plans with accumulated benefit obligations in excess of plan assets were as follows at December 31:
Defined BenefitPension Plans
Retiree Health Benefit Plans
2016 2015 2016 2015
Accumulated benefit obligation . . . . . . . . . . . . . . . . . . . . . $ 9,805.4 $ 2,028.1 $ 222.7 $ 245.8Fair value of plan assets . . . . . . . . . . . . . . . . . . . . . . . . . . 8,285.2 844.9 — —
The total accumulated benefit obligation for our defined benefit pension plans was $11.49 billion and $10.75 billion at December 31, 2016 and 2015, respectively.

FINANCIAL REPORT
F8282
Net pension and retiree health benefit expense included the following components:
Defined BenefitPension Plans
Retiree HealthBenefit Plans
2016 2015 2014 2016 2015 2014Components of net periodic (benefit)cost:
Service cost . . . . . . . . . . . . . . . . . . . . . . $ 277.7 $ 315.7 $ 240.9 $ 39.1 $ 45.1 $ 33.0Interest cost . . . . . . . . . . . . . . . . . . . . . . 420.8 476.8 472.6 53.2 62.6 85.6Expected return on plan assets . . . . . . . (752.1) (782.3) (756.6) (150.2) (150.0) (146.4)Amortization of prior service (benefit)
cost . . . . . . . . . . . . . . . . . . . . . . . . . . . 11.8 10.4 3.6 (85.8) (91.1) (37.6)Recognized actuarial loss . . . . . . . . . . . 285.6 383.2 282.3 19.1 38.0 20.7Net periodic (benefit) cost . . . . . . . . . . . $ 243.8 $ 403.8 $ 242.8 $ (124.6) $ (95.4) $ (44.7)
As of January 1, 2016, we changed the method used to estimate the service and interest cost components of the net periodic pension and retiree health benefit plan costs. This new method uses the spot yield curve approach to estimate the service and interest costs by applying the specific spot rates along the yield curve to the projected cash outflows of our obligations. Previously, those costs were determined using a single weighted-average discount rate. The new method provides a more precise measure of interest and service costs by improving the correlation between the projected benefit cash flows and the specific spot yield curve rates. The change did not affect the measurement of the total benefit obligations as the change in service and interest costs is recorded in the actuarial gains and losses recorded in accumulated other comprehensive loss. We have accounted for this change as a change in estimate prospectively.
The following represents the amounts recognized in other comprehensive income (loss) for the years ended December 31, 2016, 2015, and 2014:
Defined BenefitPension Plans
Retiree HealthBenefit Plans
2016 2015 2014 2016 2015 2014
Actuarial gain (loss) arising duringperiod . . . . . . . . . . . . . . . . . . . . . . . . $ (725.2) $ 120.4 $ (1,939.3) $ (132.2) $ 48.6 $ (282.9)Plan amendments during period . . . — 0.4 2.4 35.8 — 533.6Amortization of prior service(benefit) cost included in netincome . . . . . . . . . . . . . . . . . . . . . . . 11.8 10.4 3.6 (85.8) (91.1) (37.6)Amortization of net actuarial lossincluded in net income . . . . . . . . . . . 285.6 383.2 282.3 19.1 38.0 20.7Foreign currency exchange ratechanges and other . . . . . . . . . . . . . . 75.6 58.8 89.6 2.5 4.2 —Total other comprehensive income(loss) during period . . . . . . . . . . . . . $ (352.2) $ 573.2 $ (1,561.4) $ (160.6) $ (0.3) $ 233.8
We have defined contribution savings plans that cover our eligible employees worldwide. The purpose of these plans is generally to provide additional financial security during retirement by providing employees with an incentive to save. Our contributions to the plans are based on employee contributions and the level of our match. Expenses under the plans totaled $175.0 million, $162.4 million, and $153.3 million for the years ended December 31, 2016, 2015, and 2014, respectively.
We provide certain other postemployment benefits primarily related to disability benefits and accrue for the related cost over the service lives of employees. Expenses associated with these benefit plans for the years ended December 31, 2016, 2015, and 2014 were not material.

FINAN
CIAL
REPO
RT
F8383
Benefit Plan Investments
Our benefit plan investment policies are set with specific consideration of return and risk requirements in relationship to the respective liabilities. U.S. and Puerto Rico plans represent approximately 80 percent of our global investments. Given the long-term nature of our liabilities, these plans have the flexibility to manage an above-average degree of risk in the asset portfolios. At the investment-policy level, there are no specifically prohibited investments. However, within individual investment manager mandates, restrictions and limitations are contractually set to align with our investment objectives, ensure risk control, and limit concentrations.
We manage our portfolio to minimize concentration of risk by allocating funds within asset categories. In addition, within a category we use different managers with various management objectives to eliminate any significant concentration of risk.
Our global benefit plans may enter into contractual arrangements (derivatives) to implement the local investment policy or manage particular portfolio risks. Derivatives are principally used to increase or decrease exposure to a particular public equity, fixed income, commodity, or currency market more rapidly or less expensively than could be accomplished through the use of the cash markets. The plans utilize both exchange-traded and over-the-counter instruments. The maximum exposure to either a market or counterparty credit loss is limited to the carrying value of the receivable, and is managed within contractual limits. We expect all of our counterparties to meet their obligations. The gross values of these derivative receivables and payables are not material to the global asset portfolio, and their values are reflected within the tables below.
The defined benefit pension and retiree health benefit plan allocation for the U.S. and Puerto Rico currently comprises approximately 80 percent growth investments and 20 percent fixed-income investments. The growth investment allocation encompasses U.S. and international public equity securities, hedge funds, private equity-like investments, and real estate. These portfolio allocations are intended to reduce overall risk by providing diversification, while seeking moderate to high returns over the long term.
Public equity securities are well diversified and invested in U.S. and international small-to-large companies across various asset managers and styles. The remaining portion of the growth portfolio is invested in private alternative investments.
Fixed-income investments primarily consist of fixed-income securities in U.S. treasuries and agencies, emerging market debt obligations, corporate bonds, mortgage-backed securities, commercial mortgage-backed obligations, and any related repurchase agreements.
Hedge funds are privately owned institutional investment funds that generally have moderate liquidity. Hedge funds seek specified levels of absolute return regardless of overall market conditions, and generally have low correlations to public equity and debt markets. Hedge funds often invest substantially in financial market instruments (stocks, bonds, commodities, currencies, derivatives, etc.) using a very broad range of trading activities to manage portfolio risks. Hedge fund strategies focus primarily on security selection and seek to be neutral with respect to market moves. Common groupings of hedge fund strategies include relative value, tactical, and event driven. Relative value strategies include arbitrage, when the same asset can simultaneously be bought and sold at different prices, achieving an immediate profit. Tactical strategies often take long and short positions to reduce or eliminate overall market risks while seeking a particular investment opportunity. Event strategy opportunities can evolve from specific company announcements such as mergers and acquisitions, and typically have little correlation to overall market directional movements. Our hedge fund investments are made through limited partnership interests primarily in fund-of-funds structures to ensure diversification across many strategies and many individual managers. Plan holdings in hedge funds are valued based on NAVs calculated by each fund or general partner, as applicable, and we have the ability to redeem these investments at NAV.

FINANCIAL REPORT
F8484
Private equity-like investment funds typically have low liquidity and are made through long-term partnerships or joint ventures that invest in pools of capital invested in primarily non-publicly traded entities. Underlying investments include venture capital (early stage investing), buyout, and special situation investing. Private equity management firms typically acquire and then reorganize private companies to create increased long term value. Private equity-like funds usually have a limited life of approximately 10-15 years, and require a minimum investment commitment from their limited partners. Our private investments are made both directly into funds and through fund-of-funds structures to ensure broad diversification of management styles and assets across the portfolio. Plan holdings in private equity-like investments are valued using the value reported by the partnership, adjusted for known cash flows and significant events through our reporting date. Values provided by the partnerships are primarily based on analysis of and judgments about the underlying investments. Inputs to these valuations include underlying NAVs, discounted cash flow valuations, comparable market valuations, and may also include adjustments for currency, credit, liquidity and other risks as applicable. The vast majority of these private partnerships provide us with annual audited financial statements including their compliance with fair valuation procedures consistent with applicable accounting standards.
Real estate is composed of both public and private holdings. Real estate investments in registered investment companies that trade on an exchange are classified as Level 1 on the fair value hierarchy. Real estate investments in funds measured at fair value on the basis of NAV provided by the fund manager are classified as such. These NAVs are developed with inputs including discounted cash flow, independent appraisal, and market comparable analyses.
Other assets include cash and cash equivalents and mark-to-market value of derivatives.
The cash value of the trust-owned insurance contract is invested in investment-grade publicly traded equity and fixed-income securities.
Other than hedge funds, private equity-like investments, and real estate, which are discussed above, we determine fair values based on a market approach using quoted market values, significant other observable inputs for identical or comparable assets or liabilities, or discounted cash flow analyses.

FINAN
CIAL
REPO
RT
F8585
The fair values of our defined benefit pension plan and retiree health plan assets as of December 31, 2016 by asset category are as follows:
Fair Value Measurements Using
Asset Class Total
Quoted Prices inActive
Markets forIdentical Assets
(Level 1)
SignificantObservable
Inputs(Level 2)
SignificantUnobservable
Inputs(Level 3)
Investments Valued at Net Asset Value(1)
Defined Benefit Pension PlansPublic equity securities:
U.S. . . . . . . . . . . . . . . . . . . . . . . $ 402.4 $ 165.5 $ — $ — $ 236.9International . . . . . . . . . . . . . . . . 2,285.6 770.5 — — 1,515.1
Fixed income:Developed markets . . . . . . . . . . 2,631.3 27.2 1,983.0 — 621.1Developed markets -repurchase agreements . . . . . . . (1,024.4) — (1,024.4) — —Emerging markets . . . . . . . . . . . 450.0 — 180.1 0.3 269.6
Private alternative investments:Hedge funds . . . . . . . . . . . . . . . 2,904.6 — — — 2,904.6Equity-like funds . . . . . . . . . . . . 1,355.0 — 0.2 16.8 1,338.0
Real estate . . . . . . . . . . . . . . . . . . 504.1 344.5 — — 159.6Other . . . . . . . . . . . . . . . . . . . . . . 671.1 365.0 108.1 — 198.0Total . . . . . . . . . . . . . . . . . . . . . . . $10,179.7 $ 1,672.7 $ 1,247.0 $ 17.1 $ 7,242.9
Retiree Health Benefit PlansPublic equity securities:
U.S. . . . . . . . . . . . . . . . . . . . . . . $ 38.7 $ 16.7 $ — $ — $ 22.0International . . . . . . . . . . . . . . . . 146.3 52.0 — — 94.3
Fixed income:Developed markets . . . . . . . . . . 68.0 — 58.4 — 9.6Emerging markets . . . . . . . . . . . 42.6 — 18.2 — 24.4
Private alternative investments:Hedge funds . . . . . . . . . . . . . . . 261.0 — — — 261.0Equity-like funds . . . . . . . . . . . . 116.0 — — 1.7 114.3
Cash value of trust ownedinsurance contract . . . . . . . . . . 1,208.3 — 1,208.3 — —
Real estate . . . . . . . . . . . . . . . . . . 34.8 34.8 — — —Other . . . . . . . . . . . . . . . . . . . . . . 45.5 28.1 3.7 — 13.7Total . . . . . . . . . . . . . . . . . . . . . . . $ 1,961.2 $ 131.6 $ 1,288.6 $ 1.7 $ 539.3
(1) Certain investments that are measured at fair value using the NAV per share (or its equivalent) as a practical expedient have not been classified in the fair value hierarchy.
No material transfers between Level 1, Level 2, or Level 3 occurred during the year ended December 31, 2016. The activity in the Level 3 investments during the year ended December 31, 2016 was not material.
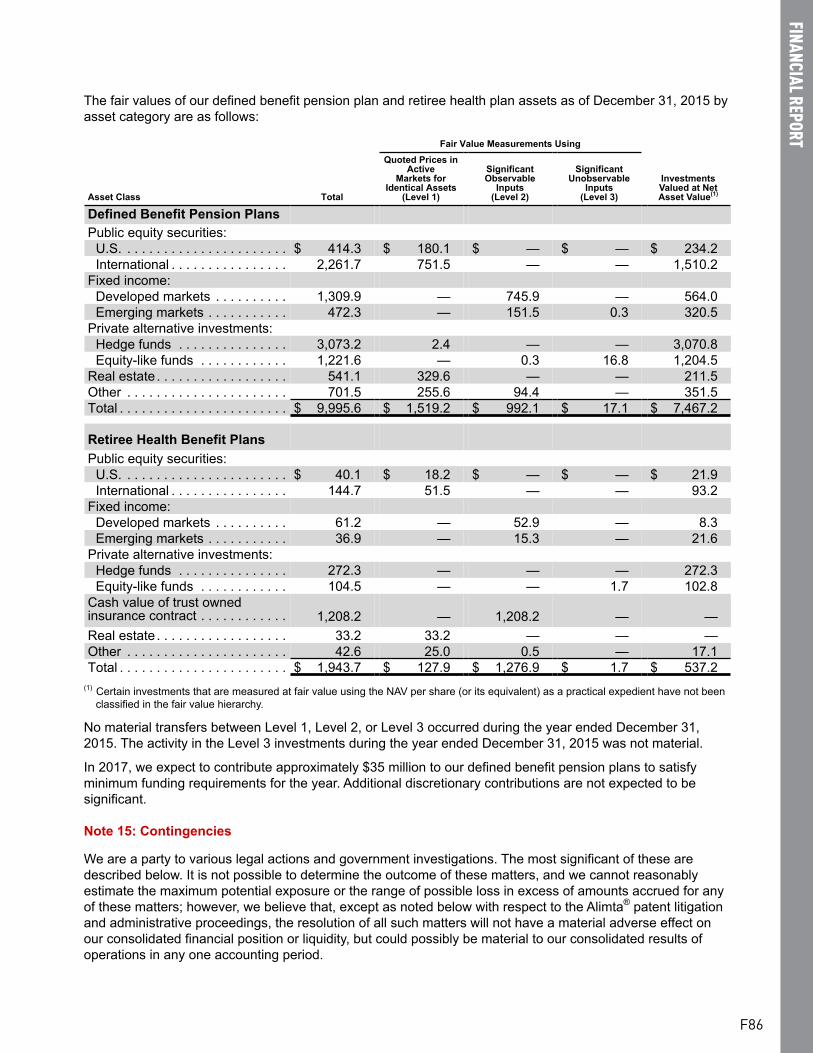
FINANCIAL REPORT
F8686
The fair values of our defined benefit pension plan and retiree health plan assets as of December 31, 2015 by asset category are as follows:
Fair Value Measurements Using
Asset Class Total
Quoted Prices inActive
Markets forIdentical Assets
(Level 1)
SignificantObservable
Inputs(Level 2)
SignificantUnobservable
Inputs(Level 3)
Investments Valued at Net Asset Value(1)
Defined Benefit Pension PlansPublic equity securities:
U.S. . . . . . . . . . . . . . . . . . . . . . . $ 414.3 $ 180.1 $ — $ — $ 234.2International . . . . . . . . . . . . . . . . 2,261.7 751.5 — — 1,510.2
Fixed income:Developed markets . . . . . . . . . . 1,309.9 — 745.9 — 564.0Emerging markets . . . . . . . . . . . 472.3 — 151.5 0.3 320.5
Private alternative investments:Hedge funds . . . . . . . . . . . . . . . 3,073.2 2.4 — — 3,070.8Equity-like funds . . . . . . . . . . . . 1,221.6 — 0.3 16.8 1,204.5
Real estate . . . . . . . . . . . . . . . . . . 541.1 329.6 — — 211.5Other . . . . . . . . . . . . . . . . . . . . . . 701.5 255.6 94.4 — 351.5Total . . . . . . . . . . . . . . . . . . . . . . . $ 9,995.6 $ 1,519.2 $ 992.1 $ 17.1 $ 7,467.2
Retiree Health Benefit PlansPublic equity securities:
U.S. . . . . . . . . . . . . . . . . . . . . . . $ 40.1 $ 18.2 $ — $ — $ 21.9International . . . . . . . . . . . . . . . . 144.7 51.5 — — 93.2
Fixed income:Developed markets . . . . . . . . . . 61.2 — 52.9 — 8.3Emerging markets . . . . . . . . . . . 36.9 — 15.3 — 21.6
Private alternative investments:Hedge funds . . . . . . . . . . . . . . . 272.3 — — — 272.3Equity-like funds . . . . . . . . . . . . 104.5 — — 1.7 102.8
Cash value of trust ownedinsurance contract . . . . . . . . . . . . 1,208.2 — 1,208.2 — —Real estate . . . . . . . . . . . . . . . . . . 33.2 33.2 — — —Other . . . . . . . . . . . . . . . . . . . . . . 42.6 25.0 0.5 — 17.1Total . . . . . . . . . . . . . . . . . . . . . . . $ 1,943.7 $ 127.9 $ 1,276.9 $ 1.7 $ 537.2
(1) Certain investments that are measured at fair value using the NAV per share (or its equivalent) as a practical expedient have not been classified in the fair value hierarchy.
No material transfers between Level 1, Level 2, or Level 3 occurred during the year ended December 31, 2015. The activity in the Level 3 investments during the year ended December 31, 2015 was not material.
In 2017, we expect to contribute approximately $35 million to our defined benefit pension plans to satisfy minimum funding requirements for the year. Additional discretionary contributions are not expected to be significant.
Note 15: Contingencies
We are a party to various legal actions and government investigations. The most significant of these are described below. It is not possible to determine the outcome of these matters, and we cannot reasonably estimate the maximum potential exposure or the range of possible loss in excess of amounts accrued for any of these matters; however, we believe that, except as noted below with respect to the Alimta® patent litigation and administrative proceedings, the resolution of all such matters will not have a material adverse effect on our consolidated financial position or liquidity, but could possibly be material to our consolidated results of operations in any one accounting period.

FINAN
CIAL
REPO
RT
F8787
Litigation accruals, environmental liabilities, and the related estimated insurance recoverables are reflected on a gross basis as liabilities and assets, respectively, on our consolidated balance sheets. With respect to the product liability claims currently asserted against us, we have accrued for our estimated exposures to the extent they are both probable and reasonably estimable based on the information available to us. We accrue for certain product liability claims incurred but not filed to the extent we can formulate a reasonable estimate of their costs. We estimate these expenses based primarily on historical claims experience and data regarding product usage. Legal defense costs expected to be incurred in connection with significant product liability loss contingencies are accrued when both probable and reasonably estimable.
Alimta Patent Litigation and Administrative Proceedings
A number of generic manufacturers are seeking approvals in various countries to market generic forms of Alimta prior to the expiration of our vitamin regimen patents, alleging that those patents are invalid, not infringed, or both. We believe our Alimta vitamin regimen patents are valid and enforceable against these generic manufacturers. However, it is not possible to determine the ultimate outcome of the proceedings, and accordingly, we can provide no assurance that we will prevail. An unfavorable outcome could have a material adverse impact on our future consolidated results of operations, liquidity, and financial position. We expect that a loss of exclusivity for Alimta would result in a rapid and severe decline in future revenues for the product in the relevant market.
U.S. Patent Litigation and Administrative Proceedings
We are engaged in various U.S. patent litigation matters involving Alimta brought pursuant to procedures set out in the Drug Price Competition and Patent Term Restoration Act of 1984 (the Hatch-Waxman Act). More than ten Abbreviated New Drug Applications (ANDAs) seeking approval to market generic versions of Alimta prior to the expiration of our vitamin regimen patent (expiring in 2021 plus pediatric exclusivity expiring in 2022) have been filed by a number of companies, including Teva Parenteral Medicines, Inc. (Teva) and APP Pharmaceuticals, LLC (APP). These companies have also alleged the patent is invalid.
In October 2010, we filed a lawsuit in the U.S. District Court for the Southern District of Indiana against Teva, APP and two other defendants seeking rulings that the U.S. vitamin regimen patent is valid and infringed (the Teva/APP litigation). A trial occurred in August 2013; the sole issue before the district court at that time was to determine patent validity. In March 2014, the court ruled that the asserted claims of the vitamin regimen patent are valid. The U.S. District Court for the Southern District of Indiana held a hearing on the issue of infringement in May 2015. In September 2015, the district court ruled that the vitamin regimen patent would be infringed by the generic challengers' proposed products. Teva and APP appealed all of the district court’s substantive decisions. In January 2017, the U.S. Court of Appeals for the Federal Circuit affirmed the district court’s decisions concerning validity and infringement.
From 2012 through 2016, we filed similar lawsuits against other ANDA defendants seeking a ruling that our patents are valid and infringed. Some of these cases have been stayed pending the outcome of the Teva/APP litigation, and several parties have agreed to be bound by the outcome of the Teva/APP litigation; the remaining cases have been administratively closed.
In 2016 we filed lawsuits alleging infringement against Dr. Reddy's Laboratories and Hospira in response to their alternative salt forms of pemetrexed product.
In June 2016, the United States Patent and Trademark Office (USPTO) granted petitions by Neptune Generics, LLC and Sandoz Inc. seeking inter partes review (IPR) of our vitamin regimen patent. Several additional generic companies have filed petitions and joined these proceedings. The final written IPR decisions are expected in mid-2017.
European Patent Litigation and Administrative Proceedings
Generic manufacturers filed an opposition to the European Patent Office's (EPO) decision to grant us a vitamin regimen patent. The Opposition Division of the EPO upheld the patent and the generic manufacturers lodged an appeal. In October 2015 the generic manufacturers withdrew the appeal. As a result, the original EPO decision upholding the patent is now final.

FINANCIAL REPORT
F8888
In addition, in the United Kingdom (U.K.), Actavis Group ehf and other Actavis companies (collectively, Actavis) filed litigation asking for a declaratory judgment that commercialization of certain salt forms of pemetrexed (the active ingredient in Alimta) diluted in saline solution would not infringe the vitamin regimen patents for Alimta in the U.K., Italy, France, and Spain. In May 2014, the trial court ruled that the vitamin regimen patents for Alimta would not be infringed by commercialization of alternative salt forms of pemetrexed, after expiration of the compound patents in December 2015. We appealed, and in June 2015, the U.K. Court of Appeal reversed the trial court's decision granting declarations of non-infringement over the Alimta vitamin regimen patents in those countries, ruling that the Alimta vitamin regimen patent would be infringed by commercialization of Actavis' products as proposed to be diluted in saline solution prior to the patent's expiration in June 2021. In February 2016, the U.K. Supreme Court granted our and Actavis' requests for permission to appeal different aspects of the judgment. A hearing is scheduled for April 2017.
In parallel proceedings, Actavis returned to the lower court seeking a declaration of non-infringement for a different proposed product diluted in dextrose solution. In February 2016, the trial court ruled that Actavis’ commercialization of this product would not infringe the patent in the U.K., Italy, France, and Spain. We have sought to appeal this ruling.
We commenced separate infringement proceedings against certain Actavis companies in Germany. Following a trial, in April 2014, the German trial court ruled in our favor. The defendants appealed, and after a hearing in March 2015, the German Court of Appeal overturned the trial court and ruled that our vitamin regimen patent in Germany would not be infringed by a dipotassium salt form of pemetrexed. In June 2016, the German Federal Supreme Court granted our appeal, vacating the prior decision denying infringement, and returned the case to the Court of Appeal to reconsider infringement based on its judgment.
In separate proceedings, in May 2016 and June 2016, the German courts confirmed preliminary injunctions against Hexal AG (Hexal), which had stated its intention to launch a generic disodium salt product diluted in saline solution in Germany, and ratiopharm GmbH, a subsidiary of Teva, which had stated its intention to launch a proposed alternative salt form of pemetrexed product diluted in dextrose solution. Hexal has separately filed a challenge to the validity of our vitamin regimen patent before the German Federal Patent court.
In late 2016, the German courts issued preliminary injunctions against two other companies that had stated their intentions to launch a proposed alternative salt form of pemetrexed product diluted in dextrose solution.
We do not anticipate any generic entry into the German market at least until the Court of Appeal proceedings against Actavis considers the issues remanded by the German Federal Supreme Court or the injunctions are lifted.
Additional legal proceedings are ongoing in various national courts of other European countries. We are aware that at least two generic pemetrexed products have launched in a major European market.
Japanese Administrative Proceedings
Three separate demands for invalidation of our two vitamin regimen patents, involving several companies, have been filed with the Japanese Patent Office (JPO). In November 2015, the JPO issued written decisions in the invalidation trial initiated by Sawai Pharmaceutical Co., Ltd. (Sawai), which had been joined by three other companies, upholding both vitamin regimen patents. In February 2017, the Japan Intellectual Property High Court confirmed the decisions of the JPO and ruled in our favor in the invalidation trials initiated by Sawai. If generic challengers do not petition or if their petitions are not accepted to the Japan Supreme Court, the Japan Intellectual Property High Court’s decisions are final. These patents provide intellectual property protection for Alimta until June 2021. The remaining invalidation trials initiated by the other parties are currently suspended and are likely to remain so until the High Court decision becomes final.
Notwithstanding our patents, generic versions of Alimta were approved in Japan in 2016. To date, each manufacturer of the generic version of Alimta has agreed not to proceed to pricing approval.

FINAN
CIAL
REPO
RT
F8989
Effient Patent Litigation and Administrative Proceedings
We, along with Daiichi Sankyo, Daiichi Sankyo, Inc., and Ube Industries (Ube) are engaged in U.S. patent litigation involving Effient brought pursuant to procedures set out in the Hatch-Waxman Act. More than 10 different companies have submitted ANDAs seeking approval to market generic versions of Effient prior to the expiration of Daiichi Sankyo’s and Ube’s patents (expiring in 2023) covering methods of using Effient with aspirin, and alleging the patents are invalid. One of these ANDAs also alleged that the compound patent for Effient (expiring in April 2017) was invalid. We have entered into a settlement relating to the compound patent litigation and anticipate that a generic version could launch as early as mid-August 2017.
Beginning in March 2014, we filed lawsuits in the U.S. District Court for the Southern District of Indiana against these companies, seeking a ruling that the patents are valid and infringed. These cases have been consolidated.
In 2015, several generic pharmaceutical companies filed petitions with the USPTO, requesting IPR of the method patents. In September 2016, the USPTO determined that the method-of-use patents are invalid. Daiichi Sankyo and Ube have appealed these decisions to the U.S. Court of Appeals for the Federal Circuit. We expect a final decision in late 2017. The consolidated lawsuit is currently stayed with respect to all parties pending the outcome of this appeal.
We believe the Effient patents are valid and enforceable against these generic manufacturers. However, it is not possible to determine the outcome of the proceedings, and accordingly, we can provide no assurance that we will prevail. We expect a loss of exclusivity for Effient would result in a rapid and severe decline in future revenues for the product in the relevant market.
Actos® Product Liability Litigation
We have been named along with Takeda Chemical Industries, Ltd., and Takeda affiliates (collectively, Takeda) as a defendant in approximately 6,500 product liability cases in the U.S. related to the diabetes medication Actos, which we co-promoted with Takeda in the U.S. from 1999 until 2006. In general, plaintiffs in these actions allege that Actos caused or contributed to their bladder cancer. Almost all of the active cases have been consolidated in federal multidistrict litigation in the Western District of Louisiana or are pending in a coordinated state court proceeding in California or a coordinated state court proceeding in Illinois.
In April 2015, Takeda announced they will pay approximately $2.4 billion to resolve the vast majority of the U.S. product liability lawsuits involving Actos. Although the vast majority of U.S. product liability lawsuits involving Actos are included in the resolution program, there may be additional cases pending against Takeda and us following completion of the resolution program. Our agreement with Takeda calls for Takeda to defend and indemnify us against our losses and expenses with respect to the U.S. litigation arising out of the manufacture, use, or sale of Actos and other related expenses in accordance with the terms of the agreement. We believe we are entitled to full indemnification of our losses and expenses in the U.S. cases; however, there can be no guarantee we will ultimately be successful in obtaining full indemnification.
We are also named along with Takeda as a defendant in four purported product liability class actions in Canada related to Actos, including two in Ontario (Casseres et al. v. Takeda Pharmaceutical North America, Inc., et al. and Carrier et al. v. Eli Lilly et al.), one in Quebec (Whyte et al. v. Eli Lilly et al.), and one in Alberta (Epp v. Takeda Canada et al.). We promoted Actos in Canada until 2009.
We believe these lawsuits are without merit, and we and Takeda are prepared to defend against them vigorously.

FINANCIAL REPORT
F9090
Cymbalta® Product Liability Litigation
In October 2012, we were named as a defendant in a purported class-action lawsuit in the U.S. District Court for the Central District of California ( Saavedra et al v. Eli Lilly and Company ) involving Cymbalta. The plaintiffs, purporting to represent a class of all persons within the U.S. who purchased and/or paid for Cymbalta, asserted claims under the consumer protection statutes of four states, California, Massachusetts, Missouri, and New York, and sought declaratory, injunctive, and monetary relief for various alleged economic injuries arising from discontinuing treatment with Cymbalta. In December 2014, the district court denied the plaintiffs' motion for class certification. Plaintiffs filed a petition with the U.S. Court of Appeals for the Ninth Circuit requesting permission to file an interlocutory appeal of the denial of class certification, which was denied. Plaintiffs filed a second motion for certification under the consumer protection acts of New York and Massachusetts. The district court denied that motion for class certification in July 2015. The district court dismissed the suit and plaintiffs are appealing to the U.S. Court of Appeals for the Ninth Circuit. Oral argument is expected in late 2017.
We are named in approximately 140 lawsuits involving approximately 1,470 plaintiffs filed in various federal and state courts alleging injuries arising from discontinuation of treatment with Cymbalta. These include approximately 40 individual and multi-plaintiff cases filed in California state court, centralized in a California Judicial Counsel Coordination Proceeding pending in Los Angeles. The first individual product liability cases were tried in August 2015 and resulted in defense verdicts against four plaintiffs.
We have reached a settlement framework which provides for a comprehensive resolution of nearly all of these personal injury claims, filed or unfiled, alleging injuries from discontinuing treatment with Cymbalta. There can be no assurances, however, that a final settlement will be reached.
We believe all these Cymbalta lawsuits and claims are without merit and are prepared to defend against them vigorously.
Brazil–Employee Litigation
Our subsidiary in Brazil, Eli Lilly do Brasil Limitada (Lilly Brasil), is named in a lawsuit brought by the Labor Attorney for 15th Region in the Labor Court of Paulinia, State of Sao Paulo, Brazil, alleging possible harm to employees and former employees caused by exposure to heavy metals at a former Lilly manufacturing facility in Cosmopolis, Brazil, operated by the company between 1977 and 2003. The plaintiffs allege that some employees at the facility were exposed to benzene and heavy metals; however, Lilly Brasil maintains that these alleged contaminants were never used in the facility. In May 2014, the labor court judge ruled against Lilly Brasil. The judge's ruling orders Lilly Brasil to undertake several actions of unspecified financial impact, including paying lifetime medical insurance for the employees and contractors who worked at the Cosmopolis facility more than six months during the affected years and their children born during and after this period. While we cannot currently estimate the range of reasonably possible financial losses that could arise in the event we do not ultimately prevail in the litigation, the judge has estimated the total financial impact of the ruling to be approximately 1.0 billion Brazilian real (approximately $305 million as of December 31, 2016) plus interest. We strongly disagree with the decision and filed an appeal in May 2014.
We are also named in approximately 30 lawsuits filed in the same court by individual former employees making similar claims.
We believe these lawsuits are without merit and are prepared to defend against them vigorously.
Product Liability Insurance
Because of the nature of pharmaceutical products, it is possible that we could become subject to large numbers of product liability and related claims in the future. Due to a very restrictive market for product liability insurance, we are self-insured for product liability losses for all our currently marketed products.

FINAN
CIAL
REPO
RT
F9191
Note 16: Other Comprehensive Income (Loss)
The following table summarizes the activity related to each component of other comprehensive income (loss):
(Amounts presented net of taxes)
ForeignCurrency
TranslationGains (Losses)
Unrealized NetGains (Losses)on Securities
Defined BenefitPension and
Retiree HealthBenefit Plans
EffectivePortion ofCash Flow
Hedges
AccumulatedOther
ComprehensiveLoss
Beginning balance at January 1, 2014 $ 463.0 $ 205.2 $ (2,489.1) $ (181.8) $ (2,002.7)
Other comprehensive income (loss)before reclassifications . . . . . . . . . . . (961.4) 105.2 (1,098.5) (15.2) (1,969.9)Net amount reclassified fromaccumulated other comprehensiveloss . . . . . . . . . . . . . . . . . . . . . . . . . . — (210.7) 185.6 5.9 (19.2)Net other comprehensive income(loss) . . . . . . . . . . . . . . . . . . . . . . . . . (961.4) (105.5) (912.9) (9.3) (1,989.1)
Balance at December 31, 2014. . . . . . (498.4) 99.7 (3,402.0) (191.1) (3,991.8)
Other comprehensive income (loss)before reclassifications . . . . . . . . . . . (861.8) 38.6 155.0 (36.9) (705.1)Net amount reclassified fromaccumulated other comprehensiveloss . . . . . . . . . . . . . . . . . . . . . . . . . . — (128.2) 234.9 9.5 116.2Net other comprehensive income(loss) . . . . . . . . . . . . . . . . . . . . . . . . . (861.8) (89.6) 389.9 (27.4) (588.9)
Balance at December 31, 2015. . . . . . (1,360.2) 10.1 (3,012.1) (218.5) (4,580.7)
Other comprehensive income (loss)before reclassifications . . . . . . . . . . . (581.6) 206.7 (518.7) (2.2) (895.8)Net amount reclassified fromaccumulated other comprehensiveloss . . . . . . . . . . . . . . . . . . . . . . . . . . 74.5 7.2 159.2 9.8 250.7Net other comprehensive income(loss) . . . . . . . . . . . . . . . . . . . . . . . . . (507.1) 213.9 (359.5) 7.6 (645.1)
Ending balance at December 31, 2016(1) . . . . . . . . . . . . . . . . . . . . . . . . . $ (1,867.3) $ 224.0 $ (3,371.6) $ (210.9) $ (5,225.8)
(1) Accumulated other comprehensive loss as of December 31, 2016 consists of $5,274.0 million of accumulated other comprehensive loss attributable to controlling interest and $48.2 million of accumulated other comprehensive income attributable to non-controlling interest.
The tax effects on the net activity related to each component of other comprehensive income (loss) for the years ended December 31, were as follows:
Tax (expense) benefit 2016 2015 2014
Foreign currency translation gains (losses) . . . . . . . . . . . . . . . . . . . $ (70.6) $ (2.0) $ —Unrealized net gains (losses) on securities . . . . . . . . . . . . . . . . . . . (89.2) 48.5 56.7Defined benefit pension and retiree health benefit plans . . . . . . . . . 153.3 (183.0) 414.7Effective portion of cash flow hedges . . . . . . . . . . . . . . . . . . . . . . . . (4.1) 14.6 5.2Provision for income taxes related to other comprehensive income(loss) items . . . . . . . . . . . . . . . . . . . . . . . . . . . . . . . . . . . . . . . . . . . . $ (10.6) $ (121.9) $ 476.6

FINANCIAL REPORT
F9292
Except for the tax effects of foreign currency translation gains and losses related to our foreign currency-denominated notes, cross-currency interest rate swaps, and other foreign currency exchange contracts designated as net investment hedges (see Note 7), income taxes were not provided for foreign currency translation. Generally, the assets and liabilities of foreign operations are translated into U.S. dollars using the current exchange rate. For those operations, changes in exchange rates generally do not affect cash flows; therefore, resulting translation adjustments are made in shareholders' equity rather than in the consolidated statements of operations.
Reclassifications out of accumulated other comprehensive loss were as follows:
Details about Accumulated Other Comprehensive Loss Components
Year Ended December 31, Affected Line Item in the ConsolidatedStatements of Operations2016 2015 2014
Amortization of retirementbenefit items:
Prior service benefits, net $ (74.0) $ (80.7) $ (34.0) (1)
Actuarial losses 304.7 421.2 303.0 (1)
Total before tax 230.7 340.5 269.0Tax benefit (71.5) (105.6) (83.4) Income taxes
Net of tax 159.2 234.9 185.6
Unrealized gains/losses onavailable-for-sale securities:
Realized gains, net (16.1) (209.3) (324.1) Other—net, (income) expenseImpairment losses 27.3 12.0 — Other—net, (income) expense
Total before tax 11.2 (197.3) (324.1)Tax expense (4.0) 69.1 113.4 Income taxes
Net of tax 7.2 (128.2) (210.7)
Other, net of tax (2) 84.3 9.5 5.9 Other—net, (income) expenseTotal reclassifications for theperiod, net of tax $ 250.7 $ 116.2 $ (19.2)
(1) These accumulated other comprehensive loss components are included in the computation of net periodic pension cost (see Note 14).(2) Amount for year ended December 31, 2016 included primarily $74.5 million of foreign currency translation losses.
Note 17: Other–Net, (Income) Expense
Other–net, (income) expense consisted of the following:
2016 2015 2014Interest expense . . . . . . . . . . . . . . . . . . . . . . . . . . . . . . . . . . . . . . . $ 185.2 $ 161.2 $ 148.8Interest income . . . . . . . . . . . . . . . . . . . . . . . . . . . . . . . . . . . . . . . . (108.7) (87.0) (121.0)Venezuela charge . . . . . . . . . . . . . . . . . . . . . . . . . . . . . . . . . . . . . . 203.9 — —Debt extinguishment loss (Note 10) . . . . . . . . . . . . . . . . . . . . . . . . — 166.7 —Other income . . . . . . . . . . . . . . . . . . . . . . . . . . . . . . . . . . . . . . . . . (195.6) (341.5) (368.3)Other–net, (income) expense . . . . . . . . . . . . . . . . . . . . . . . . . . . . . $ 84.8 $ (100.6) $ (340.5)
In 2016, due to the financial crisis in Venezuela and the significant deterioration of the bolívar, we changed the exchange rate used to translate the assets and liabilities of our subsidiaries in Venezuela which resulted in a charge of $203.9 million. Prior to this change, we used the Supplementary Foreign Currency Administration System (SICAD) rate; however, this official rate was discontinued in 2016. After considering several factors, including the future uncertainty of the Venezuelan economy, published exchange rates, and the limited amount of foreign currency exchanged, we changed to the Divisa Complementaria (DICOM) rate.
For the years ended December 31, 2016, 2015, and 2014, other income is primarily related to net gains on investments (Note 7). Other income in 2014 also related to the transfer to Boehringer Ingelheim of our license rights to co-promote linagliptin and empagliflozin in certain countries (Note 4).

FINAN
CIAL
REPO
RT
F9393
Note 18: Segment Information
We have two operating segments—human pharmaceutical products and animal health products. Our operating segments are distinguished by the ultimate end user of the product—humans or animals. Performance is evaluated based on profit or loss from operations before income taxes. The accounting policies of the individual segments are the same as those described throughout the notes to the consolidated financial statements.
Our human pharmaceutical products segment includes the discovery, development, manufacturing, marketing, and sales of human pharmaceutical products worldwide in the following therapeutic areas: endocrinology, neuroscience, oncology, cardiovascular, and other. We lost our data package protection for Cymbalta in major European countries in 2014 and lost patent exclusivity in the U.S. for Evista® in March 2014, both of which resulted in the immediate entry of generic competitors and a rapid and severe decline in revenue. We also lost patent exclusivity for the schizophrenia and bipolar mania indications in December 2015 and April 2016, respectively, for Zyprexa® in Japan. Generic versions of Zyprexa were launched in Japan in June 2016. The loss of exclusivity for Zyprexa in Japan has caused a rapid and severe decline in revenue for the product. We will lose our patent protection for Strattera® in the U.S. in May 2017 and Cialis® in the U.S. and major European markets in November 2017. We will also lose exclusivity for Effient in the U.S. in October 2017, and we have authorized one generic manufacturer to enter the market as early as mid-August 2017.
Our animal health segment, operating through our Elanco animal health division, includes the development, manufacturing, marketing, and sales of animal health products worldwide for both food and companion animals. Animal health products include Rumensin®, Posilac®, Maxiban®, Tylan®, Denagard®, Optaflexx®, and other products for livestock and poultry, as well as Trifexis®, Comfortis®, and other products for companion animals. The animal health segment amounts for the years ended December 31, 2016 and 2015 include the results of operations from Novartis AH, which was acquired on January 1, 2015 (Note 3).
Most of our pharmaceutical products are distributed through wholesalers that serve pharmacies, physicians and other health care professionals, and hospitals. For the years ended December 31, 2016, 2015, and 2014, our three largest wholesalers each accounted for between 8 percent and 17 percent of consolidated total revenue. Further, they each accounted for between 12 percent and 21 percent of accounts receivable as of December 31, 2016 and 2015. Animal health products are sold primarily to wholesale distributors.
We manage our assets on a total company basis, not by operating segment, as the assets of the animal health business are intermixed with those of the pharmaceutical products business. Therefore, our chief operating decision maker does not review any asset information by operating segment and, accordingly, we do not report asset information by operating segment.
We are exposed to the risk of changes in social, political, and economic conditions inherent in foreign operations, and our results of operations and the value of our foreign assets are affected by fluctuations in foreign currency exchange rates.

FINANCIAL REPORT
F9494
The following table summarizes our revenue activity:
2016 2015 2014
Segment revenue—to unaffiliated customers:Human pharmaceutical products:
Endocrinology:Humalog® . . . . . . . . . . . . . . . . . . . . . . . . . . . . . . . . . . . . . . $ 2,768.8 $ 2,841.9 $ 2,785.2Forteo® . . . . . . . . . . . . . . . . . . . . . . . . . . . . . . . . . . . . . . . . 1,500.0 1,348.3 1,322.0Humulin® . . . . . . . . . . . . . . . . . . . . . . . . . . . . . . . . . . . . . . 1,365.9 1,307.4 1,400.1Trulicity® . . . . . . . . . . . . . . . . . . . . . . . . . . . . . . . . . . . . . . . 925.5 248.7 10.2Trajenta . . . . . . . . . . . . . . . . . . . . . . . . . . . . . . . . . . . . . . . 436.6 356.8 328.8Evista . . . . . . . . . . . . . . . . . . . . . . . . . . . . . . . . . . . . . . . . . 172.4 237.3 419.8Other Endocrinology . . . . . . . . . . . . . . . . . . . . . . . . . . . . . 913.6 696.4 672.9
Total Endocrinology . . . . . . . . . . . . . . . . . . . . . . . . . . . . . . . 8,082.8 7,036.8 6,939.0
Oncology:Alimta . . . . . . . . . . . . . . . . . . . . . . . . . . . . . . . . . . . . . . . . . 2,283.3 2,493.1 2,792.0Erbitux . . . . . . . . . . . . . . . . . . . . . . . . . . . . . . . . . . . . . . . . 687.0 485.0 373.3Cyramza® . . . . . . . . . . . . . . . . . . . . . . . . . . . . . . . . . . . . . . 614.1 383.8 75.6Other Oncology . . . . . . . . . . . . . . . . . . . . . . . . . . . . . . . . . 137.4 147.9 152.1
Total Oncology . . . . . . . . . . . . . . . . . . . . . . . . . . . . . . . . . . . 3,721.8 3,509.8 3,393.0
Cardiovascular:Cialis . . . . . . . . . . . . . . . . . . . . . . . . . . . . . . . . . . . . . . . . . 2,471.6 2,310.7 2,291.0Effient . . . . . . . . . . . . . . . . . . . . . . . . . . . . . . . . . . . . . . . . 535.2 523.0 522.2Other Cardiovascular . . . . . . . . . . . . . . . . . . . . . . . . . . . . . 218.6 234.3 240.3
Total Cardiovascular . . . . . . . . . . . . . . . . . . . . . . . . . . . . . . 3,225.4 3,068.0 3,053.5
Neuroscience:Cymbalta(1) . . . . . . . . . . . . . . . . . . . . . . . . . . . . . . . . . . . . . 930.5 1,027.6 1,614.7Strattera . . . . . . . . . . . . . . . . . . . . . . . . . . . . . . . . . . . . . . . 854.7 784.0 738.5Zyprexa . . . . . . . . . . . . . . . . . . . . . . . . . . . . . . . . . . . . . . . 725.3 940.3 1,037.3Other Neuroscience . . . . . . . . . . . . . . . . . . . . . . . . . . . . . . 209.8 183.5 206.0
Total Neuroscience . . . . . . . . . . . . . . . . . . . . . . . . . . . . . . . 2,720.3 2,935.4 3,596.5
Other human pharmaceutical products . . . . . . . . . . . . . . . . 313.6 227.7 287.0Total human pharmaceutical products . . . . . . . . . . . . . . . . . . . . . 18,063.9 16,777.7 17,269.0Animal health products . . . . . . . . . . . . . . . . . . . . . . . . . . . . . . . . . 3,158.2 3,181.0 2,346.6
Revenue . . . . . . . . . . . . . . . . . . . . . . . . . . . . . . . . . . . . . . . . . . . . . . $ 21,222.1 $ 19,958.7 $ 19,615.6

FINAN
CIAL
REPO
RT
F9595
2016 2015 2014
Segment profits:Human pharmaceutical products . . . . . . . . . . . . . . . . . . . . . . . . . $ 4,010.0 $ 4,026.7 $ 3,604.6Animal health products . . . . . . . . . . . . . . . . . . . . . . . . . . . . . . . . . 663.7 597.9 621.8
Total segment profits. . . . . . . . . . . . . . . . . . . . . . . . . . . . . . . . . . . . . $ 4,673.7 $ 4,624.6 $ 4,226.4
Reconciliation of total segment profits to consolidated incomebefore taxes:
Segment profits . . . . . . . . . . . . . . . . . . . . . . . . . . . . . . . . . . . . . . $ 4,673.7 $ 4,624.6 $ 4,226.4Other profits (losses): . . . . . . . . . . . . . . . . . . . . . . . . . . . . . . . . . .
Amortization of intangible assets (Note 8) . . . . . . . . . . . . . . . . (683.3) (626.2) (530.2)Asset impairment, restructuring, and other special charges(Note 5) . . . . . . . . . . . . . . . . . . . . . . . . . . . . . . . . . . . . . . . . . . (382.5) (367.7) (468.7)Venezuela charge (Note 17). . . . . . . . . . . . . . . . . . . . . . . . . . . (203.9) — —Acquired in-process research and development (Notes 3 and4) . . . . . . . . . . . . . . . . . . . . . . . . . . . . . . . . . . . . . . . . . . . . . . . (30.0) (535.0) (200.2)Inventory fair value adjustment related to Novartis AH (Note3) . . . . . . . . . . . . . . . . . . . . . . . . . . . . . . . . . . . . . . . . . . . . . . . — (153.0) —Debt repurchase charges, net(2) (Note 10) . . . . . . . . . . . . . . . . — (152.7) —U.S. Branded Prescription Drug Fee . . . . . . . . . . . . . . . . . . . . — — (119.0)Income related to transfer of linagliptin and empagliflozinrights in certain countries to Boehringer Ingelheim (Note 4) . . — — 92.0
Consolidated income before taxes . . . . . . . . . . . . . . . . . . . . . . . . . . $ 3,374.0 $ 2,790.0 $ 3,000.3
Numbers may not add due to rounding.(1) Cymbalta revenues benefited from reductions to the reserve for expected product returns of approximately $175 million during the
year ended December 31, 2016.(2) We recognized pretax net charges of $152.7 million for the year ended December 31, 2015, attributable to the debt extinguishment
loss of $166.7 million from the purchase and redemption of certain fixed-rate notes, partially offset by net gains from non-hedging interest rate swaps and foreign currency transactions associated with the related issuance of euro-denominated notes.
Depreciation and software amortization expense included in our segment profits was as follows:
2016 2015 2014
Human pharmaceutical products . . . . . . . . . . . . . . . . . . . . . . . . . . . . $ 723.4 $ 720.7 $ 790.0Animal health products . . . . . . . . . . . . . . . . . . . . . . . . . . . . . . . . . . . . 89.9 80.8 58.8Total depreciation expense and software amortization included insegment profits . . . . . . . . . . . . . . . . . . . . . . . . . . . . . . . . . . . . . . . . . . $ 813.3 $ 801.5 $ 848.8

FINANCIAL REPORT
F9696
For internal management reporting presented to the chief operating decision maker, certain costs are fully allocated to our human pharmaceutical products segment and therefore are not reflected in the animal health segment's profit. Such items include costs associated with treasury-related financing, global administrative services, certain acquisition-related transaction costs, and certain manufacturing costs.
2016 2015 2014
Geographic InformationRevenue—to unaffiliated customers(1):
United States . . . . . . . . . . . . . . . . . . . . . . . . . . . . . . . . . . . . . . . . . $ 11,506.2 $ 10,097.4 $ 9,134.1Europe . . . . . . . . . . . . . . . . . . . . . . . . . . . . . . . . . . . . . . . . . . . . . . 3,768.1 3,943.6 4,506.7Japan . . . . . . . . . . . . . . . . . . . . . . . . . . . . . . . . . . . . . . . . . . . . . . . 2,330.9 2,033.1 2,027.1Other foreign countries . . . . . . . . . . . . . . . . . . . . . . . . . . . . . . . . . . 3,616.9 3,884.6 3,947.7
Revenue . . . . . . . . . . . . . . . . . . . . . . . . . . . . . . . . . . . . . . . . . . . . . . $ 21,222.1 $ 19,958.7 $ 19,615.6
Long-lived assets(2):United States . . . . . . . . . . . . . . . . . . . . . . . . . . . . . . . . . . . . . . . . . $ 4,984.6 $ 4,576.8 $ 4,566.2Europe . . . . . . . . . . . . . . . . . . . . . . . . . . . . . . . . . . . . . . . . . . . . . . 2,140.7 2,306.4 2,401.5Japan . . . . . . . . . . . . . . . . . . . . . . . . . . . . . . . . . . . . . . . . . . . . . . . 92.4 89.2 80.4Other foreign countries . . . . . . . . . . . . . . . . . . . . . . . . . . . . . . . . . . 1,776.8 1,724.2 1,499.1
Long-lived assets . . . . . . . . . . . . . . . . . . . . . . . . . . . . . . . . . . . . . . . $ 8,994.5 $ 8,696.6 $ 8,547.2(1) Revenue is attributed to the countries based on the location of the customer.(2) Long-lived assets consist of property and equipment, net, and certain sundry assets.

FINAN
CIAL
REPO
RT
F9797
Note 19: Selected Quarterly Data (unaudited)
2016 Fourth Third Second First
Revenue . . . . . . . . . . . . . . . . . . . . . . . . . . . . . . . . . . . . . . . . $ 5,760.5 $ 5,191.7 $ 5,404.8 $ 4,865.1Cost of sales . . . . . . . . . . . . . . . . . . . . . . . . . . . . . . . . . . . . . 1,466.0 1,400.9 1,465.0 1,323.0Operating expenses(1) . . . . . . . . . . . . . . . . . . . . . . . . . . . . . . 3,240.7 2,801.8 2,958.5 2,694.9Acquired in-process research and development . . . . . . . . . . 30.0 — — —Asset impairment, restructuring, and other special charges . 147.6 45.5 58.0 131.4Other—net, (income) expense . . . . . . . . . . . . . . . . . . . . . . . (15.8) (27.2) (21.2) 149.0Income before income taxes . . . . . . . . . . . . . . . . . . . . . . . . . 892.0 970.7 944.5 566.8Net income . . . . . . . . . . . . . . . . . . . . . . . . . . . . . . . . . . . . . . 771.8 778.0 747.7 440.1Earnings per share—basic . . . . . . . . . . . . . . . . . . . . . . . . . . 0.73 0.74 0.71 0.42Earnings per share—diluted . . . . . . . . . . . . . . . . . . . . . . . . . 0.73 0.73 0.71 0.41Dividends paid per share . . . . . . . . . . . . . . . . . . . . . . . . . . . 0.51 0.51 0.51 0.51Common stock closing prices:
High . . . . . . . . . . . . . . . . . . . . . . . . . . . . . . . . . . . . . . . . . . 83.06 83.40 78.75 84.11Low . . . . . . . . . . . . . . . . . . . . . . . . . . . . . . . . . . . . . . . . . . . 65.97 76.85 72.57 69.06
2015 Fourth Third Second First
Revenue . . . . . . . . . . . . . . . . . . . . . . . . . . . . . . . . . . . . . . . . $ 5,375.6 $ 4,959.7 $ 4,978.7 $ 4,644.7Cost of sales . . . . . . . . . . . . . . . . . . . . . . . . . . . . . . . . . . . . . 1,389.2 1,236.9 1,218.4 1,192.7Operating expenses(1) . . . . . . . . . . . . . . . . . . . . . . . . . . . . . . 3,242.6 2,719.1 2,804.9 2,562.8Acquired in-process research and development . . . . . . . . . . 199.0 — 80.0 256.0Asset impairment, restructuring, and other special charges . 144.9 42.4 72.4 108.0Other—net, (income) expense . . . . . . . . . . . . . . . . . . . . . . . (44.7) (86.5) 123.3 (92.7)Income before income taxes . . . . . . . . . . . . . . . . . . . . . . . . . 444.6 1,047.8 679.7 617.9Net income . . . . . . . . . . . . . . . . . . . . . . . . . . . . . . . . . . . . . . 478.4 799.7 600.8 529.5Earnings per share—basic . . . . . . . . . . . . . . . . . . . . . . . . . . 0.45 0.75 0.57 0.50Earnings per share—diluted . . . . . . . . . . . . . . . . . . . . . . . . . 0.45 0.75 0.56 0.50Dividends paid per share . . . . . . . . . . . . . . . . . . . . . . . . . . . 0.50 0.50 0.50 0.50Common stock closing prices:
High . . . . . . . . . . . . . . . . . . . . . . . . . . . . . . . . . . . . . . . . . . 87.52 89.98 86.59 76.36Low . . . . . . . . . . . . . . . . . . . . . . . . . . . . . . . . . . . . . . . . . . . 76.98 78.26 70.89 68.41
(1) Includes research and development and marketing, selling, and administrative expenses.
Our common stock is listed on the New York Stock Exchange (NYSE), NYSE Euronext, and SIX Swiss Exchange.

FINANCIAL REPORT
F9898
Management’s ReportsManagement’s Report for Financial Statements—Eli Lilly and Company and Subsidiaries
Management of Eli Lilly and Company and subsidiaries is responsible for the accuracy, integrity, and fair presentation of the financial statements. The statements have been prepared in accordance with generally accepted accounting principles in the United States and include amounts based on judgments and estimates by management. In management’s opinion, the consolidated financial statements present fairly our financial position, results of operations, and cash flows.
In addition to the system of internal accounting controls, we maintain a code of conduct (known as "The Red Book") that applies to all employees worldwide, requiring proper overall business conduct, avoidance of conflicts of interest, compliance with laws, and confidentiality of proprietary information. All employees must take training annually on The Red Book and are required to report suspected violations. A hotline number is published in The Red Book to enable employees to report suspected violations anonymously. Employees who report suspected violations are protected from discrimination or retaliation by the company. In addition to The Red Book, the chief executive officer and all financial management must sign a financial code of ethics, which further reinforces their ethical and fiduciary responsibilities.
The consolidated financial statements have been audited by Ernst & Young LLP, an independent registered public accounting firm. Their responsibility is to examine our consolidated financial statements in accordance with generally accepted auditing standards of the Public Company Accounting Oversight Board (United States). Ernst & Young’s opinion with respect to the fairness of the presentation of the statements is included in Item 8 of our annual report on Form 10-K. Ernst & Young reports directly to the audit committee of the board of directors.
Our audit committee includes five nonemployee members of the board of directors, all of whom are independent from our company. The committee charter, which is available on our website, outlines the members’ roles and responsibilities and is consistent with enacted corporate reform laws and regulations. It is the audit committee’s responsibility to appoint an independent registered public accounting firm subject to shareholder ratification, approve both audit and non-audit services performed by the independent registered public accounting firm, and review the reports submitted by the firm. The audit committee meets several times during the year with management, the internal auditors, and the independent public accounting firm to discuss audit activities, internal controls, and financial reporting matters, including reviews of our externally published financial results. The internal auditors and the independent registered public accounting firm have full and free access to the committee.
We are dedicated to ensuring that we maintain the high standards of financial accounting and reporting that we have established. We are committed to providing financial information that is transparent, timely, complete, relevant, and accurate. Our culture demands integrity and an unyielding commitment to strong internal practices and policies. Finally, we have the highest confidence in our financial reporting, our underlying system of internal controls, and our people, who are objective in their responsibilities and operate under a code of conduct and the highest level of ethical standards.
Management’s Report on Internal Control Over Financial Reporting—Eli Lilly and Company and Subsidiaries
Management of Eli Lilly and Company and subsidiaries is responsible for establishing and maintaining adequate internal control over financial reporting as defined in Rules 13a-15(f) and 15d-15(f) under the Securities Exchange Act of 1934. We have global financial policies that govern critical areas, including internal controls, financial accounting and reporting, fiduciary accountability, and safeguarding of corporate assets. Our internal accounting control systems are designed to provide reasonable assurance that assets are safeguarded, that transactions are executed in accordance with management’s authorization and are properly recorded, and that accounting records are adequate for preparation of financial statements and other financial information. A staff of internal auditors regularly monitors, on a worldwide basis, the adequacy and effectiveness of internal accounting controls. The general auditor reports directly to the audit committee of the board of directors.

FINAN
CIAL
REPO
RT
F9999
We conducted an evaluation of the effectiveness of our internal control over financial reporting based on the framework in "2013 Internal Control—Integrated Framework" issued by the Committee of Sponsoring Organizations of the Treadway Commission.
Based on our evaluation under this framework, we concluded that our internal control over financial reporting was effective as of December 31, 2016. However, because of its inherent limitations, internal control over financial reporting may not prevent or detect misstatements. Also, projections of any evaluation of effectiveness to future periods are subject to the risk that controls may become inadequate because of changes in conditions, or that the degree of compliance with the policies or procedures may deteriorate.
The internal control over financial reporting has been assessed by Ernst & Young LLP as of December 31, 2016. Their responsibility is to evaluate whether internal control over financial reporting was designed and operating effectively.
David A. Ricks Derica W. RicePresident and Chief Executive Officer
Executive Vice President, Global Services and ChiefFinancial Officer
February 21, 2017

FINANCIAL REPORT
F100100
Report of Independent Registered Public Accounting FirmThe Board of Directors and Shareholders of Eli Lilly and Company
We have audited the accompanying consolidated balance sheets of Eli Lilly and Company and subsidiaries as of December 31, 2016 and 2015, and the related consolidated statements of operations, comprehensive income, shareholders' equity and cash flows for each of the three years in the period ended December 31, 2016. These financial statements are the responsibility of the Company's management. Our responsibility is to express an opinion on these financial statements based on our audits.
We conducted our audits in accordance with the standards of the Public Company Accounting Oversight Board (United States). Those standards require that we plan and perform the audit to obtain reasonable assurance about whether the financial statements are free of material misstatement. An audit includes examining, on a test basis, evidence supporting the amounts and disclosures in the financial statements. An audit also includes assessing the accounting principles used and significant estimates made by management, as well as evaluating the overall financial statement presentation. We believe that our audits provide a reasonable basis for our opinion.
In our opinion, the financial statements referred to above present fairly, in all material respects, the consolidated financial position of Eli Lilly and Company and subsidiaries at December 31, 2016 and 2015, and the consolidated results of their operations and their cash flows for each of the three years in the period ended December 31, 2016, in conformity with U.S. generally accepted accounting principles.
As discussed in Note 2 to the consolidated financial statements, the Company changed its method of classification of cash flows for the tax effects of share-based payment awards as a result of the adoption of the amendments to the FASB Accounting Standards Codification resulting from Accounting Standards Update No. 2016-09, Compensation - Stock Compensation (Topic 718): Improvements to Employee Share-Based Payment Accounting.
We also have audited, in accordance with the standards of the Public Company Accounting Oversight Board (United States), Eli Lilly and Company and subsidiaries’ internal control over financial reporting as of December 31, 2016, based on criteria established in Internal Control-Integrated Framework issued by the Committee of Sponsoring Organizations of the Treadway Commission (2013 framework), and our report dated February 21, 2017, expressed an unqualified opinion thereon.
Indianapolis, Indiana
February 21, 2017

FINAN
CIAL
REPO
RT
F101101
Report of Independent Registered Public Accounting FirmThe Board of Directors and Shareholders of Eli Lilly and Company
We have audited Eli Lilly and Company and subsidiaries’ internal control over financial reporting as of December 31, 2016, based on criteria established in Internal Control-Integrated Framework issued by the Committee of Sponsoring Organizations of the Treadway Commission (2013 framework) (the COSO criteria). Eli Lilly and Company and subsidiaries’ management is responsible for maintaining effective internal control over financial reporting, and for its assessment of the effectiveness of internal control over financial reporting included in the accompanying Management’s Report on Internal Control Over Financial Reporting. Our responsibility is to express an opinion on the Company’s internal control over financial reporting based on our audit.
We conducted our audit in accordance with the standards of the Public Company Accounting Oversight Board (United States). Those standards require that we plan and perform the audit to obtain reasonable assurance about whether effective internal control over financial reporting was maintained in all material respects. Our audit included obtaining an understanding of internal control over financial reporting, assessing the risk that a material weakness exists, testing and evaluating the design and operating effectiveness of internal control based on the assessed risk, and performing such other procedures as we considered necessary in the circumstances. We believe that our audit provides a reasonable basis for our opinion.
A company’s internal control over financial reporting is a process designed to provide reasonable assurance regarding the reliability of financial reporting and the preparation of financial statements for external purposes in accordance with generally accepted accounting principles. A company’s internal control over financial reporting includes those policies and procedures that (1) pertain to the maintenance of records that, in reasonable detail, accurately and fairly reflect the transactions and dispositions of the assets of the company; (2) provide reasonable assurance that transactions are recorded as necessary to permit preparation of financial statements in accordance with generally accepted accounting principles, and that receipts and expenditures of the company are being made only in accordance with authorizations of management and directors of the company; and (3) provide reasonable assurance regarding prevention or timely detection of unauthorized acquisition, use, or disposition of the company’s assets that could have a material effect on the financial statements.
Because of its inherent limitations, internal control over financial reporting may not prevent or detect misstatements. Also, projections of any evaluation of effectiveness to future periods are subject to the risk that controls may become inadequate because of changes in conditions, or that the degree of compliance with the policies or procedures may deteriorate.
In our opinion, Eli Lilly and Company and subsidiaries maintained, in all material respects, effective internal control over financial reporting as of December 31, 2016, based on the COSO criteria.
We also have audited, in accordance with the standards of the Public Company Accounting Oversight Board (United States), the 2016 consolidated financial statements of Eli Lilly and Company and subsidiaries and our report dated February 21, 2017 expressed an unqualified opinion thereon.
Indianapolis, Indiana
February 21, 2017
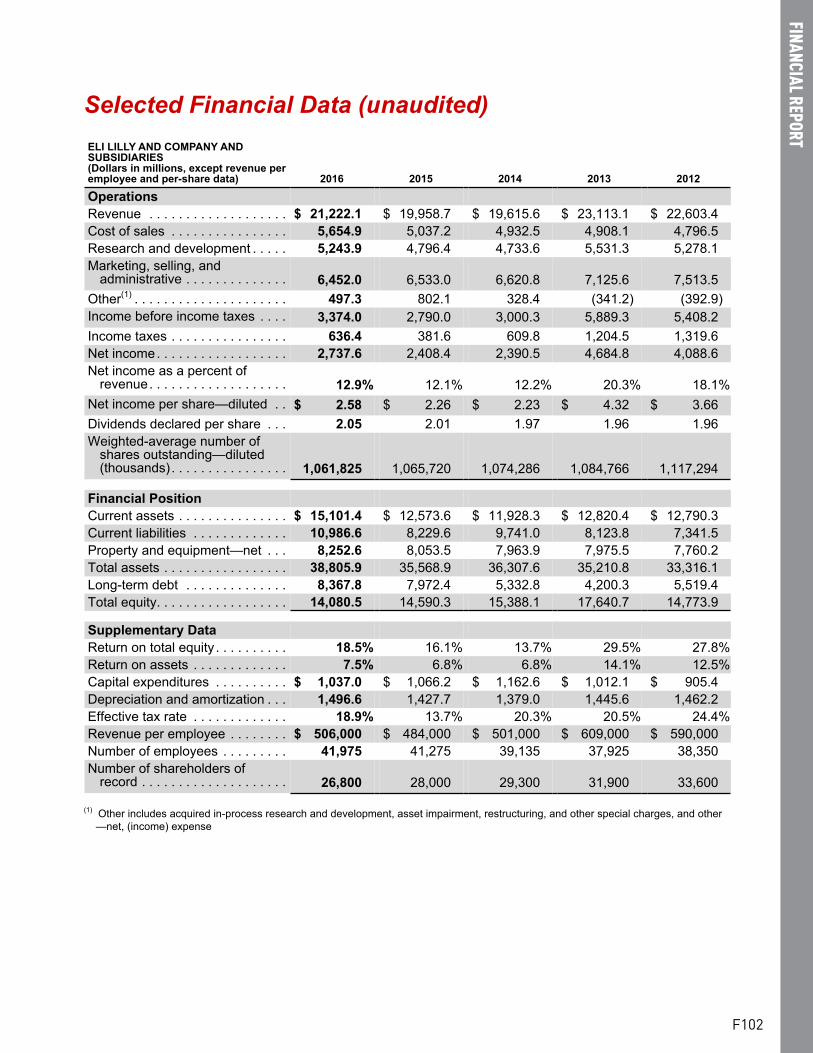
FINANCIAL REPORT
F102102
Selected Financial Data (unaudited)ELI LILLY AND COMPANY AND SUBSIDIARIES(Dollars in millions, except revenue per employee and per-share data) 2016 2015 2014 2013 2012
OperationsRevenue . . . . . . . . . . . . . . . . . . . $ 21,222.1 $ 19,958.7 $ 19,615.6 $ 23,113.1 $ 22,603.4Cost of sales . . . . . . . . . . . . . . . . 5,654.9 5,037.2 4,932.5 4,908.1 4,796.5Research and development . . . . . 5,243.9 4,796.4 4,733.6 5,531.3 5,278.1Marketing, selling, and
administrative . . . . . . . . . . . . . . 6,452.0 6,533.0 6,620.8 7,125.6 7,513.5Other(1) . . . . . . . . . . . . . . . . . . . . . 497.3 802.1 328.4 (341.2) (392.9)Income before income taxes . . . . 3,374.0 2,790.0 3,000.3 5,889.3 5,408.2Income taxes . . . . . . . . . . . . . . . . 636.4 381.6 609.8 1,204.5 1,319.6Net income. . . . . . . . . . . . . . . . . . 2,737.6 2,408.4 2,390.5 4,684.8 4,088.6Net income as a percent of
revenue. . . . . . . . . . . . . . . . . . . 12.9% 12.1% 12.2% 20.3% 18.1%Net income per share—diluted . . $ 2.58 $ 2.26 $ 2.23 $ 4.32 $ 3.66Dividends declared per share . . . 2.05 2.01 1.97 1.96 1.96Weighted-average number of
shares outstanding—diluted(thousands). . . . . . . . . . . . . . . . 1,061,825 1,065,720 1,074,286 1,084,766 1,117,294
Financial PositionCurrent assets . . . . . . . . . . . . . . . $ 15,101.4 $ 12,573.6 $ 11,928.3 $ 12,820.4 $ 12,790.3Current liabilities . . . . . . . . . . . . . 10,986.6 8,229.6 9,741.0 8,123.8 7,341.5Property and equipment—net . . . 8,252.6 8,053.5 7,963.9 7,975.5 7,760.2Total assets . . . . . . . . . . . . . . . . . 38,805.9 35,568.9 36,307.6 35,210.8 33,316.1Long-term debt . . . . . . . . . . . . . . 8,367.8 7,972.4 5,332.8 4,200.3 5,519.4Total equity. . . . . . . . . . . . . . . . . . 14,080.5 14,590.3 15,388.1 17,640.7 14,773.9
Supplementary DataReturn on total equity . . . . . . . . . . 18.5% 16.1% 13.7% 29.5% 27.8%Return on assets . . . . . . . . . . . . . 7.5% 6.8% 6.8% 14.1% 12.5%Capital expenditures . . . . . . . . . . $ 1,037.0 $ 1,066.2 $ 1,162.6 $ 1,012.1 $ 905.4Depreciation and amortization . . . 1,496.6 1,427.7 1,379.0 1,445.6 1,462.2Effective tax rate . . . . . . . . . . . . . 18.9% 13.7% 20.3% 20.5% 24.4%Revenue per employee . . . . . . . . $ 506,000 $ 484,000 $ 501,000 $ 609,000 $ 590,000Number of employees . . . . . . . . . 41,975 41,275 39,135 37,925 38,350Number of shareholders of
record . . . . . . . . . . . . . . . . . . . . 26,800 28,000 29,300 31,900 33,600
(1) Other includes acquired in-process research and development, asset impairment, restructuring, and other special charges, and other—net, (income) expense
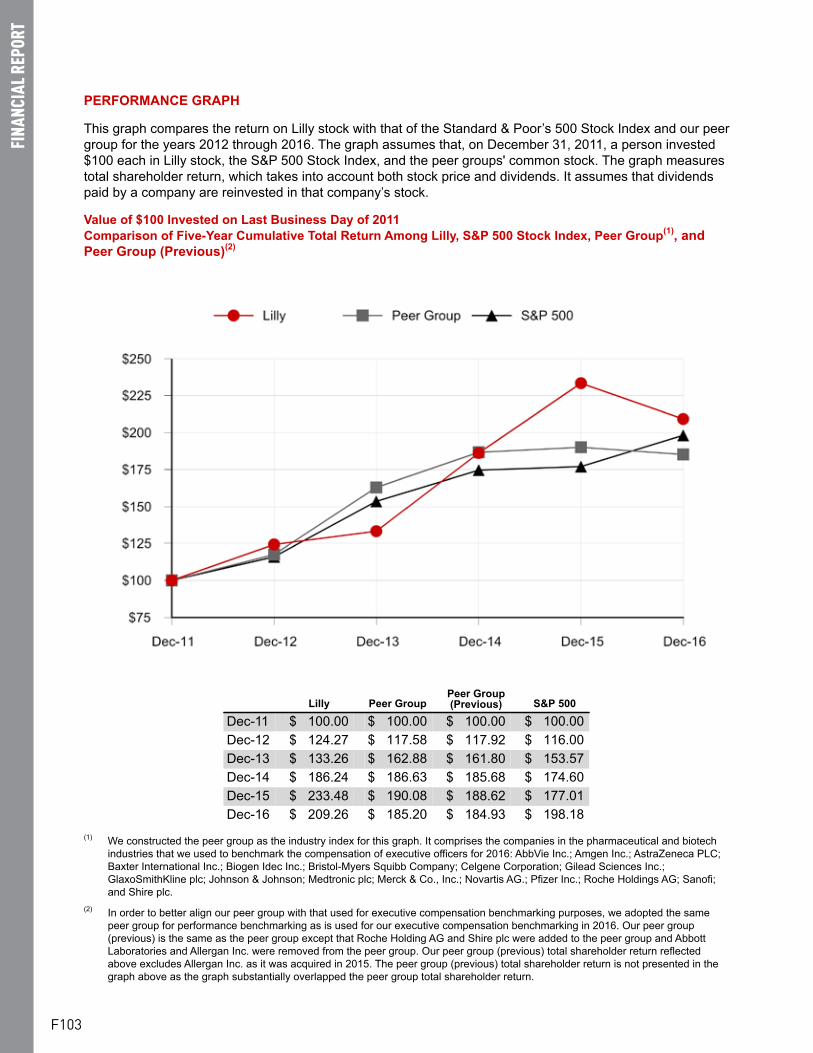
FINAN
CIAL
REPO
RT
F103103
PERFORMANCE GRAPH
This graph compares the return on Lilly stock with that of the Standard & Poor’s 500 Stock Index and our peer group for the years 2012 through 2016. The graph assumes that, on December 31, 2011, a person invested $100 each in Lilly stock, the S&P 500 Stock Index, and the peer groups' common stock. The graph measures total shareholder return, which takes into account both stock price and dividends. It assumes that dividends paid by a company are reinvested in that company’s stock.
Value of $100 Invested on Last Business Day of 2011 Comparison of Five-Year Cumulative Total Return Among Lilly, S&P 500 Stock Index, Peer Group(1), and Peer Group (Previous)(2)
Lilly Peer GroupPeer Group(Previous) S&P 500
Dec-11 $ 100.00 $ 100.00 $ 100.00 $ 100.00Dec-12 $ 124.27 $ 117.58 $ 117.92 $ 116.00Dec-13 $ 133.26 $ 162.88 $ 161.80 $ 153.57Dec-14 $ 186.24 $ 186.63 $ 185.68 $ 174.60Dec-15 $ 233.48 $ 190.08 $ 188.62 $ 177.01Dec-16 $ 209.26 $ 185.20 $ 184.93 $ 198.18
(1) We constructed the peer group as the industry index for this graph. It comprises the companies in the pharmaceutical and biotech industries that we used to benchmark the compensation of executive officers for 2016: AbbVie Inc.; Amgen Inc.; AstraZeneca PLC; Baxter International Inc.; Biogen Idec Inc.; Bristol-Myers Squibb Company; Celgene Corporation; Gilead Sciences Inc.; GlaxoSmithKline plc; Johnson & Johnson; Medtronic plc; Merck & Co., Inc.; Novartis AG.; Pfizer Inc.; Roche Holdings AG; Sanofi; and Shire plc.
(2) In order to better align our peer group with that used for executive compensation benchmarking purposes, we adopted the same peer group for performance benchmarking as is used for our executive compensation benchmarking in 2016. Our peer group (previous) is the same as the peer group except that Roche Holding AG and Shire plc were added to the peer group and Abbott Laboratories and Allergan Inc. were removed from the peer group. Our peer group (previous) total shareholder return reflected above excludes Allergan Inc. as it was acquired in 2015. The peer group (previous) total shareholder return is not presented in the graph above as the graph substantially overlapped the peer group total shareholder return.

FINANCIAL REPORT
F104104
Trademarks Used In This Report
Trademarks or service marks owned by Eli Lilly and Company or its subsidiaries or affiliates, when first used in this report, appear with an initial capital and are followed by the symbol ® or ™, as applicable. In subsequent uses of the marks in the report, the symbols may be omitted.
Actos® is a trademark of Takeda Pharmaceutical Company Limited.
ENHANZE™ is a trademark of Halozyme Therapeutics, Inc.
Byetta® is a trademark of Amylin Pharmaceuticals, Inc.
Glyxambi®, Jardiance®, Jentadueto®, Synjardy® and Trajenta® are trademarks of Boehringer Ingelheim GmbH.
Sentinel® is a trademark of Virbac Corporation.
Viagra® is a trademark of Pfizer Inc.

PROX
Y STA
TEME
NT
Notice of 2017 Annual Meeting of Shareholders and Proxy Statement
Your vote is importantPlease vote by using the Internet, telephone, or by signing, dating, and returning the enclosed proxy card by mail.

PROXY STATEMENT
Table of Contents Notice of Annual Meeting of Shareholders . . . . . . . . . . . . . . . . . . . . . . . . . . . . . . . .Proxy Statement Summary . . . . . . . . . . . . . . . . . . . . . . . . . . . . . . . . . . . . . . . . . . . .Governance . . . . . . . . . . . . . . . . . . . . . . . . . . . . . . . . . . . . . . . . . . . . . . . . . . . . . . . . .
Item 1 - Election of Directors . . . . . . . . . . . . . . . . . . . . . . . . . . . . . . . . . . . . . . . . . .Board Operations and Governance . . . . . . . . . . . . . . . . . . . . . . . . . . . . . . . . . . . . .Director Qualifications and Nomination Process . . . . . . . . . . . . . . . . . . . . . . . . . . .Director Compensation . . . . . . . . . . . . . . . . . . . . . . . . . . . . . . . . . . . . . . . . . . . . . .Director Independence . . . . . . . . . . . . . . . . . . . . . . . . . . . . . . . . . . . . . . . . . . . . . .Committees of the Board of Directors . . . . . . . . . . . . . . . . . . . . . . . . . . . . . . . . . . .Membership and Meetings of the Board and Its Committees . . . . . . . . . . . . . . . . .Board Oversight of Compliance and Risk Management . . . . . . . . . . . . . . . . . . . . .Highlights of the Company's Corporate Governance. . . . . . . . . . . . . . . . . . . . . . . .Shareholder Engagement on Governance Issues . . . . . . . . . . . . . . . . . . . . . . . . . .Prior Management Proposals to Eliminate Classified Board . . . . . . . . . . . . . . . . . .Shareholder Proposals and Nominations . . . . . . . . . . . . . . . . . . . . . . . . . . . . . . . .
Ownership of Company Stock . . . . . . . . . . . . . . . . . . . . . . . . . . . . . . . . . . . . . . . . . .Compensation . . . . . . . . . . . . . . . . . . . . . . . . . . . . . . . . . . . . . . . . . . . . . . . . . . . . . . .
Item 2 - Advisory Vote on Compensation Paid to Named Executive Officers . . . . .Compensation Discussion and Analysis . . . . . . . . . . . . . . . . . . . . . . . . . . . . . . . . .Executive Compensation . . . . . . . . . . . . . . . . . . . . . . . . . . . . . . . . . . . . . . . . . . . . .Compensation Committee Matters . . . . . . . . . . . . . . . . . . . . . . . . . . . . . . . . . . . . .Item 3 - Frequency of Future Advisory Votes on Named Executive Officer Compensation . . . . . . . . . . . . . . . . . . . . . . . . . . . . . . . . . . . . . . . . . . . . . . . . . . . . .
Audit Matters . . . . . . . . . . . . . . . . . . . . . . . . . . . . . . . . . . . . . . . . . . . . . . . . . . . . . . . .Item 4 - Proposal to Ratify the Appointment of Principal Independent Auditor . . . .
Directors' Deferral Plan . . . . . . . . . . . . . . . . . . . . . . . . . . . . . . . . . . . . . . . . . . . . . . .Item 5 - Proposal to Amend the Lilly Directors' Deferral Plan . . . . . . . . . . . . . . . . .
Shareholder Proposals . . . . . . . . . . . . . . . . . . . . . . . . . . . . . . . . . . . . . . . . . . . . . . . .Item 6 - Shareholder Proposal on Direct and Indirect Political Contributions . . . . .
Other Information . . . . . . . . . . . . . . . . . . . . . . . . . . . . . . . . . . . . . . . . . . . . . . . . . . . .Meeting and Voting Logistics . . . . . . . . . . . . . . . . . . . . . . . . . . . . . . . . . . . . . . . . . .Other Matters . . . . . . . . . . . . . . . . . . . . . . . . . . . . . . . . . . . . . . . . . . . . . . . . . . . . . .
Appendix A - Summary of Adjustments Related to the Annual Cash Bonus and Performance Award . . . . . . . . . . . . . . . . . . . . . . . . . . . . . . . . . . . . . . . . . . . . . . . . . .Appendix B - The Lilly Directors' Deferral Plan . . . . . . . . . . . . . . . . . . . . . . . . . . . .Annual Meeting Admission Ticket . . . . . . . . . . . . . . . . . . . . . . . . . . . . . . . . . . . . . . .
P1P2P9P9
P10P19P20P22P23P25P26P26P30P30P31P32P33P33P34P49P58
P59
P59P59P62P62P64P64P66P66P68
P70
P72P88

P1
Notice of 2017 Annual Meeting of Shareholders To the holders of Common Stock of Eli Lilly and Company:
The 2017 Annual Meeting of Shareholders of Eli Lilly and Company will be held as shown below:
TIME AND DATE: 11:00 a.m. EDT, Monday, May 1, 2017
LOCATION: The Lilly Center AuditoriumLilly Corporate CenterIndianapolis, Indiana 46285
ITEMS OF BUSINESS: Election of the five directors listed in the proxy statement toserve three-year termsApproval, by non-binding vote, of the compensation paid to thecompany's named executive officersAdvisory vote regarding the frequency of future advisory voteson named executive officer compensationRatification of Ernst & Young LLP as the principal independentauditors for 2017Proposal to amend the Lilly Directors' Deferral Plan
Shareholder proposal seeking report regarding direct andindirect political contributions
WHO CAN VOTE: Shareholders of record at the close of business onFebruary 24, 2017
This proxy statement is dated March 20, 2017, and is first being sent or given to our shareholders on or about the date.
See the back page of this report for information regarding how to attend the meeting. Every shareholder vote is important. If you are unable to attend the meeting in person, please sign, date, and return your proxy and/or voting instructions by mail, telephone or through the Internet promptly so that a quorum may be represented at the meeting.
By order of the Board of Directors,
Bronwen L. MantloSecretary
March 20, 2017Indianapolis, Indiana
Important notice regarding the availability of proxy materials for the shareholder meeting to be held May 1, 2017: The annual report and proxy statement are available at https://www.lilly.com/annualreport2016.
PROX
Y STA
TEME
NT
P1

PROXY STATEMENT P2P2
Proxy Statement Summary
General InformationThis summary highlights information contained elsewhere in this proxy statement. It does not contain all the information you should consider, and you should read the entire proxy statement carefully before voting.
Meeting: Annual Meeting of Shareholders Date: May 1, 2017Time: 11:00 a.m. EDT Location: The Lilly Center Auditorium
Lilly Corporate CenterIndianapolis, Indiana 46285Record Date: February 24, 2017
Items of Business: Item 1: Election of the five directors listed in this proxy statement to serve three-year terms.
Item 2: Approval, by non-binding vote, of the compensation paid to the company's named executive officers.
Item 3: Advisory vote regarding the frequency of future advisory votes on named executive officer compensation.
Item 4: Ratification of Ernst & Young LLP as the principal independent auditor for 2017.
Item 5: Proposal to amend the Lilly Directors' Deferral Plan.Item 6: Shareholder proposal seeking report regarding direct and indirect
political contributions.
What Is New In This Year's Proxy Statement
We refined the Shareholder Value Award (SVA), one of the equity compensation programs for our executive officers, to include a Total Shareholder Return (TSR) modifier. The number of shares to be awarded under the SVA will increase or decrease by 1 percent for every percentage point that Lilly's three-year TSR deviates from our peer group's median three-year TSR (capped at +/-20 percent). This change rewards our executive officers for delivering top performance within the industry and increasing shareholder return. Executive officers received a larger portion of their total equity as SVAs (from 50 percent to 60 percent) to incentivize behavior that is aligned with long-term growth.
In December 2016, John C. Lechleiter, Ph.D., retired as President and CEO. David A. Ricks became President and CEO, and a member of the Board of Directors, on January 1, 2017. Dr. Lechleiter will serve as non-executive chairman until May 31, 2017. On June 1, 2017, Mr. Ricks will succeed him as Chairman.
In October 2016, we welcomed Jamere Jackson to the board. Mr. Jackson is CFO of Nielsen Holdings plc.
In February 2017, we welcomed Carolyn R. Bertozzi, Ph.D., to the board. Dr. Bertozzi is the Anne T. and Robert M. Bass Professor of Chemistry and Professor of Chemical and Systems Biology and Radiology at Stanford University. She is an investigator for the Howard Hughes Medical Institute.
In 2017, the board approved an annual compensation cap of $800,000 for non-employee directors, which is reflected in the provisions of the amended Directors' Deferral Plan (see Item 5).

PROX
Y STA
TEME
NT
P3P3
Highlights of 2016 Company Performance
The following provides a brief look at our 2016 performance in three dimensions: operating performance, innovation progress, and shareholder return. See our 2016 annual report on Form 10-K for more details.
Operating PerformancePerformance highlights:
• 2016 revenue increased 6 percent to approximately $21.2 billion.• 2016 earnings per share (EPS) increased 14 percent on a reported basis to $2.58, and increased
3 percent on a non-GAAP basis to $3.52.
*A reconciliation of GAAP and externally reported non-GAAP measures is included in Appendix A.
Innovation ProgressWe made significant advances with our pipeline in 2016, including:
• U.S. approval of a new cardiovascular (CV) indication for Jardiance® (empagliflozin) tablets and an EU label update to include a change to the indication statement regarding the reduction of risk of CV death in adults with type 2 diabetes and established CV disease.
• U.S. approval and conditional EU approval for LartruvoTM (olaratumab) for soft tissue sarcoma.• U.S., EU, and Japan approval for Taltz® (ixekizumab) for moderate-to-severe plaque psoriasis.• Multiple new indications in the EU and Japan for Cyramza.
Shareholder ReturnWe generated strong TSR (share price appreciation plus dividends, reinvested quarterly) for the three- and five-year periods through year-end 2016. Our returns exceeded both the compensation peer group and the S&P 500 in the three- and five-year periods, but lagged for the one-year period that ended on December 31, 2016:

PROXY STATEMENT P4P4
Governance Further Information
Item 1: Election of DirectorsSee page 9
Name and principal occupation Public boards Managementrecommendation
Vote required to pass
Michael L. Eskew, 67 3M Corporation; IBMCorporation; AllstateInsurance Company
Vote FOR Majority of votes cast
Former Chairman and Chief ExecutiveOfficer, United Parcel Service, Inc.Director since 2008
William G. Kaelin, Jr., M.D., 59 Vote FOR Majority of votes castProfessor, Dana-Farber Cancer Institute;
Associate Director, Dana-Farber/HarvardCancer CenterDirector since 2012
John C. Lechleiter, Ph.D., 63 Ford Motor Company;Nike, Inc.
Vote FOR Majority of votes castChairman of the Board, Eli Lilly and Company
Director since 2005Retirement on May 31, 2017
David A. Ricks, 49 Vote FOR Majority of votes castPresident and Chief Executive Officer, Eli Lilly
and Company
Director since 2017Chairman, effective June 1, 2017
Marshall S.Runge, M.D., Ph.D., 62 Vote FOR Majority of votes castExecutive Vice President for Medical Affairs,
University of MichiganDirector since 2013
Name and principal occupation Public boards Management recommendation
Vote required to pass
Michael L. Eskew, 67Former Chariman and Chief Executive Officer, United Parcel Service, Inc.Director since 2008
3M Corporation; IBM Corporation;Allstate Insurance Company
Vote FOR Majority of votes cast
William G. Kaelin, Jr., M.D., 59Professor, Dana-Farber Cancer Institute;Associate Director, Dana-Farber/Harvard Cancer CenterDirector since 2012
Vote FOR Majority of votes cast
John C. Lechleiter, Ph.D., 63Chairman of the Board, Eli Lilly and CompanyDirector since 2005Retirement on May 31, 2017
Ford Motor Company;Nike, Inc. Vote FOR Majority of
votes cast
David A. Ricks, 49President and Chief Executive Officer, Eli LIlly and CompanyDirector since 2017 Chairman, effective June 1, 2017
Vote FOR Majority of votes cast
Marschall S. Runge, M.D., Ph.D., 62 Executive Vice President for Medical Affairs,University of MichiganDirector since 2013
Vote FOR Majority of votes cast

PROX
Y STA
TEME
NT
P5P5
Our Corporate Governance Policies Reflect Best PracticesOur board membership is marked by leadership, experience, and diversity.All of our non-employee directors, and all board committee members, are independent, with the exception of Dr. John Lechleiter, our former President and CEO. Dr. Lechleiter will retire in May 2017.We have a strong, independent lead director role.Our board actively participates in company strategy and CEO/senior executive succession planning, most recently with respect to our new President and CEO.Our board oversees compliance and enterprise risk management practices.We have in place meaningful stock ownership requirements.We have a majority voting standard and resignation policy for the election of directors.
Compensation Further Information
Item 2: Advisory Vote on Compensation Paid to Named Executive Officers
See page 33
Managementrecommendation
Vote required to pass
Item 2 Approve, by non-binding vote, compensation paid to the company's named executive officers
Vote FOR Majority ofvotes cast
Our Executive Compensation Programs Reflect Best PracticesWe have had strong shareholder support of compensation practices: in 2016, over 98 percent of shares cast voted in favor of our executive compensation.Our compensation programs are designed to align with shareholder interests and link pay to performance through a blend of short- and long-term performance measures.Our Compensation Committee annually reviews compensation programs to ensure they provide incentives to deliver long-term, sustainable business results while discouraging excessive risk-taking or other adverse behaviors.We have a broad compensation recovery policy that applies to all executives and covers a wide range of misconduct.Our executive officers (EOs) are subject to robust stock ownership guidelines and are prohibited from hedging or pledging their company stock.We do not have "top hat" retirement plans—supplemental plans are open to all employees and are limited to restoring benefits lost due to IRS limits on qualified plans.We do not provide tax gross-ups to EOs (except for limited gross-ups related to international assignments).We have a very restrictive policy on perquisites. Our severance plans related to change-in-control generally require a double trigger.We do not have employment agreements with any of our EOs.
Executive Compensation Summary for 2016At the time the total target compensation was established at the end of 2015, compensation for our named executive officers (the five officers whose compensation is disclosed in this proxy statement) was in the middle range of the company's peer group. Incentive compensation programs paid out above target, consistent with the company's strong performance in 2016, as outlined below under "Pay for Performance."
Pay for PerformanceAs described more fully in the Compensation Disclosures and Analysis (CD&A) section, we link our incentive pay programs to a balanced mix of measures on three dimensions of company performance: operating performance; progress with our innovation pipeline; and shareholder return.

PROXY STATEMENT P6P6
The summary information below highlights how our incentive pay programs align with company performance. Please also see Appendix A for adjustments that were made to revenue and EPS for incentive compensation programs.
2016 Annual Cash Bonus MultipleThe company exceeded its annual cash bonus targets for revenue and pipeline progress, but narrowly missed its EPS target.
*Performance goal multiples are capped at 2.0.

PROX
Y STA
TEME
NT
P7P7
2016 Performance Award MultipleWe exceeded our EPS growth targets under our Performance Award program, which has targets based on expected EPS growth of peer companies over a two-year period. This performance resulted in a Performance Award multiple in excess of the target.
2016 Shareholder Value Award MultipleWe significantly exceeded our stock price growth targets under our Shareholder Value Award program, which has targets based on expected large-cap company returns over a three-year period. This performance resulted in a Shareholder Value Award multiple in excess of the target.

PROXY STATEMENT P8P8
Item 3: Advisory Vote Regarding Frequency of Named Executive Officer Compensation Further Information
See page 59
Managementrecommendation
Vote required to pass
Item 3 Advisory vote regarding the frequency of future advisory voteson executive compensation
AnnualAdvisory
Votes
Optionreceiving the
highestnumber ofvotes cast
Audit Matters Further Information
Item 4: Ratification of Appointment of Principal Independent Auditor
See page 59
Managementrecommendation
Vote required to pass
Item 4 Ratify the appointment of Ernst & Young LLP as the company's principal independent auditor for 2017
Vote FOR Majority ofvotes cast
Lilly Directors' Deferral Plan Further Information
Item 5: Amendment of the Lilly Directors' Deferral Plan See page 62
Managementrecommendation
Vote required to pass
Item 5 Approve the amendment of Lilly's Directors' Deferral Plan Vote FOR Majority ofvotes cast
The Lilly Directors’ Deferral Plan (the “plan”) provides an ownership position in the company that aligns directors with shareholder interests.
Under the plan, a portion of directors' annual compensation is awarded in deferred shares:
all shares must be held until the second January following the director's departure from board serviceno stock options can be issued under the plan.
Changes to the plan include:
authorizing an additional 750,000 shares (the same amount approved in 2003)an annual compensation cap of $800,000 for non-employee directors.

PROX
Y STA
TEME
NT
P9P9
Shareholder Proposals Further Information
Item 6: Shareholder proposal seeking report regarding direct and indirect political contributions
See page 64
Managementrecommendation
Vote required to pass
Item 6 Proposal seeking report regarding direct and indirect politicalcontributions
VoteAGAINST
Majority ofvotes cast
Other Information Further InformationSee page 66
How to Vote in Advance of the MeetingEven if you plan to attend the 2017 Annual Meeting in person, we encourage you to vote prior to the meeting via one of the methods described below.
Visit the website listed on your proxy card/voting instruction form to vote VIA THE INTERNET
Call the telephone number on your proxy card/voting instruction form to vote BY TELEPHONE
Sign, date, and return your proxy card/voting instruction form to vote BY MAIL
Further information on how to vote is provided at the end of the proxy statement under "Meeting and Voting Logistics."
Voting at our 2017 Annual MeetingYou may also opt to vote in person at the 2017 Annual Meeting, which will be held on Monday, May 1, 2017, at the Lilly Corporate Center, Indianapolis, IN 46285, at 11:00 a.m., local time. See the section titled "Meeting and Voting Logistics" for more information.
GovernanceItem 1. Election of Directors Under the company’s articles of incorporation, the board is divided into three classes with approximately one-third of the directors standing for election each year. The term for directors to be elected this year will expire at the annual meeting of shareholders held in 2020. Each of the nominees listed below has agreed to serve that term, with the exception of John C. Lechleiter, who will retire from the board on May 31, 2017. At that time, the board expects to reduce its size. The following sections provide information about our directors, including their qualifications, the director nomination process, and director compensation.
PROXY STATEMENT P10P10
Board Recommendation on Item 1
The Board recommends that you vote FOR each of the following nominees: • Michael L. Eskew• William G. Kaelin, Jr., M.D.• John C. Lechleiter, Ph.D.• David A. Ricks • Marschall S. Runge, M.D., Ph.D.
Board Operations and Governance
Board of Directors
Each of our directors is elected to serve until his or her successor is duly elected and qualified. If a nominee is unavailable for election, proxy holders may vote for another nominee proposed by the Board of Directors or, as an alternative, the Board of Directors may reduce the number of directors to be elected at the annual meeting.
Director Biographies Set forth below is information as of March 8, 2017, regarding the nominees for election, which has been confirmed by each of them for inclusion in this proxy statement. We have provided the most significant experiences, qualifications, attributes, or skills that led to the conclusion that each director or director nominee should serve as one of our directors in light of our business and structure. Full biographies for each of our directors are available on our website at http://www.lilly.com/about/board-of-directors/Pages/board-of-directors.aspx.
No family relationship exists among any of our directors, director nominees, or EOs. To the best of our knowledge, there are no pending material legal proceedings in which any of our directors or nominees for director, or any of their associates, is a party adverse to us or any of our affiliates, or has a material interest adverse to us or any of our affiliates. Additionally, to the best of our knowledge, there have been no events under any bankruptcy act, no criminal proceedings and no judgments, sanctions, or injunctions during the past 10 years that are material to the evaluation of the ability or integrity of any of our directors or nominees for director. There is no arrangement between any director or director nominee and any other person pursuant to which he or she was or is to be selected as a director or director nominee.
Class of 2017
The following five directors will be seeking election at this year's annual meeting. Four of these directors are standing for reelection; David A. Ricks is seeking election for the first time. Dr. Lechleiter will retire from the board on May 31, 2017. At that time, the board expects to reduce its size. See “Item 1. Election of Directors” above for more information.

PROX
Y STA
TEME
NT
P11P11
Michael L. EskewAge: 67, Director since 2008Board Committees: Audit (chair); Directors and Corporate Governance; Finance
Public Boards: 3M Corporation; IBM Corporation; Allstate Insurance Company
Nonprofit Boards: Chairman of the board of trustees of The Annie E. Casey Foundation
Career Highlights United Parcel Service, Inc., a global shipping and logistics company• Chairman and Chief Executive Officer (2002 - 2007)• Vice Chairman (2000 - 2002)• UPS Board of Directors (1998 - 2014)
Qualifications: Mr. Eskew has CEO experience with UPS, where he established a record of success in managing complex worldwide operations, strategic planning, and building a strong consumer-brand focus. He is an audit committee financial expert, based on his CEO experience and his service on other U.S. company audit committees. He has extensive corporate governance experience through his service on the boards of other companies.
William G. Kaelin, Jr., M.D.Age: 59, Director since 2012Board Committees: Finance, Science and Technology (chair)
Industry Memberships: Institute of Medicine; National Academy of Sciences; Association of American Physicians; American Society of Clinical Investigation
Honors: Canada Gairdner International Award; Lefoulon-Delalande Prize - Institute of France; Albert B. Lasker Prize
Career Highlights Dana-Farber/Harvard Cancer Center• Professor of Medicine (2002 - present)
Brigham and Women's Hospital• Professor (2002 - present)
Howard Hughes Medical Institute• Investigator (2002 - present)• Assistant Investigator (1998 - 2002)
Qualifications: Dr. Kaelin is a prominent medical researcher and academician. He has extensive experience at Harvard Medical School, a major medical institution, as well as special expertise in oncology—a key component of Lilly's business. He also has deep expertise in basic science, including mechanisms of drug action, and experience with pharmaceutical discovery research.

PROXY STATEMENT P12P12
John C. Lechleiter, Ph.D.Age: 63, Director since 2009Board Committees: none
Industry Memberships: American Chemical Society
Honorary Degrees: Marian University, University of Indianapolis, the National University of Ireland, Indiana University, Franklin College, and Purdue University
Public Boards: Ford Motor Company; Nike, Inc.Non-profit Boards: United Way Worldwide, chairman; Chemical Heritage Foundation; and the Central Indiana Corporate Partnership (member emeritus)
Career Highlights Eli Lilly and Company• Chairman of the Board (2009 - present)• Past President and CEO (2008 - 2016)
Qualifications: Dr. Lechleiter serves as Lilly's non-executive chairman. He will retire from the board on May 31, 2017. Dr. Lechleiter served as President and CEO from April 1, 2008 until his retirement on December 31, 2016. Prior to his retirement, Dr. Lechleiter had over 37 years of experience with the company in a variety of roles of increasing responsibility in research and development, pharmaceutical operations, and corporate administration. As a result, he has a sound understanding of pharmaceutical research and development, sales and marketing, and manufacturing. He also has significant corporate governance experience through his service on other public company boards.
David A. RicksAge: 49, Director since 2017Board Committees: none
Industry Memberships: European Federation of Pharmaceutical Industries and Associations (EFPIA); Pharmaceutical Research and Manufacturers of America (PhRMA)
Non-profit Boards: Board of Governors for Riley Children's Foundation
Career Highlights Eli Lilly and Company• President and CEO (2017 - present)• Senior Vice President and President, Lilly Bio-Medicines (2012 - 2016)
Qualifications: Mr. Ricks was named President and CEO on January 1, 2017, and became a director at that time. He will be named Chairman on June 1, 2017. Mr. Ricks joined Lilly in 1996 and most recently served as president of Lilly Bio-Medicines. He has deep expertise in product development, global sales and marketing, as well as public policy. He has significant global experience in the company's commercial operations.

PROX
Y STA
TEME
NT
P13P13
Marschall S. Runge, M.D., Ph.D.Age: 62, Director since: 2013Board Committees: Public Policy and Compliance; Science and Technology
Industry Memberships: Experimental Cardiovascular Sciences Study Section of the National Institutes of Health
Career Highlights University of Michigan• CEO, Michigan Medicine (2015 - present)• Executive Vice President for Medical Affairs (2015 - present)• Dean, Medical School (2015 - present)
University of North Carolina, School of Medicine• Executive Dean (2010 - 2015); Chair of the Department of Medicine (2000 -
2015)• Principal Investigator and Director of the North Carolina Translational and
Clinical Sciences Institute
Qualifications: Dr. Runge brings the unique perspective of a practicing physician who has a broad background in health care, clinical research, and academia. He has extensive experience as a practicing cardiologist, a strong understanding of health care facility systems, and deep expertise in biomedical research and clinical trial design.
Class of 2018 The following four directors will continue in office until May 2018.
Katherine Baicker, Ph.D.Age: 45, Director since: 2011Board Committees: Audit; Public Policy and Compliance
Industry Memberships: Commissioner of the Medicare Payment Advisory Commission; Chair of the Group Insurance Commission of Massachusetts; Panel of Health Advisers to the Congressional Budget Office; Editorial boards of Health Affairs and the Journal of Health Economics; and Member of the National Academy of Medicine
Career Highlights Harvard T.H. Chan School of Public Health, Department of Health Policy and Management
• Professor of health economics (2007 - present)• C. Boyden Gray Professor and Acting Chair, Department of Health Policy and
Management (2014 - present)Council of Economic Advisers, Executive Office of the President
• Member (2005 - 2007)• Senior Economist (2001 - 2002)
Qualifications: Dr. Baicker is a leading researcher in the fields of health economics, public economics, and labor economics. As a valued adviser to numerous health care-related commissions and committees, her expertise in health care policy and health care delivery is recognized in both academia and government.

PROXY STATEMENT P14P14
J. Erik FyrwaldAge: 57, Director since: 2005Board Committees: Public Policy and Compliance (chair); Science and Technology
Non-profit Boards: UN World Food Program Farm to Market Initiative; Crop Life International; and Swiss American Chamber of Commerce
Career Highlights Syngenta International AG, a global Swiss-based agriculture technology company that produces agrochemicals and seeds
• Chief Executive Officer (2016 - present)Univar, Inc., a leading distributor of industrial and specialty chemicals and provider of related services
• President and Chief Executive Officer (2012 - 2016)Nalco Company, a leading provider of water treatment products and services
• Chairman and Chief Executive Officer (2008 - 2011)Ecolab, a leading provider of cleaning, sanitization, and water treatment products and services
• President (2012)E.I. duPont de Nemours and Company, a global chemical company
• Group Vice President, agriculture and nutrition (2003 - 2008)
Qualifications: Mr. Fyrwald has a strong record of operational and strategic leadership in three complex worldwide businesses with a focus on technology and innovation. He is an engineer by training and has significant CEO experience with Syngenta, Univar, and Nalco.
Jamere JacksonAge: 47, Director since 2016Board Committees: Audit; Finance
Non-profit Boards: Future 5
Career Highlights Nielsen Holdings plc, a global information, data, and measurement company• Chief Financial Officer (2014 - present)
GE• Vice President and CFO, GE Oil & Gas, drilling and surface division
(2013 2014)• Senior Executive, Finance, GE Aviation (2007 - 2013)• Finance Executive, GE Corporate (2004 - 2007)
Qualifications: Through his senior financial roles at Nielsen and GE, Mr. Jackson brings to the board significant global financial expertise and strong background in strategic planning, having spent his professional career in a broad range of financial and strategic planning roles. He is an audit committee financial expert, based on his CFO experience and his training as a certified public accountant.

PROX
Y STA
TEME
NT
P15P15
Ellen R. MarramAge: 70, Director since 2002, lead director since 2012Board Committees: Compensation, Directors and Corporate Governance (chair)
Public Boards: Ford Motor Company, The New York Times CompanyPrior Public Boards: Cadbury plcPrivate Boards: Newman's Own, Inc.
Non-profit Boards: Wellesley College; New York-Presbyterian Hospital; Lincoln Center Theater; and Newman's Own Foundation
Career Highlights The Barnegat Group LLC, provider of business advisory services • President (2006 - present)
North Castle Partners, LLC, private equity firm• Managing Director (2000 - 2006)
Tropicana Beverage Group• President and Chief Executive Officer (1993 - 1998)
Nabisco Biscuit Company, a unit of Nabisco, Inc.• President and Chief Executive Officer (1988 - 1993)
Qualifications: Ms. Marram is a former CEO with a strong marketing and consumer-brand background. Through her nonprofit and private company activities, she has a special focus and expertise in wellness and consumer health. Ms. Marram has extensive corporate governance experience through service on other public company boards in a variety of industries.
Jackson P. TaiAge: 66, Director since 2013Board Committees: Audit; Finance
Public Boards: MasterCard Incorporated, Royal Philips NV, HSBC Holdings plcPrior Boards: The Bank of China Limited; Singapore Airlines; NYSE Euronext; ING Groep NV; CapitaLand (Singapore); DBS Group Holdings and DBS Bank
Other (non publicly listed) Boards: Russell Reynolds Associates; Canada Pension Plan Investment Board; Metropolitan Opera; Rensselaer Polytechnic Institute
Career Highlights DBS Group Holdings and DBS Bank (formerly the Development Bank of Singapore), one of the largest financial services groups in Asia
• Vice Chairman and Chief Executive Officer (2002 - 2007)• President and Chief Operating Officer (2001 - 2002)
J.P. Morgan & Co. Incorporated, a leading global financial institution• 25-year career in investment banking, including senior management
responsibilities in New York, Tokyo, and San Francisco
Qualifications: Mr. Tai is a former CEO with extensive experience in international business and finance, and is an audit committee financial expert. He has deep expertise in the Asia-Pacific region, a key growth market for Lilly. He also has broad corporate governance experience from his service on public company boards in the U.S., Europe, and Asia.

PROXY STATEMENT P16P16
Class of 2019
The following five directors are serving terms that will expire in May 2019. Dr. Prendergast will retire from the board on May 1, 2017. At that time, the board expects to reduce its size.
Ralph AlvarezAge: 61, Director since 2009Board Committees: Compensation (chair); Science and Technology
Memberships and Other Organizations: University of Miami: President's Council; School of Business Administration Board of Overseers; International Advisory Board
Public Boards: Skylark Co., Ltd.; Lowe's Companies, Inc.; Dunkin' Brands Group, Inc.; Realogy Holdings Corp.Prior Public Boards: McDonald's Corporation; KeyCorp
Career Highlights Skylark Co., Ltd., a leading restaurant operator in Japan• Chairman of the Board (2013 - present)
McDonald's Corporation• President and Chief Operating Officer (2006 - 2009)
Qualifications: Through his senior executive positions at Skylark Co., Ltd. and McDonald’s Corporation, as well as with other global restaurant businesses, Mr. Alvarez has extensive experience in consumer marketing, global operations, international business, and strategic planning. His international experience includes a special focus on Japan and emerging markets. He also has extensive corporate governance experience through his service on other public company boards.
Carolyn R. Bertozzi, Ph.D.Age: 50, Director since 2017Board Committees: Public Policy and Compliance; Science and Technology
Industry Memberships and Other Organizations: American Chemical Society; American Society for Biochemistry and Molecular Biology; American Chemical Society Publications, Editor-in-Chief of ACS Central Science; Institute of Medicine; National Academy of Sciences; American Academy of Arts and Sciences
Honors: MacArthur Genius Award; Lemelson MIT Prize; Heinrich Wieland Prize, National Academy of Sciences Award in the Chemical Sciences
Career Highlights Stanford University• Anne T. and Robert M. Bass Professor of Chemistry, Professor of Chemical
and Systems Biology and Radiology by courtesy (2015 - present)Howard Hughes Medical Institute
• Investigator (2000 - present)University of California, Berkeley
• T.Z. and Irmgard Chu Professor of Chemistry and Professor of Molecular and Cell Biology
Qualifications: Dr. Bertozzi is a prominent researcher and academician. She has extensive experience at Stanford University and the University of Berkeley, California, two major research institutions. Her deep expertise spans the disciplines of chemistry and biology, with an emphasis on studies of cell surface glycosylation associated with cancer, inflammation and bacterial infection, and exploiting this knowledge for development of diagnostic and therapeutic approaches.

PROX
Y STA
TEME
NT
P17P17
R. David HooverAge: 71, Director since 2009Board Committees: Finance (Chair); Directors and Corporate Governance
Memberships and Other Organizations: Indiana University Kelley School of Business, Dean's Council
Public Boards: Ball Corporation; Edgewell Personal Care Co.Prior Public Boards: Qwest International, Inc.; Steelcase, Inc.Non-profit Boards: Children's Hospital Colorado; DePauw University
Career Highlights Ball Corporation, a provider of packaging products, aerospace and other technologies and services to commercial and governmental customers
• Chairman (2002 - 2013)• Chairman and CEO (2010 - 2011)• President and Chief Executive Officer (2001 - 2010)• Chief Operating Officer (2000 - 2001)• Chief Financial Officer (1998 - 2000)
Qualifications: Mr. Hoover has extensive CEO experience at Ball Corporation, with a strong record of leadership in operations and strategy. He has deep financial expertise as a result of his experience as CEO and CFO of Ball. He also has extensive corporate governance experience through his service on other public company boards.
Juan R. LucianoAge: 55, Director since 2016Board Committees: Finance; Public Policy and Compliance
Public Boards: Archer Daniels Midland Company; Wilmar
Non-profit Boards: Boys and Girls Clubs of America
Career Highlights Archer Daniels Midland Company, a global food-processing and commodities-trading company
• Chairman (January 2016 - present)• Chief Executive Officer and President (2015 - present)• President (2014 - 2015)• Executive Vice President and Chief Operating Officer (2011 - 2014)
The Dow Chemical Company, a multinational chemical company
• Executive Vice President and President, Performance Division (2010 - 2011)
Qualifications: Mr. Luciano has CEO and global business experience with Archer Daniels Midland Company, where he has established a reputation for strong result-oriented and strategic leadership, as well as many years of global leadership experience at The Dow Chemical Company. He brings to the board a strong technology and operations background, along with expertise in the food and agriculture sectors, an expanding area of focus for Lilly and its Elanco business.

PROXY STATEMENT P18P18
Franklyn G. Prendergast, M.D., Ph.D.Age: 72, Director since 1995Board Committees: Public Policy and Compliance; Science and Technology
Public Boards: Cancer Genetics Incorporated
Career Highlights Mayo Medical School• Edmond and Marion Guggenheim Professor of Biochemistry and Molecular
Biology (1986 - 2014)• Professor of Molecular Pharmacology and Experimental Therapeutics (1987 - 2014)• Mayo Clinic Center for Individualized Medicine, Director Emeritus (2006 - 2012)
Mayo Clinic Cancer Center• Director Emeritus (1995 - 2006)
Qualifications: Dr. Prendergast is a prominent medical clinician, researcher, and academician. He has extensive experience in senior-most administration at Mayo Clinic, a major medical institution, and as director of its renowned cancer center. He retired from Mayo at the end of 2014. He has special expertise in two critical areas for Lilly—oncology and personalized medicine. As a medical doctor, he brings an important practicing-physician perspective to the Board’s deliberations.
Kathi P. SeifertAge: 67, Director since 1995Board Committees: Audit; Compensation
Public Boards: Investors Community BankPrivate Boards: Appvion, Inc.Prior Public Boards: Albertsons; Revlon Consumer Products Co.; Supervalue Inc.; Lexmark International, Inc.
Non-profit Boards: Community Foundation for the Fox Valley Region; Fox Cities Building for the Arts; Fox Cities Chamber of Commerce; New North
Career Highlights Kimberly-Clark Corporation, a global consumer products company• Executive Vice President (1999 - 2004)
Katapult, LLC, a provider of pro bono mentoring and consulting services to non-profit organizations
• Chairman (2004 - present)
Qualifications: Ms. Seifert is a retired senior executive of Kimberly-Clark. She has strong expertise in consumer marketing and brand management, having led sales and marketing for several worldwide brands, with a special focus on consumer health. She has extensive corporate governance experience through her other board positions.

PROX
Y STA
TEME
NT
P19P19
Director Qualifications and Nomination ProcessDirector QualificationsThe board assesses board candidates by considering the following:
Experience: Our directors are responsible for overseeing the company's business consistent with their fiduciary duties. This significant responsibility requires highly skilled individuals with various qualities, attributes, and professional experience. The board is well-rounded, with a balance of relevant perspectives and experience, as illustrated in the following charts:
CEO Experience: 8
Financial Expertise: 7
Relevant Scientific/Academic Expertise: 6
Healthcare Experience: 7
Operational/Strategic Expertise: 10
International Experience: 8
Marketing and Sales Expertise: 7
Board Tenure and Refreshment:In 2016 and 2017, the board added three new non-employee members: Mr. Juan Luciano, Mr. Jamere Jackson, and Dr. Carolyn R. Bertozzi, as well as Mr. David A. Ricks. Also in 2016 and 2017, three members retired or will retire from the board: Ms. Karen Horn, Dr. John Lechleiter, and Dr. Frank Prendergast.
As the following chart demonstrates, our director composition also reflects a mix of tenure on the board, which provides an effective balance of historical perspective and an understanding of the evolution of our business with fresh perspectives and insights.
2 Years Tenure or Less: 4
3-5 Years: 4
6-10 Years: 3
More than 10 Years: 5
Diversity: The board strives to achieve diversity in the broadest sense, including persons diverse in geography, gender, ethnicity, and experiences. Although the board does not establish specific diversity goals or have a stand-alone diversity policy, the board's overall diversity is an important consideration in the director selection and nomination process. The Directors and Corporate Governance Committee assesses the effectiveness of board diversity efforts in connection with the annual nomination process as well as in new director searches. The company's sixteen directors range in age from 45 to 72, and include four women and five ethnically diverse members.
Character: Board members should possess the personal attributes necessary to be an effective director, including unquestioned integrity, sound judgment, a collaborative spirit, and commitment to the company, our shareholders, and other constituencies.
Director Nomination ProcessThe board delegates the director screening process to the Directors and Corporate Governance Committee, which receives input from other board members. Potential directors are identified from several sources, including executive search firms retained by the committee, incumbent directors, management, and shareholders.

PROXY STATEMENT P20P20
The committee employs the same process for evaluating all candidates, including those submitted by shareholders. The committee initially evaluates a candidate based on publicly available information and any additional information supplied by the party recommending the candidate. If the candidate appears to satisfy the selection criteria and the committee’s initial evaluation is favorable, the committee, assisted by management or a search firm, gathers additional data on the candidate’s qualifications, availability, probable level of interest, and any potential conflicts of interest. If the committee’s subsequent evaluation continues to be favorable, the candidate is contacted by the Chairman of the Board and one or more of the independent directors, including the lead director, for direct discussions to determine the mutual level of interest in pursuing the candidacy. If these discussions are favorable, the committee makes a final recommendation to the board to nominate the candidate for election by the shareholders (or to select the candidate to fill a vacancy, as applicable).
The committee performs periodic assessments of the overall composition and skills of the board in order to ensure that the board and management are actively engaged in succession planning for directors, and that our board reflects the appropriate viewpoints, diversity, and expertise necessary to support our complex and evolving business. The committee, with input from all board members, also considers the contributions of the individual directors at least every three years when considering whether to nominate the director to a new three-year term. The results of these assessments inform the board's recommendations on nominations for directors at the annual meeting each year and help provide us with insight on the types of experiences, skills, and other characteristics we should be seeking for future director candidates. Based on this assessment, the committee has recommended that the directors in the 2017 class be elected at the 2017 annual meeting.
Director Compensation Director compensation is reviewed and approved annually by the board, on the recommendation of the Directors and Corporate Governance Committee. Directors who are employees receive no additional compensation for serving on the board.
Cash CompensationThe following table shows the retainers and meeting fees for all non-employee directors in effect in 2016.
Board Retainers (annual, paid in monthlyinstallments)
Committee Retainers (annual, paid in monthlyinstallments)
Annual Board Retainer $110,000 Audit Committee; Science and TechnologyCommittee members (including the chairs)
$6,000
Annual Retainers (in addition to annual boardretainer):
Compensation Committee; Directors and CorporateGovernance; Finance Committee; Public Policy andCompliance Committee members (including thechairs)
$3,000
Lead Director $30,000
Audit Committee Chair $18,000
Science and Technology Committee Chair $15,000
Compensation Committee Chair; Directors andCorporate Governance Committee Chair;Finance Committee Chair; Public Policy andCompliance Committee Chair
$12,000
Directors are reimbursed for customary and usual travel expenses. Directors may also receive additional cash compensation for serving on ad hoc committees that may be assembled from time-to-time.
Stock Compensation Directors are required to hold meaningful equity ownership positions in the company; accordingly, a significant portion of director compensation is in the form of deferred Lilly stock. Directors are required to hold Lilly stock, directly or through company plans, valued at not less than five times their annual board retainer; new directors are allowed five years to reach this ownership level. All directors serving at least five years have satisfied these guidelines, and all other directors are making progress toward these requirements.

PROX
Y STA
TEME
NT
P21P21
Non-employee directors received $160,000 of compensation (but no more than 7,500 shares), deposited annually in a deferred stock account in the Lilly Directors’ Deferral Plan (as described below), payable beginning the second January following the director's departure from board service.
Lilly Directors’ Deferral Plan: In addition to stock compensation, the Lilly Directors' Deferral Plan allows non-employee directors to defer receipt of all or part of their cash compensation until after their service on the board has ended. Each director can choose to invest the amounts deferred in one or both of the following two accounts:
Deferred Stock Account. This account allows the director, in effect, to invest his or her deferred cash compensation in company stock. Funds in this account are credited as hypothetical shares of company stock based on the closing stock price on pre-set monthly dates. In addition, the annual stock compensation award as described above is also credited to this account. The number of shares credited is calculated by dividing the $160,000 annual compensation figure by the closing stock price on a pre-set annual date. Hypothetical dividends are “reinvested” in additional shares based on the market price of the stock on the date dividends are paid. Actual shares are issued on the second January following the director's departure from board service.
Deferred Compensation Account. Funds in this account earn interest each year at a rate of 120 percent of the applicable federal long-term rate, compounded monthly, as established the preceding December by the U.S. Treasury Department under Section 1274(d) of the Internal Revenue Code of 1986, as amended (the Internal Revenue Code). The aggregate amount of interest that accrued in 2016 for the participating directors was $124,379, at a rate of 3.1 percent. The rate for 2017 is 2.7 percent.
Both accounts may generally only be paid in a lump sum or in annual installments for up to 10 years, beginning the second January following the director’s departure from board service. Amounts in the deferred stock account are paid in shares of company stock.
See Item 5, Amendment of the Lilly Directors' Deferral Plan, for more information regarding this plan.
2016 Compensation for Non-employee Directors
Name1Fees Earned
or Paid in Cash ($) Stock Awards ($)2
All Other Compensation
and Payments ($)3 Total ($)4
Mr. Alvarez $124,250 $160,000 $0 $284,250Dr. Baicker $119,000 $160,000 $0 $279,000Mr. Eskew $140,000 $160,000 $0 $300,000Mr. Fyrwald $131,000 $160,000 $17,434 $308,434Mr. Hoover $128,000 $160,000 $30,000 $318,000Ms. Horn $53,333 $66,667 $14,050 $134,050Mr. Jackson $29,750 $40,000 $0 $69,750Dr. Kaelin $134,000 $160,000 $20,500 $314,500Mr. Luciano $106,333 $146,667 $0 $253,000Ms. Marram $158,000 $160,000 $30,000 $348,000Dr. Prendergast $119,000 $160,000 $0 $279,000Dr. Runge $123,500 $160,000 $0 $283,500Ms. Seifert $119,000 $160,000 $10,800 $289,800Mr. Tai $123,500 $160,000 $0 $283,500
1 Carolyn R. Bertozzi, Ph.D., is not included in this chart as she became a board member effective February 2017.
2 Each non-employee director received an award of stock valued at $160,000 (approximately 2,088 shares), except Ms. Horn, who retired from the board in May 2016; Mr. Luciano, who joined the board in

PROXY STATEMENT P22P22
February 2016; and Mr. Jackson, who joined the board in October 2016. All received a pro-rated award for a partial year of service. This stock award and all prior stock awards are fully vested; however, the shares are not issued until the second January following the director's departure from board service, as described above under “Lilly Directors’ Deferral Plan.” The column shows the grant date fair value for each director’s stock award. Aggregate outstanding stock awards are shown in the “Common Stock Ownership by Directors and Executive Officers” table in the “Stock Units Not Distributable Within 60 Days” column.
3 This column consists of amounts donated by the Eli Lilly and Company Foundation, Inc. ("Foundation") under its matching gift program, which is generally available to U.S. employees as well as the non-employee directors. Under this program, the Foundation matched 100 percent of charitable donations over $25 made to eligible charities, up to a maximum of $30,000 per year for each individual. The Foundation matched these donations via payments made directly to the recipient charity. The amounts for Mr. Fyrwald, Ms. Horn, Mr. Kaelin, Ms. Marram, and Ms. Seifert include matching contributions for donations made at the end of 2015 (Mr. Fyrwald - $17,434; Ms. Horn - $7,150; Mr. Kaelin - $19,500; Ms. Marram - $8,000; and Ms. Seifert - $2,550), for which the matching contribution was not paid until 2016.
4 Directors do not participate in a company pension plan or non-equity incentive plan.
2017 Director CompensationIn 2017, the board approved an annual compensation cap of $800,000 for non-employee directors, which is reflected in the provisions of the amended Directors' Deferral Plan (see Item 5). Directors' compensation remains unchanged from 2016.
Dr. Lechleiter will continue serving as non-executive chairman until May 31, 2017, at which time he will leave the board. He will be eligible for the director compensation described above, as well as an additional retainer of $200,000 for his service as chairman of the board. His total compensation will be prorated for his partial period of service on the board.
Director Independence The board annually determines the independence of directors based on a review by the Directors and Corporate Governance Committee. No director is considered independent unless the board has determined that he or she has no material relationship with the company, either directly or as a partner, significant shareholder, or officer of an organization that has a material relationship with the company. Material relationships can include commercial, industrial, banking, consulting, legal, accounting, charitable, and familial relationships, among others. To evaluate the materiality of any such relationship, the board has adopted categorical independence standards consistent with the New York Stock Exchange (NYSE) listing standards, except that the “look-back period” for determining whether a director’s prior relationship(s) with the company impairs independence is extended from three to four years.
The company's process for determining director independence is set forth in our Standards for Director Independence, which can be found on our website at https://www.lilly.com/who-we-are/governance, along with our Corporate Governance Guidelines.
On the recommendation of the Directors and Corporate Governance Committee, the board determined that each current non-employee director, other than Dr. Lechleiter, is independent. Prior to expiration of her board term in 2016, the board reached the same conclusion regarding Ms. Horn, and determined that the members of each committee also meet our independence standards. The board determined that none of the non-employee directors, other than Dr. Lechleiter, has had during the last four years (i) any of the relationships referenced above or (ii) any other material relationship with the company that would compromise his or her independence. The table that follows includes a description of categories or types of transactions, relationships, or arrangements the board considered in reaching its determinations.

PROX
Y STA
TEME
NT
P23P23
Director OrganizationType of
Organization
DirectorRelationship toOrganization
Primary Type ofTransaction/Relationship/Arrangement
between Lilly andOrganization
2016 AggregatePercentage ofOrganization's
Revenue
Dr. Baicker Harvard UniversityEducationalInstitution Employee Research grants Less than 0.1 percent
Dr. Bertozzi Stanford UniversityEducationalInstitution Employee Research grants Less than 0.1 percent
Mr. FyrwaldSyngenta International AG
For-profitCorporation Executive Officer Purchases of products Less than 0.1 percent
Univar, Inc.For-profitCorporation
Former ExecutiveOfficer Purchases of products Less than 0.1 percent
Mr. Jackson Nielsen Holdings plcFor-profitCorporation Executive Officer Purchase of products Less than 0.1 percent
Dr. Kaelin
Harvard UniversityEducationalInstitution Employee Research grants Less than 0.1 percent
Brigham and Women'sHospital
Health CareInstitution Employee Research grants Less than 0.1 percent
Dana-Farber CancerInstitute
Health CareInstitution Employee Research grants Less than 1 percent
Mr. Luciano Archer Daniels Midland For-profitCorporation
Executive Officer
Purchases of products Less than 0.1 percent
Sales of productsLess than 0.1 percentof Lilly's revenue
Dr. Prendergast
Mayo Clinic and MayoMedical School
Health Care andEducationalInstitution Retired Employee Research grants Less than 0.1 percent
Mayo FoundationCharitableOrganization
Retired employeeof affiliated MayoClinic and MayoMedical School Contributions Less than 0.1 percent
Dr. Runge
University of MichiganMedical School
EducationalInstitution Executive Officer Research grants Less than 0.1 percent
University of NorthCarolina Medical School
EducationalInstitution Executive Officer Research grants Less than 0.1 percent
All of the transactions described above were entered into at arm’s length in the normal course of business and, to the extent they are commercial relationships, have standard commercial terms. Aggregate payments to each of the relevant organizations, in each of the last four fiscal years, did not exceed the greater of $1 million or 2 percent of that organization's consolidated gross revenues in a single fiscal year for the relevant four-year period. No director had any direct business relationships with the company or received any direct personal benefit from any of these transactions, relationships, or arrangements.
Committees of the Board of Directors The duties and membership of the six board-appointed committees are described below. All committee members in 2016 and currently are independent as defined in the NYSE listing requirements, and Lilly's independence standards, and the members of the Audit and Compensation Committees each meet the additional independence requirements applicable to them as members of those committees.
The Directors and Corporate Governance Committee makes recommendations to the board regarding director committee membership and selection of committee chairs. The board has no set policy for rotation of committee members or chairs but annually reviews committee memberships and chair positions, seeking the best blend of continuity and fresh perspectives.
The chair of each committee determines the frequency and agenda of committee meetings. The Audit, Compensation, and Public Policy and Compliance Committees meet alone in executive session on a regular basis; all other committees meet in executive session as needed.
PROXY STATEMENT P24P24
All six committee charters are available online at https://www.lilly.com/who-we-are/governance, or upon request to the company's corporate secretary.
Audit CommitteeAssists the board in fulfilling its oversight responsibilities by monitoring:
• The integrity of financial information provided to the shareholders and others;• Management's systems of internal controls and disclosure controls;• The performance of internal and independent audit functions; and• The company's compliance with legal and regulatory requirements.
The committee has sole authority to appoint or replace the independent auditor, subject to shareholder ratification.
The Board of Directors has determined that Mr. Eskew, Mr. Jackson, and Mr. Tai are audit committee financial experts, as defined in the SEC rules.
Compensation Committee• Oversees the company’s global compensation philosophy and policies;• Establishes the compensation of our chief executive officer (CEO) and other EOs; • Acts as the oversight committee with respect to the company’s deferred compensation plans,
management stock plans, and other management incentive compensation programs; and• Reviews succession plans for the CEO and other senior leadership positions.
Compensation Committee Interlocks and Insider Participation
None of the Compensation Committee members: • has ever been an officer or employee of the company; • is or has been a participant in a related-person transaction with the company (see “Review and Approval
of Transactions with Related Persons” for a description of our policy on related-person transactions); or• has any other interlocking relationships requiring disclosure under applicable SEC rules.
Directors and Corporate Governance Committee• Together with the lead director, leads the process for director recruitment;• Recommends to the board candidates for membership on the board and its committees, as well as for the
role of lead director; and• Oversees matters of corporate governance, including board performance, director independence and
compensation, the corporate governance guidelines, and shareholder engagement on governance matters.
Finance Committee Reviews and makes recommendations to the board regarding financial matters, including:
• capital structure and strategies;• dividends;• stock repurchases;• capital expenditures; • investments, financing, and borrowings;• benefit plan funding and investments;• financial risk management; and • significant business development opportunities.

PROX
Y STA
TEME
NT
P25P25
Public Policy and Compliance Committee• Oversees the processes by which the company conducts its business so that the company will do so in a
manner that complies with laws and regulations and reflects the highest standards of integrity; and• Reviews and makes recommendations regarding policies, practices, and procedures of the company that
relate to public policy and social, political, and economic issues.
Science and Technology Committee • Reviews and makes recommendations regarding the company’s strategic research goals and objectives; • Reviews new developments, technologies, and trends in pharmaceutical research and development;• Reviews the progress of the company's product pipeline; • Reviews the scientific aspects of significant business development opportunities; and• Oversees matters of scientific and medical integrity and risk management.
Membership and Meetings of the Board and Its Committees In 2016, each director attended at least 80 percent of the total number of meetings of the board and the committees on which he or she served during his or her tenure as a board or committee member. In addition, all board members are expected to attend the annual meeting of shareholders, and all directors then serving attended the meeting in 2016. Current committee membership and the number of meetings of the board and each committee in 2016 are shown in the table below.
Name Board Audit Compensation
Directors and Corporate Governance Finance
Public Policy and Compliance
Science and Technology
Mr. Alvarez CDr. Baicker
Dr. Bertozzi
Mr. Eskew CMr. Fyrwald CMr. Hoover CMr. Jackson
Dr. Kaelin CDr. Lechleiter CMr. Luciano
Ms. Marram LD CDr. Prendergast
Mr. Ricks
Dr. Runge
Ms. Seifert
Mr. TaiNumber of 2016 Meetings 7 10 7 6 4 4 5
C Committee ChairLD Lead Director
PROXY STATEMENT P26P26
Board Oversight of Compliance and Risk Management The board, together with the Audit and Public Policy and Compliance Committees, oversees the processes by which the company conducts its business to ensure the company operates in a manner that complies with laws and regulations and reflects the highest standards of integrity.
The company also has an enterprise risk management program overseen by its chief ethics and compliance officer, who reports directly to the CEO. Enterprise risks are identified and prioritized by management through both top-down and bottom-up processes. The top priorities are assigned to a board committee or full board for oversight. Company management is charged with managing risk through robust internal processes and controls. The enterprise risk management program as a whole is reviewed annually at a full board meeting, and enterprise risks are also addressed in periodic business function reviews and at the annual board and senior management strategy session.
Code of EthicsThe board approves the company's code of ethics, which is set out in:
The Red Book: a comprehensive code of ethical and legal business conduct applicable to all employees worldwide and to our Board of Directors. The Red Book is reviewed and approved annually by the board.
Code of Ethical Conduct for Lilly Financial Management: a supplemental code for our CEO and all members of financial management, in recognition of their unique responsibilities to ensure proper accounting, financial reporting, internal controls, and financial stewardship.
These documents are available online at: https://www.lilly.com/who-we-are/governance/ethics-and-compliance-program and https://www.lilly.com/ethical-conduct-for-financial-management, or upon request to the company's corporate secretary. In the event of any amendments to, or waivers from, a provision of the code affecting the chief executive officer, chief financial officer, chief accounting officer, controller, or persons performing similar functions, we intend to post on the above website within four business days after the event a description of the amendment or waiver as required under applicable Securities and Exchange Commission rules. We will maintain that information on our website for at least 12 months.
Highlights of the Company’s Corporate Governance The company is committed to good corporate governance, which promotes the long-term interests of shareholders and other company stakeholders, builds confidence in our company leadership, and strengthens accountability for the board and company management. The board has adopted corporate governance guidelines that set forth the company's basic principles of corporate governance. The section that follows outlines key elements of the guidelines and other governance matters. Investors can learn more by reviewing the corporate governance guidelines, which are available online at https://www.lilly.com/who-we-are/governance or upon request to the company’s corporate secretary.
Role of the BoardThe directors are elected by the shareholders to oversee the actions and results of the company’s management. The board exercises oversight over a broad range of areas, but the board's key responsibilities include:
• providing general oversight of the business;• approving corporate strategy;• approving major management initiatives;• selecting, compensating, evaluating, and, when necessary, replacing the chief executive officer, and

PROX
Y STA
TEME
NT
P27P27
compensating other senior executives;• ensuring that an effective succession plan is in place for all executive officers and reviewing the broader
talent management process, including diversity and inclusion;• overseeing the company’s ethics and compliance program and management of significant business
risks;• nominating, compensating, and evaluating directors; and• overseeing the company's enterprise risk management program.
Board Composition and Requirements
Mix of Independent Directors and Officer-Directors There should always be a substantial majority (75 percent or more) of independent directors. The CEO should be a board member.
Voting for DirectorsIn an uncontested election, directors are elected by a majority of votes cast. An incumbent nominee who fails to receive a majority of the votes cast will tender his or her resignation. The board, on recommendation of the Directors and Corporate Governance Committee, will decide whether to accept the resignation. The company will promptly disclose the board's decision, including, if applicable, the reasons why the board rejected the resignation.
Director Tenure and Retirement PolicyNon-employee directors must retire no later than the date of the annual meeting that follows their seventy-second birthday. The Directors and Corporate Governance Committee has authority to recommend exceptions to this policy. The committee, with input from all board members, also considers the contributions of the individual directors at least every three years when considering whether to nominate the director to a new three-year term.
Other Board ServiceIn general, no director may serve on more than three other public company boards. The Directors and Corporate Governance Committee may approve exceptions if it determines that the additional service will not impair the director's effectiveness on the Lilly board. The Directors and Corporate Governance Committee reviewed an exception request for Mr. Alvarez (who serves on four other company boards), considering his attendance record and continued engagement in board matters. Upon review, the committee determined that he could effectively balance his other board responsibilities and continue to be a strong contributor to the Lilly board.
Board Confidentiality PolicyThe board has adopted a Confidentiality Policy, applicable to all current and future members of the board. The policy prohibits a director from sharing confidential information obtained in his or her role as a director with any outside party except under limited circumstances where the director is seeking legal advice or is required to disclose information by order of law. The Confidentiality Policy can be viewed on the company's website here: http://www.lilly.com/about/corporate-governance/Pages/corporate-governance.aspx.
Leadership Structure; Oversight of Chairman, CEO, and Senior ManagementLeadership StructureThe board currently believes that combining the role of Chairman of the Board and the CEO, coupled with a strong lead director position, is the most efficient and effective leadership model for the company, fostering clear accountability, effective decision-making, and alignment on corporate strategy. The board periodically reviews its leadership structure and developments in the area of corporate governance in order to ensure that this approach continues to strike the appropriate balance for the company and our stakeholders, most recently

PROXY STATEMENT P28P28
during the succession-management process relating to the retirement of Dr. Lechleiter.
Board IndependenceThe board has put in place a number of governance practices to ensure effective independent oversight, including:
• Executive sessions of the independent directors: held after every regular board meeting.
• Annual performance evaluation of the chairman and CEO: conducted by the independent directors, the results of which are reviewed with the CEO and considered by the Compensation Committee in establishing the CEO’s compensation for the next year.
• A strong, independent, clearly defined lead director role: The lead director's responsibilities include:leading the board’s processes for selecting and evaluating the CEO;presiding at all meetings of the board at which the chairman is not present;serving as a liaison between the chairman and the independent directors; if requested by major shareholders, ensures that she is available for consultation and direct communication;approving meeting agendas and schedules and generally approving information sent to the board;conducting executive sessions of the independent directors; overseeing the independent directors' annual performance evaluation of the chairman and CEO; andtogether with the Directors and Corporate Governance Committee, leading the director recruitment process.
The lead director also has authority to call meetings of the independent directors and to retain advisers for the independent directors.
The lead director is appointed annually by the board. Currently Ms. Marram is the lead director.
• Director access to management and independent advisors: Independent directors have direct access to members of management whenever they deem it necessary, and the company's EOs attend part of each regularly scheduled board meeting. The independent directors and all committees are also free to retain their own independent advisors, at company expense, whenever they feel it would be desirable to do so.
CEO Succession PlanningThe Compensation Committee, board, and CEO annually review the company's succession plans for the CEO and other key senior leadership positions. The independent directors also meet without the CEO to discuss CEO succession planning.
During these reviews, the CEO and directors discuss:future candidates for the CEO and other senior leadership positions;succession timing; anddevelopment plans for the highest-potential candidates.
The company ensures that the directors have multiple opportunities to interact with the company's top leadership talent in both formal and informal settings in order to allow them to most effectively assess the candidates' qualifications and capabilities. In 2016, the board followed this process, and the independent directors also met without the CEO present when selecting Mr. Ricks to succeed Dr. Lechleiter as president and CEO of the company, effective January 1, 2017.
The independent directors and the CEO maintain a confidential plan for the timely and efficient transfer of the CEO's responsibilities in the event of an emergency or his sudden departure, incapacitation, or death.

PROX
Y STA
TEME
NT
P29P29
Board Education and Annual Performance AssessmentThe company engages in a comprehensive orientation process for incoming new directors. Directors also receive ongoing continuing educational sessions on areas of particular relevance or importance to our company, and we hold periodic mandatory training sessions for the Audit Committee.
Additionally, the Directors and Corporate Governance Committee conducts an annual assessment of the board's performance, board committee performance, and all board processes based on input from all directors.
Conflicts of Interest and Transactions with Related PersonsConflicts of Interest Directors must disclose to the company all relationships that create a conflict or an appearance of a conflict. The board, after consultation with counsel, takes appropriate steps to identify actual or apparent conflicts and ensure that all directors voting on an issue are disinterested. A director may be excused from discussions on the issue, as appropriate.
Review and Approval of Transactions with Related Persons The board has adopted a policy and procedures for review, approval, and monitoring of transactions involving the company and related persons (directors and EOs, their immediate family members, or shareholders of more than 5 percent of the company’s outstanding stock). The policy covers any related-person transaction that meets the minimum threshold for disclosure in the proxy statement under the relevant SEC rules (generally, transactions involving amounts exceeding $120,000 in which a related person has a direct or indirect material interest).
Policy: Related-person transactions must be approved by the board or by a committee of the board consisting solely of independent directors, who will approve the transaction only if they determine that it is in the best interests of the company. In considering the transaction, the board or committee will consider all relevant factors, including:
• the company’s business rationale for entering into the transaction; • the alternatives to entering into a related-person transaction; • whether the transaction is on terms comparable to those available to third parties, or in the case of
employment relationships, to employees generally; • the potential for the transaction to lead to an actual or apparent conflict of interest and any safeguards
imposed to prevent such actual or apparent conflicts; and • the overall fairness of the transaction to the company.
Procedures: • Management or the affected director or EO will bring the matter to the attention of the chairman, the
lead director, the chair of the Directors and Corporate Governance Committee, or the corporate secretary.
• The chairman and the lead director shall jointly determine (or, if either is involved in the transaction, the other shall determine) whether the matter should be considered by the board or by one of its existing committees.
• If a director is involved in the transaction, he or she will be recused from all discussions and decisions about the transaction.
• The transaction must be approved in advance whenever practicable, and if not practicable, must be ratified, if appropriate, as promptly as practicable.
• The board or relevant committee will review the transaction annually to determine whether it continues to be in the company’s best interests.
The Directors and Corporate Governance Committee has approved the following employment relationships that are considered related-party transactions under the SEC rules.

PROXY STATEMENT P30P30
We have three current employees who are relatives of current or former EOs. Dr. John Bamforth, vice president, chief marketing officer, global marketing, is the spouse of Dr. Susan Mahony, an EO. Myles O’Neill, senior vice president, global drug products, is the spouse of Dr. Fionnuala Walsh, an EO. Finally, Andrew Lechleiter, general manager, Hong Kong, is the son of Dr. John Lechleiter, Lilly's former CEO. For 2016, these three employees received cash compensation, and equity grants between $195,000 and $1,480,000.
All three individuals participate in the company’s benefit programs generally available to U.S. employees. Their compensation is consistent with the compensation paid to other employees at their levels and with the Company's overall compensation principles based on their years of experience, performance, and positions within the company.
Communication with the Board of DirectorsYou may send written communications to one or more members of the board, addressed to:
Board of DirectorsEli Lilly and Companyc/o Corporate SecretaryLilly Corporate CenterIndianapolis, IN 46285
Shareholder Engagement on Governance IssuesEach year, the company engages large shareholders and other key constituents to discuss key areas of interest or concern related to corporate governance, as well as any specific issues for the coming proxy season. In 2016, we spoke with a number of our largest investors. Issues discussed included shareholders' perspectives regarding a potential management proposal to eliminate the company's classified board and supermajority voting requirements, proxy access, board composition and recruitment, and the company's executive compensation, among other topics. The overall tone from these conversations was positive and the investors with whom we spoke were generally supportive of our overall compensation and governance policies. We have shared the feedback we received from these conversations with our Compensation Committee and Directors and Corporate Governance Committee. We are committed to continuing to engage with our investors to ensure their diverse perspectives are thoughtfully considered.
Prior Management Proposals to Eliminate Classified Board and Supermajority Voting RequirementsBetween 2007 and 2012, each year we submitted management proposals to eliminate the company's classified board structure. The proposals did not pass because they failed to receive a “supermajority vote” of 80 percent of the outstanding shares, as required in the company's articles of incorporation. In addition, in 2010, 2011, 2012, we submitted management proposals to eliminate the supermajority voting requirements themselves. Those proposals also fell short of the required 80 percent vote.
Prior to 2012, these proposals received support ranging from 72 to 77 percent of the outstanding shares. In 2012, the vote was even lower, approximately 63 percent of the outstanding shares, driven in part by a 2012 NYSE rule revision prohibiting brokers from voting their clients' shares on corporate governance matters absent specific instructions from such clients. We have decided not to resubmit those proposals in 2016 based on our discussions with large shareholders as described above and our assessment that the proposals would not be successful. We will continue to monitor this situation and engage with our shareholders on these and other topics to ensure that we continue to demonstrate strong corporate governance and accountability to shareholders.

PROX
Y STA
TEME
NT
P31P31
Shareholder proposals If a shareholder wishes to have a proposal considered for inclusion in next year’s proxy statement, he or she must submit the proposal in writing so that we receive it by November 20, 2017. Proposals should be addressed to the company’s corporate secretary, Lilly Corporate Center, Indianapolis, Indiana 46285. In addition, the company’s bylaws provide that any shareholder wishing to propose any other business at the annual meeting must give the company written notice by November 20, 2017, and no earlier than September 21, 2017. That notice must provide certain other information as described in the bylaws. Copies of the bylaws are available online at https://www.lilly.com/who-we-are/governance or upon request to the company’s corporate secretary.
Shareholder Recommendations and Nominations for Director CandidatesA shareholder who wishes to recommend a director candidate for evaluation should forward the candidate's name and information about the candidate's qualifications to:
Chair of the Directors and Corporate Governance Committeec/o Corporate SecretaryLilly Corporate CenterIndianapolis, IN 46285
The candidate must meet the selection criteria described above and must be willing and expressly interested in serving on the board.
Under Section 1.9 of the company’s bylaws, a shareholder who wishes to directly nominate a director candidate at the 2018 annual meeting (i.e., to propose a candidate for election who is not otherwise nominated by the board through the recommendation process described above) must give the company written notice by November 20, 2017, and no earlier than September 21, 2017. The notice should be addressed to the corporate secretary at the address provided above. The notice must contain prescribed information about the candidate and about the shareholder proposing the candidate as described in more detail in Section 1.9 of the bylaws. A copy of the bylaws is available online at https://www.lilly.com/who-we-are/governance. The bylaws will also be provided by mail upon request to the corporate secretary.
We have not received any notice regarding shareholder nominations for board candidates or other shareholder business to be presented at the meeting.

PROXY STATEMENT P32P32
Ownership of Company Stock Common Stock Ownership by Directors and Executive Officers The following table sets forth the number of shares of company common stock beneficially owned by the directors, the named executive officers, and all directors and EOs as a group, as of February 17, 2017. None of the stock or stock units owned by any of the listed individuals has been pledged as collateral for a loan or other obligation.
Beneficial Owners Common Stock 1
Stock Units Not Distributable Within
60 Days 4Shares Owned 2Stock Units Distributable
Within 60 Days 3
Ralph Alvarez — — 35,224
Katherine Baicker, Ph.D. — — 12,758
Enrique A. Conterno 144,173 — 41,326
Michael L. Eskew — — 34,239
J. Erik Fyrwald 100 — 54,701
Michael J. Harrington 85,314 — 24,524
R. David Hoover 1,500 — 33,724
Jamere Jackson — — 522
William G. Kaelin, Jr., M.D. — — 11,309
John C. Lechleiter, Ph.D. 1,068,402 5 — 106,625
Juan R. Luciano — — 2,039
Jan M. Lundberg, Ph.D. 156,219 — 36,252
Ellen R. Marram 1,000 — 49,215
Franklyn G. Prendergast, M.D., Ph.D. — — 67,355
Derica W. Rice 424,905 6 — 40,518
David A. Ricks 109,620 — 26,822
Marschall S. Runge, M.D., Ph.D. — — 7,222
Kathi P. Seifert 3,533 — 61,594
Jackson P. Tai 42,141 — 6,707All directors and EOs as a group (28 people)7: 2,762,123 — 816,332
1 The sum of the "Shares Owned" and "Options Exercisable/Stock Units Distributable Within 60 Days" columns represents the shares considered "beneficially owned" for purposes of disclosure in the proxy statement. Unless otherwise indicated in a footnote, each person listed in the table possesses sole voting and sole investment power with respect to their shares. No person listed in the table owns more than 0.1 percent of the outstanding common stock of the company. All directors and EOs as a group own approximately 0.2 percent of the outstanding common stock of the company.
2 This column includes the number of shares of common stock held individually as well as the number of 401(k) Plan shares held by the beneficial owners indirectly through the 401(k) Plan.
3 This column sets forth RSUs that vest within 60 days.4 For the EOs, this column reflects RSUs that will not vest within 60 days. For the independent directors, this
column includes the number of stock units credited to the directors' accounts in the Lilly Directors' Deferral Plan.
5 The shares shown for Dr. Lechleiter include 62,582 shares that are owned by a family foundation for which he is a director. Dr. Lechleiter has shared voting power and shared investment power with respect to the shares held by the foundation. Also included are 6,468 shares held in family trusts. Pursuant to the terms of the trusts, Dr. Lechleiter has shared investment power and no voting power over the shares held in the trusts.

PROX
Y STA
TEME
NT
P33P33
6 The shares shown for Mr. Rice include 11,596 shares that are owned by a family foundation for which he is a director. Mr. Rice has shared voting power and shared investment power with respect to the shares held by the foundation.
7 Carolyn R. Bertozzi, Ph.D., joined the board in February 2017, and currently does not beneficially own any shares.
Principal Holders of Stock To the best of the company’s knowledge, the only beneficial owners of more than 5 percent of the outstanding shares of the company’s common stock, as of December 31, 2016, are the shareholders listed below:
Name and AddressNumber of Shares Beneficially Owned Percent of Class
Lilly Endowment Inc. (the Endowment)2801 North Meridian StreetIndianapolis, Indiana 46208
125,575,804 11.4%
The Vanguard Group100 Vanguard Blvd.Malvern, PA 19355
66,415,305 6.0%
BlackRock, Inc.55 East 52nd StreetNew York, New York 10055
62,755,539 5.7%
PRIMECAP Management Company177 E. Colorado Boulevard, 11th FloorPasadena, CA 91105
57,501,098 5.2%
Wellington Management Company, LLP280 Congress StreetBoston, MA 02210
56,814,140 5.2%
The Endowment has sole voting and sole dispositive power with respect to all of its shares. The Board of Directors of the Endowment is composed of N. Clay Robbins, chairman, president & chief executive officer; Mary K. Lisher; William G. Enright; Daniel P. Carmichael; Charles E. Golden; Eli Lilly II; David N. Shane; Craig Dykstra; and Jennett M. Hill.
The Vanguard Group provides investment management services for various clients. It has sole voting power with respect to 1,522,948 of its shares and sole dispositive power with respect to 64,711,235 of its shares.
BlackRock, Inc. provides investment management services for various clients. It has sole voting power with respect to 54,096,413 of its shares and sole dispositive power with respect to 62,729,638 of its shares.
PRIMECAP Management Company acts as investment advisor to various clients. It has sole voting power with respect to 12,675,302 shares and sole dispositive power with respect to all of its shares.
Wellington Management Company, LLP provides investment management services for various clients. It has shared voting power with respect to 11,484,836 shares and shared dispositive power with respect to all of its shares.
CompensationItem 2. Advisory Vote on Compensation Paid to Named Executive Officers Section 14A of the Securities Exchange Act of 1934 provides the company's shareholders with the opportunity to approve, on an advisory basis, the compensation of the company's named executive officers as disclosed in the proxy statement. Our compensation philosophy is designed to attract and retain highly talented individuals and motivate them to create long-term shareholder value by achieving top-tier corporate

PROXY STATEMENT P34P34
performance while embracing the company’s values of integrity, excellence, and respect for people.
The Compensation Committee and the Board of Directors believe that our executive compensation aligns well with our philosophy and with corporate performance. Executive compensation is an important matter for our shareholders. We routinely review our compensation practices and engage in ongoing dialog with our shareholders in order to ensure our practices are aligned with stakeholder interests and reflect best practices.
We request shareholder approval, on an advisory basis, of the compensation of the company’s named executive officers as disclosed in this proxy statement. As an advisory vote, this proposal is not binding on the company. However, the Compensation Committee values input from shareholders and will consider the outcome of the vote when making future executive compensation decisions.
Board Recommendation on Item 2
The Board of Directors recommends that you vote FOR the approval, on an advisory basis, of the compensation paid to the named executive officers, as disclosed pursuant to Item 402 of Regulation S-K, including the CD&A, the compensation tables, and related narratives provided below in this proxy statement.
Compensation Discussion and Analysis (CD&A) This CD&A describes our executive compensation philosophy, the Compensation Committee's process for setting executive compensation, the elements of our compensation program, the factors the committee considered when setting executive compensation in 2016, and how the company's results affected incentive payouts for 2016 performance.
Say-on-Pay Results for 2016At last year's annual meeting, more than 98 percent of the shares cast voted in favor of the company's Say-on-Pay proposal on executive compensation. Management and the Compensation Committee view this vote as supportive of the company's overall approach toward executive compensation.
Our Philosophy on CompensationAt Lilly, our mission is to make medicines that help people live longer, healthier, more active lives. In order to accomplish our mission, we must attract, engage, and retain highly talented individuals who are committed to the company's core values of integrity, excellence, and respect for people. Our compensation programs are designed to help us achieve these goals while balancing the long-term interests of our shareholders and customers.
ObjectivesOur compensation and benefits programs are based on the following objectives:
• Reflect individual and company performance. We reinforce a high-performance culture by linking pay with individual performance and company performance. As employees assume greater responsibilities, the proportion of total compensation based on company performance and shareholder returns increases. We perform an annual review to ensure the programs provide incentives to deliver long-term, sustainable business results while discouraging excessive risk-taking or other adverse behaviors.
• Attract and retain talented employees. Compensation opportunities should be competitive with our peer group and reflect the level of job impact and responsibilities. Retention of talent is an important factor in the design of our compensation and benefit programs.

PROX
Y STA
TEME
NT
P35P35
• Implement broad-based programs. While the amount of compensation paid to employees varies, the overall structure of our compensation and benefit programs is broadly similar across the organization to encourage and reward all employees who contribute to our success.
• Consider shareholder input. Management and the Compensation Committee consider the results of our annual Say-on-Pay vote and other sources of shareholder feedback when designing compensation and benefit programs.
Compensation Committee's Processes and AnalysesProcess for setting compensationThe Compensation Committee considers the following in determining executive compensation:
• Assessment of the executive's individual performance and contribution. • CEO: Generally, the independent directors, under the direction of the lead director, meet with the
CEO at the beginning of each year to agree upon the CEO's performance objectives for the year. At the end of the year, the independent directors meet to assess the CEO's achievement of those objectives along with other factors, including contribution to the company's performance and ethics and integrity. The year-end evaluation is used in setting the CEO's compensation for the next year. In June 2016, David A. Ricks was appointed to serve as CEO, effective January 1, 2017. His compensation for the role of President and CEO was set at the time of his appointment.
• Other Executive Officers (EOs): The committee receives individual performance assessments and compensation recommendations from the CEO and exercises its judgment based on the board's knowledge and interactions with the EOs. Each EO's performance assessment is based on achievement of objectives established between such EO and the CEO at the start of the year, as well as other factors, including the demonstration of Lilly values and leadership behaviors. For new EOs, compensation is set at time of promotion or offer.
• Assessment of company performance. The Compensation Committee considers company performance in two ways:• As a factor in establishing potential compensation for the coming year, the committee considers
overall company performance during the prior year across a variety of metrics.• To determine payouts under the cash and equity incentive programs, the committee establishes
specific company performance goals related to revenue, earnings per share (EPS), progress of our pipeline portfolio, stock price growth, and Total Shareholder Return (TSR) relative to our peer companies.
• Peer-group analysis. The committee uses peer-group data as a market check for compensation decisions, but does not use this data as the sole basis for its compensation targets. The company does not target a specific position within that range of market data.
• Input from an independent compensation consultant concerning executive pay. The role of the independent compensation consultant is described in more detail under the "Compensation Committee Matters" section that follows the CD&A.
Competitive pay assessmentOur peer group is comprised of companies that directly compete with us, operate in a similar business model, and employ people with the unique skills required to operate an established biopharmaceutical company. The committee selects a peer group whose median market cap and revenues are broadly similar to Lilly. The committee reviews the peer group at least every three years. The committee reviewed the peer group in 2015. The committee removed Allergan (acquired by Actavis Plc) and replaced Abbott with Shire Plc, lowering the peer group median revenues and market cap. The peer group referenced in December 2015 when assessing competitive pay included: Abbvie, Amgen, AstraZeneca, Baxter, Biogen, Bristol-Myers Squibb, Celgene, Gilead, GlaxoSmithKline, Hoffman-La Roche, Johnson & Johnson, Medtronic, Merck, Novartis,
PROXY STATEMENT P36P36
Pfizer, Sanofi-Aventis, and Shire Plc. With the exception of Johnson & Johnson, Novartis, and Pfizer, peer companies were no greater than three times our size with regard to both measures. The committee included these three companies despite their size because they compete directly with Lilly, have similar business models, and seek to hire from the same pool of management and scientific talent. In the aggregate, the company’s total compensation to named executive officers, when reviewed at the end of 2015, was in the middle range of the peer group.
Components of Our Compensation Our executive compensation has three components: (1) base salary; (2) annual cash bonus, which is calculated based on company's performance relative to internal targets for revenue, earnings per share (EPS), and the progress of the pipeline; and (3) two different forms of equity incentives: (i) Performance Awards (PAs)—equity awards vesting over three years, with a performance component measuring the company's two-year growth in EPS relative to the expected peer group growth followed by a 13-month service-vesting period; and (ii) Shareholder Value Awards (SVAs)—performance-based equity awards that pay out based on absolute company stock price growth and total shareholder return (TSR) relative to peers, both measured over a three-year period, followed by a one-year holding period. Executives also receive a company benefits package, described below under "Other Compensation Practices and Information - Employee Benefits."
Adjustments to reported financial resultsThe Compensation Committee has authority to adjust the reported revenue and EPS on which incentive compensation payouts are determined in order to eliminate the distorting effect of unusual income or expense items. These items may impact year-over-year growth percentages or improve comparability with peer companies. The committee considers the adjustments approved by the Audit Committee for reporting non-GAAP EPS and other adjustments, based on guidelines approved by the committee prior to the performance period. Further details on the adjustments for 2016 and the rationale for making these adjustments are set forth in Appendix A, "Summary of Adjustments Related to the Annual Cash Bonus and Performance Award." For ease of reference, throughout the CD&A and the other compensation disclosures we refer simply to "revenue" and "EPS" but we encourage you to review the information in Appendix A to understand the adjustments from GAAP revenue and EPS that were approved.
1. Base Salary
Base salaries are reviewed and established annually, and may also be adjusted upon promotion, following a change in job responsibilities, or to maintain market competitiveness. Salaries are based on each person's level of contribution, responsibility, and expertise, along with peer group data.
Annual base salary increases are established based upon a corporate budget for salary increases, which is set considering company performance over the prior year, expected company performance for the following year, and general external trends. In setting salaries, the Compensation Committee seeks to retain, motivate, and reward successful performers while maintaining affordability within the company's business plan.
2. Annual Cash Bonus
The Eli Lilly and Company Bonus Plan (Bonus Plan) is designed to reward successful achievement of the company's financial plans and pipeline objectives for the year. The bonus is based on company performance in three areas over the course of the year, relative to internal targets: (1) revenue; (2) EPS; and (3) pipeline progress.
Company performance goals and individual bonus targets are set at the beginning of each year, and actual bonuses can range from 0 to 200 percent of an individual's bonus target. In establishing performance goals, the Compensation Committee references the annual operating plan. Each year, the committee reviews the relative weighting for each of the factors. The 2016 weightings remained unchanged from the prior year:

PROX
Y STA
TEME
NT
P37P37
Goal WeightingRevenue performance 25%EPS performance 50%Pipeline progress 25%
Based on this weighting, the company bonus multiple is calculated as follows:
(0.25 x revenue multiple) + (0.50 x EPS multiple) + (0.25 x pipeline multiple) = company bonus multiple
Multiples for each performance goal can range from 0—2.0.
The annual cash bonus payout is calculated as follows:
company bonus multiple x individual bonus target x base salary earnings = payout
To preserve tax deductibility of bonus payouts, EOs are subject to the Executive Officer Incentive Plan (EOIP), which sets limits on allowable bonus amounts. Under the EOIP, the maximum annual cash bonus allowable is calculated based on non-GAAP net income (generally described in "Adjustments to Reported Results" in Appendix A to this proxy statement) for the year. For the CEO, the maximum bonus award is 0.3 percent of non-GAAP net income. For other EOs, the maximum amount is 0.15 percent of non-GAAP net income. EOs will not receive any annual cash bonus payments unless the company has a positive non-GAAP net income for the year.
Once the maximum payout for an EO is determined, the Compensation Committee has the discretion to reduce (but not increase) the amount of the annual cash bonus to be paid. In exercising this discretion, the committee intends to award EOs the lesser of (i) the bonuses they would have received under the Bonus Plan or (ii) the EOIP maximum bonuses.
3. Equity Incentives
The company grants two types of equity incentives to EOs—PAs and SVAs. The PAs are designed to focus company leaders on multiyear operational performance relative to peer companies. The SVAs align earned compensation with long-term growth in shareholder value and relative performance within our industry. The Compensation Committee has the discretion to adjust downward (but not upward) any EO's equity award payout from the amount yielded by the applicable formula.
Performance AwardsPAs vest over three years. Potential shares are earned based on achieving EPS growth targets over a two-year performance period, followed by an additional 13-month service-vesting period in the form of restricted stock units ("RSUs"). The growth-rate targets are set relative to the median expected EPS growth for the peer group. These awards do not accumulate dividends during the two-year performance period, but do accumulate dividends during the service-vesting period.
The Compensation Committee believes EPS growth is an effective measure of operational performance because it is closely linked to shareholder value, is broadly communicated to the public, is easily understood by employees, and allows for objective comparisons to peer group performance. Consistent with our compensation objectives, company performance exceeding the expected peer group median will result in above-target payouts, while company performance lagging the expected peer group median will result in below-target payouts. Possible payouts range from 0 to 150 percent of the target depending on EPS growth over the performance period.
The measure of EPS used in the PA program differs from the measure used in our annual cash bonus program in two ways. First, the target EPS goal in the bonus program is set with reference to internal goals
PROXY STATEMENT P38P38
that align to our annual operating plan for the year, while the target EPS goal in the PA program is set relative to expected growth rates among our peer group. Second, the bonus program measures EPS over a one-year period, while the PA program measurers EPS over a two-year period. In a given year, as seen in prior years, the bonus program may pay out above target while the PA pays at threshold (or vice versa).
Shareholder Value AwardsSVAs are earned based on Lilly's share price (and beginning in 2016, relative TSR performance). SVAs have a three-year performance period, and any shares paid out are subject to a one-year holding requirement. No dividends are accrued during the performance period. SVAs pay out above target if Lilly stock outperforms an expected compounded annual rate of return and below target if company stock underperforms that rate of return. The expected rate of return includes dividends and is based on the three-year TSR that a reasonable investor would consider appropriate for investing in a basket of large-cap U.S. companies, as determined by the Compensation Committee. The target share price is based on this expected rate of return less the company’s dividend yield, applied to the starting share price. EOs receive no payout if Lilly's TSR for the three-year period is zero or negative.
Possible payouts based on share price growth goals (prior to applying the applicable modifier described below) range from 0 to 150 percent of the target amount, depending on stock performance over the period.
Beginning with the 2016-2018 SVA award, a modifier based on Lilly's three-year cumulative TSR relative to our peer companies' median TSR performance will be applied to payouts for EOs. If Lilly's TSR is above the median of our peers, the payout is increased by 1 percent for every percentage point Lilly's TSR exceeds the median (up to a maximum of 20 percent). Likewise, if Lilly's TSR is below our peers' median, the payout will be reduced by up to a maximum of 20 percent. The committee added the relative TSR modifier to the SVA program because it ensures senior leaders' rewards align with shareholder experience while encouraging strong performance within the industry.
Pay for Performance The mix of compensation for the CEO and other named executive officers (NEO) reflects our desire to link executive compensation with company performance. As reflected in the charts below, a substantial portion of the target pay for all named executive officers is performance-based. Both the annual cash bonus and equity payouts are contingent upon company performance, with the bonus factoring in performance over a one-year period, and equity compensation factoring in performance over a longer term (as described above under "Components of Our Compensation - 3. Equity Incentives").

PROX
Y STA
TEME
NT
P39P39
2016 Target Total Compensation Performance Review ProcessIn setting potential EO compensation for 2016, the Compensation Committee considered both individual and company performance during 2015.
2015 Individual NEO PerformanceA summary of the committee's review of the individual NEOs is provided below:
Dr. John Lechleiter: In accordance with the company’s Corporate Governance Guidelines, the independent directors conducted a review of Dr. Lechleiter’s performance during 2015, which was provided to the Compensation Committee during a private session. Under Dr. Lechleiter’s leadership, the company increased its growth prospects in the medium and long term and drove near-term volume growth, attributable to new products including Cyramza, Trulicity®, and Jardiance. In 2015, the company launched Basaglar and Portrazza®, following the successful launch of three new molecular entities (NMEs) in 2014. In addition, the company achieved the successful integration of Novartis Animal Health and led an initiative to improve the efficiency and sustainability of the company’s research and development process. Dr. Lechleiter continued to set a positive tone of integrity, inclusiveness, safety, and compliance in his internal and external interactions.
Derica Rice: Mr. Rice demonstrated strong leadership of our portfolio management in partnership with Dr. Lundberg. The committee noted the portfolio review process is far more robust than in past years. His function met very difficult financial targets while continuing to provide outstanding support to the business.
Jan Lundberg: Dr. Lundberg led Lilly Research Laboratories positive pipeline progression, including regulatory approvals for Cyramza in 2nd-line gastric cancer in Japan and 2nd-line metastatic colorectal cancer in the U.S., Trulicity in Japan, Humalog® U-200 Kwikpen, and Glyxambi® in the U.S., and Synjardy® in the U.S. and Europe. In addition, regulatory submissions were completed for Taltz and all planned Phase 3 trial starts were achieved.
Dr. Lundberg played a key leadership role in reorganizing external research. He sponsored the expansion of our research capabilities in San Diego and Boston and progressed our next-generation development strategy.

PROXY STATEMENT P40P40
Michael Harrington: Mr. Harrington provided thoughtful counsel on a variety of issues including commercial practices, pricing, intellectual property policy, and several other areas. He was instrumental in several successful negotiations with external parties, and the company prevailed in several patent lawsuits including Alimta® in the U.S. and Europe.
Enrique Conterno: Under Mr. Conterno's leadership, the Diabetes business had a very strong year beating revenue and earnings targets. The business successfully launched several new products in the U.S. (Trulicity, Humalog U-200 Kwikpen, Glyxambi, and Synjardy). Mr. Conterno drove improvements in manufacturing our insulin products and forged strong partnerships with other functions.
Target Compensation
The information in the section below reflects target total compensation for NEOs for 2016. The actual payouts made to the named executive officers in the form of the 2016 annual cash bonus and equity awards granted in prior years and vesting in 2016 are summarized in the next section, under "2016 Compensation Payouts."
Rationale for Changes to NEO Target Compensation The committee established 2016 target total compensation opportunities for each NEO based on the NEO's 2015 performance, internal relativity, and peer-group data. The committee determined that an increase to Dr. Lechleiter’s total compensation was appropriate given overall company results and his strong leadership over several years. The committee decided his increase should be delivered entirely in performance-based equity, leaving his base salary and bonus target unchanged from prior years and increasing the target value of his equity. For Dr. Lundberg, the committee believed his base salary was appropriate but increased his bonus target and equity award reflecting the strategic importance and impact of the R&D organization’s success. Messrs. Conterno, Harrington, and Rice received salary increases, aligned with the company's annual increase guidelines, and increases to their bonus targets, reflecting their contributions over time. In light of the Diabetes business's strong performance, Mr. Conterno also received an increase in his equity award.
Base SalaryThe following table outlines salary increases, if any, for each named executive approved by the committee in December 2015. Each executive's actual base salary earned during 2016 is reflected in the "Summary Compensation Table" in the "Executive Compensation" section of this proxy.
Name 2015 Annual Base Salary 2016 Annual Base Salary Increase (effective March 1, 2016)
Dr. Lechleiter $1,500,000 $1,500,000 —
Mr. Rice $1,050,300 $1,071,306 2%
Dr. Lundberg $1,007,855 $1,007,855 —
Mr. Harrington $788,000 $835,280 6%
Mr. Conterno $710,205 $731,511 3%
Annual Cash Bonus TargetsBased on a review of internal relativity, peer data, and individual performance, the committee decided to increase bonus targets for all NEOs in 2016, except Dr. Lechleiter, based on the rationale described above. Bonus targets are shown in the table below as a percentage of base salary earnings:
Name 2015 Bonus Target 2016 Bonus TargetDr. Lechleiter 150% 150%Mr. Rice 90% 100%Dr. Lundberg 90% 100%Mr. Harrington 75% 80%Mr. Conterno 75% 80%
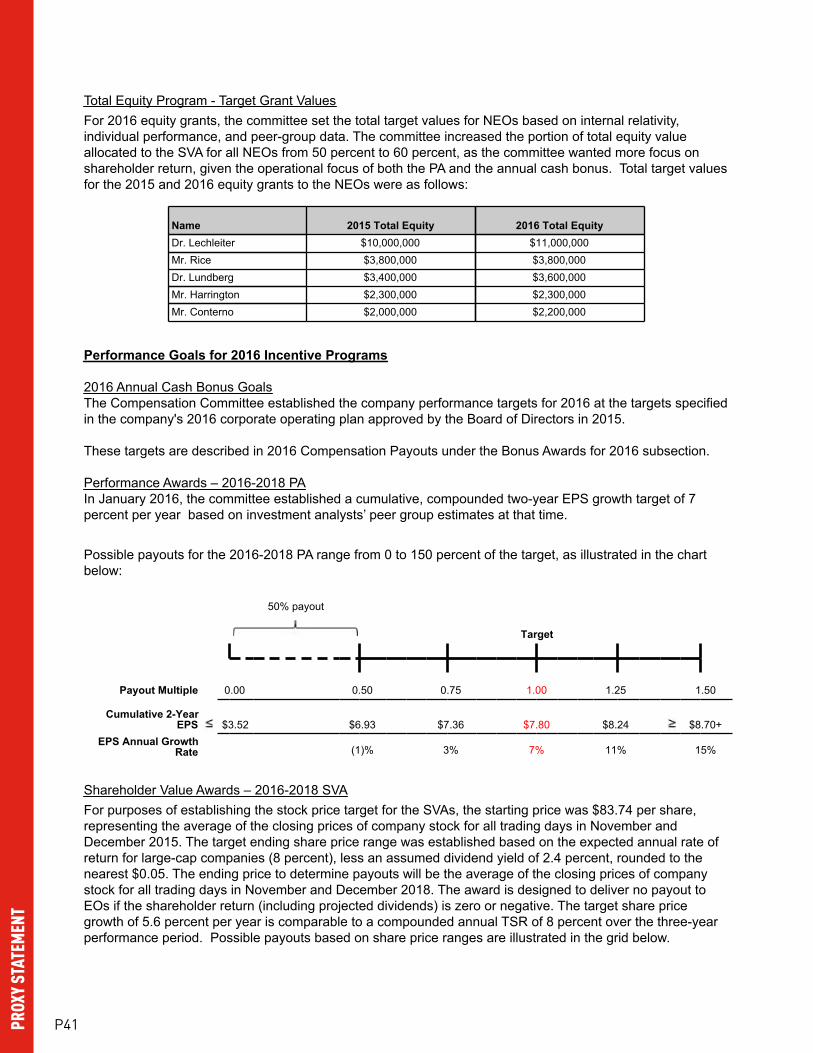
PROX
Y STA
TEME
NT
P41P41
Total Equity Program - Target Grant ValuesFor 2016 equity grants, the committee set the total target values for NEOs based on internal relativity, individual performance, and peer-group data. The committee increased the portion of total equity value allocated to the SVA for all NEOs from 50 percent to 60 percent, as the committee wanted more focus on shareholder return, given the operational focus of both the PA and the annual cash bonus. Total target values for the 2015 and 2016 equity grants to the NEOs were as follows:
Name 2015 Total Equity 2016 Total EquityDr. Lechleiter $10,000,000 $11,000,000Mr. Rice $3,800,000 $3,800,000Dr. Lundberg $3,400,000 $3,600,000Mr. Harrington $2,300,000 $2,300,000Mr. Conterno $2,000,000 $2,200,000
Performance Goals for 2016 Incentive Programs
2016 Annual Cash Bonus Goals The Compensation Committee established the company performance targets for 2016 at the targets specified in the company's 2016 corporate operating plan approved by the Board of Directors in 2015.
These targets are described in 2016 Compensation Payouts under the Bonus Awards for 2016 subsection.
Performance Awards – 2016-2018 PA In January 2016, the committee established a cumulative, compounded two-year EPS growth target of 7 percent per year based on investment analysts’ peer group estimates at that time.
Possible payouts for the 2016-2018 PA range from 0 to 150 percent of the target, as illustrated in the chart below:
50% payout
Target
Payout Multiple 0.00 0.50 0.75 1.00 1.25 1.50
Cumulative 2-YearEPS $3.52 $6.93 $7.36 $7.80 $8.24 $8.70+
EPS Annual GrowthRate (1)% 3% 7% 11% 15%
Shareholder Value Awards – 2016-2018 SVAFor purposes of establishing the stock price target for the SVAs, the starting price was $83.74 per share, representing the average of the closing prices of company stock for all trading days in November and December 2015. The target ending share price range was established based on the expected annual rate of return for large-cap companies (8 percent), less an assumed dividend yield of 2.4 percent, rounded to the nearest $0.05. The ending price to determine payouts will be the average of the closing prices of company stock for all trading days in November and December 2018. The award is designed to deliver no payout to EOs if the shareholder return (including projected dividends) is zero or negative. The target share price growth of 5.6 percent per year is comparable to a compounded annual TSR of 8 percent over the three-year performance period. Possible payouts based on share price ranges are illustrated in the grid below.

PROXY STATEMENT P42P42
Ending Stock Price Less than$77.51 $77.51-$88.02 $88.03-
$98.54 $98.55-$109.06
$109.07-$119.58
Greater than$119.58
Compounded AnnualShare Price GrowthRate (excludingdividends)
Less than(2.5%) (2.5%)-1.7% 1.7-5.6% 5.6%-9.2% 9.2%-12.6% Greater than
12.6%
Percent of Target 0% 50% 75% 100% 125% 150%
EO awards are subject to a relative TSR modifier, which is applied to the payout indicated by the grid below. The number of shares to be paid will increase or decrease by 1 percent for every percentage point Lilly's three-year TSR deviates from our peer group's median three-year TSR, capped at 20 percent.
2016 Compensation PayoutsThe information in this section reflects the amounts paid to NEOs for the 2016 annual cash bonus and payouts from equity awards granted in prior years for which the relevant performance period ended in 2016.
2016 Company Performance - CompensationFor 2016, the company exceeded its revenue target with annual revenues of $21.2 billion. The company fell short of its EPS target, with EPS of $3.52. The company also made significant progress on its pipeline, meeting or exceeding most targets for pipeline progress, highlighted by regulatory approval for Lartruvo and Taltz, along with 19 other new approvals, indications, or line extensions during 2016.
Bonus Award for 2016The company's 2016 performance compared to targets for revenue, EPS, and pipeline progress, as well as the resulting bonus multiple, is illustrated below.
2016 CorporateTarget Adjusted Results Multiple¹
Revenue $20.6 billion $21.2 billion 1.33EPS $3.55 $3.52 0.91Pipeline score 3 4.08 1.54Resulting Bonus Multiple 1.17
¹Performance goal multiples are capped at 2.0.

PROX
Y STA
TEME
NT
P43P43
The Science and Technology Committee assessed the company's progress toward achieving product pipeline goals at 4.08 (on a scale of 1 to 5) including:
• 2 new molecular entity (NME) product approvals versus a goal of 2, and 19 other significant approvals versus a goal of 12.
• 1 NME entering into Phase 3 versus a goal of 2 entrants.• 12 NMEs entering into Phase 1 versus a goal of 9-11 entrants.• 4 new indications or line extensions (NILEX) entering into Phase 3 versus a goal of 4-5 entrants.• exceeded targets for Speed to Launch: project plans across the portfolio reflected faster time to
launch than industry benchmarks scoring a 4 of 5; progressed projects in the portfolio faster than planned timelines scoring a 5 of 5.
• subjective assessment of the quality of the pipeline, considering many factors—awarded a score of 4 of 5, recognizing a strong year for innovation.
Based on the recommendation of the Science and Technology Committee, the Compensation Committee certified a pipeline score of 4.08, resulting in a pipeline multiple of 1.54.
Combined, the revenue, EPS, and pipeline progress multiples yielded a bonus multiple of 1.17.
(0.25 x 1.33) + (0.50 x 0.91) + (0.25 x 1.54) = 1.17 bonus multiple
The cash bonus amounts paid to NEOs for 2016 are reflected in the "Summary Compensation Table" below.
Equity Award Performance Periods Ending in 2016
2015-2017 Performance Award The target cumulative EPS for the 2015-2017 PA was set in the first quarter of 2015 reflecting expected industry growth of 1.0 percent each year over the two-year performance period of 2015-2016. The company's annual EPS growth for the two-year period was 7.9 percent, reflecting the positive contribution of our newer products as we return to a period of growth.
The company's performance compared to target (and the resulting multiple) for the 2015-2017 PA is reflected in the charts below.

PROXY STATEMENT P44P44
For the NEOs, the number of shares subject to an additional 13-month service-vesting period under the 2015-2017 PA is reflected in the table below (this information is also included in footnote 5 to the "Outstanding Equity Awards" table in the "Executive Compensation" section below):
Name Target Shares RSUs EarnedDr. Lechleiter 71,083 106,625Mr. Rice 27,012 40,518Dr. Lundberg 24,168 36,252Mr. Harrington 16,349 24,524Mr. Conterno 14,217 21,326
2014-2016 Shareholder Value AwardThe target stock price of $56.95 for the 2014-2016 SVA was set in January 2014 based on a beginning stock price of $50.42, which was the average closing price for Lilly stock for all trading days in November and December 2013. The ending stock price of $72.15 represents stock price growth of approximately 43 percent over the relevant three-year period. The company's performance compared to target (and the resulting payout multiple) for the 2014-2016 SVA is shown below.

PROX
Y STA
TEME
NT
P45P45
The shares paid to NEOs during 2016 for the 2014-2016 SVA were as follows:
Name Target Shares Shares Paid OutDr. Lechleiter 122,984 172,178Mr. Rice 51,927 72,698Dr. Lundberg 40,995 57,393Mr. Harrington 25,963 36,348Mr. Conterno 27,330 38,262
Other Compensation Practices and Information
Employee Benefits
The company offers core employee benefits coverage to: • provide our workforce with a reasonable level of financial support in the event of illness or injury; • provide post-retirement income; and• enhance productivity and job satisfaction through benefit programs that focus on overall well-being.
The benefits available are the same for all U.S. employees and include medical and dental coverage, disability insurance, and life insurance. In addition, The Lilly Employee 401(k) plan (401(k) Plan) and The Lilly Retirement Plan (the Retirement Plan) provide U.S. employees a reasonable level of retirement income reflecting employees’ careers with the company. To the extent that any employee’s retirement benefit exceeds Internal Revenue Service (IRS) limits for amounts that can be paid through a qualified plan, the company also offers a nonqualified pension plan and a nonqualified savings plan. These plans provide only the difference between the calculated benefits and the IRS limits, and the formula is the same for all U.S. employees. The cost of employee benefits is partially borne by the employee, including each EO.
Perquisites
The company provides very limited perquisites to EOs. The company does not generally allow personal use of the corporate aircraft; however the aircraft was made available for the personal use of Dr. Lechleiter, prior to his retirement, and for Mr. Ricks beginning in 2017, in very rare cases when the security and efficiency benefits to the company outweigh the expense. The company did not incur any expenses for personal use of its aircraft in 2016 by Dr. Lechleiter, and he received no other perquisites. Depending on seat availability,

PROXY STATEMENT P46P46
family members and personal guests of EOs may travel on the company aircraft to accompany EOs who are traveling on business. There is no incremental cost to the company for these trips.
The Lilly Deferred Compensation Plan
Members of senior management may defer receipt of part or all of their cash compensation under The Lilly Deferred Compensation Plan (Deferred Compensation Plan), which allows executives to save for retirement in a tax-effective way at minimal cost to the company. Under this unfunded plan, amounts deferred by the executive are credited at an interest rate of 120 percent of the applicable federal long-term rate, as described in more detail following the “Nonqualified Deferred Compensation in 2016” table.
Severance Benefits
Except in the case of a change in control of the company, the company is not obligated to pay severance to EOs upon termination of their employment; any such payments are at the discretion of the Compensation Committee.
The company has adopted change-in-control severance pay plans for nearly all employees, including the EOs. The plans are intended to preserve employee morale and productivity and encourage retention in the face of the disruptive impact of an actual or rumored change in control. In addition, the plans are intended to align executive and shareholder interests by enabling executives to evaluate corporate transactions that may be in the best interests of the shareholders and other constituents of the company without undue concern over whether the transactions may jeopardize the executives’ own employment.
Highlights of our change-in-control severance plansall regular employees are covereddouble trigger generally requiredno tax gross-upsup to two-year pay protection18-month benefit continuation
Although benefit levels may differ depending on the employee’s job level and seniority, the basic elements of the plans are comparable for all eligible employees:
• Double trigger. Unlike “single trigger” plans that pay out immediately upon a change in control, our plans generally require a “double trigger”—a change in control followed by an involuntary loss of employment within two years thereafter. This is consistent with the plan's intent to provide employees with financial protection upon loss of employment. A partial exception is made for outstanding PAs, a portion of which would be paid out upon a change in control on a pro-rated basis for time worked based on the forecasted payout level at the time of the change in control. This partial payment is appropriate because it is not possible to convert the company EPS targets into an award based on the surviving company’s EPS. Likewise, if Lilly is not the surviving entity, a portion of outstanding SVAs would be paid out on a pro-rated basis for time worked up to the change in control based on the merger price for company stock.
• Covered terminations. Employees are eligible for payments if, within two years of the change in control, their employment is terminated (i) without cause by the company or (ii) for good reason by the employee, each as is defined in the plan. See “Executive Compensation - Payments Upon Termination or Change in Control” for a more detailed discussion, including a discussion of what constitutes a change in control.
• Employees who suffer a covered termination receive up to two years of pay and 18 months of benefits protection. These provisions assure employees a reasonable period of protection of their income and core employee benefits.

PROX
Y STA
TEME
NT
P47P47
• Severance payment. Eligible terminated employees would receive a severance payment ranging from six months’ to two years’ base salary. Executives are all eligible for two years’ base salary plus two times the then-current year’s target bonus.
• Benefit continuation. Basic employee benefits such as health and life insurance would be continued for 18 months following termination of employment, unless the individual becomes eligible for coverage with a new employer. All employees would receive an additional two years of both age and years-of-service credit for purposes of determining eligibility for retiree medical and dental benefits.
• Accelerated vesting of equity awards. Any unvested equity awards would vest at the time of a covered termination.
• Excise tax. In some circumstances, the payments or other benefits received by the employee in connection with a change in control could exceed limits established under Section 280G of the Internal Revenue Code. The employee would then be subject to an excise tax on top of normal federal income tax. The company does not reimburse employees for these taxes. However, the amount of change in control-related benefits will be reduced to the 280G limit if the effect would be to deliver a greater after-tax benefit than the employee would receive with an unreduced benefit.
Share Ownership and Retention Guidelines; Prohibition on Hedging and Pledging SharesShare ownership and retention guidelines help to foster a focus on long-term growth. The CEO is required to own company stock valued at least six times annual base salary. The holding requirement for other EOs ranges from two to three times annual base salary depending on the position. Until the required number of shares is reached, the EO must retain 50 percent of shares net of taxes received from new equity payouts. Our executives have a long history of maintaining significant levels of company stock. As of December 31, 2016, Dr. Lechleiter held shares valued at approximately 59 times his annual salary. Mr. Ricks will retain at least 50 percent of net shares received from future equity payouts until he satisfies these guidelines. The following table shows the share requirements for each NEO:
Name Share Requirement Owns Required SharesDr. Lechleiter six times base salary YesMr. Rice three times base salary YesDr. Lundberg three times base salary YesMr. Harrington three times base salary YesMr. Conterno three times base salary Yes
EOs are also required to hold all shares received from equity program payouts, net of acquisition costs and taxes, for at least one year, even once share ownership requirements have been met. For PAs, this holding requirement is met by the 13-month service-vesting period that applies after the end of the performance period.
Non-employee directors and employees are not permitted to hedge their economic exposures to company stock through short sales or derivative transactions. Non-employee directors and all members of senior management are prohibited from pledging any company stock (i.e., using company stock as collateral for a loan or trading shares on margin).
Executive Compensation Recovery Policy All incentive awards are subject to forfeiture upon termination of employment prior to the end of the performance or vesting period or for disciplinary reasons. In addition, the Compensation Committee has adopted an executive compensation recovery policy, that gives the Compensation Committee broad discretion to claw back incentive payouts from any member of senior management (approximately 160 employees) whose misconduct results in a material violation of law or company policy that causes significant

PROXY STATEMENT P48P48
harm to the company or who fails in his or her supervisory responsibility to prevent such misconduct by others.
Additionally, the company can recover all or a portion of any EO incentive compensation in the case of materially inaccurate financial statements or material errors in the performance calculation, whether or not they result in a restatement and whether or not the EO has engaged in wrongful conduct.
The recovery policy covers any incentive compensation awarded or paid to an employee at a time when he or she is a member of senior management. Subsequent changes in status, including retirement or termination of employment, do not affect the company’s rights to recover compensation under the policy. Recoveries under the plan can extend back as far as three years.
Looking Ahead to 2017 Compensation Lilly's board of directors unanimously elected David A. Ricks to assume the role of president and chief executive officer. He became president, chief executive officer, and a director on January 1, 2017, and will become chairman of the board on June 1, 2017.
In connection with his appointment as president and chief executive officer, Mr. Ricks will receive a base salary of $1.4 million and will be eligible for an annual cash bonus with a target value of 150 percent of base salary. Mr. Ricks received an equity award in February 2017 as part of the company's annual equity incentive program with a grant value of $8.5 million. One hundred percent of this grant value was delivered in the form of performance based equity: 60 percent in SVAs and 40 percent in PAs. He does not receive any compensation for his service as a director of the company.
Beginning with 2017 grants, the treatment of performance-based equity awards (Performance Awards and Shareholder Value Awards) in the event of a change-in-control require a “double trigger” (a change-in-control occurs plus termination of employment) to pay. Accrued performance will be used to determine the number of shares earned under the award. The awards will convert to restricted stock units that continue to vest with the new company. They will payout upon the earlier of the completion of the original award period or upon a covered termination.

PROX
Y STA
TEME
NT
P49P49
Executive Compensation
Summary Compensation Table
Name and PrincipalPosition Year
Salary($)
Bonus($)
Stock Awards
($) 1Option Awards
($)
Non-Equity Incentive Plan Compensation
($) 2Change in
Pension Value($) 3
All Other Compensation
($) 4Total
Compensation($)
John C. Lechleiter,Ph.D. 2016 $1,500,000 $0 $11,000,000 $0 $2,632,500 $3,144,633 $90,000 $18,367,133Chairman, President, andChief Executive Officer
2015 $1,500,000 $0 $11,350,000 $0 $3,622,500 $0 5 $90,000 $16,562,500
2014 $1,500,000 $0 $6,750,000 $0 $1,785,000 $4,356,142 $90,000 $14,481,142Derica W. Rice 2016 $1,067,805 $0 $3,800,000 $0 $1,249,332 $1,739,429 $64,068 $7,920,634Executive Vice President,Global Services, andChief Financial Officer
2015 $1,045,200 $0 $4,313,000 $0 $1,514,495 $0 5 $62,712 $6,935,407
2014 $1,019,700 $0 $2,850,000 $0 $780,071 $2,023,458 $61,182 $6,734,411Jan M. Lundberg,Ph.D. 2016 $1,007,855 $0 $3,600,000 $0 $1,179,190 $627,381 $60,471 $6,474,897Executive Vice President,Science and Technology, and President, Lilly Research Laboratories
2015 $1,007,855 $0 $3,859,000 $0 $1,460,382 $390,645 5 $60,471 $6,778,353
2014 $1,007,855 $0 $2,250,000 $0 $771,009 $517,761 $60,471 $4,607,096Michael J.Harrington 2016 $827,400 $0 $2,300,000 $0 $774,446 $1,441,954 $49,644 $5,393,444Senior Vice President andGeneral Counsel
2015 $784,167 $0 $2,610,500 $0 $946,881 $391,899 5 $47,050 $4,780,4972014 $765,000 $0 $1,425,000 $0 $487,688 $1,330,586 $45,900 $4,054,174
Enrique A.Conterno 2016 $727,960 $0 $2,200,000 $0 $681,371 $935,408 $43,678 $4,588,417Senior Vice President andPresident, Lilly Diabetes
2015 $705,653 $0 $2,270,000 $0 $852,075 $0 5 $42,339 $3,870,067
2014 $682,890 $0 $1,500,000 $0 $435,342 $1,235,839 $40,973 $3,895,044
1 This column shows the grant date fair value of PAs and SVAs computed in accordance with FASB ASC Topic 718. Values for awards subject to performance conditions (PAs) are computed based upon the probable outcome of the performance condition as of the grant date. The PA grant values included in the "Stock Awards" column are based on the probable payout outcome anticipated at the time of grant, which was different from the target value in 2014 and 2015. For purposes of comparison, the supplemental table below shows the total target grant values approved by the committee:
Name 2014 Total Equity 2015 Total Equity 2016 Total EquityDr. Lechleiter $9,000,000 $10,000,000 $11,000,000Mr. Rice $3,800,000 $3,800,000 $3,800,000Dr. Lundberg $3,000,000 $3,400,000 $3,600,000Mr. Harrington $1,900,000 $2,300,000 $2,300,000Mr. Conterno $2,000,000 $2,000,000 $2,200,000
The table below shows the minimum, target, and maximum payouts (using the grant date fair value) for the 2016-2018 PA grant included in this column of the "Summary Compensation Table."
Name Payout Date Minimum Payout Target Payout Maximum PayoutDr. Lechleiter February 2019 $0 $4,400,000 $6,600,000Mr. Rice February 2019 $0 $1,520,000 $2,280,000Dr. Lundberg February 2019 $0 $1,440,000 $2,160,000Mr. Harrington February 2019 $0 $920,000 $1,380,000Mr. Conterno February 2019 $0 $880,000 $1,320,000

PROXY STATEMENT P50P50
2 This column shows payments under the bonus plan for performance in each of the respective years. All bonuses paid to NEOs were part of a non-equity incentive plan.
3 The amounts in this column reflect the change in pension value for each individual, calculated by our actuary, and are affected by additional service accruals and pay earned, as well as actuarial assumption changes. The changes in pension values in 2016 were driven to a large extent by a lower discount rate that increased the net present value of pensions. The design of the pension benefit did not change. See the Pension Benefits in 2016 table below for information about the standard actuarial assumptions used. No NEO received preferential or above-market earnings on deferred compensation.
4 The amounts in this column are solely company matching contributions for each individual's 401(k) plan and nonqualified savings plan contributions. The company does not reimburse executives for taxes outside of the limited circumstance of taxes related to employee relocation or a prior international assignment. There were no reportable perquisites or personal benefits.
5 In 2015, the net present value of the pension benefits for Mr. Conterno, Dr. Lechleiter, and Mr. Rice reflect no change from the previous year due to an increase in the discount rate over the prior year. For the other NEOs, increases in pensionable earnings along with an additional year of service partially offset the impact of the increased discount rate.
Grants of Plan-Based Awards During 2016 The compensation plans under which the grants in the following table were made are described in the CD&A and consist of the bonus plan (a non-equity incentive plan) and the 2002 Lilly Stock Plan (which provides for PAs, SVAs, and RSUs).
Name Award Grant Date2
CompensationCommitteeAction Date
Estimated Future PayoutsUnder Non-Equity
Incentive Plan Awards1
Estimated FuturePayouts Under EquityIncentive Plan Awards
All OtherStock orOption
Awards:Number
ofShares of
Stock,Options,or Units
Grant DateFair Valueof EquityAwards
Threshold($)
Target($)
Maximum($)
Threshold(# shares)
Target(# shares)
Maximum(# shares)
Dr. Lechleiter __ __ $56,250 $2,250,000 $4,500,000
2016-2018 PA 2/3/2016 3 12/14/2015 30,556 61,111 91,667 $4,400,000
2016-2018 SVA 2/3/2016 4 12/14/2015 64,218 160,545 288,982 $6,600,000
0
Mr. Rice __ __ $26,695 $1,067,805 $2,135,610
2016-2018 PA 2/3/2016 3 12/14/2015 10,556 21,111 31,667 $1,520,000
2016-2018 SVA 2/3/2016 4 12/14/2015 22,185 55,461 99,830 $2,280,000
0
Dr. Lundberg __ __ $25,196 $1,007,855 $2,015,710
2016-2018 PA 2/3/2016 3 12/14/2015 10,000 20,000 30,000 $1,440,000
2016-2018 SVA 2/3/2016 4 12/14/2015 21,017 52,542 94,576 $2,160,000
0
Mr. Harrington __ __ $16,548 $661,920 $1,323,840
2016-2018 PA 2/3/2016 3 12/14/2015 6,389 12,778 19,167 $920,000
2016-2018 SVA 2/3/2016 4 12/14/2015 13,427 33,568 60,422 $1,380,000
0
Mr. Conterno __ __ $14,559 $582,368 $1,164,736
2016-2018 PA 2/3/2016 3 12/14/2015 6,111 12,222 18,333 $880,000
2016-2018 SVA 2/3/2016 4 12/14/2015 12,844 32,109 57,797 $1,320,000
0
1 These columns show the threshold, target, and maximum payouts for performance under the bonus plan. Bonus payouts range from 0 to 200 percent of target. The bonus payment for 2016 performance was 117 percent of target, and is included in the “Summary Compensation Table” in the column titled “Non-Equity Incentive Plan Compensation.”

PROX
Y STA
TEME
NT
P51P51
2 To assure grant timing is not manipulated for employee gain, the annual grant date is established in advance by the Compensation Committee. Equity awards to new hires and other off-cycle grants are effective on the first trading day of the following month.
3 This row shows the possible payouts for 2016-2018 PA grants. This PA vests in February 2019, with the number of shares ranging from 0 to 150 percent of target. The grant-date fair value of the PA reflects the probable payout outcome anticipated at the time of grant, which was at target value.
4 This row shows the range of payouts for 2016-2018 SVA grants. This SVA will pay out in January 2019, with payouts ranging from 0 to 180 percent of target. We measure the fair value of the SVA on the grant date using a Monte Carlo simulation model.
To receive a payout under the PA or the SVA, a participant must remain employed with the company through the end of the relevant award period (except in the case of death, disability, retirement, or redundancy). No dividends accrue on either PAs or SVAs during the performance period. For the PA, non-preferential dividends accrue during the 13-month service-vesting period (following the two-year performance period) and are paid upon vesting.
Outstanding Equity Awards at December 31, 2016The 2016 closing stock price applied to the values in the table below was $73.55.
Stock Awards1
Name Award
Number ofShares or
Units of StockThat Have Not
Vested (#)
MarketValue of
Shares orUnits of
Stock ThatHave NotVested ($)
EquityIncentive Plan
Awards:Number ofUnearned
Shares, Units,or Other RightsThat Have Not
Vested (#)
EquityIncentive
Plan Awards:Market or
Payout Valueof Unearned
Shares, Units,or Other RightsThat Have Not
Vested ($)Dr. Lechleiter 2016-2018 SVA 96,502 2 $7,097,722
2015-2017 SVA 105,081 3 $7,728,708
2016-2018 PA 45,896 4 $3,375,651
2015-2017 PA 106,625 5 $7,842,269
2014-2016 PA 46,097 6 $3,390,434
Mr. Rice 2016-2018 SVA 99,830 2 $7,342,497
2015-2017 SVA 59,870 3 $4,403,439
2016-2018 PA 31,667 4 $2,329,108
2015-2017 PA 40,518 5 $2,980,099
2014-2016 PA 19,463 6 $1,431,504
Dr. Lundberg 2016-2018 SVA 94,576 2 $6,956,065
2015-2017 SVA 53,567 3 $3,939,853
2016-2018 PA 30,000 4 $2,206,500
2015-2017 PA 36,252 5 $2,666,335
2014-2016 PA 15,366 6 $1,130,169
Mr. Harrington 2016-2018 SVA 60,422 2 $4,444,038
2015-2017 SVA 36,236 3 $2,665,158
2016-2018 PA 19,167 4 $1,409,733
2015-2017 PA 24,524 5 $1,803,740
2014-2016 PA 9,732 6 $715,789
Mr. Conterno 2016-2018 SVA 57,796 2 $4,250,896
2015-2017 SVA 31,510 3 $2,317,561
2016-2018 PA 18,333 4 $1,348,392
2015-2017 PA 21,326 5 $1,568,527
2014-2016 PA 10,244 6 $753,446
RSU 20,000 7 $1,471,000
1 The chart no longer includes stock option awards because the company has not awarded stock options to employees since 2006 and there are no outstanding stock option awards.
2 SVAs granted for the 2016-2018 performance period will vest December 31, 2018. The number of shares reported reflects the maximum payout, which will be made if the average closing stock price in November and December

PROXY STATEMENT P52P52
2018 is over $119.58. Actual payouts may vary from 0 to 180 percent of target. Net shares from any payout must be held by EOs for a minimum of one year. Had the performance period ended December 31, 2016, there would not have been a payout.
3 SVAs granted for the 2015-2017 performance period will vest December 31, 2017. The number of shares reported reflects the maximum payout, which will be made if the average closing stock price in November and December 2017 is over $92.04. Actual payouts may vary from 0 to 140 percent of target. Net shares from any payout must be held by EOs for a minimum of one year. Had the performance period ended December 31, 2016, the payout would have been 60 percent of target.
4 This number represents the threshold value of PA shares that could pay out for 2016-2017 performance period, provided performance goals are met. Once the combined cumulative EPS result and associated payout level is determined at the end of the performance period, the associated number of shares are restricted stock units vesting in February 2019. Actual payouts may vary from 0 to 150 percent of target. The number of shares recorded in the table reflects the payout if the combined cumulative EPS for 2016 and 2017 is $8.70.
5 The performance period ending 2016 for the 2015-2017 PA resulted in a RSU for 150 percent of target shares. The RSU will vest in February 2018.
6 RSUs vested February 2017 from the 2014-2016 PA.
7 This grant was made in 2008 outside of the normal annual cycle and will vest on May 1, 2018.
Options Exercised and Stock Vested in 2016
Option Awards1 Stock Awards
NameNumber of Shares
Acquired on Exercise (#)
Value Realizedon Exercise ($)
Number of SharesAcquired on Vesting (#)
Value Realized on Vesting ($) 2
Dr. Lechleiter 0 $0
46,623 3 $3,687,879
172,178 4 $12,978,778Mr. Rice
0 $019,685 3 $1,557,084
72,698 4 $5,479,975Dr. Lundberg
0 $015,541 3 $1,229,293
57,393 4 $4,326,284Mr. Harrington
0 $09,066 3 $717,121
36,348 4 $2,739,912Mr. Conterno
0 $010,360 3 $819,476
38,262 4 $2,884,190
1 The chart no longer includes stock option awards because the company has not awarded stock options to employees since 2006 and there are no outstanding stock option awards.
2 Amounts reflect the market value of the stock on the day the stock vested.
3 RSUs resulting from the 2013-2015 PA vested in February 2016.
4 Payout of the 2014-2016 SVA at 140 percent of target.
Retirement Benefits We provide retirement income to eligible U.S. employees, including EOs, through the following plans: • The 401(k) Plan, a defined contribution plan qualified under Sections 401(a) and 401(k) of the Internal
Revenue Code. Participants may elect to contribute a portion of their base salary to the plan, and the company provides matching contributions on employees’ contributions up to 6 percent of base salary up to IRS limits. The employee contributions, company contributions, and earnings thereon are paid out in accordance with elections made by the participant. See the "All Other Compensation" column in the “Summary Compensation

PROX
Y STA
TEME
NT
P53P53
Table” for information about company contributions under the 401(k) Plan for the named executive officers. • The Retirement Plan, a tax-qualified defined benefit plan that provides monthly benefits to retirees. See the
“Pension Benefits in 2016” table below for additional information about the value of these pension benefits.
Sections 401 and 415 of the Internal Revenue Code generally limit the amount of annual pension that can be paid from a tax-qualified plan ($265,000 in 2016 and $270,000 in 2017) as well as the amount of annual earnings that can be used to calculate a pension benefit. However, since 1975 the company has maintained a nonqualified pension plan that pays retirees the difference between the amount payable under the Retirement Plan and the amount they would have received without the Internal Revenue Code limits. The nonqualified pension plan is unfunded and subject to forfeiture in the event of bankruptcy. Likewise the company maintains a nonqualified savings plan that allows participants to contribute up to 6 percent of base salary exceeding the IRS limit. The company matches these contributions as described for the 401(k) Plan. For more information, see footnote 3 to the Nonqualified Deferred Compensation in 2016 table. The following table shows benefits that the named executive officers have accrued under the Retirement Plan and the nonqualified pension plan.
Pension Benefits in 2016
Name PlanNumber of Years of
Credited ServicePresent Value of
Accumulated Benefit ($) 1Payments DuringLast Fiscal Year
($)Dr. Lechleiter 2 retirement plan (pre-2010) 30 $1,511,207
retirement plan (post-2009) 7 $256,136nonqualified plan (pre-2010) 30 $29,302,586
nonqualified plan (post-2009) 7 $4,550,732total $35,620,661 $0
Mr. Rice retirement plan (pre-2010) 20 $839,198retirement plan (post-2009) 7 $157,831
nonqualified plan (pre-2010) 20 $7,474,950nonqualified plan (post-2009) 7 $1,332,456
total $9,804,435 $0Dr. Lundberg retirement plan (post-2009) 7 $267,662
nonqualified plan (post-2009) 7 $2,118,618total $2,386,280 $0
Mr. Harrington retirement plan (pre-2010) 18 $797,055retirement plan (post-2009) 7 $172,355
nonqualified plan (pre-2010) 18 $3,454,679nonqualified plan (post-2009) 7 $725,032
total $5,149,121 $0Mr. Conterno retirement plan (pre-2010) 17 $714,937
retirement plan (post-2009) 7 $151,035nonqualified plan (pre-2010) 17 $3,520,850
nonqualified plan (post-2009) 7 $715,055total $5,101,877 $0
1 The following standard actuarial assumptions were used to calculate the present value of each individual’s accumulated pension benefit:
Discount rate: 4.50 percent for the qualified plan and 4.19 percent for the non-qualified plan
Mortality (post-retirement decrement only): RP2006 with generational projection using Scale MP2016Pre-2010 joint and survivor benefit (% of pension): 50% until age 62; 25% thereafterPost-2009 benefit payment form: life annuity
2 Dr. Lechleiter retired with full retirement benefits under the old plan formula (pre-2010 benefits) and qualified for early retirement under the new plan formula (post-2009 benefits) as described below.
PROXY STATEMENT P54P54
The Retirement Plan benefits shown in the table are net present values. The benefits are not payable as a lump sum; they are generally paid as a monthly annuity for the life of the retiree and, if elected, any qualifying survivor. The annual benefit under the retirement plan is calculated using years of service and the average of the annual earnings (salary plus bonus) for the highest five out of the last 10 calendar years of service (final average earnings). Post-2009 Plan Information: Following amendment of our Retirement Plan formulae, employees hired on or after February 1, 2008 have accrued retirement benefits only under the new plan formula. Employees hired before that date have accrued benefits under both the old and new plan formulae. All eligible employees, including those hired on or after February 1, 2008, can retire at age 65 with at least five years of service and receive an unreduced benefit. The annual benefit under the new plan formula is equal to 1.2 percent of final average earnings multiplied by years of service. Early retirement benefits under this plan formula are reduced 6 percent for each year under age 65. Transition benefits were afforded to employees with 50 points (age plus service) or more as of December 31, 2009. These benefits were intended to ease the transition to the new retirement formula for those employees who were closer to retirement or had been with the company longer at the time the plan was changed. For the transition group, early retirement benefits are reduced 3 percent for each year from age 65 to age 60 and 6 percent for each year under age 60. All named executive officers except Dr. Lundberg are in this transition group.
Pre-2010 Plan Information: Employees hired prior to February 1, 2008, accrued benefits under both plan formulae. For these employees, benefits that accrued before January 1, 2010, were calculated under the old plan formula. The amount of the benefit is calculated using actual years of service through December 31, 2009, while total years of service is used to determine eligibility and early retirement reductions. The benefit amount is increased (but not decreased) proportionately, based on final average earnings at termination compared to final average earnings at December 31, 2009. Full retirement benefits are earned by employees with 90 or more points (the sum of his or her age plus years of service). Employees electing early retirement receive reduced benefits as described below: • The benefit for employees with between 80 and 90 points is reduced by 3 percent for each year under
90 points or age 62. • The benefit for employees who have less than 80 points, but who reached age 55 and have at least 10 years
of service, is reduced as described above and is further reduced by 6 percent for each year under 80 points or age 65.
Nonqualified Deferred Compensation in 2016
Name Plan
Executive Contributions in Last Fiscal Year
($) 1
Registrant Contributions in Last Fiscal Year
($) 2
AggregateEarnings in
Last Fiscal Year($)
AggregateWithdrawals/
Distributions inLast Fiscal Year
($)
Aggregate Balance at Last Fiscal Year End
($) 3
Dr. Lechleiter nonqualified savings $74,100 $74,100 $29,286 $0 $3,644,437
deferred compensation $905,625 $455,090 $15,103,882
total $979,725 $74,100 $484,376 $0 $18,748,319
Mr. Rice nonqualified savings $48,168 $48,168 ($37,232) $0 $1,496,604
deferred compensation $0 $0 $0
total $48,168 $48,168 ($37,232) $0 $1,496,604
Dr. Lundberg nonqualified savings $44,571 $44,571 ($16,968) $0 $770,282
deferred compensation $0 $0 $0
total $44,571 $44,571 ($16,968) $0 $770,282
Mr. Harrington nonqualified savings $33,744 $33,744 $19,400 $0 $383,119
deferred compensation $25,000 $5,196 $174,973
total $58,744 $33,744 $24,596 $0 $558,092
Mr. Conterno nonqualified savings $27,778 $27,778 $6,444 $0 $710,313
deferred compensation $100,000 $34,512 $1,150,774
total $127,778 $27,778 $40,956 $0 $1,861,087
1 The amounts in this column are also included in the “Summary Compensation Table,” in the “Salary” column (nonqualified savings) or the “Non-Equity Incentive Plan Compensation” column (deferred compensation).

PROX
Y STA
TEME
NT
P55P55
2 The amounts in this column are also included in the “Summary Compensation Table,” in the “All Other Compensation” column as a portion of the savings plan match.
3 Of the totals in this column, the following amounts have previously been reported in the “Summary Compensation Table” for this year and for previous years:
Name 2016 ($) Previous Years ($) Total ($)
Dr. Lechleiter $1,053,825 $12,029,531 $13,083,356
Mr. Rice $96,336 $798,962 $895,298
Dr. Lundberg $89,142 $527,677 $616,819
Mr. Harrington $92,488 $184,100 $276,588
Mr. Conterno $155,556 $605,044 $760,600
The "Nonqualified Deferred Compensation in 2016" table above shows information about two company programs: the nonqualified savings plan and the Deferred Compensation Plan. The nonqualified savings plan is designed to allow each employee to contribute up to 6 percent of his or her base salary, and receive a company match, beyond the contribution limits prescribed by the IRS with regard to 401(k) plans. This plan is administered in the same manner as the 401(k) Plan, with the same participation and investment elections. EOs and other U.S. executives may also defer receipt of all or part of their cash compensation under the Deferred Compensation Plan. Amounts deferred by executives under this plan are credited with interest at 120 percent of the applicable federal long-term rate as established the preceding December by the U.S. Treasury Department under Section 1274(d) of the Internal Revenue Code with monthly compounding, which was 3.1 percent for 2016 and is 2.7 percent for 2017. Participants may elect to receive the funds in a lump sum or in up to 10 annual installments following termination of employment, but may not make withdrawals while employed by the company, except in the event of hardship as approved by the Compensation Committee. All deferral elections and associated distribution schedules are irrevocable. Both plans are unfunded and subject to forfeiture in the event of bankruptcy.
Payments Upon Termination or Change in Control (as of December 31, 2016) The following table describes the potential payments and benefits under the company’s compensation and benefit plans and arrangements to which the named executive officers would be entitled upon termination of employment. Except for certain terminations following a change in control of the company, as described below, there are no agreements, arrangements, or plans that entitle named executive officers to severance, perquisites, or other enhanced benefits upon termination of their employment. Any agreement to provide such payments or benefits to a terminating EO (other than following a change in control) would be at the discretion of the Compensation Committee.

PROXY STATEMENT P56P56
CashSeverance Payment 1
Continuationof Medical /
Welfare Benefits (present value) 2
Value ofAcceleration
of EquityAwards
TotalTermination
BenefitsDr. Lechleiter• Voluntary retirement $0 $0 $0 $0• Involuntary retirement or termination $0 $0 $0 $0
• Involuntary or good reason terminationafter change in control
$7,500,000 $18,916 $6,509,535 $14,028,451
Mr. Rice• Voluntary termination $0 $0 $0 $0• Involuntary retirement or termination $0 $0 $0 $0
• Involuntary or good reason terminationafter change in control
$4,285,224 $285,135 $2,403,739 $6,974,098
Dr. Lundberg• Voluntary retirement $0 $0 $0 $0• Involuntary retirement or termination $0 $0 $0 $0
• Involuntary or good reason terminationafter change in control
$4,031,420 $61,519 $2,186,665 $6,279,604
Mr. Harrington• Voluntary retirement $0 $0 $0 $0• Involuntary retirement or termination $0 $0 $0 $0
• Involuntary or good reason terminationafter change in control
$3,007,008 $262,477 $1,453,266 $4,722,751
Mr. Conterno
• Voluntary termination $0 $0 $0 $0
• Involuntary retirement or termination $0 $0 $0 $0
• Involuntary or good reason terminationafter change in control
$2,633,440 $37,832 $1,555,410 $4,226,682
1 See “Change-in-Control Severance Pay Plan—Cash Severance Payment” below.
2 See “Accrued Pay and Regular Retirement Benefits” and “Change-in-Control Severance Pay Plan—Continuation of medical and welfare benefits” below.
Accrued Pay and Regular Retirement Benefits. The amounts shown in the table above do not include certain payments and benefits to the extent they are provided on a non-discriminatory basis to salaried employees generally upon termination of employment. These include: • accrued salary and vacation pay. • regular pension benefits under the Retirement Plan and the nonqualified pension plan. See “Retirement
Benefits” above. • welfare benefits provided to all U.S. retirees, including retiree medical and dental insurance. The amounts
shown in the table above as “Continuation of Medical / Welfare Benefits” are explained below. • distributions of plan balances under the 401(k) Plan, the nonqualified savings plan, and the Deferred
Compensation Plan. See the narrative following the “Nonqualified Deferred Compensation in 2016” table for information about these plans.
Deferred Compensation. The amounts shown in the table do not include distributions of plan balances under the deferred compensation plan. Those balances are shown in the “Nonqualified Deferred Compensation in 2016” table.
Death and Disability. A termination of employment due to death or disability does not entitle named executive officers to any payments or benefits that are not available to U.S. salaried employees generally.
Termination for Cause. Executives terminated for cause receive no severance or enhanced benefits and forfeit any unvested equity grants.

PROX
Y STA
TEME
NT
P57P57
Change-in-Control Severance Pay Plan. As described in the CD&A under “Severance Benefits,” the company maintains a change-in-control severance pay plan for nearly all employees, including the named executive officers. The change-in-control plan defines a change in control very specifically, but generally the terms include the occurrence of one of the following: (i) acquisition of 20 percent or more of the company’s stock; (ii) replacement by the shareholders of one half or more of the Board of Directors; (iii) consummation of a merger, share exchange, or consolidation of the company (other than a transaction that results in the Lilly shareholders prior to the transaction continuing to hold more than 60 percent of the voting stock of the combined entity); or (iv) liquidation of the company or sale or disposition of all or substantially all of its assets. The amounts shown in the table for “involuntary or good-reason termination after change in control” are based on the following assumptions and plan provisions:
• Covered terminations. The table assumes a termination of employment that is eligible for severance under the terms of the plan, based on the named executive officer’s compensation, benefits, age, and service credit at December 31, 2016. Eligible terminations include an involuntary termination for reasons other than for cause or a voluntary termination by the executive for good reason, within two years following the change in control.
• A termination of an EO by the company is for cause if it is for any of the following reasons: (i) the employee’s willful and continued refusal to perform, without legal cause, his or her material duties, resulting in demonstrable economic harm to the company; (ii) any act of fraud, dishonesty, or gross misconduct resulting in significant economic harm or other significant harm to the business reputation of the company; or (iii) conviction of or the entering of a plea of guilty or nolo contendere to a felony.
• A termination by the EO is for good reason if it results from: (i) a material diminution in the nature or status of the executive’s position, title, reporting relationship, duties, responsibilities, or authority, or the assignment to him or her of additional responsibilities that materially increase his or her workload; (ii) any reduction in the executive’s then-current base salary; (iii) a material reduction in the executive’s opportunities to earn incentive bonuses below those in effect for the year prior to the change in control; (iv) a material reduction in the executive’s employee benefits from the benefit levels in effect immediately prior to the change in control; (v) the failure to grant to the executive stock options, stock units, performance shares, or similar incentive rights during each 12-month period following the change in control on the basis of a number of shares or units and all other material terms at least as favorable to the executive as those rights granted to him or her on an annualized average basis for the three-year period immediately prior to the change in control; or (vi) relocation of the executive by more than 50 miles.
• Cash severance payment. The cash severance payment amounts to two times the EO's annual base salary plus two times the EO’s bonus target for that year under the bonus plan.
• Continuation of medical and welfare benefits. This amount represents the present value of the change-in-
control plan’s provision, following a covered termination, of 18 months of continued coverage equivalent to the company’s current active employee medical, dental, life, and long-term disability insurance. Similar actuarial assumptions to those used to calculate incremental pension benefits apply to the calculation for continuation of medical and welfare benefits, with the addition of actual COBRA rates based on current benefit elections.
• Acceleration of equity awards. Upon a covered termination, any unvested equity awards would vest and a partial payment of outstanding PAs would be made, reduced to reflect the portion of the performance period worked prior to the change in control. Likewise, in the case of a change in control in which Lilly is not the surviving entity, SVAs would pay out based on the change-in-control stock price and be prorated for the portion of the three-year performance period elapsed. The amount in this column represents the value of the acceleration of unvested equity grants, prorated for PAs and SVAs that would have been applicable at December 31, 2016.
• Excise taxes. Upon a change in control, employees may be subject to certain excise taxes under Section 280G of the Internal Revenue Code. The company does not reimburse the affected employees for those excise taxes or any income taxes payable by the employee. To reduce the employee's exposure to excise taxes, the employee’s change-in-control benefit may be decreased to maximize the after-tax benefit to the individual.

PROXY STATEMENT P58P58
Payments Upon Change in Control Alone. In general, the change-in-control plan is a “double trigger” plan, meaning payments are made only if the employee suffers a covered termination of employment within two years following the change in control. There are limited exceptions for pro-rata portions of PAs and SVAs, based on performance to the date of the change in control, as noted above under "Acceleration of equity awards."
Compensation Committee MattersBackground
Role of the Independent Consultant in assessing Executive CompensationThe Compensation Committee has retained Cimi B. Silverberg of Frederic W. Cook & Co., Inc., as its independent compensation consultant. Ms. Silverberg reports directly to the committee. Neither she nor her firm is permitted to have any business or personal relationship with management or the members of the committee. The consultant’s responsibilities are to:
• review the company’s total compensation philosophy, peer group, and target competitive positioning for reasonableness and appropriateness;
• review the company’s executive compensation program and advise the committee of evolving best practices; • provide independent analyses and recommendations to the committee on the CEO’s pay;• review draft CD&A and related tables for the proxy statement;• proactively advise the committee on best practices for board governance of executive compensation; and• undertake special projects at the request of the committee chair.
Ms. Silverberg interacts directly with members of company management only on matters under the committee’s oversight and with the knowledge and permission of the committee chair.
Role of EOs and Management in assessing Executive CompensationWith the oversight of the CEO and the senior vice president of human resources and diversity, the company’s global compensation group formulates recommendations on compensation philosophy, plan design, and compensation for EOs (other than the CEO, as noted below). The CEO provides the committee with a performance assessment and compensation recommendation for each of the other EOs. The committee considers those recommendations with the assistance of its consultant. The CEO and the senior vice president of human resources and diversity attend committee meetings; they are not present for executive sessions or any discussion of their own compensation. Only non-employee directors and the committee’s consultant attend executive sessions.
The CEO does not participate in the formulation or discussion of his pay recommendations. He has no prior knowledge of the recommendations that the consultant makes to the committee.
Risk Assessment Process As a part of the company's overall enterprise risk management program, in 2016 the committee reviewed the company’s compensation policies and practices and concluded that the programs and practices are not reasonably likely to have a material adverse effect on the company. The committee noted numerous policy and design features of the company’s compensation programs and governance structure that reduce the likelihood of inappropriate risk-taking, including, but not limited to:
• The committee is comprised of independent directors only.• The committee engages its own independent compensation consultant.• The committee has downward discretion to lower compensation plan payouts.• The committee approves all adjustments to financial results that affect compensation calculations.• Different measures and metrics are used across multiple incentive plans that appropriately balance cash/stock,
fixed/variable pay, and short-term/long-term incentives.• Incentive plans have predetermined maximum payouts.• Performance objectives are challenging but achievable.• Programs with operational metrics have a continuum of payout multiples based upon achievement of
performance milestones, rather than "cliffs" that might encourage sub-optimal or improper behavior.• A compensation recovery policy is in place for all members of senior management; negative compensation
consequences can be applied in cases of serious compliance violations.

PROX
Y STA
TEME
NT
P59P59
• Meaningful share ownership requirements are in place for all members of senior management and the board.
Compensation Committee ReportThe Compensation Committee evaluates and establishes compensation for EOs and oversees the deferred compensation plan, the company’s management stock plans, and other management incentive and benefit programs. Management has the primary responsibility for the company’s financial statements and reporting process, including the disclosure of executive compensation. With this in mind, the Compensation Committee has reviewed and discussed with management the CD&A above. The committee recommended to the Board of Directors that the CD&A be included in this proxy statement for filing with the SEC.
Compensation Committee Ralph Alvarez, ChairEllen R. Marram Kathi P. Seifert
Item 3. Advisory Vote on Frequency of Future Advisory Votes on Named Executive Officer CompensationIn accordance with federal legislation enacted in 2010 requiring advisory shareholder votes on executive compensation, we are required this year to ask shareholders, on an advisory basis, whether they would prefer advisory named executive officer compensation votes every year, every two years, or every three years. Your proxy or voting instruction card allows you to choose the frequency you prefer.
Shareholders should consider the value of having the opportunity every year to voice their opinion on the company’s named executive officer compensation through an advisory vote, weighing that against the additional burden and expense to the company and shareholders of preparing and responding to proposals annually, as well as the other means available to shareholders to provide input on executive compensation.
On balance, we support advisory votes on named executive officer compensation every year, and they are currently occurring annually. We welcome shareholder input and believe that the value of an annual vote outweighs the burden of preparing annual proposals. We also believe annual advisory votes on named executive officer compensation provide a meaningful way to continue dialogue with shareholders regarding this issue.
The board is not bound by this advisory shareholder vote; however, it will give significant weight to shareholder preferences on this matter.
Board Recommendation on Item 3
The Board of Directors recommends that you vote FOR an ANNUAL advisory vote on the compensation of the company's named executive officers as disclosed in its proxy statements.
Audit MattersItem 4. Ratification of the Appointment of Principal Independent AuditorAudit Committee Oversight of Independent AuditorThe Audit Committee is responsible for the appointment, compensation, retention, and oversight of the independent auditor, and oversees the process for selecting, reviewing, and evaluating the lead audit partner. Further information regarding the committee's oversight of the independent auditor can be found in the Audit Committee charter, available online at https://www.lilly.com/who-we-are/governance, or upon request to the company's corporate secretary.

PROXY STATEMENT P60P60
In connection with the decision regarding whether to reappoint the independent auditor each year (subject to shareholder ratification), the committee assesses the independent auditor's performance. This assessment examines three primary criteria: (1) the independent auditor's qualifications and experience; (2) the communication and interactions with the auditor over the course of the year; and (3) the auditor's independence, objectivity, and professional skepticism. These criteria are assessed against an internal and an external scorecard, and are discussed with management during a private session, as well as in executive session. The committee also periodically considers whether a rotation of the company's independent auditor is advisable.
Ernst & Young LLP (EY) served as the principal independent auditor for the company in 2016. Based on this year's assessment of EY's performance, the Audit Committee believes that the continued retention of EY to serve as the company's principal independent auditor is in the best interests of the company and its shareholders, and has therefore reappointed the firm of EY as principal independent auditor for the company for 2017. In accordance with the bylaws, this appointment is being submitted to the shareholders for ratification.
Representatives of EY are expected to be present at the annual meeting and will be available to respond to questions. Those representatives will have the opportunity to make a statement if they wish to do so.
Board Recommendation on Item 4
The Board recommends that you vote FOR ratifying the appointment of Ernst & Young LLP as principal independent auditor for 2017.
Audit Committee Report
The Audit Committee reviews the company’s financial reporting process on behalf of the Board. Management has the primary responsibility for the financial statements and the reporting process, including the systems of internal controls and disclosure controls. In this context, the committee has met and held discussions with management and the independent auditor. Management represented to the committee that the company’s consolidated financial statements were prepared in accordance with generally accepted accounting principles (GAAP), and the committee has reviewed and discussed the audited financial statements and related disclosures with management and the independent auditor, including a review of the significant management judgments underlying the financial statements and disclosures.
The independent auditor reports to the Audit Committee, which has sole authority to appoint and to replace the independent auditor (subject to shareholder ratification).
The committee has discussed with the independent auditor matters required to be discussed with the Audit Committee by the standards of the Public Company Accounting Oversight Board (PCAOB) and the NYSE, including the quality, not just the acceptability, of the accounting principles, the reasonableness of significant judgments, and the clarity of the disclosures in the financial statements. In addition, the committee has received the written disclosures and the letter from the independent auditor required by applicable requirements of the PCAOB regarding communications with the Audit Committee concerning independence, and has discussed with the independent auditor the auditor’s independence from the company and its management. In concluding that the auditor is independent, the committee determined, among other things, that the nonaudit services provided by EY (as described below) were compatible with its independence. Consistent with the requirements of the Sarbanes-Oxley Act of 2002 (the Sarbanes-Oxley Act), the committee has adopted policies to ensure the independence of the independent auditor, such as prior committee approval of nonaudit services and required audit partner rotation.
The committee discussed with the company’s internal and independent auditors the overall scope and plans for their respective audits, including internal control testing under Section 404 of the Sarbanes-Oxley Act. The committee periodically meets with the internal and independent auditors, with and without management present, and in private sessions with members of senior management (such as the chief financial officer and the chief accounting officer) to discuss the results of their examinations, their evaluations of the company’s internal controls, and the overall quality of the company’s financial reporting. The committee also periodically meets in executive session.

PROX
Y STA
TEME
NT
P61P61
In reliance on the reviews and discussions referred to above, the committee recommended to the Board (and the Board subsequently approved the recommendation) that the audited financial statements be included in the company’s annual report on Form 10-K for the year ended December 31, 2016, for filing with the SEC. The committee has also appointed the company’s independent auditor, subject to shareholder ratification, for 2017.
Audit CommitteeMichael L. Eskew, ChairKatherine Baicker, Ph.D.Jamere JacksonKathi P. SeifertJackson P. Tai
Services Performed by the Independent AuditorThe Audit Committee preapproves all services performed by the independent auditor, in part to assess whether the provision of such services might impair the auditor’s independence. The committee’s policy and procedures are as follows:
• Audit services: The committee approves the annual audit services engagement and, if necessary, any changes in terms, conditions, and fees resulting from changes in audit scope, company structure, or other matters. Audit services include internal controls attestation work under Section 404 of the Sarbanes-Oxley Act. The committee may also preapprove other audit services, which are those services that only the independent auditor reasonably can provide.
• Audit-related services: Audit-related services are assurance and related services that are reasonably related to the performance of the audit or reviews of the financial statements, and that are traditionally performed by the independent auditor. The committee believes that the provision of these services does not impair the independence of the auditor.
• Tax services: The committee believes that, in appropriate cases, the independent auditor can provide tax compliance services, tax planning, and tax advice without impairing the auditor’s independence.
• Other services: The committee may approve other services to be provided by the independent auditor if (i) the services are permissible under SEC and PCAOB rules, (ii) the committee believes the provision of the services would not impair the independence of the auditor, and (iii) management believes that the auditor is the best choice to provide the services.
• Approval process: At the beginning of each audit year, management requests prior committee approval of the annual audit, statutory audits, and quarterly reviews for the upcoming audit year as well as any other services known at that time. Management will also present at that time an estimate of all fees for the upcoming audit year. As specific engagements are identified thereafter, they are brought forward to the committee for approval. To the extent approvals are required between regularly scheduled committee meetings, preapproval authority is delegated to the committee chair.
For each engagement, management provides the committee with information about the services and fees, sufficiently detailed to allow the committee to make an informed judgment about the nature and scope of the services and the potential for the services to impair the independence of the auditor.
After the end of the audit year, management provides the committee with a summary of the actual fees incurred for the completed audit year.

PROXY STATEMENT P62P62
Independent Auditor Fees
The following table shows the fees incurred for services rendered on a worldwide basis by EY in 2016 and 2015. All such services were pre-approved by the committee in accordance with the pre-approval policy.
2016($ millions)
2015($ millions)
Audit Fees $12.8 $13.1Annual audit of consolidated and subsidiary financial statements, including Sarbanes-Oxley404 attestationReviews of quarterly financial statementsOther services normally provided by the auditor in connection with statutory and regulatoryfilings
Audit-Related Fees $0.6 $0.7Primarily related to assurance and related services reasonably related to the performance ofthe audit or reviews of the financial statements primarily related to employee benefit planand other ancillary audits, and due diligence services on potential acquisitions
Tax Fees $6.7 $5.6Primarily related to consulting and compliance services
All Other Fees $— $0.12015: primarily related to consulting and compliance services
Total $20.2 $19.5*Numbers may not add due to rounding
Directors' Deferral PlanItem 5. Proposal to Amend the Lilly Directors' Deferral Plan
The Lilly Directors’ Deferral Plan provides an ownership position in the company that aligns directors with shareholder interests. The plan was last approved by shareholders in 2003.
Under the plan, a portion of directors' annual compensation is awarded in deferred shares:
• all shares must be held until the second January following the director's departure from board serviceno stock options can be issued under the plan.
Changes to the plan include:
authorizing an additional 750,000 shares (the same amount approved in 2003)a cap on non-employee directors’ compensation.

PROX
Y STA
TEME
NT
P63P63
We summarize the principal features of the plan below, subject to the full text of the plan, which is attached to this proxy statement as Appendix B.
EligibleParticipants
The plan is available only to non-salaried directors, as further defined in the plan document. Thereare currently 17 eligible directors, 13 active and 4 retired.
PlanAdministration
The plan is administered by the directors and corporate governance committee of the board.
SharesAuthorized
A total of 1,500,000 shares of Lilly stock may be issued or transferred under the restated plan. Forthe period April 29, 2003, through December 31, 2016, the aggregate number of authorized shareswas 750,000. As of February 17, 2017, 300,685 shares have been paid out under the plan and457,071 shares were credited to participants’ accounts (including retired directors), and thoseshares would be counted against the share limit.
Recent StockPrice
The closing price of Lilly stock on the New York Stock Exchange on February 17, 2017, was $80.39.
ElectiveDeferrals
Prior to the beginning of each year, a director may irrevocably elect to defer all or a portion of his or her retainer and meeting fees for the year. The director can choose to have the funds credited to either of two accounts:
• Deferred Compensation Account. Funds are credited monthly and earn interest equal to 120 percent of the applicable long-term federal rate with monthly compounding, as posted by the Internal Revenue Service annually. The interest rate is adjusted each December. Payments from this account are made in cash.
• Deferred Stock Account. This account allows the director, in effect, to invest cash compensation in Lilly stock, with receipt deferred until the second January following the end of board service. Deferred funds are credited monthly, and the annual share award described below is credited annually, as hypothetical shares of Lilly stock, based on the market price of the stock on a monthly valuation date. Hypothetical dividends are reinvested in additional share units based on the market price of the stock on the date that common stock dividends are paid. Payments from this account are made in shares of Lilly stock. No shares are issued or transferred until the second January following the director's departure from board service or the director dies.
CompensationLimits
Each eligible director receives an annual credit to his or her deferred stock account of the number ofhypothetical shares of Lilly stock equal to $160,000 on a valuation date specified in the plan (or suchother number as the board may establish by resolution). The annual share award may not exceedthe lesser of 7,500 shares or an amount equal to $800,000 minus the director’s total cashcompensation (including compensation deferred into the plan) for the relevant plan year. In 2016,each independent director was credited with 2,088 shares. The amount of stock compensation isprorated for months of service and may not be adjusted by the board more than once every calendaryear.
Payment Options At the time of the election to defer, the director chooses one of two payment options:
• lump sum on the second January following the director's departure from board service• from two to ten annual installments beginning on the second January following the director's
departure from board service.
The plan includes alternate payment provisions that call for accelerated payment in the case of death of the participant or an unexpected emergency causing a severe financial hardship that cannot be relieved through other available funds (as determined by the committee).
Adjustments forCapital Changes
In the event of stock split, stock dividend, spinoff or other relevant change affecting Lilly stock, thecommittee will adjust existing account balances in the deferred stock account and will also adjust thetotal number of shares available under the plan and the maximum annual award amount.
Termination andAmendment ofPlan
The plan remains effective until terminated by the board. The board may amend or terminate theplan in its discretion, subject to certain limitations, including that shareholder approval is required forany material amendments to the extent required by applicable NYSE listing standards.
OtherInformation
The amount of future benefits to be paid under the plan cannot be determined at this time. In 2016, the 17 participants received in the aggregate the following amounts in their accounts:
• Deferred compensation accounts: $124,379 of interest credited• Deferred stock accounts: 41,779 shares credited• 97,815 shares paid out to retired participants.

PROXY STATEMENT P64P64
Equity Compensation Plan InformationThe following table presents information as of December 31, 2016, about our other compensation plans under which shares of Lilly stock have been authorized.
Plan category
(a) Number ofsecurities to be issuedupon exercise ofoutstanding options,warrants, and rights
(b) Weighted- issuanceunder equity averageexercise price ofoutstanding, options,warrants, and rights
(c) Number ofsecurities remaining available for future compensation plans(excluding securities reflected in column (a))
Equity compensation plans approved bysecurity holders — $ — 99,568,453Equity compensationplan not approved bysecurity holders — — —Total — — 99,568,453
Board Recommendation on Item 5
The Board of Directors recommends a vote FOR the proposal.
Shareholder ProposalsItem 6. Shareholder Proposal: Report Regarding Direct and Indirect Political ContributionsThe Comptroller of the State of New York, Thomas P. DiNapoli, trustee of the New York State Common Retirement Fund and the administrative head of the New York State and Local Retirement System, beneficial owner of 2,954,390 shares, has submitted the following proposal:
Shareholder Proposal
Whereas, we believe in full disclosure of Eli Lilly's direct and indirect lobbying activities and expenditures to assess whether Eli Lilly's lobbying is consistent with Eli Lilly's expressed goals and in the best interests of shareholders.
Resolved, the shareholders of Eli Lilly and Company ("Eli Lilly") request the preparation of a report, updated annually, disclosing:
1. Company policy and procedures governing lobbying, both direct and indirect, and grassroots lobbying communications.
2. Payments by Eli Lilly used for (a) direct or indirect lobbying or (b) grassroots lobbying communications, in each case including the amount of the payment and the recipient.
3. Eli Lilly’s membership in and payments to any tax-exempt organization that writes and endorses model legislation.
4. Description of the decision making process and oversight by management and the Board for making payments described in section 2 and 3 above.
For purposes of this proposal, a "grassroots lobbying communication" is a communication directed to the general public that (a) refers to specific legislation or regulation, (b) reflects a view on the legislation or regulation and (c) encourages the recipient of the communication to take action with respect to the legislation or regulation. "Indirect lobbying" is lobbying engaged in by a trade association or other organization of which Ely Lilly is a member.

PROX
Y STA
TEME
NT
P65P65
Both "direct and indirect lobbying” and "grassroots lobbying communications" include efforts at the local, state and federal levels.
The report shall be presented to the Audit Committee or other relevant oversight committees and posted on Eli Lilly's website.
Supporting StatementWe encourage transparency in the use of corporate funds to influence legislation and regulation, both
directly and indirectly. Eli Lilly spent over $15.3 million in 2014 and 2015 on federal lobbying (opensecrets.org). This figure does not include lobbying expenditures to influence legislation in states, where Eli Lilly also lobbies in 48 states ("Amid Federal Gridlock, Lobbying Rises in the States," Center for Public Integrity, February 11, 2016), but disclosure is uneven or absent.
Eli Lilly belongs to the Chamber of Commerce, which has spent over $1.2 billion on lobbying since 1998. Eli Lilly does not disclose its payments to trade associations, or the amounts used for lobbying. Transparent reporting would reveal whether company assets are being used for objectives contrary to Eli Lilly’s long-term interests. For example, Lilly supports smoking cessation, yet the Chamber works to block global smoking laws (“U.S. Chamber Works Globally to Fight Antismoking Measures,” New York Times, June 30, 2015). And Eli Lilly recognizes the risks posed by climate change, yet the Chamber has sued the EPA to block the Clean Power Plan.
And Eli Lilly does not disclose its contributions to tax-exempt organizations that write and endorse model legislation, such as its serving on the Health and Human Services Task Force of the American Legislative Exchange Council (ALEC). ALEC promotes legislation against state regulations addressing climate change. Over 100 companies have publicly left ALEC, including Allergan, Amgen, AstraZeneca, GlaxoSmithKline, Johnson & Johnson, Medtronic and Merk.
Statement in opposition to the Shareholder Proposal Regarding Report on the Company’s Direct and Indirect Political Contributions
The public policy and compliance committee of the board has reviewed this proposal and recommends a vote against it, as we currently publish most of the information requested by the shareholder. The additional reporting requirements are unnecessary, as the information requested is publicly available and this reporting would place an undue administrative burden on the company.
Beginning in 2005, the company has published the following information on our website (www.lilly.com) for both direct company contributions and employee political action committee (PAC) contributions to support candidates for political office, political parties, officials, or committees in the United States:
• policies and procedures for company and PAC contributions• contributions to candidates, including information about the candidate's office (for example, state, local, or
federal; House or Senate), party affiliation, state, and district• contributions to political organizations and Section 527 organizations reported by state.
This information is updated annually. In addition to the information available on our website, detailed corporate contributions, PAC contribution data, and the company’s direct lobbying expenses are available to the public on the Federal Election Committee website (http://www.fec.gov/disclosure.shtml) and through individual state agencies.
In addition to direct political contributions, Lilly maintains memberships in certain trade associations that report lobbying activity to the U.S. government. We maintain memberships in trade associations and other tax-exempt organizations specific to business and pharmaceutical industry interests, such as PhRMA (Pharmaceutical Research and Manufacturers Association), BIO (Biotechnology Association), Healthcare Leadership Conference, and the National Association of Manufacturers. We support organizations that champion public policies that contribute to pharmaceutical innovation, healthy patients, and a healthy business climate.
The “Lilly Report of Political Financial Support” notes our memberships in trade associations that report lobbying activity to the U.S. government and to which we contribute $50,000 per year or more. Organizations where Lilly has a board seat are also noted.

PROXY STATEMENT P66P66
These tax exempt organizations are also required to disclose their lobbying expenditures under the Lobbying Act of 1995: they report their lobbying expenditures to the United States Senate.
As we do not control the portion of the organization’s budget spent on lobbying, it is the fact of company membership and support for the trade association, and the trade association’s total lobbying expenditure, that reveals the most about Lilly's political activities.
Board Recommendation on Item 6
The Board of Directors recommends a vote AGAINST the proposal.
Other InformationMeeting and Voting Logistics Additional items of businessWe do not expect any items of business other than those above because the deadline for shareholder proposals and nominations has passed. Nonetheless, if necessary, the accompanying proxy gives discretionary authority to the persons named on the proxy with respect to any other matters that might be brought before the meeting. Those persons intend to vote that proxy in accordance with their best judgment.
Voting Shareholders as of the close of business on February 24, 2017 (the record date) may vote at the annual meeting. You have one vote for each share of common stock you held on the record date, including shares:
• held directly in your name as the shareholder of record • held for you in an account with a broker, bank, or other nominee • attributed to your account in the 401(k) plan.
You may vote your shares in person at the meeting. However, we encourage you to vote by mail, by telephone, or on the Internet even if you plan to attend the meeting.
Required vote Below are the vote requirements for the various proposals:
• The five nominees for director will be elected if the votes cast for the nominee exceed the votes cast against the nominee. Abstentions will not count as votes cast either for or against a nominee.
• The following items of business will be approved if the votes cast for the proposal exceed those cast against the proposal:
• advisory approval of executive compensation; • advisory vote on frequency of vote on named executive officer compensation, with the option receiving
the highest number of votes to be given due consideration by the board when determining frequency of such votes;
• ratification of the appointment of principal independent auditor;• amend the directors' deferral plan; and• one shareholder proposal.
Abstentions will not be counted either for or against these proposals.
Quorum A majority of the outstanding shares, present or represented by proxy, constitutes a quorum for the annual meeting. As of the record date, 1,103,354,357 shares of company common stock were issued and outstanding.

PROX
Y STA
TEME
NT
P67P67
Voting by proxyIf you are a shareholder of record, you may vote your proxy by any one of the following methods:
On the Internet. You may vote online at www.proxyvote.com. Follow the instructions on your proxy card or notice. If you received these materials electronically, follow the instructions in the e-mail message that notified you of their availability. Voting on the Internet has the same effect as voting by mail. If you vote on the Internet, do not return your proxy card.
By telephone. Shareholders in the U.S., Puerto Rico, and Canada may vote by telephone by following the instructions on your proxy card or notice. If you received these materials electronically, follow the instructions in the e-mail message that notified you of their availability. Voting by telephone has the same effect as voting by mail. If you vote by telephone, do not return your proxy card.
By mail. Sign and date each proxy card you receive and return it in the prepaid envelope. Sign your name exactly as it appears on the proxy. If you are signing in a representative capacity (for example, as an attorney-in-fact, executor, administrator, guardian, trustee, or the officer or agent of a corporation or partnership), please indicate your name and your title or capacity. If the stock is held in custody for a minor (for example, under the Uniform Transfers to Minors Act), the custodian should sign, not the minor. If the stock is held in joint ownership, one owner may sign on behalf of all owners. If you return your signed proxy but do not indicate your voting preferences, we will vote on your behalf with the board’s recommendations.
If you did not receive a proxy card in the materials you received from the company and you wish to vote by mail rather than by telephone or on the Internet, you may request a paper copy of these materials and a proxy card by calling 855-731-6026 (toll free) or 317-433-5112. If you received a notice or an e-mail message notifying you of the electronic availability of these materials, please provide the control number, along with your name and mailing address.
You have the right to revoke your proxy at any time before the meeting by (i) notifying the company’s secretary in writing, or (ii) delivering a later-dated proxy via the Internet, by mail, or by telephone. If you are a shareholder of record, you may also revoke your proxy by voting in person at the meeting.
Voting shares held by a broker If your shares are held by a broker, the broker will ask you how you want your shares to be voted. You may instruct your broker or other nominee to vote your shares by following instructions that the broker or nominee provides to you. Most brokers offer voting by mail, by telephone, and on the Internet.
If you give the broker instructions, your shares will be voted as you direct. If you do not give instructions, one of two things can happen, depending on the type of proposal. For the ratification of the principal independent auditor, the broker may vote your shares in its discretion. For all other proposals, the broker may not vote your shares at all.
Voting shares held in the 401(k) plan You may instruct the plan trustee on how to vote your shares in the 401(k) plan via the Internet, by mail, or by telephone as described above, except that, if you vote by mail, the card that you use will be a voting instruction form rather than a proxy card.
In addition, unless you decline, your vote will apply to a proportionate number of other shares held by participants in the 401(k) plan for which voting directions are not received (except for a small number of shares from a prior stock ownership plan, which can be voted only on the directions of the participants to whose accounts the shares are credited).
All participants are named fiduciaries under the terms of the 401(k) plan and under the Employee Retirement Income Security Act (ERISA) for the limited purpose of voting shares credited to their accounts and the portion of undirected shares to which their vote applies. Under ERISA, fiduciaries are required to act prudently in making voting decisions.
If you do not want to have your vote applied to the undirected shares, you must so indicate when you vote. Otherwise, the trustee will automatically apply your voting preferences to the undirected shares proportionally with

PROXY STATEMENT P68P68
all other participants who elected to have their votes applied in this manner.
If you do not vote, your shares will be voted by other plan participants who have elected to have their voting preferences applied proportionally to all shares for which voting instructions are not otherwise received.
Proxy cards and notices If you received more than one proxy card, notice, or e-mail related to proxy materials, you hold shares in more than one account. To ensure that all your shares are voted, sign and return each card. Alternatively, if you vote by telephone or on the Internet, you will need to vote once for each proxy card, notice, or e-mail you receive. If you do not receive a proxy card, you may have elected to receive your proxy statement electronically, in which case you should have received an e-mail with directions on how to access the proxy statement and how to vote your shares. If you wish to request a paper copy of these materials and a proxy card, please call 855-731-6026 (toll free) or 317-433-5112.
Vote tabulation Votes are tabulated by an independent inspector of election, IVS Associates, Inc.
Attending the annual meeting Attendance at the meeting will be limited to shareholders of record, those holding proxies from shareholders of record, and invited guests from the media and financial community. All shareholders of record as of the record date may attend by presenting the admission ticket that appears at the end of this proxy statement. Please fill it out and bring it with you to the meeting. The meeting will be held at the Lilly Center Auditorium. Please use the Lilly Center entrance to the south of the fountain at the intersection of Delaware and McCarty streets. You will need to pass through security, including a metal detector. Present your ticket to an usher at the meeting.
Parking will be available on a first-come, first-served basis in the garage indicated on the map at the end of this report. If you have questions about admittance or parking, you may call 855-731-6026 (toll free) or 317-433-5112 (prior to the annual meeting).
The 2018 annual meeting The company’s 2018 annual meeting is currently scheduled for May 7, 2018.
Other MattersHouseholdingWe have adopted a procedure approved by the SEC called "householding." Under the householding procedure, certain shareholders, whether they own registered shares or shares in street name, who have the same address will receive only one set of proxy materials, unless one or more of the shareholders at that address has previously notified us that they want to receive separate copies. Each 401(k) Plan participant will continue to receive a copy of all of the proxy materials. Regardless of how you own your shares, if you received a single set of proxy materials as a result of householding, and one or more shareholders at your address would like to have separate copies of these materials with respect to the 2017 annual meeting or in the future, please contact Broadridge Financial Solutions, Inc. at 1-866-540-7095.
Other information regarding the company’s proxy solicitation The board of directors is soliciting proxies for the 2017 annual meeting. We will pay all expenses in connection with our solicitation of proxies. We will pay brokers, nominees, fiduciaries, or other custodians their reasonable expenses for sending proxy material to and obtaining instructions from persons for whom they hold stock of the company. We expect to solicit proxies primarily by mail and email, but directors, officers, and other employees of the company may also solicit in person or by telephone, fax, or email. We have retained Georgeson LLC to assist in the distribution and solicitation of proxies. Georgeson may solicit proxies by personal interview, telephone, fax, mail, and email. We expect that the fee for those services will not exceed $17,500 plus reimbursement of customary out-of-pocket expenses.

PROX
Y STA
TEME
NT
P69P69
Section 16(a) beneficial ownership reporting complianceUnder SEC rules, our directors and EOs are required to file with the SEC reports of holdings and changes in beneficial ownership of company stock. We have reviewed copies of reports provided to the company, as well as other records and information. Based on that review, we concluded that all reports were timely filed, except that, due to administrative errors, Jackson Tai was late in reporting two stock purchases and Fionnuala Walsh was late in reporting a stock sale. Each filing was made promptly after the issue was discovered.
By order of the Board of Directors,
Bronwen L. Mantlo Secretary
March 20, 2017

PROXY STATEMENT P70P70
Appendix A - Summary of Adjustments Related to the Annual Cash Bonus and Performance Award
Consistent with past practice, the Compensation Committee adjusted the reported financial results on which the 2016 annual cash bonus and the 2015-2017 Performance Awards were determined to eliminate the distorting effect of certain unusual items on incentive compensation performance measures. The adjustments are intended to:
• align award payments with the underlying performance of the core business. • avoid volatile, artificial inflation or deflation of awards due to unusual items in the award year, and, where
relevant, the previous (comparator) year. • eliminate certain counterproductive short-term incentives—for example, incentives to refrain from
acquiring new technologies, to defer disposing of underutilized assets, or to defer settling legacy legal proceedings to protect current bonus payments.
• facilitate comparisons with peer companies.
To assure the integrity of the adjustments, the Compensation Committee establishes adjustment guidelines in the first 90 days of the performance period. These guidelines are generally consistent with the company guidelines for reporting non-GAAP financial measure to the investment community, which are reviewed by the Audit Committee. The adjustments apply equally to income and expense items. The Compensation Committee reviews all adjustments and retains downward discretion, i.e., discretion to reduce compensation below the amounts that are yielded by the adjustment guidelines.
Adjustments for 2016 Bonus PlanFor the 2016 bonus calculations, the Compensation Committee made the following adjustments to reported EPS consistent with our external reporting of non-GAAP financial measures:
• Eliminated the impact of the charge related to the Venezuelan financial crisis, including the significant deterioration of the bolivar.
• Eliminated the impact of the charge recognized for acquired in-process research and development.• Eliminated the impact of asset impairments, restructuring and other special charges.• Eliminated the impact of amortization of certain intangible assets.
Reconciliations of these adjustments to our reported EPS are below.
2016EPS as reported $2.58
Eliminate impact of the Venezuelan financial crisis $0.19Eliminate acquired in process research and development charge $0.02Eliminate asset impairments, restructuring and other special charges $0.29Eliminate amortization of certain intangible assets $0.44
Non-GAAP EPS $3.52
Adjustments for 2015-2017 PAFor the 2015-2017 PA payout calculations, the Compensation Committee made the following adjustments to reported EPS consistent with our reporting of non-GAAP financial measures:
• 2016: Eliminated the impact of the Venezuelan financial crisis.• 2016, 2015 and 2014: Eliminated the impact of the charges recognized for acquired in-process
research and development.• 2016, 2015 and 2014: Eliminated the impact of asset impairments, restructuring, and other special
charges.• 2016 and 2015: Eliminated the impact of amortization of certain intangible assets.• 2015: Eliminated the impact of the debt extinguishment loss.

PROX
Y STA
TEME
NT
P71P71
• 2015: Eliminated the impact of inventory step-up for Novartis Animal Health.• 2014: Eliminated the impact of the charge for an extra year of the U.S. Branded Prescription Drug
Fee.• 2014: Eliminated the impact of gain related to transfer of our linagliptin and empagliflozin commercial
rights in certain countries to Boehringer Ingelheim.
In addition to the adjustments consistent with our reporting of non-GAAP financial measures, the Compensation Committee made the following other adjustments:
• When the Compensation Committee set 2015-2017 PA targets, the transfer of the commercialization rights for Erbitux® in North America to Lilly (which occurred in October 2015) was not contemplated. Accordingly, the committee adjusted the 2016 and 2015 results to neutralize the expected EPS impact of the transfer of commercialization rights.
• When the Compensation Committee set 2015-2017 PA targets, the EPS goals were set assuming the acquisition of Novartis Animal Health (which occurred in January 2015). Accordingly, the committee adjusted the base year 2014 results to include the results of Novartis Animal Health as if the acquisition and financing had occurred as of January 1, 2014.
• When the Compensation Committee set 2015-2017 PA targets, the company began excluding amortization of certain intangible assets from non-GAAP financial measures in 2015. To make effective comparisons, the committee adjusted the 2014 non-GAAP results to exclude the impact of amortization of certain intangible assets.
Reconciliations of these adjustments to our reported EPS are below.
2016 2015% Growth
2016 vs. 2015 2014% Growth
2015 vs. 2014EPS as reported $2.58 $2.26 14.2% $2.23 1.3%Eliminate impact of the Venezuelan financial crisis $0.19 — —Eliminate acquired in process research anddevelopment charges $0.02 $0.33 $0.12Eliminate asset impairments, restructuring andother special charges $0.29 $0.25 $0.38Eliminate amortization of certain intangible assets $0.44 $0.39 —Eliminate debt extinguishment loss — $0.09 —Eliminate inventory step-up for Novartis AnimalHealth — $0.10 —Eliminate additional U.S. Drug Fee — — $0.11Eliminate gain related to transfer of commercialrights to Boehringer Ingelheim — — $(0.06)Non-GAAP EPS $3.52 $3.43 2.6% $2.78 23.4%Transfer of Erbitux commercialization rightsadjustment $(0.14) $(0.01) —Novartis Animal Health acquisition adjustment — — $(0.07)Amortization of certain intangible assets — — $0.32Adjusted Non-GAAP EPS $3.38 $3.42 (1.2)% $3.03 12.9%*Numbers may not add due to rounding

PROXY STATEMENT P72P72
Appendix B - The Lilly Directors' Deferral Plan (As Amended and Restated Effective January 1, 2017)
ELI LILLY AND COMPANY
THE LILLY DIRECTORS' DEFERRAL PLAN(as Amended and Restated on October 19, 2009 Effective January 1, 2017)
Preamble
The Lilly Directors’ Deferral Plan has been established by the Company for the purpose of providing an opportunity for Directors of the Company who are not salaried employees of the Company to voluntarily defer receipt of some or all of their meeting fees and retainer and to share in the long-term growth of the Company by acquiring, on a deferred basis, an ownership interest in the Company. Subject to adjustment as provided in Section 5(f), and contingent upon receiving approval of the Company’s shareholders, effective January 1, 2017, the aggregate number of shares of Eli Lilly and Company common stock that may be issued or transferred under this Plan after is 1,500,000. For the period beginning April 28 29, 2003, is and ending December 31, 2016, the aggregate number of authorized shares was 750,000. The shares Shares issued under the Plan may be authorized and unissued shares or treasury shares.
The Plan constitutes a plan of unfunded deferred compensation and is intended to comply with the requirements of Section 409A. Notwithstanding any other provision of this Plan, this Plan shall be interpreted, operated and administered in a manner consistent with these intentions.
For the rules that apply to the distribution of amounts that were earned and vested (within the meaning of Section 409A) under the Plan prior to 2005 (and earnings thereon) and are exempt from the requirements of Section 409A, see Appendix A.
This amendment and restatement of the Plan is effective January 1, 2017, contingent upon approval of the Company’s shareholders at the Company’s 2017 annual meeting.
Section 1. Definition of Terms
The following terms used in the Plan shall have the meanings set forth below:
(a) “Account” means one or more deferred compensation accounts maintained for each Participant under the Plan. A Participant’s Account shall consist of a Deferred Compensation Account and the Deferred Stock Account as described in Section 5 hereof.
(b) “Annual Allocation Date” means the last Business Day in November of each calendar year, or such other annual date, not earlier than the third Monday in February, established by the Plan Administrator as the date as of which the annual allocation of Shares are allocated described in Section 5(c) is credited to each the Deferred Stock Account in accordance with Section 5, which shall be as soon as administratively feasible after the Annual Valuation Date, but in no event later than the last Business Day in November of the applicable Plan Year.
(c) “Annual Valuation Date” means the Valuation Date in November of each Plan Year, on which the annual allocation of Shares referenced in Section 5(c) is valued.
(d) “Beneficiary” means the person or persons who are designated by the Participant or are otherwise entitled to receive benefits under the Plan in the event of the Participant’s death, as provided in Section 6(d) hereof.
(e) “Board” means the Board of Directors of the Company.

PROX
Y STA
TEME
NT
P73P73
(f) “Business Day” means a day on which the Company’s corporate headquarters are open for regular business.
(g) “Code” means the Internal Revenue Code of 1986, as amended.
(h) “Company” means Eli Lilly and Company, an Indiana corporation.
(i) “Deferral Amount” means the amount of a Participant’s Monthly Compensation that is elected by a Participant for deferral under the Plan.
(j) “Deferred Compensation Account” means the bookkeeping account described in Section 5(a)(i). A sub-account shall be established within the Deferred Compensation Account for each Plan Year in which a Deferred Stock Participant elects to defer compensation into the Deferred Compensation Account in accordance with Section 4(a).
(k) “Deferred Stock Account” means the bookkeeping account described in Section 5(a)(ii). A sub-account shall be established within the Deferred Stock Account for each Plan Year in which a Deferred Stock Participant elects to defer compensation into the Deferred Stock Account in accordance with Section 4(a) or receives allocations of Shares under Section 5, to hold the Shares allocated during such Plan Year.
(l) “Deferred Stock Participant” means a Director who is not, and for the preceding 12 months has not been, a salaried employee of the Company.
(m) “Director” means a member of the Board of Directors of the Company.
(n) “Dividend Payment Date” means the date as of which the Company pays a cash dividend on Shares.
(o) “Dividend Record Date” means the date established by the Board of Directors as the record date for determining shareholders entitled to the dividend with respect to any Dividend Payment Date.
(p) “Election Form” means the written or electronic form or forms approved by the Plan Administrator and completed by the Participant specifying the Participant’s election to defer Monthly Compensation pursuant to Section 4 and setting forth the Participant’s Beneficiary designation and the terms of distribution of the Participant’s Deferred Compensation Account and/or Deferred Stock Account pursuant to Section 6.
(q) “Monthly Compensation” means the monthly retainer and the aggregate of all other fees and retainers, including, but not limited to, meeting fees, committee fees and committee chairperson fees to which a Director is entitled for services rendered to the Company as a Director during the month, as established from time to time by resolution of the Board of Directors. For avoidance of doubt, Monthly Compensation does not include stock options granted to Directors or the Shares allocated pursuant to Section 5 of this Plan.
(r) “Monthly Deferral Participant” means a Director who is not, and for the preceding 12 months has not been, a salaried employee of the Company and who elects to defer all or part of his or her Monthly Compensation pursuant to the Plan in accordance with Section 4 hereof.
(s) “Participant” means any current or former Director with an outstanding Account balance in the Plan.
(t) “Plan” means The Lilly Directors’ Deferral Plan, as amended and restated herein.
(u) “Plan Administrator” means the Directors and Corporate Governance Committee of the Board of Directors, or any successor committee of the Board of Directors that is charged with matters relating to the compensation of non-employee directors. Except with respect to Section 5(f) of this Plan, the Plan Administrator may at its discretion delegate any of its responsibilities to one or more individuals provided that such delegation is in accordance with applicable laws.
(v) “Plan Year” means the calendar year from January 1 through December 31 with respect to which compensation eligible for deferral under the Plan is earned.
PROXY STATEMENT P74P74
(w) “Section 409A” means section 409A of the Code and the Treasury regulations and other official guidance promulgated thereunder.
(x) “Separation from Service” means a “separation from service” within the meaning of Section 409A.
(y) “Share” means a share of common stock of the Company.
(z) “Unforeseeable Emergency” means a severe financial hardship of a Participant resulting from an illness or accident of such Participant or Beneficiary, such Participant’s spouse or a dependent (as defined in section 152(a) of the Code) of such Participant, loss of such Participant’s property due to casualty, or other similar extraordinary and unforeseeable circumstances arising as a result of events beyond the control of such Participant, each as determined in the manner consistent with Section 409A, and any other event or circumstance within the meaning of the term “unforeseeable emergency” under Section 409A.
(aa) “Valuation Date” means for any month, the third Monday of the month, or if Shares are not traded on the New York Stock Exchange on such third Monday, the next day on which Shares are traded on the New York Stock Exchange.
Section 2. Plan Administrator
(a) Authority. The Plan Administrator shall have full authority to administer the Plan in accordance with its terms and to exercise all responsibilities and authorities as provided herein, including the discretionary authorities to determine the terms and conditions of deferrals of compensation under the Plan, to determine the terms and conditions of crediting to and distributing from Accounts under the terms of the Plan, and to adopt such rules and regulations for administering the Plan as it may deem necessary or appropriate. The Plan Administrator has the discretionary authority to interpret and construe all provisions of the Plan, to remedy possible ambiguities, inconsistencies, or omissions under the Plan, and to resolve all questions of fact arising under the Plan. The decisions of the Plan Administrator shall be final, binding and conclusive on all parties. No member of the Board, the Plan Administrator nor any officers of the Company shall have any liability for any action or determination taken under the Plan.
(b) Delegation; Expenses. The appropriate officer(s) of the Company as designated by the Plan Administrator are authorized to act on behalf of the Plan Administrator for the day-to-day administration of the Plan, subject to the authority of the Plan Administrator. Expenses of the administration of the Plan may be borne by the Company or may be deducted from Participants’ Accounts at the sole discretion of the Plan Administrator.
Section 3. Participation
The Plan Administrator may require a Participant to comply with such terms and conditions as the Plan Administrator may specify in order for the Participant to participate in the Plan.
Section 4. Elections to Participate
(a) Deferral Elections. A Monthly Deferral Participant in the Plan may file an Election Form with the Plan Administrator on or before the date specified in accordance with Section 4(c) hereof. The Election Form shall permit the Monthly Deferral Participant to specify the Deferral Amount, subject to a minimum annual Deferral Amount of five thousand dollars ($5,000), for the deferral of Monthly Compensation, or such amounts as may be specified by the Plan Administrator in its sole discretion, and whether such Deferral Amount shall be credited in cash to his or her Deferred Compensation Account or in Shares to his or her Deferred Stock Account, pursuant to Section 5(a) hereof. The Election Form shall also set forth the terms of distribution of the Participant’s Account in accordance with Section 6 hereof and the Participant’s Beneficiary designation. All elections to defer compensation under the Plan are irrevocable, and no changes to any Election Form delivered to the Plan Administrator shall be permitted, except as specifically provided under the terms of the Plan.
(b) Maximum Deferrals. A Monthly Deferral Participant may elect a Deferral Amount of up to 100% of the Participant’s Monthly Compensation for a Plan Year. One hundred percent (100%) of any annual allocation of Shares earned pursuant to Section 5(c) will be automatically credited to a Deferred Stock Participant’s Deferred Stock Account.

PROX
Y STA
TEME
NT
P75P75
(c) Timing and Effect of Elections. Unless otherwise specified by the Plan Administrator in accordance with the requirements of Section 409A, deferral elections on an Election Form shall be made:
(i) In the case of Monthly Compensation or an annual Share allocation not qualifying as “performance-based compensation” within the meaning of Section 409A, prior to the beginning of the Plan Year with respect to which the compensation is earned; and
(ii) In the case of Monthly Compensation or an annual Share allocation which the Plan Administrator has determined qualifies as “performance-based compensation” within the meaning of Section 409A, no later than June 30th of the applicable Plan Year with respect to which the compensation is earned.
Deferral elections shall apply to Monthly Compensation and annual Share allocations with respect to the Plan Year for which the elections are made. Participants will be required to make deferral elections for future Plan Years at such times to be specified by the Plan Administrator in accordance with the foregoing. If a Participant does not file an Election Form with the Plan Administrator on or before the deadline established by the Plan Administrator for deferral elections for a Plan Year, a Participant will be deemed not to have elected to defer Monthly Compensation for such Plan Year, as applicable. Notwithstanding the foregoing, in the first year in which an individual who is newly elected or appointed to serve as a Director becomes eligible to participate in the Plan, such individual may, not later than thirty (30) days after the date he or she becomes eligible to participate in the Plan, elect in accordance with the preceding provisions of this Section 4, to defer the receipt of Monthly Compensation and set forth the terms of distribution of the individual's Account with respect to services to be performed after the filing of the election with the Company.
Section 5. Accounts and Interest Credits
(a) Participant Accounts. Accounts shall be maintained for each Participant under the Plan:
(i) Deferred Compensation Account – The Company shall maintain a Deferred Compensation Account in the name of each Monthly Deferral Participant who elects to have a Deferral Amount credited in cash pursuant to Section 4 hereof for a given Plan Year. The Deferred Compensation Account shall be denominated in U.S. dollars, rounded to the nearest whole cent. For each month, Deferral Amounts allocated to a Deferred Compensation Account shall be credited to the Deferred Compensation Account as of the last Business Day of the month.
(ii) Deferred Stock Account – The Company shall maintain a Deferred Stock Account for each Deferred Stock Participant and for each Monthly Deferral Participant who elects to have a Deferral Amount credited in Shares. The Deferred Stock Account shall be denominated in Shares and maintained in fractions rounded to three (3) decimal places. Deferral Amounts intended to be allocated to a Deferred Stock Account shall be credited to on a monthly basis, as soon as administratively feasible following the Deferred Stock Account as of Valuation Date for the applicable month, but in no event later than the last Business Day of the month such month. The annual allocations of Shares for Deferred Stock Participants described in section (c) below shall be credited to the applicable Deferred Stock Account on the Annual Allocation Date. Shares and, if necessary, fractional Shares, shall be credited based upon the closing price of Shares on the New York Stock Exchange on the Valuation Date for that month. Notwithstanding any other provision of the Plan, Shares allocated to each Share a Deferred Stock Account shall be hypothetical and not issued or transferred by the Company until payment is made pursuant to Section 6 hereof.
A Participant’s Account shall consist of book entries only and shall not constitute a separate cash or Share fund or other asset held in trust or as security for the Company’s obligation to pay the amount of the Account to the Participant. The balance of a Participant’s Account shall be adjusted pursuant to this Section 5 and reduced by the amount of applicable tax withholding, distributions and expenses. A Participant’s Account may include sub-accounts as the Company considers necessary or advisable for purposes of maintaining a proper accounting of amounts credited or debited for a Participant under the Plan. A Participant shall receive or have on-line access to a statement of such Participant’s Account no less frequently than once a year following the end of each Plan Year.
(b) Crediting of Deferral Amount. A Participant who has filed an Election Form with the Plan Administrator for the deferral of Monthly Compensation with respect to a Plan Year shall have the Deferral Amount

PROXY STATEMENT P76P76
deducted from the applicable compensation and credited to the Participant’s appropriate Account under the Plan. The Deferral Amount so credited shall be reduced by applicable tax withholding, distributions and expenses.
(c) Annual Share Allocation. As of On the Annual Allocation Date of each Plan Year, there shall be allocated to the Deferred Stock Account of each person who (i) is a Deferred Stock Participant on the Annual Valuation Date of that date Plan Year or (ii) was a Deferred Stock Participant at any time subsequent to the last Annual Allocation Valuation Date, as part of his or her compensation for service on the Board of Directors, up to 7,500 the number of Shares, as may be specified from time to time by resolution of the Board of Directors. This allocation shall in no event be more than the lesser of (i) 7,500 Shares or (ii) the number of Shares equal in value to $800,000 minus the director’s total cash compensation for the Plan Year (including for this purpose, but not limited to, any cash compensation deferred into this Plan pursuant to an election under Section 4(a) above), as of the Annual Valuation Date.
(d) Interest Credits. The Deferred Compensation Accounts of Participants shall be credited with interest computed each Plan Year or portion thereof at a rate equal to 120% of the long-term applicable federal rate, with monthly compounding (as prescribed under section 1274(d) of the Code), as in effect for the month of December for the immediately preceding Plan Year. Such interest shall accrue on all Deferral Amounts and prior earnings thereon of Deferred Compensation Accounts and be credited daily to such accounts.
(e) Cash Dividends. Cash dividends paid on Shares shall be deemed to have been paid on the Shares allocated to each Participant’s Deferred Stock Account as if the allocated Shares were actual Shares issued and outstanding on the Dividend Record Date. An amount equal to the amount of such dividends shall be credited in Shares to each Deferred Stock Account as of the last Business Day of each month in which a Dividend Payment Date occurs, based upon the closing price for Shares on the New York Stock Exchange on the Valuation Date for that month.
(f) Capital Adjustments. The number of Shares referred to in the Preamble and Section 5 hereof and the number of Shares allocated to each Deferred Stock Account shall be adjusted by the Plan Administrator, in the event of any subdivision or combination of Shares or any stock dividend, stock split, reorganization, recapitalization, or consolidation or merger with the Company as the surviving corporation, or if additional shares or new or different shares or other securities of the Company or any other issuer are distributed with respect to Shares through a spin-off or other extraordinary distribution.
(g) Vesting of Accounts. A Participant is fully vested in his or her entire Account balance.
Section 6. Distribution of Accounts
(a) Distribution upon Separation from Service. A Participant shall specify on an Election Form the manner in which the amounts deferred in the Deferred Compensation Account and the Deferred Stock Account, as applicable, for a Plan Year (and earnings thereon) shall be distributed from the Participant’s Account upon the Participant’s Separation from Service. All elections are irrevocable, and no changes shall be permitted to any Election Form delivered to the Plan Administrator, except as specifically provided under the terms of the Plan. A Participant may elect, to the extent permitted by the Plan Administrator and set forth on the Election Form, that such portion of the Account be distributed upon a Participant’s Separation from Service either in:
(i) Lump Sum payment in January of the second Plan Year following the Plan Year in which the Participant's Separation from Service occurs; or
(ii) Annual Installment payments over a period of two (2) to ten (10) years commencing in January of the second Plan Year following the Plan Year in which the Participant's Separation from Service occurs, with subsequent installment payments to be made in each January within the applicable period.
If a Participant fails to make a timely payment election on the Election Form for a Plan Year, the amounts deferred in the Deferred Compensation Account and the Deferred Stock Account, as applicable, for such Plan Year (and earnings thereon) shall be distributed in a lump sum in accordance with Section 6(a)(i) hereof.
(b) Form of Distributions. All distributions of a Participant’s Deferred Compensation Account under the Plan shall be made in cash. Except as provided in Section 6(f), all distributions of a Participant’s

PROX
Y STA
TEME
NT
P77P77
Deferred Stock Account shall be paid in Shares, at which time the Shares shall be issued or transferred from the books of the Company to the Participant. All Shares to be issued or transferred hereunder may be newly issued or treasury shares. Fractional Shares shall not be issued or transferred to a Participant, provided that in the case of a final payment under the Plan with respect to a Participant, any fraction remaining in the Participant’s Deferred Stock Account shall be rounded up to the next whole Share and that number of whole Shares shall be issued or transferred. The value of the Deferred Stock Account is calculated with reference to the closing price of Shares on the last trading day of the prior Plan Year.
(c) Distribution of Account. The Company shall distribute amounts from the Participant’s Deferred Compensation Account and the Deferred Stock Account in the manner and on the date(s) applicable under this Section 6. If the payment option described in Section 6(a)(i) hereof is applicable, the amount of the lump sum shall be calculated using the valuation of the applicable portion of the Participant’s Account as of the December 31 preceding the date of the payment. If the payment option described in Section 6(a)(ii) hereof is applicable, the amount of each installment shall be calculated using the valuation of the applicable portion of the Participant’s Account as of the December 31 preceding the date of the installment payment divided by the number of installment payments that have not yet been made.
(d) Distribution upon Death. Notwithstanding any election made by a Participant or any other provision of this Section 6 to the contrary, if a Participant dies before full distribution of his or her Account balance, any remaining balance shall be distributed to the Participant’s Beneficiary in a lump sum within 90 days following the date of the Participant’s death. The amount of such lump sum distribution shall be calculated using the valuation of the Participant's Account as of the date preceding the date of distribution. Any payment required to be made to a Participant under the Plan that cannot be made due to the Participant’s death shall be made to the Participant’s Beneficiary, subject to applicable law. Each Participant shall have the right to designate one or more Beneficiaries, and to change a Beneficiary designation, from time to time by filing a written notice with the Plan Administrator. In the event that a Beneficiary does not survive the Participant and no successor Beneficiary is selected, or in the event no valid Beneficiary designation has been made, the Participant’s Beneficiary shall be the Participant’s estate.
(e) Unforeseeable Emergency. Upon the written request of a Participant, the Plan Administrator may permit the Participant to withdraw some or all of the Participant’s Account for the purpose of enabling the Participant to meet the immediate needs created by an Unforeseeable Emergency. The circumstances that will constitute an Unforeseeable Emergency will depend upon the facts of each case, but in any case, the amounts distributed with respect to an Unforeseeable Emergency shall not exceed the amounts necessary to satisfy such Unforeseeable Emergency plus amounts necessary to pay taxes reasonably anticipated as a result of the distribution, after taking into account the extent to which such hardship is or may be relieved through reimbursement or compensation by insurance or otherwise, by liquidation of the Participant’s assets, to the extent that the liquidation of such assets would not itself cause severe financial hardship, or by cessation of deferrals under the Plan.
(f) Payment of Cash in Lieu of Shares. If at any time the Plan Administrator determines that payment of Shares to a Participant (or a Participant’s Beneficiary) or the ownership or subsequent disposition of such Shares by such Participant or Beneficiary may violate or conflict with any applicable law or regulation, the Plan Administrator shall pay all or a portion of the Participant’s Deferred Stock Account in cash.
(g) Withholding Taxes. All distributions of a Participant’s Account under the Plan shall be subject to income tax and other withholdings that the Plan Administrator deems necessary or appropriate, and the Plan Administrator may reduce the amount credited to any Participant’s Account to the extent it deems necessary to satisfy tax withholding requirements. Participants or Beneficiaries receiving distributions under the Plan shall bear all taxes on amounts paid under the Plan to the extent that taxes are not withheld thereon, irrespective of whether withholding is required.
Section 7. Administrative Matters
(a) Claims Procedure. Any person making a claim for benefits hereunder shall submit the claim in writing to the Plan Administrator. If the Plan Administrator denies the claim in whole or in part, it shall issue to the claimant a written notice explaining the reason for the denial and identifying any additional information or documentation that might enable the claimant to perfect the claim. The claimant may, within sixty (60) days of receiving a written notice of denial, submit a written request for reconsideration to the Plan Administrator, together

PROXY STATEMENT P78P78
with a written explanation of the basis of the request. The Plan Administrator shall consider any such request and shall provide the claimant with a written decision together with a written explanation thereof. No legal action may be commenced or maintained against the Plan more than one year after the Plan Administrator wholly or partially denies, or is deemed to have wholly or patially denied, a claim for Plan benefits. All interpretations, determinations, and decisions of the Plan Administrator in respect of any claim shall be final, binding and conclusive.
(b) Incapacity. If the Plan Administrator determines that any person entitled to benefits under the Plan is unable to care for his or her affairs because of illness, accident or other physical and mental incapacity, any payment due (unless a duly qualified guardian or other legal representative has been appointed) may be paid consistent with the terms described herein for the benefit of such person to such person’s spouse, parent, brother, sister, adult child or other party deemed by the Plan Administrator in its sole discretion to ensure proper care for such person.
(c) Inability to Locate. If the Plan Administrator is unable to locate a person to whom a payment is due under the Plan for a period of twelve (12) months, commencing with the first day of the month as of which the payment becomes payable, the total amount payable to such person shall be forfeited.
(d) Liability. Any decision made or action taken by the Board of Directors, the Plan Administrator, or any employee of the Company or any of its subsidiaries, arising out of or in connection with the construction, administration, interpretation, or effect of the Plan, shall be absolutely discretionary, and shall be conclusive and binding on all parties. Neither the Plan Administrator nor a member of the Board of Directors and no employee of the Company or any of its subsidiaries shall be liable for any act or action hereunder, whether of omission or commission, by any other member or employee or by any agent to whom duties in connection with the administration of the Plan have been delegated or, except in circumstances involving bad faith, for anything done or omitted to be done.
(e) Notices. No notice, election or communication in connection with the Plan made or submitted by any Participant, claimant or other person shall be effective unless duly executed and filed with the Plan Administrator (including any of its representatives, agents, or delegates) in the form and manner required by the Plan Administrator.
(f) Waiver. No term, condition, or provision of the Plan shall be deemed waived unless the purported waiver is in writing signed by the Plan Administrator. No waiver signed by the Plan Administrator shall be deemed a continuing waiver unless so specifically stated in the writing, and any such waiver shall operate only for the stated period and only as to the specific term, condition, or provision waived, and shall apply only to the individual or individuals seeking the waiver.
Section 8. Unfunded Status
All Accounts and all rights of Participants to benefits under the Plan are unfunded obligations of the Company. Plan benefits shall be paid from the general assets of the Company, and Participants shall have the status of an unsecured general creditor of the Company with respect to all interests under the Plan. The Plan is a plan of unfunded deferred compensation. Notwithstanding the foregoing, the Company may, but shall not be required to, establish a trust or other funding vehicle under the Plan that does not affect the Plan’s status as a Plan of unfunded deferred compensation.
Section 9. Nontransferability; Successors
No interest of any person in, or right to receive a distribution under, the Plan shall be subject in any manner to sale, transfer, assignment, pledge, attachment, garnishment, or other alienation or encumbrance of any kind; nor may such interest or right to receive a distribution be taken, either voluntarily or involuntarily for the satisfaction of the debts of, or other obligations or claims against, such person.
The obligations of the Company under the Plan will be binding upon the Company’s successors, transferees and assigns.
Section 10. Limitation of Rights

PROX
Y STA
TEME
NT
P79P79
Nothing in the Plan shall confer upon any Participant the right to continue to serve as a Director of the Company or to serve in the capacity in which the Participant is employed by the Company. Nothing in the Plan shall be interpreted as creating a right of a Participant to receive any compensation or benefit from the Company. A Participant shall have no rights as a shareholder of the Company with respect to any Shares until the Shares are issued or transferred to the Participant on the books of the Company.
Section 11. Enforceability and Governing Law
To the extent not preempted by federal law, the Plan shall be construed, administered and enforced in accordance with the laws of the State of Indiana, regardless of the law that might otherwise govern under applicable principles or provisions of choice or conflict of law doctrines. To the extent that any provision of the Plan or portion thereof shall be found to be invalid or unenforceable, it such provision or portion of the Plan shall be considered deleted herefrom and the remainder of such provision and the Plan shall be construed and enforced as if such illegal or invalid provision had never been inserted herein. In addition, the remainder of the Plan shall be unaffected and shall continue in full force and effect.
Section 12. Forum Selection
To the fullest extent permitted by law, any action brought in whole or in part relating to the Plan the lawfulness of any Plan provision, the administration of the Plan, or the performance or non-performance of the Plan’s administrators and fiduciaries, shall be filed in one of the following jurisdictions: (i) the jurisdiction in which the Plan is principally administered, which is currently the United States District Court for the Southern District of Indiana; or (ii) in the case of a putative class action, the jurisdiction in which the largest number of putative class members resides (or if that jurisdiction cannot be determined, the jurisdiction in which the largest number of class members is reasonably believed to reside).
If any action is filed in a jurisdiction other than one of those described above, then the Plan, all parties to such action that are related to the Plan (such as a Plan fiduciary, administrator or party in interest) and all alleged Plan Participants and Beneficiaries shall take all necessary steps to have the action removed to, transferred to or re-filed in a jurisdiction described above. Such steps may include, but are not limited to, (i) a joint motion to transfer the action; or (ii) a joint motion to dismiss the action without prejudice to its re-filing in a jurisdiction described above, with any applicable time limits or statutes of limitations applied as if the suit or class action allegation had originally been filed or asserted in a jurisdiction described above at the same time that it was filed or asserted in a jurisdiction not described therein.
This forum selection provision is waived, with respect to an action, if no party invokes it within 120 days of the filing of an action. This provision does not relieve any claimant from any obligation existing under the Plan or by law to exhaust administrative remedies before initiating litigation.
Section 13. Scrivener’s Errors
The Plan shall be applied and interpreted without regard to any scrivener's error in this instrument. The determination whether a scrivener's error has occurred shall be made by the Plan Administrator in the exercise of the Plan Administrator’s best judgment and sole discretion, based on the Plan Administrator’s understanding of the intent of the Company as settlor of the Plan, and taking into account such evidence, written or oral, as the Plan Administrator deems appropriate or helpful. The Plan Administrator is authorized to correct any scrivener's errors the Plan Administrator discovers in this instrument, retroactively or prospectively.
Section 14. Rules of Construction
For purposes of the Plan, unless the contrary is clearly indicated by the context:
(a) the use of the masculine gender in this Plan shall also include within its meaning the feminine gender and vice versa;
(b) the use of the singular shall also include within its meaning the plural and vice versa;
(c) the word "include" shall mean to include, but not to be limited to;

PROXY STATEMENT P80P80
(d) any reference to a statute or section of a statute shall further be a reference to any successor or amended statute or section, and any regulations or other guidance of general applicability issued thereunder;
(e) the title of an officer, employee, or entity used in this Plan means the respective officer, employee, or entity of Eli Lilly and Company and means any successor title to such position as such title may be changed from time to time;
(f) references to the Plan Administrator, or other named fiduciary, officer or employee of the Company, or other person or entity with responsibility or authority under the Plan shall include delegates (if any) of such entity or person, with respect to such entity's or person's delegated responsibilities; and
(g) the captions and headings of each article, section, paragraph, and other provision of the Plan are for convenience and reference only and are not to be considered in interpreting the terms and conditions of the Plan.
Section 15. Effective Date; Amendment and Termination
The Plan, as amended and restated, shall become effective for the 2009 deferrals on and after January 1, 2017, and for each Plan Year (except as to the share limit specified in Section 5(c), which shall become effective October 20, 2008) and for future Plan Years thereafter until terminated by the Board, contingent upon receiving the approval of the Company’s shareholders at the Company’s 2017 annual meeting. The Board may amend or terminate the Plan at any time and in any manner; provided that no amendment or termination shall reduce the amount credited to a Participant’s Account at the time of any such amendment or termination, and no amendment shall be effective that shall cause the Plan to fail to meet the requirements of Section 409A. Upon termination of the Plan in accordance with the requirements of Section 409A, (i) all future deferrals of compensation will cease, (ii) all Plan Accounts will continue to receive interest credits (or be invested) as permitted under the Plan, and (iii) all Plan Accounts will be distributed in accordance with the Participant’s elections under the provisions of the Plan, unless the Company determines in its sole discretion that all such amounts shall be distributed upon termination in accordance with the requirements of Section 409A.

PROX
Y STA
TEME
NT
P81P81
APPENDIX A
GRANDFATHERED AMOUNTS
Distribution of amounts that were earned and vested (within the meaning of Section 409A) under the Plan prior to 2005 (and earnings thereon) and are exempt from the requirements of Section 409A shall be made in accordance with the Plan terms as in effect on January 1, 2004, as attached below.
THE LILLY DIRECTORS' DEFERRAL PLAN(As amended and restated through January 1, 2004)
Section 1. Establishment of the Plan and Shares Available.
1.1. Establishment of Plan. This Plan was established effective January 1, 1996, to permit Directors of the Company who are not salaried employees of the Company to voluntarily defer receipt of some or all of their meeting fees and retainer and to share in the long-term growth of the Company by acquiring, on a deferred basis, an ownership interest in the Company. This amended and restated Plan is effective January 1, 2004.
1.2. Shares Available. Subject to adjustment as provided in Section 7.5, the aggregate number of shares of Eli Lilly and Company common stock that may be issued or transferred under this Plan after April 28, 2003, is 750,000. The shares may be authorized and unissued shares or treasury shares.
Section 2. Definitions.
The following terms shall have the definitions set forth in this Section 2:
2.1. Annual Allocation Date. The last Business Day in November of each calendar year, or such other annual date, not earlier than the third Monday in February, established by the Committee as the date as of which Shares are allocated to each Share Account in accordance with Section 6.
2.2. Beneficiary. The beneficiary or beneficiaries (including any contingent beneficiary or beneficiaries) designated pursuant to subsection 8.3 hereof.
2.3 Business Day. A day on which the Company’s corporate headquarters are open for regular business.
2.4. Board of Directors. The Board of Directors of the Company.
2.5. Committee. The Directors and Corporate Governance Committee of the Board of Directors, or any successor committee of the Board of Directors that is charged with matters relating to the compensation of non-employee directors.
2.6. Company. Eli Lilly and Company.
2.7. Company Credit. For any calendar year or part thereof, an amount computed, and credited annually to a Participant's Deferred Compensation Account at an annual rate that is equal to one hundred twenty percent (120%) of the applicable federal long-term rate, with compounding (as prescribed under Section 1274(d) of the Internal Revenue Code) that was in effect for the month of December immediately preceding the calendar year.
2.8. Deferred Amount. The amount of a Monthly Deferral Participant's Monthly Compensation that the Participant elects to defer in accordance with Section 4 hereof.
2.9. Deferred Stock Participant. A Director who is not, and for the preceding 12 months has not been, a salaried employee of the Company and who becomes a Participant in the Plan in accordance with Section 3 hereof.
2.10. Director. A member of the Board of Directors.
2.11. Dividend Payment Date. The date as of which the Company pays a cash dividend on Shares.

PROXY STATEMENT P82P82
2.12. Dividend Record Date. With respect to any Dividend Payment Date, the date established by the Board of Directors as the record date for determining shareholders entitled to the dividend.
2.13. Individual Accounts or Accounts. The separate accounts (the Deferred Compensation Account and the Share Account) described in Section 7 hereof. When used in the singular, the term shall refer to one of these two accounts, as the context requires.
2.14. Monthly Compensation. For any month, the monthly retainer and the aggregate of all meeting fees, committee fees and committee chairperson fees to which a Director is entitled for services rendered to the Company as a Director during the month, as established from time to time by resolution of the Board of Directors. For avoidance of doubt, Monthly Compensation does not include stock options granted to Directors or the Shares allocated pursuant to Section 6 of this Plan.
2.15. Monthly Deferral Participant. A Director who is not a salaried employee of the Company and who has elected to defer all or part of his or her Compensation pursuant to the Plan in accordance with Section 4 hereof.
2.16. Participant. A Director who is a Deferred Stock Participant, a Monthly Deferral Participant, or both.
2.17. Plan. The Lilly Directors' Deferral Plan, as set forth herein and as it may be amended from time to time.
2.18. Share. A share of common stock of the Company. 2.19. Valuation Date. For any month, the third Monday of the month, or if Shares are not traded on the
New York Stock Exchange on such third Monday, the next day on which Shares are traded on the New York Stock Exchange.
Section 3. Deferred Stock Participants.
Each Director who participated in The Lilly Non-Employee Directors' Deferred Stock Plan immediately before the effective date of this Plan shall continue as a Deferred Stock Participant on such effective date, and all elections in effect under The Lilly Non-Employee Directors' Deferred Stock Plan shall remain in effect under this Plan, unless and until amended in accordance with this Plan. Thereafter, each person who becomes a Director, and who is not, and for the preceding 12 months has not been, a salaried employee of the Company, shall become a Deferred Stock Participant.
Section 4. Monthly Deferral Participants.
Each Director who participated in The Lilly Directors' Deferred Compensation Plan immediately before the effective date of the Plan shall continue as a Monthly Deferral Participant on such effective date, and all elections in effect under The Lilly Directors' Deferred Compensation Plan shall remain in effect under this Plan, unless and until amended in accordance with this Plan. Prior to the beginning of each calendar year, any Director who is not a salaried employee of the Company may defer the receipt of Monthly Compensation to be earned by the Director during such year by filing with the Company a written election that:
(i) defers payment of a designated amount (of one Thousand Dollars ($1,000) or more) or percentage of his or her Monthly Compensation for services attributable to the following calendar year or portion thereof (the "Deferred Amount");
(ii) specifies the payment option selected by the Participant pursuant to subsection 8.2 hereof for such Deferred Amount; and
(iii) specifies the option selected by the Participant pursuant to Section 5 hereof for such Deferred Amount.
The amount deferred may not exceed the Director's aggregate Monthly Compensation for the calendar year. Notwithstanding the foregoing, any individual who is newly elected or appointed to serve as a Director may, not later than thirty (30) days after his election or appointment becomes effective, elect in accordance with the preceding

PROX
Y STA
TEME
NT
P83P83
provisions of this Section 4, to defer the receipt of Monthly Compensation earned during the portion of the current calendar year that follows the filing of the election with the Company. Except as provided in subsections 8.2 and 8.4 hereof, any elections made pursuant to this Section 4 with respect to a calendar year shall be irrevocable when made. If a Participant fails to make an election under section 5 with respect to his or her Deferred Amount for a future calendar year, the Participant's previous election shall remain in effect, provided that the Participant may amend his or her election with regard to a future calendar year at any time.
Section 5. Form of Deferred Compensation Credits.
5.1. Deferred Compensation Account. Except with respect to Deferred Amounts which a Monthly Deferral Participant elects to have credited in Shares in accordance with subsection 5.2 hereof, the Deferred Amount shall be denominated in U.S. dollars and credited to the Participant's Deferred Compensation Account pursuant to subsection 7.1 hereof.
5.2. Shares. Prior to the beginning of each calendar year, a Monthly Deferral Participant may elect to have all or a percentage of the Deferred Amount for the following calendar year credited in Shares and allocated to the Participant's Share Account pursuant to subsection 7.2 hereof.
Section 6. Annual Allocations to Share Accounts.
6.1. Annual Allocation of Shares. As of the Annual Allocation Date of each calendar year, there shall be allocated to the Share Account (as described in Section 7.2 below) of each Deferred Stock Participant who is a Director on that date, as part of his or her compensation for service on the Board of Directors, seven hundred (700) Shares or such other number of Shares, not to exceed 3,000 shares, as may be specified from time to time by resolution of the Board of Directors.
Section 7. Individual Accounts.
The Company shall maintain Individual Accounts for Participants as follows:
7.1. Deferred Compensation Account. The Company shall maintain a Deferred Compensation Account in the name of each Monthly Deferral Participant who elects to defer the receipt of Monthly Compensation pursuant to Section 4 hereof for a calendar year and does not elect to have the Deferred Amount for such calendar year credited in Shares pursuant to subsection 5.2 hereof. The Deferred Compensation Account shall be denominated in U.S. dollars, rounded to the nearest whole cent. For each month, Deferred Amounts allocated to a Deferred Compensation Account pursuant to subsection 5.1 hereof shall be credited to the Deferred Compensation Account as of the last Business Day of the month.
7.2. Share Account. The Company shall maintain a Share Account for each Deferred Stock Participant and for each Monthly Deferral Participant who elects to have a Deferred Amount credited in Shares pursuant to subsection 5.2 hereof. The Share Account shall be denominated in Shares and maintained in fractions rounded to three (3) decimal places. Shares allocated to each Share Account shall be hypothetical and not issued or transferred by the Company until payment is made pursuant to Section 8 hereof.
For each month, Deferred Amounts allocated to a Share Account pursuant to subsection 5.2 hereof shall be credited to the Share Account as of the last Business Day of the month. Shares and, if necessary, fractional Shares, shall be credited based upon the average of the high and low price of Shares on the New York Stock Exchange on the Valuation Date for that month.
7.3. Accrual of Company Credit. The Treasurer of the Company shall determine the annual rate of Company Credit on or before December 31 of each calendar year. This rate shall be effective for the following calendar year. The Company Credit shall accrue monthly, at one-twelfth of the applicable annual rate, on all amounts credited to a Participant's Deferred Compensation Account, including the Company Credits for prior years. The Company Credit shall not accrue on any amount distributed to a Participant (or to the Participant's Beneficiary) during the month for which the accrual is determined, except where an amount is distributed to a Beneficiary in the month of the Participant's death. The Company Credit for each year shall be credited to each Deferred Compensation Account as of December 31 of that year and shall be compounded monthly.

PROXY STATEMENT P84P84
7.4. Cash Dividends. Cash dividends paid on Shares shall be deemed to have been paid on the Shares allocated to each Participant's Share Account as if the allocated Shares were actual Shares issued and outstanding on the Dividend Record Date. An amount equal to the amount of such dividends shall be credited in Shares to each Share Account as of the last Business Day of each month in which a Dividend Payment Date occurs, based upon the average of the high and low prices for Shares on the New York Stock Exchange on the Valuation Date for that month.
7.5. Capital Adjustments. The number of Shares referred to in Sections 1.2 and 6 hereof and the number of Shares allocated to each Share Account shall be adjusted by the Committee, as it deems appropriate in its discretion, in the event of any subdivision or combination of Shares or any stock dividend, stock split, reorganization, recapitalization, or consolidation or merger with Eli Lilly and Company as the surviving corporation, or if additional shares or new or different shares or other securities of the Company or any other issuer are distributed with respect to Shares through a spin-off or other extraordinary distribution.
7.6. Account Statements. Within a reasonable time following the end of each calendar year, the Company shall render an annual statement to each Participant. The annual statement shall report the number of Shares credited to the Participant's Share Account as of December 31 of that year and the dollar amount, if any, credited to the Participant's Deferred Compensation Account as of December 31 of that year.
Section 8. Payment Provisions.
8.l. Method of Payment. All payments to a Participant (or to a Participant's Beneficiary) with respect to the Participant's Deferred Compensation Account shall be paid in cash. Except as provided in Section 8.5, all payments to a Participant (or to a Participant's Beneficiary) with respect to the Participant's Share Account shall be paid in Shares, at which time the Shares shall be issued or transferred on the books of the Company. All Shares to be issued or transferred hereunder may be newly issued or treasury shares. Fractional Shares shall not be issued or transferred to a Participant, provided that in the case of a final payment under the Plan with respect to a Participant, any fraction remaining in the Participant's Share Account shall be rounded up to the next whole Share and that number of whole Shares shall be issued or transferred. If Shares are not traded on the New York Stock Exchange on any day on which a payment of Shares is to be made under the Plan, then that payment shall be made on the next day on which Shares are traded on the New York Stock Exchange.
8.2. Payment Options. Prior to each calendar year, or within 30 days after becoming a Participant, the Participant shall select a payment election with respect to the payment of one or both of the Participant's Individual Accounts from the following payment elections:
(i) a lump sum in January of the calendar year immediately following the calendar year in which the Participant ceases to be a Director;
(ii) a lump sum in January of the second calendar year following the calendar year in which the
Participant ceases to be a Director;
(iii) annual (or, in the case of the Deferred Compensation Account only, monthly) installments over a period of two to ten years commencing in January of the calendar year following the calendar year during which the Participant ceases to be a Director; or
(iv) annual (or in the case of the Deferred Compensation Account only, monthly) installments over a period of two to ten years commencing in January of the second calendar year following the calendar year in which the Participant ceases to be a director.
If a payment option described in paragraphs (i) or (ii), above, has been elected, the amount of the lump sum with respect to the Participant's Deferred Compensation Account shall be equal to the amount credited to the Participant's Deferred Compensation Account as of the December 31 immediately preceding the date of the payment, and the amount of the lump sum with respect to the Participant's Share Account shall be equal to the number of Shares credited to the Share Account as of the December 31 immediately preceding the date of payment. If a payment option described in paragraphs (iii) or (iv), above, has been elected, the amount of each installment with respect to the Participant's Deferred Compensation Account shall be equal to the amount credited to the Participant's Deferred Compensation Account as of the last day of the month immediately preceding the date of a monthly installment payment, or the December 31 immediately preceding the date of an annual installment

PROX
Y STA
TEME
NT
P85P85
payment, divided by the number of installment payments that have not yet been made. The amount of each installment with respect to the Participant's Share Account shall be equal to the number of Shares credited to the Participant's Share Account as of the December 31 immediately preceding the date of an annual installment payment, divided by the number of installment payments that have not yet been made.
A Participant may elect that his or her final payment election may control over all prior payment elections. If the Participant fails to elect a payment option, the amount credited to the Participant's Individual Account shall be distributed in a lump sum in accordance with the payment option described in paragraph (i) above. At the time of any scheduled payment, if the amount credited to a Participant's Deferred Compensation Account or the value of Shares credited to a Participant's Share Account is less than $25,000, the Committee, in its sole discretion, may pay out the Account in a lump sum.
8.3. Payment Upon Death. Within a reasonable period of time following the death of a Participant, the amount credited to the Participant's Deferred Compensation Account and the Shares credited to the Participant's Share Account shall be paid by the Company in a lump sum to the Participant's Beneficiary. For purposes of this subsection 8.3, the amount credited to the Participant's Deferred Compensation Account and the number of Shares credited to the Participant's Share Account shall be determined as of the later of the date of death or the last Business Day of the month prior to the month in which the payment occurs.
A Participant may designate the Beneficiary, in writing, in a form acceptable to the Committee before the Participant's death. A Participant may revoke a prior designation of Beneficiary and may also designate a new Beneficiary without the consent of the previously designated Beneficiary, provided that such revocation and new designation (if any) are in writing, in a form acceptable to the Committee, and filed with the Committee before the Participant's death. If the Participant does not designate a Beneficiary, or if no designated Beneficiary survives the Participant, any amount not distributed to the Participant during the Participant's life shall be paid to the Participant's estate in a lump sum in accordance with this subsection 8.3.
8.4. Payment on Unforeseeable Emergency. The Committee may, in its sole discretion, direct payment to a Participant of all or of any portion of the Participant's Individual Account balance, notwithstanding an election under subsection 8.2 above, at any time that it determines that such Participant has an unforeseeable emergency, and then only to the extent reasonably necessary to meet the emergency. For purposes of this section, "unforeseeable emergency" means severe financial hardship to the Participant resulting from a sudden and unexpected illness or accident of the Participant or of a dependent of the Participant, loss of the Participant's property due to casualty, or other similar extraordinary and unforeseeable circumstances arising as a result of events beyond the control of the Participant. The circumstances that will constitute an unforeseeable emergency will depend upon the facts of each case, but, in any case, payment may not be made to the extent that such hardship is, or may be, relieved --
(i) through reimbursement or compensation by insurance or otherwise;
(ii) by liquidation of the Participant's assets, to the extent the liquidation of such assets would not itself cause severe financial hardship; or
(iii) by cessation of deferrals under the Plan.
Examples of what are not considered to be unforeseeable emergencies include the need to send a Participant's child to college or the desire to purchase a home.
8.5. Payment of Cash in Lieu of Shares. If at any time the Committee shall determine that payment of Shares to a Participant (or a Participant’s Beneficiary) or the ownership or subsequent disposition of such Shares by such Participant or Beneficiary may violate or conflict with any applicable law or regulation, the Committee may, in its discretion, pay all or a portion of the Participant’s Share Account in cash. In this case, the amount of cash shall be determined with reference to the average of the high and low trading price for Shares on the December 31 next preceding the date of payment, or if Shares are not traded on that day, the next preceding trading day.
Section 9. Ownership of Shares.
A Participant shall have no rights as a shareholder of the Company with respect to any Shares until the Shares are issued or transferred to the Participant on the books of the Company.

PROXY STATEMENT P86P86
Section 10. Prohibition Against Transfer.
The right of a Participant to receive payments of Shares and cash under the Plan may not be transferred except by will or applicable laws of descent and distribution. A Participant may not assign, sell, pledge, or otherwise transfer Shares or cash to which he is entitled hereunder prior to transfer or payment thereof to the Participant, and any such attempted assignment, sale, pledge or transfer shall be void.
Section 11. General Provisions.
11.1. Director's Rights Unsecured. The Plan is unfunded. The right of any Participant to receive payments of cash or Shares under the provisions of the Plan shall be an unsecured claim against the general assets of the Company.
11.2. Administration. Except as otherwise provided in the Plan, the Plan shall be administered by the Committee, which shall have the final authority to adopt rules and regulations for carrying out the Plan, and to interpret, construe, and implement the provisions of the Plan.
11.3. Legal Opinions. The Committee may consult with legal counsel, who may be counsel for the Company or other counsel, with respect to its obligations and duties under the Plan, or with respect to any action, proceeding, or any questions of law, and shall not be liable with respect to any action taken, or omitted, by it in good faith pursuant to the advice of such counsel.
11.4. Liability. Any decision made or action taken by the Board of Directors, the Committee, or any employee of the Company or any of its subsidiaries, arising out of or in connection with the construction, administration, interpretation, or effect of the Plan, shall be absolutely discretionary, and shall be conclusive and binding on all parties. Neither the Committee nor a member of the Board of Directors and no employee of the Company or any of its subsidiaries shall be liable for any act or action hereunder, whether of omission or commission, by any other member or employee or by any agent to whom duties in connection with the administration of the Plan have been delegated or, except in circumstances involving bad faith, for anything done or omitted to be done.
11.5. Withholding. The Company shall have the right to deduct from all payments hereunder any taxes required by law to be withheld from such payments. The recipients of such payments shall bear all taxes on amounts paid under the Plan to the extent that no taxes are withheld thereon, irrespective of whether withholding is required.
11.6. Legal Holidays. If any day on which action under the Plan must be taken falls on a Saturday, Sunday, or legal holiday, such action may be taken on the next succeeding day that is not a Saturday, Sunday, or legal holiday; provided, that this subsection 11.8 shall not permit any action that must be taken in one calendar year to be taken in any subsequent calendar year.
11.7. Participant Who Becomes Employee. If a Participant becomes an employee of the Company but remains a Director, he or she will no longer be entitled to new deferrals under the Plan as a Deferred Stock Participant or Monthly Deferral Participant. However, the individual’s Account balances will continue to be administered under the Plan (including eligibility for the Company Credit and Cash Dividends under Sections 7.3 and 7.4) until they are paid out in accordance with Section 8.
Section 12. Term, Amendment, Suspension, and Termination.
The Plan shall remain in effect until terminated by the Board of Directors. The Board of Directors shall have the right at any time, and from time to time, to amend, suspend, or terminate the Plan, subject to the following:
(i) no amendment or termination shall reduce the number of Shares or the cash balance in an Individual Account;
(ii) the number of Shares allocated annually pursuant to Section 6 hereof may not be changed more frequently than every calendar year; and

PROX
Y STA
TEME
NT
P87P87
(iii) to the extent required by New York Stock Exchange listing rules or applicable law, material amendments shall be submitted to the Company’s shareholders for approval.
Section 13. Applicable Law.
The Plan shall be governed by, and construed in accordance with, the laws of the State of Indiana, except to the extent that such laws are preempted by Federal law.
Section 14. Effective Date.
The effective date of this Plan is January 1, 1996. Nothing herein shall invalidate or adversely affect any previous election, designation, deferral, or accrual in accordance with the terms of The Lilly Directors' Deferred Compensation Plan or The Lilly Non-Employee Directors' Deferred Stock Plan that were in effect prior to the effective date of this Plan.

P88P88
Annual Meeting Admission Ticket
Eli Lilly and Company 2017 Annual Meeting of Shareholders Monday, May 1, 201711:00 a.m. EDT
Lilly Center Auditorium Lilly Corporate Center Indianapolis, Indiana 46285
The top portion of this page will be required for admission to the meeting.
Please write your name and address in the space provided below and present this ticket when you enter the Lilly Center.
Doors open at 10:15 a.m.
Name
Address
City, State, and Zip Code
Parking Pass
Directions and Parking From I-70 take Exit 79B; follow signs to McCarty Street. Turn right (east) on McCarty Street; go straight into Lilly Corporate Center. You will be directed to parking. Be sure to take the admission ticket (the top portion of this page) with you to the meeting and leave this parking pass on your dashboard.
P89P89
Take the top portion of this page with you to the meeting.
Detach here
Eli Lilly and Company Annual Meeting of Shareholders May 1, 2017
Please place this identifier on the dashboard of your car as you enter Lilly Corporate Center so it can be clearly seen by security and parking personnel.

Corporate Information
ANNUAL MEETINGThe annual meeting of shareholders will be held at the Lilly Center Auditorium, Lilly Corporate Center, Indianapolis, Indiana, on Monday, May 1, 2017, at 11:00 a.m. EDT. For more information, see the proxy statement section of this report.
10-K AND 10-Q REPORTSPaper copies of the company’s annual report to the Securities and Exchange Commission on Form 10-K and quarterly reports on Form 10-Q are available upon written request to:
ELI LILLY AND COMPANYc/o Corporate SecretaryLilly Corporate CenterIndianapolis, Indiana 46285
To access these reports more quickly, you can find all of our SEC filings online at: https://investor.lilly.com/sec.cfm.
STOCK LISTINGSEli Lilly and Company common stock is listed on the New York Stock Exchange, NYSE Euronext, and SIX Swiss Exchange. NYSE ticker symbol: LLY. Most newspapers list the stock as “Lilly (Eli) and Co.”
CEO AND CFO CERTIFICATESThe company’s chief executive officer and chief financial officer have provided all certifications required under Securities and Exchange Commission regulations with respect to the financial information and disclosures in this report. The certifications are available as exhibits to the company’s Form 10-K and 10-Q reports.
In addition, the company’s chief executive officer has filed with the New York Stock Exchange a certification to the effect that, to the best of his knowledge, the company is in compliance with all corporate governance listing standards of the Exchange.
TRANSFER AGENT AND REGISTRARWELLS FARGO SHAREOWNER SERVICES Mailing Address:
SHAREOWNER SERVICESP.O. Box 64854St. Paul, Minnesota 55164-0854
Overnight Address:SHAREOWNER SERVICES1110 Centre Pointe Curve, Suite 101Mendota Heights, Minnesota 55120-4100
Telephone: 1-800-833-8699E-mail: [email protected]: www.shareowneronline.com
DIVIDENT REINVESTMENT AND STOCK PURCHASE PLANWells Fargo Shareowner Services administers the Shareowner Service Plus Plan, which allows registered shareholders to purchase additional shares of Lilly common stock through the automatic investment of dividends. The plan also allows registered shareholders and new investors to purchase shares with cash payments, either by check or by automatic deductions from checking or savings accounts. The minimum initial investment for new investors is $1,000. Subsequent investments must be at least $50. The maximum cash investment during any calendar year is $150,000. Please direct inquiries concerning the Shareowner Service Plus Plan to:
WELLS FARGO SHAREOWNER SERVICESP.O. Box 64856St. Paul, Minnesota 55164-0856Telephone: 1-800-833-8699
ONLINE DELIVERY OF PROXY MATERIALSShareholders may elect to receive annual reports and proxy materials online. This reduces paper mailed to the shareholder’s home and saves the company printing and mailing costs. To enroll, go to https://investor.lilly.com/services.cfm and follow the directions provided.
© 2017 Eli Lilly and Company YEAR2016AR

ELI LILLY AND COMPANYLILLY CORPORATE CENTER INDIANAPOLIS, INDIANA 46285 USA317-276-2000 | www.lilly.com
Printed on 10% post-consumer recycled paper