electronic systems · pdf fileelectronic systems division i 13 april 1973 distributed by: ......
TRANSCRIPT

AD-760 817
FREQUENCY-SELECTIVE LIMITER AND ITS APPLICATION IN A FILTER BANK RECEIVER
Rex C. S Ohien
Massachusetts Institute of Technology
Prepared for:
Electronic Systems Division
i
13 April 1973
DISTRIBUTED BY:
mi] National Technical Information Service U. S. DEPARTMENT OF COMMERCE 5285 Port Royal Road, Springfield Va. 22151
- ■ -■■ .MM^MMMBMMM


^^^^i^^^^^ iiiwimip ■■ i nw^t^mm^m ■■■■ ■ . ■>
'*#
MASSACHUSETTS INSTITUTE OF TECHNOLOGY
LINCOLN LABORATORY
FREQUENCY-SELECTIVE LIMITER AND ITS APPLICATION IN A FILTER BANK RECEIVER
R. C. S. CHIEN
Group 91
TECHNICAL NOTE 1973-1
13 APRIL 1973
' f-s
Approved for public release; distribution unlimited.
LEXINGTON MASSACHUSETTS
'I
■ ■ ■- * — —■ - i

The work reported in this document was performed at Lincoln Laboratory, a center for research operated by Massachusetts Institute of Technology, with the support of the Department of the Air Force under Contract Fl%28-73-C-0002.
This report may be reproduced to satisfy needs of U.S. Government agencies.
Ü
M I ■■ -— ■■■ I '-- ■-- - , - -- - —^^^i^m^mm^t*m^mm*t A

mmm
UNCIASSHIFD Security Classification
DOCUMENT CONTROL DATA - R&D (Smrurlly clnflllcttlon ol Uli», body ol mbtlfd mnd Indaxlnt «nnoCaflnn mini be »nltrmd whtn the ov»r»lt fpotl It cl»*iltl»d)
I. ORI0INATIN0 ACTIVITY (Corpotnl« author)
Lincoln Lal)orutory, M. l.T.
2a. REPORT SECURITY CLASSIFICATION
Unclassified 2b. CROUP
None
». REPORT TITLE
Frequency-Selective Limitcr and Its Application In a Filter Bank Receiver
4. DESCRIPTIVE NOTES (Typo ol tepori and Incluilvo dalot)
Technicul Note 5. AUTHORISI (Last nanip, lift name, Initial)
Chien, Rex C. S.
8. REPORT DATE
13 April 1973
»«. CONTRACT OR GRANT NO. Fl 9628-73-C-0002
b. PROJECT NO. 627A
7a. TOTAL NO. OF PAGES
62 76. NO. OF REFS
12
«a. ORIGINATOR'S REPORT NUMBERISI
Technical Note 1973-1
tb. OTHER REPORT NOIS» (Any other number» that mny be aeelened Ihl» report)
ESD-TR-73-81
10. AVAILABILITY/LIMITATION NOTICES
Approved for public release; distribution unlimited.
II. SUPPLEMENTARY NOTtS
None
12. SPONSORING MILITARY ACTIVITY
Air Force Systems Command, USAF
13. ABSTRACT
One imporiant ivquircnu'nl in tilt* Implcmcntatjon of responsive couniennrasures is lo be able to sense the electronic order of hattle. Tliis levlimque can have application t« niHny classes of countenneaKures such as jamming, maskinf;, communications or homing. The process of si'nsmg the electromagnetic spectrum requires the alulity to select a narrow portion of the spectrum ami evaluate the signals presenr. One pielhixl to do tins is with a liank of filters, There is, however, a common difficulty encountered in building the filter hank, that is tin' exireinely high roll-off rate required o( the liamtpass fillers to reject the strong out-of-band signals, This stringent require- ment Imposes a highly complicated design on the filter bank.
One solution is to reduce the cuiiiplexity of the filler Iwnk by nonnall/ing the sipial levels by a frequency-selective limitcr (FSU, lly normalising all signal levels at an equal amplilmle ticfore feeding them into the filter lunk, the necessity of constructing bandpass filters with hipli rejection rates can be' greatly reduced.
The oivr.iiing theory of jiaramethe b'Sl.'s and the measured results of a yttrium Iron garnet (Ylvl) TSI, under different sigiul environ- ments are reported, iMtqihasis is given to ajiphcation YIC". l-Sl.'s as level nonualizers in a filter bank receiver.
YKI rsi. opT.ition is dlscussfd via a hiislc analytical motlel. In this study, transient response to pulsed KP signals, frequency modu- laled sipials, small signal snjtpression and intermodtilahon jTrodoct phenomena when two signals are simultaneously received, ate also repnned.
Kiqiennu'iiiiit results oUained aj'.ree with the analytical model. Kxtenslve data are provided to facilitate design of Y10 FSl.'s in filler lunk receivers.
Specific applications lor YKI l-'SL's are presented; Yin I'Sl. as a level norm.ili7.er. cascading YUl TSI.'s to obtain large limiting range, threshold level ilelection inflneiu ed by small signal suppression, and use of a Yhl 1SI. to offset amplitude reduction of b.indjiass fillers caused by a sweep signal.
A filter bank r comprising Ylti FSl.'s is presently under construction.
14. KEY WORDS
frcquciKy-solcctivL' limiter filler bank receiver
satellite communications re-entry systems
YIC
,,11-IBOO
♦ •I UNCLASSIl'll-D
Secutily Clusüificatioii
i iiiniir, i i-- ,
■ '- mmimmmtamtKtittm

s .«.-^«..^.««»»^»«"■»••»»»•■Bovmsw«».-
Specific applications for YIG FSL's are presented: YIG FSL as a level normallzer,
cascading YIG FSL's to obtain large limiting range, threshold level detection
influenced by small signal suppression, and use of a YIG FSL to offset amplitude
reduction of bandpass filters caused by a sweep signal.
A filter bank receiver comprising YIG FSL's is presently under construction.
Accepted for the Air Force Joseph J. Whelan. USAF Acting Chief, Lincoln Laboratory Liaison Office
IV
.11- -..IIII »mi i n ili—imlin iii-i.j..iii niiiiiuMmmtliiia
1
A

mm* WWPMMW'i
f.,
I
CONTENTS
f.'
V... w r
Abstract
Introduction 1
I. Operation of a Parametric FSL 3
A. Basic Models 3
a Circuit Model 6
C. YIG FSL 10
1. Intermodulatlon Products 11
2. Small Signal Suppression 15
3. Response to a Time-Frequency Coded CW Signal 19
4. Linear Frequency Modulation Response 19
II. YIG FSL Experimental Results 23
A. Power Distributions 24
B. Leakage Spike 28
C. Small Signal Suppression 32
D. Intermodulatlon Products 35
E. Linear FM Responses 36
III. Application of the YIG FSL to Filter Bank Receivers 42
A. YIG FSL as a Level Normalizer 42
B. Cascading YIG FSL's to Achieve Large Limiting Range 44
C. 3rd Order IM Products to Filter Bank Receiver 45
D. Small Signal Suppression and the Threshold Level Detector 48
E. Response of a YIG FSL and Filter Bank Receiver to an LFM Signal 50
■ ■-*'■• - - — — MMMMaa ■MMMMJI

r ra mmmm^~^^^^mfr*mmmmii\ ..... m.w.aiiiwi.liRMiiiHmip mi
HUHMWWWI'Mi
CONTENTS (Continued)
IV. Conclusion
Acknowledgment
References
54
54
55
VI
i - -"•"—■■—-—■■

Wi»««—,
mmmmmmumm
I'VHmmiHMMi nimmminnrnwiiiiiuiMwi
■ IIM^I inwin ii IMIIHHII IIIIW—i.
INTRODUCTION
;'
Although Interesting applications of yttrium Iron garnet (YIG) frequency-selective
llmlters (FSL's) have been reported In the literature during the past decade, their
value as a building block In communication systems has received only nominal
attention. FSL's tend not to be "captured" by strong signals, and the Intermodulatlon
products are generally negligible In the presence of more than one signal. Such
characteristics could be used advantageously In an ECM receiver system (Fig. 1)
that uses a large number of contiguous bandpass filters to detect and Identify the
frequencies of received signals. (Generally, the absolute strengths at the outputs
are of no Interest.) Once the level of a signal reaches a preset threshold, the
trigger circuit Is initiated to record Incoming signals and their frequencies
corresponding to positions of the filters.
[iliUiill
BANDPASS FILTER
THRESHOLD DETECTOR V
-]
FSL k
• •
• •
• •
BANDPASS FILTER
THRESHOLD DETECTOR
•- CH
CH N
Fig. 1. Filter bank receiver.
One difficulty encountered in building the filter bank is the extremely high roll-
off rate required of the bandpass filters. Consider a wide range of signal levels
■ i. a ii maM — ■■■ n tniiiim«!"-

mmmm iMMMRPiiiMnMpnipmmm www iHHIiiii^ii ■!■ n i ^I.IIIU im W^fWpiWH
applied to a bandpass filter wi± finite roll-off rate; if the threshold is set to detect
the smallest in-band signal desired, then a large signal whose signal frequency falls
outside the passband could also reach the threshold and trigger the output circuits.
An extremely strong signal could trigger many channels and disable the system.
A straightforward solution is to build bandpass filters that contain many stages.
The more poles there are in the bandpass filters, the higher the roll-off rate that
can be obtained. However, the total number of stages of the filter bank will be
equal to die number of stages times the number of channels of the filter bank.
Complexity, size and weight are therefore multiplied.
A solution to the problem is to normalize the signal levels by FSL's before they
arc fed into the filter bank. If signals fed into the filter bank possess equal
amplitude, out-of-band triggering can be prevented by setting the threshold at the
intersection point of the bandpass filters. Ideally, normalized signals can be
identified with the simplest one-pole filter bank. As a result, high roll-off rate
is no longer necessary and the complexity of the filter bank can be greatly reduced.
The FSL can be considered as a device whose input signal levels (Fig. 2) arc large
O ■D ^- _i a. 5 •4
i
1 : 1
PREQUEN :Y
18-9- ^OGl
LIMITING THRESHOLD
a) INPUT SIGNALS
FREQUENCY
b) OUTPUT SIGNALS
Fig. 2. I L (a) input and (b) output signal level.
■ -- ■-"- -■ ■■ -.;... ■■... . n i^»'1 ' _J___^__^^.
I
P:
and diverse, whereas the output signals are normalized with respect to the limiting
threshold. Consequently, the FSL Is a self-adaptive device that will normalize
levels on a frequency-by-frequency basis.
FSL devices with these characteristics have been constructed In various types: 12 3
magnetoelastlc, nuclear magnetic, electron paramagnetic, and spin-wave. Only
the spin-wave mode of a YIG sphere Is practical and most attractive In terms of
simplicity of construction, size, weight and performance.
The purpose of this report Is to present the operating theory and measurement results
for a YIG FSL under different signal environments. Application of the YIG FSL in a
filter bank receiver for signal spectrum Identification Is emphasized, but the
measurement results are applicable to other types of systems such as multi-
channel satellite communications and anti-jamming receivers.
Operation of the YIG FSL Is discussed In Section I via analytical models. Measure-
ment of 1) power distribution, 2) leakage spike, 3) small signal suppression,
4) Intermodulatlon (IM) products, and 5) linear frequency modulation response are
presented in Section II. Section III deals with applications of the YIG FSL as a
level normalizer with particular attention to: 1) cascading YIG FSL to obtain large
limiting range, 2) 3rd order IM products, 3) small signal suppression and threshold
level detector, and 4) response of a YIG FSL filter bank receiver to a linear FM signal.
I. Operation of a Parametric FSL
A. Basic Models
The basic analytical model of a parametric llnuter was developed and 4
analyzed by Ho and Siegman. Their primary Interest was to use the llmlter's phase
distortionless characteristics. This model permits qualitative explanation of basic
YIG FSL operation, and in a restricted manner, (because of the lack of basic YIG FSL 5, 6
parameters) its numerical analysis.
■--■ ..-w^.— j^^nyjygnm^l mm HMMHM

mmmmmm
Two resonant tanks of frequency j' and JU/2 are coupled hv a nonlinear flenuni hi
what is basically a parametric oscillator (Fig. 0. Input power Is coupled i«> die i
tank as is the output power.
II- i- JOM 1
NPUT OUTPUT
NONLINEAR t L E M E N T
Fig. j. Subharmonic oscillation Ilmitcr.
When an input signal at frecjuency JL is below a certain threshold, it will pass tlinnij..*
the i' tank as if subharmonic tank i/2 did not exist, and therefore, no subharmonic
oscillation existed in the v/2 tank. However, when the input [»wer is above ihreshold
[wwer P , oscillation will be excited at a frequency exactly half the input frequency.
The result is that part of the input power is transferred to maintain the sublinrmonic
oscillation, and part is reflected to the input source because of the Impedance mis-
match caused by die added equivalent conductance to t tank caused by oscillation in
the i/2 tank. These combined effects result in a sharp limiting characterlstk
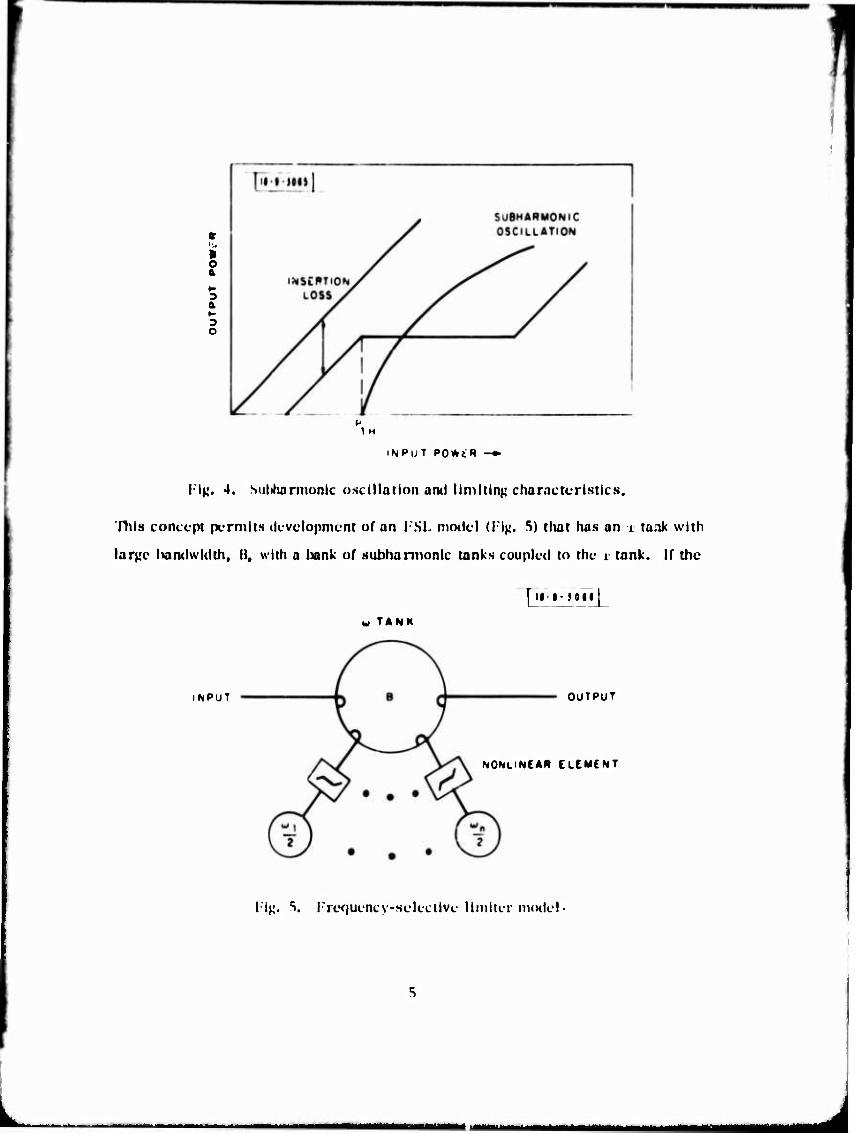
(Fig. 4). As input power increases, subharmonic oscillation continues to increase,
hut output power remains constant.
ntr MtIMM •■ ■■ ..-..^—. .-—.^Mam^uMi
i o &
3 a K 3 O
1 M
INPUT PO*iR -»
Fig. 4. Miltharmonk oscillation ami limiting characteristics.
Tills concept permits development of an I SL model (lij;. S) that has an i ta^ik with
large liamlwldth, I), wltti a bank of subharmonlc tanks coupled to the i tank. If the
[JM-JOJM]^
w TANK
INPUT OUTPUT
NONLINEAR ELEMENT
I i^. S. Prcquency-Hclectlvc llmlter model
■ m—!■

^r
subharmonlc tanks arc tuned contiguously In frequency across the iMindwidth, H/2, an
I'SL is formed. Thus, when the Input signal In bandwidth 13 is siiiallcr t'ian threshold
P ,, the x tank can Ix considered as an ordinary resonant tank inserted between the th
input and output. However, when the signal at x is above P. , the- eorrespondinfj
subharmonic tanks, xJl, will IK- excited into oscillation. Hence, one finds that each
subharmonlc tank reacts at only twice its resonant frequency (or at a small bandwidth
centered at r.). I'rcquencles separated by Iwindwidth " x1 will ix1 nnitually Independent
because their half frequencies do not fall In the same subharmonic tank. Consequently,
limiting Is done on a frequency •by-frequent . 'KTSIS.
IJ. Circuit Model
The parametric limltei can IK- demonstrated successfully by a circuit
model (1T^. 6) In the VI!!' band. Ihe circuit uses a varactor as the nonlinear
18-93067
(!)
C DV
-4f-
SOuRCt UJ RESONANT TANK i OA[) U-/2 WESÜNANT 'ANH
I i^;. 6, Circuit model for varactor diode parametric llmiter.
coupling element iK-nveen the .i and x/2 resonant tanks. When tliu i f2 tank is tuned
to exactly lialf tlic resonant fref|Uency of the L tank, and lire input signal i^ at the

^T"
I '■ww^tjiT^frrhi-i""'' < > !WiMBWi«WW'n
center frequency of die uu resonant circuit, the circuit can be analyzer by solving
differential equations describing the model:
dVi n -> 'i i dIi
dt 2Q vl ' 2C 1/2 2C J 2dC dt (1)
dV 1/2
dt 4Q 1/2 1/2 J 2C
1/2 V V vi/2 :
= 0. (2)
where
1/2
VjfOexplJxtl A VJ (t) exp I-jjut]
V1/2(t) exp [J^.] + v;/2 (t) exp T- ^
V
1/2
I)
V + V . 1 1/2
C ♦(. fC.
J-C,
C _1
T iC
1/2 2(;
1/2
I'irst oaler nonlinear coefficient of varactor.
The steady state solution may lx- obtained by allowing the time derivative terms to
IK- zero:
ih
(;T(;i/2 il)
(3)
M (il/2 Vl/2 A I)
1/2 (4)

Equation (3) defines the threshold magnitude, I ., of Input current, I , which will
cause subhamionlt oscillation. When die Input current Is larger than I , , the output
will be limited. Equation (4) shows that the magnitude of output voltage V ] Is
Independent of the Input current I as well as V . when V Is limited.
Equations ( I ) and (2) arc also useful In analyzing the transient responses. Tile
YIG llmlter exhibits a large leakage spike when a pulsed RF signal above the limiting
level Is applied. The leakage Is usually not desired ami causes troublesome effects
In most applications. The mechanism forming the leakage spike- can lie explained.
When an Input pulse with steep leading edge is applied to du- limiter (I ig. 7) tlu
subharmonlc oscillation starts immediately to build up from the noise level toward its
UJ O LEADING EDGE SPIKE ~[li-8-i066 j
a. 5
NOISE LEVEL
INPUT PULSE
LIMITED OUTPUT
w/2 SUBHARMONIC
^
STEADY-STATE DURATION
.TRAILING EDGE SPIKE
^r.L_ TIME
lig. 7. Leading edge spikt-, muling edge spike and subharmonlc build jp when i iput is a pulse function.

steady state level. Tlic subharmonlc buildup Is an exponential function of time. The
rate of rise of the i/2 oscillation depends on, among other factors, the input level
relative to the threshold [»wer of the limiter. Before the a'/2 oscillation reaches
the steady state level, limiting does not occur. The Input signal will pass through
die llmlier and appear at the output with full amplitude. When the subharmonlc
oscillation has built up to the steady state, the output drops Instantaneously to the
limited level. Hence a leading edge spike Is formed. The duration of the spike can
also he obtained from Kqs. (1) and (2) and is given as
- 2Q>/2 , A** s ... Vör-rjrln p ^ (5)
n
where
P steady state subharmonlc power level
P noise power level of subharmonlc tank n
vTTF" th
P - input power
P. - threshold power.
Hie value- of In (P /P ) is a relatively large number since P is at the noise power level, ss n * * „ Variation of P contributes less to - than n; therefore, the spike duration, - , is
strongly dependent on n when (^ ,_ and x are usually determined by the spin-wave
line width of the YIG material ami the operating frequency.
Hie trailing spike, with no amplinule significance Is generated by turning off the
input signal when the subharmonlc oscillation reaches steady state. Some of tlie
stored energy in the x/2 tank reconverts to the i frequency and appears at die out-
put when the signal, j,, is turnet! off. Trailing edge spikes are not observed in VIC

"V nnppaiMBMP i i •^«Pipü^^BWi^
*t^.-,«(»'iH*»«>(nfMM"nrr.rr-'.»'VJ
FSL measurements.
As the input pulse becomes narrower, the steady state duration T approaches zero.
Output power is then not limited at all. The time T + T is a good approximation of
tlic response time to an impulse function at input. In fact, due to the negligible
effect of the trailing edge spike, the impulse response can be given by - - ~ .
lor an input pulse with duration n shorter than the spike duration T., higher power
tiian P is needed to see the limiting affect. Hquation (5) can be solved for the
input power needed to reach the limiting threshold:
2Q.,,, P v 1/2 P-.P -_lZi ln^-1 I .
rh JU- P ; n
(h)
Where a has been substituted for- ; the smaller the value for z, the more input
power is needed. Tbe excess power is used to speed up the subharmonic oscillation
to the steady state value, hence limiting can result.
C. YIG FSL
A large number of subharmonic tanks are needed to implement an
ISL as shown in i-'ig. 5, since selectivity is dependent on the number of i/2 tanks
across a certain bandwidth. The same difficulties as building the filter bank would
Ix.- encountered if one had to construct a large number of contiguously tuned, high-Q,
resonant circuits. However, the YIG limiter is seen to closely approximate the
ISL model as it possesses a large number of closely spaced hlgh-Q, spin-wave modes
wher the limiter is operated in the coincidence-limiting mode, Kotzebue demonstrates
the independent limiting characteristic ol a VIC l-'SL and describes its operation via
an l-'SL model.
Although the- spin-waves are the substitution of the x/2 resonant tanks in the VIC
ISL, the behavior of the VIC I'SL can Iv predicted by die circuit model and fundamental
10

III'»!"" lllllT^»PP|l|p|)pPtpmil—r^WPT^WM HP » — m ii 11'
theory just derived. In practice, because of finite selectivity, Q,/9, of the sub-
harmonic tanks (spin-wave line width). Independent limiting of signals can be observed
only when signals are separated in frequencies larger than the spin-wave line width.
When the separation between signals Is small, some undeslred nonlinear effects are
generated at the output; namely, Intermodulatlon products and small signal suppression.
These nonlinear effects are strongly dependent on frequency separation as well as the
input power level.
Intermodulatlon products represent a false signal at die output of the filter bank --
an entirely new signal that is not really received by the antenna -- and small signals
can be suppressed by large limited signals. Therefore, a small signal can be
suppressed below the level of the trigger circuits at the output of the filter bank.
A YIG FSL developes spike leakage as discussed when an RF signal is pulse modulated.
However, it would also develope spike leakage if a CW signal is time-frequency coded
so that the frequency shift Is larger than the spin-wave line width. A different case
from the transient spike leakage Is that when a linear frequency-modulated signal
Is applied to a YIG FSL. The response of the YIG FSL depends on the signal sweep
rate.
The aforementioned phenomena are part of the characteristics oi the YIG FSL whose
mechanisms are discussed next.
I. Intermodulatlon Products
When two signals at x1 ^nd uu- are applied to an FSL, many
intermodulatlon products are generated.
X'... = mx + nx (7) IM I 2
Mi where m and n are integers. For a particular value of m and n, the K order IM
product Is defined by
11

wmm^p w*mm*** ■'■' ' ! •^^■■^^ < ^ !■• nwv^HfWftlp ^P^HIP iniwii PIMI'I 'fiwmfi ly**
m f n . (8)
Among various orders of IM products, only the ones that fall within passband, B,
of the FSL have to be cons IG. red. The worst kind is found to be the 3rd order IM
products.
^M = 2a,l " ^2 (9)
and
^M^'V
which have the largest significant amplitude. The output spectrum (Fig. 8) shows
two fundamental signals and their 3rd order IM products when üü. and u)9 arc 10 dB
above the threshold power, P ., and have 3-MHz spacing.
Horizontal: 3 MHz/cm
Vertical: 10 dB/cm
Flg. 8. 3rd order IM products for two equally powered signals.
The magnitude of the 3rd order products is a function of the frequency separation.
For the same Input power level, the amplitude of the 3rd order IM product will be
12

MB » ^..~- ■ • ■'" ■■■■-■>( ■'■.■f (-]•*'i&p ["W-'yW
reduced rapidly as frequency separation is increased.
Exact prediction of 3rd order IM products is complicated because it is also dependent
on the input power. Giarola has derived a two-signal theory (Fig. 9) ,3rd order IM
18-9-3070
• ♦
^ V S z *' P a» f- ^ > < 'l '2
<=, E Li c, <
G,
U) TANK
Fig. 9. Circuit model for 3rd order IM products,
product. The results are given by
OJ si
UJ S2
9..
V
th
I ', V^^-.-^j.^^V. th
(10)
13
- ■ ■

mmm WWWwwwiwiwpww^i mm ■i *IIIMIW> i ■ i mv m'
*»i»'it*^':.'nt|,.w. .f,^l'f»,■,'■«l^', i
6 where A = 2Qr,1
SI a-sl
b = : 1/2 (uu2 ■ *1>
G = t GI+G
S + GL
+ rG
th =
GsGt
A plot of the magnitude of Eq. (.1) as a function of the normalized frequency spacing
with respect to Ms sho'/n in Fig, 10. The curve shows the general characteristic
that the 3rd order IM magnitude is strongly dependent on frequency separation and
agrees with the experimental results.
i
I
Fig. 10. 3rd order IM product for two equally powered signals each 12 dB abovo uic limiting knee (after A. j. Giarola).
14
■ i

t'^*»'^'^^ tM,,
WWB mmmmm
1
2. Small Signal Suppression
When two signals, uu and a),1t arc applied to an FSL so that one
signal is large enough to be limited and the other is below the threshold, P ,, the small th
signal at the output is a function of the frequei. :y separation and the amplitude of the
large signal. The result is that the small signal is suppressed in amplitude by the
presence of the large signal. This effect is also generated by nonlinear behavior
and is described as small signal suppression.
The amount of suppression versus frequency spacing and input power can be derived
via the circuit model in Fig. 11. The model has two current sources, I and L,
fed into Jie u) tank. I and I represent the large and small signals, respectively.
;
18-9-3072
ö 0
* I f
Gi
cu TANK
C = DV
W ' rGd
Fig. 11. Circuit model for small signal suppression.
UJ/2 TANK
15
MBM^a^aaa MMBtaMllitfiaMMMIMl

HIHPmiMMMHB* iiiiMiMi ,.ii»|i imi '"I" HW—tWW ■ '"
f'»'*^W»»^M»'«n. -.-
Tlic normalized small signal amplitude has been given by Giarola and reproduced as
2 Z1')1 \ J'A cv, ^+2 r--' r2^ 77
t 2 _ L th J th I,
rh th th
(11)
Tlic normalized 3rd order IK', products in this case are given by
Ct
V3 rh
r.,^.,) •th •
2j.'-, [2~- -1 th
(12)
lägure 12 was obtained by using a spectrum analyzer, monitoring at the output when
two signals were fed into the YIG KSL. 'Hie level of the fixed frequency at the center
was 10 dB above the limiting knee, P . The variable frequency level was just below
the knee. As the variable frequency was swept from left to right, the 3rd order
product, 2f - f , swept in the opposite direction. The envelope of the small
signal tracked a V-shaped curve, the valley of which coincided with the fixed large
frequency to signify the small signal suppression is a functioi of frequency separation.
The 3rd order IM product traced an inverted V curve, the peak of which coincided
with the fixed frequency separation. These curves are a general description of
Kqs. (11) and (12).
16
MMM .MMMiMHIMMMH

I
^m ■MPüppnppHipi n") ilWWMI1«,11!!!
1
9-3073
31
M • :
iSv^"
n
J 2 MHz
Fig. 12. 3rd order IM product and small signal suppression behavior of YIG FSL, when two signals, one on the limiting knee and one 10 dB above the limiting knee are fed into the input.
A family of V and Inverted V curves can be plotted by substituting different values
of large amplitude signal, I , into Eqs. (11) and (12). The results are plotted in
Fig. 13. It is worth noting that curves derived from these equations showed two
distinct points:
a. The amount of small signal suppression when the two
signals approach coincidence Is equal to what It would be when a conventional type
llmlter Is used. Small signal suppression in dB = x + 6 where x is the large signal
Input power In dB above the limiting knee.
17

^r
(8P) ä3M0d indino 3AiIvn38
Si I n - o
2 ^
II « c s .2 £ in
s
3 w
o
>
Hi — c 3 ~ 5 "x
18

—••«
b. The amplitude of the suppressed Hrnull Nlpnai Is equal to
the amplitude of the 3rd order IM product when the two signals coincide. The peak
of the Inverted V and the valley of V curves not only coincide, but also intersect at
their vertices.
3. Response to a Time-Frequency Coded CW Signal
A time-frequency coded waveform Is a sig.ui! '"hose frequency
Is shifted on an interval-to-lnterval basis while the amplitude is a consent (Fig. 14a).
When such a signal is applied to an FSL, the analysis is analogous ro the transient
responses described in the previous section.
Though the signal Is CW, to the subham.onlc tanks the time-frequency coded signal
Is hopping. Recall that In the FSL model the sublmrmonic tanks are successively
tuned In frequency. Each subharmonlc ts.nk is pumped into oscillation by twice
Its resonant frequency. Therefore, every time the pumping frequency is shifted
abruptly, and the amount of the shift is larger than the bandwidth of the subharmonic
tank, the oscillation in the subharmonlc tank has to start to build up from noise:
this results in a delay in limiting action. The leakage spike will occur each time
the frequency is shifted. Consequently, a scries of comb-like leakage spikes
will be received at the output (Fig. Mb).
As the frequency shifting pulse gets shorter, the duration of the signal to pump the
corresponding tank is shortened, therefore, more Input power is required to reach
steady state. Limiting docs not occur until the input power is higher then P .
4. Linear Frequency Modulation Response
A linear frequency modulation (LFM) signal is one where
19

II-I-WS
FREQUENCY
AMPLITUDE
riME
(0) TIME-FREQUENCY CODED WAVEFORM
IMPUT AMPLITUDE mm:.:, AMPLITUDE
TIME
(b) INPUT AND OUTPUT RESPONSE
ig. 14. ISL response ro rime-frequency coded signal.
20
«M^^MMM^Mfll

i the frequency la contlnuounly ■hKr.ng (I Ig. 15). I««« InMtontoneouM fruquency con IK-
cxprcHscd OH o function of time
xit) = x() ♦ 2- wt (13)
where s Is the sweep rate defined as the total frequency change, i', divided by the
duration, T
S = F/T. (14)
ll-l-JOU
-- -ztr FREQUENCY
T
AMPLITUDE
♦ TIME
■— TIME t
f (t) = A $ln((Jo + 2* sf) t
Fig. 15. Linear I'M signal.
21
■■'"-■•- ii ■ ■ - ■-■ -minm i i II HMHHMIMII

1
If an LI-'M signal Is applied to the I'SL, a .subharmonic tank will effectively see the
pumping signal sweep over the bandwidth, '. (. ,., In a short time. How long the
pumping signal remains In the handwldth '\f.,7 depends on the sweep rate as fjiven
by
Tlio problem here is quite similar to the well-known response of n tuned circuit to
a swept frequency. Generally, the response of a bandpass filter to a swept signal
depends on the sweep rate. 'Hie response is distorted by a reduction of peak amplitude
viicn the bandpass filter Is swept In time period d comparable to its rise tlmo for
the impulse response, T. Thus, for a subharmonic tank, distortion occurs when
the relation of the sweep rate, bandwidth and response time is
■fl/2 ITT"- ,",)
Tlie concept can be further simplified if the time brndwldth product, K, is introduced
K =-• \(]/2 (17)
where K is a value usually of die order of unity, K ~ I.
2 For a signal that is swept slowly, S ■< 2/- , the response of the subharmonic oscilla-
tion is essentially the response as if a CW were applied. Tills condition is sometimes
called a quasi-state condition. The output power will be limited when the input power
is larger than P , as defined by Eq. (3).
2 Distortion results WIKV. the swept rate is increased to S» 2/- . In this case, the
pumping signal staying in the bandwidth, " l" , , is less than the subharmonic
22

mt i
oHcillatlon relaxation time T; therefore, limiting cannot occur when Input power Is
equal to P . Higher Input power I« needed to reduce the response time T since T
Is a function of input power as given by Hq. (5).
Consequently, when a sweep frequency Is applied at the input, and the sweep rate is 2
fast enough such chat S « 2/T , the FSL output will not be limited to the same level
as when a CW is applied. The limiter will exhibit a higher threshold power. There-
fore, the threshold power level depends on the sweep rote and the selectivity, Q./«•
of the subharmonlc tanks. The higher the sweep rate ond the Q,,7, the larger the
Input power required to reach the threshold level -- and output power will be limited
at a higher level.
II. Y1G FSL Experimental Results
An experimental YIG FSL was made with four Y1G spheres in series (Fig. 16),
DC
n
18-9-30IT
RF INPUT
RF OUTPUT
Fig. 16. Multi-stage YIG FSL.
23
■ »■»■ ■ ■» m
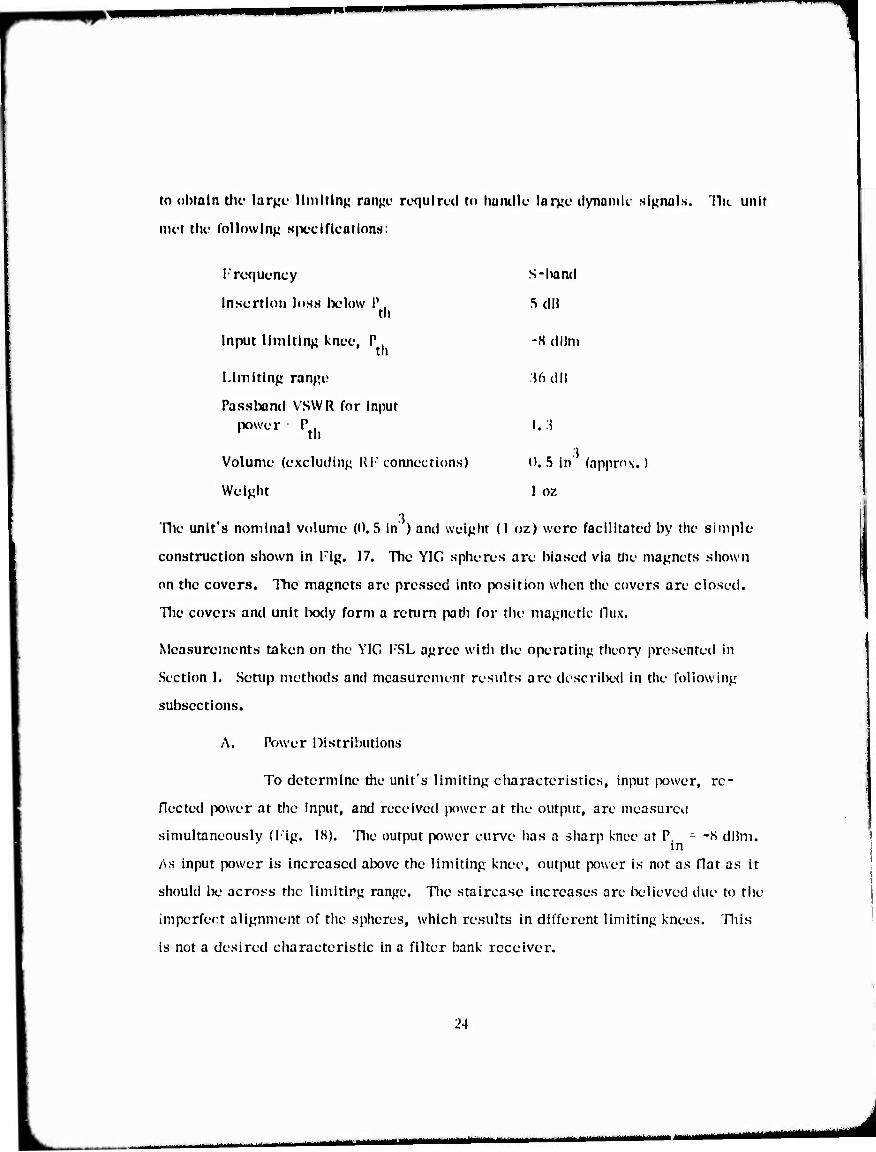
to obtain the large limiting; ran^'L" required to Imiulle lar^c dynamic signals. Tlu. unit
met the followlnj» Hpeclflcatlonä:
Ircqucncy S-iiand
Insertion loss below P . S diJ th
Input limiting knee, P -H dUni
Limiting ranjTe }6 diJ
Passband VSWR for input powe r P , ],.]
tli
Volume (excluding lU" connections) 0, 5 in (apprn\. )
Weight 1 oz
The unit's nominal volume (0,5 in' ) and weight (1 oz) were facilitated by the simple
construction shown in Fig. 17. The YIG spheres are biased via the magnets shown
on the covers. The magnets are pressed into position when the covers are closed.
The covers and unit body form a return path for the magnetic flux.
Measurements taken on the YIG FSL a^ree with the operating theory presented in
Section I. Setup methods and measurement results are described in the following
subsections.
A. Power Distributions
To determine the unit's limiting characteristics, input power, re-
flected power at the input, and received power at the output, are measurcu
simultaneously (Flg. 1H). The output power curve has a sharp knee at P. ~ -H dHm.
As input power is Increased above the limiting knee, output power is not as flat as it
should be across the limiting range. The staircase increases are believed due to tiie
Imperfect alignment of the spheres, which results in different limiting knees. This
is not a desired characteristic in a filter bank receiver.
24
1 —-"

n*i unpp^j i ^ a T «»-*■ "•
Pll5-H8i
•■v
■** «A..--;-
^
J
I I l I I I I I l l l I I I i I J J .3 .4 ' A .7 S .9 ' I J 3 .4 .6 7 A .9
0 .5 10 lr 2X) INCH
MIT Lincoln Loborotory
Fig. 17. A YIG FSL.
25

E o
-5 -
•10 -
•15
-20 -
-
M 11-J-JOUl
/ y»»ErLCCTEO POWER
- OdB LOSS/ / /
/
i
1 OUTPUT POWER
1 1 1 1 . 1 1 i 15 -10 0 5 10
INPJT POWER (dBm)
15 20 25
Fig. 18. YIG FSL power distribution.
It Is apparent that a large amount of Input power Is reflected to die source by mismatch
when input power is well above the limiting knee. This Information verifies that the
YIG FSL Is a power-reflective limiter rather than an absorptive device. Heat sink
and power handling capabilities \ hin the limiting range are generally not Important.
26
. J»T.f.! 1 - -. ^--TV .-■ -
■■'■ " ■' "
However, du<:, to the Impedance mismatch behavior, devices connected to the 1'SL,
such as filters, no longer look Into a matched load.
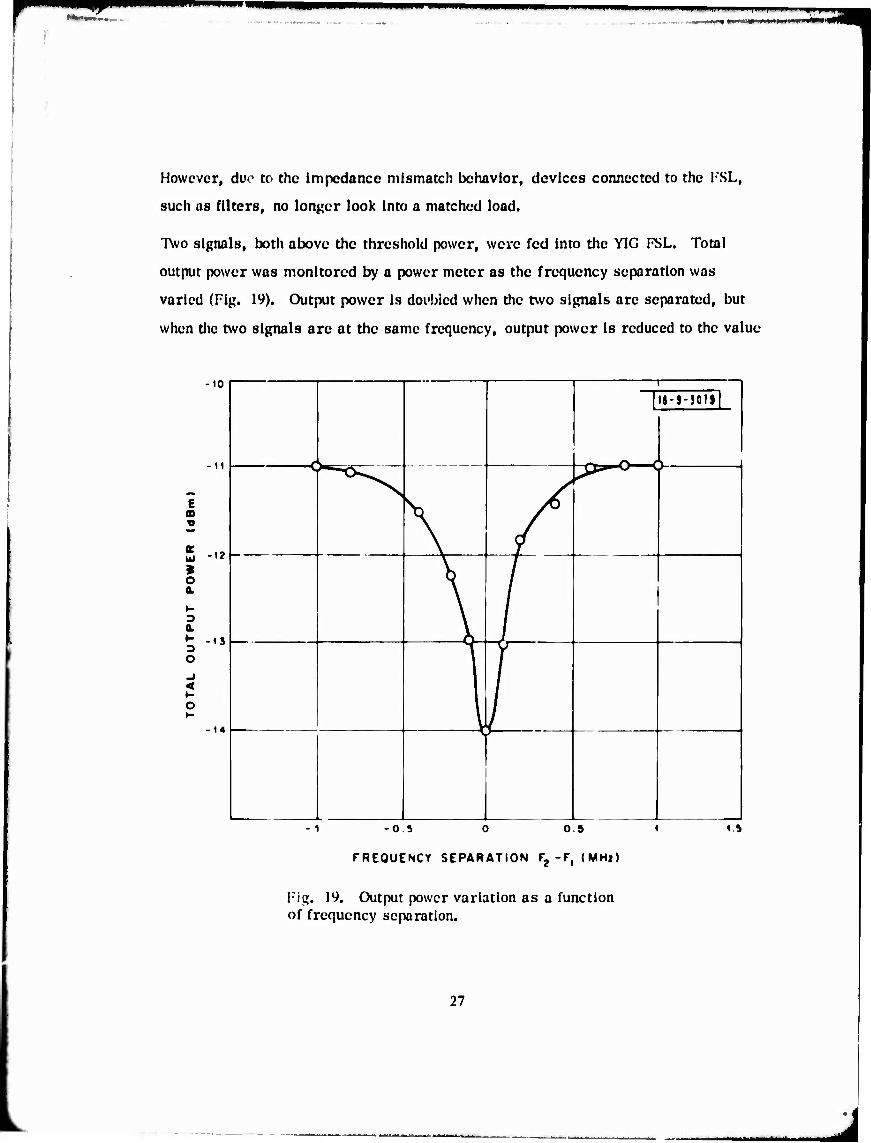
Two signals, both above the threshold power, were fed Into the YIC FSL. Total
output power was monitored by a power meter as the frequency separation was
varied (Fig. 19). Output power Is doi'bled when the two signals are separated, but
when the two signals are at the same frequency, output power Is reduced to the value
-10 1
1 I8-9-J0 $ —
- 1
i
C
^^
r 1
5 -12 s O a.
y
/
o a.
o
/
r < o »-
-14 , \; ,
-1 -0.5 0 0.5 1
FREQUENCY SEPARATION F2-F, (MHi)
Fig. 19. Output power variation as a function of frequency separation.
1 5
27

when there Is only one signal present. Tills measurement demonstrates vividly
the selective limiting characteristics, and dun the YIC I SL Is not a constant
power output llmltcr such os a diode clipper. In fact, the output power Is n times
the limited output power of a single signal when n separated signals are present.
The Y1G FSL Is a reciprocal device. If Input and output «TC Interchanged, a very 8
small effect Is observed. However, It could Ix; made a nonreciprocal device hy
different construction techniques.
B. Leakage Spike
Video waveforms were observed at the VIC. FSL output when the
Input Rl-was pulse modulated. The waveforms In i Ig. 20 represent Input power
for the following cases; on the limiting knee, +1, +1, ^ and ♦*> above the limiting
knee, P . The waveforms In 1-Ig. 2!a are a multiple exposure of the waveforms
In ITg. 20; those In Fig. 2 lb represent Input power at 10, 15, 20, 25 ami 30 d»
above the limiting knee.
The details of the spike forms are somewhat limited by the pulse modulator and the
detector used, but give clear Indication of the relations of spike duration, amplitude,
and Input power . It Is obvious that spike duration becomes shorter and the amplitude
larger as input power Is Increased. Duration of the spike as a function ol input is
plotted In ITg, 22.
It lias been reported that Integrated areas under the waveforms are approximately 9
constant. However, in this measurement, the results do not follow this simple
rule. The areas under the curves Increased with an increase In input power (Table i).
Tlie trailing edge spike of the YIG I SL is not observed in these measurements. In
general. It lias less energy and the effect is not Important.
2K
«MBMMM

1
(0) (b)
(c) (d)
(e)
Fig. 20. Leading edge spike at various input levels, (a) 0 dB, (b) 1 dB. (c) 3 dB,(d) 6 dB, and :e) 9 dB above the limiting knee.
29

f^^^m^^^mm Wimm i ^»mm i ■■-..■■. — -
NWWmr "i»f«ff»w>.».wt L-ng.
(a)
(b)
Fig. 21. a) Leakage waveforms of Fig. 20.
Fig. 21. b) Leakage waveforms corresponding to input power
10 dB, 15 dB, 20 dB, 25 dB, and 30 dB above the limiting knee.
30
tMMMHMMMMfl A

^ WPW" •—wmmimmm^** wmw**m^wi*iiiF*w*' -— ii i pi
10 20
dB ABOVE LIMITING KNEE
Fig. 22. Spikage Leakage duration.
| Table I
| Integrated Areas Under Waveforms in Fig. 20
Input Power (dB) Total Area Relative to P . (cm2)
tn
Relative Area (cm2)
0 3.352 0
1 4.001 0.649
3 4. 397 1.045
1 6 4. 902 1.550
9 5. 479 2. 127
31
M^^^^MBM^MM. »■«.^■■■^■•iM*. mt^m,^^^ammj
mmmmm^m^m^^^
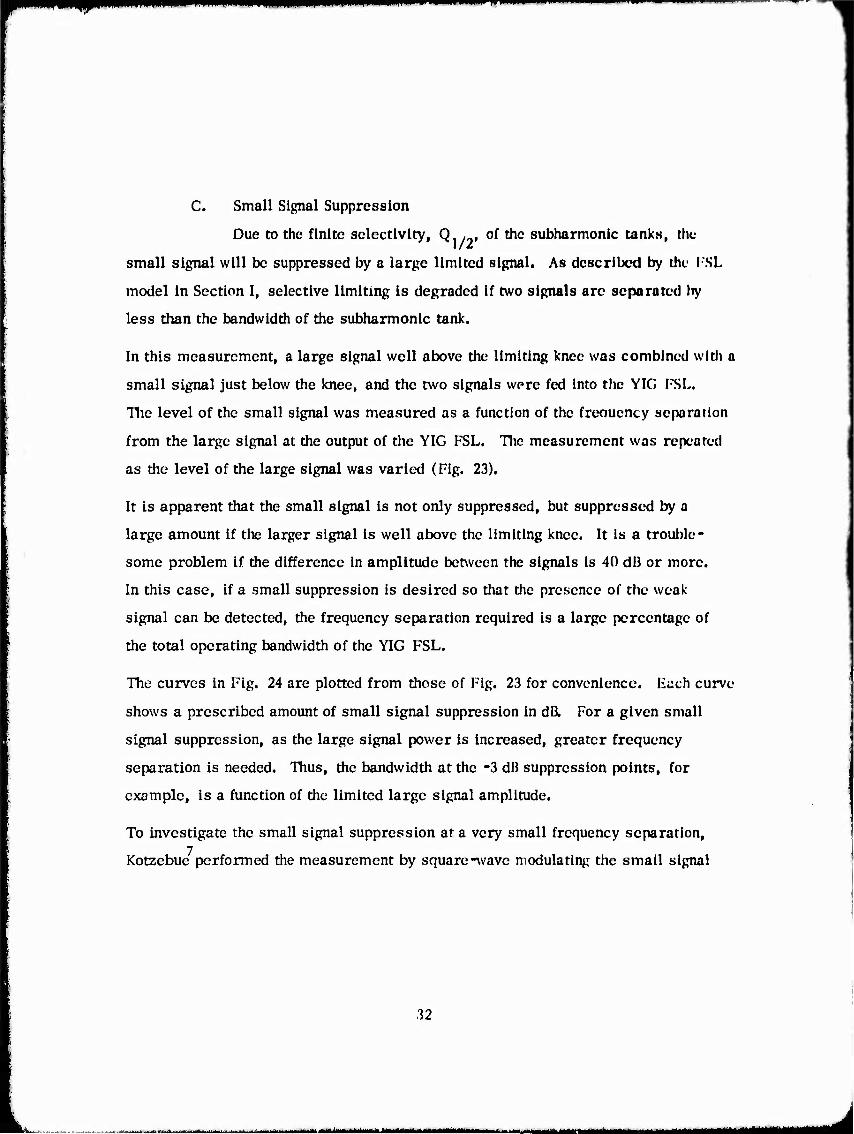
C. Small Signal Suppression
Due to the finite selectivity, Q,/9, of the subharmonlc tanks, the
small signal will be suppressed by a large limited signal. As described by the l-SL
model In Section 1, selective limiting Is degraded if two signals are separated by
less than the bandwidth of the subharmonlc tank.
In this measurement, a large signal well above the limiting knee was combined with a
small signal just below the knee, and the two signals were fed into the YIG FSL.
The level of the small signal was measured as a function of the freouency separation
from the large signal at the output of the YIG FSL. The measurement was repeated
as the level of the large signal was varied (Fig. 23).
It is apparent that the small signal is not only suppressed, but suppressed by a
large amount if the larger signal is well above the limiting knee. It Is a trouble-
some problem if the difference in amplitude between the signals Is 40 dB or more.
In this case, if a small suppression is desired so that the presence of the weak
signal can be detected, the frequency separation required is a large percentage of
the total operating bandwidth of the YIG FSL.
The curves in Fig. 24 are plotted from those of Fig. 23 for convenience. Each curve-
shows a prescribed amount of small signal suppression in dB. For a given small
signal suppression, as the large signal power is increased, greater frequency
separation is needed. Thus, the bandwidth at the -3 dB suppression points, for
example, is a function of the limited large signal amplitude.
To investigate the small signal suppression at a very small frequency separation,
Kotzebue performed the measurement by square-wave modulating the small signal
32
M^MMMflMMMl

r w
m
z g to
Ui (T Q. Q.
to
o to
<
to
-25 •—
5 10 15 20 25
FREQUENCY SEPARATION (MHz)
30
Fig. 23. Small signal suppression of two signals.
33
i ii ■ ——B ^a^i^rihdlMaW Ma^aaam aaaMaaMaa ttm

60
50 f-
X
40 -
<
< 0- 30 Ui in
>■
ü z UJ 3 20 O Ui
10 -
<8-9-3085
3dB SMALL SIGNAL i SUPPRESSION '
6 dB
10 dB
0 10 20 30 40 50
LARGE SIGNAL INPUT POWER, dB ABOVE LIMITING KNEE
Flfj. 24. Frequency separation required as a function of larye signal strength for a given small signal suppression.
at input (Fig. 25). The amplitude of the modulated signal was then observed at the
output. The device was tested at a frequency 2700 MHz which is higher than that
of the YIG FSL used in this measurement.
34
I I IM*',—
i
J

■ Ill I ——fp MHBMHH • 1—aMi i"Wiitwii wr~-»- •-*— --■•*-.
-5
CD
-I < Z o -10
-15 (/) u. o UJ CO z o co -20 UJ
-25
■15
A LARGE SIGNAL 10 dB ABOVE LIMITING
O 6dB
O 3dB
18-9-3086 J_
•10 -5 0 5
FREQUENCY(MHz)
10 15
Fig. 25. Small signal suppression at 2700 MHz as a function of frequency difference and large signal power level, (after K. L. Kotzebue)
D. Intcrmodulition Products
To investigate 3rd order IM products, two equally powered CW
signals were combined by matched coupler, fed Into the YIG FSL, and monitored
by a spectrum analyzer.
TTiere was some doubt about the 2nd order IM-type products that were generated.
35

wm^mmmmm w^^m^H^^m^
However, the spectrum was clean at frequencies outside the operating band. Hie
only products observed were those whose frequency I7 = |m|f + |n|f falls In
the unit's operation frequency band.
3rd order products 2f. - f2 and 2f - f. were the strongest products observed with
much higher amplitudes than other higher order products.
There Is no simple way to characterize the IM products such as "cross modulation"
or "intercept point" methods used in amplifiers. Since the YIG FSL is a frequency-
selective device, the IM products are a function of the amplitude as well as frequency
spacing.
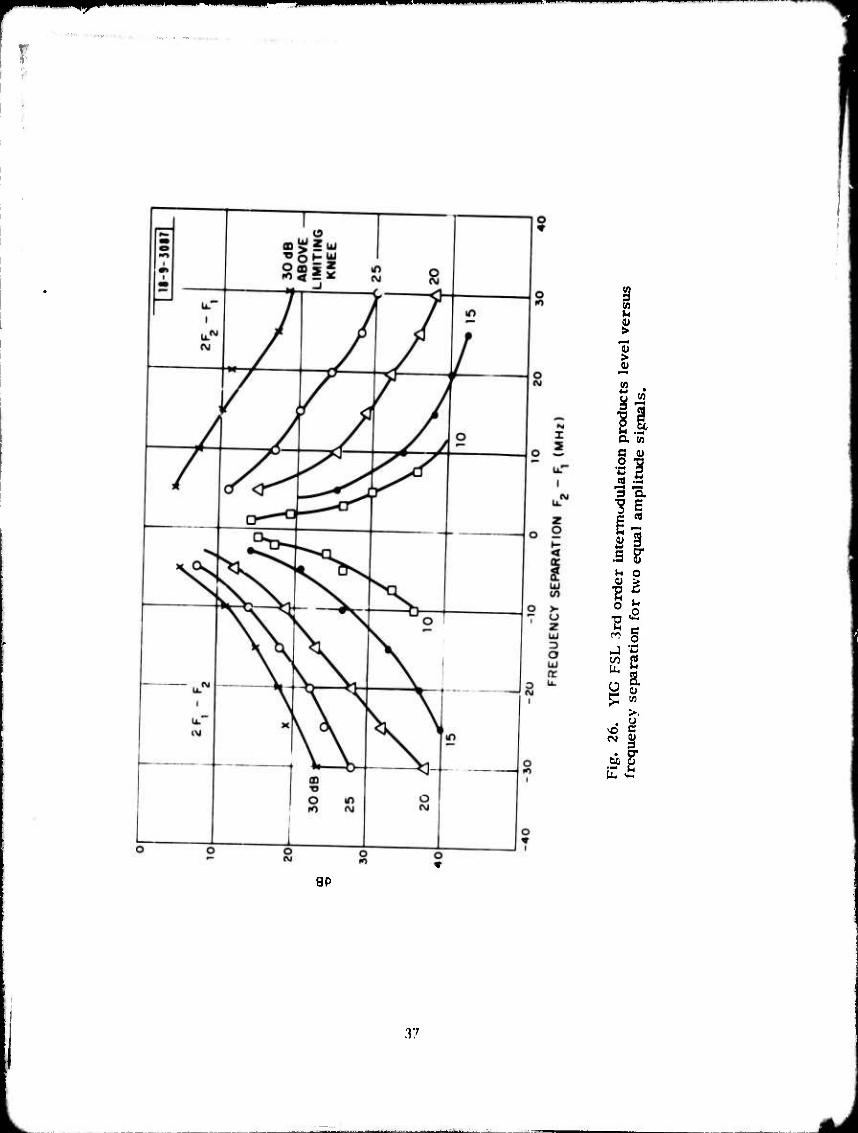
For frequency separation of the order of 1 MHz and powers above the limiting knee,
the device generates strong ;5rd order IM products (Figs. 26 and 27). These products
are greatly reduced as frequency separation is increased.
As the frequency separation decreases, the 3rd crdei IM product levels tend to
approach a level some 3 dB or so below the fundamental output level. When two
signals are extremely close in frequency, measurements are limited by the
stability of the signal generators and the resolution of die spectrum analyzer.
Higher order products (5th and 7th order) are also noticeable though small in
magnitude. The magnitudes of 3rd, 5th and 7Ü1 order products in two equal
amplitude signals 20 dB above the limiting knee were compared (Fig. 2S).
E. Linear FM Responses
An RF generator with a sweep rate much higher than the order of
1 MHz per usec is required to investigate limiting characteristics when a linear
FM signal is applied. As such a high sweep rate Is not generally available in a
conventional sweep generator, a special setup was provided by Mr. G. T. Flynn
and Mr. A. J. Yakutls of the R. I7. Systems Group; an S-band voltage-tuned
36
r *
0»
to
!^ Q. CO
C U
IS
■3 1 "I
o
§
2 a o m >.
9P
37

■'■'■■""""l" ■■^.n«
CO
3 RO ORDER INTERMODULATION PRODUCT LEVEL BELOW THE SIGNAL AT OUTPUT
INPUT POWER ABOVE THE LIMITING KNEE OF TWO EQUALLY POWERED SIGNALS (dB)
Fig, 27. Frequency reparation required as a function of two equally powered signal levels for prescribed 3rd order IM products.
38
— 1—i—i ' - MM^^^MHMMHMM

^^mm^nmrn '-'— ""•—'^
& 3 O
1 I s rt
CQ T3
18 Sis
11 S
H s c
00
r o
SP
39

^H^
magnetron (VTM). Linear frequency modulation (LI-'M) was achieved by a linear
sawtooth generator In series with the cathode and Us high voltage power supply.
Uy varying the amplitude of the sawtooth voltage or the repetition rate, the setup
provided an extremely fast sweep over a wide frequency range. The signal was then
used as an LFM source fed into the Ylfi FSL.
In this measurement, the sawtooth voltage amplitude was fixed so that the RF
frequency had the same start and stop frequency fin .^rious conditions (Fig. 29).
FREQUENCY Tl8- 9-5090| 1 i
f^SD ■ y y \ yS / F
', ^ y ^ *
. i
D ^|
1
2D 3D
TIME
Fig. 29. Sawtooth-varying frequency.
The sweep rate S-Mliz/jsec was varied by changing the repetition rate of the saw-
tooth generator. The purpose of such an arrangement was to operate the unit in
the same portion of the frequency band for different conditions and ensure that tiiis
was within the operating band of the unit.
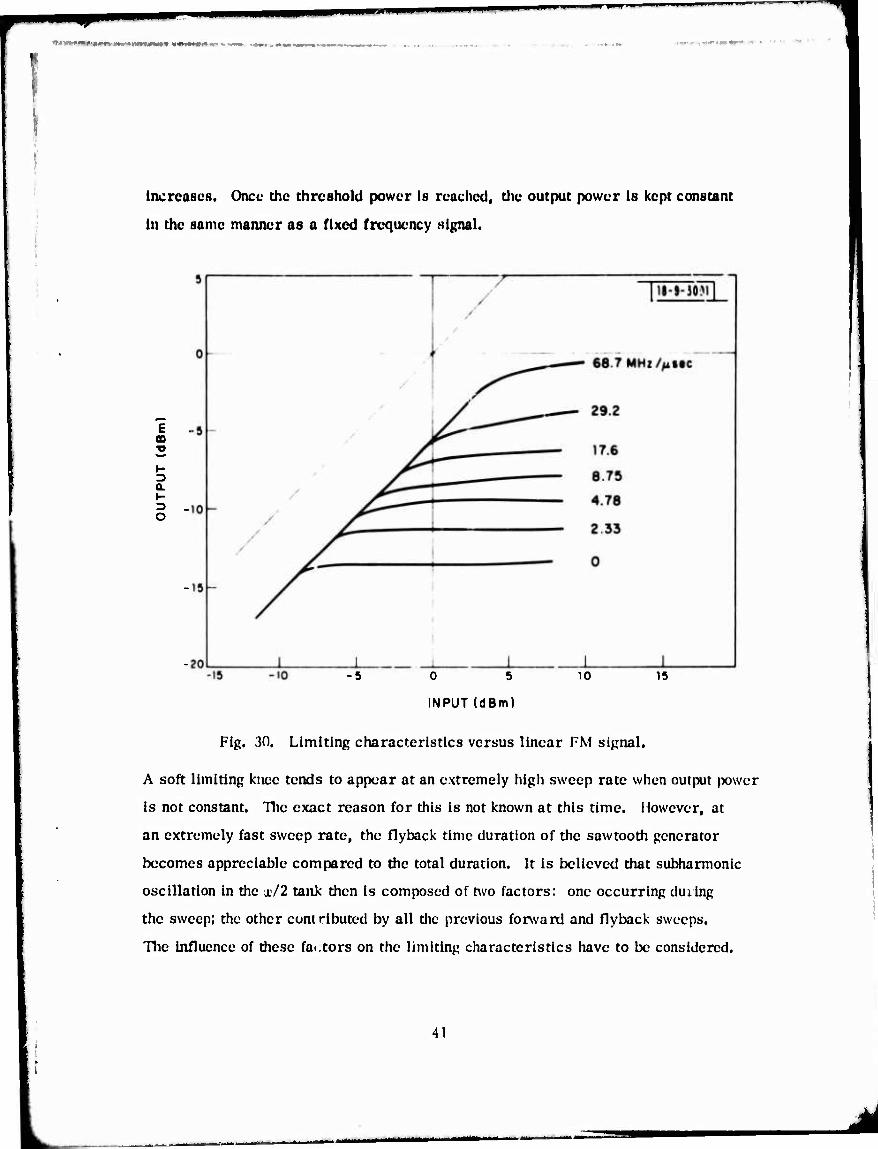
Output power plotted as a function of input power for different sweep rates (Fig. 30)
shows clearly that as sweep rate increases, the limiting threshold power also
40
mmmmm
increases. Once the threshold power is reached, the output power is kept constant
in the same manner as a fixed frequency Hignal.
E OD
a 3 O
-5 0 5
INPUT (dBm)
10 15
Fig. 30. Limiting characteristics versus linear FM signal,
A soft limiting knee tends to appear at an extremely high sweep rate when output jxnvcr
is not constant. The exact reason for this is not known at this time. However, at
an extremely fast sweep rate, the flyback time duration of the sawtooth generator
becomes appreciable compared to the total duration. It is believed that subharmonic
oscillation in the x/2 tank then is composed of two factors: one occurring duiing
the sweep; the other cuniributed by all the previous forward and flyback sweeps.
The influence of these factors on the limiting characteristics have to be considered.
41

III. Appllcntlon of the YKi l-SL to Miter Ikink Kecelvers
A. YKi ISL as a Level Normalizcr
Since tlie Y1G I'SL Is a self-adaptive llmlter, signals of different
levels are attenuated Individually by the I'SL according to their strength. Ideally,
all signals will have the same amplitude at the output If die signal levels fall within
the limiting range. The signals, therefore, are normalized to du- output limiting
level of the Y1C I'SL a id are fed Into the filter hank. Thus, exotic design of the
filter hank can be avoided and size and weight can be minimized.
However, due to the finite selectivity, Q./», of the I'SL, small signals will Iv
suppressed by the limited large signals when two signals are separated by only a
small amount. Therefore, output levels are not the same where signals are spaced
closely together or are widely divergent.
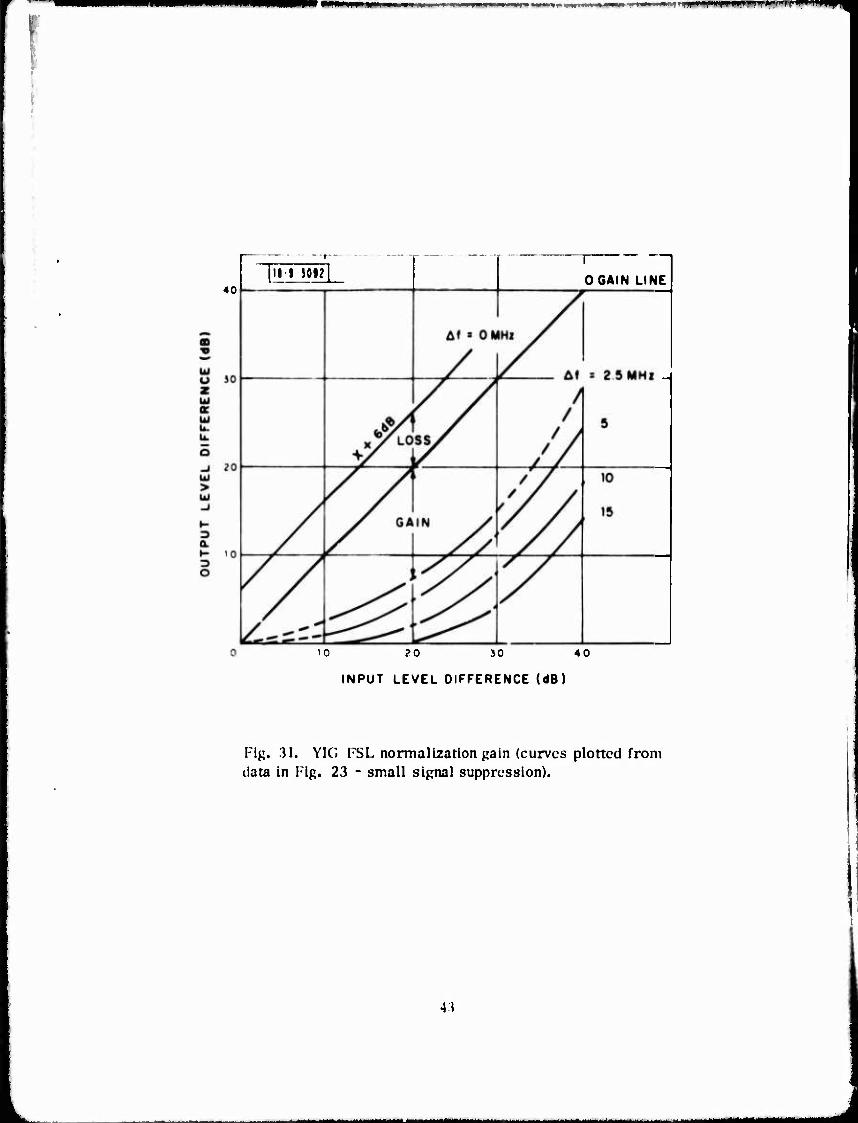
The extent of normalization can be determined by comparing die difference in levels
at the Input witii that at die output of the I'SL. The curves In 1 ig. M are plotted by
using the data In ITg. 23 for two Input signals, one on the limiting knee and the
other above die knee. The difference in dl5 at die input Is projected to the difference
at the output for a prescribed frequency sepavarion, L i in MHz. nie zero gain
line Indicates no normalization by die VIC ISL. Points belov. the zero gain line
show diat the level difference at the output is less than at the input: normalization
zained. Points above the zero gain line show a loss or denonnallzatlon.
The successive lines indicate diat as frequency separation is reduced, the curves
tend to approach the zero gain line. In essence, normalization g.iin Is reduced by
die fact that small signal suppression Increases progressively as die frequencies
approach each other.
When die signals approach zero separation, all curves coincided with die line
1 f = 0, die case for hard limiting.
42
t mm >■'■■■ ■■ ■■■■!»■» IHMWUPIWW 11 ~»",*fr
40
lit 50»? I
OGAIN LINE
'0 ?0 30 40
INPUT LEVEL DIFFERENCE (dB)
Fig. 31. YIG FSL normalization pain (curves plotted from data in Fig. 23 - small signal suppression).
43
■ ■ tf^MMMM^MIMiMH

Obviously, operating conditions above the zero ^aln line should Ix.' avoided. However,
in the real environment, one has no control of frequency separation and the strength
of received signals. Nevertheless, the conditions represent very close freouency
spacing -- of the order of 1 MHz -- which Is generally closer than the bandwidth
for filter banks considered to date. Normnlization of frequencies separated by less
than 1 MHz Is basically limited by the large dynamic signal range.
YIG KSL's can be cascaded In series If each stage can be Isolated. Hy properly
adjusting threshold levels, larger normalization gain than with a single l"SL can i)e
achieved. This hypothesis is explained In the next subsections.
B. Cascading VIC FSL's to Achieve Large Limiting Range
One problem with a YIC FSL is its relatively short limiting range
compared with the dynamic range of signals that are encountered in the environment.
To normalize a given range of signals, an FSL needs a limiting range that at least
equals the signal dynamic range. YIG FSL's with a limiting range of 20 to 25 dl!
are easily obtainable by using a single sphere. Tile multi-sphere technique permits
one to achieve a larger limiting range, closer to the requirement. However, due to
interactions of the spheres, the range is still basically limited.
l\\'o other effects can influence Y1CI FSL design at very large input power: heat and
nonlinear mode of the YIC FSL, which are also part of the difficulties in achieving
large limiting ranj;e.
Although the YIC FSL is generally a power reflective type device, at extremely lar^c
input power, the ahsorix-'d power causes higher sphere tern pe ram re. Ilic heating
effect could lower its magnetization and thereby raise die level of the limitinj: knee.
Consequently, output power cannot be kept at a constant level.
The YIC; sphere will enter a premature decline nonlinear node at a certain high |iower
invel. The premature decline mode is a 2nd order nonlinear effect that uses the
44
wmim*nmft*******miwv.'****—**"■****•»mm ■v>"'-"*wi«wi-»"'',''-'*i w ■ ■.—•irnr<»w*»,,i'rrrtMiriciwi^1-ir*»vii.Tr»r'««rrti
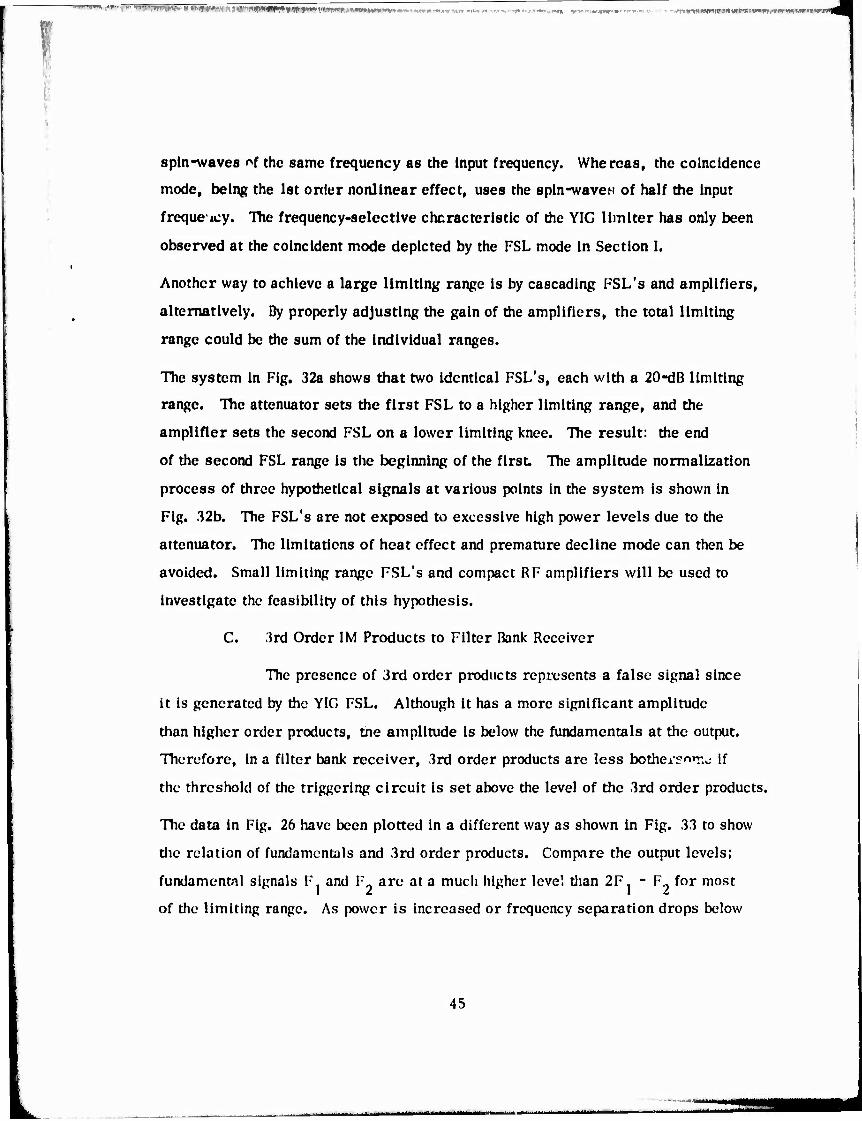
spin-waves of the same frequency as the Input frequency. Whereas, the coincidence
mode, being the 1st order nonlinear effect, uses the spln-waveH of half the Input
freque icy. TTie frequency-selective characteristic of the YIG llmlter has only been
observed at the coincident mode depicted by the FSL mode In Section I.
Another way to achieve a large limiting range Is by cascading FSL's and amplifiers,
alternatively. By properly adjusting the gain of the amplifiers, the total limiting
range could be die sum of the individual ranges.
The system In Fig. 32a shows that two Identical FSL's, each with a 20-dB limiting
range. The attenuator sets the first FSL to a higher limiting range, and the
amplifier sets the second FSL on a lower limiting knee. The result: the end
of the second FSL range Is the beginning of the first. The amplitude normalization
process of three hypothetical signals at various points In the system Is shown In
Fig. 32b. The FSL's are not exposed to excessive high power levels due to the
attenuator. The limitations of heat effect and premature decline mode can then be
avoided. Small limiting range FSL's and compact RF amplifiers will be used to
Investigate the feasibility of this hypothesis.
C. 3rd Order IM Products to Filter Bank Receiver
The presence of 3rd order products represents a false signal since
it Is generated by the YIG FSL. Although It has a more significant amplitude
than higher order products, the amplitude Is below the fundamentals at the output.
Therefore, In a filter bank receiver, 3rd order products are less bother?«'!^ if
the threshold of the triggering circuit Is set above the level of the 3rd order products.
The data In Fig. 26 have been plotted in a different way as shown In Fig. 33 to show
die relation of fundamentals and 3rd order products. Compare the output levels;
fundamentnl signals F. and F are at a much higher level tiian 2F. - F for most
of die limiting range. As power Is Increased or frequency separation drops below
45

18-1-3013
INPUT Q
ATT
LIMITING ! FS| 1
RANGE; 20 dB L
AMP/
LIMITING RANGE: 20 dB
FSL 2
INSERTION LOSS
INSERTION LOSS
■ a) (b)
Fig, 32. Cascade FSL's to achieve large limiting range.
46

1 MHz, the 3rd order tends to approach a level just 3 dB below the fundamental
level (Section II D). Therefore, most of the detrimental effect caused by 3rd order
products can be overcome by setting the triggering level just 3 dB below the level
of the fundamental signals. The false signal can then be Ignored.
-20
CD •O
3 a. H => -30 O
-35 -
LIMITING KNEE
-20 -10
18-9-3216
AF = 5
= 10
10 20
INPUT (dBm)
30
Fig. 33. Fundamentals and 3rd order products.
47
■ I III IMmMM——y
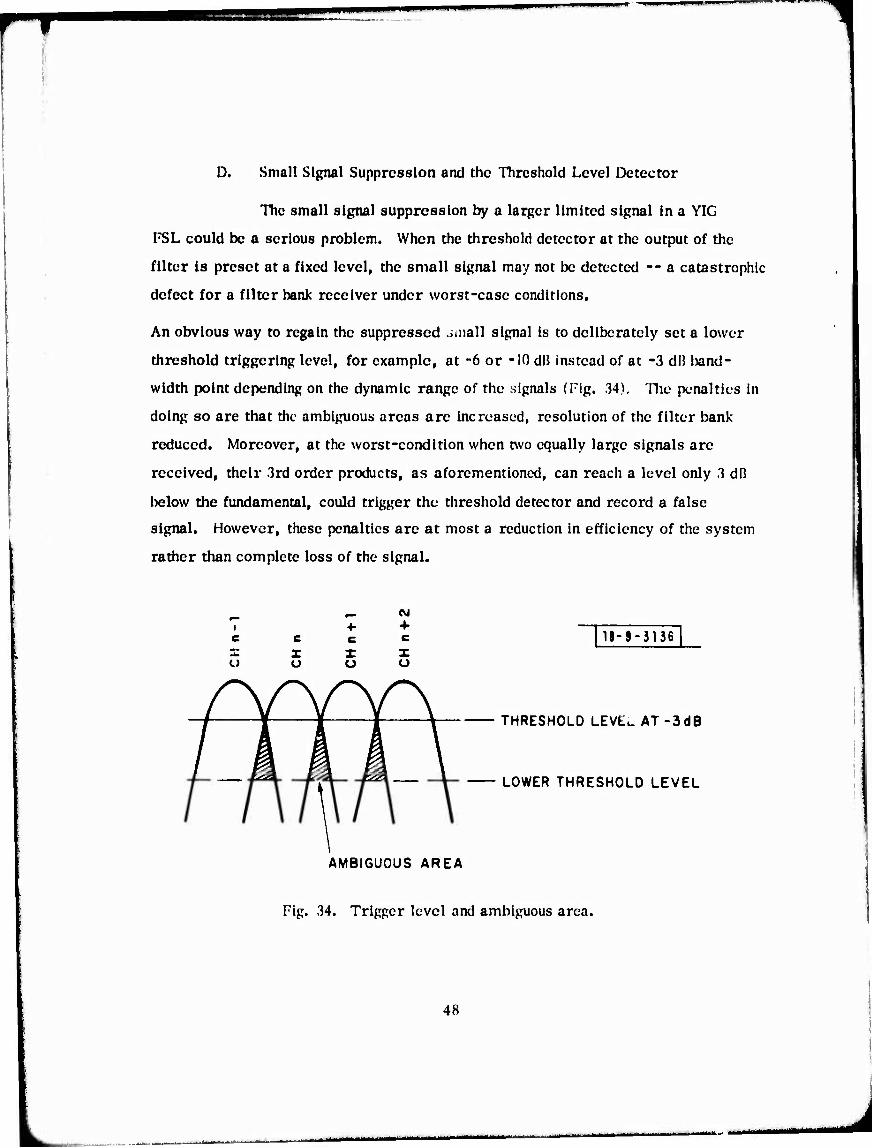
D. Small Signal Suppression and the Threshold Level Detector
The small signal suppression by a larger limited signal in a YIG
FSL could be a serious problem. When the threshold detector at the output of the
filter is preset at a fixed level, the small signal may not be detected -- a catastrophic
defect for a filter bank receiver under worst-case conditions.
An obvious way to regain the suppressed .üiiall signal is to deliberately set a lower
threshold triggering level, for example, at -6 or -10 dB instead of at -3 dB band-
width point depending on the dynamic range of the signals (Fig. 34). The penalties In
doing so are that the ambiguous areas are Increased, resolution of the filter bank-
reduced. Moreover, at the worst-condition when two equally large signals are
received, their 3rd order products, as aforementioned, can reach a level only 3 dB
below the fundamental, could trigger the threshold detector and record a false
signal. However, these penalties are at most a reduction In efficiency of the system
rather than complete loss of the signal.
<VJ
18-9-3136 z o
X o
X o
r\ /
i J \
THRESHOLD LEVtu AT -3dB
LOWER THRESHOLD LEVEL
AMBIGUOUS AREA
Fig. 34. Trigger level and ambiguous area.
48

\
mmmm
Consider the problem of a threshold level detector that under worst-case conditions
Is not triggered by 3rd order IM products but by the suppressed small signal as well
as by the large signal. In a given dynamic range of signals, the design can be met
with certain frequency separation.
Worst-case conditions for keeping the detection from being triggered by 3rd order
products exist waen two equal peak power signals are received (Fig. 35). Worst-
case conditions that ensure the smallest signal trigger will exist when received
together with a peak signal (see Fig. 35). These curves Intersect at a point
corresponding to frequency separation F and normalized signal level N . s l~i
FREQUENCY SEPARATION (MHz)
10 20 30
> UJ
3 Q.
8 10
o UJ
o -I UJ m m
\
1 1
^ ^ SMALL SIGNAL SUPPRESSION >
Fs
TRIGGER LEVEL, NL
u 3RD ORDER IM PRODUCTS
18-9-3137 i
Fig. 35. Worst-case conditions and threshold level.
If the trigger level is set at level N , the signals with frequency separation larger
than the F will trigger properly since 3rd order IM products are below the trigger
level and the suppressed small signal is still above the trigger level. Whereas,
signal spacing is less than the required separation, F , small signals are not 9
49

" ■■'
detected and the 3rd order IM products are not kept from the trigger. Consequently,
the minimum frequency separation is defined by the worst-case condition when the
signal dynamic range is given. As expected, the larger the dynamic range, the
greater the separation, F , required. 8
One is forced to set a low trigger level when considering worst-case conditions,
therefore, the ambiguous area is Increased, or a better filter roll-off rate must be
obtained.
E. Response of a YIG FSL and Filter Bank Receiver to an LFM Signal
A row of contiguous subharmonlc tanks connected to an UJ tank, and a
column of filter banks connected at tho output of the uu tank through the amplifier
represents a YIG FSL and filter bank receiver (Fig. 36). An amplifier provides some
isolation.
The response of the YIG FSL to an LFM signal has been analyzed and measured
(Section II 4). As mentioned, the effective signal level to the subharmonlc tank Is
reduced due to the sweeping effect. The result Is that the limiting knee and output
level of the YIG FSL Is higher (see Fig. 30).
TTie response of a bandpass filter to a sweep signal Is well known and sometimes
described as the gliding effect. Basically, the signal sweeps over a large number
of channels in sequential fashion. TTie filter response depends on the sweep rate.
At a very low sweep rate, the filter output Is simply a plot of its frequency response.
However, at an extremely high rate, the LFM Input signal appears as an impulse
signal. The output approaches the impulse response of the filter. The response
between these extremes Is a function of the sweep rate and the shape of the bandpass
filter. Nevertheless, the output of the bandpass filter to an LFM signal Is a pulse
waveform In the time domain, and the amplitude depends on the rate of sweeping.
50
■ ■-■--
^Mü

4
INPUT
YIG FSL
w-TANK
CONTIGUOUS BANDPASS
FILTERS
THRESHOLD DETECTOR
CH 1 fcj
•
I
• >—H 0 •
• •
i 1 r 1 CH N -H-
CONTIGUOUS SUBHARMONIC TANKS IIJ-iOM
Fig. 36. YIG FSL and filter bank receiver.
51

«pp
A signal with sweep rate s (Hz/sec) can be represented by
f(t) = expj jnst .
If f(t) Is applied to a Gaussian-shaped bandpass filter,
H(u)) =expr- 1/2 (^)2' • 11
Tlie response at the output of the filter would be
2 2
z(t) = r n^ N2 TTT:— CiXP r.
[-(^ri^ ■ -&^
where a = n ^ f //ln2 .
The amplitude of |z(t)| can be plotted as a function of sweep rates when the bandwidth
of the Gaussian filter Is given. One such curve of |z(t)| is plotted in dB versus
MHz/usec (Fig. 37). In general, for a given bandpass filter, the faster the sweep
rate, the lower the output amplitude. Therefore, above a certain sweep rate,
without some means of compensation, the amplitude could be reduced to below the
threshold level of the triggering circuit. Consequently, no signals are detected and
identified.
The response of the Y1G FSL to the LFM signal has an opposite effect from that of
the bandpass filter described. For a system like the one shown In Fig. 36, an
increase In amplitude at the Y1G FSL output will offset amplitude reduction from the
bandpass filter. When a sweep signal is applied, the net change could be cancelled
at the output; the Identification capability, therefore, is not degraded.
52
MMMMMiMMMIHil

BBKT
u 0)
CO
C cd .^
o CO o 93
3 '■^ rt I C H O CO
» o n ? J ^ < LT OD UH •
Ui Ü S p K <fc«
0
o s o 0 O *~* *" •> <-!
IA cd 4. IH
■v cd I > 2 Si
U 1 K < a IT £
cd 0. UJ tu o $ c (rt o
CO »m*
U
t e o U
« r^ CO
be •** UH
(SP) 3anindwv Ni NIV9 do sscn
53
«UM^^^MMMMlMMiia MM k^MMMMMMM

1
A comparison of the loss at the ouput of a 1-MHz bandpass filter with the gain by
the YIG FSL as a function of sweep rate is given In Fig. .T'. 'the offset is excellent
up to a sweep rate of about 10 MHz/usec. At higher rates, the measured output
level of the YIG FSL is not at a constant value (Section II E) but the offset is still
good. It seems reasona^'e to say that the YIG FSL can be used advantageously in
a filter bank receiver to detect linear frequency modulated signals.
IV. Conclusion
A basic parametric FSL model was used to predict the characteristics of
a YIG FSL under different signal forms and signals existing simultaneously. The
predictions agreed qualitatively with the experimental results.
Experimental data obtained from a procured YIG FSL should typify all YIG FSL's
designed with power and selectivity characteristics scaled to the value of this unit.
A way to achieve a large limiting range by cascading the YIG FSL's and amplifiers
is proposed. This method is an alternative to using YIG spheres alone, which has
proven difficult to perfect.
TTie YIG FSL has the property of raising output lovel when an LFM signal Is applied,
which Is desirable for frequency Identification and detection in filter bank receivers.
ACKNOWLEDGMENT
The author is indebted to Mr. G. T. Flynn, for his valued recommendations,
Mr, A. J. Yakutls, who provided necessary equipment and suggestions, and
to all my colleagues who helped in the preparation of this note. Thanks are also
due to Patricia M. Anderson for her patient help In typing this note.
54
MMMMMMMMMiMaM ^mm m^^^mmmmmmmmtmk

REFERENCES
1. A. J. Glarola and D. R. Jackson, "Wideband Magnetoelastic Frequency- Selective Llmlter for VHF, " Boeing Internal Doc. D2-125343-1 (March 1967).
2. D. R. Jackson and R. W. Orth, "A Frequency-Selective Llmlter Using Nuclear Magnetic Resonance, " Proc. IEEE 55, 36-45 (January 1967).
3. T. R. Bllleter, "EPR Frequency-Selective Llmlter, " Proc. IEEE (letters) 56, 370-371 (March 1968).
4. I. T. Ho and A. E. Slegman, "Passive Phase-Distortionless Parametric Limiting with Varactor Diodes, " IRE Trans. MTT-9. 459-472 (November 1961).
5. A. J. Glarola, "Theory for the Signal Suppression In Ferrlte Frequency- Selective Limiters, " Proc. NEC Conf. 22, 42-44 (October 1966).
6. A. J, Glarola, "Third-Order Intermodulatlon Products Ina Ferrlte FSL- Two Signal Theory, " Proc. IEEE (letters) 55, 36-45 (January 1967).
7. A. L. Kotzebue, "Frequency Selective Limiting, "IRE TMTT-10. 516-520 (November 1962).
8. R. E. Tokhelm, C. K. Greene, J. C. Hoover, and P. W. Peter, "Non- reciprocal YIG Filter, " IEEE Trans. Magnetics MAG-3. 383-391 (September 1967).
9. B. Lax and K. J. Button, Microwave Ferrites and Ferrlmagftetlcs (McGraw-Hill, New York, 1962), p. 680.
10. N. F. Barber and F. Ursell, "The Response of a Resonant System to Gliding Tone, " Phil Mag (May 1948).
11. "Spectrum Analysis, " Application Note 63, Hewlett-Packard Company.
12. R. W. Orth, "Frequency Selective Limiters and Their Application, " IEEE Trans. Electromagnetic Compatibility ECM-10. 2, 273-283 (June 1968).
55
■ 1