effectiveness of positive behavioral interventions and supports
TRANSCRIPT
2012
Effectiveness of Positive Behavioral
Interventions and Supports A Report to the Texas Legislature
Published by the Texas Juvenile Justice Department
Effectiveness of
Positive Behavioral Interventions and Supports
A Report to the Texas Legislature
Texas Juvenile Justice Department Michael Griffiths, Executive Director
4900 North Lamar Boulevard
P.O. Box 12757 Austin, Texas 78711 www.tjjd.texas.gov
Community-Based Programs, Services and Facilities
P (512) 424-6700 I F (512) 424-6717 I TDD (512) 424-4000
State Institutions, Programs, Services and Facilities P (512) 424-6130 I F (512) 424-6010 I TDD (512) 424-4000
Published December 2012
Summary of Contents
Introduction ........................................................................................................................................ 1
Positive Behavior Interventions and Supports (PBIS) ........................................................ 1
Historical Reference ............................................................................................................. 2
Implementation Report (December 2010) ..................................................................................... 4
Local PBIS Leadership Teams ............................................................................................. 5
Behavioral Data Systems ..................................................................................................... 6
Validated Measurement of Systemic Positive Behavioral Support Interventions ............ 6
Student Participation in PBIS .............................................................................................. 6
Data Collection, Disaggregation, and Analysis .............................................................................. 7
Data Sets for Social Behavior .......................................................................................................... 8
Disciplinary Actions by Subgroup ...................................................................................... 15
Limited English Proficiency ................................................................................................ 16
Average Daily Attendance Rate for FY 2012 .................................................................... 20
Time Out of the Regular Classroom .................................................................................. 20
Conclusion ........................................................................................................................................ 22
Bibliography ..................................................................................................................................... 23

Executive Summary Positive Behavioral Interventions and Supports (PBIS)
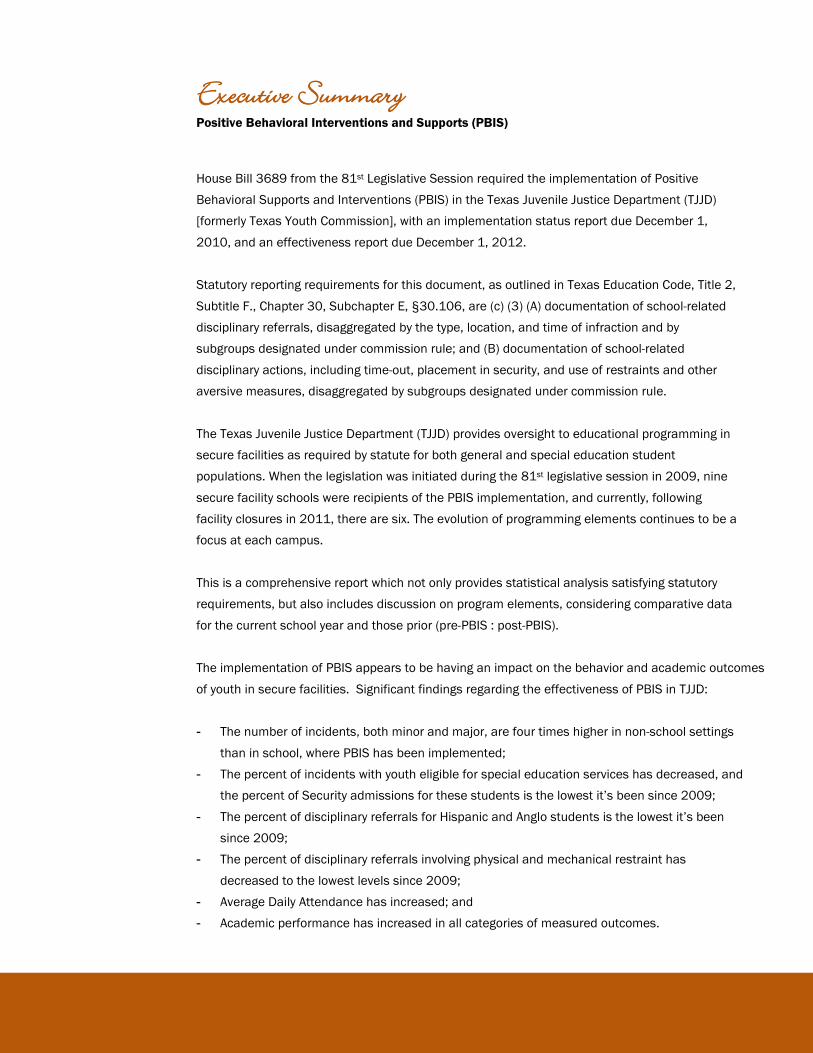
House Bill 3689 from the 81st Legislative Session required the implementation of Positive Behavioral Supports and Interventions (PBIS) in the Texas Juvenile Justice Department (TJJD) [formerly Texas Youth Commission], with an implementation status report due December 1,
2010, and an effectiveness report due December 1, 2012. Statutory reporting requirements for this document, as outlined in Texas Education Code, Title 2,
Subtitle F., Chapter 30, Subchapter E, §30.106, are (c) (3) (A) documentation of school-related disciplinary referrals, disaggregated by the type, location, and time of infraction and by subgroups designated under commission rule; and (B) documentation of school-related
disciplinary actions, including time-out, placement in security, and use of restraints and other aversive measures, disaggregated by subgroups designated under commission rule.
The Texas Juvenile Justice Department (TJJD) provides oversight to educational programming in secure facilities as required by statute for both general and special education student populations. When the legislation was initiated during the 81st legislative session in 2009, nine
secure facility schools were recipients of the PBIS implementation, and currently, following facility closures in 2011, there are six. The evolution of programming elements continues to be a focus at each campus.
This is a comprehensive report which not only provides statistical analysis satisfying statutory requirements, but also includes discussion on program elements, considering comparative data
for the current school year and those prior (pre-PBIS : post-PBIS). The implementation of PBIS appears to be having an impact on the behavior and academic outcomes
of youth in secure facilities. Significant findings regarding the effectiveness of PBIS in TJJD: - The number of incidents, both minor and major, are four times higher in non-school settings
than in school, where PBIS has been implemented; - The percent of incidents with youth eligible for special education services has decreased, and
the percent of Security admissions for these students is the lowest it’s been since 2009;
- The percent of disciplinary referrals for Hispanic and Anglo students is the lowest it’s been since 2009;
- The percent of disciplinary referrals involving physical and mechanical restraint has
decreased to the lowest levels since 2009; - Average Daily Attendance has increased; and - Academic performance has increased in all categories of measured outcomes.

Effectiveness of Positive Behavior Interventions and Supports, December 2012 1
House Bill 3689 from the 81st Legislative Session required implementation of PBIS in the Texas Juvenile Justice Department (then Texas Youth Commission), with an implementation status report due December 1, 2010, and a Positive Behavioral Interventions and Supports effectiveness report due December 1, 2012. Positive Behavioral Interventions and Supports (PBIS) Positive Behavioral Interventions and Supports (PBIS) is an implementation framework that is designed to enhance academic and social behavior outcomes for all students by (a) emphasizing the use of data for informing decisions about the selection, implementation, and progress monitoring of evidence-based behavioral practices; and (b) organizing resources and systems to improve durable implementation fidelity (Sugai and Simonsen, June 19, 2012). The PBIS framework has a number of defining characteristics. First and foremost, student outcomes serve as the basis for practice selection, data collection, and intervention evaluations. These outcomes are (a) academic and social, (b) individual and small group, and (c) judged on their educational and social value and importance (McIntosh, Filter, Bennett, Ryan, & Sugai, 2010; McIntosh, Flannery, Sugai, Braun, & Cochrane, 2008). Second, rather than focusing on specific packaged or manualized interventions, the PBIS framework highlights specification and adoption of evidence- and research-based practices that characterize packaged programs. These practices are organized to support students across (a) school-wide (e.g., teaching and acknowledging a small number of positively stated behavioral expectations, clear and distinctive definitions for rule violations, and data-decision rules), (b) non-classroom (e.g., active supervision, reminders, teaching setting-specific routines), (c) classroom (e.g., effective academic instruction, active supervision, high praise rates), and (d) individual student (e.g., function-based behavior intervention supports, explicit social skills instruction, wraparound processes) routines (Eber, Sugai, Smith, & Scott, 2002; Lewis & Sugai, 1999). Third, consistent with the response-to-intervention approach, PBIS is characterized by the establishment of a continuum of behavior support practices and systems (Sugai & Horner, 2009). These practices are unified with procedures for universal screening, continuous progress monitoring, team-based decision making rules and procedures, explicit monitoring of implementation fidelity, and local content expertise and fluency. In addition, the PBIS framework stresses the importance of embedded and continuous professional development, monitoring based on phase of implementation, and systems-based competence and supports (e.g., policy, leadership, funding) (Sugai, Horner, Fixsen, & Blase, 2010). Finally, the effective, efficient, and relevant use of data or information to guide decision-making links the above characteristics. The collection, analysis, and use of data are considered essential for a number of PBIS purposes: (a) need clarification and priority, (b) matching of need and intervention or practice, (c) evaluation of research-base for practice selection, (d) student responsiveness and outcome impact, (e) intervention or practice fidelity, (f) social and ecological validity, and (g) implementation adjust for efficiency, effectiveness, and relevance (Lewis-Palmer, Sugai, & Larson, 1999).
Introduction
2 TEXAS JUVENILE JUSTICE DEPARTMENT
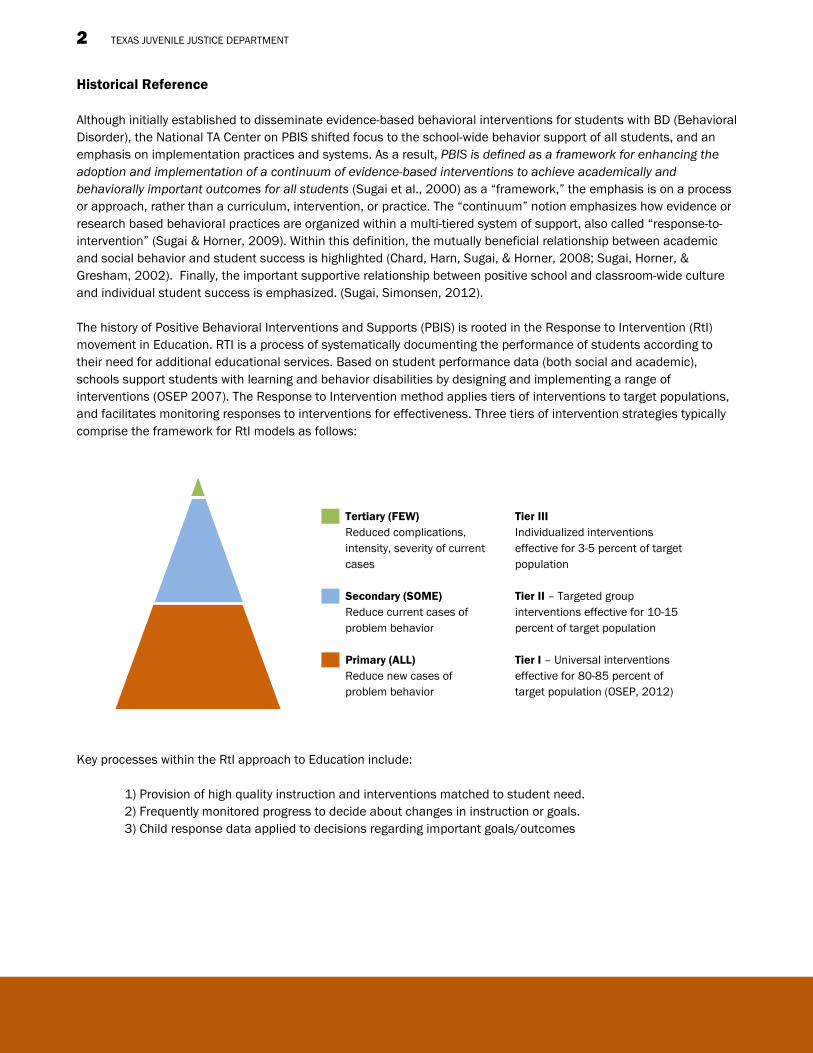
Historical Reference Although initially established to disseminate evidence-based behavioral interventions for students with BD (Behavioral Disorder), the National TA Center on PBIS shifted focus to the school-wide behavior support of all students, and an emphasis on implementation practices and systems. As a result, PBIS is defined as a framework for enhancing the adoption and implementation of a continuum of evidence-based interventions to achieve academically and behaviorally important outcomes for all students (Sugai et al., 2000) as a “framework,” the emphasis is on a process or approach, rather than a curriculum, intervention, or practice. The “continuum” notion emphasizes how evidence or research based behavioral practices are organized within a multi-tiered system of support, also called “response-to-intervention” (Sugai & Horner, 2009). Within this definition, the mutually beneficial relationship between academic and social behavior and student success is highlighted (Chard, Harn, Sugai, & Horner, 2008; Sugai, Horner, & Gresham, 2002). Finally, the important supportive relationship between positive school and classroom-wide culture and individual student success is emphasized. (Sugai, Simonsen, 2012). The history of Positive Behavioral Interventions and Supports (PBIS) is rooted in the Response to Intervention (RtI) movement in Education. RTI is a process of systematically documenting the performance of students according to their need for additional educational services. Based on student performance data (both social and academic), schools support students with learning and behavior disabilities by designing and implementing a range of interventions (OSEP 2007). The Response to Intervention method applies tiers of interventions to target populations, and facilitates monitoring responses to interventions for effectiveness. Three tiers of intervention strategies typically comprise the framework for RtI models as follows:
Key processes within the RtI approach to Education include:
1) Provision of high quality instruction and interventions matched to student need. 2) Frequently monitored progress to decide about changes in instruction or goals. 3) Child response data applied to decisions regarding important goals/outcomes
___ Tertiary (FEW) Reduced complications, intensity, severity of current cases
___ Secondary (SOME)
Reduce current cases of problem behavior
___ Primary (ALL)
Reduce new cases of problem behavior
Tier III Individualized interventions effective for 3-5 percent of target population Tier II – Targeted group interventions effective for 10-15 percent of target population Tier I – Universal interventions effective for 80-85 percent of target population (OSEP, 2012)
Effectiveness of Positive Behavior Interventions and Supports, December 2012 3
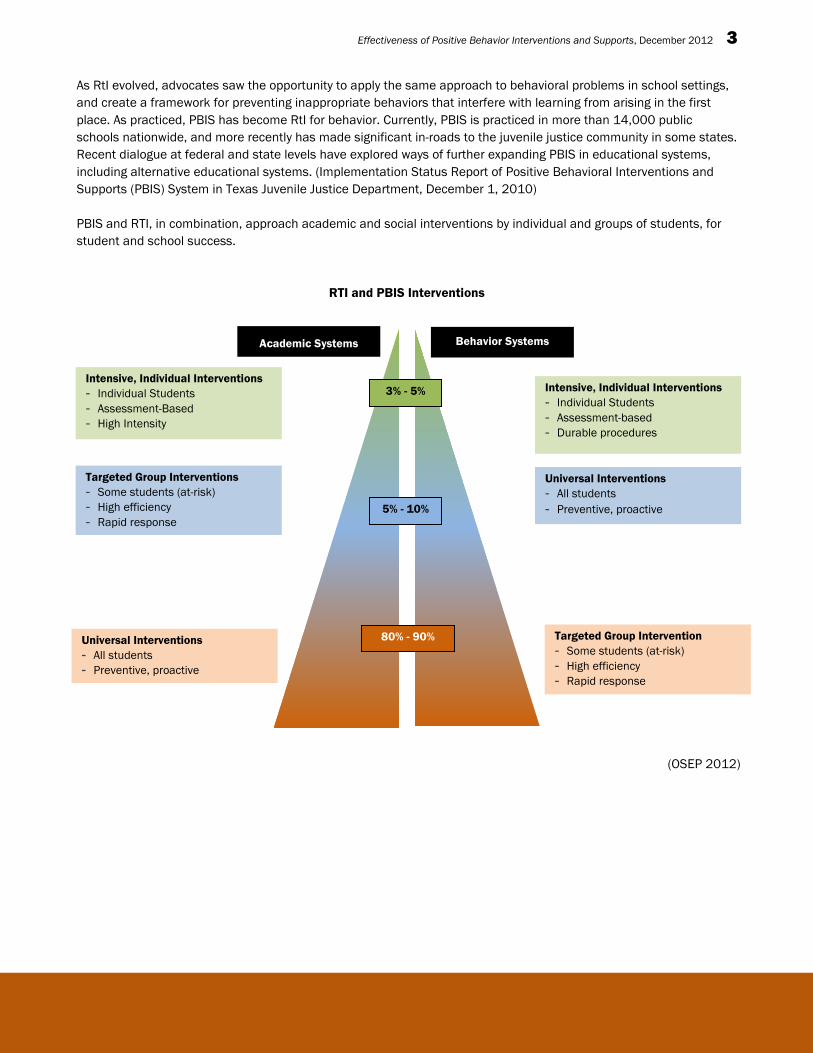
As RtI evolved, advocates saw the opportunity to apply the same approach to behavioral problems in school settings, and create a framework for preventing inappropriate behaviors that interfere with learning from arising in the first place. As practiced, PBIS has become RtI for behavior. Currently, PBIS is practiced in more than 14,000 public schools nationwide, and more recently has made significant in-roads to the juvenile justice community in some states. Recent dialogue at federal and state levels have explored ways of further expanding PBIS in educational systems, including alternative educational systems. (Implementation Status Report of Positive Behavioral Interventions and Supports (PBIS) System in Texas Juvenile Justice Department, December 1, 2010) PBIS and RTI, in combination, approach academic and social interventions by individual and groups of students, for student and school success.
RTI and PBIS Interventions
(OSEP 2012)
Intensive, Individual Interventions - Individual Students - Assessment-Based - High Intensity
Intensive, Individual Interventions - Individual Students - Assessment-based - Durable procedures
Targeted Group Interventions - Some students (at-risk) - High efficiency - Rapid response
Targeted Group Intervention - Some students (at-risk) - High efficiency - Rapid response
Universal Interventions - All students - Preventive, proactive
Universal Interventions - All students - Preventive, proactive
Academic Systems
Behavior Systems
3% - 5%
5% - 10%
80% - 90%
4 TEXAS JUVENILE JUSTICE DEPARTMENT
Among consultants with whom TJJD had contracted to facilitate PBIS implementation, the legislation was the first known instance of mandated PBIS participation for an educational system. Consultants expressed early intrigue regarding fit between the mandatory nature of participation and a fundamental PBIS concept…voluntary buy-in and readiness for implementation. Much of that concern diminished as TJJD staff learned about PBIS’s potential to reduce problematic behaviors, improve student and staff safety, enhance classroom learning, and improve educational as well as treatment outcomes. Moreover, the legislation provided support for revival of a PBIS initiative the agency had started previously, except with the benefit of additional consultation from education centers of higher learning. This partnership between TJJD and higher education consultants constituted the cornerstone of implementation and will be a vital component of further phase development. Contract with C. Michael Nelson, Ed.D. TJJD executed a PBIS support contract with Dr. Nelson, nationally regarded expert in PBIS, in February 2010 after initial consultation with TJJD management in November 2009. Dr. Nelson has played a major role in coordination of trainings for key leadership personnel charged with implementation of PBIS at state and local levels. He delivered initial training to all Education staff at an annual Education conference in June 2010. He has also participated in routine conference calls with the team of PBIS consultants and TJJD Education administrators to plan on-going training activities and advised ways to integrate PBIS systems with other TJJD operations. Contract with Eugene Wang, Ph.D. TJJD executed a PBIS evaluation contract with Dr. Wang, well-regarded evaluation expert from Texas Tech University in April 2010. Dr. Wang has worked extensively with TJJD’s Information Resources Division to analyze data systems within TJJD relevant to assessing impact of PBIS implementation. He has had extensive access to TJJD data systems. He has also used his experience in working with PBIS to co-facilitate trainings for key leadership personnel and local leadership teams charged with implementation at the facility level. He also co-facilitated information gathering sessions from juvenile correctional officers regarding front line data options for tracking individual students’ progress. Dr. Wang also participated in routine conference calls with the team of PBIS consultants and TJJD Education administrators to facilitate the disaggregation of data and key performance indicators. Contract with Texas State University. With input from Dr. Nelson and Advocacy, Inc. leadership, TJJD designed and developed a contract with Texas State University to tap expertise from the University’s Behavioral Disorders/Positive Behavioral Supports graduate concentration program. The contract provided for a network of external behavior coaches assigned to each TJJD facility that met with local leadership teams, offered on-going technical assistance, and monitored program fidelity, including effective conversion of data to useful information for decision-making purposes. Behavior coaches also aided in developing PBIS training materials for parents of TJJD youth. The initial contract provided for four general education behavior coaches and three special education behavior coaches. Hiring was staged sequentially to provide needed support as facilities were prepared to receive it. Special education behavior coaches provided specialized input to functional behavior assessments, behavior intervention plans, and other individualized interventions for youth with disabilities and assisted with specialized data tracking requirements and general implementation of PBIS initiatives for youth with disabilities. Dr. Nelson and Dr. Brenda Scheuermann, Texas State’s PBIS project director, have presented the collaboration between TJJD and Texas State as a possible best practice for implementation of PBIS in juvenile justice settings at national conferences.
Implementation Report (December 2010)
Effectiveness of Positive Behavior Interventions and Supports, December 2012 5
Statewide PBIS Leadership Team. TJJD sponsored the creation of a Statewide PBIS Leadership Team, including identification of a Statewide PBIS Coordinator, in March 2010. The team initially included Principals from three TJJD facilities, as well as Central Office executive and mid-management personnel. The team was drafted to provide coordinated oversight of the PBIS system. A key initial decision from the state leadership team was that PBIS could be most effective with implementation on a facility-wide, 24/7 basis rather than in Education settings alone as required by legislation. This decision carried large ramifications for design, delivery, and program fidelity considerations. Complexity introduced from the decision to implement PBIS facility-wide at each location included enhanced coordination with existing CoNEXTions® systems, logistical considerations for staff orientation and development on a significantly broader scale, as well as a comprehensive integration of information systems and daily schedules that facilitated meeting times to use PBIS effectively. To help shape efforts, the statewide team directed that PBIS systems would organize around five common behavioral expectations established previously through CoNEXTions®:
- Be in the right place at the right time. - Follow directions - Participate in activities - Respect others - Accept consequences
Simultaneously and most importantly, the state leadership team realized implementation of PBIS was less a matter of new programming for youth than it was about changing systems and mindsets of adults who work with youth. The consultant team strongly advised deliberate, advanced planning that would enhance program fidelity, especially given the broad distribution of personnel impacted in each TJJD facility, let alone the broad geographic location of facilities across Texas. The statewide leadership team and consultant team also recognized that PBIS could not be implemented immediately at all locations with program fidelity, and choices had to be made logistically to stage a rollout on each campus. To help meet requirements of HB 3689, the statewide team determined that TJJD schools would be the best facility location to begin implementation and training and implementation on dorms would follow. Local PBIS Leadership Teams In initial implementation stages, local leadership teams typically were comprised of 8-10 staff representing broad operational areas where PBIS was used across facilities. Teams from each facility received initial training in three different cohorts. Teams then quickly held a series of orientation meetings with all facility staff, supported by external PBIS coaches, to introduce PBIS concepts. Orientations encouraged staff participation in facility-wide dialogues about common behavioral expectations in specific settings at each facility. The dialogue was critical to the development of behavioral expectations that staff would support. Local teams used staff input to specify what each of the five big expectations would look like in different settings. For example, “respecting others” requires a different set of behavioral skills in the classroom compared to the lunch line. Local leadership teams met regularly to hone such expectations and garner input from campus personnel to design an Expectations Matrix for each facility that indicated positive behavioral skills needed in different facility locations, beginning in the school. As expectations for each setting were specified, leadership teams designed local lesson plans to proactively teach the desired behavioral skills, and scheduled regular times to deliver them. In addition, teams created rules posters and designed other reminders to reinforce expectations for each setting. General acknowledgment systems to reinforce desired outcomes were also essential, and were facilitated in part by experience with existing CoNEXTions® incentive systems. However, the consultant team also advised that schools should develop reinforcement systems that could be contained and delivered within the school system itself, during the school day. Refinement of reinforcement systems internal to schools continues to evolve.
6 TEXAS JUVENILE JUSTICE DEPARTMENT
Behavioral Data Systems Local leadership teams reviewed available data to help discern areas of highest need for behavioral interventions. Existing data systems tracked major incident locations, times, etc., that resulted in referrals to Security units. The statewide leadership team, with PBIS consultants’ input, determined these were sufficient to begin designing PBIS interventions. However, a review of other available behavioral data systems revealed opportunity for cost-effective, large scale improvements in behavioral data tracking. The agency purchased access to the Referral Assessment Management Portal (RAMP) from Region XIII Education Service Center for its highly customizable features that allowed data tracking with significantly greater precision. RAMP features were more useful for designing behavioral interventions. Initial training for local RAMP data administrators occurred in September 2010. However, integration with the agency’s student attendance accounting software (iTCCS) remained a work in progress, and in the summer of the 2012 school year, RAMP was no longer supported by ESC XIII. Validated Measurement of Systemic Positive Behavioral Support Interventions During the implementation period, the PBIS planning team considered a number of instruments (with some variations) used in public schools to monitor stages and fidelity of implementation. These included the Benchmarks of Quality, the Team Implementation Checklist, and the Facility-Wide Evaluation Tool (FET). Of these instruments, the FET proved most amenable to training and use within TJJD operations. FET results are used to assess features of PBIS in place, determine annual goals, evaluate on-going efforts, design and revise procedures as needed, and compare year to year efforts toward effective implementation (Facility-wide Evaluation Tool version 5.0, C. Michael Nelson, October 2009). Student Participation in PBIS To support program fidelity, TJJD followed the PBIS consulting team’s advice to proceed deliberately, with systems fully planned before formal application to students. Design and development of all system components was a methodical process involving many participants. An early and natural result of such planning was a shift from traditional thinking about ways to intervene with students. Campuses continue to see a significant reduction in referrals to Security, in large part because staff members are looking proactively for positive ways to keep students in classrooms. The school attendance rate was higher in 2010-11 than any year in the prior ten. Formal training of all Education staff in all PBIS components began on January 3, 2011. At that time, students formally received direct, proactive instruction in desired behavioral skills, a practice that continues. HB 3689 tied students’ successful participation in PBIS, as defined by agency rule, to parole eligibility. The agency adopted GAP.91.55 in September 2010 to meet this requirement. The PBIS consulting team noted the requirement’s aversive nature ran counter to the philosophy of PBIS systems as implemented nationally. Accordingly, TJJD adopted the requirement as an eligibility criterion for release that runs parallel with implementation of the PBIS system, but is not a formal part of the PBIS system. Successful participation is tied by definition to time in class and acquisition of behavioral skills necessary for success in a student’s next academic or vocational setting. As students continue to receive full benefits, behavioral expectations and accountability will continue to rise.
Effectiveness of Positive Behavior Interventions and Supports, December 2012 7
All data has been collected and presented for analysis by TJJD Research Department, TJJD Education staff, and/or Dr. Eugene Wang, Assistant Professor in Educational Psychology at Texas Tech University. Data are stored in multiple tables in a relational database and were provided to evaluators for fiscal years 1995 through August 2012. Files reviewed and used for analysis:
- Initial Review and Assessment Records for Treatment Needs and Priorities - Individualized Case Plans - Dorm Assignment Records - Education Evaluation, Assessment, and Scoring - Incident reports (CCS) - Offense History - iTTCS/PEIMS records (state education reporting data systems) - In school behavioral data (RAMP) - Commitment Records, including commitment, recommitment, revocation, & reclassification - Specialized Services and Treatment Records - Facility-wide Evaluation Tool (FET)
Practice selection and intervention evaluation are dependent on looking at social and academic behavior both on an individual and group basis. For TJJD evaluators, there has also been a focus on behavior in both the school and non-school setting for comparative purposes. Evaluators report that because of TJJD’s highly mobile population, simply taking a standard frequency or a rate per 100 student population was not feasible. Instead, much of the following data looks at three outcomes per student/month/facility:
1. Major incidents 2. Referrals to security 3. Admissions to security
Within this framework, evaluators then aggregated the number of days a student was at a certain facility during a specified month, noted the frequency of major incidents, and computed a monthly rate (per 30 days at a facility), then did the same for the subset of incidents reported in the school setting. Data indicated in this report reflects schools operating in nine secure facilities until July 2011, when three were closed.
Data Collection, Disaggregation and Analysis
8 TEXAS JUVENILE JUSTICE DEPARTMENT
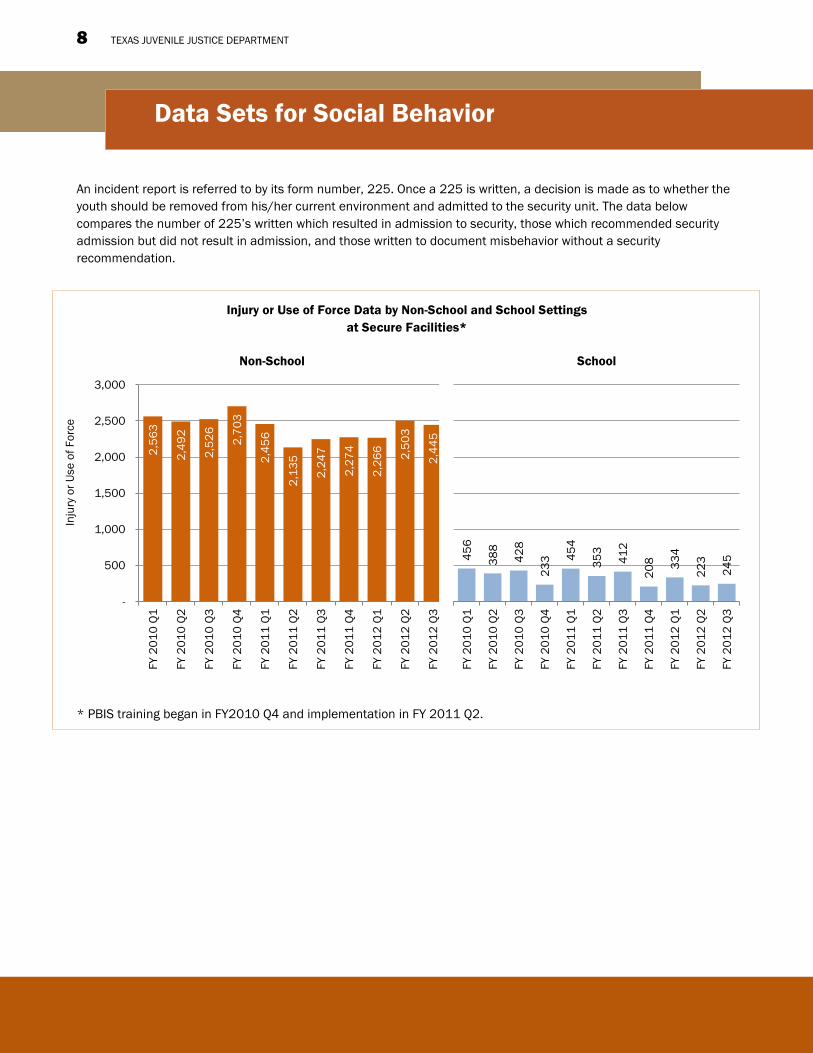
An incident report is referred to by its form number, 225. Once a 225 is written, a decision is made as to whether the youth should be removed from his/her current environment and admitted to the security unit. The data below compares the number of 225’s written which resulted in admission to security, those which recommended security admission but did not result in admission, and those written to document misbehavior without a security recommendation.
Injury or Use of Force Data by Non-School and School Settings at Secure Facilities*
* PBIS training began in FY2010 Q4 and implementation in FY 2011 Q2.
Data Sets for Social Behavior 2
,563
2,4
92
2,5
26
2,7
03
2,4
56
2,1
35
2,2
47
2,2
74
2,2
66
2,5
03
2,4
45
-
500
1,000
1,500
2,000
2,500
3,000
FY 2
010
Q1
FY 2
010
Q2
FY 2
010
Q3
FY 2
010
Q4
FY 2
011
Q1
FY 2
011
Q2
FY 2
011
Q3
FY 2
011
Q4
FY 2
012
Q1
FY 2
012
Q2
FY 2
012
Q3
Non-School
456
388
428
233 45
4
353
412
208 33
4
223
245
FY 2
010
Q1
FY 2
010
Q2
FY 2
010
Q3
FY 2
010
Q4
FY 2
011
Q1
FY 2
011
Q2
FY 2
011
Q3
FY 2
011
Q4
FY 2
012
Q1
FY 2
012
Q2
FY 2
012
Q3
School
Inju
ry o
r Use
of F
orce
Effectiveness of Positive Behavior Interventions and Supports, December 2012 9
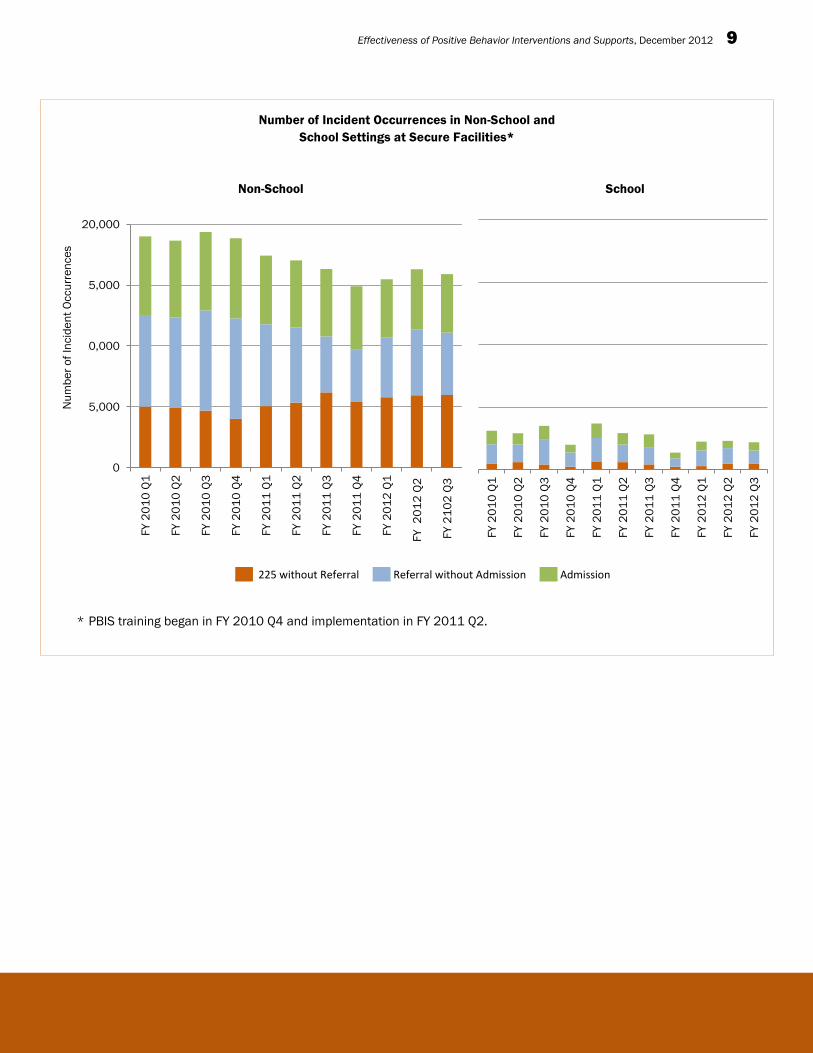
Number of Incident Occurrences in Non-School and School Settings at Secure Facilities*
* PBIS training began in FY 2010 Q4 and implementation in FY 2011 Q2.
0
5,000
10,000
15,000
20,000
FY 2
010
Q1
FY 2
010
Q2
FY 2
010
Q3
FY 2
010
Q4
FY 2
011
Q1
FY 2
011
Q2
FY 2
011
Q3
FY 2
011
Q4
FY 2
012
Q1
FY 2
012
Q2
FY 2
102
Q3
Non-School
FY 2
010
Q1
FY 2
010
Q2
FY 2
010
Q3
FY 2
010
Q4
FY 2
011
Q1
FY 2
011
Q2
FY 2
011
Q3
FY 2
011
Q4
FY 2
012
Q1
FY 2
012
Q2
FY 2
012
Q3
School
Num
ber o
f Inc
iden
t Occ
urre
nces
___ 225 without Referral ___ Referral without Admission ___ Admission
10 TEXAS JUVENILE JUSTICE DEPARTMENT
0
100
200
300
400
500
600
700
Sep-10 Oct-10 Nov-10 Dec-10 Jan-11 Feb-11 Mar-11 Apr-11 May-11
School Incidents
Minor w/o referral Minor with referral no admit
Minor with referral & admit Major w/o referral
Major with referral no admit Major with referral & admit
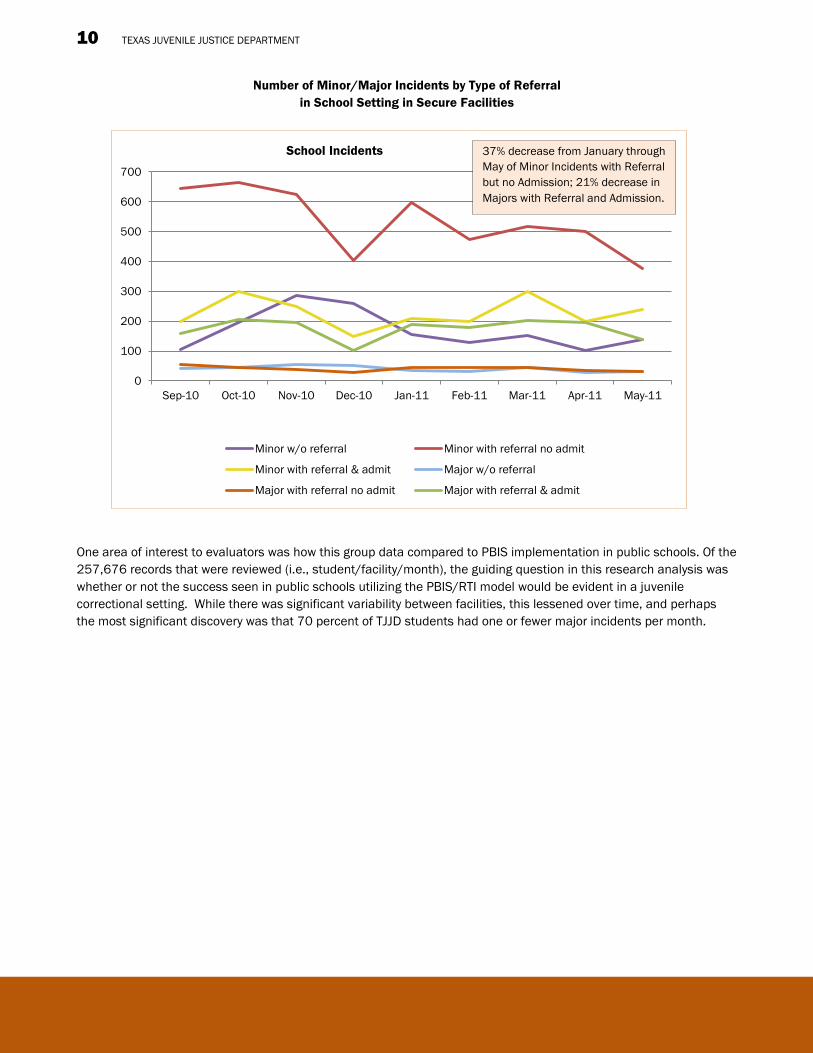
Number of Minor/Major Incidents by Type of Referral in School Setting in Secure Facilities
One area of interest to evaluators was how this group data compared to PBIS implementation in public schools. Of the 257,676 records that were reviewed (i.e., student/facility/month), the guiding question in this research analysis was whether or not the success seen in public schools utilizing the PBIS/RTI model would be evident in a juvenile correctional setting. While there was significant variability between facilities, this lessened over time, and perhaps the most significant discovery was that 70 percent of TJJD students had one or fewer major incidents per month.
37% decrease from January through May of Minor Incidents with Referral but no Admission; 21% decrease in Majors with Referral and Admission.
Effectiveness of Positive Behavior Interventions and Supports, December 2012 11
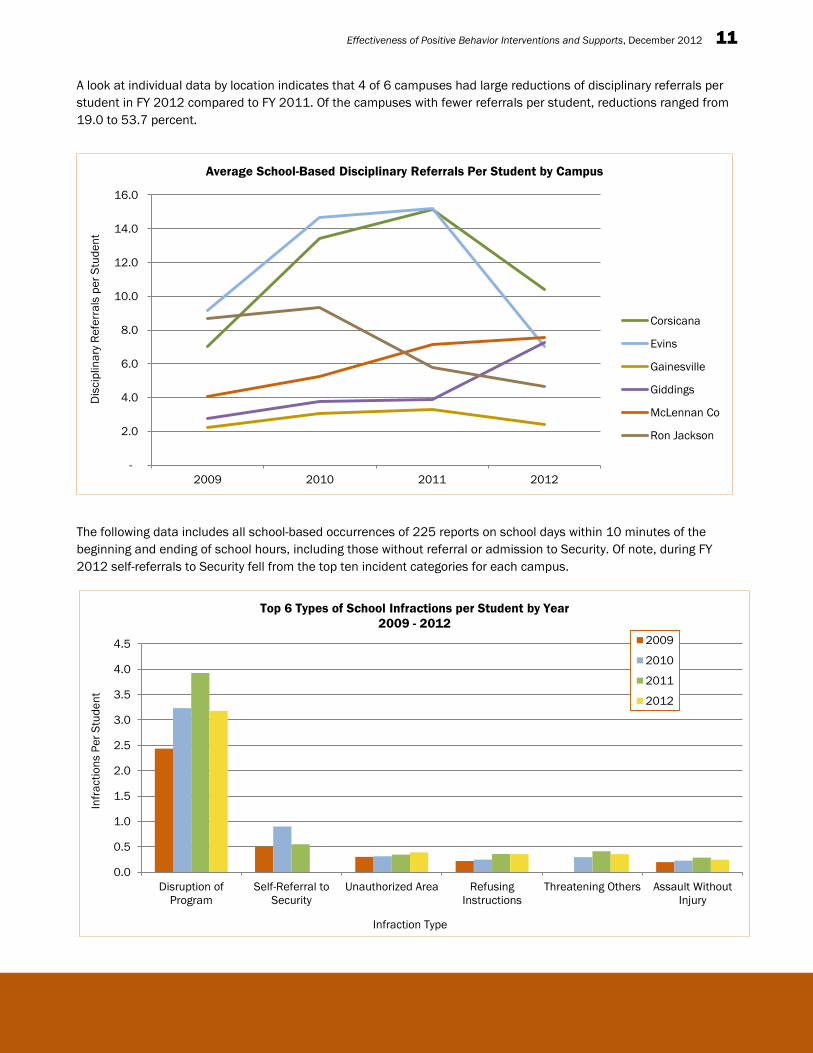
A look at individual data by location indicates that 4 of 6 campuses had large reductions of disciplinary referrals per student in FY 2012 compared to FY 2011. Of the campuses with fewer referrals per student, reductions ranged from 19.0 to 53.7 percent.
The following data includes all school-based occurrences of 225 reports on school days within 10 minutes of the beginning and ending of school hours, including those without referral or admission to Security. Of note, during FY 2012 self-referrals to Security fell from the top ten incident categories for each campus.
-
2.0
4.0
6.0
8.0
10.0
12.0
14.0
16.0
2009 2010 2011 2012
Dis
cipl
inar
y Re
ferr
als
per S
tude
nt
Average School-Based Disciplinary Referrals Per Student by Campus
Corsicana
Evins
Gainesville
Giddings
McLennan Co
Ron Jackson
0.0
0.5
1.0
1.5
2.0
2.5
3.0
3.5
4.0
4.5
Disruption ofProgram
Self-Referral toSecurity
Unauthorized Area RefusingInstructions
Threatening Others Assault WithoutInjury
Infra
ctio
ns P
er S
tude
nt
Infraction Type
Top 6 Types of School Infractions per Student by Year 2009 - 2012
2009
2010
2011
2012
12 TEXAS JUVENILE JUSTICE DEPARTMENT
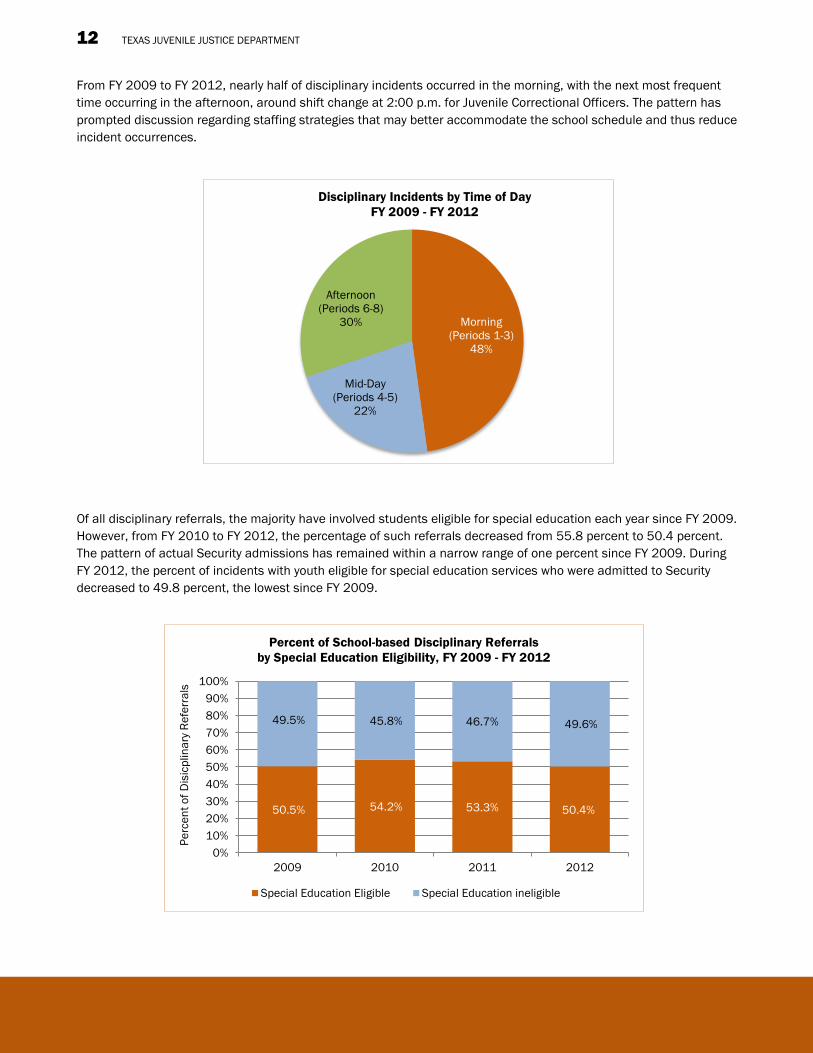
From FY 2009 to FY 2012, nearly half of disciplinary incidents occurred in the morning, with the next most frequent time occurring in the afternoon, around shift change at 2:00 p.m. for Juvenile Correctional Officers. The pattern has prompted discussion regarding staffing strategies that may better accommodate the school schedule and thus reduce incident occurrences.
Of all disciplinary referrals, the majority have involved students eligible for special education each year since FY 2009. However, from FY 2010 to FY 2012, the percentage of such referrals decreased from 55.8 percent to 50.4 percent. The pattern of actual Security admissions has remained within a narrow range of one percent since FY 2009. During FY 2012, the percent of incidents with youth eligible for special education services who were admitted to Security decreased to 49.8 percent, the lowest since FY 2009.
Morning (Periods 1-3)
48%
Mid-Day (Periods 4-5)
22%
Afternoon (Periods 6-8)
30%
Disciplinary Incidents by Time of Day FY 2009 - FY 2012
50.5% 54.2% 53.3% 50.4%
49.5% 45.8% 46.7% 49.6%
0%10%20%30%40%50%60%70%80%90%
100%
2009 2010 2011 2012
Perc
ent o
f Dis
icpl
inar
y Re
ferr
als
Percent of School-based Disciplinary Referrals by Special Education Eligibility, FY 2009 - FY 2012
Special Education Eligible Special Education ineligible
Effectiveness of Positive Behavior Interventions and Supports, December 2012 13
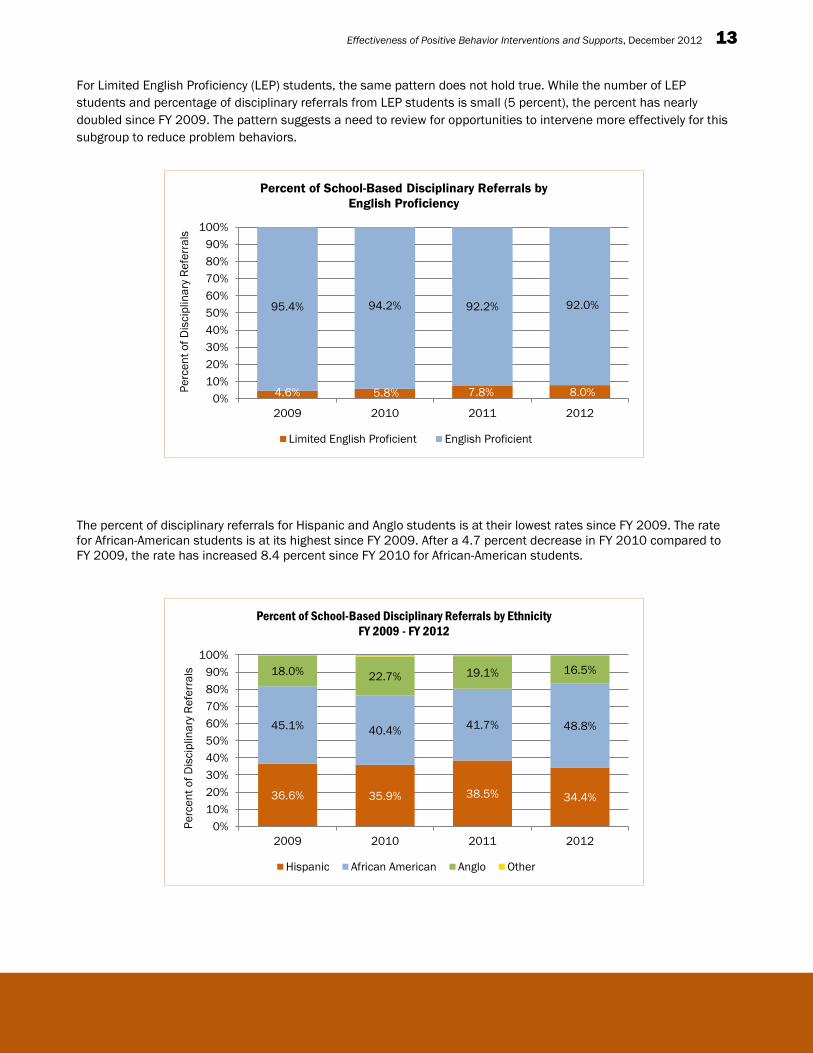
For Limited English Proficiency (LEP) students, the same pattern does not hold true. While the number of LEP students and percentage of disciplinary referrals from LEP students is small (5 percent), the percent has nearly doubled since FY 2009. The pattern suggests a need to review for opportunities to intervene more effectively for this subgroup to reduce problem behaviors.
The percent of disciplinary referrals for Hispanic and Anglo students is at their lowest rates since FY 2009. The rate for African-American students is at its highest since FY 2009. After a 4.7 percent decrease in FY 2010 compared to FY 2009, the rate has increased 8.4 percent since FY 2010 for African-American students.
4.6% 5.8% 7.8% 8.0%
95.4% 94.2% 92.2% 92.0%
0%10%20%30%40%50%60%70%80%90%
100%
2009 2010 2011 2012
Perc
ent o
f Dis
cipl
inar
y Re
ferr
als
Percent of School-Based Disciplinary Referrals by English Proficiency
Limited English Proficient English Proficient
36.6% 35.9% 38.5% 34.4%
45.1% 40.4% 41.7% 48.8%
18.0% 22.7% 19.1% 16.5%
0%10%20%30%40%50%60%70%80%90%
100%
2009 2010 2011 2012
Perc
ent o
f Dis
cipl
inar
y Re
ferr
als
Percent of School-Based Disciplinary Referrals by Ethnicity FY 2009 - FY 2012
Hispanic African American Anglo Other
14 TEXAS JUVENILE JUSTICE DEPARTMENT
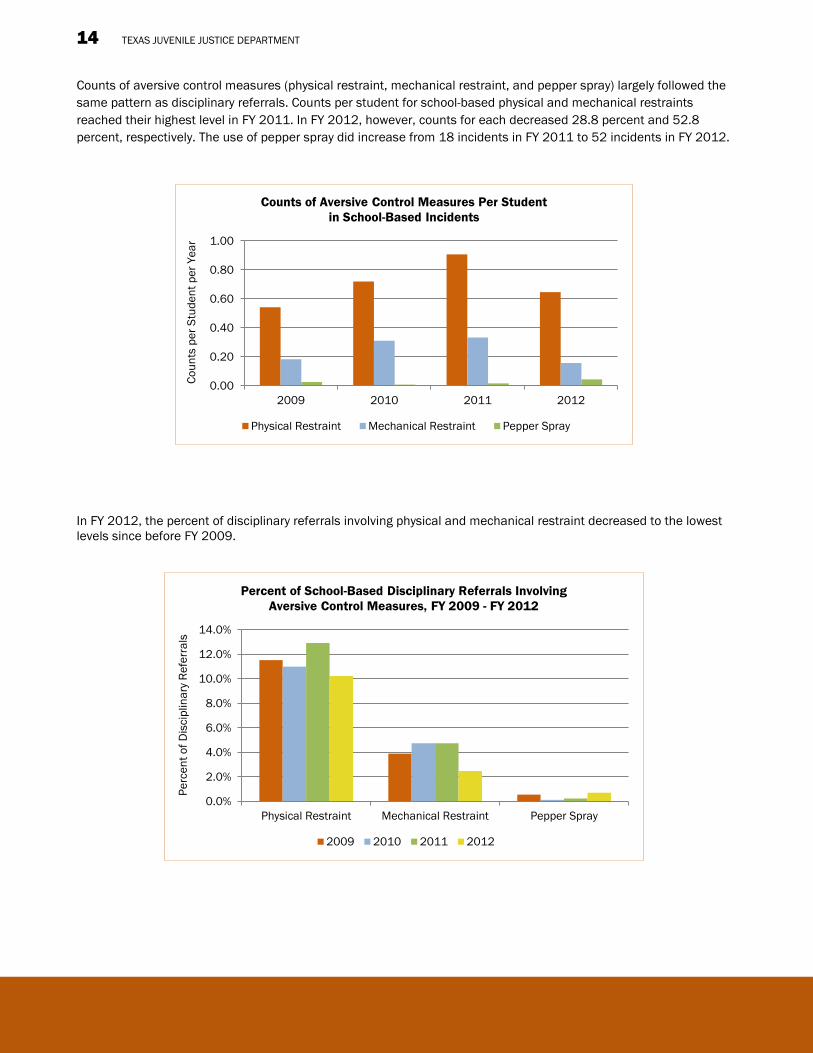
Counts of aversive control measures (physical restraint, mechanical restraint, and pepper spray) largely followed the same pattern as disciplinary referrals. Counts per student for school-based physical and mechanical restraints reached their highest level in FY 2011. In FY 2012, however, counts for each decreased 28.8 percent and 52.8 percent, respectively. The use of pepper spray did increase from 18 incidents in FY 2011 to 52 incidents in FY 2012.
In FY 2012, the percent of disciplinary referrals involving physical and mechanical restraint decreased to the lowest levels since before FY 2009.
0.00
0.20
0.40
0.60
0.80
1.00
2009 2010 2011 2012
Coun
ts p
er S
tude
nt p
er Y
ear
Counts of Aversive Control Measures Per Student in School-Based Incidents
Physical Restraint Mechanical Restraint Pepper Spray
0.0%
2.0%
4.0%
6.0%
8.0%
10.0%
12.0%
14.0%
Physical Restraint Mechanical Restraint Pepper Spray
Perc
ent o
f Dis
cipl
inar
y Re
ferr
als
Percent of School-Based Disciplinary Referrals Involving Aversive Control Measures, FY 2009 - FY 2012
2009 2010 2011 2012
Effectiveness of Positive Behavior Interventions and Supports, December 2012 15
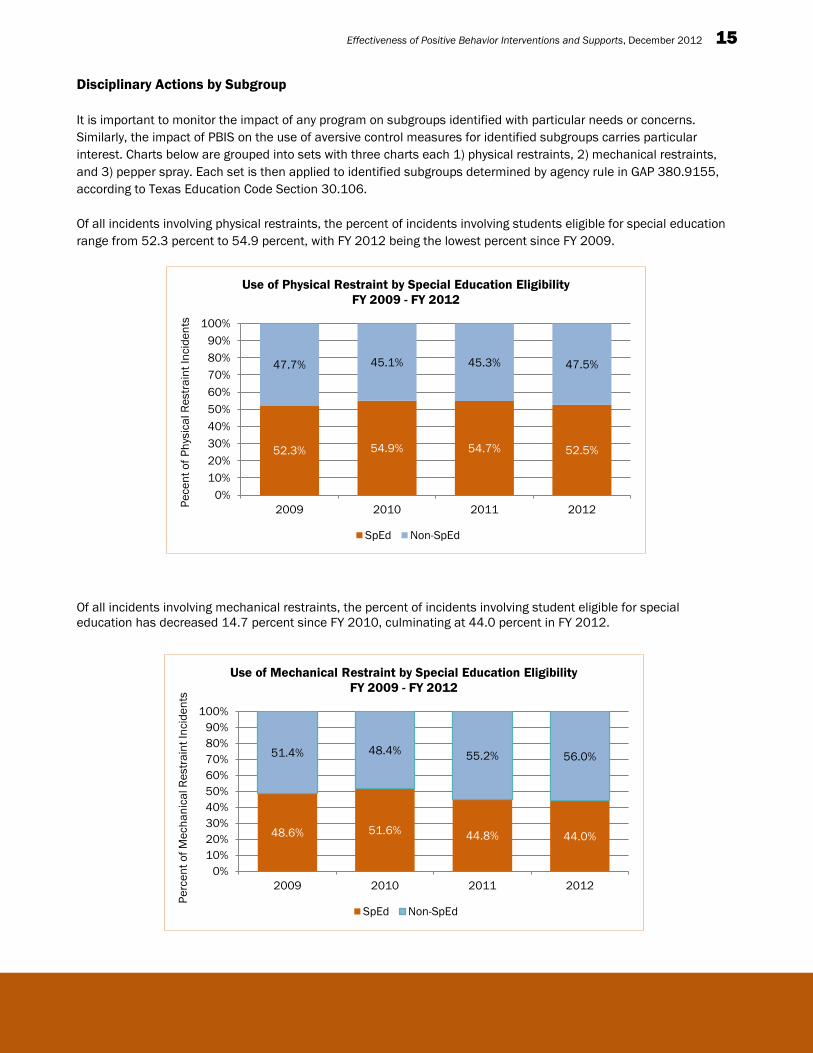
Disciplinary Actions by Subgroup It is important to monitor the impact of any program on subgroups identified with particular needs or concerns. Similarly, the impact of PBIS on the use of aversive control measures for identified subgroups carries particular interest. Charts below are grouped into sets with three charts each 1) physical restraints, 2) mechanical restraints, and 3) pepper spray. Each set is then applied to identified subgroups determined by agency rule in GAP 380.9155, according to Texas Education Code Section 30.106. Of all incidents involving physical restraints, the percent of incidents involving students eligible for special education range from 52.3 percent to 54.9 percent, with FY 2012 being the lowest percent since FY 2009.
Of all incidents involving mechanical restraints, the percent of incidents involving student eligible for special education has decreased 14.7 percent since FY 2010, culminating at 44.0 percent in FY 2012.
52.3% 54.9% 54.7% 52.5%
47.7% 45.1% 45.3% 47.5%
0%10%20%30%40%50%60%70%80%90%
100%
2009 2010 2011 2012Pece
nt o
f Phy
sica
l Res
train
t Inc
iden
ts
Use of Physical Restraint by Special Education Eligibility FY 2009 - FY 2012
SpEd Non-SpEd
48.6% 51.6% 44.8% 44.0%
51.4% 48.4% 55.2% 56.0%
0%10%20%30%40%50%60%70%80%90%
100%
2009 2010 2011 2012
Perc
ent o
f Mec
hani
cal R
estra
int I
ncid
ents
Use of Mechanical Restraint by Special Education Eligibility FY 2009 - FY 2012
SpEd Non-SpEd
16 TEXAS JUVENILE JUSTICE DEPARTMENT
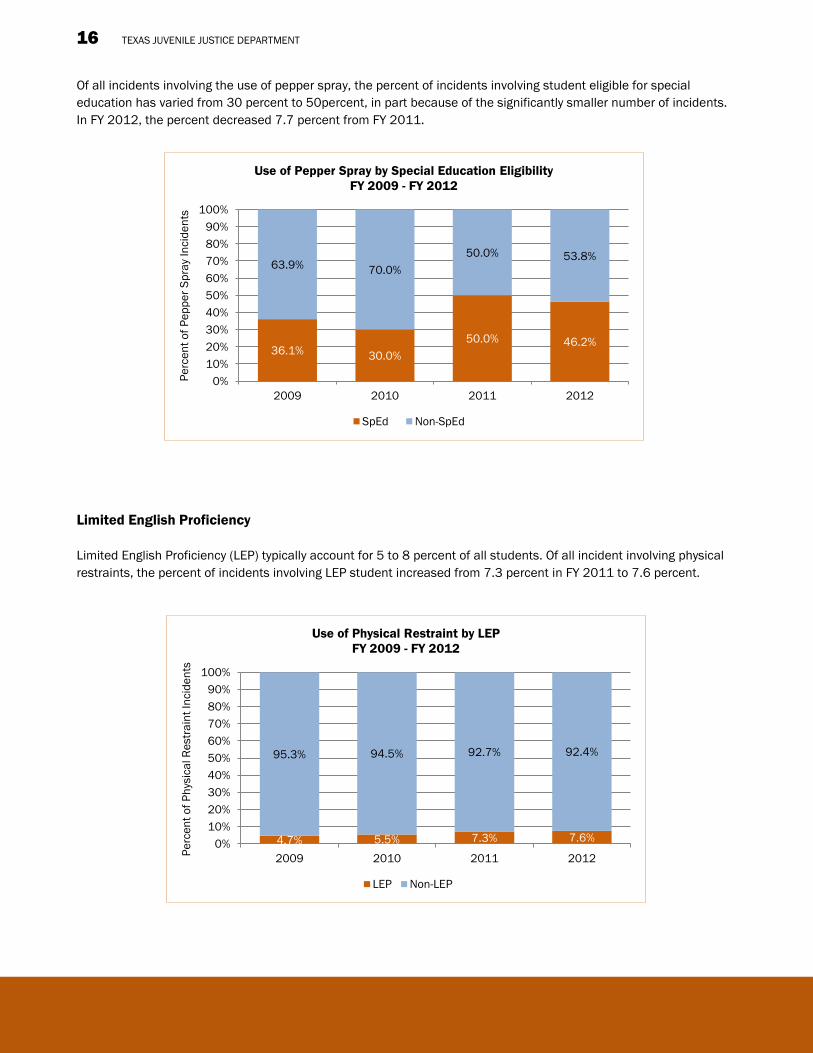
Of all incidents involving the use of pepper spray, the percent of incidents involving student eligible for special education has varied from 30 percent to 50percent, in part because of the significantly smaller number of incidents. In FY 2012, the percent decreased 7.7 percent from FY 2011.
Limited English Proficiency Limited English Proficiency (LEP) typically account for 5 to 8 percent of all students. Of all incident involving physical restraints, the percent of incidents involving LEP student increased from 7.3 percent in FY 2011 to 7.6 percent.
36.1% 30.0% 50.0% 46.2%
63.9% 70.0% 50.0% 53.8%
0%10%20%30%40%50%60%70%80%90%
100%
2009 2010 2011 2012
Perc
ent o
f Pep
per S
pray
Inci
dent
s Use of Pepper Spray by Special Education Eligibility
FY 2009 - FY 2012
SpEd Non-SpEd
4.7% 5.5% 7.3% 7.6%
95.3% 94.5% 92.7% 92.4%
0%10%20%30%40%50%60%70%80%90%
100%
2009 2010 2011 2012Perc
ent o
f Phy
sica
l Res
train
t Inc
iden
ts
Use of Physical Restraint by LEP FY 2009 - FY 2012
LEP Non-LEP

Effectiveness of Positive Behavior Interventions and Supports, December 2012 17
Of all incidents involving mechanical restraints, the percent of incidents involving LEP students decreased from 11.2 percent in FY 2011 to 8.2 percent in FY 2012.
Of all incidents involving the use of pepper spray, the percent of incidents involving LEP students increased from 5.6 percent in FY 2011 to 11.5 percent in FY 2012.
8.3% 10.0% 5.6% 11.5%
91.7% 90.0% 94.4% 88.5%
0%10%20%30%40%50%60%70%80%90%
100%
2009 2010 2011 2012
Perc
ent o
f Pep
per S
pray
Inci
dent
s
Use of Pepper Spray by English Language Proficiency FY 2009 - FY 2012
LEP Non-LEP
6.3% 10.1% 11.2% 8.2%
93.7% 89.9% 88.8% 91.8%
0%10%20%30%40%50%60%70%80%90%
100%
2009 2010 2011 2012Perc
ent o
f Mec
hani
cal R
estra
int I
ncid
ents
Use of Mechanical Restraint by LEP FY 2009 - FY 2012
LEP Non-LEP
18 TEXAS JUVENILE JUSTICE DEPARTMENT
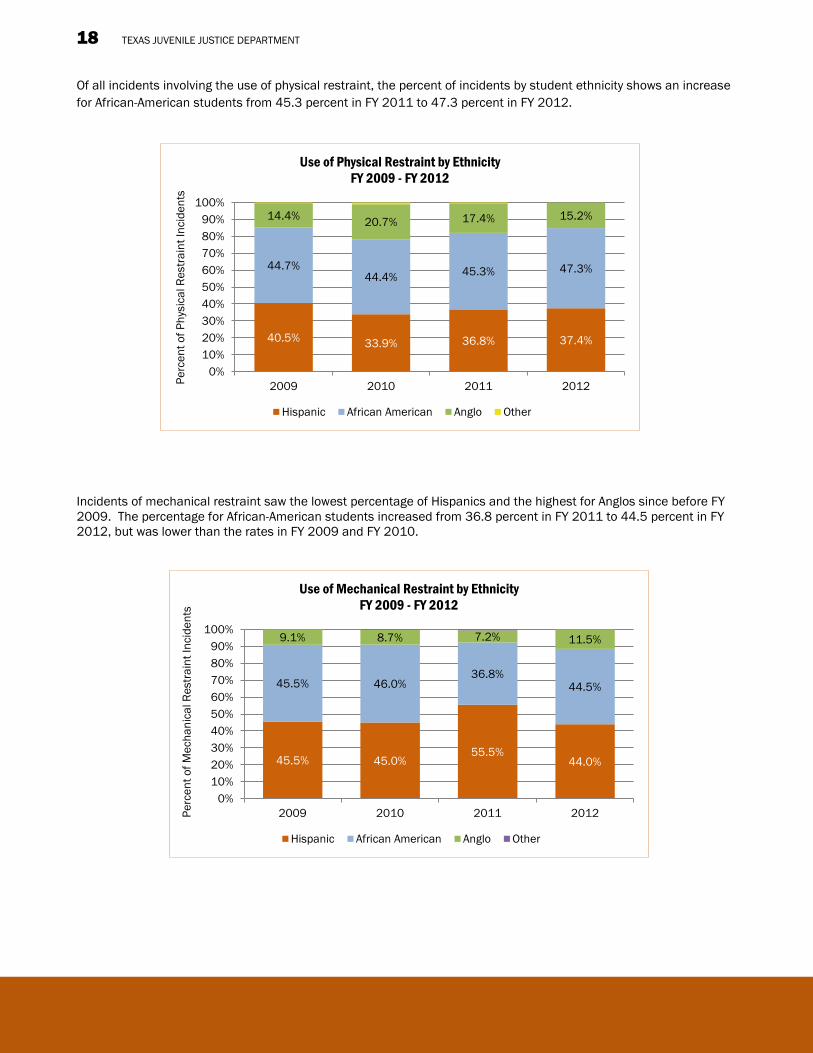
Of all incidents involving the use of physical restraint, the percent of incidents by student ethnicity shows an increase for African-American students from 45.3 percent in FY 2011 to 47.3 percent in FY 2012.
Incidents of mechanical restraint saw the lowest percentage of Hispanics and the highest for Anglos since before FY 2009. The percentage for African-American students increased from 36.8 percent in FY 2011 to 44.5 percent in FY 2012, but was lower than the rates in FY 2009 and FY 2010.
45.5% 45.0% 55.5%
44.0%
45.5% 46.0% 36.8%
44.5%
9.1% 8.7% 7.2% 11.5%
0%10%20%30%40%50%60%70%80%90%
100%
2009 2010 2011 2012Perc
ent o
f Mec
hani
cal R
estra
int I
ncid
ents
Use of Mechanical Restraint by Ethnicity FY 2009 - FY 2012
Hispanic African American Anglo Other
40.5% 33.9% 36.8% 37.4%
44.7% 44.4% 45.3% 47.3%
14.4% 20.7% 17.4% 15.2%
0%10%20%30%40%50%60%70%80%90%
100%
2009 2010 2011 2012Perc
ent o
f Phy
sica
l Res
train
t Inc
iden
ts
Use of Physical Restraint by Ethnicity FY 2009 - FY 2012
Hispanic African American Anglo Other
Effectiveness of Positive Behavior Interventions and Supports, December 2012 19
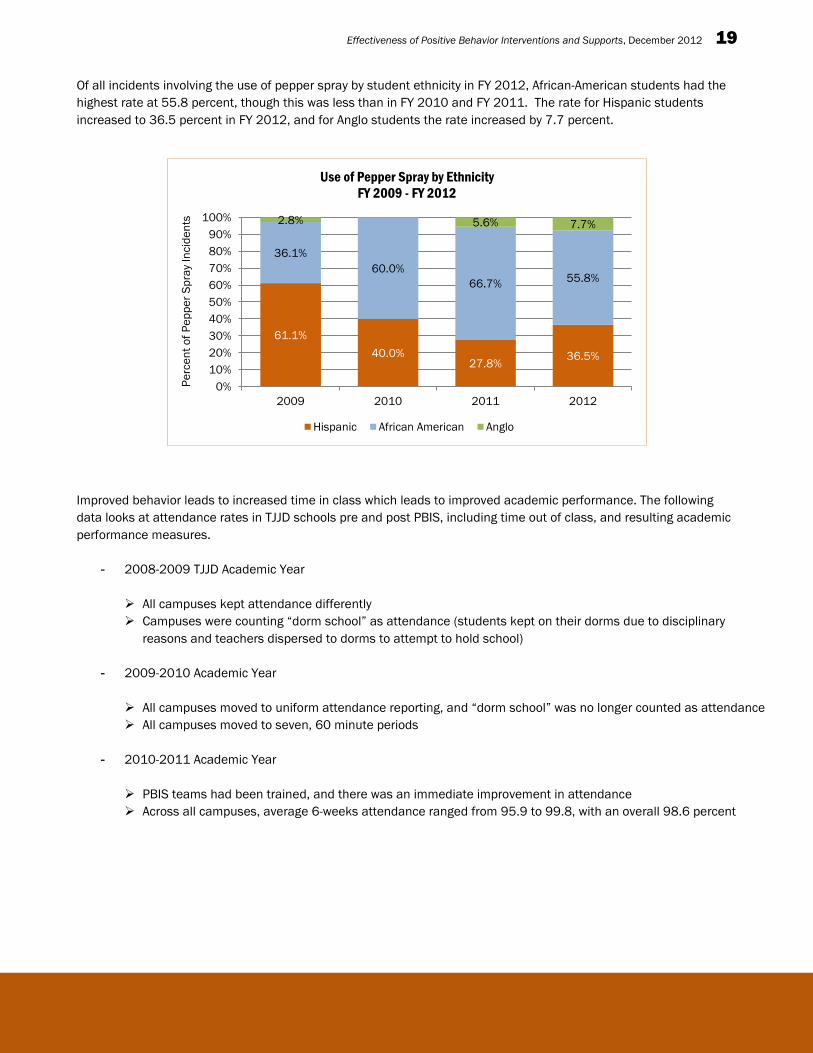
Of all incidents involving the use of pepper spray by student ethnicity in FY 2012, African-American students had the highest rate at 55.8 percent, though this was less than in FY 2010 and FY 2011. The rate for Hispanic students increased to 36.5 percent in FY 2012, and for Anglo students the rate increased by 7.7 percent.
Improved behavior leads to increased time in class which leads to improved academic performance. The following data looks at attendance rates in TJJD schools pre and post PBIS, including time out of class, and resulting academic performance measures.
- 2008-2009 TJJD Academic Year
All campuses kept attendance differently Campuses were counting “dorm school” as attendance (students kept on their dorms due to disciplinary
reasons and teachers dispersed to dorms to attempt to hold school)
- 2009-2010 Academic Year
All campuses moved to uniform attendance reporting, and “dorm school” was no longer counted as attendance All campuses moved to seven, 60 minute periods
- 2010-2011 Academic Year
PBIS teams had been trained, and there was an immediate improvement in attendance Across all campuses, average 6-weeks attendance ranged from 95.9 to 99.8, with an overall 98.6 percent
61.1% 40.0%
27.8% 36.5%
36.1% 60.0%
66.7% 55.8%
2.8% 5.6% 7.7%
0%10%20%30%40%50%60%70%80%90%
100%
2009 2010 2011 2012
Perc
ent o
f Pep
per S
pray
Inci
dent
s Use of Pepper Spray by Ethnicity
FY 2009 - FY 2012
Hispanic African American Anglo
20 TEXAS JUVENILE JUSTICE DEPARTMENT
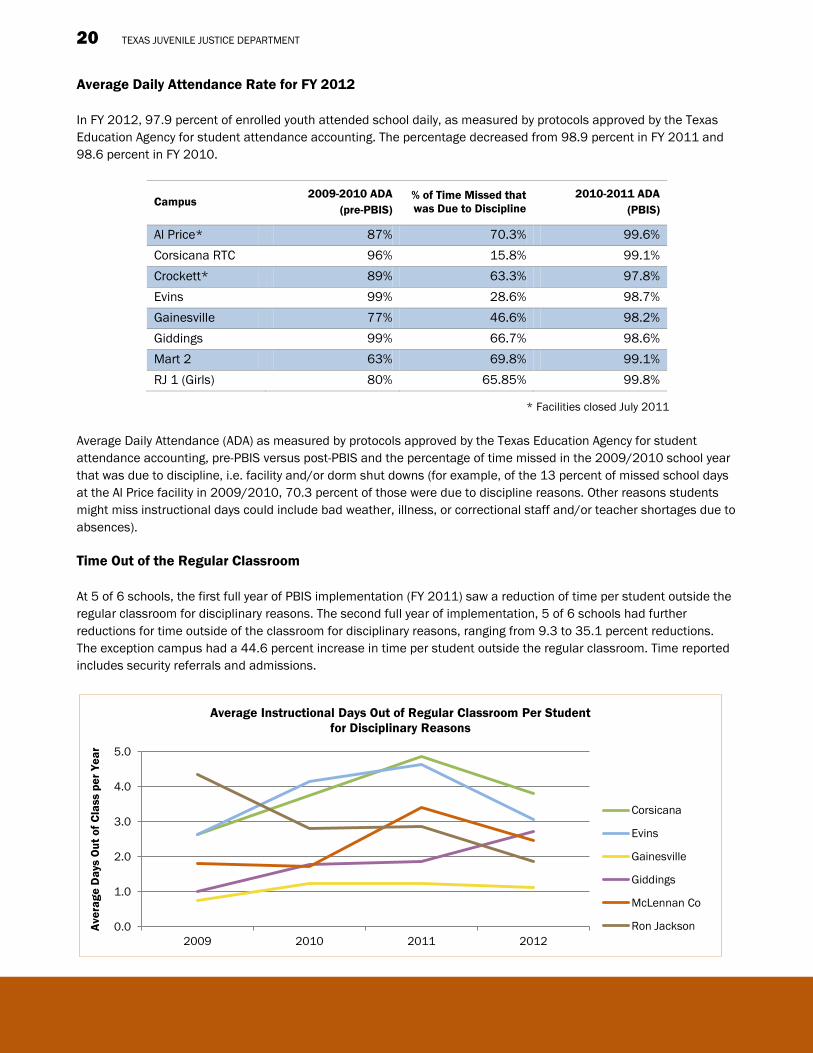
Average Daily Attendance Rate for FY 2012 In FY 2012, 97.9 percent of enrolled youth attended school daily, as measured by protocols approved by the Texas Education Agency for student attendance accounting. The percentage decreased from 98.9 percent in FY 2011 and 98.6 percent in FY 2010.
Campus 2009-2010 ADA
(pre-PBIS) % of Time Missed that was Due to Discipline
2010-2011 ADA (PBIS)
Al Price* 87% 70.3% 99.6% Corsicana RTC 96% 15.8% 99.1% Crockett* 89% 63.3% 97.8% Evins 99% 28.6% 98.7% Gainesville 77% 46.6% 98.2% Giddings 99% 66.7% 98.6% Mart 2 63% 69.8% 99.1% RJ 1 (Girls) 80% 65.85% 99.8%
* Facilities closed July 2011 Average Daily Attendance (ADA) as measured by protocols approved by the Texas Education Agency for student attendance accounting, pre-PBIS versus post-PBIS and the percentage of time missed in the 2009/2010 school year that was due to discipline, i.e. facility and/or dorm shut downs (for example, of the 13 percent of missed school days at the Al Price facility in 2009/2010, 70.3 percent of those were due to discipline reasons. Other reasons students might miss instructional days could include bad weather, illness, or correctional staff and/or teacher shortages due to absences). Time Out of the Regular Classroom At 5 of 6 schools, the first full year of PBIS implementation (FY 2011) saw a reduction of time per student outside the regular classroom for disciplinary reasons. The second full year of implementation, 5 of 6 schools had further reductions for time outside of the classroom for disciplinary reasons, ranging from 9.3 to 35.1 percent reductions. The exception campus had a 44.6 percent increase in time per student outside the regular classroom. Time reported includes security referrals and admissions.
0.0
1.0
2.0
3.0
4.0
5.0
2009 2010 2011 2012
Aver
age
Day
s O
ut o
f Cla
ss p
er Y
ear
Average Instructional Days Out of Regular Classroom Per Student for Disciplinary Reasons
Corsicana
Evins
Gainesville
Giddings
McLennan Co
Ron Jackson
Effectiveness of Positive Behavior Interventions and Supports, December 2012 21
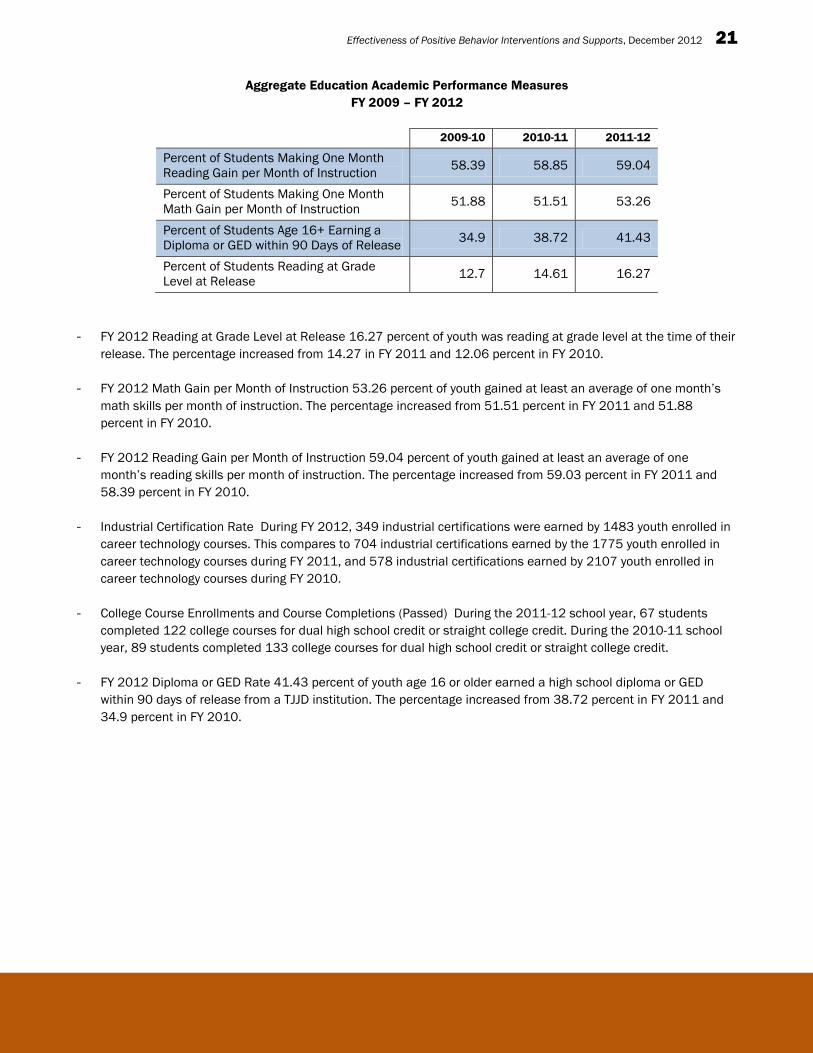
Aggregate Education Academic Performance Measures FY 2009 – FY 2012
2009-10 2010-11 2011-12
Percent of Students Making One Month Reading Gain per Month of Instruction 58.39 58.85 59.04
Percent of Students Making One Month Math Gain per Month of Instruction 51.88 51.51 53.26
Percent of Students Age 16+ Earning a Diploma or GED within 90 Days of Release 34.9 38.72 41.43
Percent of Students Reading at Grade Level at Release 12.7 14.61 16.27
- FY 2012 Reading at Grade Level at Release 16.27 percent of youth was reading at grade level at the time of their
release. The percentage increased from 14.27 in FY 2011 and 12.06 percent in FY 2010. - FY 2012 Math Gain per Month of Instruction 53.26 percent of youth gained at least an average of one month’s
math skills per month of instruction. The percentage increased from 51.51 percent in FY 2011 and 51.88 percent in FY 2010.
- FY 2012 Reading Gain per Month of Instruction 59.04 percent of youth gained at least an average of one
month’s reading skills per month of instruction. The percentage increased from 59.03 percent in FY 2011 and 58.39 percent in FY 2010.
- Industrial Certification Rate During FY 2012, 349 industrial certifications were earned by 1483 youth enrolled in
career technology courses. This compares to 704 industrial certifications earned by the 1775 youth enrolled in career technology courses during FY 2011, and 578 industrial certifications earned by 2107 youth enrolled in career technology courses during FY 2010.
- College Course Enrollments and Course Completions (Passed) During the 2011-12 school year, 67 students
completed 122 college courses for dual high school credit or straight college credit. During the 2010-11 school year, 89 students completed 133 college courses for dual high school credit or straight college credit.
- FY 2012 Diploma or GED Rate 41.43 percent of youth age 16 or older earned a high school diploma or GED
within 90 days of release from a TJJD institution. The percentage increased from 38.72 percent in FY 2011 and 34.9 percent in FY 2010.
22 TEXAS JUVENILE JUSTICE DEPARTMENT
Systemic and anecdotal data suggests that PBIS has been effective in curtailing an upward trend of problematic behaviors in TJJD schools, and in promoting a continuum of pro-social behavior that has improved academic performance of students. TJJD has developed strategies for continuance of PBIS focus in the next biennium. These strategies are aligned with the agency’s mission, as well as the mission of the TJJD division of education to impact students’ lives and ensure their success. TJJD’s PBIS sustainability plan includes orientation and on-going training for students and staff, a robust data management system for continued team-based decision making, quality and timely interventions, and continued partnerships with institutions of higher education for guidance and implementation fidelity. These efforts will ensure that school will be a positive and safe climate for students and educators at every TJJD campus.
Conclusion
Effectiveness of Positive Behavior Interventions and Supports, December 2012 23
Brophy, J. E. "Research linking teacher behavior to student achievement: Potential implications for instruction of
Chapter 1 students." Educational Psychologist (1988): 23, 235-286.
Chard, D., Harn, B., Sugai, G., & Horner, R. "Core Features of Multi-Tier Systems of Academic and Behavioral Support.In Greenwood, C.G. (Ed.)." Elementary School-Wide Prevention Models: Real Models and Real Lessons Learned. New York: Guilford, 2008.
Eber, L., Sugai, G., Smith, Cl, & Scott, T. "Blending process and practice to maximize outcomes: Wraparound and positive b ehavioral interventions and supports in the schools." Journal of Emotional and Behavioral Disorders (2002): 10, 171-181.
Fisher, C.W., Berliner, D.C., Filby, N.N., Marliave, R., Cahen, L.S., & Dishaw, M.M. "Teaching behaviors, academic learning time, and student achievement: An overview." Journal of Classroom Interaction (1980): 17(1), 2-15.
Lewis-Palmer, T., Sugai, G., & Larson, S. "Using data to guide decisions about program implementation and effectiveness." Effective School Practices (1999): 17 (4), 47-53.
McIntosh, K., Filter, L.J., Bennett, J., Ryan. C. & Sugai, G. "Principales of sustainable prevention: Designing scale-up of school-wide positive behavior support to promote durable systems." Psychology in the Schools (2010): 47, 5-21.
McIntosh, L., Flannery, L.B., Sugai, G., Braun, D., & Cochrane, L.L. "Relationships between academics and problem behavior in the transition from middle school to high school." Journal of Emotional and Behavioral Disorders (2008): 10, 243-255.
Muscott, H., Mann E. & LeBrun, M. "Positive behavioral interventions and supports in new hampshire: Effects of large-scale implementation of schoolwide positive behavior support on student discipline and academic achievement." Journal of Positive Behavior Interventions (2008): 10, No. 3.
OSEP . Response to Intervention (RTI) and PBIS. June 2007. 1 November 2012. <http://pbis.org/school/rti.aspx>.
OSEP. School-Wide PBIS. 2012. 1 November 2012. <http://pbis.org/school/default.aspx>.
Sugai, G., & Horner, R.H. "Responsiveness to intervention and school wide positive behavior supports: Integration of multi-tiered approaches." Exceptionality (2009): 17, 223-237.
Sugai, G., & Horner, R.H., Fixsen, D., & Blase, K. "Developing systems-level capacity for RtI implementation: Current efforts and future directions. In T.A. Glover & S. Vaughn (Eds)." Response to Intervention: Empowering all students to learn-A critical account of the science and practice. New York: Guilford, 2010. 286-309.
Sugai, G., Horner, R. H., & Gresham, F. "Behaviorally effective school environments." Interventions for academic and behavior problems: Preventive and remedial approaches (2002): pp. 315-350.
Sugai, G., Horner, R.H., Dunlap, G., Hieneman, M., Lewis, T.J., Nelson, C.M., Scott, T., Liaupsin, C., Sailor, W., Turnbull, A.P., Turnbull, H.R., III, Wickham, D., Reuf, M., & Wilcox, B. "Applying positive behavioral support and functional behavioral assessment in schools." Journal of Positive Behavioral Interventions (2000): 2, 131-143.
Sugai, G., Simonsen, B. Positive Behavior Interventions and Supportws: History, Defining Features, and Misconceptions. 19 June 2012. 1 November 2012. <http://pbis.org/school/pbis.revisited.aspx->.
Texas Juvenile Justice Department of Education. Implementation Status Report of Positive Behavioral Interventions and Supports (PBIS) System in Texas Youth Commission. Austin, 2010.
Wang, Eugene. "Evaluation of PBIS in Secure Texas Juvenile Justice Division (TJJD) Facilities." FY 2012 Summative Report. 2012.
Bibliography