ee101 labs and ecebot assembly/testing instructions
TRANSCRIPT

EE101 Labs and ECEbot Assembly/Testing Instructions
by
Montana State University Department of Electrical and Computer Engineering
A Montana Space Grant Consortium Project
December 17, 2007

Beginning in 2004, the Montana State University Department of Electrical and Computer Engineering worked on a major revision of our introductory course for freshmen, EE 101: Introduction to Electrical Fundamentals Lab. The revision included adding a 50 minute lecture session each week in addition to the existing 2 hour lab period, increasing the number of credits to 2, and developing an entirely new set of laboratory experiments based on a custom mobile robot. The work on this revision was made possible by an Educational Enhancement grant from the Montana Space Grant Consortium. The MSGC support enabled the final mechanical and electrical design of the robot, the embedded software development, and the authorship of the laboratory experiments and assembly guides. Since the original version in 2004, nearly 400 students have constructed an "ECEbot" robot while enrolled in EE 101. The ECEbot kit has been upgraded and refined each year, primarily due to changes in parts availability and cost. The current ECEbot Epsilon version (Fall 2007) is described in this manual. This document contains the ten lab experiments used in EE 101. The first five lab exercises are intended for students who are studying electrical principles and lab instrumentation for the first time. The assembly guides for the robot kit begin after Lab 5.
Robert C. Maher, Department Head Electrical and Computer Engineering 610 Cobleigh Hall P.O. Box 173780 Montana State University Bozeman, MT 59717-3780 [email protected] Copyright © 2007 Department of Electrical & Computer Engineering, Montana State University. All Rights Reserved.


Rev. 8/29/2007
EE 101 Fall 2007 Date: Lab Section #:
Lab #1 Name:
Batteries, Power Supplies, and Resistors Partner:
Abstract
This experiment introduces a few basic electrical circuit components and measurements that will be usedthroughout this course: batteries, bench power supplies, resistors, and digital multimeters (DMMs).Although this experiment is not too complicated, keep in mind that the entire field of electricalengineering is built on a few key concepts, including the details you will start to learn this week.
After completing this experiment you should:
(1) Be able to determine the resistance and tolerance of resistors using the standard color chart,(2) Be able to assemble series and parallel resistor circuits on your protoboard and measure the total
resistance of these circuits using a DMM,(3) Be able to calculate the percent difference between a resistor’s nominal value and its measured
value,(4) Be able to use the DMM to make a DC voltage measurement,(5) Be able to use the bench power supply to generate a desired DC voltage and verify its value using
a DMM.
Introduction and Theory
In order to do anything useful with electricity, we need to create an electrical circuit. A circuit is aconducting path made up of one or more electrical power sources, some electrical components, andinterconnecting wires. Electrical charge can move from place to place in the circuit, and this movementof charge is known as an electrical current. A circuit has to be in the form of a loop since the electricalcurrent exiting the power source must exactly balance the electrical current returning to the power source.
The dry cell battery is a well-known example of an electrical power source. The battery contains acarefully chosen combination of chemical compounds. The chemical reaction releases energy from thechemical bonds, and also creates an excess of electrical charge that can travel through the circuit as acurrent. A battery produces direct current (DC), since the chemical reaction in the battery causes currentto flow in only one direction through the circuit. The measurement unit for electrical current is called theampere, or simply the amp, and is abbreviated with a capital-A.
The electrical potential, or voltage, of a battery indicates how much energy is available to move theelectrical charge through the circuit. However, the voltage alone does not tell us how much electricalpower the battery has, since no matter what the voltage, there must also be enough electrical chargeavailable to make a sustained current. The measurement unit for electrical voltage is called the volt,abbreviated with a capital-V. Even though the abbreviation DC means direct current, electrical engineersoften use the abbreviation “DC” even when talking about a constant voltage. Thus, we often say that anAA-size battery has 1.5 “volts DC,” even though this might seem confusing usage.
In the laboratory it is often convenient to use an adjustable voltage source that is powered by a wall outlet.The bench DC power supply will serve this purpose. The bench supply converts the AC (alternatingcurrent) provided by the power company into a DC voltage that can be adjusted with knob or dial.
1-2
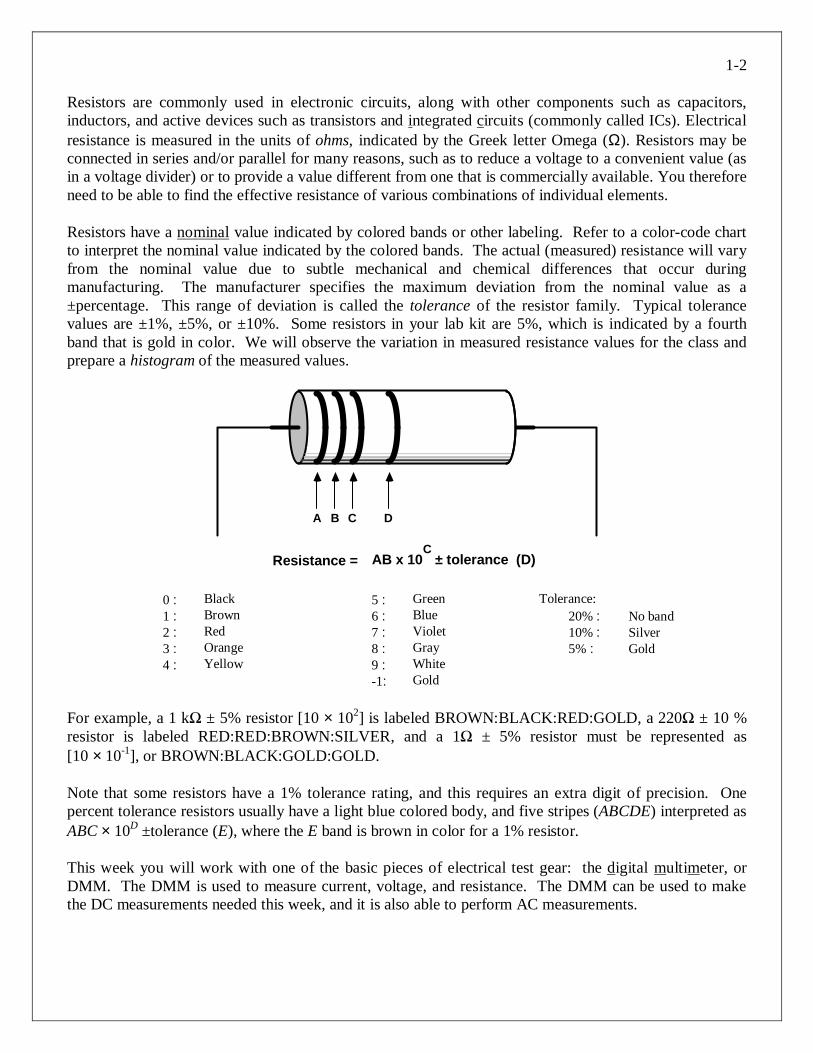
Resistors are commonly used in electronic circuits, along with other components such as capacitors,inductors, and active devices such as transistors and integrated circuits (commonly called ICs). Electricalresistance is measured in the units of ohms, indicated by the Greek letter Omega (Ω). Resistors may beconnected in series and/or parallel for many reasons, such as to reduce a voltage to a convenient value (asin a voltage divider) or to provide a value different from one that is commercially available. You thereforeneed to be able to find the effective resistance of various combinations of individual elements.
Resistors have a nominal value indicated by colored bands or other labeling. Refer to a color-code chartto interpret the nominal value indicated by the colored bands. The actual (measured) resistance will varyfrom the nominal value due to subtle mechanical and chemical differences that occur duringmanufacturing. The manufacturer specifies the maximum deviation from the nominal value as a±percentage. This range of deviation is called the tolerance of the resistor family. Typical tolerancevalues are ±1%, ±5%, or ±10%. Some resistors in your lab kit are 5%, which is indicated by a fourthband that is gold in color. We will observe the variation in measured resistance values for the class andprepare a histogram of the measured values.
A B C D
AB x 10C
± tolerance (D)Resistance =
0 : Black 5 : Green Tolerance:1 : Brown 6 : Blue 20% : No band2 : Red 7 : Violet 10% : Silver3 : Orange 8 : Gray 5% : Gold4 : Yellow 9 : White
-1: Gold
For example, a 1 k ± 5% resistor [10 × 102] is labeled BROWN:BLACK:RED:GOLD, a 220 ± 10 %resistor is labeled RED:RED:BROWN:SILVER, and a 1 ± 5% resistor must be represented as[10 × 10-1], or BROWN:BLACK:GOLD:GOLD.
Note that some resistors have a 1% tolerance rating, and this requires an extra digit of precision. Onepercent tolerance resistors usually have a light blue colored body, and five stripes (ABCDE) interpreted asABC × 10D ±tolerance (E), where the E band is brown in color for a 1% resistor.
This week you will work with one of the basic pieces of electrical test gear: the digital multimeter, orDMM. The DMM is used to measure current, voltage, and resistance. The DMM can be used to makethe DC measurements needed this week, and it is also able to perform AC measurements.

1-3
Equipment
Your circuit prototype board. Resistors, resistor color code chart, alligator clips, bench power supply,multimeter, AA-size battery, and banana cables will be furnished in the lab.
Procedures
P1. Using the resistor color code chart, you and your partner should each select the following resistorsfrom your lab kit: two 10 k (10,000 Ω), one 1 k (1,000 Ω), and one 470 .
Fill out the table below for the resistors given to you by your instructor. You will record:
§ the sequence of color bands and the nominal resistance value this represents§ the measured value of each resistor,§ the percent difference between the nominal value and the measured value
The percentage difference between the nominal value (indicated by the color code) and the measuredvalue is calculated using the equation:
Percent difference ≡ measured value – nominal value × 100%nominal value
NOTE: A negative percentage when calculated using the above formula simply indicates that themeasured value is less than the nominal value.
No. Color bands on the resistor(Use three letter abbreviations for colornames, e.g. Blk for black, Blu for blue)
Nominal Resistance(Value calculated fromcolor codes; in ohms)
Measured resistanceusing multimeter
(Be sure that the decimalpoint and units are correct)
Percent difference,measured value
relative to color codevalue, in percentage
1.2.3.4.
P2. Select a 1 kΩ resistor and a 470 Ω resistor. Using your prototype board, connect these tworesistors in parallel and then measure the combination resistance using the multimeter.
R1 nominal value: R2 nominal value:
R1 measured value: R2 measured value:
Resistance of parallel combination calculated using nominal values:
Measured resistance of parallel combination:
Give the mathematical formula you used to calculate the parallel combination resistance.

1-4
Given two resistors connected in parallel, what can we say about the value of the equivalent resistance ofthe combination in relation to the values of the individual resistors?
P3. Next, connect the same two resistors in series and then measure the combination resistance usingthe multimeter.
Resistance of series combination calculated using nominal values:
Measured resistance of series combination:
Give the mathematical formula you used to calculate the series combination resistance.
Given two resistors connected in series, what can we say about the value of the equivalent resistance ofthe combination in relation to the values of the individual resistors?
P4. Use the DMM to measure the DC voltage of an AA-size battery. Is it exactly equal to 1.5 voltsDC? Why might it be different?
P5. Set the DC Bench supply to produce 8 volts between the red and black terminals of the “A”supply. Use the DMM to monitor the voltage while you adjust the supply knob. Demonstrate for yourinstructor or lab TA that you can adjust the supply to any specified voltage between 2 volts and 15 volts.
Instructor/TA initials

Rev. 20070725JPB
EE 101 Fall 2007 Date: Lab Section #:
Lab #2 Name:
Ohm’s and Kirchhoff’s Circuit Laws Partner:
Abstract
Electrical circuits can be described with mathematical expressions. In fact, it is possible to calculate thecurrents and voltages in a circuit by solving a set of equations, and this is one reason why advancedmathematics is so important in the field of electrical engineering. The circuit equations can be determinedusing Ohm’s Law, which gives the relationship between voltage and current in a resistor (V=IR), andKirchhoff’s Current and Voltage Laws, which govern the currents entering and exiting a circuit node andthe sum of voltages around a circuit loop, respectively.
After completing this experiment you should:
(1) Be able to draw the equivalent circuit of simple series and parallel resistor circuits and to calculatethe current in such circuits,
(2) Be able to construct simple series and parallel resistor circuits on your prototype board and toapply power to your circuit using the bench power supply,
(3) Be able to use the DMM to measure voltage and current at various parts of a given circuit.
Introduction and Theory
An electrical circuit can contain voltage sources (bench power supply or battery) and one or moreadditional components, such as the resistors that were used in Lab #1. A point in the circuit where two ormore components connect together is called a circuit node. A path from one node to another is known asa circuit branch. A closed path through the circuit that starts at a particular node and passes through asequence of components before arriving back at the starting node without the path crossing itself is calleda circuit loop. All circuits have at least two nodes and at least one loop. It is possible to have severalloops in a circuit, and the various loops may partially overlap each other.
One of the fundamental rules for electrical engineers is Ohm’s Law, named for Georg Simon Ohm (1789-1854). Ohm discovered a linear relationship between voltage and current in many circuit elements:
V = I R
where V is voltage (volts), I is current (amps), and R is the resistance of the circuit element that we nowmeasure in the unit of ohms. Another way of interpreting Ohm’s Law is that the resistance R is thevoltage across the component divided by the current through it: R = V / I.
Two other very important rules for understanding electrical circuits are Kirchhoff’s Laws, named afterGustav Robert Kirchhoff (1824-1887), who did experiments with electricity in the mid-1800s.
Kirchhoff’s voltage law: the sum of the voltages around a circuit loop must equal zero, when following a consistentmeasurement direction of voltages for each element around the loop. In other words, the total of the voltage steps asyou go around a circuit loop must end up back where you started.
Kirchhoff’s current law: the sum of all currents into a circuit node must equal zero. In other words, the total currentflowing into a node must equal the current flowing out of that node.

2-2
Voltage and current measurements use two wires from the multimeter. Voltage can be measured byconnecting one of the multimeter wires to one circuit node and the other multimeter wire to a differentnode: the meter will indicate the relative potential difference— the voltage— between the two nodes.Current is a little more difficult to measure because the meter must actually be connected in series withone of the circuit branches. This means that you have to disconnect part of the circuit, insert the meter,and then take the measurement: the meter will indicate the amount of current passing through it.
Both current and voltage measurements will have a polarity: either positive or negative. A positivevoltage indicates that the positive terminal on the meter is connected to a node in the circuit that is at ahigher potential than the negative (or common) terminal. Conversely, if the meter displays a negativenumber, it indicates that the positive meter terminal is connected to a node that is at a lower electricalpotential than the meter’s common terminal. Similarly, a positive current means that the branch currentis flowing into the positive terminal on the meter and out of the negative terminal, while if the meterdisplays a negative number it means that current is entering the negative meter terminal and exiting viathe positive terminal.
Since there are two wires from the multimeter, there are two choices of how the wires are connected in acircuit (black wire here, or red wire here?). Exchanging the meter wires changes the relative polarity ofthe measurement, so the meter display will switch from positive to negative, or vice versa. Beingattentive to the connections and the meter terminal labels allows you to figure out the correct polarity for agiven measurement. It helps to be consistent: you are encouraged always to connect the red wire to themeter’s positive terminal and the black wire to the negative (or reference) terminal. The color of the wireobviously doesn’t change the electrical properties, but it does provide a good visual cue to make it easierto recognize what is going on.
Engineers and technicians frequently use circuit diagrams to show how components and voltage sourcesare interconnected. Understanding circuit diagrams that others have written, and writing your own circuitdiagrams so that others may understand them, is clearly an essential skill for communicating specifictechnical information in electrical and computer engineering. This lab will provide you a chance to beginto develop your skills in this area.
Prelab
PL1. Consider the circuit shown in Figure 1 in which R1 = 470 Ω and R2 = 1 kΩ. To the right of thefigure and inside the box provided, draw the single-resistor equivalent circuit and include the value of theequivalent resistance.
8 V +-
+ VA -+VB-
-VC
+
R1
R2
Figure 1: A series circuit
Single Resistor Equivalent Circuit
2-3
Calculate the expected current in the series circuit of Figure 1. Show your work below and boxyour answer.
Instructor’s initials_______
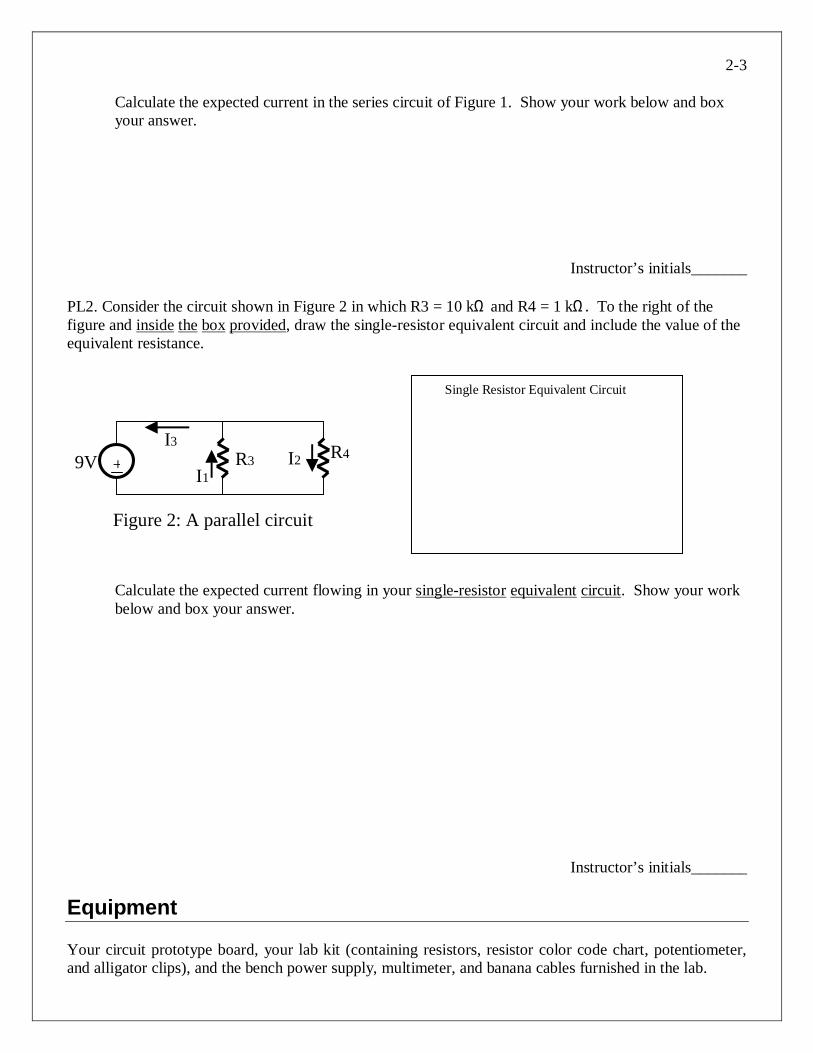
PL2. Consider the circuit shown in Figure 2 in which R3 = 10 kΩ and R4 = 1 kΩ. To the right of thefigure and inside the box provided, draw the single-resistor equivalent circuit and include the value of theequivalent resistance.
R3 R4+ I2
I19V
I3
Figure 2: A parallel circuit
Single Resistor Equivalent Circuit
Calculate the expected current flowing in your single-resistor equivalent circuit. Show your workbelow and box your answer.
Instructor’s initials_______
Equipment
Your circuit prototype board, your lab kit (containing resistors, resistor color code chart, potentiometer,and alligator clips), and the bench power supply, multimeter, and banana cables furnished in the lab.
2-4
Procedures
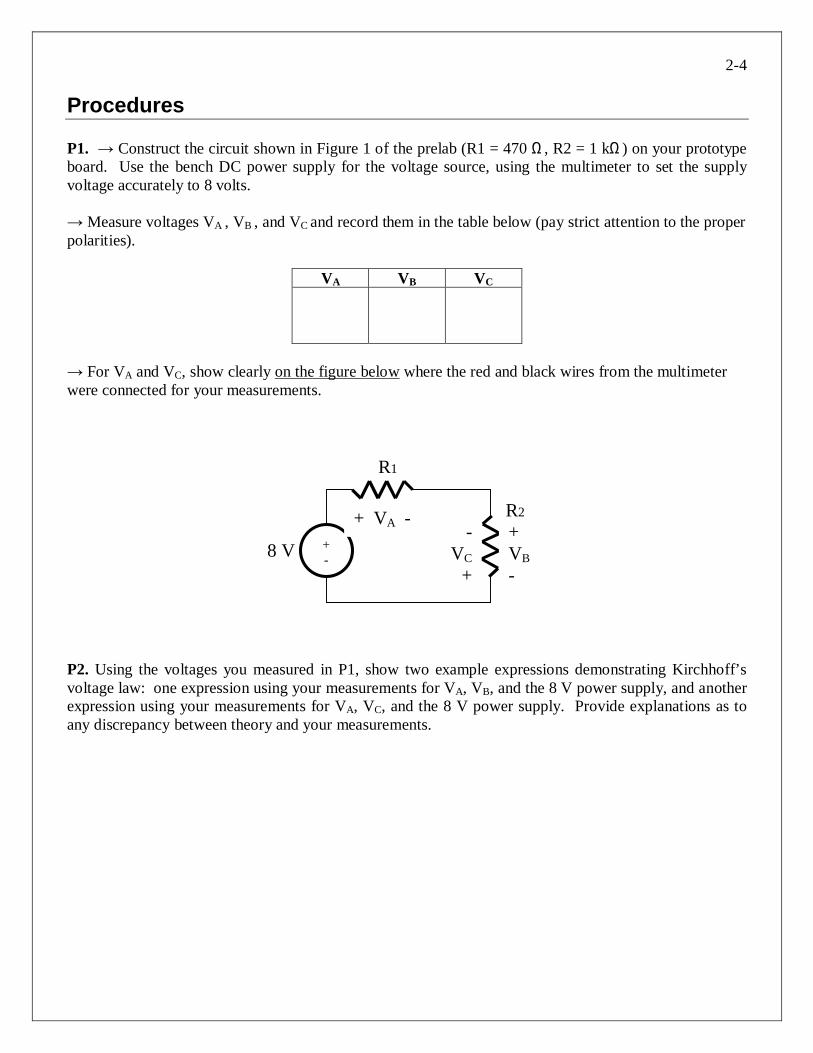
P1. Construct the circuit shown in Figure 1 of the prelab (R1 = 470 Ω, R2 = 1 kΩ) on your prototypeboard. Use the bench DC power supply for the voltage source, using the multimeter to set the supplyvoltage accurately to 8 volts.
Measure voltages VA , VB , and VC and record them in the table below (pay strict attention to the properpolarities).
VA VB VC
For VA and VC, show clearly on the figure below where the red and black wires from the multimeterwere connected for your measurements.
8 V +-
+ VA -+VB-
-VC
+
R1
R2
P2. Using the voltages you measured in P1, show two example expressions demonstrating Kirchhoff’svoltage law: one expression using your measurements for VA, VB, and the 8 V power supply, and anotherexpression using your measurements for VA, VC, and the 8 V power supply. Provide explanations as toany discrepancy between theory and your measurements.
2-5
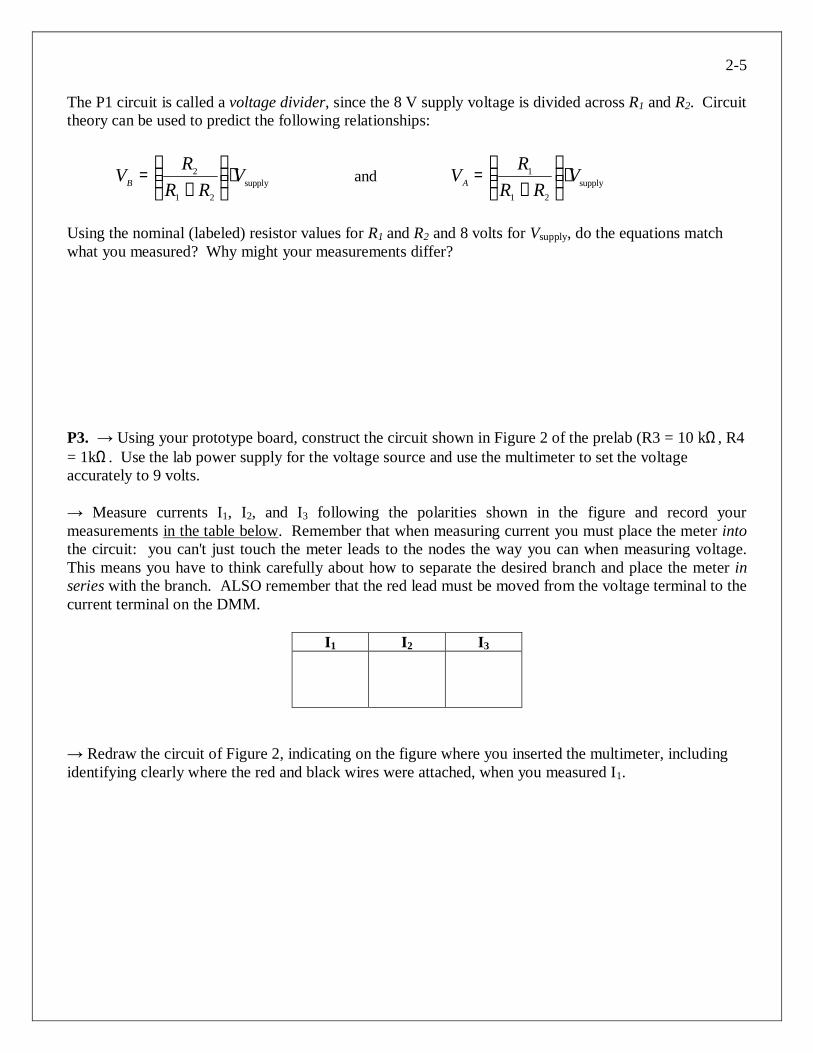
The P1 circuit is called a voltage divider, since the 8 V supply voltage is divided across R1 and R2. Circuittheory can be used to predict the following relationships:
supply21
2 VRR
RVB ⋅
+
= and supply21
1 VRR
RVA ⋅
+
=
Using the nominal (labeled) resistor values for R1 and R2 and 8 volts for Vsupply, do the equations matchwhat you measured? Why might your measurements differ?
P3. Using your prototype board, construct the circuit shown in Figure 2 of the prelab (R3 = 10 kΩ, R4= 1kΩ. Use the lab power supply for the voltage source and use the multimeter to set the voltageaccurately to 9 volts.
Measure currents I1, I2, and I3 following the polarities shown in the figure and record yourmeasurements in the table below. Remember that when measuring current you must place the meter intothe circuit: you can't just touch the meter leads to the nodes the way you can when measuring voltage.This means you have to think carefully about how to separate the desired branch and place the meter inseries with the branch. ALSO remember that the red lead must be moved from the voltage terminal to thecurrent terminal on the DMM.
I1 I2 I3
Redraw the circuit of Figure 2, indicating on the figure where you inserted the multimeter, includingidentifying clearly where the red and black wires were attached, when you measured I1.
2-6
P4. Using the currents you measured in P3, show an expression involving I1, I2, and I3 that demonstratesKirchhoff’s current law for one of the circuit nodes and explain how this law relates to your measuredcurrents.
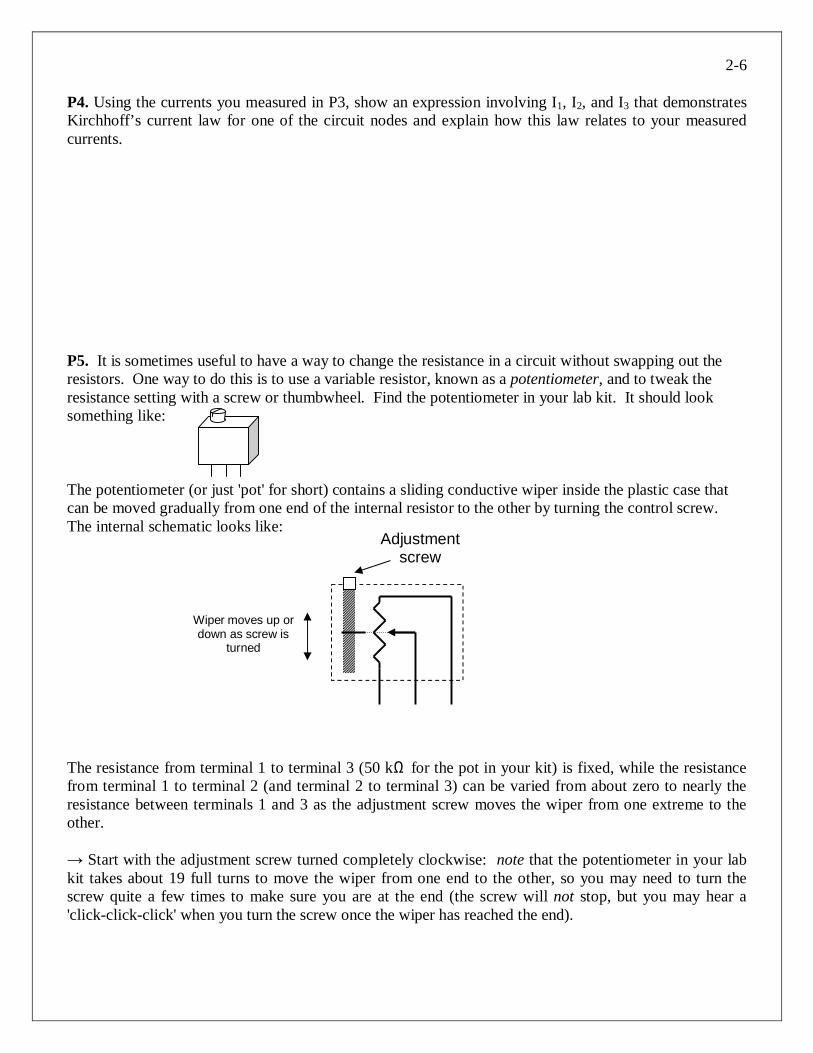
P5. It is sometimes useful to have a way to change the resistance in a circuit without swapping out theresistors. One way to do this is to use a variable resistor, known as a potentiometer, and to tweak theresistance setting with a screw or thumbwheel. Find the potentiometer in your lab kit. It should looksomething like:
The potentiometer (or just 'pot' for short) contains a sliding conductive wiper inside the plastic case thatcan be moved gradually from one end of the internal resistor to the other by turning the control screw.The internal schematic looks like:
The resistance from terminal 1 to terminal 3 (50 kΩ for the pot in your kit) is fixed, while the resistancefrom terminal 1 to terminal 2 (and terminal 2 to terminal 3) can be varied from about zero to nearly theresistance between terminals 1 and 3 as the adjustment screw moves the wiper from one extreme to theother.
Start with the adjustment screw turned completely clockwise: note that the potentiometer in your labkit takes about 19 full turns to move the wiper from one end to the other, so you may need to turn thescrew quite a few times to make sure you are at the end (the screw will not stop, but you may hear a'click-click-click' when you turn the screw once the wiper has reached the end).
Adjustmentscrew
ÇÅ É
Wiper moves up ordown as screw is
turned

2-7
Now use the DMM to measure the resistance between terminal 1 and terminal 2 for the several screwpositions listed in the table below. One full turn means 360 degrees of rotation.
Screw position Measured Resistance betweenÅ andÇ (in ohms)Fully clockwiseAfter rotating 5 full turns counterclockwiseRotating another 5 full turns counterclockwiseRotating another 5 full turns counterclockwiseRotated fully counterclockwise
Using this information, do you think it would be possible to predict the measured change in resistance foran arbitrary number of screw rotations? What do you estimate to be the "ohms per turn" for thispotentiometer? Test a few predictions yourself, and explain your reasoning using complete sentences.
Rev. 20070725JPB
EE 101 Fall 2007 Date: Lab Section #
Lab #3 Name:
AC Signals and the Oscilloscope Partner:
Abstract
AC (alternating current) signals have a time-varying magnitude. Common AC signals in electricalengineering are periodic oscillations used for communications and electrical power transmission.Because AC signals vary with time, engineers have developed a test instrument called the oscilloscopethat can display AC signal measurements as a voltage vs. time graph.
After completing this experiment you should:
(1) Be able to determine the value of a capacitor using the standard three-digit code,(2) Be able to use an oscilloscope to make a DC voltage measurement,(3) Be able to use a function generator to establish an AC signal with a specified amplitude and
frequency,(4) Be able to use an oscilloscope to identify the properties (amplitude, frequency, period and phase
shift) of AC waveforms,(5) Be able to calculate the phase shift between two AC waveforms given their period (or frequency)
and their time offset.
Introduction and Theory
AC signals are very useful in electrical engineering. Often the AC signal is a sinusoidal variation involtage, so we can describe the signal in terms of its amplitude (peak) value and its frequency (oscillationrate).
Oscilloscope
The oscilloscope is arguably the most fundamental measurement device in electrical engineering. Theusefulness of the oscilloscope–or 'scope' for short–is due primarily to its ability to display electrical signalinformation directly in visual form. A block diagram of a basic oscilloscope is shown in Figure 1 on thefollowing page.
Although it may appear complicated, the basic oscilloscope is quite simple in concept:
§ The vertical position, or vertical deflection, of the electron beam of a cathode ray tube (CRT) is linearly proportionalto the input voltage. The input voltage is measured between a particular circuit node and the circuit ground reference.A calibrated variable amplifier is used to boost low-level signals in order to produce a visible beam deflection. Theinput voltage can thus be determined by measuring the amount of beam deflection for a particular input amplifier gain.Vertical deflection calibration is usually indicated as volts per division, where "division" refers to the grid lines etchedon the face of the CRT.
§ The horizontal deflection is controlled either by another input signal or more commonly by a calibrated sweepgenerator. The sweep generator moves the electron beam at a selectable, constant rate from left to right across theCRT screen. The calibrated sweep rate is usually indicated as time per division, where "division" again refers to theCRT display grid lines.

3-2
The most important use of oscilloscopes is in the observation of periodic signals: repetitive waveforms(oscillations) can be viewed by synchronizing the sweep generator with the repetition rate of the inputsignal. This is accomplished using a trigger generator which starts the horizontal sweep when the inputsignal exceeds an adjustable voltage threshold. The trigger can be selected to occur for either a positiveor negative slope at the threshold voltage. Thus, by adjusting the vertical gain, trigger level, and thesweep speed, time varying input signals can be viewed directly as a voltage-vs.-time display.
Oscilloscopes have many other features for producing displays of particular types of signals. Forexample, most scopes have two or more independent input amplifiers for displaying two or more inputsignals simultaneously. Some special features will depend upon the instrument manufacturer and thesophistication of the scope itself. Some of these "advanced" features will be considered later in thiscourse.
HorizontalAmplifier
VerticalAmplifier
Gain Selector Dial(Sensitivity)
SweepGenerator
Sweep RateSelector Dial
TriggerGenerator
Input
Oscilloscope Display
Trigger LevelSelector Dial
"Ground"Reference
(Trigger Pulses) (Horizontal Sweep Signal)
Figure 1: Block Diagram of a Basic Oscilloscope

3-3
Capacitors
Capacitors are electrical circuit elements that can store temporarily an electrical charge. The amount ofcharge stored depends on the size (capacitance) of the capacitor. The capacitance is measured in farads:coulombs (charge) divided by volts. Typical capacitors found in the lab might be 1.0 microfarads (10-6
farads), or 0.1 microfarads, or 0.001 microfarads. The schematic circuit symbol for a capacitor looks like
or like if the capacitor is polarized, meaning that thecomponent must be placed in the circuit with a specified polarity.
Capacitors are frequently labeled with a three-digit code that is somewhat similar in format to the code forresistors. Referring to the three digit sequence as ABD, the nominal value of the capacitor is given by ABx 10D in picofarads (pF). For example, the label "103" (A=1, B=0, D=3) would mean 10 x 103 pF, or 0.01µF (microfarads).
The three digit nominal value code is usually followed by a letter, which is used to indicate the toleranceof the capacitance value. Common tolerance indication letters are: M=20%, K=10%, J=5%, G=2%,F=1%, and E=0.5%. Recall that the tolerance refers to what range of actual (measured) capacitanceexpected for the particular device, expressed as a ± percentage of the nominal value. For example, if acapacitor is labeled “103K”, that means its capacitance will be somewhere in the range 0.01 µF ± 10%, orbetween 0.009 µF and 0.011 µF.
Some capacitors (e.g., aluminum electrolytic devices) are physically large enough that they have thecapacitance printed directly on the case without using the three-digit code.
Applications of capacitors include using them in circuits, along with resistors, to create electrical filters.Filters will tend to reduce the amplitude of electrical signals in selected frequency ranges. Thus, theoutput signal from a filter circuit that is supplied by a sinusoidal input signal will have amplitude thatdepends on both the amplitude and frequency of the input signal. For example, a frequency-selectivefilter is found in a radio “tone” control: adjusting this control can cause an increase in the level of bass(low frequency) sounds relative to high frequency sounds, or vice versa.
In this experiment you will explore the characteristics of simple lowpass filters made using one resistorand one capacitor. At low frequencies, the capacitor will have sufficient time to become “charged” withone polarity as the current flows through the circuit during one half cycle of the sinusoidal input signal,and then discharged and recharged in the opposite polarity during the next half cycle. The output voltagewill therefore be about as large as the input signal. But at very high frequencies, the period (cycleduration, 1/frequency) of the input signal is so short that the capacitor cannot charge or discharge beforethe next cycle of the waveform. This means that the output voltage amplitude is expected to decrease asthe input frequency increases.
Prelab
PL1. What is the three-digit (nominal value) code to indicate a 0.1 µF capacitor? In the space provided onthe following page show how your code, when used in the formula: AB x 10D in picofarads (pF), resultsin 0.1 µF.
+

3-4
PL2. Imagine that you are investigating the properties of two waveforms using an oscilloscope. You findthat the two waveforms share a common period of 250 µs and are offset in time by 20 µs.
Calculate the frequency of the waveforms. Show your work and box your answer.
Calculate the phase shift (in degrees) between the waveforms. Show your work and box your answer.
Instructor’s initials_______
Equipment
Your circuit prototype board, your lab kit (containing resistors, resistor color code chart, potentiometer,capacitors, and alligator clips), and the bench power supply, function generator, oscilloscope, DMM, andbanana cables furnished in the lab.
Procedures
P1. Turn on the function generator and use the control knobs to produce a 1 kHz (1000 Hz) sinusoidalwaveform with an amplitude of 2Vpp. Using a BNC-to-alligator cable, connect the oscilloscope probe tipto the red lead from the function generator and the probe's ground clip to the black lead. Adjust theoscilloscope amplitude knob and time scale knob until you see about one cycle of the sinusoidalwaveform on the screen.
Measure the period of the waveform (horizontal time required for one cycle) and verify its peak-to-peak amplitude.
Waveform Period: Peak-to-peak Amplitude:

3-5
P2. Adjust the function generator frequency and scope sweep rate so that approximately two cycles ofa triangle waveform fit across the display screen. Then adjust the function generator amplitude—observing with the oscilloscope— so that the triangle waveform is exactly 3V peak to peak with a periodof 2ms. Record the scope settings.
Scope Vertical Gain Setting (volts/division): _ How many divisions?
Using the numbers you just recorded, show that you established a triangle waveform of the desired peakto peak amplitude of 3V.
Scope Horizontal Sweep Setting (time/division): __
How many divisions corresponding to one cycle?
Using the numbers you just recorded, show that you established a triangle waveform with the desiredperiod of 2 ms.
What is the frequency of the triangle waveform? Show your calculation and box your answer.
P3. Construct the simple resistor-capacitor (RC) network shown below using your prototype board,and set the function generator to be a 2 volt peak-to-peak sinewave.
Use the two channels of the oscilloscope to display the input voltage waveform (CH1) and the outputvoltage waveform (CH2) simultaneously. Figure out a way to find the delay (lag) of the output comparedto the input. Take a set of measurements to fill out the table below. Below the table show how youcalculated the phase shift in the 500 Hz case.
2 V p to pC = 0.1 µF
To scope ground
R = 1 kΩVin: To scope CH1
Vout: To scope CH2

3-6
*** COMPLETE ALL MEASUREMENTS IN A GIVEN ROW BEFORE MOVING ON TO THENEXT ROW ***
InputFrequency
Vin Amplitude(set 2V p-to-p)
VOUT Amplitude(peak-to-peak)
Time Delay(output vs. input)
Phase Shift (degrees)(output vs. input)
500 Hz1 kHz2 kHz5 kHz
10 kHz20 kHz50 kHz100 kHz
Example calculation of the phase shift:
This circuit is called a lowpass filter. Based on your measurements, explain in words why you think theterm lowpass makes sense.
Rev. 20070108JPB Copyright © Department of Electrical and Computer Engineering, Montana State University, 2007
EE 101 Fall 2007 Date: Lab Section #
Lab #4 Name:
Diodes and Digital Signals Partner:
Abstract
A signal that has a continuously varying amplitude and/or frequency is called an analog signal, while asignal that has only a set of specifically allowed amplitudes and frequencies is known as a digital signal.The continuous sine wave and triangle wave signals used in the previous lab are examples of analogsignals. A common type of digital signal can represent the two logic states ‘1’ and ‘0’ that are used inbinary arithmetic. There are a variety of ways in which the ‘1’ and ‘0’ states can be represented, such asdifferent voltage levels, polarities, frequencies, and combinations of these.
After completing this experiment you should:
(1) Be able to calculate the duty cycle of a pulse waveform given the waveform’s pulse width andrepetition period,
(2) Be able to approximate the current that flows in a simple diode circuit,(3) Be able to measure the voltage and current in a simple diode circuit,(4) Be able to wire a typical light emitting diode (LED) display on a prototype board so as to
illuminate a desired segment on the display.
Introduction and Theory
Digital logic circuits such as microcomputers typically use different voltages to represent the binary digits‘1’ and ‘0’. For example, in our robot system we will use +5V to represent a logic 1 and 0 V to representa logic 0. If the voltage switches from a logic 1 to a logic 0 on a regular basis, we can observe a pulsewaveform using the oscilloscope.
Pulse waveforms are described in terms of the pulse repetition period, or pulse frequency, and the pulsehigh time, or pulse width. The ratio of the pulse width to the pulse period is called the duty cycle, and istypically expressed as a percentage. For example, a pulse waveform with a 20 millisecond (ms) period
and a 2 ms pulse width has a duty cycle of %10%100202
=×
.
Figure 1: Pulse waveform with 10% duty cycle
A diode is a two-terminal semiconductor circuit element that allows electrical current to pass in only onedirection. In effect it functions as a “flow valve” – current is allowed to pass in one direction through thediode, but is prevented from passing through in the opposite direction. Diodes are marked to indicate inwhich direction electrical current will flow, so diodes have polarity; that is, they need to be placed in a
2 ms
20 ms

4-2
circuit in the correct direction. The two diode wires are referred to as the anode and the cathode, in orderto match the terminology originally used with vacuum tube diodes.
Although a diode allows current to flow through in one direction, it does this at the expense of a smallvoltage drop across the diode. Typically this forward bias voltage drop for a diode is about 0.5 V to 0.6 V,and this voltage is relatively independent of the amount of electrical current flowing through the diode.An example of the current vs. voltage relationship for a diode is shown below.
Typical Diode Current vs. VoltageCharacteristic
-100
1020304050607080
-2 -1 0 1 2Voltage across diode [V]
Cur
rent
thro
ugh
diod
e[m
A]
Figure 2: Diode Characteristics
In this lab exercise you will be using a special type of diode: the light-emitting diode, or LED. LEDs arediode devices that produce light when a current of the proper polarity is provided. There is no glowinghot resistive filament in an LED like there is in an incandescent light bulb. In fact, it is VERYIMPORTANT that the current through the LED be limited by including a series resistor so that the devicedoes not overheat.
anode: long wire
cathode: short wire
Figure 3: Light-Emitting Diode
The schematic symbol for a light-emitting diode is shown in Figure 3. The LED’s symbol is just like thatof the regular diode but with the addition of a wiggly arrow representing the light. The LED itselfoperates similarly to a regular diode, except the forward voltage is more like 1.5-2.0 V instead of 0.5-0.6
anode cathode
current allowed in this direction
stripe or markindicates cathode
Schematic Symbol:
Typical package:
4-3
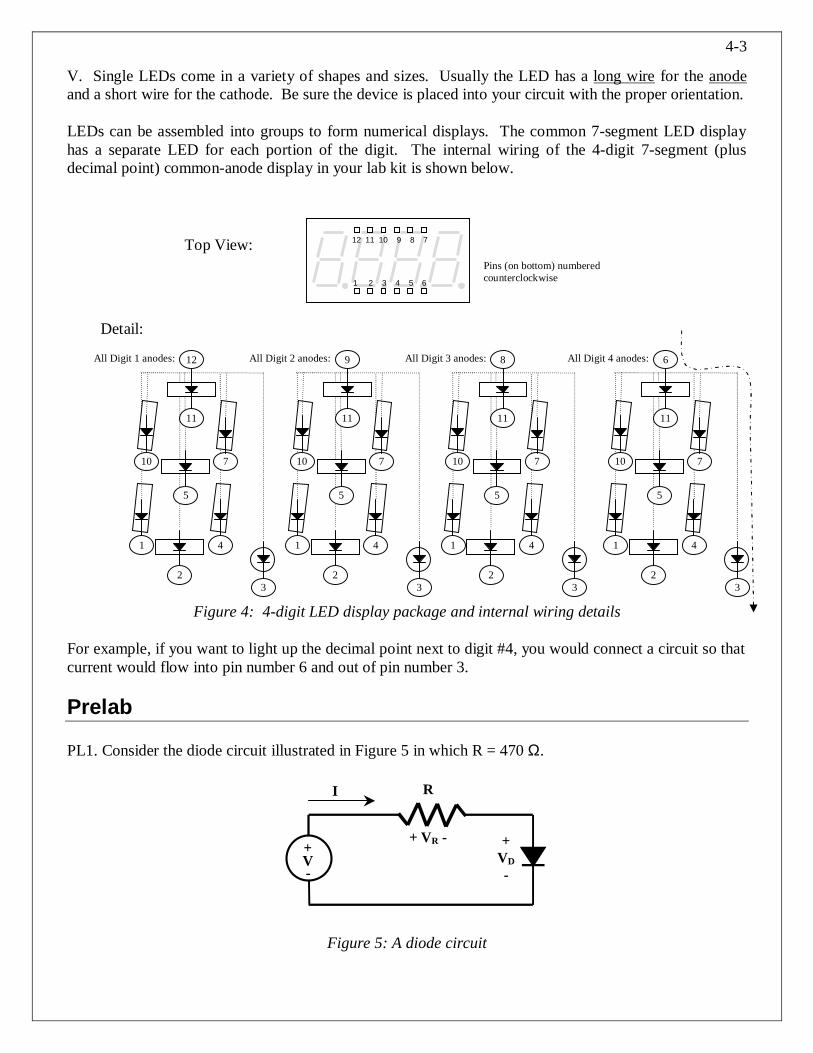
V. Single LEDs come in a variety of shapes and sizes. Usually the LED has a long wire for the anodeand a short wire for the cathode. Be sure the device is placed into your circuit with the proper orientation.
LEDs can be assembled into groups to form numerical displays. The common 7-segment LED displayhas a separate LED for each portion of the digit. The internal wiring of the 4-digit 7-segment (plusdecimal point) common-anode display in your lab kit is shown below.
Figure 4: 4-digit LED display package and internal wiring details
For example, if you want to light up the decimal point next to digit #4, you would connect a circuit so thatcurrent would flow into pin number 6 and out of pin number 3.
Prelab
PL1. Consider the diode circuit illustrated in Figure 5 in which R = 470 Ω.
+
-V
R
+ VR - +VD-
I
Figure 5: A diode circuit
Top View:Pins (on bottom) numberedcounterclockwise
Detail:
32
41
6All Digit 4 anodes:
11
710
5
32
41
8All Digit 3 anodes:
11
710
5
32
41
9All Digit 2 anodes:
11
710
5
32
41
12All Digit 1 anodes:
11
710
5
1 2 3 4 5 6
12 11 10 9 8 7

4-4
Using the “piecewise linear” model of the diode we studied in lecture and found in the course note set,calculate the current and voltage levels requested in Table I. Assume a diode turn-on voltage of 0.7 V.In the space provided below the table, show your calculations for the following cases: V = -2 V, V = 0V,and V = 1V.
TABLE I: Predicted Values for the circuit of Figure 5
V VR VD I-2 V0 V
0.4 V1 V
1.5 V2 V
2.5 V3 V
3.5 V4 V
4.5 V5 V6 V
Instructor’s initials_______

4-5
Equipment
Your circuit prototype board, your lab kit (containing resistors, light-emitting diodes (LEDs), 4-digit 7-segment LED display, and alligator clips), a diode provided by the instructor during lab, and the benchpower supply, function generator, oscilloscope, multimeter, and banana cables furnished in the lab.
Procedures
P1. Using the bench power supply to establish the DC voltage, construct the circuit of Figure 5 (found inthe prelab). As you will be asked to measure voltages and currents in the circuit for several values ofinput voltage, determine how to use the DMM to complete the following table.
TABLE II: Measured Values for the circuit of Figure 5
V VR VD I-2 V
00.4 V1 V
1.5 V2 V
2.5 V3 V
3.5 V4 V
4.5 V5 V6 V
Comment on the agreement between the values calculated in Table I and those you measured in Table II.
In Lab 5 we will use MATLAB to plot your measured data and thus create an I-V curve for the IN4004.We are now finished with the circuit of Figure 5.

4-6
P2. → Turn on the function generator and set the controls to create a pulse waveform with a 1 kHzrepetition frequency, 20 % duty cycle, 5 volt peak-to-peak amplitude and an offset such that the pulsewaveform is zero volts during the low portions and +5 volts at the high portions. To set the Tek AFG310or 320 arbitrary function generator for a pulse waveform, use the ‘FUNC’ button, the up and down arrowbuttons and the ‘ENTER’ button. To change the pulse’s duty cycle press the ‘SHIFT’ button and then the‘FUNC’ button. Use the “OFFSET’ button to alter the DC offset. Choose a sweep rate on the scope sothat about two cycles of the waveform are visible on the screen.
Carefully sketch the waveform below, including the time and voltage details. Also calculate the dutycycle (ratio of “high” duration to one waveform period).
Duty cycle = %
P3. → Now construct the circuit below on your breadboard. The LED should be illuminated slightly.
Decrease the frequency of the function generator until your eyes can just start to see the LED flickeringon and off. What frequency is it? . Then continue decreasing the frequency until theLED flashes about once per second. To what frequency does this correspond? _________
P4. → Now place the 4-digit 7-segment display onto the breadboard so that it straddles one of thegrooves. Arrange the wiring so that the decimal point of the 4th digit is illuminated, as shown below, byusing jumper wires and alligator clips. Remember that you MUST include the series resistor to limit thecurrent through the LED segment!
300 Ω
Function Generator(DC offset for 0-5 Vpulses)
Function Generator(DC offset for 0-5 Vpulses)
300 Ω
+
-
+
- 1 2 3 4 5 6
12 11 10 9 8 7

4-7
Using the circuit diagram and pin labels from Figure 4, move the wires on the breadboard to demonstratethat you can illuminate any of the segments. Demonstrate this for your instructor or lab TA.
Instructor/TA initials
P5. → Finally, use the 4-digit display, the dual in-line package (DIP) switch module, eight 300 Ωresistors, and the fixed +5V output of the DC bench power supply so that each switch controls one of thesegments of digit 1. Demonstrate your circuit for the instructor or lab TA.
Instructor/TA initials
1 2 3 4 5 6
12 11 10 9 8 7
1 2 3 4 5 6 7 8ON
+-5 V
All 300 Ω
Connect all lower switchcontacts together

1
August 29, 2007 JPB
EE 101 Fall 2007 Date: Lab Section #
Lab #5 Name:
Introduction to MATLAB No Lab partners this time!
Abstract
NOTE: You need to have a free MSU computer account AND ECE printing permission BEFORE youarrive for this experiment!
After completing this experiment you should:(1) Be able to enter data into MatlabTM,(2) Be able to create line graphs using Matlab,(3) Be able to create data sets representing sinusoidal signals using Matlab,(4) Be able to graph these data sets and create appropriate titles and axis labels,(5) Be able to copy Matlab graphs into a word processor to produce a technical document(6) Be more comfortable in describing sinusoids mathematically,(7) Have bolstered your understanding of the I-V characteristics of resistors and diodes.
Introduction and Theory
MatlabTM is a software package intended for use by engineers and scientists in solving complex problems.The name “Matlab” is short for “matrix lab,” since Matlab is very efficient at processing arrays andmatrices of numbers. One generally interacts with Matlab by typing special words and symbols in acommand window on the computer screen. Matlab contains commands and features for many specificapplications, such as plotting (plot and bar are two such commands). Also, the user can readily createcustom software routines for specialty needs. These user-created routines can be used in the same manneras the commercial routines provided with the Matlab package.
To find out about how to use Matlab, keep in mind that a help option is always available: to get helpabout any command, type help <command> and hit return. For example, help plot givesinformation about using the command plot. Fortunately, Matlab uses many familiar notations for itscommands, such as plot to generate a graphical plot, sin(x) for the sine function, pi for the numberπ, etc.
Matlab has the ability to handle complex-valued numbers (‘a + jb’) with the same ease as for real-valuednumbers. It also can handle matrix-valued arrays in a similar manner as single values. For example, tomultiply a matrix A times a vector B, simply write A*B. The appropriate combinations of rows andcolumns are handled correctly.
A few other useful Matlab commands are: grid to toggle grid lines on or off for a graph; figure toopen a new plotting window so you can produce a new graph in a separate window without erasing thegraph in the previous window; hold or hold on to hold the current plot so that a second plot can bewritten on top of the original graph; hold off releases this feature.
Another helpful feature is that Matlab keeps track of the history of commands you enter. After enteringseveral Matlab commands, use the up or down arrow keys to see previous commands which can now be
2
August 29, 2007 JPB
edited and re-run by simply pressing the enter key. Remember chapter 6 of your EE 101 Note Setcontains a Matlab tutorial.
PrelabPL1. Calculate the period of a 60 Hz sinusoid. Show your work.
Instructor’s initials_______
PL2. How long does it take a 60 Hz sinusoid to complete five full cycles? Show your work.
Instructor’s initials_______
PL3. What is the value of a 2Vpp, 60 Hz sine wave in both magnitude (in Volts) and phase (in degrees) att = 2.5 ms if the waveform is assumed to start with zero phase at t = 0 seconds? Show your work.
Instructor’s initials_______
Equipment
Computers and Matlab program in the ECE computer lab, room 625 Cobeigh Hall.
Procedures
P1. Launch the Matlab program using the desktop icon or the ‘Start’ menu. The program will open withseveral window panes.
Explore Matlab by typing the command help at the >> prompt in the command window, then for any ofthe topics listed, type help <topic>. It is not necessary to write the directory name preceding thetopic of interest. Also try help plot and help cos. After you finish the exercises of proceduresP2 through P10, feel free to type help demo and try out one or more of the available demonstrations.
P2. Using your measured diode data from Lab 4 (which you recorded in Table II of Lab 4), create vectorscontaining:
- the input voltage values (save under the variable V)- the voltage drop across the resistor (save under the variable VR)- the voltage drop across the diode (save under the variable VD)- the current flowing through the circuit (save under the variable I)

3
August 29, 2007 JPB
Create a line graph of the current (y-axis) vs. the voltage drop across the resistor (x-axis).
Place an appropriate descriptive title on the graph. Also label the x and y axes with the proper quantitynames and units.
P3. Create a new Microsoft Word document and copy the P2 graph from Matlab into the Worddocument. Underneath the graph write a brief description about what is shown. Does the I-Vcharacteristic of the resistor match what you expected? Using your graph, approximate the resistancevalue of the resistor. Explain your calculation.
P4. Create a line graph of the current (y-axis) vs. the voltage drop across the diode (x-axis). Place anappropriate descriptive title on the graph. Also label the x and y axes with the proper quantity names andunits.
P5. Copy the P4 graph from Matlab into the Word document. Underneath the graph write a briefdescription about what is shown. Does the I-V characteristic of the diode match what you expected? Fora piecewise linear model of the diode, what seems to be a good estimate the diode’s voltage drop whenconducting?
P6. In this step you will use the ideal diode equation to plot the I-V characteristic of the 1N4005 (thediode used in lab 4) and compare it to the measured I-V characteristic.
Create a new vector called Vdiode containing the values from –2 to 0.7 in steps of 0.01. Thisnew set of values will be used to create an I-V characteristic for the 1N4005.
Create a variable Io and set it equal to 76.9 x 10⁻¹². This is the value of Io in the equation givenon page 35 of your note set. The value was taken from the SPICE model for the 1N4005.
Create the variable N and set it equal to 1.45. This is the value of the diode ideality factor asgiven on page 35 of your note set. The value was taken from the SPICE model for the 1N4005.
Create variables for the electronic charge and Boltzmann’s constant as found on page 35 of thenoteset.
Create a variable T and set it equal to 290. This is the assumed value of temperature in degreesKelvin.
Using the ideal diode equation, create a new vector called Idiode containing the values of thediode current for voltages held in variable Vdiode. The equation is given on page 39 of thenoteset. The exponential function in MatLab is exp; try help exp in MatLab to learn more.
Create a graph that contains both the measured I-V characteristic of the diode and thatpredicted using the ideal diode equation. Make certain to label your graph appropriately.
Copy this graph to your Word document. Underneath the graph write a brief descriptionregarding what is shown.
Below the graph, comment on the agreement between the measured I-V characteristic and thatpredicted using the ideal diode equation.
P7. Again in Matlab, create a cosine wave with frequency f = 60 Hz, and create a line plot of fivecycles of this signal, with “volts” for the vertical scale and time in seconds for the horizontal scale. Youneed to think about how to specify the argument for the cosine function and how many points perwaveform cycle is appropriate.
Be sure to label the graph and axes appropriately, and copy this plot into the Word document and givea written description.

4
August 29, 2007 JPB
P8. Repeat P7, but with a phase shift of +30 degrees. This requires changing the argument to thecosine function. Be sure to account for degrees or radians when using the cosine function.
P9. Now create one graph with both signals from P7 and P8 overlapped on the same graph. Choosedifferent line styles for the two signals, keeping in mind that the printer in the lab is monochrome (colorswon’t show up). Label the graph and axes, then copy the plot into the Word document and give a writtendescription.
P10. Add a report title at the top of the first page, along with the date, class number and section, andyour name. Check the graph sizes, page boundaries, and text wrapping so that the graphs and theircorresponding descriptions fit on the proper pages without wasting space. Print this report and turn it inas your lab report for today.
MATLAB is a tool that you may find useful in your math and science courses – make use of this fantasticresource!
20071002RCM
ASSEMBLING the
ECEbot Printed Circuit Board: Part One
Due Date
The Part One assembly steps must be completed prior to:
Prepared by R.C. Maher September 2007
Copyright © 2007 Department of Electrical and Computer Engineering, Montana State University
All Rights Reserved

PCB Assembly Part One 2
BEFORE STARTING: be sure to put your name on your kit box! Also be sure to label your robot PCB with a marker pen. This will help get the items returned if they are lost or misplaced.
1 Printed Circuit Board Preliminaries
This section describes the initial steps to begin soldering the ECEbot’s circuit board. Look at both sides of the Printed Circuit Board (PCB). The front side has printed lines and labels called the “silk screen,” while the back side doesn’t have any printing on it. Notice that there are many small labels on the front (silk screen) side of the board. The instructions will often refer to the components by these labels, like diode “LED3”, resistor “R11”, or header “J17”. Most of the components will be inserted in the board from the front side by slipping the wires or legs through the drill holes, then soldering them to the back side.
Figure 1-1: PCB Layout: Front of Main Board
PCB Assembly Part One 3
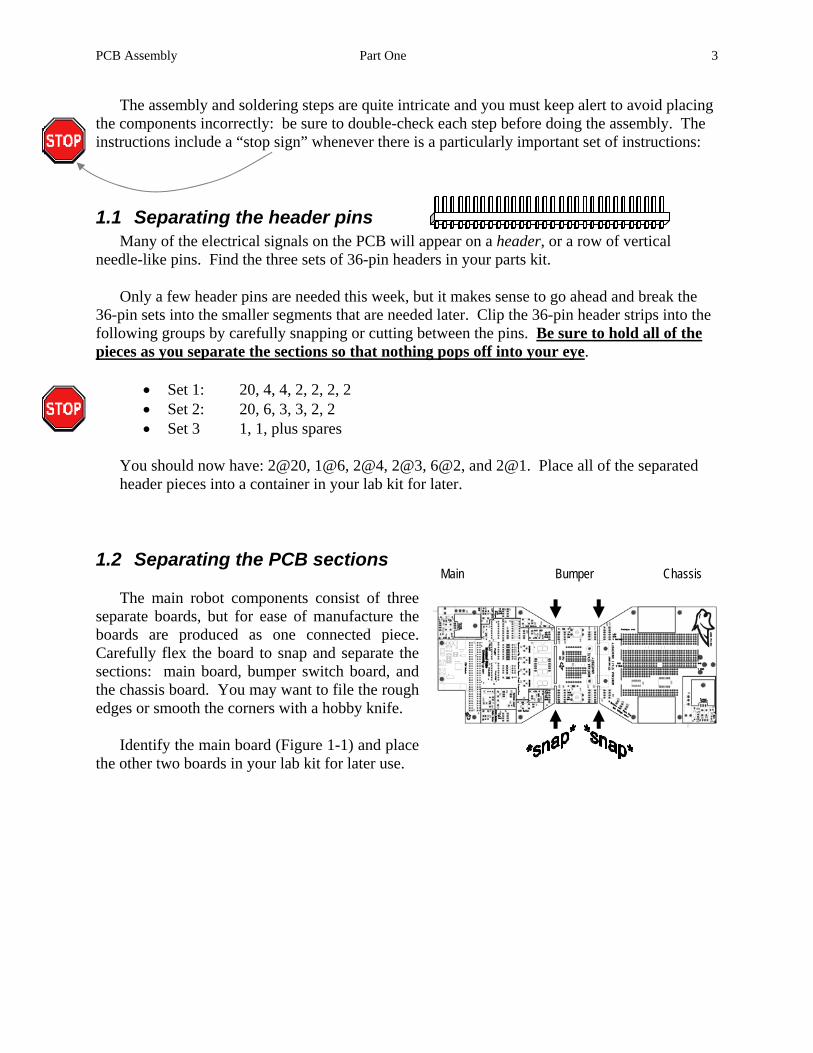
The assembly and soldering steps are quite intricate and you must keep alert to avoid placing the components incorrectly: be sure to double-check each step before doing the assembly. The instructions include a “stop sign” whenever there is a particularly important set of instructions:
1.1 Separating the header pins Many of the electrical signals on the PCB will appear on a header, or a row of vertical
needle-like pins. Find the three sets of 36-pin headers in your parts kit.
Only a few header pins are needed this week, but it makes sense to go ahead and break the 36-pin sets into the smaller segments that are needed later. Clip the 36-pin header strips into the following groups by carefully snapping or cutting between the pins. Be sure to hold all of the pieces as you separate the sections so that nothing pops off into your eye.
Main Bumper Chassis
• Set 1: 20, 4, 4, 2, 2, 2, 2 • Set 2: 20, 6, 3, 3, 2, 2 • Set 3 1, 1, plus spares
You should now have: 2@20, 1@6, 2@4, 2@3, 6@2, and 2@1. Place all of the separated header pieces into a container in your lab kit for later.
1.2 Separating the PCB sections
The main robot components consist of three separate boards, but for ease of manufacture the boards are produced as one connected piece. Carefully flex the board to snap and separate the sections: main board, bumper switch board, and the chassis board. You may want to file the rough edges or smooth the corners with a hobby knife.
Identify the main board (Figure 1-1) and place the other two boards in your lab kit for later use.

PCB Assembly Part One 4
1.3 Soldering Step 1: Installing a Repair Jumper Wire Do not proceed until the instructor has demonstrated how to use the soldering iron and you have practiced making several solder joints using one of the scrap circuit boards in the lab.
The Fall 2007 main PCB requires one minor "fix" to the built-in wiring. Begin by flipping the main PCB over so that you are looking at the back side (the side with no silk screen labeling), as shown below. Look carefully at the middle right portion of the board back, and locate two small cuts and a short section of bare copper on the board (see figure below).
Pre-Cut Traces
Bare Copper
You will need to solder a short segment (2-3 cm) of bare wire to the small hole just above the cuts, and solder the other end to the bare copper trace just below the cuts, as indicated in the close up figure on the next page. You can use a piece of wire trimmed from the end of one of the resistors in your lab kit.
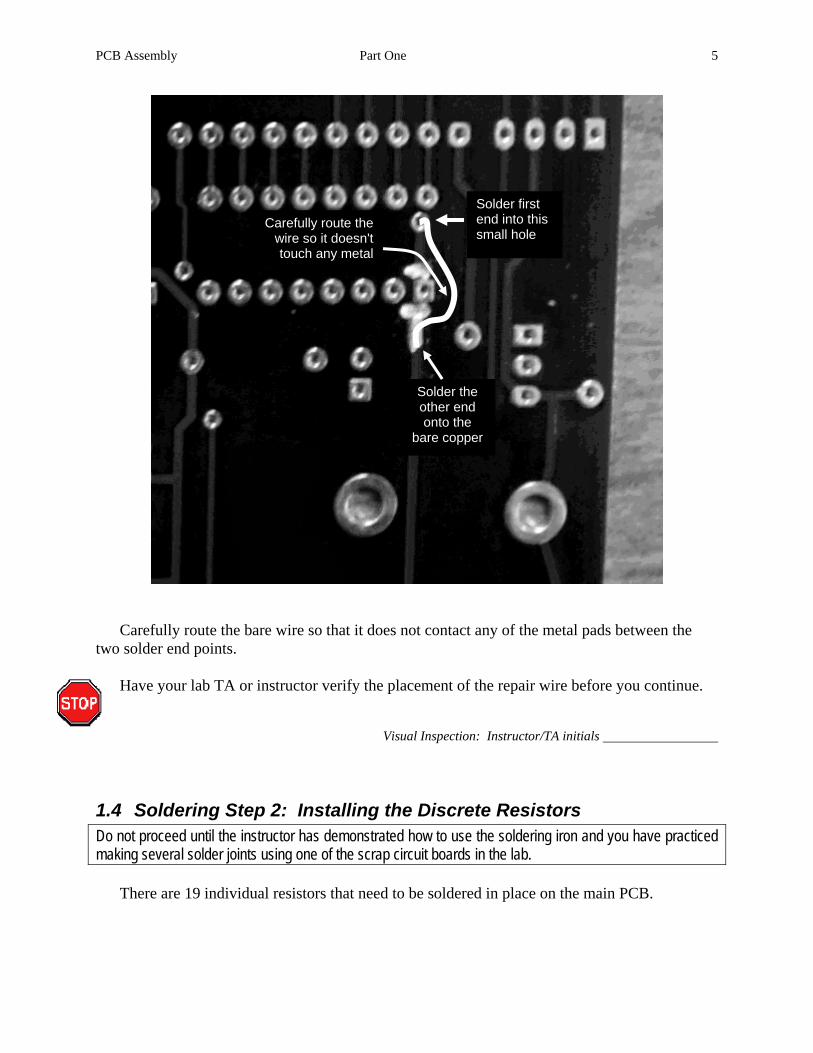
PCB Assembly Part One 5
Solder first end into this small hole
Solder the other end onto the
bare copper
Carefully route the wire so it doesn't touch any metal
Carefully route the bare wire so that it does not contact any of the metal pads between the two solder end points.
Have your lab TA or instructor verify the placement of the repair wire before you continue.
Visual Inspection: Instructor/TA initials
1.4 Soldering Step 2: Installing the Discrete Resistors Do not proceed until the instructor has demonstrated how to use the soldering iron and you have practiced making several solder joints using one of the scrap circuit boards in the lab.
There are 19 individual resistors that need to be soldered in place on the main PCB.
PCB Assembly Part One 6
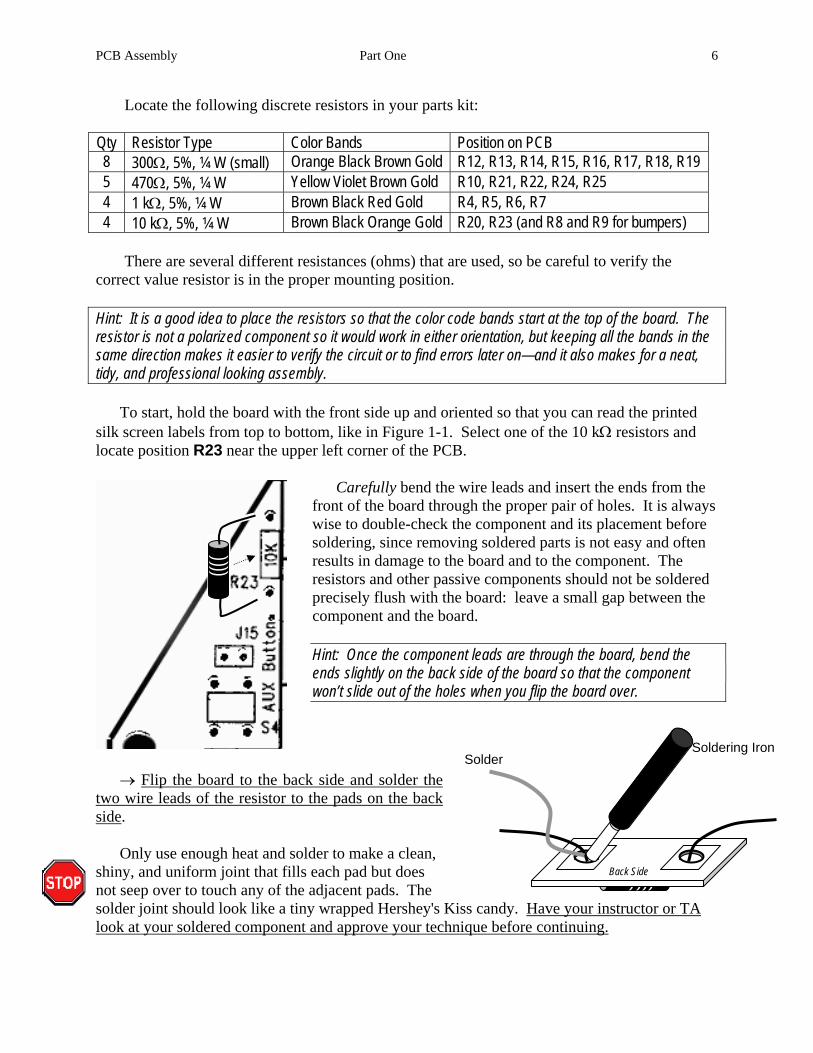
Locate the following discrete resistors in your parts kit:
Qty Resistor Type Color Bands Position on PCB 8 300Ω, 5%, ¼ W (small) Orange Black Brown Gold R12, R13, R14, R15, R16, R17, R18, R19 5 470Ω, 5%, ¼ W Yellow Violet Brown Gold R10, R21, R22, R24, R25 4 1 kΩ, 5%, ¼ W Brown Black Red Gold R4, R5, R6, R7 4 10 kΩ, 5%, ¼ W Brown Black Orange Gold R20, R23 (and R8 and R9 for bumpers)
There are several different resistances (ohms) that are used, so be careful to verify the correct value resistor is in the proper mounting position.
Hint: It is a good idea to place the resistors so that the color code bands start at the top of the board. The resistor is not a polarized component so it would work in either orientation, but keeping all the bands in the same direction makes it easier to verify the circuit or to find errors later on—and it also makes for a neat, tidy, and professional looking assembly.
To start, hold the board with the front side up and oriented so that you can read the printed silk screen labels from top to bottom, like in Figure 1-1. Select one of the 10 kΩ resistors and locate position R23 near the upper left corner of the PCB.
Carefully bend the wire leads and insert the ends from the front of the board through the proper pair of holes. It is always wise to double-check the component and its placement before soldering, since removing soldered parts is not easy and often results in damage to the board and to the component. The resistors and other passive components should not be soldered precisely flush with the board: leave a small gap between the component and the board.
Hint: Once the component leads are through the board, bend the ends slightly on the back side of the board so that the component won’t slide out of the holes when you flip the board over.
→ Flip the board to the back side and solder the two wire leads of the resistor to the pads on the back side.
Only use enough heat and solder to make a clean, shiny, and uniform joint that fills each pad but does not seep over to touch any of the adjacent pads. The solder joint should look like a tiny wrapped Hershey's Kiss candy. Have your instructor or TA look at your soldered component and approve your technique before continuing.
Solder Soldering Iron
Back Side

PCB Assembly Part One 7
After the solder cools, gently clip off the excess wires on the back side just above each solder joint: be sure to hold the wire so it doesn't go shooting across the room as you clip it!
→ Now locate the proper place for each of the 18 other resistors and systematically solder them in place. If you are in doubt about where a resistor goes, be sure to ask the instructor or lab TA for assistance.
1.5 Soldering Step 3: Attach the 60-pin Socket
Hold the board with the front side up. The row of holes just above the silk screen label "CSM Module" (J25 and J26 labels) is the location of the 60-pin socket that will hold the microcontroller board. A socket provides electrical connections to another component and aids in removing and replacing that component if necessary.
Socket Location: bottom row
Figure 1-2: Socket location and orientation on the PCB
Find the 60-pin socket in your lab kit. Carefully line up all 60 pins of the socket with the holes on the PCB (see Figure 1-3) and hold the socket flush against the board as you flip it over.
PCB Assembly Part One 8
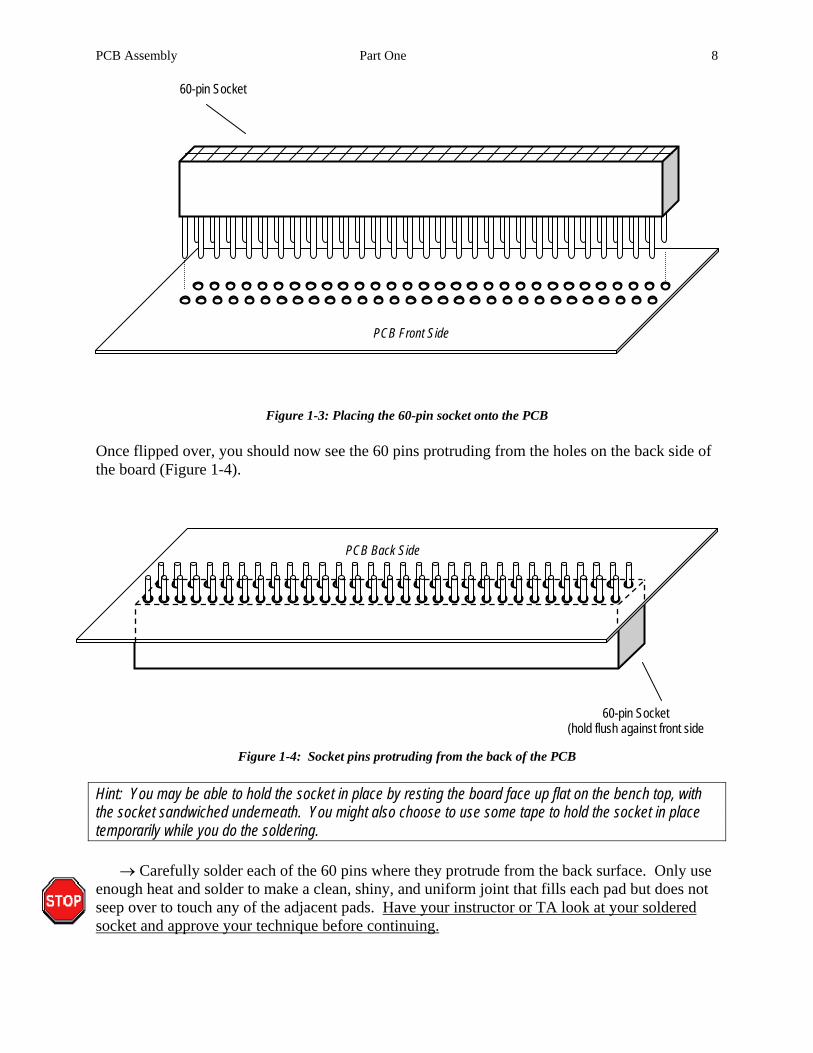
60-pin Socket
PCB Front Side
Figure 1-3: Placing the 60-pin socket onto the PCB
Once flipped over, you should now see the 60 pins protruding from the holes on the back side of the board (Figure 1-4).
PCB Back Side
60-pin Socket (hold flush against front side
Figure 1-4: Socket pins protruding from the back of the PCB
Hint: You may be able to hold the socket in place by resting the board face up flat on the bench top, with the socket sandwiched underneath. You might also choose to use some tape to hold the socket in place temporarily while you do the soldering.
→ Carefully solder each of the 60 pins where they protrude from the back surface. Only use enough heat and solder to make a clean, shiny, and uniform joint that fills each pad but does not seep over to touch any of the adjacent pads. Have your instructor or TA look at your soldered socket and approve your technique before continuing.

PCB Assembly Part One 9
1.6 Soldering Step 4: The Power System Components
In this section, the power system for the robot will be introduced. Hold the PCB with the front side up, the silk screen oriented so you can read the main labels, and locate the power section of the board in the lower left corner (see Figure 1-5).
Figure 1-5: Power system section (front side, bottom left)
To begin with, be sure you understand the concept of polarized or directional components, meaning components that have a positive and negative direction: the diodes, the voltage regulator, and the electrolytic capacitor. This concept will be important in this sub-system.
If you have any questions do not hesitate to ask the instructor.
PCB Assembly Part One 10
1.6.1 Components list
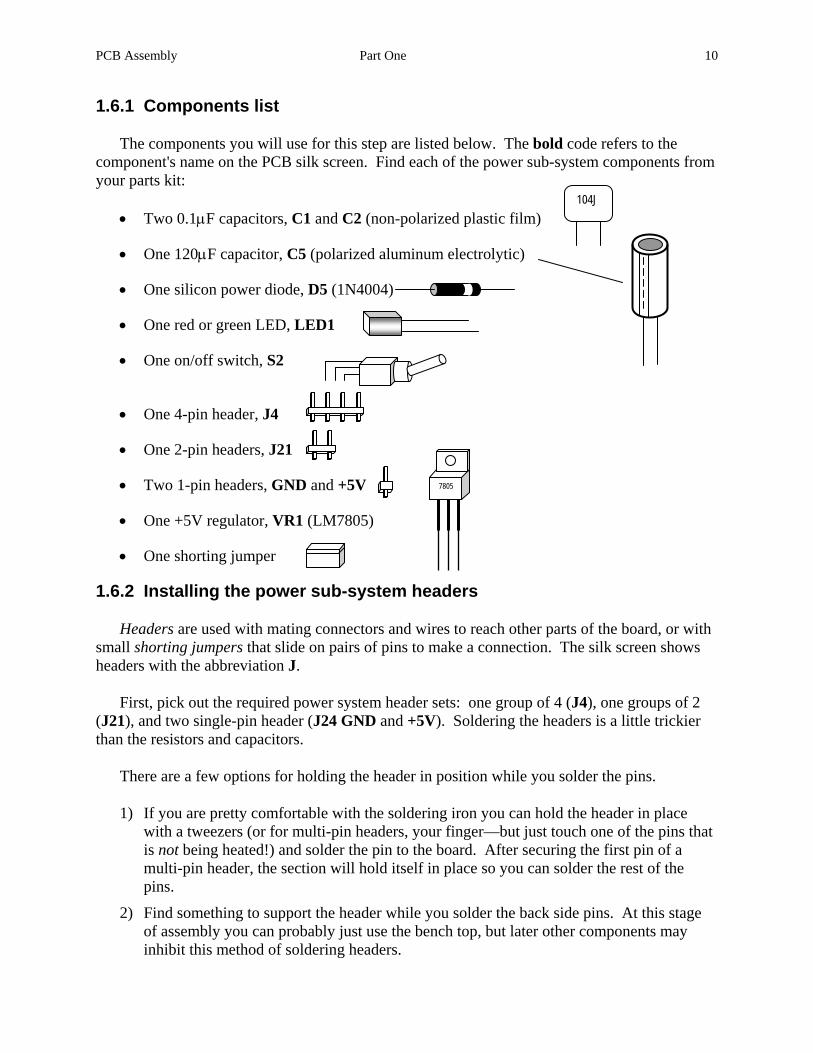
The components you will use for this step are listed below. The bold code refers to the component's name on the PCB silk screen. Find each of the power sub-system components from your parts kit:
104J • Two 0.1μF capacitors, C1 and C2 (non-polarized plastic film)
• One 120μF capacitor, C5 (polarized aluminum electrolytic)
• One silicon power diode, D5 (1N4004)
• One red or green LED, LED1
• One on/off switch, S2
• One 4-pin header, J4
• One 2-pin headers, J21
7805 • Two 1-pin headers, GND and +5V
• One +5V regulator, VR1 (LM7805)
• One shorting jumper
1.6.2 Installing the power sub-system headers
Headers are used with mating connectors and wires to reach other parts of the board, or with small shorting jumpers that slide on pairs of pins to make a connection. The silk screen shows headers with the abbreviation J.
First, pick out the required power system header sets: one group of 4 (J4), one groups of 2 (J21), and two single-pin header (J24 GND and +5V). Soldering the headers is a little trickier than the resistors and capacitors.
There are a few options for holding the header in position while you solder the pins.
1) If you are pretty comfortable with the soldering iron you can hold the header in place with a tweezers (or for multi-pin headers, your finger—but just touch one of the pins that is not being heated!) and solder the pin to the board. After securing the first pin of a multi-pin header, the section will hold itself in place so you can solder the rest of the pins.
2) Find something to support the header while you solder the back side pins. At this stage of assembly you can probably just use the bench top, but later other components may inhibit this method of soldering headers.

PCB Assembly Part One 11
3) A piece of tape can be used to hold the header in place. In some ways this seems like the best option, but it is often hard to keep the header aligned perpendicularly to the board.
→ Place the 4-pin power system header (J4) into position by sliding the short ends of the jumper pins through the matching holes, decide how you will hold it in place, and then solder it from the back side.
→ Do the same for the 2-pin header J21.
→ The single pin J24 attached to the board’s ground potential (GND). J24 is located over in the middle left side of the PCB just above the power section.
→ The single pin +5V attached to the board’s regulated power output potential is located in the middle of the power section.
As you will see later, there are a lot of headers to install on the board!
1.6.3 Power supply connector "key"
When the entire kit is assembled you will be powering your robot using a battery pack. The pack will connect to the PCB using the four header pins (J4) you just soldered in place. The positive (+) battery wire will connect to the left pin and the negative (-) battery wire will connect to the right pin. In order to make it less likely to connect the power backwards, we will key the connection by removing one of the header pins. The corresponding hole in the battery connector is plugged, so the connector can only be installed in the proper orientation.
→ Carefully clip off the second-to-right header pin of J4. The hole plug in the mating battery connector to make sure the positive and negative connections are correct.

PCB Assembly Part One 12
1.6.4 Installing the passive components
First identify the correct holes for the two 0.1μF (104) plastic film capacitors C1 and C2.
Hint: The plastic film capacitors look a bit like Chiclets candy and do not have a polarization: they can go into the circuit in either orientation. However, be sure to choose the capacitor orientation so that the "104J" label will still be visible after installation, not sandwiched between the C1 and C2 capacitors.
→ Insert the legs from the front side of the board, flip the board to the back side, and solder the capacitor legs in place on the back. Carefully clip off the excess wire.
Now place the 120μF aluminum electrolytic capacitor C5 into its holes: make sure the negative lead and positive lead are oriented correctly.
Hint: The electrolytic capacitor looks like a small metal can and is polarized: one of the leads is labeled "-", for negative, on the side of the capacitor. Make sure the other lead (positive) goes into the hole with the square pad near the "+" silk screen mark. Your board will not work if the electrolytic capacitor is inserted backwards!
→ After double-checking the orientation, solder the C5 capacitor in place. Carefully snip off the excess wire.
Next, locate the holes for the light-emitting diode (LED1) and the power diode (D5) in the lower left area of the board.
Hint: The LED (light emitting diode) is directional. The long wire is the anode and the short wire is the cathode. You may also be able to see the larger cathode element inside the LED package. Make sure the LED is inserted so the short wire (cathode end) goes through the square pad
104J
C5
Front Side
Front Side cathode: short wire anode: long wire Short wire…
…square pad

PCB Assembly Part One 13
Hint: The proper direction for the power diode stripe corresponds to the white mark on the silk screen.
→ Solder the LED and the power diode into position. Both before and after soldering, verify the placement and orientation of each polarized component, and seek help if you notice any errors.
1.6.5 Installing the voltage regulator
The next piece that goes in the power sub-system is the 3-pin voltage regulator. The regulator takes the voltage from the batteries (which will vary with temperature, load, and as the batteries discharge), and electrically converts it to the constant +5 volts that is needed by the rest of the circuitry. The first pin is the input voltage, the second pin is the circuit ground, and the third pin is the regulated 5 volts.
→ Insert the component from the front side of the PCB oriented so that the tab is toward the top and the label toward the bottom, and then solder the three pins on the back side. Gently clip off the excess wires after soldering.
VR1
1.6.6 Power switch
Finally, install the toggle switch in position S2. The switch has two “feet” that fit into the holes at the edge of the board, and three electrical contacts protruding from the rear. Hold the switch in place as you solder the five connections on the bottom of the board.

PCB Assembly Part One 14
1.6.7 Visual inspection
Take a moment to examine your board carefully and critically.
Were all the power system components installed? Are all the pins soldered completely? Are there any "whiskers" or "solder bridges" between the pads? Is there any loose debris (like solder crumbs or metal flakes) caught anywhere on the
board? Look closely. Do you see any damage to the board or its components, like bent pins, cracked
housings, or crushed LEDs?
Be sure to ask your instructor or lab TA to examine any questionable areas of your PCB.
1.6.8 Power sub-system testing
Once you get to the lab, find the test plugs shown here. These are not part of your lab kit: just use them temporarily in the lab room for testing purposes.
Attach a 4-socket pigtail to the power supply header (J4), and a single-socket pigtail to the bottom pin of 2-pin jumper J21.
Figure 1-6: Power header detail (front side, bottom)
(Plug)
(Orange)
(Gray)
J21 bottom pin is +5V regulator output
-Supply (gray or black) +Supply (orange or red)

PCB Assembly Part One 15
→ Set the DC bench power supply to 10 V using the DMM to verify the voltage. Connect the positive (red) wire from the supply to the orange or red wire of the pigtail using a banana cable and alligator clip. Connect the neutral (black) power supply wire to the gray or black pigtail using another banana cable and alligator clip.
→ Flip the toggle switch S2 to the down position. This is the “on” position.
→ The voltage regulator output (5 volts) is sent to the bottom pin on header J21 in the power supply area of the PCB. Use the DMM to measure the voltage between the bottom J21 pin and the board ground test pin (J24 GND).
If you do NOT measure 5 volts, systematically check your connections and ask the instructor or TA for help.
If the measured regulator output voltage is 5 volts, proceed on to the next step.
→ Disconnect the DMM and single-socket pigtail from J21. Carefully slide a shorting jumper over the two J21 header pins: this will connect 5 volts from the regulator to the Vcc supply bus on the board. This should illuminate LED1, located in the lower right of the board. If the LED does NOT light up, turn off the power supply and re-check all the connections. Seek help if you need it.
This concludes soldering Part One. Your lab instructor will let you know when you should start work on assembly steps described
in the Part Two instructions.
ASSEMBLING the
ECEbot
Printed Circuit Board: Part Two
Due Date
The Part Two assembly steps must be completed prior to:
Prepared by R.C. Maher September 2007
Copyright © 2007 Department of Electrical and Computer Engineering, Montana State University
All Rights Reserved
20071001RCM

PCB Assembly Part Two 2
2. Resistor Packs, Transistors, Switches, and Headers
2.1. Soldering Step 5: Resistor Packs and Transistors
2.1.1. Components list
The components you will use for this step are listed below. The bold code refers to the component's name on the PCB silk screen. Find each of the components from your parts kit:
472
• One 4.7 kΩ dual in-line (DIP) resistor pack (yellow), R1
• One 10 kΩ single in-line (SIP) resistor pack (red or yellow), R2
• One 50 kΩ potentiometer, R11
• Four 2N3906 PNP bipolar transistors, Q1, Q2, Q3, Q4
2.1.2. Placing the SIP and DIP resistor packs
Locate position R2, the ten-pin in-line resistor pack in the left center of the board (see the location circled in Figure 2-1). It is important to solder the resistor pack so the pin with the black square above it is in the first (leftmost) hole of the group.
→ Hold the pack in place on the front side while you solder each pin on the back side.
R1 is also a resistor pack, but it has eight separate 4.7 kΩ resistors inside a dual in-line package (DIP). For this particular device it does not matter which direction you put it in, but for the sake of consistency it is suggested that you insert the package so that
the printed label has the same orientation as the PCB silk screen lettering and the notched end on the package is to the left.
→ Place the pins through the front side holes and solder each pin on the back side.

PCB Assembly Part Two 3
R1, R2
R11
Figure 2-1: PCB layout: Front
2.1.3. Installing the potentiometer
The potentiometer is installed at position R11 in the right center of the board. Orient the “pot” so that the adjustment screw is at the top (toward the center of the board), as indicated on the silk screen.
→ Place the pot’s three leads through the holes and solder the potentiometer in place.
2.1.4. Transistors The next components to install are the four transistors. Find the small half cylinder-
shaped objects with three leads. These are the 2N3906 PNP bipolar transistors. Locate the Q1-Q4 holes in the upper center of the PCB. Orient the transistors so the shape is aligned with the silk screen emblem (curved side to the top).
PCB Assembly Part Two 4
Hints: Gently bend the middle pin out so it will fit as the transistor is inserted, but do not press it down so hard that the middle pin is in danger of snapping. The black transistor body should not be forced down into contact with the board: leave a little space so the leads do not kink.
→ Solder the four transistors in place, then snip off the excess wire. Take your time: make sure the solder only contacts the leg of the transistor and the pad, not the adjacent board surfaces and components.
2.2. Soldering Step 6: Pushbuttons and Capacitors
2.2.1. Components list
The components you will use for this step are listed below. The bold code refers to the component's name on the PCB silk screen. Find each of the components from your parts kit:
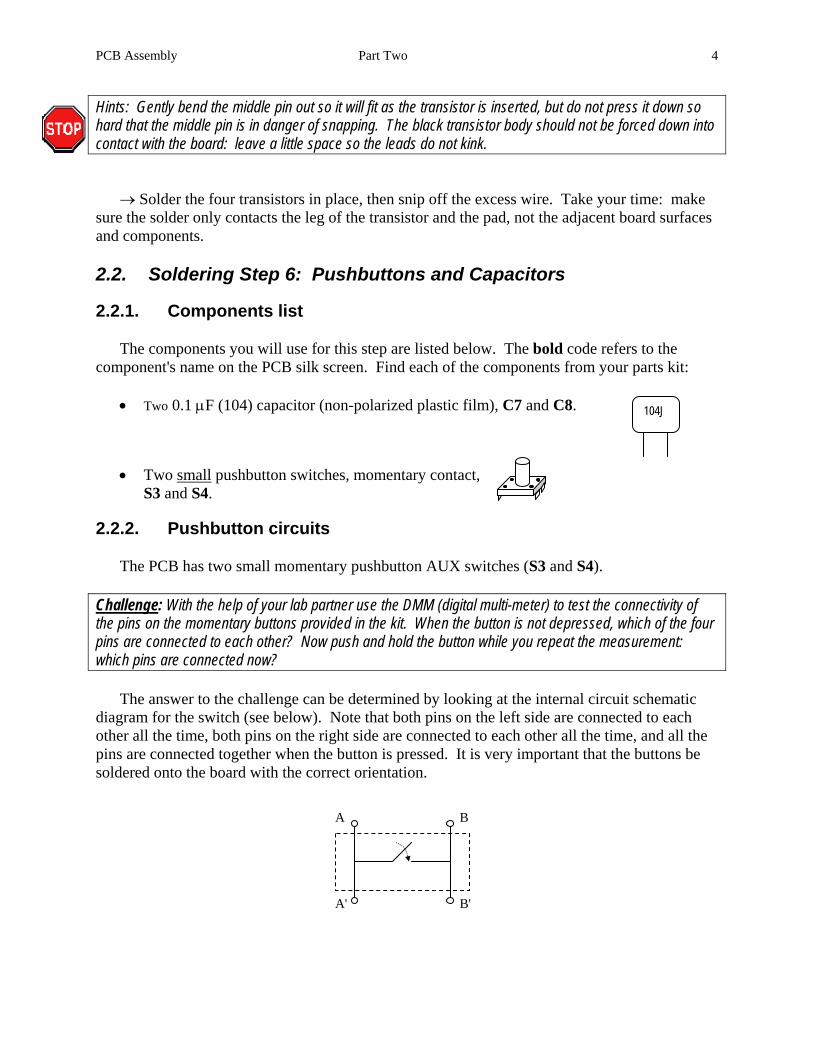
• Two 0.1 μF (104) capacitor (non-polarized plastic film), C7 and C8.
• Two small pushbutton switches, momentary contact, S3 and S4.
2.2.2. Pushbutton circuits
The PCB has two small momentary pushbutton AUX switches (S3 and S4).
Challenge: With the help of your lab partner use the DMM (digital multi-meter) to test the connectivity of the pins on the momentary buttons provided in the kit. When the button is not depressed, which of the four pins are connected to each other? Now push and hold the button while you repeat the measurement: which pins are connected now?
The answer to the challenge can be determined by looking at the internal circuit schematic diagram for the switch (see below). Note that both pins on the left side are connected to each other all the time, both pins on the right side are connected to each other all the time, and all the pins are connected together when the button is pressed. It is very important that the buttons be soldered onto the board with the correct orientation.
A'
A B
104J
B'

PCB Assembly Part Two 5
AUX Button S3
AUX Button S4
Locate the two AUX button locations on the PCB. The pin spacing is slightly wider in one direction than in the other, so make sure you have the switch in the proper orientation as you insert the pins.
→ Solder the pins of each switch on the back side of the PCB.
2.2.3. Capacitors
Now install the two 0.1μF plastic film capacitors, C7 and C8.
C7 is located in the Right Motor area and C8 is located in the Left Motor area. The capacitors are non polarized so they can go into the board in either orientation. It is a good idea to place the capacitor so its label will be visible once the motor connector is installed in the adjacent position.
→ Solder the leads of each capacitor on the back side of the PCB, then gentlyclip the excess wire.
C8 C7

PCB Assembly Part Two 6
2.3. Soldering Step 7: Main Headers
The other items to be installed this week are headers, and there are quite a few of them!
Header size Qty Locations 2-pin 5 J3, J14, J15, J17, J18 3-pin 2 J7, J13 20-pin 2 J1+J27
→ The locations to install are circled in the PCB layout shown in Figure 2-2. Insert all the specified headers and solder them in place. Try to make sure the pins end up perpendicular to the board. Note that several header positions will be left empty: J2, J5, J9, J10, J19, J20, J26 and J28 are not needed.
J3
J13
J1+J27
J18
J14 J15
J17
J7
Figure 2-2: Locations to install the indicated headers.
This concludes soldering Part Two. This coming week you will complete the PCB assembly with the Part Three steps.

ASSEMBLING the
ECEbot
Printed Circuit Board: Part Three
Due Date
The Part Three assembly steps must be completed prior to:
Prepared by R.C. Maher September 2007
Copyright © 2007 Department of Electrical and Computer Engineering, Montana State University
All Rights Reserved
20071001RCM

PCB Assembly Part Three 2
3.1. Soldering Step 8: Light Emitting Diodes
3.1.1. Display
Figure 3-1 shows the location of the 4-digit LED Display (U1) to be mounted at the top center of the PCB.
4-digit Display (decimal points: lower right)
Figure 3-1: Position of 4-digit LED Display
First, take the 4-digit display and insert its 12 pins with the same orientation as the silk screen: decimal points located to the bottom right of each digit.
→ As before, use a piece of tape or some other technique to keep the display flush with the PCB while soldering the display's pins on the back side.
3.1.2. Discrete LEDs
Four individual light emitting diodes need to be installed (LED2, LED3, LED4 and LED5).
Remember: The LEDs (light emitting diodes) are directional. The long wire is the anode and the short wire is the cathode. Make sure the LED is inserted so the short wire goes through the square pad
anode: long wire cathode: short wire
Short wire… …square pad
PCB Assembly Part Three 3
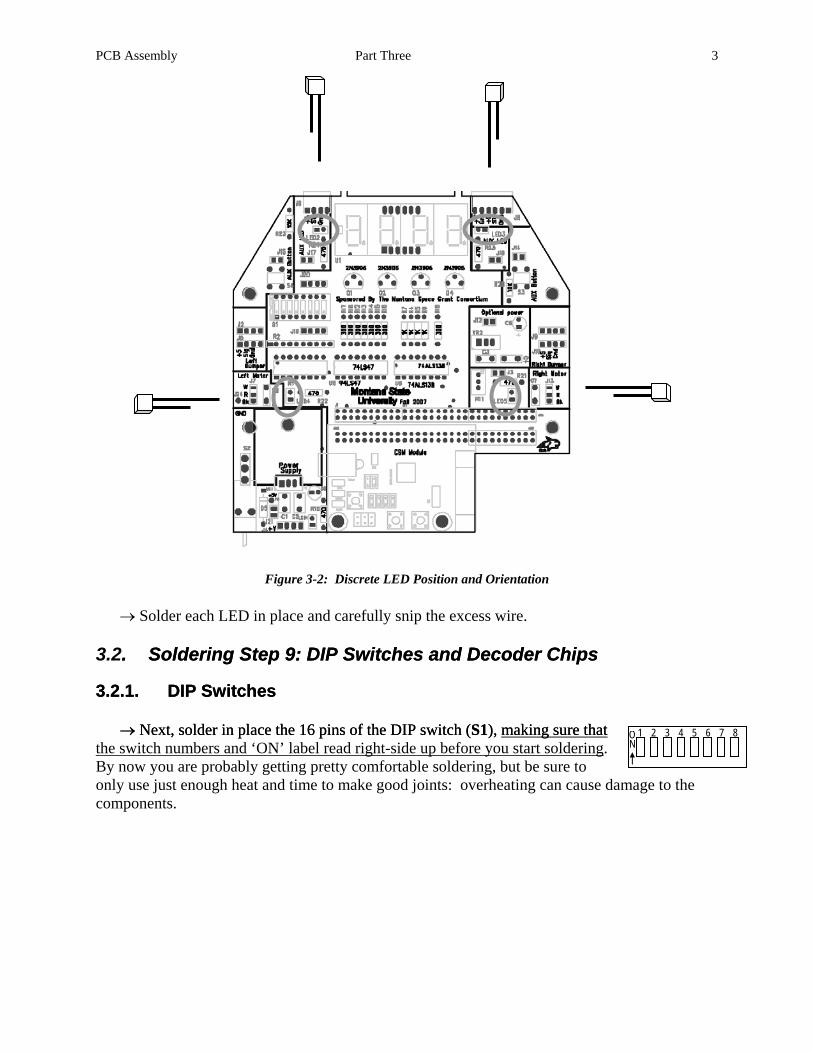
Figure 3-2: Discrete LED Position and Orientation
→ Solder each LED in place and carefully snip the excess wire.
3.2. Soldering Step 9: DIP Switches and Decoder Chips . Soldering Step 9: DIP Switches and Decoder Chips
3.2.1. DIP Switches 3.2.1. DIP Switches
→ Next, solder in place the 16 pins of the DIP switch (S1), making sure that → Next, solder in place the 16 pins of the DIP switch (S1), making sure that the switch numbers and ‘ON’ label read right-side up before you start soldering. By now you are probably getting pretty comfortable soldering, but be sure to only use just enough heat and time to make good joints: overheating can cause damage to the components.
1 2 3 4 5 6 7 8 O N

PCB Assembly Part Three 4
74LS47
74LS138
3.2.2. Decoder Integrated Circuits
The final electronic components are two integrated circuit (IC) packages. These are black, 16-pin, dual in-line packages. Although the two packages are exactly the same shape and size, notice that they are labeled with different part numbers and they perform two different functions. They must be installed in the proper place. IT MATTERS WHICH CIRCUIT GOES WHERE, SO DOUBLE-CHECK YOUR IDENTIFICATION AND PACKAGE ORIENTATION!!
Hint: The integrated circuits can be damaged easily by static electricity and overheating during soldering. It is possible for a static discharge to occur even if you don’t feel or see a spark! Be sure to discharge yourself frequently when working at the lab bench by touching a grounded panel or chassis. If possible, use an approved grounding wrist strap and antistatic mat.
→ The device placed in location U8 (left spot) is the 74LS47 (“BCD to 7-segment decoder”). Turn the device so that the notch on the package is to the left, and gently insert through the holes. Keep the package flush with the board while you solder the pins on the back side. Don’t overheat the pins!
→ The device placed in location U6 (right spot) is the 74LS138 (“1-of-8 decoder”). Orient the package so the notch is on the left, and hold the package flush with the board while you solder the pins on the back side.
74LS138 74LS47
Figure 3-3: Placement of the Decoder ICs. Double check the IC label and mounting position!

PCB Assembly Part Three 5
3.3. Soldering Step 10: Bumper Switch Connectors
The last soldering step is to attach the two edge connectors for the bumper switches.
→ Locate the 4-pin edge connector and solder it in place on the top left front of the board (J6), and locate the 6-pin edge connector and solder it in place on the top right front (J8).
Figure 3-5: 4-pin and 6-pin edge connectors (for bumper switch attachment).
3.4. Final PCB Visual Inspection
Take a moment to examine the board carefully and critically.
Are there any missing components—other than the unused areas of the board? Are all the pins soldered completely? Are there any "whiskers" or "solder bridges" between the pads? Is there any loose debris (like solder crumbs or metal flakes) caught anywhere on the
board? Look closely. Do you see any damage to the board or its components, like bent pins, cracked
housings, or crushed LEDs?
Be sure to ask your instructor or lab TA to examine any questionable areas of your PCB. You will perform electrical tests during the next lab session.
You must complete the entire PCB assembly to this point by the due date.

EE 101 Fall 2007 Date: Lab Section #
Lab #6 Name:
Robot Board Sub-System Testing Partner: No Lab partners this time!
Abstract
The ECEbot robots have a printed circuit board (PCB) containing most of the control circuitry. The board includes a voltage regulator sub-system, a light-emitting diode (LED) display sub-system, a microcontroller sub-system, and an interface sub-system for the sensors and motors. It is assumed that you have completed the assembly steps as described in Assembling the ECEBot, Printed Circuit Board: Parts 1 through 3. You will start sub-system testing in this lab.
Introduction and Theory
Essentially all electronic devices and computers need a DC supply voltage to power the components. The power can come from batteries, from a line-powered DC bench supply, or from an integrated power supply.
The ECEbot circuitry requires a 5 volt DC supply. If we simply tried to use a combination of batteries to create the 5 volts, we would find that the actual voltage would vary as the load changed and as the batteries gradually discharged. This sort of voltage variation would lead to incorrect operation of the microcontroller and other malfunctions. In order to avoid these performance issues, the required constant 5 volts is provided by a special electronic component called a voltage regulator. The regulator input voltage (batteries in this case) is allowed to fluctuate up and down with time, as long as it remains at least a few volts greater than 5 volts at all times. The circuitry within the regulator holds the output at a constant 5 volts even as the input voltage or the load changes.
Emitter
Base PNP Transistor
Collector
The four PNP-type transistors located just below the display are used as electronic switches: a digital signal applied to the middle terminal of the transistor (the base) controls whether or not current is allowed to flow from the upper terminal (the emitter) through the device and out of the lower terminal (the collector). The four transistor collectors are connected to four common anodes of the LED digits, while the four transistor emitter terminals are connected to the +5V supply, known as Vcc.
Equipment
Your ECEbot circuit board, your robot parts kit, and the bench power supply, oscilloscope, multimeter, and banana cables furnished in the lab.
Procedures
Rev. 20071010RCM Copyright © 2007 Department of Electrical and Computer Engineering, Montana State University
P1. Verify that you have completed all soldering steps. The front side of the board should have all of the discrete components, switches, red LEDs, 4-digit 7-segment LED display, voltage regulator, and multi-pin headers installed. There will be some empty spots on the board, as noted in Part Three of the assembly guide. Check that the components are oriented correctly and that all pins have been soldered in place.

6-2
Have the lab instructor or your lab TA visually inspect your board and soldering, then make any corrections that are required.
Visual Inspection: Instructor/TA initials
P2. The first electrical test is to verify the voltage regulator. Later on, seven AA-size 1.5 V batteries connected in series (10.5 V total) will provide power for the robot, but for now the DC bench supply will be used for testing purposes.
→ If a shorting jumper is installed on header J21, you should REMOVE IT now temporarily.
→ Set the DC bench power supply to 10.5 V using the DMM to verify the voltage.
Attach a 4-socket pigtail to the power supply header (J4), and a single-socket pigtail to the top pin of 2-pin jumper J21.
-Supply (gray or black) J21 top pin is
+5V regulator output +Supply (orange or red)
Connect the positive (red) wire from the supply to the red (or orange) wire of the pigtail using a banana cable and alligator clip. Connect the neutral (black) power supply wire to the black (or gray) pigtail using another banana cable and alligator clip.
→ Flip the toggle switch S2 to the down position. This is the “on” position.
→ The voltage regulator output (5 volts) is sent to the top pin on header J21 in the power supply area of the PCB. Use the DMM to measure the voltage between the top J21 pin and the board ground test pin (J24 GND).
If you do NOT measure 5 volts, systematically check your connections and ask the instructor or TA for help.
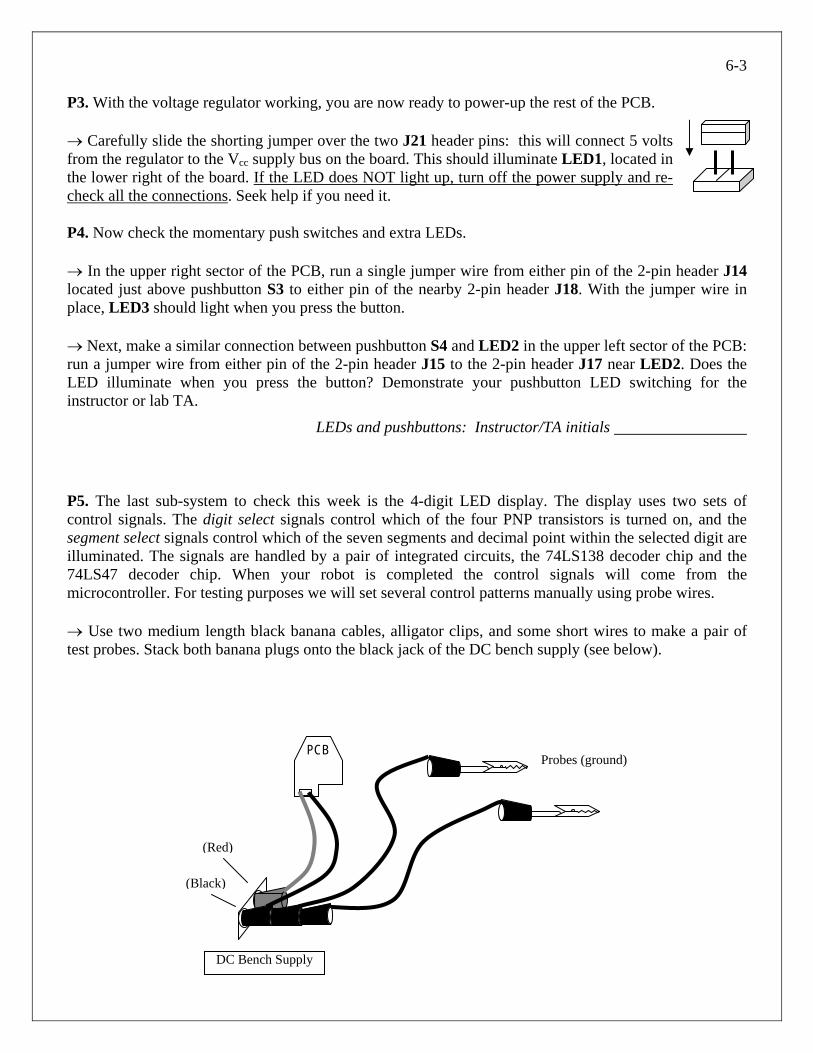
6-3
P3. With the voltage regulator working, you are now ready to power-up the rest of the PCB.
→ Carefully slide the shorting jumper over the two J21 header pins: this will connect 5 volts from the regulator to the Vcc supply bus on the board. This should illuminate LED1, located in the lower right of the board. If the LED does NOT light up, turn off the power supply and re-check all the connections. Seek help if you need it.
P4. Now check the momentary push switches and extra LEDs.
→ In the upper right sector of the PCB, run a single jumper wire from either pin of the 2-pin header J14 located just above pushbutton S3 to either pin of the nearby 2-pin header J18. With the jumper wire in place, LED3 should light when you press the button.
→ Next, make a similar connection between pushbutton S4 and LED2 in the upper left sector of the PCB: run a jumper wire from either pin of the 2-pin header J15 to the 2-pin header J17 near LED2. Does the LED illuminate when you press the button? Demonstrate your pushbutton LED switching for the instructor or lab TA.
LEDs and pushbuttons: Instructor/TA initials
P5. The last sub-system to check this week is the 4-digit LED display. The display uses two sets of control signals. The digit select signals control which of the four PNP transistors is turned on, and the segment select signals control which of the seven segments and decimal point within the selected digit are illuminated. The signals are handled by a pair of integrated circuits, the 74LS138 decoder chip and the 74LS47 decoder chip. When your robot is completed the control signals will come from the microcontroller. For testing purposes we will set several control patterns manually using probe wires.
→ Use two medium length black banana cables, alligator clips, and some short wires to make a pair of test probes. Stack both banana plugs onto the black jack of the DC bench supply (see below).
PCB Probes (ground)
DC Bench Supply
(Black)
(Red)

6-4
→ Move DIP switch 1 "on" and all the other DIP switches to the "off" position.
→ Locate the dual row of header pins labeled J27 in the middle of the PCB just below the words "Montana State University." With the power off, CAREFULLY attach a grounded alligator clip so that it touches both pin 16 and pin 18 of the header (see below). This segment select signal will cause the 74LS47 decoder chip to enable all seven segments of the digit. Now simultaneously touch the other probe wire to pin 3 of header. This will cause the 74LS138 decoder chip to forward-bias the base terminal of the digit 1 control transistor. Now switch on the power. Digit 1 (leftmost) on the display should illuminate as “8”. If the digit does not light up, switch off the power and check your connections.
Note: the dual header pins in J1+J27 are numbered this way:
J27: Pin 16 & Pin 18
J27: Pin 3
BBEE EEXXTTRREEMMEELLYY CCAARREEFFUULL TTOO TTOOUUCCHH OONNLLYY TTHHEE SSPPEECCIIFFIIEEDD PPIINNSS..
IITT IISS EEAASSYY TTOO SSHHOORRTT--OOUUTT OORR BBUURRNN UUPP EELLEECCTTRROONNIICC CCOOMMPPOONNEENNTTSS
BBYY IINNAADDVVEERRTTEENNTTLLYY TTOOUUCCHHIINNGG TTHHEE WWRROONNGG PPIINNSS!!!!!!
1
2
3 4
5
6
7 8
9
10
11
12
13
14
15
16
17
18
19
20
1
2
3 4
5
6
7 8
9
10
11
12
13
14
15
16
17
18
19
20
J1 J27
1 2 3 4 5 6 7 8 O N

6-5
→ Finally, keep the grounded wire on J27 pin 3 and move the other grounded wire to J1 pin 19.
Note that J1 pin 19 controls the decimal point.
J27: Pin 3
BBEE EEXXTTRREEMMEELLYY CCAARREEFFUULL TTOO TTOOUUCCHH OONNSSPPEECCIIFFIIEEDD PPIINNSS..
IITT IISS EEAASSYY TTOO SSHHOOOORR BBUURRNN UUPP EELLEECCTTRROONNIICC CCOOMMPPOO
BBYY IINNAADDVVEERRTTEENNTTLLYY TTOOTTHHEE WWRROONNGG
LLYY TTHHEE
RRTT--OOUUTT NNEENNTTSS
UUCCHHIINNGG PPIINNSS!!!!!!
J1: Pin 19
Demonstrate that you can illuminate the digit and decimal point for the instructor or TA.
LED display probe: Instructor/TA initials
Remember: Start the Chassis Assembly construction steps this week. You should have the base plate, motors, wheels, and brackets assembled before the next ECEbot lab. Don’t attach the PCB to the chassis yet: you still have a few tests to do during the next lab.

ASSEMBLING the
ECEbot
Chassis Mechanical Assembly
Due Date:
Prepared by R.C. Maher September 2007
Copyright © 2007 Department of Electrical and Computer Engineering, Montana State University
All Rights Reserved
20071002RCM

Chassis Assembly 2
Base Plate Preliminaries The chassis materials consist of:
1 Roller ball caster 1 PCB base plate 2 Servo motors 2 Wheels, screws, and rubber tire bands 4 1½" aluminum stand-offs (cylinders) 7 16
3 " 4-40 screws 4 small 4-40 "L" brackets 8 4
1 " 4-40 screws
Also, note that you will not install the bumper board yet. That installation will happen later when the main PCB is completed, but for now, double-check that your bumper board is equipped with the following:
2 6-32 "L" brackets 4 ¼" 6-32 screws
NOTE: do NOT discard any extra parts from the wheel and motor kits. Some of these will be used later on.
Chassis Step 1: Attach Roller Ball Caster to the Base Plate Figure 1 shows the basic format of the PCB base plate. In EE101 we won't be doing any soldering on this PCB, but note that there are connections you could use for your own custom circuits once you learn more about electronics!
Front of robot
Rear of robot
Figure 1: Base plate layout
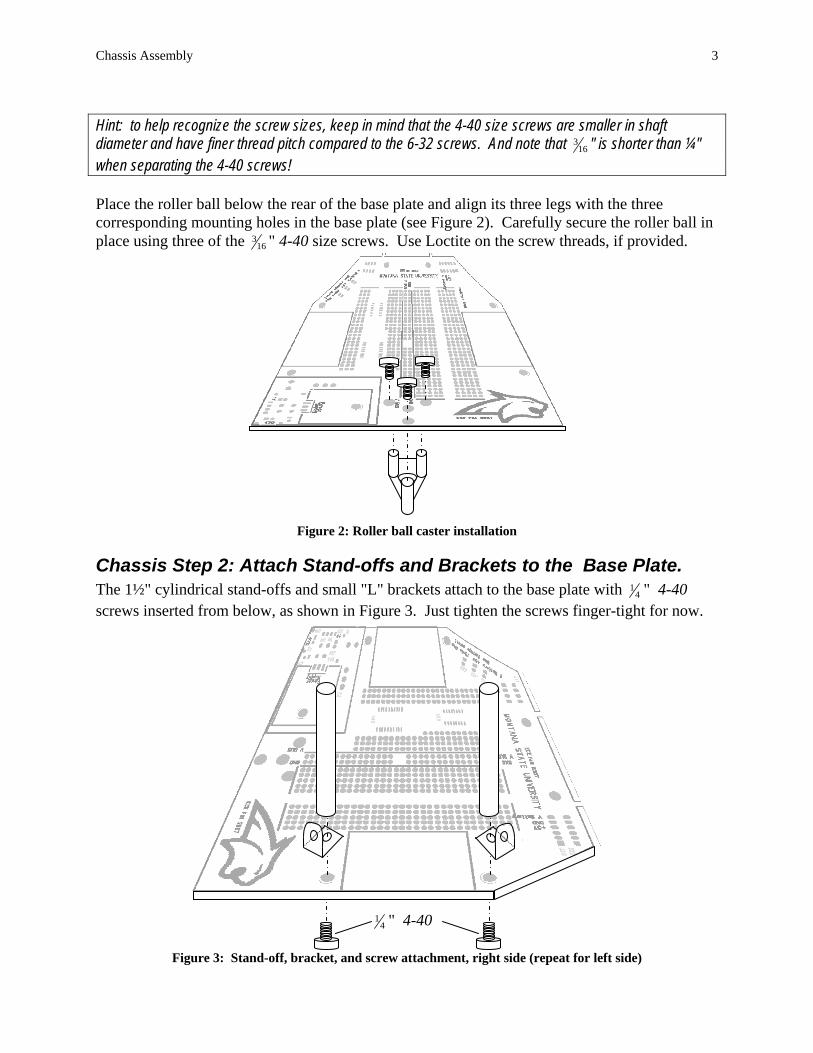
Chassis Assembly 3
Hint: to help recognize the screw sizes, keep in mind that the 4-40 size screws are smaller in shaft diameter and have finer thread pitch compared to the 6-32 screws. And note that 16
3 " is shorter than ¼" when separating the 4-40 screws! Place the roller ball below the rear of the base plate and align its three legs with the three corresponding mounting holes in the base plate (see Figure 2). Carefully secure the roller ball in
" 4-40 size screws. Use Loctite on the screw threads, if provided.
e Base Plate.
Figure 2: Roller ball caster installation
place using three of the 163
Chassis Step 2: Attach Stand-offs and Brackets to thThe 1½" cylindrical stand-offs and small "L" brackets attach to the base plate with 4
1 " 4-40 screws inserted from below, as shown in Figure 3. Just tighten the screws finger-tig t for nowh .
Figure 3: Stand-off, bracket, and screw attachment, right side (repeat for left side)
41 " 4-40

Chassis Assembly 4
Once the two right side stand-offs and brackets are installed, repeat for the two stand-offs and brackets on the left side. You won't be mounting the top PCB yet, so keep the 4 4-40 screws for the top of each stand-off either in your parts kit or temporarily screw them into the stand-offs for safe keeping.
Chassis Step 3: Mounting the Motors onto the L brackets Locate the two servo motors from your parts kit. Each servo motor attaches with two 16
3 " 4-40 screws using the small L brackets just installed in Step 2. Place the servo motor so that the axle position is toward the front of the robot, as shown in Figure 4. Insert a screw through the lower flange of the motor and line it up with the small "L" bracket sandwiched below the stand-offs. Now adjust the alignment of the motor, brackets, and stand-offs, then tighten (but do not overtighten) the screws—use Loctite liquid (if provided in the lab) on the stand-off screws and the motor screws.
Figure 4: Motor installation, right side (repeat for left side)
Chassis Step 4: Attach the Wheels The last step is to attach the wheels. Get the two wheels from the kit and attach each wheel to a servo axle. Secure the wheel to the servo with a small screw. Finally, place the rubber "tire" band onto each wheel. This completes the chassis construction steps. The printed circuit board, microcontroller board,
Note: axle position forward 16
3 " 4-40 screws go through motor flange and into
"L" bracket
bumper board, and batteries will be mounted during a later lab session.

20071001RCM
ASSEMBLING the
ECEbot
Bumper Switch Assembly
Due Date:
Prepared by R.C. Maher September 2007
Copyright © 2007 Department of Electrical and Computer Engineering, Montana State University
All Rights Reserved

Bumper Assembly 2
Small PCB Preliminaries
One way your robot can move autonomously from place to place is to have bumper switches on the front: if the robot hits something, the switch gets closed, and the robot's microcontroller can command the motors to back up and turn. Your robot will have two bumper switches mounted on the forward "L" brackets.
The bumper switch circuit boards you will assemble contain just a few components. The simple circuit diagram is shown below.
The switch is normally open. In this configuration the signal S2 is 'high' because the node is connected to +5 V (Vcc) through the 10 kΩ resistor: since no current flows in the resistor Ohm's Law says that the voltage across the resistor must be zero, so S2 must be at the same voltage as Vcc. If the switch gets bumped or pushed, the switch closes and S2 is pulled 'low' because that node is connected to 0 volts (ground) by the switch, and current flows through the 10 kΩ resistor from Vcc to ground.
The S2 signals from the left and right bumper switch sensors are connected to one of the digital input pins on the microcontroller. The program running on the microcontroller can test the state of the signal to see if it is high or low, and then take some action in response.
The bumper switch circuits consist of:
1 Small printed circuit board (rectangular) 2 10 kΩ ¼ watt resistors (Brown Black Orange Gold) 2 Large pushbutton switches 1 4-pin header set and 1 6-pin header set 4 ¼" 6-32 Phillips head screws 2 right angle brackets 2 hub flanges (from motor kits)
10 kΩ
Vcc = 5 V
S2
GND = 0 V
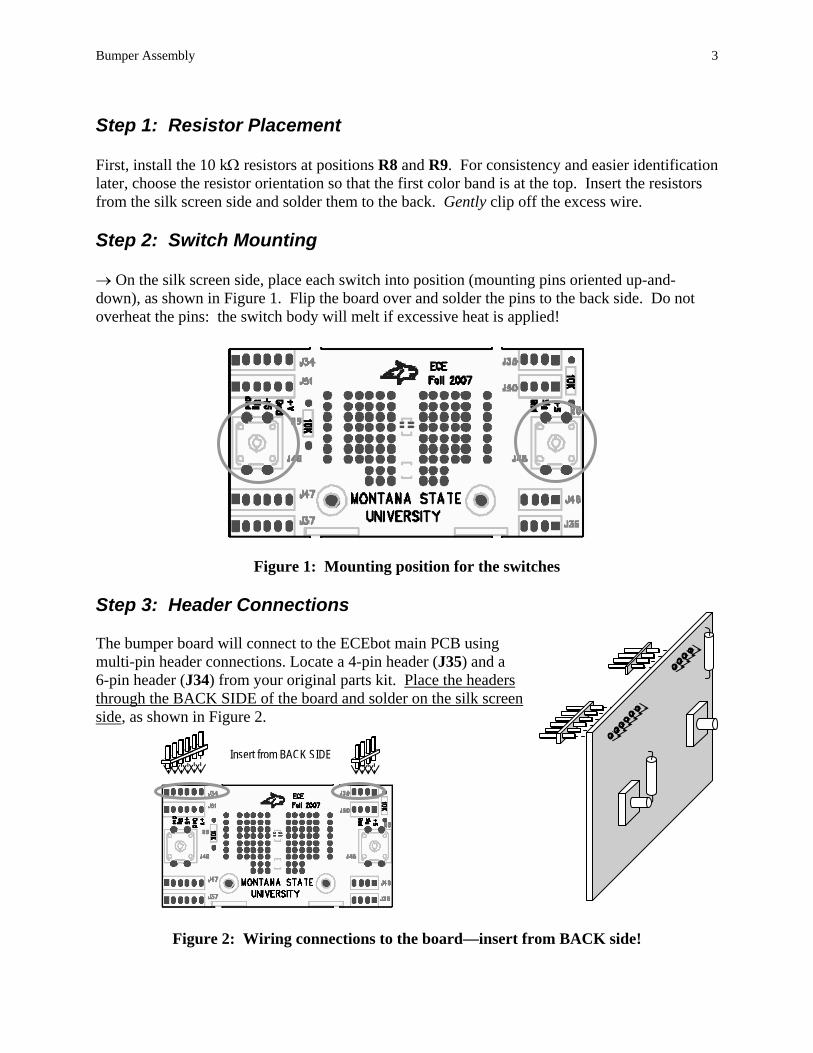
Bumper Assembly 3
Step 1: Resistor Placement
First, install the 10 kΩ resistors at positions R8 and R9. For consistency and easier identification later, choose the resistor orientation so that the first color band is at the top. Insert the resistors from the silk screen side and solder them to the back. Gently clip off the excess wire.
Step 2: Switch Mounting
→ On the silk screen side, place each switch into position (mounting pins oriented up-and-down), as shown in Figure 1. Flip the board over and solder the pins to the back side. Do not overheat the pins: the switch body will melt if excessive heat is applied!
Figure 1: Mounting position for the switches
Step 3: Header Connections
The bumper board will connect to the ECEbot main PCB using multi-pin header connections. Locate a 4-pin header (J35) and a 6-pin header (J34) from your original parts kit. Place the headers through the BACK SIDE of the board and solder on the silk screen side, as shown in Figure 2.
Insert from BACK SIDE
Figure 2: Wiring connections to the board—insert from BACK side!
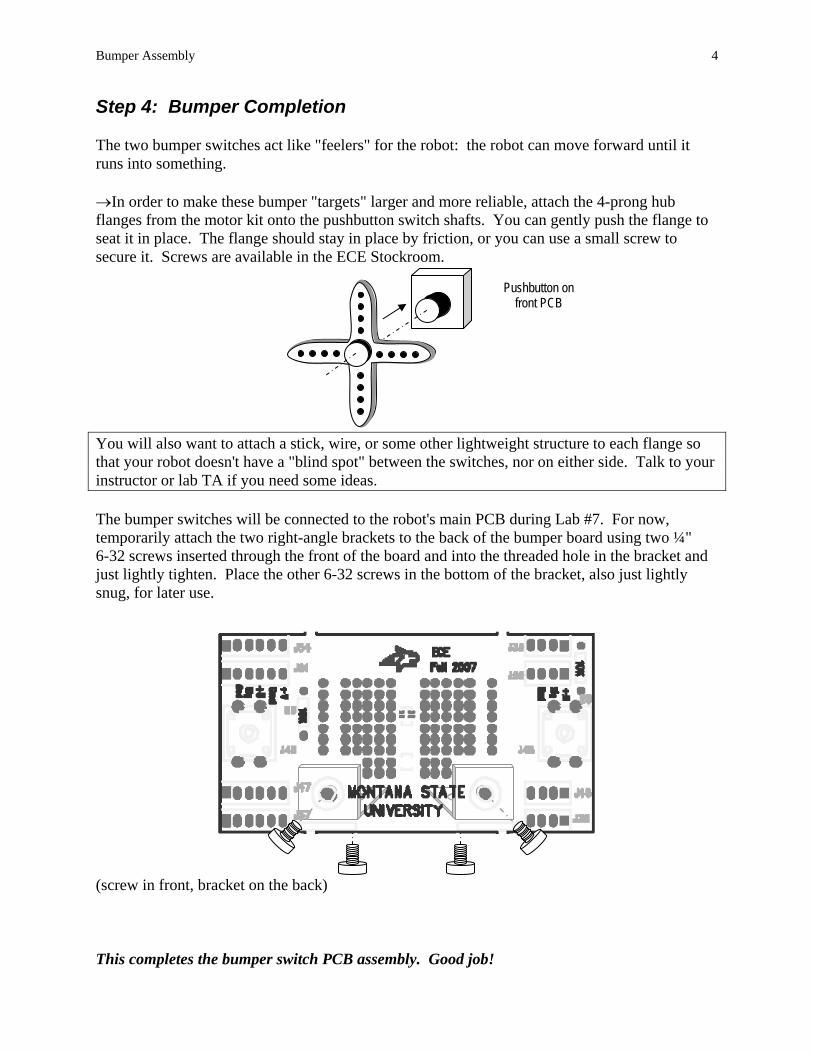
Bumper Assembly 4
Step 4: Bumper Completion
The two bumper switches act like "feelers" for the robot: the robot can move forward until it runs into something.
→In order to make these bumper "targets" larger and more reliable, attach the 4-prong hub flanges from the motor kit onto the pushbutton switch shafts. You can gently push the flange to seat it in place. The flange should stay in place by friction, or you can use a small screw to secure it. Screws are available in the ECE Stockroom.
You will also want to attach a stick, wire, or some other lightweight structure to each flange so that your robot doesn't have a "blind spot" between the switches, nor on either side. Talk to your instructor or lab TA if you need some ideas.
Pushbutton on front PCB
The bumper switches will be connected to the robot's main PCB during Lab #7. For now, temporarily attach the two right-angle brackets to the back of the bumper board using two ¼" 6-32 screws inserted through the front of the board and into the threaded hole in the bracket and just lightly tighten. Place the other 6-32 screws in the bottom of the bracket, also just lightly snug, for later use.
(screw in front, bracket on the back)
This completes the bumper switch PCB assembly. Good job!

EE 101 Fall 2007 Date: Lab Section #
Lab #7 Name:
Microcontroller and Motor Testing Partner:
Abstract
The ECEbot uses a microcontroller chip (self-contained computer) to perform various functions. The microcontroller module plugs into the 40-pin socket on the front of the main PCB. The microcontroller is used to read switch positions, illuminate digits on the LED display, and generate control signals for the robot's motors. This lab involves installing and testing the microcontroller and the motors for the robot's drive wheels.
Introduction and Theory
A microcontroller is a self-contained computer system that fits on a single chip. Microcontrollers are widely used as embedded processors inside cell phones, home appliances, automobiles, etc. Unlike a personal computer, microcontrollers are usually programmed once "back at the factory" and then do their job as part of a larger system. For example, a microwave oven typically uses a microcontroller to drive the visual indicators, monitor the pushbuttons, control the oven timing, and activate the "beep beep" to let you know your dinner is ready. Similarly, a microcontroller in your car engine monitors the air temperature, oxygen content, throttle position, RPMs, etc., and then determines the precise ignition and fuel injector timing for maximum power and minimum tailpipe emissions.
The ECEbot project uses a programmable microcontroller, the MC9S12C32, that is mounted on a small, surface-mount printed circuit board, the CSM module. Although in EE101 you will be using programs that we have already stored in the chip's Flash memory, you will learn in subsequent EE courses how to program this type of microcontroller to do almost anything you want.
Equipment
Your ECEbot circuit board with installed components, the servo motors and robot chassis components, the pre-programmed CSM microcontroller module, and the bench power supply, oscilloscope, multimeter, and banana cables furnished in the lab.
Procedures
P1. At this point you should have your ECEbot PCB finished up through all of the soldering steps, and the robot chassis assembled up through the motor mounting process.
Rev. 20071013RCM Copyright © 2007 Department of Electrical and Computer Engineering, Montana State University
Do NOT connect the motor cables or any other connections yet, and do not attach the PCB to the chassis until instructed below. This will allow you to test and verify the individual components one by one before assembling the entire system. Patience is an important part of engineering lab work: you need to verify the performance carefully and systematically in order to catch problems before they result in burned-out components!

7-2
→ First, make sure all 8 of the DIP switches are in the OFF position. If any are 'on,' use a plastic screwdriver (or your fingernail) to gently switch them to the off position.
→ Your PCB should have two 2-pin shorting jumpers installed. Check to see that:
In the lower left corner of the board, the jumper is installed on J21 to the right of the robot's on/off switch.
In the right center of the board, a jumper is installed on 2-pin header J3 just to the right of the potentiometer.
→ Set the DC bench supply to +10.5 volts using the DMM. Place a power pigtail connector on the J4 header power supply header, and apply the +10.5 V (red) to the left wire and the black (neutral) supply connection to the right wire. Flip the board’s power switch to the down (on) position. The power indicator LED (LED1, lower left corner of the board) should be illuminated. If not, turn off the power immediately and check your connections.
P2. → Now flip the board’s power switch to the up (off) position, and also TURN OFF THE DC BENCH SUPPLY. Make sure the power LED on the PCB is OFF. NEVER INSTALL OR REMOVE COMPONENTS WITH THE POWER ON!!
With power still OFF, hold the PCB so that the 7-segment display is at the top, and identify the 60-pin socket location. Discharge yourself of static electricity by touching your finger on the ground tab on the oscilloscope.
→ Slowly and carefully remove the microcontroller module from its wrapper. While keeping yourself grounded, align the 40 pins of the microcontroller to the left end of the 60-pin socket, and make sure that all of the pins are lined up with the receptacles.
Have your instructor or TA verify the orientation before carefully seating the module down into the socket.
Microcontroller positioned correctly: Instructor/TA initials
IT IS EASY TO BEND THE PINS ACCIDENTALLY, so be certain that each pin is aligned!
→ Verify that the DC Bench Supply is set for +10.5 volts, and then reconnect the power to the PCB with the proper polarity.
Turn on the power switch. The microcontroller should now be running! Look for the following:
The robot's power indicator LED (LED1, lower left) is illuminated. The side LEDs (LED4, left, and LED5, right) are blinking on and off. The 4-digit LED display counts through a sequence of numbers and then tests each digit.
Note any malfunctions: immediately turn off the power and seek help from the instructor or TA.

7-3
P3. → Using a plastic screwdriver or your fingernail, gently slide the both the number 1 DIP switch and the number 3 DIP switch to the 'on' position. Leave the other six switches in the off position. Then press and release the RESET button on the microcontroller module. This causes the microcontroller to generate two control signals to the 3-pin motor headers J7 (Left Motor) and J13 (Right Motor).
→ Connect CH1 of the oscilloscope to observe the waveform on the top pin of J7 (Left Motor), and connect CH2 of the scope to observe the top pin of J13 (Right Motor). Connect the ground clips to the ground pin J24. View the CH1 and CH2 waveforms separately, since they are not triggered synchronously.
Determine the frequency and duty cycle of the two different waveforms. Describe, using complete sentences, what is similar and what is different about the two signals. Also, sketch the two signals on the same scale.
CH1: Left motor signal frequency Duty cycle
CH2: Right motor signal frequency Duty Cycle
P4. Now disconnect the oscilloscope and turn the power off from the DC bench supply.
→ Hold the PCB on top of the chassis tubular spacers and insert ¼" 4-40 screws down through the PCB and into the tubular spacers so that the 4-digit display is toward the front and the voltage regulator is toward the back (over the caster).
Jiggle the orientation until the screws and standoff holes line up. Gently tighten the mounting screws just until they are snug.
Caster (below)
4-digit Display
Tubular spacers
Screws
PCB
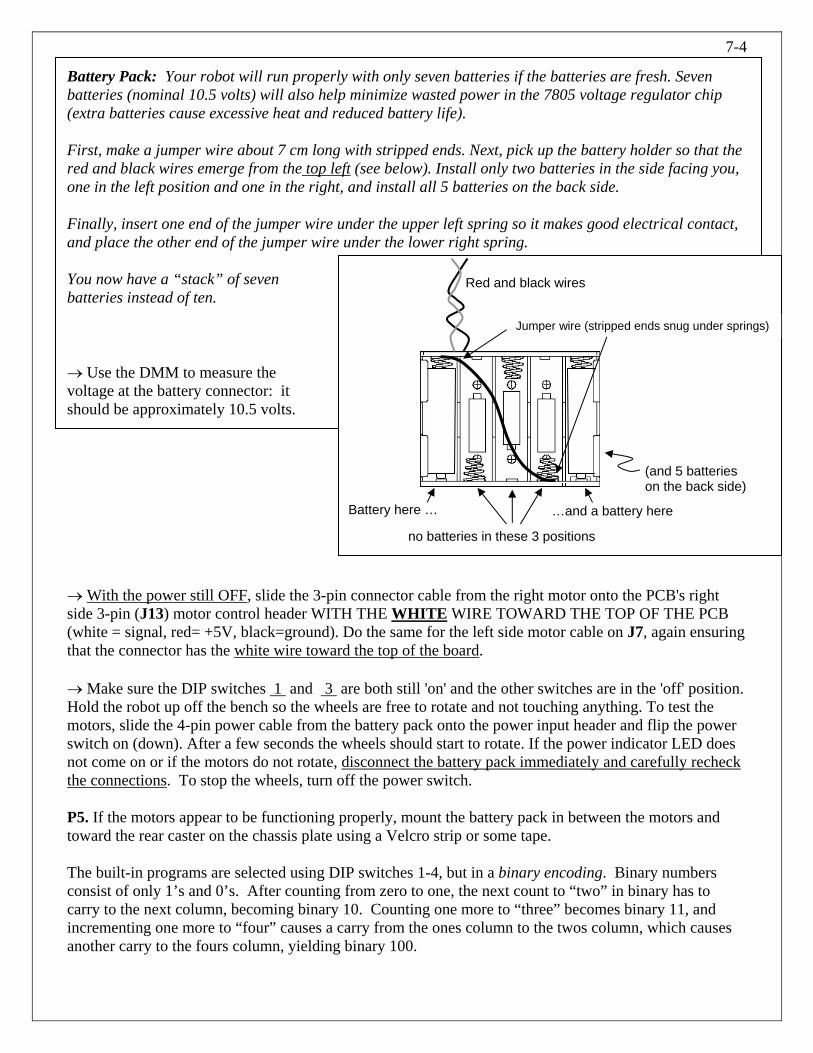
7-4
Battery Pack: Your robot will run properly with only seven batteries if the batteries are fresh. Seven batteries (nominal 10.5 volts) will also help minimize wasted power in the 7805 voltage regulator chip (extra batteries cause excessive heat and reduced battery life).
First, make a jumper wire about 7 cm long with stripped ends. Next, pick up the battery holder so that the red and black wires emerge from the top left (see below). Install only two batteries in the side facing you, one in the left position and one in the right, and install all 5 batteries on the back side.
Finally, insert one end of the jumper wire under the upper left spring so it makes good electrical contact, and place the other end of the jumper wire under the lower right spring.
You now have a “stack” of seven batteries instead of ten.
Red and black wires
Jumper wire (stripped ends snug under springs)
no batteries in these 3 positions
…and a battery here Battery here …
→ Use the DMM to measure the voltage at the battery connector: it should be approximately 10.5 volts.
(and 5 batteries on the back side)
→ With the power still OFF, slide the 3-pin connector cable from the right motor onto the PCB's right side 3-pin (J13) motor control header WITH THE WHITE WIRE TOWARD THE TOP OF THE PCB (white = signal, red= +5V, black=ground). Do the same for the left side motor cable on J7, again ensuring that the connector has the white wire toward the top of the board.
→ Make sure the DIP switches 1 and 3 are both still 'on' and the other switches are in the 'off' position. Hold the robot up off the bench so the wheels are free to rotate and not touching anything. To test the motors, slide the 4-pin power cable from the battery pack onto the power input header and flip the power switch on (down). After a few seconds the wheels should start to rotate. If the power indicator LED does not come on or if the motors do not rotate, disconnect the battery pack immediately and carefully recheck the connections. To stop the wheels, turn off the power switch.
P5. If the motors appear to be functioning properly, mount the battery pack in between the motors and toward the rear caster on the chassis plate using a Velcro strip or some tape.
The built-in programs are selected using DIP switches 1-4, but in a binary encoding. Binary numbers consist of only 1’s and 0’s. After counting from zero to one, the next count to “two” in binary has to carry to the next column, becoming binary 10. Counting one more to “three” becomes binary 11, and incrementing one more to “four” causes a carry from the ones column to the twos column, which causes another carry to the fours column, yielding binary 100.

7-5
Note that DIP switches 5 through 8 are not monitored by the microcontroller.
The mode settings, binary representations, and switch settings are shown in the table below.
DIP Switches Decimal Binary 1 2 3 4 Program
0 0000 OFF OFF OFF OFF Test LED display 1 0001 ON OFF OFF OFF Analog-to-Digital display (potentiometer) 2 0010 OFF ON OFF OFF Forward 5 seconds and stop 3 0011 ON ON OFF OFF Forward and backward repeatedly 4 0100 OFF OFF ON OFF “Dance” motion 5 0101 ON OFF ON OFF Forward, hit bumper, backup and turn 6 0110 OFF ON ON OFF User download command mode 7 0111 ON ON ON OFF “Figure-8” motion 8 1000 OFF OFF OFF ON (Not Assigned) 9 1001 ON OFF OFF ON ″
10 1010 OFF ON OFF ON ″ 11 1011 ON ON OFF ON ″ 12 1100 OFF OFF ON ON ″ 13 1101 ON OFF ON ON ″ 14 1110 OFF ON ON ON ″ 15 1111 ON ON ON ON ″
You are now ready to try three of the built-in test programs: • 5 seconds forward test (mode 2): First, find an open space in the lab or out in the hallway and set your
ECEbot on the floor. For this test, turn DIP switch number 2 to the 'on' position and make sure all of the other DIP switches are in the OFF position. Turn the power switch on. The robot should move forward for about 5 seconds and then automatically stop. To repeat the test, reposition the robot and press the RESET button.
• Forward/Backward test (mode 3): Turn both DIP switches number 1 and 2 to the 'on' position and make sure all of the other DIP switches are in the 'off' position. Press the RESET button. The robot should move forward and backward a short distance over and over continuously until you turn the power off.
• ECEbot dance test (mode 4): Turn DIP switch number 3 to the 'on' position and make sure all of the other DIP switches are in the 'off' position. Press the RESET button. The robot should do a sequence of forward movements and turns over and over endlessly until you turn the power off.
When you have completed the tests, be sure to turn off the power switch to keep the batteries from running down.
P6. → To help support the microcontroller module, carefully install the ½" 4-40 screw, threaded spacer, and 4-40 nuts, as shown here:

7-6
→ The Bumper board attaches to the front of the PCB. Attach the lower edge of the bumper board to the L-brackets on the chassis below using ¼" 6-32 screws.
→ Test the bumper switches by using the DMM to measure the voltage between pins 2 and 3 of J2 (left bumper), and between pins 2 and 3 of J9 (right bumper), as shown in the figure below. Turn on the power and verify that the voltage is normally 5 V, and becomes zero volts while the corresponding bumper switch is pressed. Ask your instructor/TA for assistance if this does not work.
Now verify that the microcontroller can monitor the bumpers.
→ Select program 4 (dance mode) using the DIP switches (OFF, OFF, ON, OFF) and hit the reset button. The microcontroller is also monitoring the bumper switches: if you hit either switch, the robot should stop. If not, you need to check the switch connections, cables, and connections. Seek help from the instructor/TA if necessary.
→ Finally, run program 5 (ON OFF ON OFF) to make sure your robot is functional with its bumper switches: your robot should move forward until one of the switches hits an object. If the left switch is hit the robot should stop, back up, and turn right. On the other hand, if the right switch is hit the robot should stop, back up, and turn left. Try this out in the hallway.
Motor and switch inspection: Instructor/TA initials
Congratulations to you (and your robot) for making it this far. Excellent!
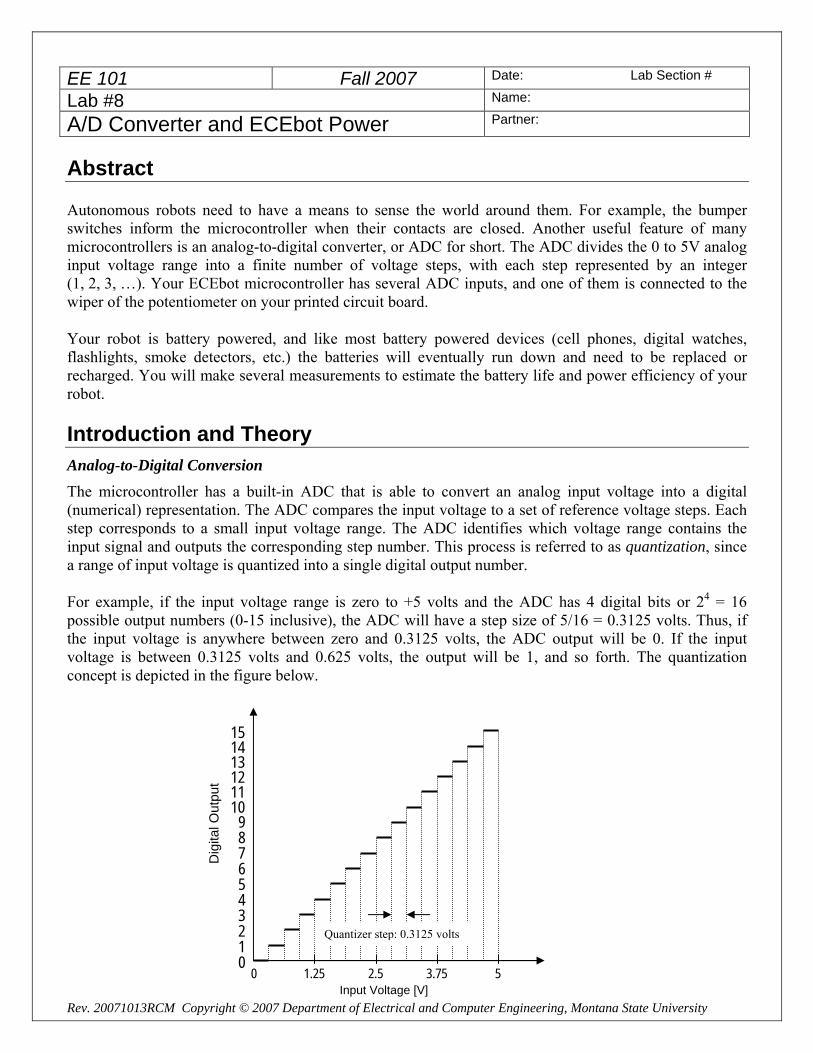
EE 101 Fall 2007 Date: Lab Section #
Lab #8 Name:
A/D Converter and ECEbot Power Partner:
Abstract
Autonomous robots need to have a means to sense the world around them. For example, the bumper switches inform the microcontroller when their contacts are closed. Another useful feature of many microcontrollers is an analog-to-digital converter, or ADC for short. The ADC divides the 0 to 5V analog input voltage range into a finite number of voltage steps, with each step represented by an integer (1, 2, 3, …). Your ECEbot microcontroller has several ADC inputs, and one of them is connected to the wiper of the potentiometer on your printed circuit board.
Your robot is battery powered, and like most battery powered devices (cell phones, digital watches, flashlights, smoke detectors, etc.) the batteries will eventually run down and need to be replaced or recharged. You will make several measurements to estimate the battery life and power efficiency of your robot.
Introduction and Theory Analog-to-Digital Conversion The microcontroller has a built-in ADC that is able to convert an analog input voltage into a digital (numerical) representation. The ADC compares the input voltage to a set of reference voltage steps. Each step corresponds to a small input voltage range. The ADC identifies which voltage range contains the input signal and outputs the corresponding step number. This process is referred to as quantization, since a range of input voltage is quantized into a single digital output number.
For example, if the input voltage range is zero to +5 volts and the ADC has 4 digital bits or 24 = 16 possible output numbers (0-15 inclusive), the ADC will have a step size of 5/16 = 0.3125 volts. Thus, if the input voltage is anywhere between zero and 0.3125 volts, the ADC output will be 0. If the input voltage is between 0.3125 volts and 0.625 volts, the output will be 1, and so forth. The quantization concept is depicted in the figure below.
Input Voltage [V]
Dig
ital O
utpu
t
0 1 2 3 4 5 6 7 8 9
10 11 12 13 1415
Quantizer step: 0.3125 volts
0 1.25 2.5 3.75 5
Rev. 20071013RCM Copyright © 2007 Department of Electrical and Computer Engineering, Montana State University

8-2
The ADC is a useful way for a digital processor such as the ECEbot microcontroller to receive input from the outside world. In this lab you will be measuring the voltage divider produced by a potentiometer voltage divider, but the ADC could just as easily be measuring a voltage produced by a temperature sensor, an optical detector, a demodulated radio signal, or any other voltage within the range of the device.
The ADC results in this lab will be displayed with 8 digital bits of precision. 8 bits yields 28 = 256 different voltage steps, ranging 0-255.
Battery Power Considerations Modern electronic equipment is usually designed to minimize the total power dissipated in the circuitry. Power is the rate at which energy is consumed. The SI unit of energy is the joule, and the unit of power is the watt (joules per second). For direct current circuits we can determine the power as the product of the input voltage multiplied by the input current:
wattssecondjoules
secondcoulomb
coulombjoules DCamps DCvolts
secondcoulombampere,
coulombjoulesvolt
==⋅=×
==
For example, if a 5 kΩ resistor has 5 V across it, the current through the resistor is given by Ohm's Law: I = V/R = 5/5kΩ = 1 milliamp (mA). The power dissipated in the resistor is P = VI = 5 milliwatts (mW). The power is dissipated in the form of heat. Sometimes the conversion of electrical energy into heat is deliberate, like in the heating element of a toaster, but in low-power circuits the heat is a waste byproduct of the electronics.
Incidentally, you can use Ohm's Law and the power expression to show that P = VI = V2/R = I2R.
We can determine the power consumption of the ECEbot by measuring the DC voltage and the DC (average) current drawn from the batteries under various load conditions.
As we know, batteries come in various shapes and sizes and load capacities. Batteries are sometimes specified with a milliamp-hour (mA·H) rating. Since mA·H has units of amperes × time, it is actually proportional to the coulombs of charge available in the battery.
A battery's mA·H rating can be interpreted roughly as the current that can be drawn from the battery for one hour before the battery will be used up. Reducing the current by half would make the battery life 2 hours, while increasing the current would consume the battery more quickly. This makes the mA·H rating a useful rule-of-thumb. However, the capacity of a battery in real life is actually much more complicated since the capacity will vary with the actual load current, temperature, and the "cutoff voltage" at which the attached circuitry stops functioning.
The AA 1.5 V alkaline batteries used in the ECEbot are typically rated at least 2,000 mA·H (=2 amp-hours), corresponding to 7200 coulombs. 1.5 volts multiplied by 7200 coulombs yields a total of 10,800 joules of energy available from the battery.
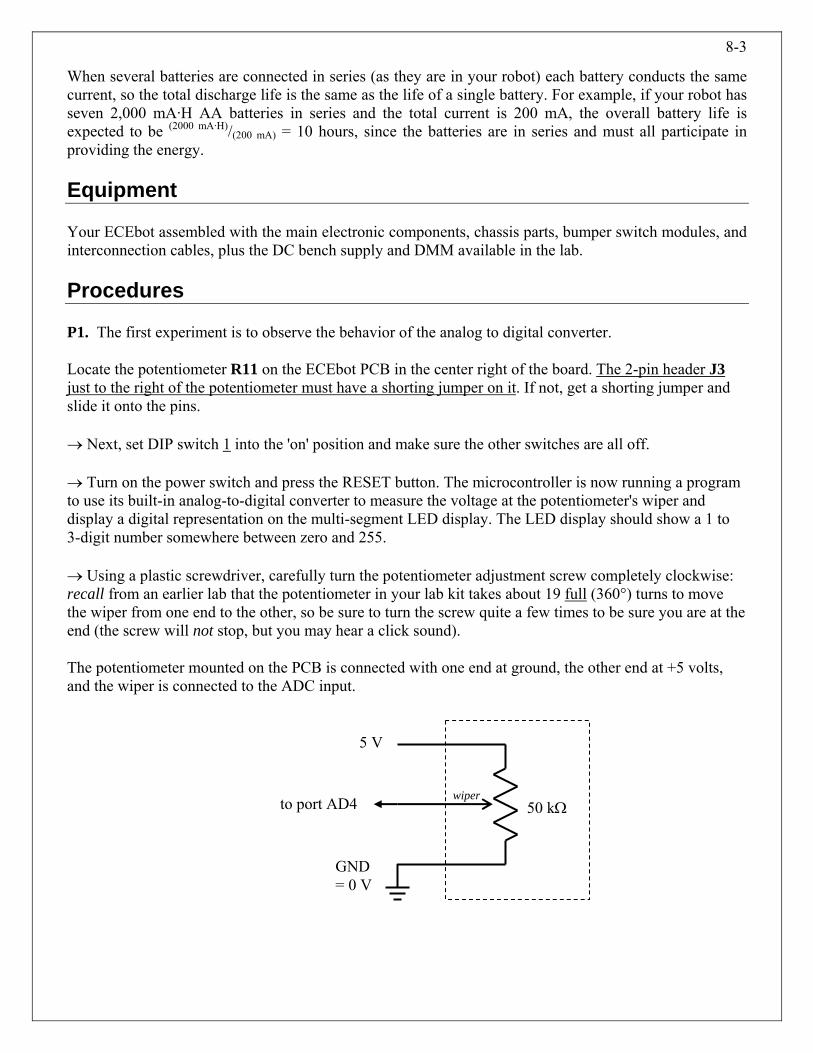
8-3
When several batteries are connected in series (as they are in your robot) each battery conducts the same current, so the total discharge life is the same as the life of a single battery. For example, if your robot has seven 2,000 mA·H AA batteries in series and the total current is 200 mA, the overall battery life is expected to be (2000 mA·H)/(200 mA) = 10 hours, since the batteries are in series and must all participate in providing the energy.
Equipment
Your ECEbot assembled with the main electronic components, chassis parts, bumper switch modules, and interconnection cables, plus the DC bench supply and DMM available in the lab.
Procedures
P1. The first experiment is to observe the behavior of the analog to digital converter.
Locate the potentiometer R11 on the ECEbot PCB in the center right of the board. The 2-pin header J3 just to the right of the potentiometer must have a shorting jumper on it. If not, get a shorting jumper and slide it onto the pins.
→ Next, set DIP switch 1 into the 'on' position and make sure the other switches are all off.
→ Turn on the power switch and press the RESET button. The microcontroller is now running a program to use its built-in analog-to-digital converter to measure the voltage at the potentiometer's wiper and display a digital representation on the multi-segment LED display. The LED display should show a 1 to 3-digit number somewhere between zero and 255.
→ Using a plastic screwdriver, carefully turn the potentiometer adjustment screw completely clockwise: recall from an earlier lab that the potentiometer in your lab kit takes about 19 full (360°) turns to move the wiper from one end to the other, so be sure to turn the screw quite a few times to be sure you are at the end (the screw will not stop, but you may hear a click sound).
The potentiometer mounted on the PCB is connected with one end at ground, the other end at +5 volts, and the wiper is connected to the ADC input.
50 kΩ to port AD4
5 V
GND = 0 V
wiper
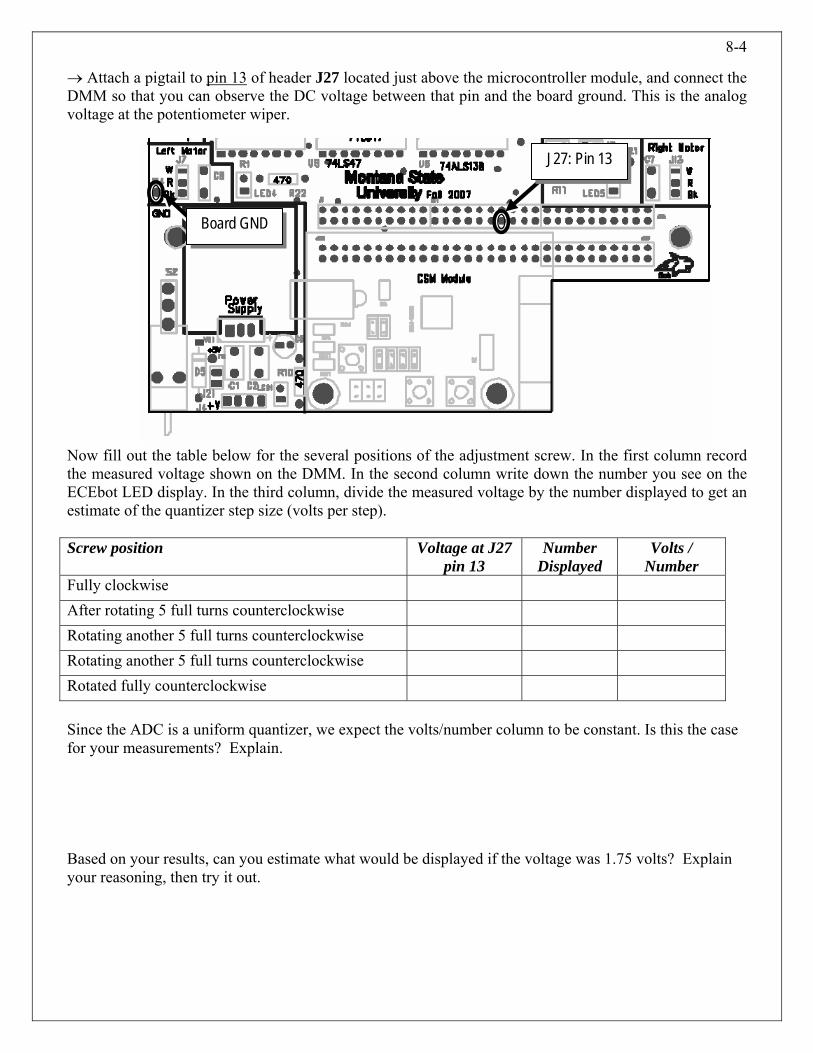
8-4
→ Attach a pigtail to pin 13 of header J27 located just above the microcontroller module, and connect the DMM so that you can observe the DC voltage between that pin and the board ground. This is the analog voltage at the potentiometer wiper.
Now fill out the table below for the several positions of the adjustment screw. In the first column record the measured voltage shown on the DMM. In the second column write down the number you see on the ECEbot LED display. In the third column, divide the measured voltage by the number displayed to get an estimate of the quantizer step size (volts per step). Screw position Voltage at J27
pin 13 Number
Displayed Volts /
Number Fully clockwise After rotating 5 full turns counterclockwise Rotating another 5 full turns counterclockwise Rotating another 5 full turns counterclockwise Rotated fully counterclockwise
Since the ADC is a uniform quantizer, we expect the volts/number column to be constant. Is this the case for your measurements? Explain.
Based on your results, can you estimate what would be displayed if the voltage was 1.75 volts? Explain your reasoning, then try it out.
J27: Pin 13
Board GND

8-5
P2. In this exercise you will measure the current required by the ECEbot in several different operating modes. We will use the bench power supply instead of the batteries in order to simplify the electrical connections.
→ Set the DC bench power supply to 10.5 volts using the DMM to verify the voltage.
→ Remove the meter cables, switch the DMM to measure current, and place the red cable into the current receptacle (fused), and the black cable into the common (COM) receptacle.
→ Place a dual pigtail on your robot's power connector and attach the DMM in series with the positive (red) power supply lead in order to measure the power supply current entering the robot PCB.
DMM (DC Amps)
PCB
Set the robot DIP switch for mode 0 (all switches off) and press RESET. Observe the supply current. Does the current vary as the LEDs turn on and off? What is the current during the multi-digit segment test sequence? What is the maximum and minimum current? Comment on your observations using complete sentences.
DC Bench Supply: 10.5V
(Black)
(Red)
(Plug)
(Red or Orange)
(Black or Gray)

8-6
Next, set the DIP switch for mode 1 (switch 1 on, all others off) and press RESET. What is the supply current in this mode? What happens if you turn the potentiometer and change the digits displayed?
Now set the DIP switches for mode 5 , hold your robot so that the wheels can turn freely, and press RESET. What is the supply current with the motors running? What happens if you press one of the bumper switches so that the motors reverse direction?
Estimate the battery life in modes 0, 1, and 5, based on the typical current observed and assuming a 2,000 mA·H battery capacity.
Finally, estimate the battery life if your robot spends ⅓ of the time in mode 0, ⅓ of the time in mode 1, and ⅓ of the time in mode 5, again assuming 2,000 mA·H battery capacity. Hint: use the average current.

EE 101 Spring 2007 Date: Lab Section #
Lab #9 Name:
Simultaneous Equations No Partners this week.
Abstract
This lab exercise provides the opportunity to practice assembling and solving linear sets of equations.
Introduction and Theory
Refer to the Chapter 7: Solving Linear Systems of Equations of the note set for a review of linearequations and basic solution techniques.
Equipment
Matlab to generate two graphs and to solve a system of equations that describes current flow in a resistivecircuit.
Procedures
P1: Consider the following set of linear equations:
2y = 11x (1)
5.5x = y - 12 (2)
Rearrange the equations in a form to be used in a matrix description such that the variables are inalphabetical order on the left hand side of the equation and constants are on the right side.
Equation 1: _________________________
Equation 2:_________________________
The matrix form of the two equation set is (fill in the blanks):
__ __ x __=
__ __ y __
Using the space provided on the next page, compute the determinant of the coefficient matrix by hand.You must show all steps to receive credit.

2
Based on your evaluation of the determinant, does the system of equations have a unique solution?
ANSWER: ______________
P2: Consider again the same two equations of P1. Solve the equations for y.
Equation 1: _________________________
Equation 2:_________________________
Create a Word document with a heading that includes:
NameLab Section NumberDateLab 9 Addendum
Use MatLab to plot the two equations on the same graph in the range of –10 x 10 using 0.1increments for x. Make certain to place a descriptive title on your plot and to label the plot axes. Pastethe plot in a Word document. Below the plot, enter the following caption:
“Figure 1: A graph of the two linear equations of part P1.”
Based on your plot, do you believe the system of equations has a unique solution? ________________
Explain the reasoning underlying your response:

3
P3: Consider the following set of linear equations:
1-y = -2x (3)
2y = -1.6x + 30 (4)
Rearrange the equations in a form to be used in a matrix description such that the variables are inalphabetical order on the left hand side of the equation and constants are on the right side.
Equation 1: _________________________
Equation 2:_________________________
The matrix form of the two equation set is (fill in the blanks):
__ __ x __=
__ __ y __
Using the space provided on the next page, compute the determinant of the coefficient matrix by hand.You must show all steps to receive credit.
Based on your evaluation of the determinant, does the system of equations have a unique solution?
ANSWER: ______________
P4: Consider again the same two equations of P3. Solve the equations for y.
Equation 3: _________________________
Equation 4:_________________________

4
Use MatLab to plot the two equations on the same graph in the range of –10 x 10 using 0.1increments for x. Make certain to place a descriptive title on your plot and to label the plot axes. Pastethe plot into your Word document. Below the plot, enter the following caption:
“Figure 2: A graph of the two linear equations of part P3.”
Based on your plot, do you believe the system of equations has a unique solution? ________________
Explain the reasoning underlying your response:
P5: Consider the following electrical circuit.
2
3
i
i
1i
3R
2R
1R
V
Using KVL, sum the voltages around the loop containing the battery, R1 and R2. Write your equation interms of the battery voltage V, resistors R1, R2 and R3 and the unknown currents i1,i2 and i3 as appropriate.
(1)
Using KVL, sum the voltages around the loop containing the voltage source, R1 and R3. Write yourequation in terms of the battery voltage V, resistors R1, R2 and R3 and the unknown currents i1,i2 and i3 asappropriate.
(2)
Using KVL, sum the voltages around the loop containing R2 and R3. Write your equation in terms of thebattery voltage V, resistors R1, R2 and R3 and the unknown currents i1,i2 and i3 as appropriate.
(3)

5
Cast your equations into matrix form by filling in the blanks below. Note your equations must beproperly ordered!
1
2
3
__ __ __ i ____ __ __ i = ____ __ __ i __
Assume that: R1 = 100 Ω, R2 = 1 kΩ, R3 = 500 Ω and V = 5 V. Substitute these values into the matrixarrangement below.
1
2
3
__ __ __ i ____ __ __ i = ____ __ __ i __
Calculate the determinant of the coefficient matrix by hand. Show your work.
Use Matlab to verify your results. Attach the Matlab command lines and their result in your Worddocument. Identify the code with: “P5: Determinant of the original coefficient matrix.”

6
Based on your calculation of the determinant of the coefficient matrix, does your assembled set ofequations have a unique solution?
ANSWER____________________
Perhaps this is a surprising result. Let’s see if we can explain.
Solve equation (1) of part P5 for i1 (do not substitute any numbers, retain expression in terms ofvariables).
Substitute this result into equation (2) and solve for i2 in terms of i3.
Compare this result to equation (3). Explain the significance of your finding.
Let’s create a new equation, calling it equation (4), by applying KCL at one of the circuit nodes thatincludes all three unknown currents.
(4)
Now replace the third row of your matrix equation (both the third row of the coefficient matrix and thethird row of the column vector of constants), thus creating the new matrix equation that follows:
1
2
3
__ __ __ i ____ __ __ i = ____ __ __ i __

7
Calculate the determinant of the coefficient matrix by hand. Show your work.
Use Matlab to verify your results. Attach the Matlab command lines and their result in your Worddocument. Identify the code with: “P5: Determinant of the revised coefficient matrix.”
Based on your calculation of the determinant of the coefficient matrix, does your assembled set ofequations have a unique solution?
ANSWER____________________
You are now to use Cramer’s method to calculate a value for i2. Using numerical values, assemble theappropriate 3x3 matrix to determine i2.
__ __ ____ __ ____ __ __
Calculate the determinant of this 3x3 matrix by hand. Show your work.

8
Calculate i2. Show your work.
Create a Matlab script to calculate i1, i2 and i3 using the “A\B method” described in the note set. Attachyour Matlab script, with a descriptive title, and its output (showing the values of i1, i2 and i3) to your Lab9 addendum.

EE 101 Spring 2007 Date: Lab Section #
Lab #10 Name:
Control and Motion Sequencing Partner: NO PARTNERS THIS WEEK
Abstract
The ECEbot microcontroller has been pre-programmed for some simple motion control strategies. For example, you have seen how the bumper switches allow the robot to detect a collision, back up, turn, and then continue. In this lab a different control strategy is used: a list of motion commands is loaded into the microcontroller's memory, then executed one after the other. Much more complicated motion control programs are possible, but the simple methods can serve as building blocks.
Introduction and Theory
The microcomputer used in your robot is known as a microcontroller because it includes input/output pins for monitoring and controlling external devices, like switches and motors. We do not have enough time in EE101 to learn all the details of computer programming, but in this experiment you will determine a set of motion control instructions using a PC, download the instructions into your robot's memory, then observe and verify the resulting behavior.
Digital computers, such as the microcontroller that is part of your robot, execute a series of machine instructions. Each machine instruction causes data to be moved from one location to another inside the processor's memory, an arithmetic operation to occur, a logical test of some sort to determine the next instruction, or some combination of these actions. A computer programmer can write a sequence of instructions, called a computer program, directly using these native machine instructions, or more commonly using a high-level language that is easier to understand and maintain.
Digital computers perform arithmetic and logic operations on binary numbers. Unlike the base-10 (decimal) number system we use for most hand calculations, the binary number system is base-2.
Base-10 (or decimal): each column contains digits 0-9, and each column is weighted by 10n.
1000's 100's 10's 1's 103 102 101 100
Base-2 (or binary): each column contains digits 0-1, and each column is weighted by 2n.
8's 4's 2's 1's 23 22 21 20
Binary counting is appropriate because digital computers use electronic switches (transistors) that are either 'on' or 'off'. If we choose the 'on' and 'off' states to correspond to the '1' and '0' of the binary system, we can implement arbitrary arithmetic and logic functions using collections of transistor switches.
Rev. 20071014RCM Copyright © 2007 Department of Electrical and Computer Engineering, Montana State University
We can convert between decimal and binary by selecting the appropriate combination of digits and columns so that the numerical values match. For example, to convert 5 from Base-10 into Base-2, we first choose the largest column in Base-2 that does not exceed the numerical value: 5 is bigger than 4 but less than 8, so the most significant binary digit (or bit for short) is in the 4's column. The remainder between 5

10-2
and 4 is 1, so we also need a 1 in the 1's column. Thus, 510 = 1012 . Similarly, we can convert from binary to decimal by adding up the binary column weights. For example, 110102 = 1×16 + 1×8 + 0×4 + 1×2 + 0×1 = 2610 .
Binary bits are typically collected into groups of 8: a group of 8 bits is called a byte. Computers may also use collections of several bytes, which is known as a binary word. A word may contain two bytes (16 bits), three bytes (24 bits), four bytes (32 bits), or some other number chosen by the hardware designer.
One practical problem with writing numbers in binary is that it is difficult for humans to see whether or not two strings of bits match. For example, consider the following 16-bit numbers:
0110111010110101 and 0110111010100101
They do differ, but it is hard to notice with a quick glance. If we separate the 16-bit strings into smaller groups, say, groups of four, the difference is more noticeable.
0110 1110 1011 0101 and 0110 1110 1010 0101
By noticing that groups of four bits can represent 16 different combinations, it is reasonable to express the groups using base-16. In a rather unfortunate combination of Greek and Roman terms, base-16 is referred to as hexadecimal, or just hex for short. Since we need 16 symbols and there are only 10 decimal digits (0-9), hexadecimal number use the letters A-F for the additional digits.
Binary Hex Binary Hex Binary Hex Binary Hex 0000 0 0100 4 1000 8 1100 C 0001 1 0101 5 1001 9 1101 D 0010 2 0110 6 1010 A 1110 E 0011 3 0111 7 1011 B 1111 F
Thus, the two 16-bit strings from above when expressed in hex become:
6 E B 5 and 6 E A 5
and the difference is now more clearly visible.
In addition to storing numerical values, computers also use binary storage to hold encoded data. That is, there may be sub-groups of bits within a byte or word that represent different pieces of information. For example, we could invent a compact representation of the 26 capital letters A-Z and the period, comma, colon, semicolon, exclamation point, and question mark (total of 32 symbols) using 5 bits (25 = 32). If we then use three bits to indicate bold, italic, underline, we could pack the information into a single byte.
Bold Italic
Underline Letter Code
(5 bits= 32 symbols)
7 6 5 4 3 2 1 0

10-3
Computers don't typically use this particular text representation, but the encoding concept can be helpful in several different applications. As another example, the pre-installed software in your robot's microcontroller is designed to understand a set of specially coded commands.
The robot understands six commands, as shown in the table below. Since there are six commands, we need at least 3 bits to represent which command is to be used. Three bits can actually represent 8 commands, so two of the possible codes are not needed (extra Sleep modes!).
Command Code Forward 000 Left 001 Right 010 Back Up 011 Sleep 100 (Sleep) 101 (Sleep) 110 HALT 111
The microcontroller can operate on 16-bit words, so with three bits reserved for the command code there are 13 bits remaining in one word. The 13 bits are used to represent the number of milliseconds (0.001 seconds) in duration. 13 bits can represent 213 numbers, 0 through 8191, so each command can have a duration of up to 8.191 seconds. The encoded data format is shown below.
In order for the robot to use the encoded commands, the data must be loaded into a specific place within the microcontroller's memory. You will download the commands to the robot from a PC using a serial data cable.
You will use a pre-written spreadsheet program to create the command sequence. The spreadsheet will take the encoded commands and combine them with the address (memory location) and some special download commands. For example, if it is desired to have the robot perform the sequence:
1. Forward for 1 second 0000 0011 1110 1000 hex: 03E8 2. Right for 2 seconds 0100 0111 1101 0000 hex: 47D0 3. Back Up for 2.375 seconds 0110 1001 0100 0111 hex: 6947 4. HALT 1110 0000 0000 0000* hex: E000
(*note that the duration of the HALT command is irrelevant)
The spreadsheet would create the following command string (shown in hexadecimal): Data Data Data Data
0D A2 3E00 03 A2 3E01 E8 A2 3E02 47 A2 3E03 D0 etc.
"Start download"
code (0D)
"Set memory" code (A2)
Memory addresses
Command (3 bits=
8 symbols)
Duration in msec (13 bits=
8192 symbols)
15 14 13 12 11 10 9 8 7 6 5 4 3 2 1 0
10-4
Equipment
Your ECEbot assembled with the main electronic components, chassis parts, bumper switch modules, and interconnection cables, plus the programming software, special serial cable, and PC located in the lab.
Procedures
P1. First of all, take several measurements to determine how fast your robot travels (distance per time, e.g., feet per second or centimeters per second). Can you think of a convenient way to do this in the lab room? One idea would be to set your robot for mode 5 (DIP switches 1 and 3 on) and use a wristwatch to measure how long it takes the robot to travel a known distance. The floor tiles in the hallway are 1 foot by 1 foot and make a pretty good ruler. Another approach would be to measure the circumference of one of the robot's wheels, then observe how many rotations occur in a certain time interval as the robot rolls along.
Choose one of these methods--or think of your own method--and record your robot's forward speed. Each robot will be slightly different. Explain your method and your results using complete sentences.
P2. → Each student needs to get the ECEbot Lab spreadsheet and copy it into an accessible project folder on the PC: name it with your initials.
→ Launch Excel and open the Lab spreadsheet. If you are sharing a computer, each student should open his or her own instance (window) of the spreadsheet. Save each instance with your initials to keep them straight.
→ Use the spreadsheet controls to create a sequence consisting of the following five commands:
a. Forward for 3 seconds b. Right for 1 second c. Left for 1 second d. Backward for 3 seconds e. HALT
The spreadsheet takes the commands and generates the sequence of control bytes.

10-5
a. In Excel, save your spreadsheet but don’t close it: you will modify the commands again later. b. Tools → Macros → Security → Choose low security. c. Tools → Add-Ins → Choose Analysis ToolPak. d. In the settings spreadsheet at the bottom of the excel page, make certain that COM PORT 1 is
chosen. e. Save, close, then reopen your excel program. f. With the power off, set your robot for mode 6 (switches 2 and 3 on, all the others off). Next, hold
the robot so that its wheels are off the table, then power up the robot. Now press and hold down SW1 on the microcontroller module while you simultaneously press and release the RESET button. The robot should now be on, but with blank LED display.
g. With the help of your TA or lab instructor, carefully connect the serial cable to the DB9 jack located on the side of the microcontroller module.
h. Now use the mouse to click the download button in the spreadsheet. This command sends the data bytes into the processor's memory.
Do not turn off the robot, as this would erase the robot's RAM memory!
Carefully remove the serial cable, hold the robot so that the wheels can turn freely, and press the Reset button: the robot should momentarily show its startup display, then begin the forward, right, left, backward, halt sequence that you downloaded. If this does not work, repeat the download and test sequence, and seek help from your TA or lab instructor.
Find an open space in the lab or in the hallway, set your robot on the floor, and press reset. Verify that the motion matches the command sequence. If you want to re-run the same sequence, just press reset and the microcontroller will perform the commands again.
P3. Now do some programming experiments to accomplish the following tasks. Debug the command sequences iteratively: if the results aren't correct, determine which commands and durations to change, copy, paste, and save the command string, and re-download to the robot for further testing.
When reprogramming your robot, simply alter the spreadsheet commands, save the spreadsheet file, and return to step (f) above. After the first time, there is no need to close Excel or to change the settings in the tool menu.
a. The maximum duration for any command is 8.191 seconds, but you can create longer intervals by using a repeated sequence of the same command. Make a sequence that will move forward for 10 seconds, then back up for 10 seconds.
b. You can press RESET to restart the sequence without having to download the commands again (as long as you don’t switch the power off!) What happens if the bumper hits something during the sequence?

10-6
Write some test commands that will allow you to determine the duration for left and right turns so that the rotation is 90, 180, 270, and 360 degrees.
90°: Duration: 270°: Duration: 180°: Duration: 360°: Duration:
c. Using the 90º turn rate results and the forward speed results from P1, create, test, and debug a control sequence that causes the robot to follow a square trajectory, starting and stopping at the same point, with sides 4 feet in length and 90º corners. It is normal that your robot might drift left or right as it moves because the motors may not be perfectly matched. Try putting in some course corrections to compensate for any drift or veer in your robot’s motion.
Robot maneuvers in a 4 foot square: Instructor/TA initials
P4. You are now ready to program your robot to follow the route that is mapped out on the floor.
Robot successfully negotiates the route: Instructor/TA initials
CONGRATULATIONS ON SUCCESSFULLY COMPLETING THE ROBOT EXERCISES!!
4'4'