edworkingpaper no. 20-201
TRANSCRIPT

Timing in Early Childhood Education: How Cognitive and Achievement Program Impacts Vary by Starting Age, Program Duration, and Time Since the End of the Program
This paper uses meta-analytic techniques to estimate the separate effects of the starting age, program duration, and persistence of impacts of early childhood education programs on children’s cognitive and achievement outcomes. It concentrates on studies published before the wide scale penetration of state-pre-K programs. Specifically, data are drawn from 67 high-quality evaluation studies conducted between 1960 and 2007, which provide 993 effect sizes for analyses. When weighted for differential precision, effect sizes averaged .26 sd at the end of these programs. We find larger effect sizes for programs starting in infancy/toddlerhood than in the preschool years and, surprisingly, smaller average effect sizes at the end of longer as opposed to shorter programs. Our findings suggest that, on average, impacts decline geometrically following program completion, losing nearly half of their size within one year after the end of treatment. Taken together, these findings reflect a moderate level of effectiveness across a wide range of center-based programs and underscore the need for innovative intervention strategies to produce larger and more persistent impacts.
Suggested citation: Li, Weilin, Greg J. Duncan, Katherine Magnuson, Holly S. Schindler, Hirokazu Yoshikawa, and Jimmy Leak. (2020). Timing in Early Childhood Education: How Cognitive and Achievement Program Impacts Vary by Starting Age, Program Duration, and Time Since the End of the Program. (EdWorkingPaper: 20-201). Retrieved from Annenberg Institute at Brown University: https://doi.org/10.26300/5tvg-nt21
Weilin LiChild Trends
Greg J. DuncanUniversity of California, Irvin
Katherine MagnusonUniversity of Wisconsin – Madison
Holly S. SchindlerUniversity of Washington
Hirokazu YoshikawaNew York University
Jimmy LeakNuru International
VERSION: February 2020
EdWorkingPaper No. 20-201
Running Head: TIMING IN EARLY CHILDHOOD EDUCATION
1
Timing in Early Childhood Education: How Cognitive and Achievement Program Impacts Vary by Starting Age, Program Duration, and Time Since the End of the Program
Weilin Li Child Trends
Greg J. Duncan University of California, Irvine
Katherine Magnuson University of Wisconsin – Madison
Holly S. Schindler University of Washington
Hirokazu Yoshikawa New York University
Jimmy Leak Nuru International
February 2, 2020
Acknowledgment: We are grateful to the following funders of the National Forum on Early Childhood Policy and Programs: the Birth to Five Policy Alliance, the Buffett Early Childhood Fund, Casey Family Programs, the McCormick Tribune Foundation, the Norlien Foundation, Harvard University, and an Anonymous Donor. We are also grateful to the Institute of Education Sciences [#R305A110035] and the Eunice Shriver Institute for Child Health and Human Development [5R01HD073172-04] for supporting this research, to Abt Associates, Inc. and the National Institute for Early Education Research for making their data available to us, and to Larry Schweinhart for helpful comments.
Running Head: TIMING IN EARLY CHILDHOOD EDUCATION
2
Timing in Early Childhood Education: How Cognitive and Achievement Program Impacts Vary
by Starting Age, Program Duration, and Time Since the End of the Program
Abstract
This paper uses meta-analytic techniques to estimate the separate effects of the starting age,
program duration, and persistence of impacts of early childhood education programs on
children’s cognitive and achievement outcomes. It concentrates on studies published before the
wide scale penetration of state-pre-K programs. Specifically, data are drawn from 67 high-
quality evaluation studies conducted between 1960 and 2007, which provide 993 effect sizes for
analyses. When weighted for differential precision, effect sizes averaged .26 sd at the end of
these programs. We find larger effect sizes for programs starting in infancy/toddlerhood than in
the preschool years and, surprisingly, smaller average effect sizes at the end of longer as opposed
to shorter programs. Our findings suggest that, on average, impacts decline geometrically
following program completion, losing nearly half of their size within one year after the end of
treatment. Taken together, these findings reflect a moderate level of effectiveness across a wide
range of center-based programs and underscore the need for innovative intervention strategies to
produce larger and more persistent impacts.
Keywords: meta-analysis; early childhood education; program impact; timing.
Running Head: TIMING IN EARLY CHILDHOOD EDUCATION
3
Timing in Early Childhood Education: How Cognitive and Achievement Program Impacts Vary
by Starting Age, Program Duration, and Time Since the End of the Program
Gaps between more and less advantaged children in academic-related skills emerge early
in life and increase substantially by the time children enter school (Duncan & Magnuson, 2011).
This well-documented concern has led policymakers and practitioners to focus on programs that
hold the promise of improving children’s school readiness and preventing the emergence of
achievement gaps before children enter formal schooling. Early childhood education (ECE) has
been an important part of these efforts because of its demonstrated effectiveness in improving
disadvantaged children’s foundation for learning by boosting children’s early skills.
Despite several decades of ECE program evaluation research, many questions about how
to maximize its effectiveness in early learning remain unanswered. Two of the most important
questions – whether programs produce better outcomes if they start earlier in life or last for
longer periods of time – have not been adequately addressed by prior studies. Consequently,
policymakers and administrators continue to make difficult decisions in the absence of good
research findings. For example, they must decide about whether it is better to allocate limited
resources to support ECE programs that serve larger numbers of children for a shorter period of
time or to invest in longer-lasting programs (or perhaps a sequence of programs) that serve a
smaller number of children. Questions about the extent to which early program impacts persist
beyond the end of the programs are also important for assessing the ability of ECE to reduce
later achievement gaps as well as to build foundational skills to be able to profit from subsequent
K-12 curricula.
Running Head: TIMING IN EARLY CHILDHOOD EDUCATION
4
Although a wide variety of ECE programs have been evaluated in the last 50 years,
scholarly discussions about early education have been dominated by individual evaluations of a
small number of ECE program models, most prominently Perry Preschool and the Abecedarian
Project. Most efforts to summarize this literature consist of narrative reviews that attempt to
uncover commonalities among programs with large positive effects (Barnett, 1995). Such an
approach privileges the best-known studies, and overlooks what can be learned from a
comprehensive and systematic analysis of all existing evaluation research. In this study, we
employ meta-analytic techniques to examine whether age of entry and program duration are
associated with ECE program effectiveness in a large group of rigorously evaluated programs.
We also estimate the extent to which ECE program impacts persist beyond program completion,
and whether several program factors (such as duration) increase the persistence of program
impacts after they end. Throughout, we concentrate studies published before the wide scale
penetration of state-pre-K programs, although provide a brief review of those programs in our
discussion section.
Background
Developmental research and theory point to early childhood as an important and sensitive
period in which experiences and environmental influences interact with genetic predispositions
to foster the acquisition of cognitive skills and later academic achievement as well as other
capacities (Shonkoff & Phillips, 2000). Children’s healthy development and skill growth is best
promoted by environments that provide sensitive, responsive caregiving and a variety of learning
opportunities that are rich in language and tailored to a child’s capabilities and needs. It is not
just that more information is learned in enriching environments; both human and animal studies
in neurobiology suggest that experiences in the earliest years affect the brain architecture and
Running Head: TIMING IN EARLY CHILDHOOD EDUCATION
5
neurocognitive functions that will shape future cognitive, social, and emotional development, as
well as physical and mental health (Knudsen, Heckman, Cameron, & Shonkoff, 2006; Sapolsky,
2004).
Age of Entry and Program Duration
Cognitive and language abilities are described as highly plastic neuro-cognitive skills
because they are strongly shaped by environmental experiences during the early childhood
period (Shonkoff et al., 2016). Thus, it is hardly surprising that ECE programs often improve
scores on developmental tests that measure a variety of language, achievement and cognitive
skills (Camilli et al., 2010). The relative plasticity of skill development during differing time
periods within the first five years, however, is not well articulated. Starting in infancy, responsive
caregiving and language-rich interactions are associated with greater success in reaching
developmental milestones generally, as well as stronger early language development more
specifically (Tamis-LeMonda, Bornstein, & Baumwell, 2001). Based on these findings, if center-
based experiences for infants and toddlers created such environments, we would expect to find
an “earlier is better” pattern of effects.
Starting ECE programs as early in life as possible is also consistent with the idea of
cumulative advantage, in which children who enter preschool or kindergarten with better skills
are likely to continue to outperforming other students because they are given more learning
opportunities by the educational environments they experience than are other children. This was
termed the “Matthew effect” by education and psychology researchers (Stanovich, 1986;
Walberg & Tsui, 1983). This concept has become central to the arguments of Cunha and
Heckman’s (2007) on the importance of early skill development. They describe a model of
Running Head: TIMING IN EARLY CHILDHOOD EDUCATION
6
learning in which early efforts to boost skills in vulnerable young children can improve the
productivity of later schooling and enrichment.
Because most ECE programs start at a specific age, and do not systematically and
intentionally enroll children at differing ages, estimating how program impacts vary by age of
entry is complicated. To do so, requires comparisons either across programs that vary along age-
of-entry or from large population studies in which the preschool experiences are not well
defined. Such comparisons might not be as challenging if the pattern of findings suggested a
clear answer—but they do not. Looking across the most prominent ECE programs in the first
three years of life one can find relatively small effects on cognitive development (e.g., Love et
al., 2002) as well as much larger impacts (Duncan & Sojourner, 2013). Studies that look across a
range of age of entry suggests a more complicated non-linear association between age of entry
and outcomes. For example, Loeb and colleagues found the largest positive effects of center-
based care for children who first experienced the setting at ages 2-3 compared with those who
started earlier or later (Loeb, Bridges, Bassok, Fuller, & Rumberger, 2007).
One possible explanation for these differences is that not all center-based ECE programs
are the same, and how children in these programs experience these setting may depend on their
ages. Although some ECE settings for infants and toddlers are able to ensure that all children get
individual attention from caregivers and rich language interactions with adults, other ECE
environments may not be sufficiently enriching or interactive to promote the development of all
the young children in the room. Although it might be easier to structure center and classroom
experiences to stimulate learning for four-year-olds, such experiences may come too late to build
some foundational skills and neurodevelopmental structures. Finally, starting at a later age

Running Head: TIMING IN EARLY CHILDHOOD EDUCATION
7
necessitates a shorter period of time being exposed to the enriching learning setting prior to entry
into K-12 schooling.
Age of entry into an early childhood education setting is correlated with, but conceptually
distinct from, program duration. In general, children who enter at a young age tend to experience
more cumulative time in these settings. However, program duration also differs based on
program design. For example, some programs may set age requirements in such a way that
children only attend for one or two years, as is the case with many school-based prekindergarten
programs or center-based Early Head Start programs. Only a very small number of ECE program
models span infancy through the preschool years with the specific goal of providing an ECE
experience based on a coherent and articulated model of early education and development across
this period.
Abundant literature suggests that the number of years spent in K-12 or post-secondary
education is linked to labor market success, with additional years bringing greater skills and
higher earnings (Card, 1999). Given the cumulative nature of learning, it is reasonable to expect
that greater time spent in developmentally stimulating environments before formal school entry
should also yield higher levels of academic skills. However, this conclusion is likely to depend
on the extent to which ECE programs are able to articulate and implement learning activities that
differentiate instruction and activities as they develop over time based on children’s mastery of
skills and content.
Developmentally-informed activity sequences likely vary as a function of the explicit and
implicit curriculum. For example, a preschool curriculum that does not adapt to children’s
developmental progress and prior classroom experience could be redundant. If children continue
to experience more of the same activities rather than increasingly complex, differentiated
Running Head: TIMING IN EARLY CHILDHOOD EDUCATION
8
learning experiences, they may gain much less from a second or third year in the same program
than they did in the first year. Existing skills may be solidified, but few new skills may be
learned. On the other hand, if learning is not primarily fostered through the explicit curriculum
and is instead dependent on implicit child directed learning and scaffolded interactions with
teachers (rather than say intentional instruction on specified topics), then such individualized
approaches to learning may maximize children’s learning throughout the time they are in center-
based ECE settings.
When researchers have considered how length of time within an ECE program relates to
academic related outcomes the results have been mixed. If the a priori expectation is that
attending a program for twice as long should result in twice the impact, the results tend to be
disappointing. The Chicago Parent Child (CPC) early education program found that two program
years boosted children’s school readiness more than one program year as measured by skills in
kindergarten. However, the early benefits for attending two years faded during the remainder of
elementary school such that years of attendance did not predict program outcomes. Reynolds and
colleagues concluded “children reach a threshold of performance at 1 year beyond which there
are diminishing returns over time” (Reynolds, 1995, p. 22).
Schweinhart and Weikart (1988) and Sprigle and Schaefer (1985) reached similar
conclusions in their analyses of ECE program impacts. Given the additional costs of another year
of preschool, Reynolds (1995) suggested that policymakers would be better off allocating funds
to assure that all children are able to attend ECE for one year rather than supporting a smaller
number of children for two years.
These findings contrast with the conclusions of several recent studies that find
predominantly larger effects for two years of ECE program attendance compared with one year,
Running Head: TIMING IN EARLY CHILDHOOD EDUCATION
9
which typically corresponded to attending at both ages three and four compared with just at age
four. A longer-run follow-up of CPC found that two years of program participation was
associated with some scattered positive effects on school performance (higher test scores and
lower grade retention); criminal behavior (fewer juvenile petitions), but not educational or
occupational attainment (Arteaga et al., 2014). A non-experimental analysis of the Abbot
Preschool program in New Jersey produced mixed results on this issue, finding that an additional
year of early education significantly improved children’s vocabulary but did not yield larger
gains in their print awareness or math skills (Barnett & Lamy, 2006). Wen and colleagues found
that two years of Head Start were more effective than just one year in terms of producing gains
in academic and language outcomes (Leow, Wen, & Kormacher, 2014; Wen, Leow, Hans-
Vaughn, & Marcus, 2012; see also Domtrovich and colleagues 2013). At the same time,
however, the analysis of Jenkins et al. (2016) found that children who entered Head Start centers
as three year-olds showed more cognitive growth if they transitioned to pre-K centers at age four
than if they remained in the Head Start program.
Using meta-analysis to examine patterns of findings across a larger set of program
models, Gorey (2001) found that programs with durations in excess of 3 years had larger effects
on cognitive and achievement outcomes than 1- or 2-year-long interventions (Gorey, 2001). It is
worth noting, however, that the difference in effects was not proportional, as three-year effects
were only 9% larger than one- or two-year effects. A more recent meta-analysis found no
significant effect of treatment duration on program impacts on achievement and cognitive
outcomes (Camilli et al., 2010).
Based on the presumption that greater exposure to enriched early learning environments
would produce larger effects, we hypothesize that, with starting age held constant, multi-year

Running Head: TIMING IN EARLY CHILDHOOD EDUCATION
10
programs will produce significantly larger end-of-treatment impacts than single-year programs.
At the same time, the absence of developmentally sequenced curricula in many preschool
settings reduces our confidence that past programs will show this hypothesized patterns of
impacts.
Persistence of ECE Effects
The declining magnitude of early education program impacts on achievement and
cognitive outcome as children progress through elementary school, sometimes referred to as
fadeout, convergence or catch-up, has raised questions about whether ECE is a worthy
investment (Bailey et al., 2017; Abenavoli, 2019). Intervention programs may simply accelerate
mastery of content that would have occurred anyway, with later similarities between groups
attributed to the presumption that children in the control group simply “catch-up” after the
program is terminated (Ackerman, 2007). Others argue that the fade-out of impacts is not
inevitable but reflects the fact that preschool is not an “inoculation” against the adverse effects of
subsequent low-quality schooling (Currie & Thomas 2000; Lee & Loeb, 1995).
Many studies of individual ECE programs show sizable program impacts on children’s
academic skills at program completion, but then document shrinking differences between
treatment and control groups at later time points. In the case of the Infant Health and
Development Program (which included an intensive center-based ECE component between ages
1 and 3), large cognitive impacts at age 3 had mostly disappeared by age 5 (Duncan and
Sojourner, 2013). More recently, the Head Start Impact Study, which conducted an investigation
of nationally representative centers, demonstrated modest effects on children’s pre-academic
outcomes after one year of program participation, but Head Start children’s advantage in
academic skills had disappeared entirely by the spring of first grade (Puma, et al., 2010). In the
Running Head: TIMING IN EARLY CHILDHOOD EDUCATION
11
first random assignment evaluation of a state-wide pre-K program, Lipsey et al. (2018) found
null or even negative achievement impacts in third grade. Despite differences in the rates of
home-based care among control-group children, Weiland et al. (2019) found similar longer-run
patterns in a lottery-based evaluation of the Boston pre-K program.
This pattern of disappearing impacts over time is not universal. Although the CPC
program impacts on achievement declined after program completion, a significant impact
attributed to preschool and school year participation was still found in seventh grade for math
and reading skills (Reynolds & Temple, 1998; Reynold 2000). Likewise, the Abecedarian
program evaluation results have persisting impacts on several domains of achievement and
cognitive (IQ) outcomes in young adulthood (Campbell et al., 2002).
Given the sizable number of studies that have collected medium- and long-term follow-
up data, the question of persistence is particularly well-suited to meta-analytic study. Camilli et
al. (2010) conducted a meta-analysis of ECE interventions for children ages 3-5 that measured
cognitive domains and compared an ECE treatment to a no-treatment control group. Their
average overall effect size was .23 sd, but they also estimated a -.24 sd drop in effect size
between the time children were between 3 to 5 years old and when they were older than 10 years
of age at the time of measurement. In a study of 33 programs, Aos and colleagues (2004) found
that each additional year post-program completion was associated with a -.03 sd decline in test
scores, holding constant program and research study design quality. Further calculations led to
an estimate that by the end of high school, a “real-world” ECE program with an initial impact of
.12 sd, would increase test scores by only .08 sd.
The presence and degree of ECE program impact “fadeout” for children’s cognitive and
achievement skills may depend on the specific cognitive domain or types of outcomes
Running Head: TIMING IN EARLY CHILDHOOD EDUCATION
12
assessments under consideration. For example, if preschool instruction may concentrate on
narrower set of defined knowledge for which impacts may be easier to demonstrate on specific
assessment in the short run (e.g. identifying letters or numbers). Yet, the defined knowledge of
print conventions or the alphabet most children master in the early school years because it is
typically the target of explicit instruction. Broader skills, including those that are unconstrained
such as a reasoning, vocabulary, and background knowledge, are not easily measured by brief
assessments. However, because developing unconstrained knowledge and skills requires high
quality and varied learning experiences, which may require a higher “dose” of program exposure
for generating both initial and sustained impact (Bailey et al., 2017). This might argue for ECE
impacts on unconstrained skills, lasting longer than impacts on specific areas of achievement,
which might be more fleeting.
IQ, which includes a mix of skills across the range of cognitive development, was
historically one of the most often measured outcomes of early childhood education (Zigler &
Trickett, 1978). Zigler attributed IQ’s popularity as an outcome to the fact that several IQ scales
had good measurement properties, were strongly predictive of later schooling outcomes, and
measured a broad range of cognitive skills that might be covered by early childhood education
programs. Yet, he cautioned that established measures of IQ blend three types of cognitive skills:
formal cognitive skills (e.g. reasoning, processing speed), achievement skills, and motivation for
test performance. Thus, as a measure that combines a range of skills, it is hard to know what to
make of declining or persisting program impacts on IQ. This is further complicated by evidence
of rapid decline in size of positive impacts even in high quality programs, as well as variation in
the extent to which long-term impacts on IQ persist in later years. For example, the large IQ
impacts measured shortly after the completion of the Perry Preschool Project had completely
Running Head: TIMING IN EARLY CHILDHOOD EDUCATION
13
disappeared by age 8, although effects on academic achievement persisted into middle adulthood
(Schweinhart et al., 1993). Abecedarian generated IQ impacts that persisted well beyond age 8,
despite declines in the size of these effects in the first two years post-program (Campbell,
Pungello, Miller-Johnson, Burchinal, & Ramey, 2001; Hojman, 2015). In short, evidence from
prior evaluations does not clearly provide suggestion about how the type of outcome being
assessed might be associated with patterns of impact persistence.
The current study
This paper address three questions related to the timing of ECE programs: (1) Do
programs targeting younger children produce larger impacts than those targeting older children;
(2) Does the duration of a program affect the magnitude of impacts; and (3) How persistent are
ECE program impacts over time? Impact persistence was also addressed in a more differentiated
manner by asking whether program impacts last longer for achievement compared with cognitive
outcomes, longer-duration programs, and earlier-starting programs. Specifically, this paper aims
to test the following hypotheses:
Hypothesis 1: ECE programs targeting younger children will produce larger end-of-
treatment impacts than programs targeting older children.
Hypothesis 2: Longer-duration ECE programs will produce larger end-of-treatment
impacts than shorter-duration programs.
Hypothesis 3: ECE program effects will decrease as the time since the end of treatment
increases.
Hypothesis 4: ECE program effects on outcomes that are more sensitive to instruction
will fade out more quickly than effects on outcomes that are less sensitive to instruction.
Running Head: TIMING IN EARLY CHILDHOOD EDUCATION
14
Hypothesis 5: Impacts from programs targeting older children will fade out more quickly
than impacts from programs targeting younger children.
Hypothesis 6: Impacts from programs with shorter durations will fade out more quickly
than impacts from programs with longer durations.
In order to test these hypotheses, we analyzed data in a meta-analytic database that
includes 273 rigorously conducted experimental and quasi-experimental studies since 1960.
Although a subset of these studies was included in the Camilli et al. (2010) analysis, we added
eight studies published between 2000 and 2007 (including the National Head Start impact study
and six evaluations of pre-K programs) as well as 44 studies published or released during the
Camilli review period but not included in the Camilli et al. (2010). Finally, our quality thresholds
led us to exclude 94 studies included in Camilli et al. (2010).
Method
Data
We focused exclusively on early childhood education (ECE) programs, defined as
structured, center-based early childhood education classes, day care with some educational
component, or center-based child care. These include widely implemented pre-school programs
such as Head Start and other demonstration interventions conducted by researchers. Programs
included in our study must have provided educational services to children at program sites and
may also have provided services to families and/or staff.
A multi-step data collection and evaluation process was used for determining what
studies would be included in our database (Figure 1). The first step was to conduct a
comprehensive search of the literature from 1960 to 2007. The 2007 date marked the year in
which we engaged in our systematic review of the thousands of documents that met our search
Running Head: TIMING IN EARLY CHILDHOOD EDUCATION
15
criteria (see below). Coding these documents took several years and our grant funding enabled us
to finish the coding tasks but not to update our document search for the literature published after
2007. We highlight some of the most noteworthy contributions to the ECE literature in our
discussion section.
To generate our EC database, we conducted keyword searches (Appendix 1) in ERIC,
PsycINFO, EconLit, and Dissertation Abstracts databases, resulting in 9,617 documents, as any
given program may produce a series of such documents. The team then manually searched the
websites of policy institutes (e.g., RAND, Mathematica, NIEER) and state and federal
departments (e.g., U.S. Department of Health and Human Services), as well as references
mentioned in collected studies and other key early childhood education reviews. This search
produced another 692 documents. In sum, 10,309 documents for potential inclusion in the ECE
portion of the database were identified.
[INSERT FIGURE 1 HERE]
The research team next developed criteria for the inclusion of studies into our meta-
analytic database. The vast majority (91%) of the 10,313 documents that were found were
excluded because they violated as least one inclusion criteria. Most of the excluded documents
were not actual research studies but were commentaries or reviews. In addition to being an ECE
intervention or program reported on from 1960 to 2007, studies had to have a treatment and
control/comparison group, and not simply assess the growth of one group of children over time.
Each of the estimates in the study must have been based on groups that included at least 10
participants and incurred less than 50% attrition. Studies were excluded if they assessed children
with medical disorders or learning disabilities, or interventions took place outside of the United
Running Head: TIMING IN EARLY CHILDHOOD EDUCATION
16
States. Our resulting overall database includes 277 studies of programs or interventions for
children starting between birth and age 5.
About one-third of the studies used random assignment with the remainder following
quasi-experimental designs such as change models, individual or family fixed effects models,
regression discontinuity, difference in difference, propensity score matching, interrupted time
series, instrumental variables, or some other types of matching. Studies that used quasi-
experimental designs were also included if they had pre- and post-test information on the
outcome or established baseline equivalence of groups on demographic characteristics
determined by a joint test. A general goal of our meta-analysis project was to use more rigorous
inclusion criteria than previous meta-analyses and to assure that the quality of included quasi-
experimental studies be as close as possible to approximating random assignment. To that end, a
virtue of the systematic approach a formal meta-analysis affords is that it enables researchers to
test for whether effect sizes and relationships differ systematically by inclusion criteria such as
having a random assignment design.
Coding the studies. A team of nine graduate research assistants at three universities,
under the guidance of the senior authors, were trained as coders during a 3- to 6-month process
that included instruction in evaluation methods, using the coding protocol, and computing effect
sizes. Trainees were paired with experienced coders in multiple rounds of practice coding.
Before coding independently, research assistants also passed a reliability test comprised of
randomly selected codes from a randomly selected study. In order to pass the reliability test,
research assistants had to calculate 100% of the effect sizes correctly and achieve 80%
agreement with a master coder for the remaining codes. In instances when research assistants
were just under the threshold for effect sizes, but were reliable on the remaining codes, they
Running Head: TIMING IN EARLY CHILDHOOD EDUCATION
17
underwent additional effect size training before coding independently and were subject to
periodic checks during their transition. Questions about coding were resolved in weekly research
team conference calls usually involving all four principal investigators, and decisions were kept
in an annotated codebook so that decisions about ambiguities could be recalled when coding
subsequent studies. In a few instances, codes were added and previously coded studies were
adjusted accordingly to account for the new additions.
Hierarchical structure of the database. The database consists of three levels of data:
study, contrast, and effect size. Studies are defined as independent investigations of ECE
programs. Contrasts are group comparisons within study (e.g. Head Start vs. non-Head Start,
literacy intervention vs. no literacy intervention). Each contrast can have multiple dependent
measures collected at different time points during, at, and after program completion. Those
dependent measures are recorded in the database as effect sizes, or standardized comparisons of
treatment and control groups on a set of outcome measures which, in the full meta-analytic data
set, include cognition, achievement, behavior, socio-emotional skills, health, and other domains.
The current paper focuses on a subset of our overall database. First, we exclude sub-
contrasts, which consist of subgroups such as male vs. female or black vs. white children (as we
lack the statistical power to examine such subgroups). Second, we focus exclusively on effect
sizes for cognitive and achievement outcomes. All in all, these restrictions reduced the number of
effect sizes in our analysis from 15,804 to 1,045, which are drawn from 67 studies in the
database.
Effect size computation. Each study’s outcome measures were coded into standardized
mean difference effect sizes, which were computed using the Comprehensive Meta-Analysis
computer software program (CMA; Borenstein, Hedges, Higgins, & Rothstein, 2005). We used
Running Head: TIMING IN EARLY CHILDHOOD EDUCATION
18
the Hedges’ g-based definition of effect sizes, which adjusts standardized mean differences
(Cohen’s d) to account for bias arising from small sample sizes. We included how we calculated
effect size estimates in Appendix Table 19. To avoid potential domination by outliers, we
truncated the 9 effect size estimates with values above 1.5 sd, although in practice this truncation
had little effect on our key results. The most negative effect size was -0.70 sd.
Measures
Outcomes. Outcome measures for this analysis included assessments of child cognition
and achievement. Cognitive outcomes in our categorization, following Christian, Morrison,
Frazier, and Massetti (2000), are considered less sensitive to general preschool instruction than
achievement outcomes. These include IQ, attention, vocabulary, task persistence, theory of mind,
and syllabic segmentation such as elision and rhyming. Achievement measures tend to be
readily amenable to instruction, narrower in scope and more completely measurable. Letter
recognition is the most obvious example, but this category also includes reading, math, numeracy
other than conservation of number, and other achievement tests.
Program timing. The key independent variables of interest for our analyses are three
measures of timing: starting age, length of program, and elapsed time since the end of the
program. Starting age is the age of the child, scaled in years, at the beginning of the
intervention/program. Program length is the amount of time, scaled in years, over which services
are offered to participating children. The persistence of program impacts are estimated with the
length of time, scaled in years, between the end of the program and when the given effect size
impact measurement took place.

Running Head: TIMING IN EARLY CHILDHOOD EDUCATION
19
Analytic approach
Random-effects modeling. Since effect size estimates are nested within contrasts, which
in turn are nested within studies, we accounted for the potential lack of independence across
effect size estimates by implementing a set of 3-level random-effect meta-analytic models. Our
models were based on assumptions of (1) studies included in this analysis were a random
selection from a larger population of studies, (2) true effect sizes in the population of studies are
normally distributed, (3) effect size estimates from different contrasts are independent (i.e.
uncorrelated), (4) effect size estimates from different studies are independent, and (5) effect size
estimates from different contrasts within the same study are dependent with a compound
symmetric variance-covariance structure. We used the rma.mv() method of the <metaphor>
package in R to implement this set of models (Viechtbauer, 2010).
Weights. Following best meta-analytic best practices, we weighted our random-effect
models by the precision of the effect size estimates. Specifically, the precision of effect sizes is
the inverse of the squared standard error of the effect size estimates that were generated by the
CMA program.
Control variables. Following Shager et al. (2010), we included a measure of whether the
study was conducted before or after 1980, whether the study was for research demonstration
purpose, whether the measured outcome was not measured by a performance test (two
categories, one representing observational measure and the second indicating all of other
methods, whether the reported estimates were based on children actually taking up the treatment
(treatment-on-the-treated) as opposed to just being offered the treatment.
In addition, we considered a number of variables of study quality, all of which were
scaled so that higher scores represented higher-quality research practices. These included: (1) the
Running Head: TIMING IN EARLY CHILDHOOD EDUCATION
20
reported reliability of the given outcome measure, as indicated by whether the alpha, was higher
than .88, (2) the study was random assignment (vs. quasi-experimental) design, (3) the study
controlled for baseline measures, (4) the study reported insignificant differences in groups at
baseline, (5) data collectors were blinded, (6) the comparison group did not receive equivalent
alternative services, (7) the study had attrition rate lower than the sample median rate of 16%,
which was calculated from the original sample size at assignment and the sample size at
measurement; (8) the study was published in a peer reviewed journal; and (9) bias was not
observed in the study. We then summed these nine dichotomous quality indicators into a quality
index.
Imputation. Studies included in our analysis had missing values in some covariates. We
conducted multiple imputation to address this missing data issue. Specifically, we used the
predictive mean matching method (PMM; Heitjan and Little 1991; Schenker and Taylor 1996) to
generate 40 imputed datasets. The PMM is a semi-parametric imputation method that imputes
observed values whose predicted values are the closest to the missing observation’s predicted
values from the simulated models. Because the PMM imputation values are restricted to the
observed values and free from the structural imputation models, the PMM provides generally
high quality imputations (van Buuren & Groothuis-Oudshoorn, 2011).
We also included several demographic characteristics of the participants, with the percent
of participating children who were male and dummy variables indicating whether participants
were mostly (i.e., >50%) (1) White (the reference group); (2) Black; or (3) Hispanic; (4) whether
none of these group proportions exceeded 50%; and a catchall (5) racial/ethnic composition
missing. Some 84% of studies reported the percentage of their child samples who came from
low-income families; we split these studies at the median percentage low income: 90.8%. Our
Running Head: TIMING IN EARLY CHILDHOOD EDUCATION
21
measure of program characteristics focused on whether the treatment included any sort of family
support services, such as parenting education or provision of material resources to parents.
Testing our hypotheses. To test hypotheses 1 and 2 regarding effects of program starting
age and duration, we restricted our analytic sample to effect size estimates from outcomes
assessed during the treatment and around the end of treatment. Since quite a few studies assessed
end-of-treatment program impacts somewhat before the final weeks of the program or slightly
after the program ended rather than right at the end, we define the “end of treatment” impact
estimate to be the ones closest to the end of the treatment but within a radius of 25% of the
program duration. We also measured the time between the measurement and the end of treatment
and included it as a covariate in the study in our preliminary regressions. Since we found this
timing measure to be uniformly insignificant, we dropped it from the final analyses. The 25%
restriction effectively excluded program mid-point outcome measurements. Based on this
definition, some 90 effect sizes from 11 studies were assessed within 25% of the end of the
treatment; 180 effect sizes from 23 studies were assessed right at the end of the treatment; and
132 effect sizes from 18 studies were assessed within 25% following the end of the treatment.
For effect size estimates from outcomes assessed during the treatment, we recoded our measure
of program duration to the assessment point. For example, the Abecedarian study had a program
length of 60 months. We adjusted the program length to 10 months for treatment outcomes
assessed 10 months after the beginning of the treatment. For outcomes assessed at the end of the
treatment or after the treatment, we measured program length as 60 months.
To test hypotheses 3 to 6, we restricted our analytic sample to effect size estimates from
outcomes assessed at the end of the treatment and after the treatment. When testing hypothesis 3
on fadeout, we estimated both linear and, for time since the end of program, categorical models.
Running Head: TIMING IN EARLY CHILDHOOD EDUCATION
22
For the latter, we distinguished outcomes that were assessed: (1) at the end of treatments; (2) 0-1;
(3) 1-2; (4) 2-4; and (5) 4 or more years following the end of program. When testing hypotheses
4 to 6 regarding what types of outcomes or programs will have more enduring impacts, we
created three corresponding interaction terms with the assessment time of the effect size estimate
interacting with (1) whether the effect size estimate was from cognitive outcomes (less sensitive
to instruction than achievement outcomes), (2) program starting age, and (3) program duration.
We drew our inferences for hypotheses 4 to 6 from estimates of these three interaction terms.
Results
An overview of our studies and their average effect sizes on cognitive and achievement
outcomes (taken around the end of treatment) are presented in Figure 2. Reflecting their
approximate contributions to our weighted results, “bubble” sizes are proportional to the square
root of their sample sizes. A full list of studies with their associated starting years, average effect
sizes, average end of treatment effect sizes, average starting age, and average program duration
is provided in Appendix Table 1. A relatively large proportion of our studies began in the 1960s,
with another concentration launched between the early 1990s and early 2000s. Average effect
sizes for most studies are positive, although a handful are negative. The weighted trend line in
average effect sizes shows a slightly negative slope, which may reflect the changing nature of
conditions facing children not enrolled in early childhood education programs (Duncan and
Magnuson, 2013).
[INSERT FIGURE 2 HERE]
Table 1 provides descriptive statistics on dependent variables, key timing variables and
other control measures. At .16 sd, the weighted mean of the 993 effect size estimates in our
database is modest, although there is very large variability around that mean. Moreover, the .16
Running Head: TIMING IN EARLY CHILDHOOD EDUCATION
23
sd average includes a number of effect size estimates measured years after the end of the
programs. If we restrict our calculation to just end-of-treatment effect sizes, the weighted
average was .26 sd. This indicates that the typical end-of-treatment impact from the broad set of
evaluations conducted over the 47 years between 1960 and 2007 is noteworthy but considerable
smaller than the end of treatment effect sizes found for the most famous early childhood
programs – Perry and Abecedarian.
[INSERT TABLE 1 HERE]
Table 1 also shows the distribution of studies by a host of other quality and demographic
indicators. Most studies did not use random assignment, did not or could not blind data
collectors to the treatment status of the children, were not published in peer-reviewed journals,
did not adjust for baseline covariates, and were based on treatment-on-the-treated estimates.
With regard to demographics, most programs targeted low-income children and many targeted
black children. It proved important to adjust for these covariates since they are systematically
correlated with both our key timing variables and effect sizes. Appendix Table 2 presents
correlations among these covariates.
Publication bias is a potential concern for meta-analytic studies such as ours. It is
encouraging that Table 1 shows that most of the effect size estimates in our data base did not
appear in refereed journals. A more formal approach to publication bias is with the funnel plot
for end-of-treatment effect sizes shown in Figure 3. Each dot represents the average effect size
for contrasts in each of the 43 studies that included estimates of impacts at the end of treatment.
Bias is a possible problem if smaller studies (the ones with the larger standard errors shown in
the bottom portion of the graph) tend to produce more consistently positive impacts (Bornstein et
al., 2009), although in the case of the early childhood education, smaller studies might reflect

Running Head: TIMING IN EARLY CHILDHOOD EDUCATION
24
higher quality programs implemented by developers. Although not obvious from Figure 3,
Egger’s test for asymmetry of the funnel plot (Egger et al., 1997), which is based on the intercept
from the linear regression of normalized effect estimate (i.e., the estimate divided by its standard
error) against precision (i.e., reciprocal of the standard error of the estimate), is significantly
different than zero (t = 2.6746; df = 35; p = .0113).
Bornstein et al. (2009) recommend two approaches to address the issue of publication
bias. One is to assess the possible impact of the bias introduced by conducting a sensitivity test in
which the sample of impacts is restricted to those generated by the largest studies. The other
approach is “trim-and-fill,” which generates simulated effect sizes and standard errors so that the
funnel plot becomes symmetric and publication bias is minimized. Results of both approaches
are reported below.
[INSERT FIGURE 3 HERE]
Hypothesis 1 regarding starting age
On average, effect sizes were taken from programs that began their treatments at age 3.47
(Table 1). A scatter plot of all effect sizes sorted by starting age in Figure 4 provides a better idea
of the nature of the raw data we are working with. In most cases, vertical columns of effect size
estimates come from a single study and indicate considerable effect size clustering by study. For
example, data in the left-most column of effect sizes are all generated from the 1978 Project
CARE program and all were measured at the end of that program’s treatment. Some 51.2% of
the variance across our entire set of 993 effect size estimates were accounted for by study. This
heavy clustering confirms the wisdom of our multilevel modeling strategy.
[INSERT FIGURE 4 HERE]

Running Head: TIMING IN EARLY CHILDHOOD EDUCATION
25
Wide variation in cognitive and achievement impact estimates at all starting ages is
apparent in Figure 4; a weighted trend line fit to these effect sizes has a modest positive slope,
indicating somewhat smaller effect sizes with earlier-starting programs. Adjusting for the
varying numbers of impact estimates coming from the various studies reversed the sign of this
trend line (Model 1 of Table 2), with effect sizes estimated to decrease by a statistically
insignificant .029 sd per year of starting age. Adjusting for study quality and demographic
composition produced a less negative coefficient (-.019 sd per year). By also incorporating
adjustments for program duration, the seventh column in Table 2 provides our best estimate of
the impact of starting age on effect sizes: increasing program starting age by a year was
associated with a statistically insignificant -.057 sd per year decrease in effect sizes. The
estimates for program starting age remained significant and changed only slightly in magnitude
when we included during-treatment effect sizes in the analyses (Models 1, 2, 3 in Table 3).
Appendix Table 5 provides results from a regression in which starting age is characterized with
dummy variables and suggests the possibility of a threshold around a starting age of 3. Both
unadjusted and adjusted coefficients from this regression are shown in Figure 5.
[INSERT TABLES 2, 3 AND FIGURE 5 HERE]
Complete regression results for the fully-controlled model, including coefficients on the
control variables themselves, are presented in Appendix Tables 3 and 4. Relatively few study
characteristics generated significant results. Studies with significant baseline differences between
treatment and control groups or higher levels of attrition were associated with smaller effect
sizes, while studies that did not include baseline characteristics were associated with larger ones.
Studies with greater than 50% children of color generated larger although statistically
insignificant effect sizes.

Running Head: TIMING IN EARLY CHILDHOOD EDUCATION
26
Hypothesis 2 regarding length of program
Treatment duration averaged 1.75 years, with clusters of studies of either very short
durations or close to one year in length (Table 1 and Figure 6). Figure 6 shows a modest decrease
in average effect size by length of program. In the multilevel models with and without study
quality and demographic composition, length of program was negatively associated with effect
size estimates (Models 4-7 in Table 2). That is, contrary to our expectations, each added year of
length to a program was associated with a decrease in effect size, with our preferred estimate
being -.085 sd.
[INSERT FIGURE 6 HERE]
In light of this unexpected negative relationship between program duration and end-of-
treatment impact, we wondered whether this was driven by an offsetting association in which
most of the longer programs also started at an earlier age. One useful piece of evidence comes
from an examination of whether the negative relationship also held within the several studies that
measured impacts over the course of their treatments. For this analysis, we included both end-of-
treatment (25% radius) effect sizes as well as the during-treatment effect sizes that had been
excluded from analyses reported thus far. As described before, we adjusted program duration to
the assessment point for effect size estimates from outcomes assessed during the treatment.
Figure 7 shows that in most cases, the longer the program, the smaller and the effect size.
[INSERT FIGURE 7 HERE]
There could also be an interaction effect between starting age and program duration. For
example, effect sizes could be larger for a program that started early and lasted longer.
Therefore, we conducted a model with interaction effects of starting age and program duration.

Running Head: TIMING IN EARLY CHILDHOOD EDUCATION
27
We did not find that the coefficient on this interaction effect met conventional levels of statistical
significance (Appendix Table 6).
Hypothesis 3 regarding time since end of program
Although nearly half (45%) of all effect sizes were measured around the point of program
completion, there was still substantial variation in time between end of treatment and effect size
measurement (Figure 8). A weighted trend line in Figure 8 showed a drop from about .20 sd to
.10 sd over the course of five years – about .02 sd per year. Weighting the data and controlling
for the other timing measures produced an annual fadeout estimate of -.006 sd per year; adjusting
for study characteristics produced similar estimate of linear persistence at -.006 sd per year
(columns 1 and 3 of Table 4).
A closer look at Figure 8 suggests that a linear model might not do justice to the patterns
of falling effect sizes. When we characterized these timing effect in a more flexible way using a
set of dummy variables, we found what approximates more of a geometric decline (columns 2
and 4 of Table 4). Thus, our full-control model suggests that much of the eventual decline in
effect sizes occurs within a year of the end of treatment, and the later decline does not continue
in a linear manner. We discuss some of the implications of this rapid decline in the discussion
section.
[INSERT FIGURE 8 AND TABLE 4 HERE]
Hypothesis 4 regarding interaction between outcome types and time since end of program
We tested whether the timing of effects differed for cognitive and achievement measures
by adding an interaction variable of “whether achievement measure” and “years since end of
treatment” (column 1 in Table 5). We found no evidence of more enduring effects for outcomes
that were more or less sensitive to preschool instruction.
Running Head: TIMING IN EARLY CHILDHOOD EDUCATION
28
[INSERT TABLE 5 HERE]
Hypothesis 5 regarding interaction between program length and time since end of program
A second interaction hypothesis regarding persistence is that longer programs produce
longer-lasting effects than shorter programs. We tested this hypothesis with an interaction
between length of treatment and years since end of treatment. The results suggested significantly
more persistence of effects for studies with longer duration than those with shorter program
duration (β = .006; se = .002; p < .001).
Hypothesis 6 regarding interaction between program starting age and time since end of
program
A third persistence-interaction hypothesis is that programs starting in a child’s early years
have longer-lasting effects. We tested this hypothesis with an interaction between starting year
and years since end of treatment. The results suggested significantly more persistence of effects
for studies that started early than those that started late (β = -.004; se = .001; p < .01).
Sensitivity Analyses and Robustness Checks
We have defined “end-of-treatment” effect sizes according to whether they were assessed
within a radius of 25% of the program duration. When we shortened the radius distance to 10%,
our estimates of the effects of starting age and program duration were somewhat less negative,
while our estimates of effect size persistence and persistence interactions were quite similar to
those obtained with a 25% radius (Appendix Tables 7, 8, and 9, which parallel models presented
in Tables 2, 3, and 4).
As mentioned above, one approach for assessing the possible bias revealed in the funnel
plot in Figure 2 is to re-estimate key models using only observations from larger studies. We
Running Head: TIMING IN EARLY CHILDHOOD EDUCATION
29
reran the regressions presented in Table 2, 3, and 4 using data based on the largest 50% of our
contrasts (i.e. studies with sample sizes greater than 178; see Appendix Tables 10, 11 and 12).
Our estimates of starting age were not significant when only larger studies were included.
Estimates of effect size persistence from larger studies were similar with those from all studies.
In addition, all three estimates of persistence interactions were significant when only larger
studies were included, indicating for larger studies, significantly more persistence of effects for
outcomes that were less sensitive to preschool instruction than outcomes more sensitive to
instruction, more persistence of effects for programs with longer duration than those with shorter
duration, and more persistence of effects for programs with relatively older children than those
with infants and/or toddlers.
We also used a trim-and-fill approach to remove publication bias in effect size estimates
(Duval & Tweedie, 2000). Because trim-and-fill cannot be used to generate simulated covariates,
we resorted to a series of bivariate comparisons of the average effect size of: studies targeting
children younger and older than 3 years old when the treatments began, and studies with
treatments that lasted less and more than 2 years. Consistent with Table 2, 3, and 4 results
regarding starting age, the average effect size of studies targeting children younger than 3 years
old was a statistically significant .068 sd higher than for studies targeting older children. The
trim-and-fill estimate of this difference was similar – a statistically significant difference of .053
sd. Thus, trim-and-full adjustments do not alter the conclusion that effect sizes are somewhat
larger in studies starting earlier in life.
The trim-and-fill adjustment also confirmed our conclusions with regard to program
duration. The average effect size of shorter-duration studies was a statistically insignificant .029
Running Head: TIMING IN EARLY CHILDHOOD EDUCATION
30
sd higher than for studies that lasted longer. The trim-and-fill estimate of this difference favored
shorter studies by a statistically significant .043 sd.
When coding our outcome assessment, we have grouped vocabulary outcomes into
cognitive outcomes are that not sensitive to instruction because preschools that provide literacy
activities and instruction often fail to provide language rich environments (Justice et al., 2008).
However because vocabulary skills could be impacted by a child’s language environment, we
grouped vocabulary outcomes into cognitive outcomes that are sensitive to instruction and
conducted models in Tables 2, 3, and 4. Appendix Tables 13, 14, and 15 presented results of this
set of analysis, which are quite similar to corresponding results in Tables 2, 3, and 4.
When estimating effects of the starting age, program duration, and persistence of impacts
of early childhood education programs, we used effect sizes from outcomes assessed at various
developmental stages. However because effects of these timing factors could vary according to
when the outcomes were measured, we examined associations between timing variables and
effect sizes of outcomes measured at school-entry age. We presented results in Appendix Tables
16, 17, and 18. Unfortunately, number of effect sizes at school-entry age were so small that most
of our models with covariates did not converge.
In addition, timing variables may have differential associations with effect sizes in
achievement and cognitive measures. Hence we included interactions between timing variables
and the indicator for achievement or cognitive measures. We included this set of results in
Appendix Tables 19, 20, and 21. We found programs that started later generated larger effects on
end-of-treatment cognitive than achievement outcomes, as did programs with longer durations.
The pattern of interactions in Appendix Table 19 shows higher initial impacts on achievement
Running Head: TIMING IN EARLY CHILDHOOD EDUCATION
31
than cognitive outcomes but the achievement impacts quickly fall below the cognitive impacts.
We expand on these results in the discussion section.
Discussion
The data presented in this paper are drawn from the most comprehensive meta-analytic
database of early childhood programs in the United States produced to date. They comprise
about 1,000 effect sizes generated by 67 studies conducted over a 47-year period. The criteria
used for screening studies led us to include those with high quality standards, and adjust for
quality differences across the studies.
The overall (weighted) magnitude of ECE impact on both cognitive and achievement
scores averaged .26 sd at the time of program completion. This average reflects a moderate level
of effectiveness and is comparable with what has been reported in the literature on short-term
impacts of Head Start programs more generally (Shager et al., 2010) and for literacy impacts in
the recent Head Start impact study specifically (USDHHS, 2010). At the same time, it is
considerably smaller than some of the end-of-treatment impacts generated by demonstration
efficacy studies such as the Perry Preschool Project and Abecedarian Program. Thus, almost half
a century of evaluation research confirms that, on average, center-based early education
programs that begin between birth and 5 years of age produce positive effects of moderate
magnitude on measures of cognition and achievement taken close to program exit.
Beyond this overall finding of ECE program effectiveness, further analyses of the extent
to which timing considerations influenced impacts revealed some expected and a few unexpected
results. As we hypothesized, effect sizes were somewhat larger for children who started
programs at younger ages. Also as expected, treatment effects persisted beyond the end of the
programs, but declined exponentially, losing half of their end-of-treatment values within just a
Running Head: TIMING IN EARLY CHILDHOOD EDUCATION
32
year. Our linear estimate of fadeout (-.022 sd) is similar to estimates from two prior meta-
analyses that examined persistence of early childhood education effects (Aos et al. 2004; Camilli
et al., 2010), but we find that a linear function does not capture the time path of fadeout very
well, which is characterized by a rapid immediate decline, rather than a slow decremental
decline.
We found that impacts on cognitive measures tended to be smaller at the end of treatment
but persist longer than impacts on achievement measures. This result runs counter to findings
from the Perry Preschool evaluation in which achievement impacts lasted longer than IQ effects,
although would be in keeping with the possibility that achievement gains fade as control-group
children receive more and more direct instruction on achievement skills once they enter primary
school. This implies that ECE curricula that are designed to build broader cognitive skills, which
are usually thought of as less sensitive to instruction (e.g., vocabulary), may produce longer-
lasting impacts. For example, effective vocabulary instruction is relatively rare in ECE programs,
which tend to focus their instruction on narrower school-readiness skills such as identifying
letters and numbers (Bowne, Yoshikawa, & Snow, 2016).
The value of persisting cognitive skills, in the absence of achievement skill differences, is
unclear. Theoretically, improved cognitive skills, such as increased vocabulary and executive
functioning, are thought to be of importance because they improve children’s ability to learn in
the classroom—and these skills may be especially important in later grades when instruction is
more likely to come in the form of independent work and in which broader comprehension is
especially relevant. Yet, the fact that they are not accompanied by lasting achievement impacts,
which might be driven by improved cognitive skills, is a bit puzzling. One possible explanation
Running Head: TIMING IN EARLY CHILDHOOD EDUCATION
33
is that the achievement measures are not well aligned with later school content or are not
sensitive enough to capture meaningful differences in achievement skills.
The diminishing persistence of program impacts over time may be due to the fact that
many teachers fail to differentiate instruction for beginning and advanced students, which will
reduce the likelihood of continued academic growth relative to the expected growth of
comparison children who have not learned the content in preschool (Bennett, Desforges,
Cockburn, & Wilkinson, 1984; Engel et al., 2012). Although these patterns of declining impacts
are sometimes called “fadeout,” in the context of early-grade learning, when achievement gains
are rapid for almost all children, converging achievement trajectories of children in the pre-K
and comparison groups are better described as “catch up.” Unfortunately, we lack causal
evaluations of interventions of differential instruction in early childhood in the US to be able to
test this hypothesis. Moreover, a recent meta-analysis of studies pairing ECE programs with
high-quality early-grade classroom experiences failed to find consistent evidence of positive
interactions (Bailey et al., 2019).
Although the data reported in this paper confirm the positive impacts of a wide range of
center-based, early education programs throughout the early childhood period, the larger
magnitude of effects reported for infant-toddler services compared with preschool programs for
4-year-olds raises important questions about how we should allocate our ECE policy dollars.
Although impacts of the Early Head Start program were small (Love et al., 2002), our meta-
analysis showed that programs aimed at younger children tended to produce substantially larger
impacts than programs starting later. This suggests the importance of redoubling efforts to
develop scalable and effective early-childhood program models for infants and toddlers, while at
the same time being aware of the fact that the high staff ratios in center-based care for infants
Running Head: TIMING IN EARLY CHILDHOOD EDUCATION
34
and toddlers increases their expense substantially (e.g., Duncan and Sojourner, 2013) and that the
preschool programs that follow these early infant and toddler programs may amplify or diminish
their effects.
More nuanced descriptions of the center-based services and curricula delivered in these
programs, followed by analyses of their relation to the different developmental needs of infants,
toddlers, and preschoolers, would provide some of the additional data needed to interpret the
aggregated results reported in this paper. Unfortunately, our data set does not include the detailed
information on indicators of developmentally appropriate practice required to address these
questions.
While this paper is based on a rich meta-analytic database that covers almost 50 years of
research, there are certainly limitations to the conclusions we can draw. First, our research
funding enabled us to code up literature published between 1960 and 2007, but not studies
published more recently than 2007. A major development in US ECE programs over the past
two decades has been the growth of state-based pre-kindergarten programs and evidence from
very few pre-K evaluations are included in this paper. Phillips et al. (2017) compile evidence on
pre-K programs through 2017 and find “striking uniformity” in the evidence that pre-K programs
are successful in improving school-readiness skills at the end of the pre-K year. Longer-run
effects have rarely been assessed with random-assignment research designs. Two exceptions
were noted above: Lipsey et al. (2018) found null or even negative achievement impacts in third
grade in the Tennessee Voluntary PreK program, while Weiland et al. (2019) found similar null
to negative patterns for the Boston pre-K program. The possibility that attending a pre-
kindergarten program might hurt children’s longer-run prospects is novel, disturbing and very
much in need of further replication. Gormley et al. (2018) find scattered positive impacts of the
Running Head: TIMING IN EARLY CHILDHOOD EDUCATION
35
Tulsa’s pre-K program in their eighth-grade follow-up, although rely on propensity-score
matching methods rather than random assignment to generate their impact estimates.
Second, we can say nothing about the general effects of center care (e.g., from national
survey studies) because research design limitations of those studies led them to fail to meet our
selection criteria. In addition, our meta-analysis focused solely on studies conducted in the
United States and its protectorates, due to the very different research contexts of evaluations of
ECE in other nations. That said, recent reviews that focus on the effects of preprimary education
in low- and middle-income countries offer additional insights that are worthy of attention (Engle
et al., 2011; Britto et al., 2017; Rao et al., 2017).
Another limitation is that characteristics of children likely to select into these studies may
have changed over time as center-based and preschool programs spread in the 1980s and 1990s
(Duncan and Magnuson, 2013). Therefore, although we controlled for some demographic
features of populations such as SES and race, we were unable to control for other population
characteristics such as parent education and family structure. In terms of the timing findings,
there are limits to understanding the pace of decline of ECE program effects because virtually all
studies lack data about the quality of subsequent schooling or family changes. And finally, all of
the impacts presented in the paper compare children in early education programs to children in a
diverse array of counterfactual conditions, most of which are not well documented in the
evaluation studies we analyze.
As with any longitudinal impact study, another limitation to our analysis is that cognitive
measures, even if given the same label, may not be truly comparable at different ages and
developmental periods. This introduces a confound between age and measurement that is
impossible for us, or indeed for any researchers, to untangle.
Running Head: TIMING IN EARLY CHILDHOOD EDUCATION
36
In summary, this study shows that center-based, ECE for disadvantaged children, on
average, produces positive impacts of nearly one-quarter of a standard deviation on cognitive
skills and achievement scores at program completion. These data confirm the plasticity of
cognition and learning in early childhood and the potential capacity of interventions to improve
developmental outcomes that persist for several years beyond the end of program treatments,
despite their diminishing magnitude over time. These findings also highlight the need for new
intervention approaches that increase the impacts of additional months (or years) of program
services, as well as modified curricula for the early grades of school that build on the gains
produced by effective early childhood programs.

Running Head: TIMING IN EARLY CHILDHOOD EDUCATION
37
References
* Abbott-Shim, M., Lambert, R. and McCarty, F. (2003). A comparison of school readiness
outcomes for children randomly assigned to a Head Start program and the program's wait
list. Journal of Education for Students Placed at Risk 8(2): 191-214.
doi:10.1207/S15327671ESPR0802_2
Abenavoli, R. M. (2019). The mechanisms and moderators of “fade-out”: Towards
understanding why the skills of early childhood program participants converge over time
with the skills of other children. Psychological Bulletin, 145(12), 1103.
Ackerman, P. L. (2007). New developments in understanding skilled performance. Current
Directions in Psychological Science, 16, 235–239. doi: 10.1111/j.1467-
8721.2007.00511.x
* Ackerman Ross, F. S. (1985). The Relationship of Day Care to Middle-Class Three-Year-Olds'
Language Performance (Maternal Employment, Cognitive). Unpublished Ph.D.,
Memphis State University, United States -- Tennessee.
* Administration for Children and Families. Making a Difference in the Lives of Infants and
Toddlers and Their Families: The Impacts of Early Head Start. Washington, DC: U.S.
Department of Health and Human Services, 2002.
* Administration on Children, Youth and Families. (2001). Building their futures: How Early
Head Start programs are enhancing the lives of infants and toddlers in low-income
families. Washington, DC: Author.
* Allerhand, M. (1965). Impact of summer 1965 Head Start on children's concept attainment
during kindergarten. (ED 015 733)

Running Head: TIMING IN EARLY CHILDHOOD EDUCATION
38
* Ametjian, A. (1965). The effects of a preschool program upon the intellectual development and
social competency of lower class children. Doctoral dissertation, Stanford University,
Palo Alto, CA.
Aos, S., Lieb, R., Mayfield, J., Miller, M., & Pennucci, A. (2004). Benefits and costs of
prevention and early intervention programs for youth. Olympia: Washington State
Institute for Public Policy.
* Arnoult, Joseph F. A Comparison of the Psycholinguistic Abilities of Selected Groups of First
Grade Children. Dissertation Abstracts International, 1973, 33(7-A):3364-3365.
Arteaga, I., Humpage, S., Reynolds, A. J., & Temple, J. A. (2014). One year of preschool or two:
Is it important for adult outcomes?. Economics of Education Review, 40, 221-237.
doi:10.1016/j.econedurev.2013.07.009
Bailey, D., Duncan, G. J., Odgers, C. L., & Yu, W. (2016). Persistence and fadeout in the
impacts of child and adolescent interventions. Journal of Research on Educational
Effectiveness, 1-33.
Bailey, Drew H., Jade M. Jenkins, and Daniela Alvarez-Vargas. (2019). Complementarities
between Early Educational Intervention and Later Educational Quality? A Systematic
Review of the Sustaining Environments Hypothesis. (EdWorkingPaper: 19-99).
Retrieved from Annenberg Institute at Brown University:
http://www.edworkingpapers.com/ai19-99
Barnett, S. (1995). Long-term effects of early childhood programs on cognitive and school
outcomes. The Future of Children, 5, 25–50.
Running Head: TIMING IN EARLY CHILDHOOD EDUCATION
39
* Barnett, W.S., Frede, E.C., Mobasher, H. and Mohr, P. (1987). The efficacy of public
preschool programs and the relationship of program quality to efficacy. Education
Evaluation and Policy Analysis 10(1): 37-49. doi: 10.3102/01623737010001037
Barnett, W. S., & Lamy, C. (2006). Estimated impacts of numbers of years of preschool
attendance on vocabulary, literacy and math skills at kindergarten entry. New
Brunswick, NJ: National Institute for Early Education Research.
* Barnett, W. S., Jung, K., Lamy, C., Wong, V., & Cook, T. (2007). Effects of five state
prekindergarten programs on early learning. Paper presented at the SRCD annual
meeting, Boston, MA.
* Bittner, M., Rockwell, M. and Matthews, C. (1968). An evaluation of the preschool readiness
centers' program in East St. Louis, July 1, 1967 - June 30, 1968. Final Report. East St.
Louis, MO: Southern Illinois University, Center for the Study of Crime, Delinquency,
and Corrections. (ED 023 472)
* Blatt, B. and Garfunkel, F. (1969). The educability of intelligence: Preschool intervention with
disadvantaged children. Washington, DC: The Council for Exceptional Children Inc.
Borenstein, M., Hedges, L., Higgins, J., & Rothstein, H. (2005). Comprehensive Meta-analysis,
Version 2. Englewood NJ: Biostat.
Borenstein, M., Hedges, L. V., Higgins, J. P. T., & Rothstein, H. R. (2009). Introduction to
Meta-Analysis, West Sussex, UK: Wiley.
Bowne, J.B., Yoshikawa, H., & Snow, C.E. (2016). Experimental impacts of a teacher
professional development program in early childhood on observed explicit vocabulary
instruction across the curriculum. Early Childhood Research Quarterly, 34, 27-39.
Running Head: TIMING IN EARLY CHILDHOOD EDUCATION
40
Bradley, R. H., Corwyn, R. F., Burchinal, M., McAdoo, H. P. & García Coll, C. (2001), The
home environments of children in the United States part II: Relations with behavioral
development through age thirteen. Child Development, 72: 1868–1886. doi:
10.1111/1467-8624.t01-1-00383
* Bradshaw-McAnulty, G. & Delaney, L. (1979). An evaluation of the Mother-Child Home
Program, ESEA, Title-I. Pittsfield, MA: Pittsfield Public School District.
* Bridge, C.A., Townley, K.F., Hemmeter, M.L. and de Mesquita, P.B. (1995). Third party
evaluation of the Kentucky Education Reform Act preschool programs. Frankfort, KY:
Kentucky Department of Education. (ED 394 628)
Britto, P. R., Lye, S. J., Proulx, K., Yousafzai, A. K., Matthews, S. G., Vaivada, T., ... &
MacMillan, H. (2017). Nurturing care: promoting early childhood development. The
Lancet, 389(10064), 91-102.
* Brooks-Gunn, J., Liaw, F., and Klebanov, P. (1992). Effects of early intervention on low birth
weight preterm infants: What aspects of cognitive functioning are enhanced? Journal of
Pediatrics, 120(3), 350-359.
* Brooks-Gunn, J., McCarton, C.M., Casey, P.H., et al (1994). Early intervention in low-birth-
weight premature infants: Results through age 5 years from the infant health and
development program. Journal of the American Medical Association, 272(16), 1257-
1262.
Camilli, G., Vargas, S., Ryan, S., & Barnett, W. S. (2010). Meta-analysis of the effects of early
education interventions on cognitive and social development. Teachers College Record,
112(3).
Running Head: TIMING IN EARLY CHILDHOOD EDUCATION
41
* Campbel, F,. Ramey, C., Pungello, E., Sparling, J. (2002) Early Childhood Education: Young
Adults Outcomes from the Abecedarian Project. Applied Developmental Science. 6 (1)
42-57. doi: 10.1207/S1532480XADS0601_05
Campbell, F. A., Ramey, C. T., Pungello, E., Sparling, J., & Miller-Johnson, S. (2002). Early
childhood education: Young adult outcomes from the Abecedarian Project. Applied
developmental science, 6(1), 42-57.
Card, D.E. (1999). The causal effect of education on earnings. In O. Ashenfelter, & D. Card
(Eds.), Handbook of Labor Economics (Vol. 3, pp. 1801–63). Amsterdam: North-
Holland.
* Cataldo, C.Z. (1978). A follow-up study of early intervention, University of New York-
Buffalo, 1977. Dissertation Abstracts International, 39(2-A): 657.
* Chesterfield, R. et al (1982). An Evaluation of the Head Start Bilingual Bicultural Curriculum
Development Project. Final Report. (ERIC Document Reproduction Service No. ED 212
391)
Cheung, M.W.-L. (2014). MetaSEM: an R package for meta-analysis using structural equation
modeling. Frontiers in Psychology, 5 (1521). doi: 10.3389/fpsyg.2014.01521
Christian, K., Morrison, F. J., Frazier, J. A., & Massetti, G. (2000). Specificity in the nature and
timing of cognitive growth in kindergarten and first grade. Journal of Cognition and
Development, 1, 429–448. doi:10.1207/S15327647JCD0104_04
Cunha, F., & Heckman, J.J. (2007): The Technology of Skill Formation. American Economic
Review, 97, 31–47. doi: 10.1257/aer.97.2.31
* Cicarelli, V.G., Cooper, W.H. and Granger, R.L. (1969). The impact of Head Start: An
evaluation of the effects of Head Start on children’s cognitive and affective development.

Running Head: TIMING IN EARLY CHILDHOOD EDUCATION
42
Volume 2. Office of Economic Opportunity. Athens, OH: Westinghouse Learning
Corporation and Ohio University. PB 184 329.
* Currie, J. and Thomas, D. (1995). Does Head Start make a difference? The American
Economic Review 85: 341-364.
* Currie, J. and Thomas, D. (1999). Does Head Start help Hispanic children? Journal of Public
Economics 74: 235-262.
Currie, J., & Thomas, D. (2000). School quality and the longer-term effects of Head Start.
Journal of Human Resources, 35, 755–774. doi: 10.2307/146372
DerSimonian, R. & Laird, N. (1986). Meta-analysis in clinical trials. Controlled clinical trials
7:177-188.
* DeVito, P. & Karon, J. (1984). Parent-Child Home Program Chapter 1, ECIA Pittsfield Public
Schools Longitudinal Evaluation, Final Report. Pittsfield, MA: Pittsfield Public Schools.
* Di Lorenzo, L.T., Salter, R. and Brady, J.J. (1969). Prekindergarten programs for educationally
disadvantaged children. Final report. New York: New York State Department of
Education. (ED 038 460)
* Donna M. Bryant, Ellen S. Peisnar-Feinberg, and Richard M. Clifford, Evaluation of Public
Preschool Programs in North Carolina, University of North Carolina (Chapel Hill, N.C.:
1993)
Duncan, G. & Sojourner, A. (2013) Can Intensive Early Childhood Intervention Programs
Eliminate Income-Based Cognitive and Achievement Gaps? Journal of Human
Resources, Vol. 48, No. 4: 945-968. doi: 10.3368/jhr.48.4.945

Running Head: TIMING IN EARLY CHILDHOOD EDUCATION
43
* Dunham, R., Kidwell, J., & Portes, P. (1988). Effects of parent-adolescent interaction on the
continuity of cognitive development from early childhood to early adolescence. Journal
of Early Adolescence, 8(3), 297-310. doi: 10.1177/0272431688083006
Duval, S. J., & Tweedie, R. L. (2000a). Trim and fill: A simple funnel-plot-based method of
testing and adjusting for publication bias in meta-analysis. Biometrics, 56(2), 455–463.
Egger, M., Smith, G. D., Schneider, M., and Minder, C. (1997). Bias in meta-analysis detected
by a simple, graphical test. British Medical Journal 315,629-634. doi:
http://dx.doi.org/10.1136/bmj.315.7109.629
Engle, P. L., Fernald, L. C., Alderman H., Behrman J., O'Gara C., Yousafzai A., de Mello M. C.,
Hidrobo M., Ulkuer N., Ertem I., Iltus S.; Global Child Development Steering Group.
(2011). Strategies for reducing inequalities and improving developmental outcomes for
young children in low-income and middle-income countries. The Lancet, 378, (9799),
1339-1353. doi: 10.1016/S0140-6736(11)60889-1
* Erickson, E.L., McMillan, J., Bonnell, J., Hofman, L. and Callahan, O.D. (1969). Experiments
in Head Start and early education: The effects of teacher attitude and curriculum structure
on preschool disadvantaged children. Final report. 186. Office of Economic Opportunity,
Washington, DC. Washington, DC. Western Michigan University, Kalamazoo. Center for
Sociological Research. OEO-4130. (ED 041 615)
* Field, T., J. Pickens, J., Prodromidis M., Malphurs J., Fox N., Bendell D., Yando R.,
Schanberg S., & Kuhn C.. (2000). Targeting adolescent mothers with depressive
symptoms for early intervention. Adolescence 35(138): 381-414.
Running Head: TIMING IN EARLY CHILDHOOD EDUCATION
44
* Field, T., Widmayer, S., Greenberg, R., Stoller, S. (1982). Effects of parent training on teenage
mothers and their infants. Pediatrics, 69(6), 703-707. doi:
http://dx.doi.org/10.1097/00004583-198211000-00026
* Frede, E., Kwanghee, J., Barnett, S. W., Lamy, C. E. & Figueras, A. (June 2007) The Abbott
Preschool Program Longitudinal Effects Study (APPLES). Interim Report. Retrieved
2/1/2008 from http://nieer.org/resources/research/APPLES.pdf.
Gleser, L. & Olkin, I. (1994). Stochastically dependent effect sizes. In Cooper, H. and Hedges,
L. V. (Eds.), The handbook of research synthesis. (pp. 339-356). New York: Russell Sage
Foundation.
Gorey, K. M. (2001). Early childhood education: A meta-analytic affirmation of the short- and
long-term benefits of educational opportunity. School Psychology Quarterly, 16(1), 9–30.
doi: 10.1521/scpq.16.1.9.19163
* Gormley, W. T., Jr., & Gayer, T. (2005). Promoting School Readiness in Oklahoma. Journal of
Human Resources, 40(3), 533. doi: 10.3368/jhr.XL.3.533
* Gormley, W. T., Jr., Gayer, T., Phillips, D., & Dawson, B. (2005). The Effects of Universal
Pre-K on Cognitive Development. Developmental Psychology, 41(6), 872-884.
http://dx.doi.org/10.1037/0012-1649.41.6.872
Gormley Jr, W. T., Phillips, D., & Anderson, S. (2018). The Effects of Tulsa's Pre‐K Program on
Middle School Student Performance. Journal of Policy Analysis and Management, 37(1),
63-87.
* Gray, S.W., & Klaus, R.A. (1970). The Early Training Project: A seventh-year report. Child
Development, 41, 909-924 doi: 10.2307/1127321
Running Head: TIMING IN EARLY CHILDHOOD EDUCATION
45
* Gray, S.W., Ramsey, B.K. and Klaus, R.A. (1982). From 3 to 20: The early training project.
Baltimore: University Park Press.
Hackman, D., Farah, M. (2009). Socioeconomic status and the developing brain. Trends in
Cognitive Sciences, 13, 65-73. doi: 10.1016/j.tics.2008.11.003
Hedges, L. V., Tipton, R., & Johnson, M. C. (2010). Robust variance estimation in meta-
regression with dependent effect size estimates. Research synthesis methods, 1, 39-65.
doi: 10.1002/jrsm.5
* Herzog, E., Newcomb, C.H. and Cisin, I.H. (1973). Preschool and postscript: An evaluation of
the inner-city program. Washington, DC: Social Research Group, Washington
University. (ERIC Document Reproduction Service ED 118241)
* Hill, J. L., Brooks-Gunn, J., & Waldfogel, J. (2003). Sustained effects of high participation in
an early intervention for low-birth-weight premature infants. Developmental Psychology,
39(4), 730-744. http://dx.doi.org/10.1037/0012-1649.39.4.730
* Hines, B. W. (1971a). Attainment of Cognitive Objectives. Technical Report No. 14. ERIC
Document Reproduction Service No. ED 062 017.
* Hines, B. W. (1971b). Analysis of visual perception of children in the Early Childhood
Education Program. Technical Report No. 5. Charleston.
* Hines, B. W. (1971c). Detailed analysis of the language development of children in AEL's
Preschool Education Program. ERIC Document Reproduction Service ED 062 018.
* Hines, B. W. (1971d). Analysis of visual perception of children in the Appalachia Preschool
Education Program. ERIC Document Reproduction Service ED 062 019.
Hojman, A. (2015). Evidence on the fadeout of IQ gains from early childhood interventions: A
skill formation perspective. Chicago: University of Chicago, Department of Economics.

Running Head: TIMING IN EARLY CHILDHOOD EDUCATION
46
Hunter, J. E., & Schmidt, F. L. (1994). Correcting for sources of artificial variation across
studies. In Cooper, H. and Hedges, L. V. (Eds.), The handbook of research synthesis (pp.
323-338). New York: Russell Sage Foundation.
* Huron Institute. Cambridge, Massachusetts. Short Term Cognitive Effects of Head Start
Programs: A Report on the Third Year of Planned Variation.
* Hyman, I.A. and Kliman, D.S. (1967). First grade readiness of children who have had summer
Headstart programs. Training School Bulletin 63: 163-167.
* IHDP research team (1990). Enhancing the outcomes of low-birth-weight, premature infants: A
multisite, randomized trial. The Journal of the American Medical Association, 263, 3035-
3042.
Jacob, R. T., Creps, C. L., & Boulay, B. (2004). Meta-analysis of research and evaluation
studies in early childhood education. Cambridge, MA: Abt Associates Inc.
Jenkins, J. M., Farkas, G., Duncan, G. J., Burchinal, M., & Vandell, D. L. (2016). Head Start at
ages 3 and 4 versus Head Start followed by state pre-k: Which is more effective?
Educational evaluation and policy analysis, 38(1), 88-112.
Justice, L. M., Mashburn, A. J., Hamre, B. K., & Pianta, R. C. (2008). Quality of language and
literacy instruction in preschool classrooms serving at-risk pupils. Early Childhood
Research Quarterly, 23(1), 51-68.
* Karnes, Hodgins, and Teska (1969). The effects of early education with disadvantaged infants.
In Investigations of classroom and at-home interventions: Research and development
programs on preschool disadvantaged children.
* Karnes, M.B., Hodgins, A.S., Stoneburner, R.L., Studley, W.M. and Teska, J.A. (1968).
Effects of a highly structured program of language development on intellectual
Running Head: TIMING IN EARLY CHILDHOOD EDUCATION
47
functioning and psycholinguistic development of culturally disadvantaged three-year-
olds. The Journal of Special Education 2(4): 405-412.
* Keister, M. E. A demonstration project: Group care of infants and toddlers. Final report,
University of North Carolina at Greensboro, 1970.
Kishiyama, M., Boyce, W.T., Jimenez, A., Perry, L., & Knight, R. (2009). Socioeconomic
disparities affect prefrontal function in children. Journal of Cognitive Neuroscience
21(6), 1106-1115. doi: 10.1371/journal.pone.0035744
* Klaus, R.A., & Gray, S.W. (1968). The Early Training Project for Disadvantaged Children: A
report after five years. Monographs of the Society for Research in Child Development,
23(4).
* Klebanov, P. K., Brooks-Gunn, J., & McCormick, M. C. (2001). Maternal coping strategies
and emotional distress: results of an early intervention program for low birth weight
young children. Developmental Psychology, 37(5), 654-667. doi: 10.1037//0012-
1649.37.5.654
Knudsen E., Heckman, J., Cameron, J., & Shonkoff, J. (2006). Economic, neurobiological, and
behavioral perspectives on building America’s future workforce. PNAS, 103: 10155 -
10162. doi: 10.1073/pnas.0600888103
* Larson, D.E. (1972). Stability of gains in intellectual functioning among white children who
attended a preschool program in rural Minnesota. Final report., Office of Education
(DHEW). Mankato, MN: Mankato State College. (ED 066 227)
* Larson, D.F. (1969). The effects of a preschool experience upon intellectual functioning among
four-year-old, white children in rural Minnesota. Mankato: Minnesota State University,
College of Education. (ED 039 030)
Running Head: TIMING IN EARLY CHILDHOOD EDUCATION
48
Layzer, J. I., Goodson, B. D., Bernstein, L., & Price, C. (2001). National evaluation of family
support programs, volume A: The meta-analysis, final report. Cambridge, MA: Abt
Associates Inc.
* Lee, M., & Burchinal, M. (1987). Children of Poverty: A Multi-Level Analysis of the
Determinants of Intellectual Development.
Lee, V. E., & Loeb, S. (1995). Where do Head Start attendees end up? One reason why
preschool effects fade out. Educational Evaluation & Policy Analysis, 17,62 – 82. doi:
10.3102/01623737017001062
* Lewis, M.A., Salas, I., de la Sota, A., Chiofalo, N. Leake, B. (1990). Randomized trial of a
program to enhance the competencies of children with epilepsy. Epilepsia, 31, 101-109.
doi: 10.1111/j.1528-1157.1990.tb05367.x
Lipsey, M. W., Farran, D. C., & Durkin, K. (2018). Effects of the Tennessee Prekindergarten
Program on children’s achievement and behavior through third grade. Early Childhood
Research Quarterly, 45, 155-176.
Lipsey, M. W., & Wilson, D. B. (2001). Practical meta-analysis. Thousand Oaks, CA: Sage.
Loeb, S., Bridges, M., Bassok, D., Fuller, B.,& Rumberger, R.W. (2007). How much is too
much? The influence of preschool centers on children's social and cognitive
development. Economics of Education Review, 26, 52-66.
doi:10.1016/j.econedurev.2005.11.005
* Love, J. M., Kisker, E. E., Ross, C., Raikes, H., Constantine, J., Boller, K., et al. (2005). The
Effectiveness of Early Head Start for 3-Year-Old Children and Their Parents: Lessons for
Policy and Programs. Developmental Psychology, 41(6), 885-901.
http://dx.doi.org/10.1037/0012-1649.41.6.885
Running Head: TIMING IN EARLY CHILDHOOD EDUCATION
49
Love, J. M., Kisker, E. E., Ross, C. M., Schochet, P. Z., Brooks-Gunn, J., Paulsell, D., Boller, K.
(2002) Making a Difference in the Lives of Infants and Toddlers and Their Families: The
Impacts of Early Head Start. Volumes I-III: Final Technical Report [and] Appendixes
[and] Local Contributions to Understanding the Programs and Their Impacts.
Washington, D.C.: Administration on Children and Families.
* Ludwig, J. & Phillips, D. ( 2007). The benefits and costs of Head Start. Social Policy Report,
21(3), 3-13.
Lupien, S., McEwen, B., Gunnar, M., Heim, C. (2009). Effects of stress throughout the lifespan
on the brain, behavior, and cognition. Nature Reviews Neuroscience, 10 (June), 1-12.
doi:10.1038/nrn2639
* MacDonald, R. (1971). Analysis of Intelligence Scores. Technical Report No. 13. ERIC
Document Reproduction Service No. ED 062 016.
* Marcon, R.A. (1992). Differential effects of three preschool models on inner-city 4-year-olds.
Early Childhood Research Quarterly 7(4): 517-530. doi:10.1016/0885-2006(92)90060-C
* McCarton, Brooks-Gunn, Wallace, et al. (1997). Results at age 8 years of early intervention for
low-birth-weight premature infants: The infant health and development program. The
Journal of the American Medical Association, 277(2), 126-132.
* McCormick, M. C., McCarton, C., Tonascia, J., & Brooks-Gunn, J. (1993). Early educational
intervention for very low birth weight infants: results from the Infant Health and
Development Program. Journal of Pediatrics, 123(4), 527-533. doi:10.1016/S0022-
3476(05)80945-X
* Miller, L. and Bizzell (1983). Long-Term Effects of Four Preschool Programs: Ninth- and
Tenth-Grade Results. Child Development, 55(4), 1570-1587. doi: 10.2307/1130027
Running Head: TIMING IN EARLY CHILDHOOD EDUCATION
50
* Montgomery County Public Schools. Rockville, Maryland. Impact of the Head Start program.
Phase I of a projected longitudinal study. 1970.
* Morris, B. and Morris, G.L. (1966). Evaluation of changes occurring in children who
participated in project Head Start. Kearney, NE: Kearney State College. (ERIC
Document Reproduction Service No. ED 017 316)
* Nedler, S. (1970). Early education for Spanish speaking Mexican American children: A
comparison of three intervention strategies. (Washington: American Educational
Research Association/Austin: Southwest Educational Development Laboratory, 1970).
* Nummedal, S.G. and Stern, C. (1971). Head Start graduates: One year later. Paper presented at
the annual meeting of the American Educational Research Association, New York, NY.
Olkin, I. & Gleser, L. (1994). Stochastically dependent effect sizes. In Cooper, H. & Hedges, L.
V. (Eds.), The handbook of research synthesis. (pp. 339-356). New York: Russell Sage
Foundation.
* Peck, C. J. & Bridge, C. (1993). Third party evaluation. Kentucky Education Reform Act
(KERA) preschool programs. Lexington: University of Kentucky, College of Education
and College of Human Environmental Sciences.
Phillips, D., Lipsey, M., Dodge, K. A., Haskins, R., Bassok, D., Burchinal, M. R., & Weiland, C.
(2017). Puzzling it out: The current state of scientific knowledge on pre-kindergarten
effects. Washington, DC: Brookings Institution.
* Pilcher, L.C. (1994). Georgia Prekindergarten Program Evaluation with Executive Summary.
Atlanta, GA: Georgia State University Early Childhood Education.
Running Head: TIMING IN EARLY CHILDHOOD EDUCATION
51
* Porter, P.J., Leodas, C., Godley, R.A. and Budroff, M. (1965). Evaluation of Headstart
educational program in Cambridge, Massachusetts. Final Report. Cambridge, MA:
Harvard University. (ED 013 668)
Puma, M., Bell, S., Cook, R., Heid, C., Shapiro, G., Broene, P., et al. (2010). Head Start impact
study: Final report. Washington, DC: US Department of Health and Human Services,
Administration for Children and Families.
Ramey, C. T., & Campbell, F. A. (1984). Preventive education for high-risk children: Cognitive
consequences of the Carolina Abecedarian Project. American Journal of Mental
Deficiency, 88(5), 515-523.
* Ramey, C.T., & Campbell, F. A. (1984). Preventive education for high-risk children: Cognitive
consequences of the Carolina Abecedarian Project. American Journal of Mental
Deficiency, 88(5), 515-523.
Rao, N., Sun, J., Chen, E. E., & Ip, P. (2017). Effectiveness of early childhood interventions in
promoting cognitive development in developing countries: A systematic review and
meta-analysis. Hong Kong Journal of Paediatrics (New Series), 22(1), 14-25.
* Rescorla, L. A., Provence, S., & Naylor, A. (1982). The Yale Child Welfare Research
Program: Description and results. In E. F. Zigler & E. Gordon (Eds.), Day care: Scientific
and social policy issues (pp. 183-199). Boston, MA: Auburn House Publishing Company.
* Reynolds, A.J. (1995) One year of preschool intervention or two: Does it matter? Early
Childhood Research Quarterly, 10, 1‑31. doi:10.1016/0885-2006(95)90024-1
Reynolds, A. J. (2000). Success in early intervention: The Chicago child parent centers.
University of Nebraska Press.
Running Head: TIMING IN EARLY CHILDHOOD EDUCATION
52
Reynolds, A. J., & Temple, J. A. (1998). Extended early childhood intervention and school
achievement: Age thirteen findings from the Chicago Longitudinal Study. Child
Development, 69(1), 231-246.
Reynolds, A. J., Richardson, B. A., Hayakawa, M., Lease, E. M., Warner-Richter, M., Englund,
M. M., Ou, S., & Sullivan, M. (2014). Association of a full-day vs part-day preschool
intervention with school readiness, attendance, and parent involvement. Journal of the
American Medical Association, 312(20), 2126-2134. doi:10.1001/jama.2014.15376
* Ricciuti, A. E. S. P. R. G., Lee, W., Parsad, A., Institute of Education Sciences, W. D. C., &
Abt Associates, I. W. D. C. (2004). Third National Even Start Evaluation: Follow-Up
Findings from the Experimental Design Study. NCEE 2005-3002: National Center for
Education Evaluation and Regional Assistance NCEE.
* Roberts, J. E., Rabinowitch, S., Bryant, D. M., Burchinal, M. R., Koch, M. A. and Ramey, C.
T. (1989). Language skills of children with different preschool experiences. Journal of
Speech, Language, and Hearing Research 32(4): 773-786.
* Robertson, S. B. and S. E. Weismer (1999). Effects of treatment on linguistic and social skills
in toddlers with delayed language development. Journal of Speech, Language, and
Hearing Research 42(5): 1234-1248. doi: 10.1044/jslhr.4205.1234
Robin, K. B., Frede, E. C., & Barnett, W. S. (2006). Is more better? The effects of full-day vs.
half-day preschool on early school achievement. New Brunswick, NJ: NIEER.
* Rubenstein, J. L., Howes, C., & Boyle, P.. (1981). A Two-Year Follow-Up of Infants in
Community-Based Day Care. Journal of Child Psychology and Psychiatry and Allied
Disciplines, 22(3), 209. doi: 10.1111/j.1469-7610.1981.tb00547.x

Running Head: TIMING IN EARLY CHILDHOOD EDUCATION
53
Sammons, P., Sylva, K., Melhuish, E., Siraj-Blatchford, I., Taggart, B., & Elliot, K. (2002).
Measuring the impact of pre-school on children’s cognitive progress over the pre-school
period (Technical paper 8a). London Institute of Education.
Sapolsky, R. (2004). Mothering style and methylation. Nature Neuroscience,7:791-792.
doi:10.1038/nn0804-791
* Schmitt, D.R. (1994). Longitudinal study of a bilingual program for four year olds. Paper
presented at the annual meeting of the Association of Louisiana Evaluators, New Orleans,
LA: University of New Orleans.
Schweinhart, L., & Weikart, D. (1988). Education for young children living in poverty: Child-
initiated learning or teacher-directed instruction? Elementary School Journal, 89, 213-
225. doi: 10.1086/461574
Schweinhart, L.J., Barnes, H., & Weikart, D. (1993). Significant benefits the High/Scope Perry
preschool study through age 27. High-scope educational research foundation, Ypsilanti,
MI, Monograph #10.
* Schweinhart, L.J., Barnes, H.V., & Weikart, D.P. (1993). Significant benefits of the High-
Scope Perry preschool study through age 27. Ypsilanti, MI: High/Scope Press.
Shager, H. M., Schindler, H. S., Hart, C. M. D., Duncan, G. J., Magnuson, K. A., & Yoshikawa,
H. (2010). Using Meta-Analysis to Explain Variation in Head Start Research Results:
The Role of Research Design. The SREE Annual Research Conference, Washington,
D.C., March 4.
Shonkoff, J. (2010). Building an enhanced biodevelopmental framework to guide the future of
early childhood policy. Child Development, 81(1), 343-353. doi: 10.1111/j.1467-
8624.2009.01399.x
Running Head: TIMING IN EARLY CHILDHOOD EDUCATION
54
Shonkoff, J., Boyce, W.T., McEwen, B (2009). Neuroscience, molecular biology, and the
childhood roots of health disparities: Building a new framework for health promotion and
disease prevention. Journal of the American Medical Association 301(21):2252-2259.
doi: 10.1001/jama.2009.754.
Shonkoff, J., & Phillips, D. (Eds.) (2000). From Neurons to Neighborhoods: The Science of
Early Childhood Development. Committee on Integrating the Science of Early Childhood
Development, Board on Children, Youth, and Families, Commission on Behavioral and
Social Sciences and Education. Washington, DC, National Academy Press
Shonkoff, J. P., Richmond, J., Levitt, P., Bunge, S. A., Cameron, J. L., Duncan, G. J., & Nelson
III, C. A. (2016). From best practices to breakthrough impacts a science-based approach
to building a more promising future for young children and families. Cambridge, MA:
Harvard University, Center on the Developing Child.
* Sontag, M., Sella, A.P. and Thorndike, R.L. (1969). The effect of Head Start training on the
cognitive growth of disadvantaged children. The Journal of Educational Research 62(9):
387-389.
Sprigle, J.E., & Schaefer, L. (1985). Longitudinal evaluation of the effects of two compensatory
preschool programs on fourth- through sixth-grade students. Developmental Psychology,
21, 702-708. doi: 10.1037/0012-1649.21.4.702
* St. Pierre, R., Swartz, J., Gamse, B., Murray, S., Deck, D., & Nickel, P. (1995). National
evaluation of Even Start Family Literacy Program: Final report. Cambridge, MA: Abt
Associates Inc.
Running Head: TIMING IN EARLY CHILDHOOD EDUCATION
55
* St. Pierre, R. G., Layzer, J. I., Goodson, B. D., & Bernstein, L. S. (1997). National Impact
Evaluation of the Comprehensive Child Development Program. Cambridge, MA: Abt
Associates, Inc.
* St. Pierre, R. G., Ricciuti, A. E., & Rimdzius, T. A. (2005). Effects of a Family Literacy
Program on Low-Literate Children and Their Parents: Findings From an Evaluation of
the Even Start Family Literacy Program. Developmental Psychology, 41(6), 953-970.
http://dx.doi.org/10.1037/0012-1649.41.6.953
Tamis-LeMonda, C. S., Bornstein, M. H., & Baumwell, L. (2001). Maternal responsiveness and
children's achievement of language milestones. Child Development, 72, 748–767. doi:
10.1111/1467-8624.00313
* U.S. Department of Health and Human Services, Administration for Children and Families
(2005), Head Start Impact Study: First Year Findings, Washington, DC.
* U.S. Department of Health and Human Services, Administration for Children and Families.
(2006), Preliminary findings from the Early Head Start prekindergarten followup.
Washington, DC: U.S. Department of Health and Human Services, Administration for
Children and Families.
U.S. Department of Health and Human Services, Administration for Children and Families
(January 2010). Head Start Impact Study. Final Report. Washington, DC.
* Vance, B.J. (1967). The effect of preschool group experience on various language and social
skills in disadvantaged children. Final report. (ERIC Document Reproduction Service
No. ED 019 989)
Viechtbauer, W. (2010). Conducting meta-analyses in R with the metafor package. Journal of
Statistical Software, 36(3), 1–48. http://www.jstatsoft.org/v36/i03/.

Running Head: TIMING IN EARLY CHILDHOOD EDUCATION
56
* Warden, B.A. (1998). A study to determine the effectiveness of preschool on kindergarten
readiness and achievement. Master's thesis. Master of Arts Degree Program, Salem-
Teikyo University, Salem, WV.
* Wasik, B.H., Ramey, C.T., Bryant, D.M., Sparling, J.J. (1990). A longitudinal study of two
early intervention strategies: Project CARE. Child Development, 61, 1682-1696. doi:
10.1111/j.1467-8624.1990.tb03559.x
* Weikart, D.P., Bond, J.T. and McNeil, J.T. (1978). The Ypsilanti Perry Pre-School Project:
Pre-school years and longitudinal results through fourth grade. Monographs of the
High/Scope Educational Research Foundation 3 (Ypsilanti, MI: High/Scope Press. 04104
Weiland, C., Unterman, R., Shapiro, A., Staszak, S., Rochester, S., & Martin, E. (forthcoming,
2019). The effects of enrolling in oversubscribed prekindergarten programs through third
grade. Child Development.
* Xiang, Z. and Schweinhart, L.J. (2002). Effects five years later: The Michigan School
Readiness Program evaluation through age 10. Michigan State Board of Education.
Ypsilanti, MI: High/Scope Educational Research Foundation.
Yoshikawa, H., Aber, J.L., & Beardslee, W.R. (2012). Poverty and the mental, emotional and
behavioral health of children and youth: Implications for prevention science. American
Psychologist, 67, 272-284. doi: 10.1037/a0028015
* Young-Joo, K. (2007). The return to private school and education-related policy. University of
Wisconsin (dissertation).
* Zigler, E. F., Abelson, W. D., Trickett, P. K., & Seitz, V. (1982). Is an intervention program
necessary in order to improve economically disadvantaged children's IQ scores? Child
Development 53(2): 340-348. doi: 10.2307/1128975

Running Head: TIMING IN EARLY CHILDHOOD EDUCATION
57
Zigler, E., & Trickett, P. K. (1978). IQ, social competence, and evaluation of early childhood
intervention programs. American Psychologist, 33(9), 789
Note: Asterisks (*) indicate papers or research reports for the studies in the meta‐analysis.
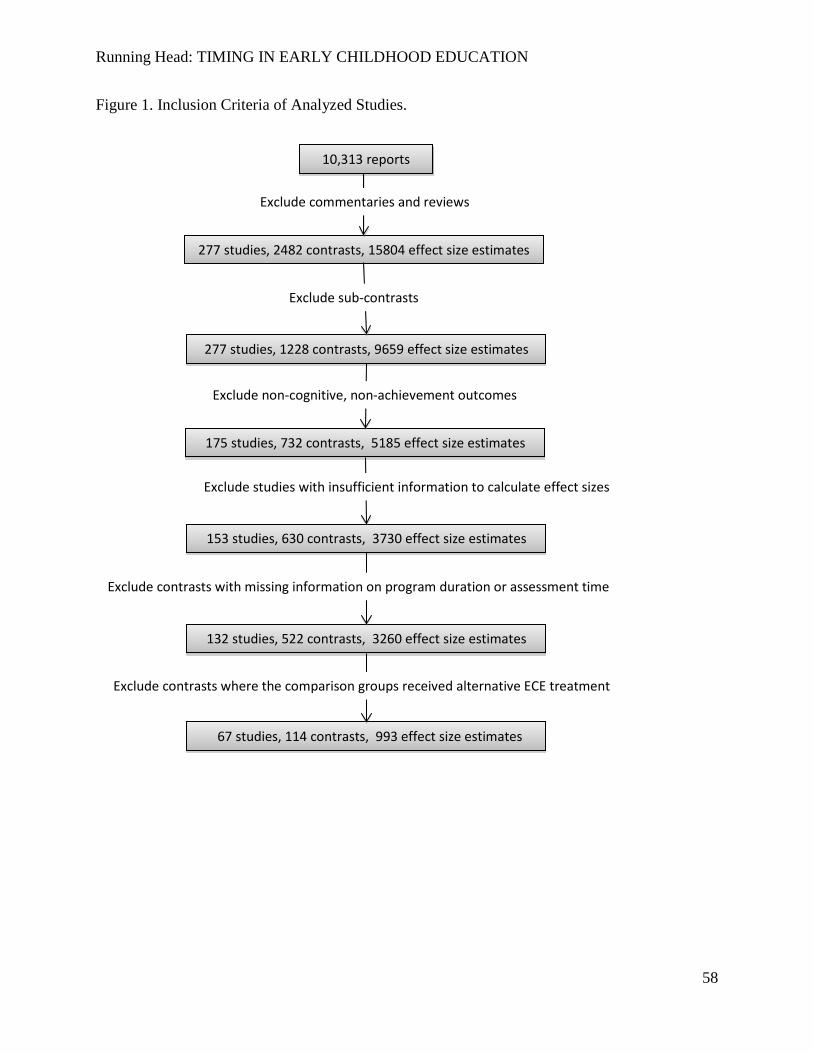
Running Head: TIMING IN EARLY CHILDHOOD EDUCATION
58
Figure 1. Inclusion Criteria of Analyzed Studies.
10,313 reports
277 studies, 2482 contrasts, 15804 effect size estimates
277 studies, 1228 contrasts, 9659 effect size estimates
Exclude sub-contrasts
175 studies, 732 contrasts, 5185 effect size estimates
153 studies, 630 contrasts, 3730 effect size estimates
132 studies, 522 contrasts, 3260 effect size estimates
67 studies, 114 contrasts, 993 effect size estimates
Exclude non-cognitive, non-achievement outcomes
Exclude studies with insufficient information to calculate effect sizes
Exclude contrasts with missing information on program duration or assessment time
Exclude contrasts where the comparison groups received alternative ECE treatment
Exclude commentaries and reviews
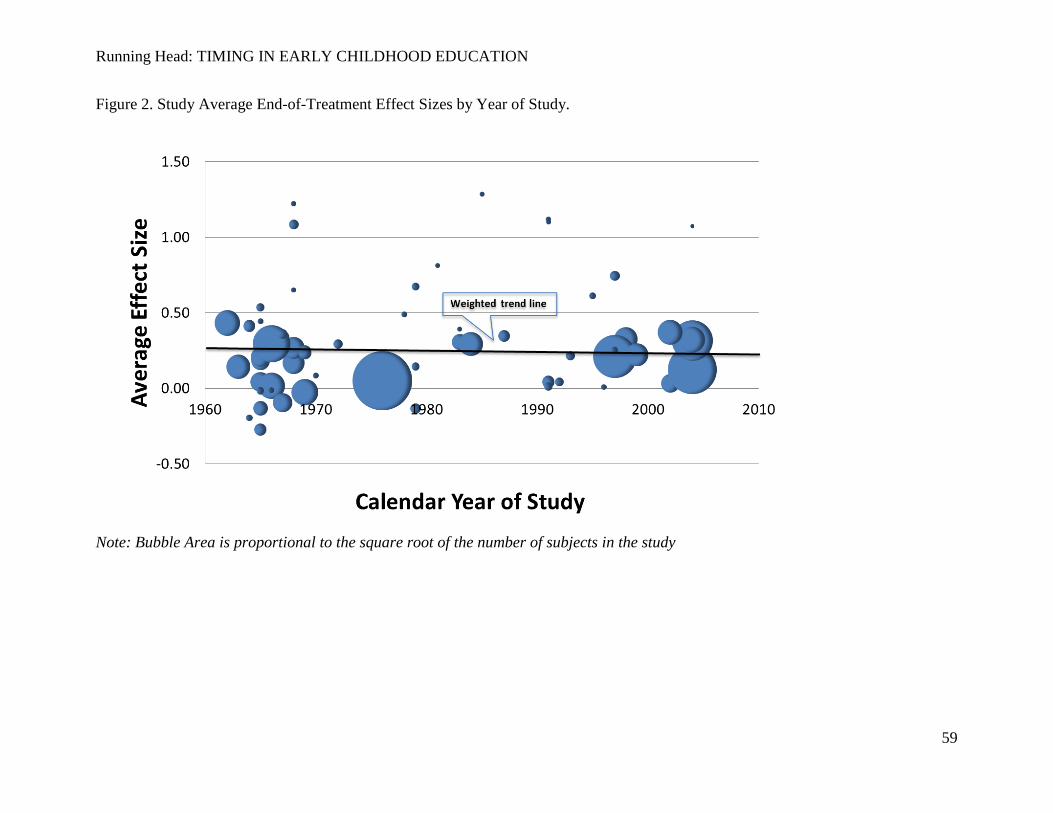
Running Head: TIMING IN EARLY CHILDHOOD EDUCATION
59
Figure 2. Study Average End-of-Treatment Effect Sizes by Year of Study.
Note: Bubble Area is proportional to the square root of the number of subjects in the study
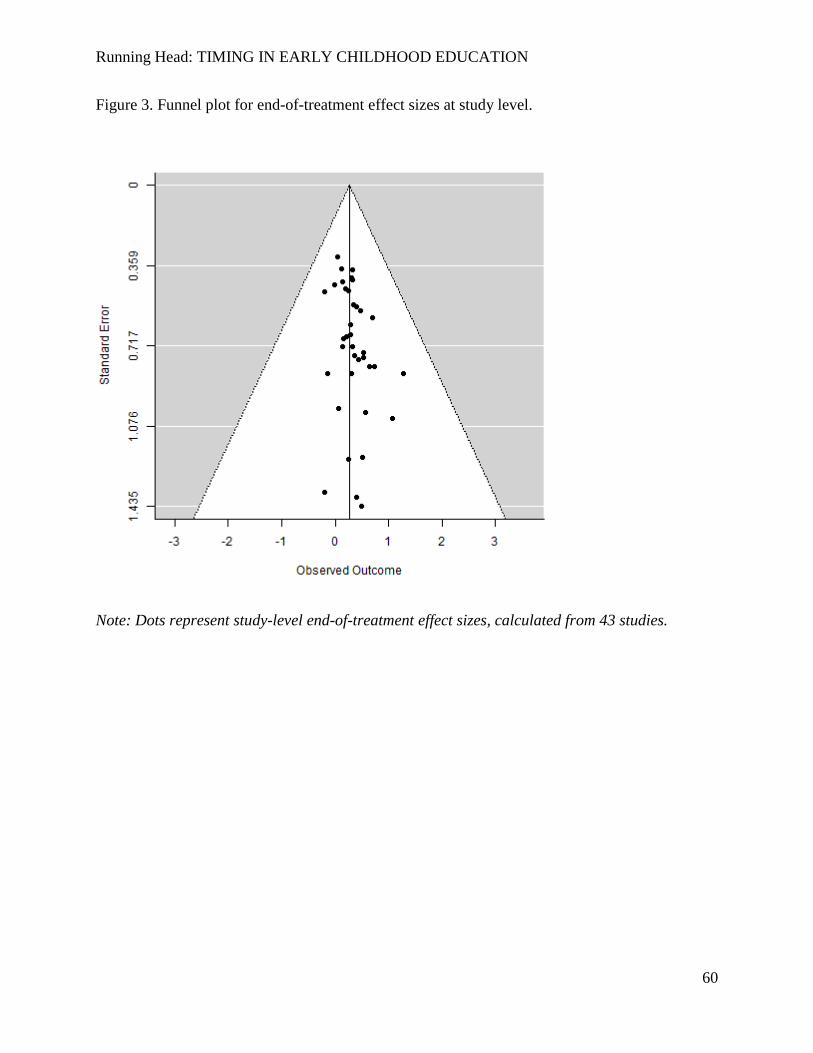
Running Head: TIMING IN EARLY CHILDHOOD EDUCATION
60
Figure 3. Funnel plot for end-of-treatment effect sizes at study level.
Note: Dots represent study-level end-of-treatment effect sizes, calculated from 43 studies.
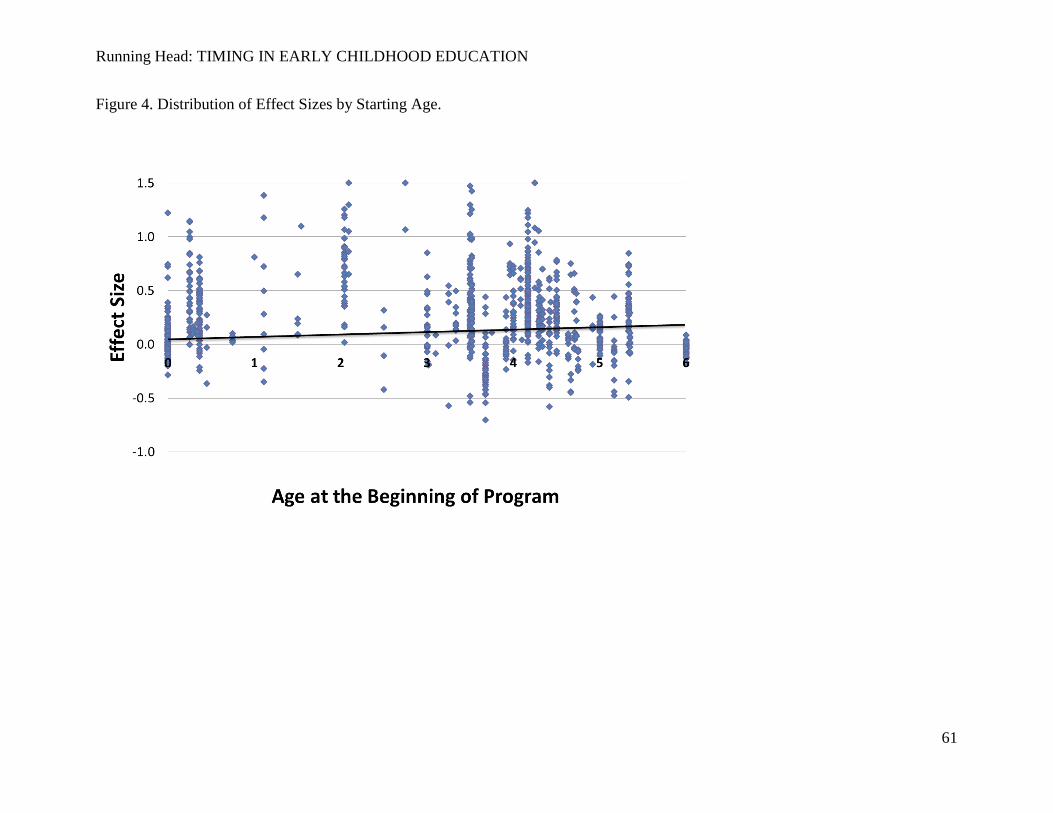
Running Head: TIMING IN EARLY CHILDHOOD EDUCATION
61
Figure 4. Distribution of Effect Sizes by Starting Age.
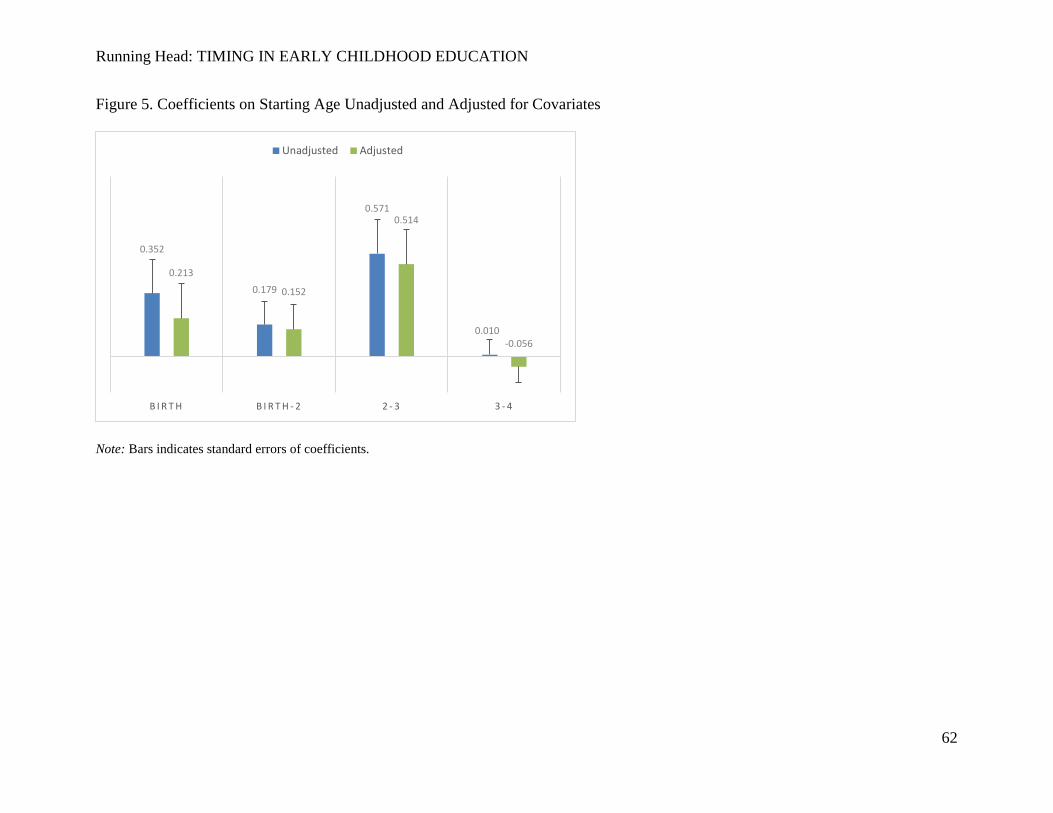
Running Head: TIMING IN EARLY CHILDHOOD EDUCATION
62
Figure 5. Coefficients on Starting Age Unadjusted and Adjusted for Covariates
Note: Bars indicates standard errors of coefficients.
0.352
0.179
0.571
0.010
0.213
0.152
0.514
-0.056
B I R T H B I R T H - 2 2 - 3 3 - 4
Unadjusted Adjusted
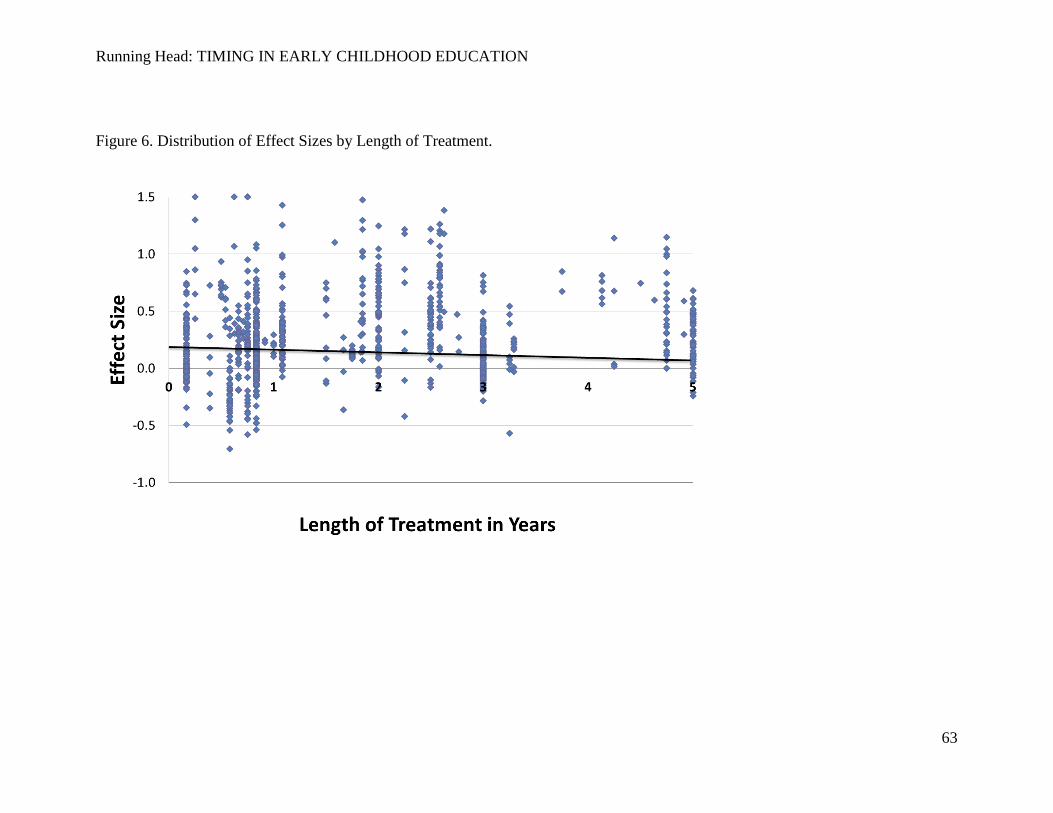
Running Head: TIMING IN EARLY CHILDHOOD EDUCATION
63
Figure 6. Distribution of Effect Sizes by Length of Treatment.
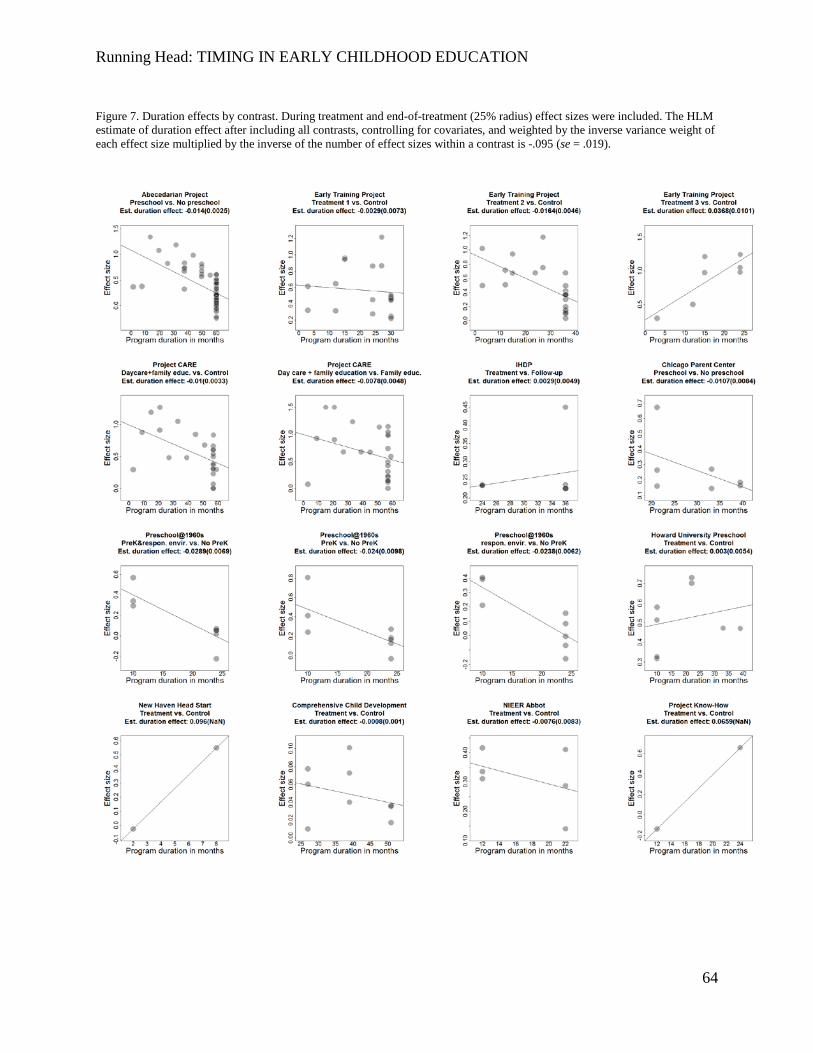
Running Head: TIMING IN EARLY CHILDHOOD EDUCATION
64
Figure 7. Duration effects by contrast. During treatment and end-of-treatment (25% radius) effect sizes were included. The HLM estimate of duration effect after including all contrasts, controlling for covariates, and weighted by the inverse variance weight of each effect size multiplied by the inverse of the number of effect sizes within a contrast is -.095 (se = .019).
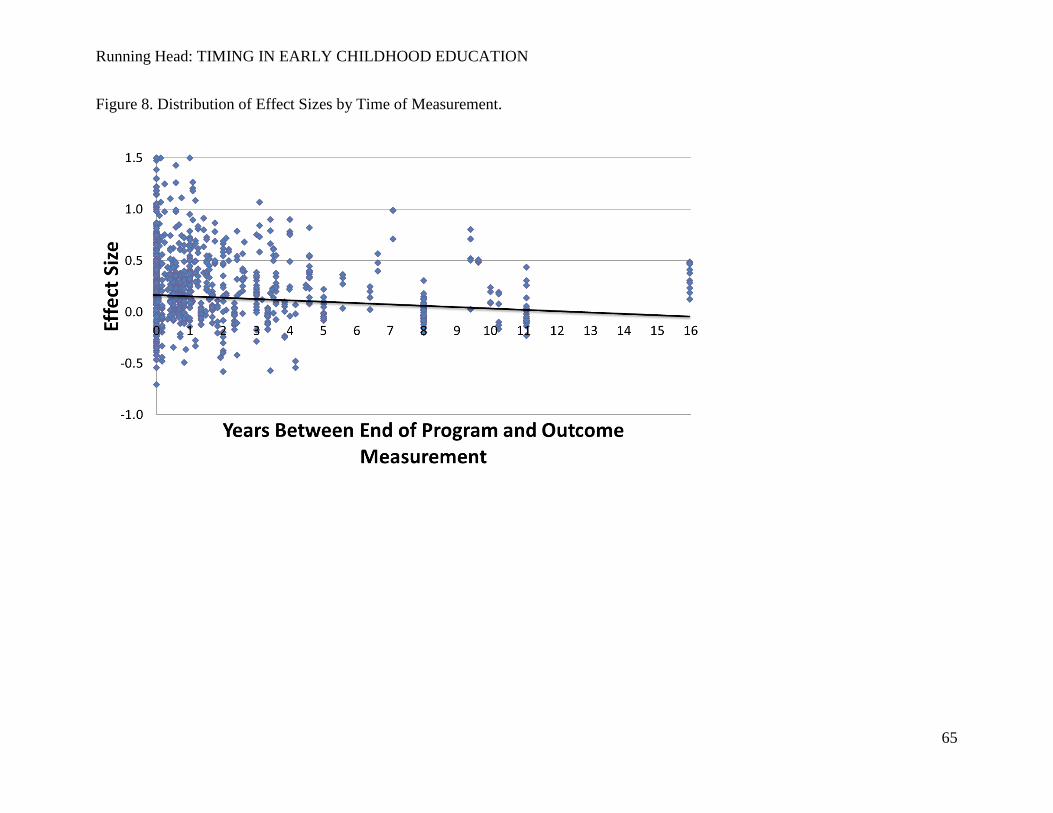
Running Head: TIMING IN EARLY CHILDHOOD EDUCATION
65
Figure 8. Distribution of Effect Sizes by Time of Measurement.
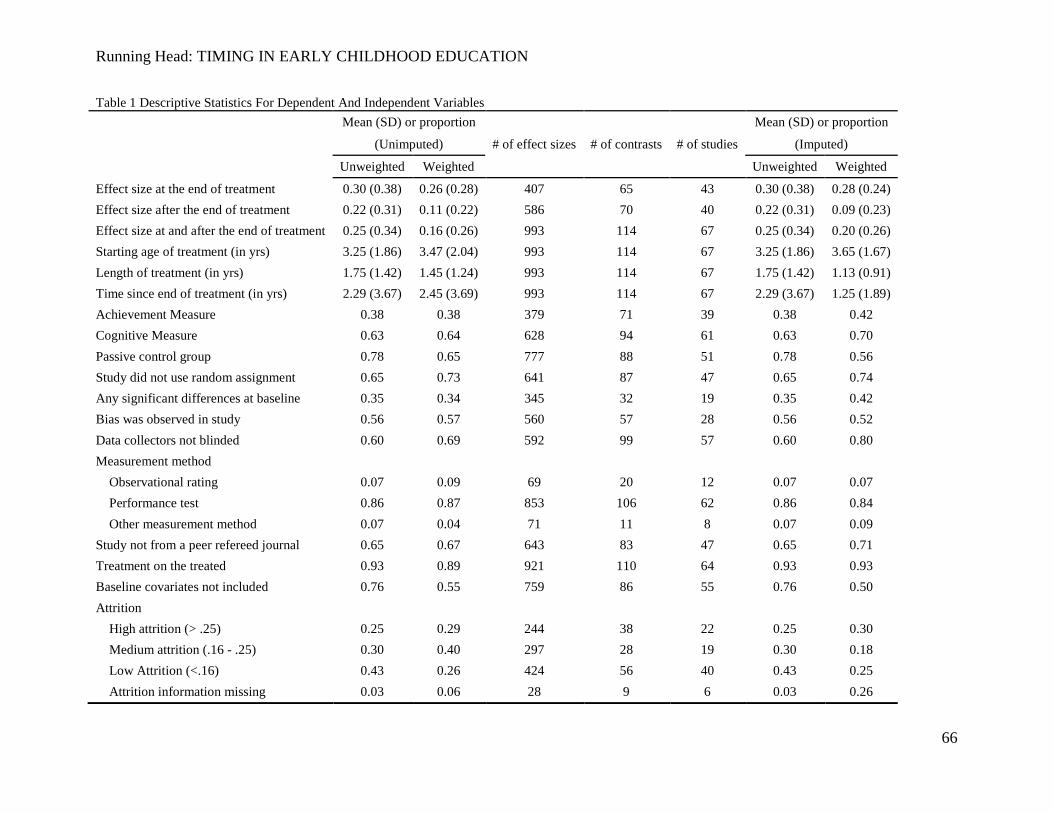
Running Head: TIMING IN EARLY CHILDHOOD EDUCATION
66
Table 1 Descriptive Statistics For Dependent And Independent Variables
Mean (SD) or proportion
# of effect sizes # of contrasts # of studies
Mean (SD) or proportion
(Unimputed) (Imputed)
Unweighted Weighted Unweighted Weighted
Effect size at the end of treatment 0.30 (0.38) 0.26 (0.28) 407 65 43 0.30 (0.38) 0.28 (0.24) Effect size after the end of treatment 0.22 (0.31) 0.11 (0.22) 586 70 40 0.22 (0.31) 0.09 (0.23) Effect size at and after the end of treatment 0.25 (0.34) 0.16 (0.26) 993 114 67 0.25 (0.34) 0.20 (0.26) Starting age of treatment (in yrs) 3.25 (1.86) 3.47 (2.04) 993 114 67 3.25 (1.86) 3.65 (1.67) Length of treatment (in yrs) 1.75 (1.42) 1.45 (1.24) 993 114 67 1.75 (1.42) 1.13 (0.91) Time since end of treatment (in yrs) 2.29 (3.67) 2.45 (3.69) 993 114 67 2.29 (3.67) 1.25 (1.89) Achievement Measure 0.38 0.38 379 71 39 0.38 0.42 Cognitive Measure 0.63 0.64 628 94 61 0.63 0.70 Passive control group 0.78 0.65 777 88 51 0.78 0.56 Study did not use random assignment 0.65 0.73 641 87 47 0.65 0.74 Any significant differences at baseline 0.35 0.34 345 32 19 0.35 0.42 Bias was observed in study 0.56 0.57 560 57 28 0.56 0.52 Data collectors not blinded 0.60 0.69 592 99 57 0.60 0.80 Measurement method Observational rating 0.07 0.09 69 20 12 0.07 0.07 Performance test 0.86 0.87 853 106 62 0.86 0.84 Other measurement method 0.07 0.04 71 11 8 0.07 0.09 Study not from a peer refereed journal 0.65 0.67 643 83 47 0.65 0.71 Treatment on the treated 0.93 0.89 921 110 64 0.93 0.93 Baseline covariates not included 0.76 0.55 759 86 55 0.76 0.50 Attrition High attrition (> .25) 0.25 0.29 244 38 22 0.25 0.30 Medium attrition (.16 - .25) 0.30 0.40 297 28 19 0.30 0.18 Low Attrition (<.16) 0.43 0.26 424 56 40 0.43 0.25 Attrition information missing 0.03 0.06 28 9 6 0.03 0.26
Running Head: TIMING IN EARLY CHILDHOOD EDUCATION
67
Table 1 Descriptive Statistics For Dependent And Independent Variables (Continued)
Mean (SD) or proportion
# of effect sizes # of contrasts # of studies
Mean (SD) or proportion
(Unimputed) (Imputed)
Unweighted Weighted Unweighted Weighted
Low reliability (< .88) 0.27 0.36 264 26 15 0.27 0.15 Missing Reliability 0.62 0.57 620 97 58 0.62 0.74 Study conducted before 1980 0.71 0.53 704 68 36 0.71 0.35 Race >50% White 0.12 0.09 123 13 10 0.12 0.07 >50% Black 0.43 0.29 423 40 27 0.43 0.20 >50% Hispanic 0.04 0.06 41 7 6 0.04 0.06 No Racial Group > 50% 0.13 0.22 128 21 14 0.13 0.44 Race Missing or Other 0.28 0.34 278 33 19 0.28 0.24 % Low Income (>90.8%) 0.57 0.34 568 60 41 0.57 0.33 % Low Income (<90.8%) 0.32 0.48 321 47 21 0.32 0.53 % Low Income Missing 0.10 0.19 104 7 6 0.10 0.14 % Male 0.46 (0.16) 0.41 (0.2) 993 114 67 0.46 (0.16) 0.43 (0.18) Missing Gender 0.37 0.50 370 47 28 0.37 0.37 Any Family Support Services 0.79 0.84 783 69 38 0.79 0.71 No Family Support Services 0.06 0.03 62 17 11 0.06 0.07 Any Family Support Services Missing 0.15 0.13 148 28 21 0.15 0.21 Research/Demonstration Programs 0.49 0.32 489 27 20 0.49 0.11 Quality Index 3.79 (1.55) 3.5 (1.33) 373 41 26 3.74 (1.68) 3.91 (1.62)
Note: These data are based on 993 effect sizes, drawn from 114 contrasts and 67 studies.
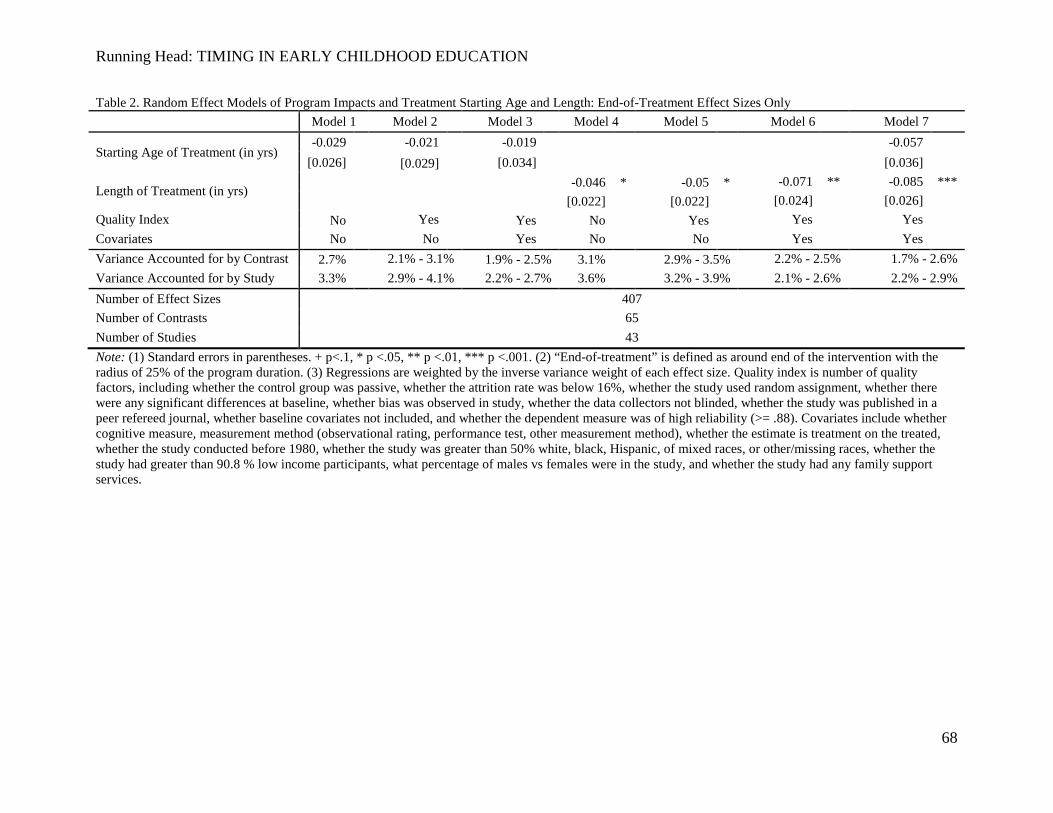
Running Head: TIMING IN EARLY CHILDHOOD EDUCATION
68
Table 2. Random Effect Models of Program Impacts and Treatment Starting Age and Length: End-of-Treatment Effect Sizes Only
Model 1 Model 2 Model 3 Model 4 Model 5 Model 6 Model 7
Starting Age of Treatment (in yrs) -0.029
-0.021 -0.019 -0.057
[0.026]
[0.029]
[0.034]
[0.036] Length of Treatment (in yrs)
-0.046 * -0.05 * -0.071 ** -0.085 ***
[0.022]
[0.022]
[0.024] [0.026]
Quality Index No
Yes Yes
No
Yes
Yes Yes Covariates No No Yes No No Yes Yes Variance Accounted for by Contrast 2.7%
2.1% - 3.1% 1.9% - 2.5% 3.1%
2.9% - 3.5% 2.2% - 2.5% 1.7% - 2.6%
Variance Accounted for by Study 3.3% 2.9% - 4.1% 2.2% - 2.7% 3.6% 3.2% - 3.9% 2.1% - 2.6% 2.2% - 2.9% Number of Effect Sizes 407 Number of Contrasts 65 Number of Studies 43 Note: (1) Standard errors in parentheses. + p<.1, * p <.05, ** p <.01, *** p <.001. (2) “End-of-treatment” is defined as around end of the intervention with the radius of 25% of the program duration. (3) Regressions are weighted by the inverse variance weight of each effect size. Quality index is number of quality factors, including whether the control group was passive, whether the attrition rate was below 16%, whether the study used random assignment, whether there were any significant differences at baseline, whether bias was observed in study, whether the data collectors not blinded, whether the study was published in a peer refereed journal, whether baseline covariates not included, and whether the dependent measure was of high reliability (>= .88). Covariates include whether cognitive measure, measurement method (observational rating, performance test, other measurement method), whether the estimate is treatment on the treated, whether the study conducted before 1980, whether the study was greater than 50% white, black, Hispanic, of mixed races, or other/missing races, whether the study had greater than 90.8 % low income participants, what percentage of males vs females were in the study, and whether the study had any family support services.
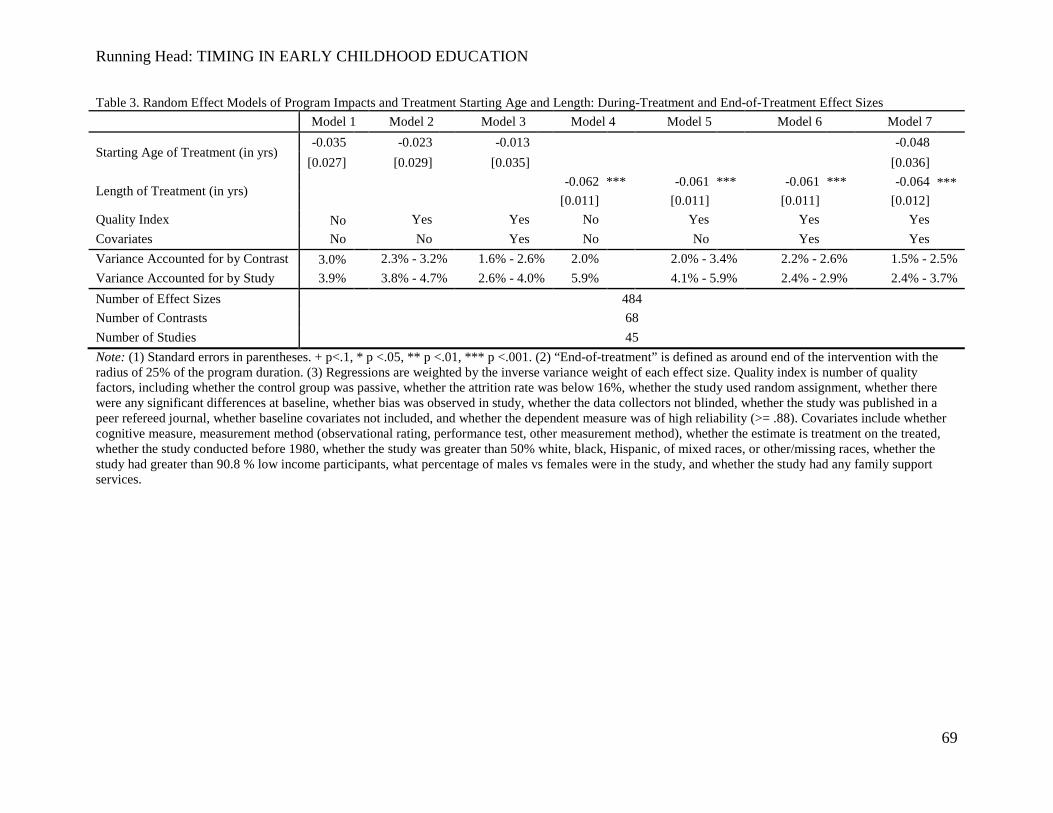
Running Head: TIMING IN EARLY CHILDHOOD EDUCATION
69
Table 3. Random Effect Models of Program Impacts and Treatment Starting Age and Length: During-Treatment and End-of-Treatment Effect Sizes
Model 1 Model 2 Model 3 Model 4 Model 5 Model 6 Model 7
Starting Age of Treatment (in yrs) -0.035 -0.023 -0.013 -0.048
[0.027] [0.029] [0.035] [0.036] Length of Treatment (in yrs) -0.062 *** -0.061 *** -0.061 *** -0.064 ***
[0.011] [0.011] [0.011] [0.012] Quality Index No
Yes Yes No Yes Yes Yes
Covariates No No Yes No No Yes Yes Variance Accounted for by Contrast 3.0%
2.3% - 3.2% 1.6% - 2.6% 2.0% 2.0% - 3.4% 2.2% - 2.6% 1.5% - 2.5%
Variance Accounted for by Study 3.9% 3.8% - 4.7% 2.6% - 4.0% 5.9% 4.1% - 5.9% 2.4% - 2.9% 2.4% - 3.7% Number of Effect Sizes 484 Number of Contrasts 68 Number of Studies 45 Note: (1) Standard errors in parentheses. + p<.1, * p <.05, ** p <.01, *** p <.001. (2) “End-of-treatment” is defined as around end of the intervention with the radius of 25% of the program duration. (3) Regressions are weighted by the inverse variance weight of each effect size. Quality index is number of quality factors, including whether the control group was passive, whether the attrition rate was below 16%, whether the study used random assignment, whether there were any significant differences at baseline, whether bias was observed in study, whether the data collectors not blinded, whether the study was published in a peer refereed journal, whether baseline covariates not included, and whether the dependent measure was of high reliability (>= .88). Covariates include whether cognitive measure, measurement method (observational rating, performance test, other measurement method), whether the estimate is treatment on the treated, whether the study conducted before 1980, whether the study was greater than 50% white, black, Hispanic, of mixed races, or other/missing races, whether the study had greater than 90.8 % low income participants, what percentage of males vs females were in the study, and whether the study had any family support services.
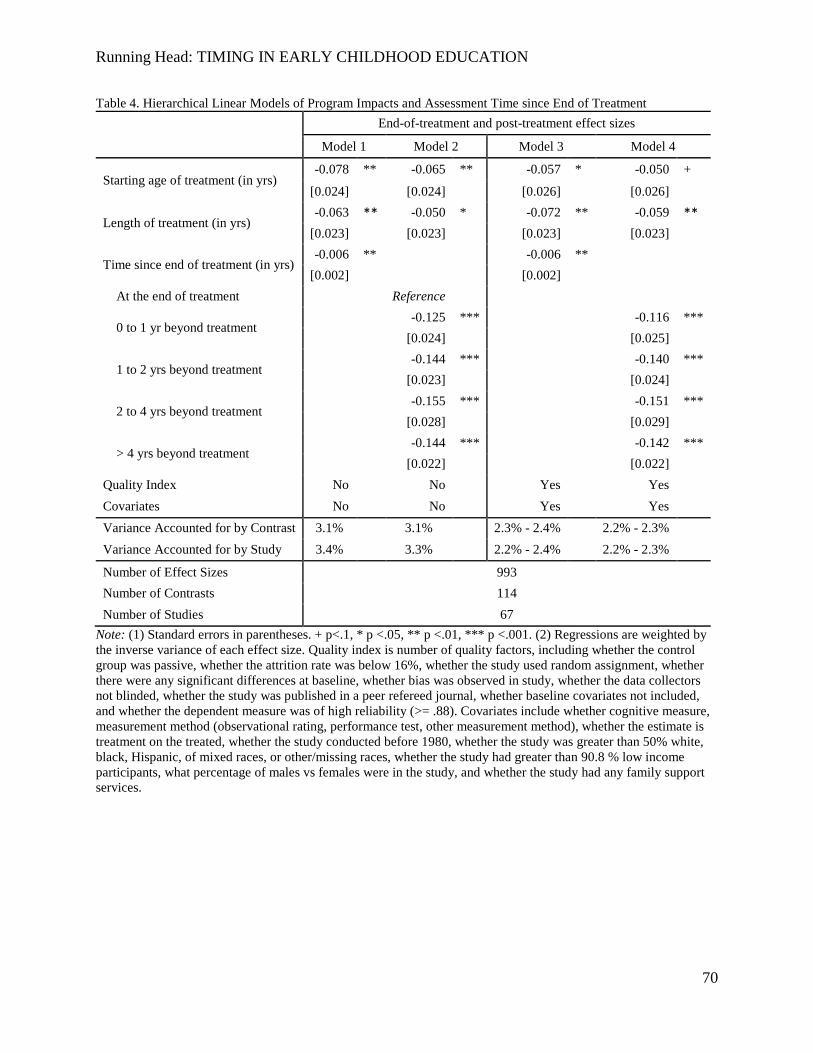
Running Head: TIMING IN EARLY CHILDHOOD EDUCATION
70
Table 4. Hierarchical Linear Models of Program Impacts and Assessment Time since End of Treatment
End-of-treatment and post-treatment effect sizes
Model 1 Model 2 Model 3 Model 4
Starting age of treatment (in yrs) -0.078 ** -0.065 ** -0.057 * -0.050 +
[0.024]
[0.024] [0.026] [0.026]
Length of treatment (in yrs) -0.063 ** -0.050 * -0.072 ** -0.059 **
[0.023]
[0.023] [0.023] [0.023]
Time since end of treatment (in yrs) -0.006 ** -0.006 **
[0.002] [0.002] At the end of treatment Reference
0 to 1 yr beyond treatment -0.125 *** -0.116 ***
[0.024] [0.025]
1 to 2 yrs beyond treatment -0.144 *** -0.140 ***
[0.023] [0.024]
2 to 4 yrs beyond treatment -0.155 *** -0.151 ***
[0.028] [0.029]
> 4 yrs beyond treatment -0.144 *** -0.142 ***
[0.022] [0.022] Quality Index No No Yes Yes Covariates No No Yes Yes Variance Accounted for by Contrast 3.1% 3.1% 2.3% - 2.4% 2.2% - 2.3% Variance Accounted for by Study 3.4% 3.3% 2.2% - 2.4% 2.2% - 2.3% Number of Effect Sizes 993 Number of Contrasts 114 Number of Studies 67
Note: (1) Standard errors in parentheses. + p<.1, * p <.05, ** p <.01, *** p <.001. (2) Regressions are weighted by the inverse variance of each effect size. Quality index is number of quality factors, including whether the control group was passive, whether the attrition rate was below 16%, whether the study used random assignment, whether there were any significant differences at baseline, whether bias was observed in study, whether the data collectors not blinded, whether the study was published in a peer refereed journal, whether baseline covariates not included, and whether the dependent measure was of high reliability (>= .88). Covariates include whether cognitive measure, measurement method (observational rating, performance test, other measurement method), whether the estimate is treatment on the treated, whether the study conducted before 1980, whether the study was greater than 50% white, black, Hispanic, of mixed races, or other/missing races, whether the study had greater than 90.8 % low income participants, what percentage of males vs females were in the study, and whether the study had any family support services.
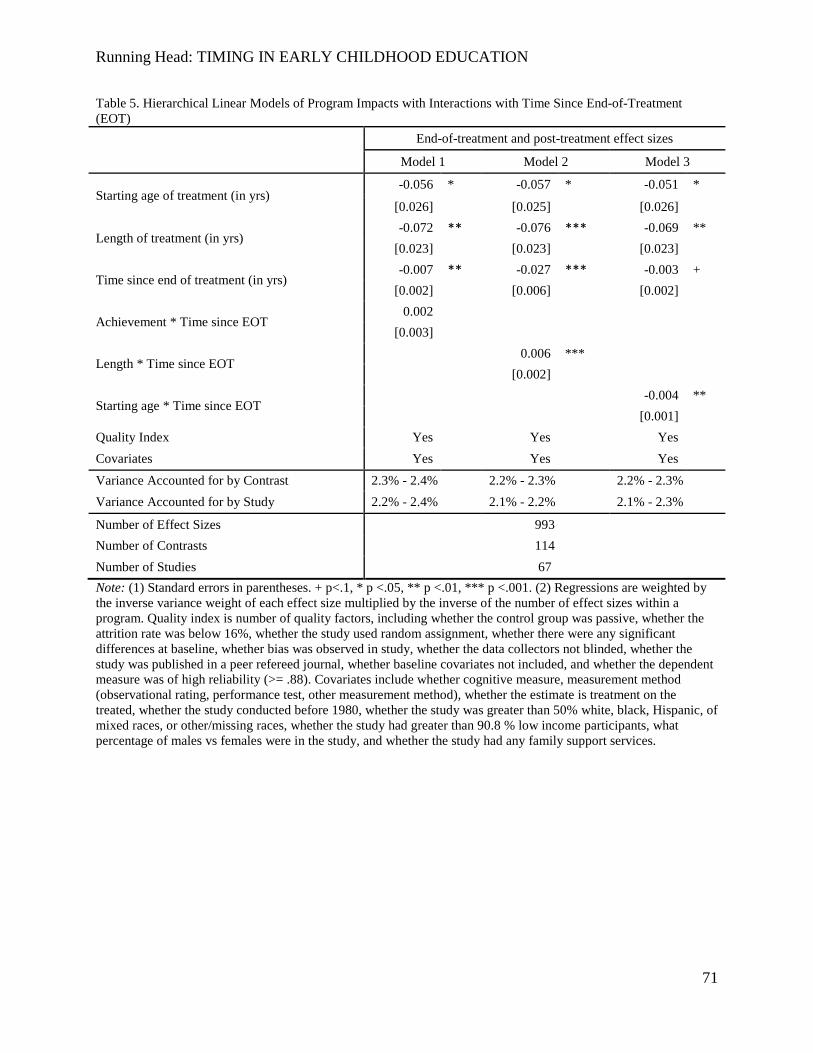
Running Head: TIMING IN EARLY CHILDHOOD EDUCATION
71
Table 5. Hierarchical Linear Models of Program Impacts with Interactions with Time Since End-of-Treatment (EOT)
End-of-treatment and post-treatment effect sizes
Model 1 Model 2 Model 3
Starting age of treatment (in yrs) -0.056 * -0.057 * -0.051 *
[0.026] [0.025]
[0.026]
Length of treatment (in yrs) -0.072 ** -0.076 *** -0.069 **
[0.023] [0.023]
[0.023]
Time since end of treatment (in yrs) -0.007 ** -0.027 *** -0.003 +
[0.002] [0.006] [0.002]
Achievement * Time since EOT 0.002
[0.003]
Length * Time since EOT 0.006 *** [0.002]
Starting age * Time since EOT -0.004 **
[0.001] Quality Index Yes Yes Yes Covariates Yes Yes Yes Variance Accounted for by Contrast 2.3% - 2.4% 2.2% - 2.3% 2.2% - 2.3% Variance Accounted for by Study 2.2% - 2.4% 2.1% - 2.2% 2.1% - 2.3%
Number of Effect Sizes 993 Number of Contrasts 114 Number of Studies 67 Note: (1) Standard errors in parentheses. + p<.1, * p <.05, ** p <.01, *** p <.001. (2) Regressions are weighted by the inverse variance weight of each effect size multiplied by the inverse of the number of effect sizes within a program. Quality index is number of quality factors, including whether the control group was passive, whether the attrition rate was below 16%, whether the study used random assignment, whether there were any significant differences at baseline, whether bias was observed in study, whether the data collectors not blinded, whether the study was published in a peer refereed journal, whether baseline covariates not included, and whether the dependent measure was of high reliability (>= .88). Covariates include whether cognitive measure, measurement method (observational rating, performance test, other measurement method), whether the estimate is treatment on the treated, whether the study conducted before 1980, whether the study was greater than 50% white, black, Hispanic, of mixed races, or other/missing races, whether the study had greater than 90.8 % low income participants, what percentage of males vs females were in the study, and whether the study had any family support services.
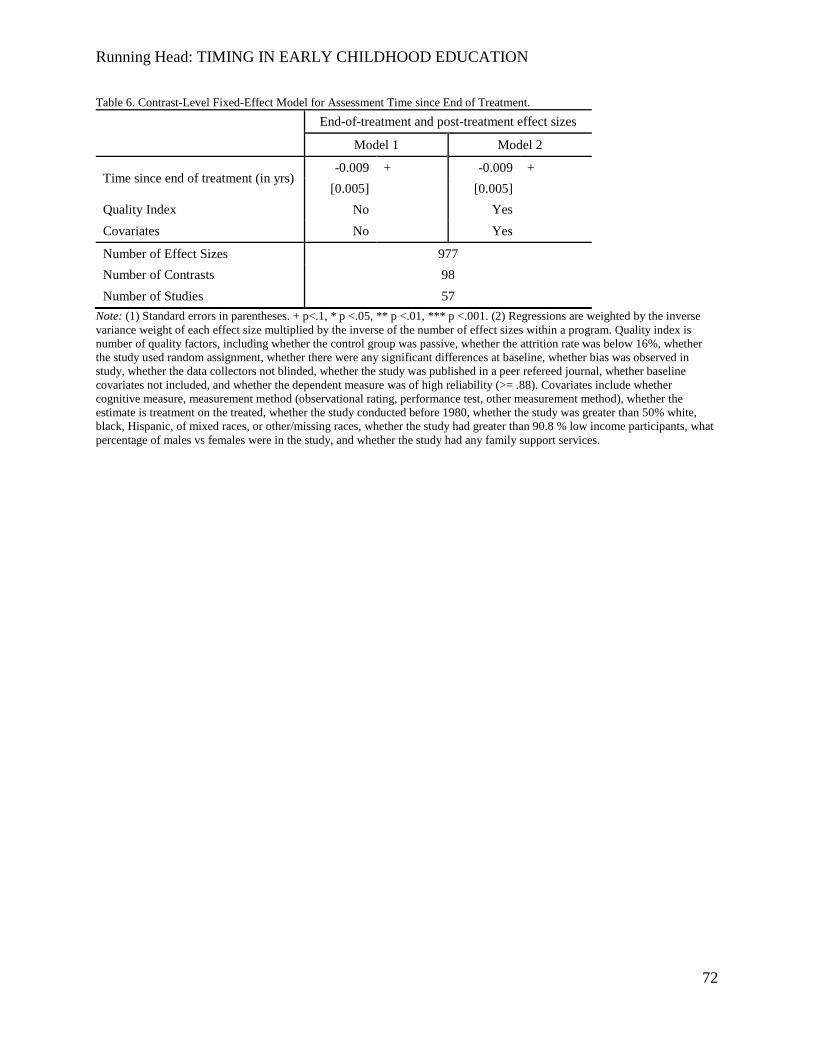
Running Head: TIMING IN EARLY CHILDHOOD EDUCATION
72
Table 6. Contrast-Level Fixed-Effect Model for Assessment Time since End of Treatment.
End-of-treatment and post-treatment effect sizes
Model 1 Model 2
Time since end of treatment (in yrs) -0.009 + -0.009 +
[0.005] [0.005] Quality Index No Yes Covariates No Yes Number of Effect Sizes 977 Number of Contrasts 98 Number of Studies 57
Note: (1) Standard errors in parentheses. + p<.1, * p <.05, ** p <.01, *** p <.001. (2) Regressions are weighted by the inverse variance weight of each effect size multiplied by the inverse of the number of effect sizes within a program. Quality index is number of quality factors, including whether the control group was passive, whether the attrition rate was below 16%, whether the study used random assignment, whether there were any significant differences at baseline, whether bias was observed in study, whether the data collectors not blinded, whether the study was published in a peer refereed journal, whether baseline covariates not included, and whether the dependent measure was of high reliability (>= .88). Covariates include whether cognitive measure, measurement method (observational rating, performance test, other measurement method), whether the estimate is treatment on the treated, whether the study conducted before 1980, whether the study was greater than 50% white, black, Hispanic, of mixed races, or other/missing races, whether the study had greater than 90.8 % low income participants, what percentage of males vs females were in the study, and whether the study had any family support services.
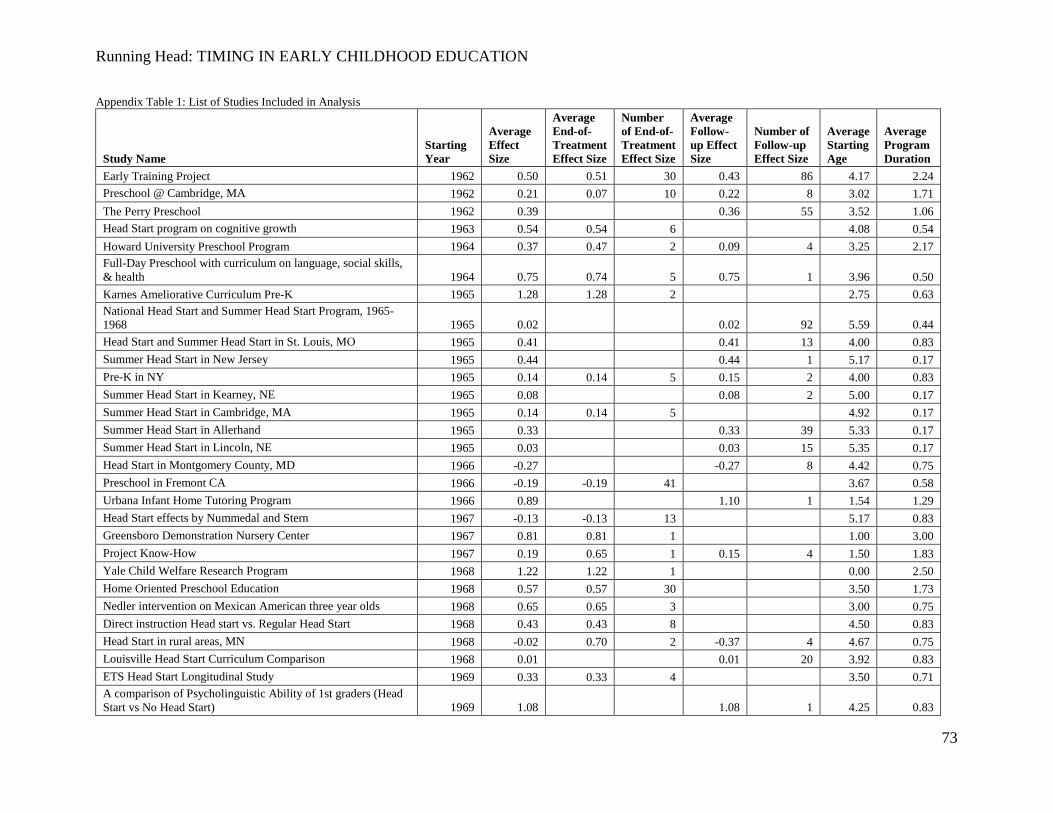
Running Head: TIMING IN EARLY CHILDHOOD EDUCATION
73
Appendix Table 1: List of Studies Included in Analysis
Study Name Starting Year
Average Effect Size
Average End-of-Treatment Effect Size
Number of End-of-Treatment Effect Size
Average Follow-up Effect Size
Number of Follow-up Effect Size
Average Starting Age
Average Program Duration
Early Training Project 1962 0.50 0.51 30 0.43 86 4.17 2.24 Preschool @ Cambridge, MA 1962 0.21 0.07 10 0.22 8 3.02 1.71 The Perry Preschool 1962 0.39
0.36 55 3.52 1.06
Head Start program on cognitive growth 1963 0.54 0.54 6
4.08 0.54 Howard University Preschool Program 1964 0.37 0.47 2 0.09 4 3.25 2.17 Full-Day Preschool with curriculum on language, social skills, & health 1964 0.75 0.74 5 0.75 1 3.96 0.50 Karnes Ameliorative Curriculum Pre-K 1965 1.28 1.28 2
2.75 0.63
National Head Start and Summer Head Start Program, 1965-1968 1965 0.02
0.02 92 5.59 0.44
Head Start and Summer Head Start in St. Louis, MO 1965 0.41
0.41 13 4.00 0.83 Summer Head Start in New Jersey 1965 0.44
0.44 1 5.17 0.17
Pre-K in NY 1965 0.14 0.14 5 0.15 2 4.00 0.83 Summer Head Start in Kearney, NE 1965 0.08
0.08 2 5.00 0.17
Summer Head Start in Cambridge, MA 1965 0.14 0.14 5
4.92 0.17 Summer Head Start in Allerhand 1965 0.33
0.33 39 5.33 0.17
Summer Head Start in Lincoln, NE 1965 0.03
0.03 15 5.35 0.17 Head Start in Montgomery County, MD 1966 -0.27
-0.27 8 4.42 0.75
Preschool in Fremont CA 1966 -0.19 -0.19 41
3.67 0.58 Urbana Infant Home Tutoring Program 1966 0.89
1.10 1 1.54 1.29
Head Start effects by Nummedal and Stern 1967 -0.13 -0.13 13
5.17 0.83 Greensboro Demonstration Nursery Center 1967 0.81 0.81 1
1.00 3.00
Project Know-How 1967 0.19 0.65 1 0.15 4 1.50 1.83 Yale Child Welfare Research Program 1968 1.22 1.22 1
0.00 2.50
Home Oriented Preschool Education 1968 0.57 0.57 30
3.50 1.73 Nedler intervention on Mexican American three year olds 1968 0.65 0.65 3
3.00 0.75
Direct instruction Head start vs. Regular Head Start 1968 0.43 0.43 8
4.50 0.83 Head Start in rural areas, MN 1968 -0.02 0.70 2 -0.37 4 4.67 0.75 Louisville Head Start Curriculum Comparison 1968 0.01
0.01 20 3.92 0.83
ETS Head Start Longitudinal Study 1969 0.33 0.33 4
3.50 0.71 A comparison of Psycholinguistic Ability of 1st graders (Head Start vs No Head Start) 1969 1.08
1.08 1 4.25 0.83
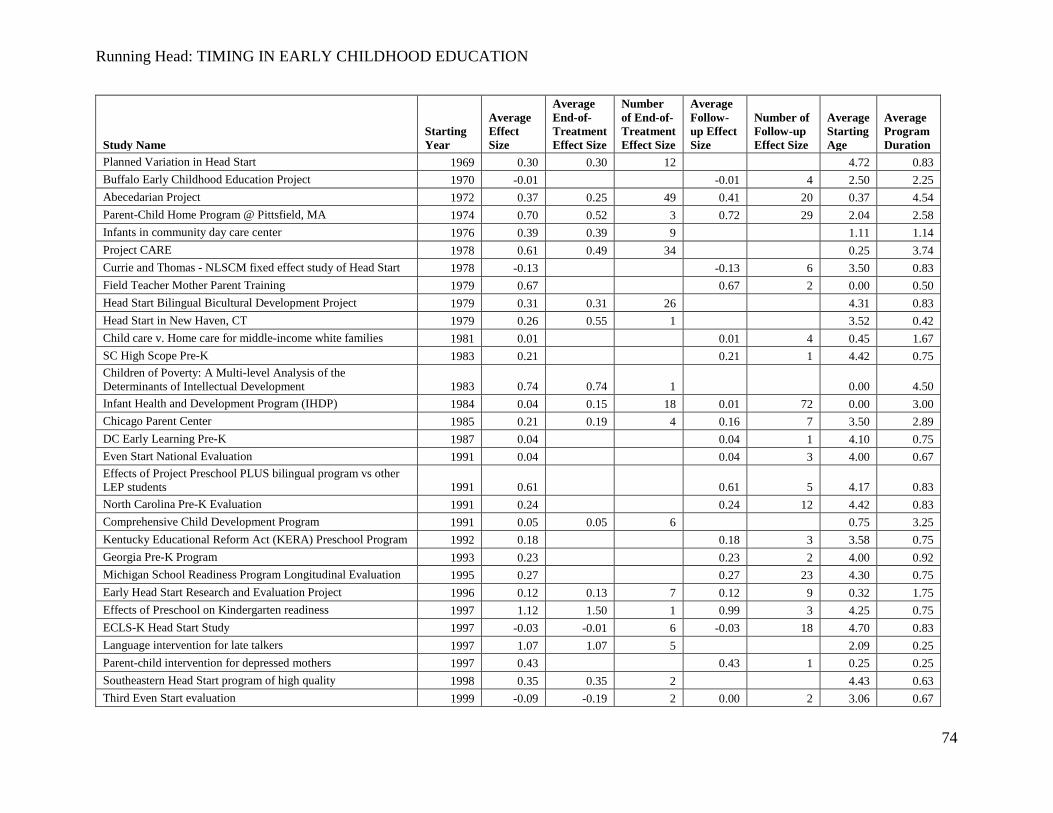
Running Head: TIMING IN EARLY CHILDHOOD EDUCATION
74
Study Name Starting Year
Average Effect Size
Average End-of-Treatment Effect Size
Number of End-of-Treatment Effect Size
Average Follow-up Effect Size
Number of Follow-up Effect Size
Average Starting Age
Average Program Duration
Planned Variation in Head Start 1969 0.30 0.30 12
4.72 0.83 Buffalo Early Childhood Education Project 1970 -0.01
-0.01 4 2.50 2.25
Abecedarian Project 1972 0.37 0.25 49 0.41 20 0.37 4.54 Parent-Child Home Program @ Pittsfield, MA 1974 0.70 0.52 3 0.72 29 2.04 2.58 Infants in community day care center 1976 0.39 0.39 9
1.11 1.14
Project CARE 1978 0.61 0.49 34
0.25 3.74 Currie and Thomas - NLSCM fixed effect study of Head Start 1978 -0.13
-0.13 6 3.50 0.83
Field Teacher Mother Parent Training 1979 0.67
0.67 2 0.00 0.50 Head Start Bilingual Bicultural Development Project 1979 0.31 0.31 26
4.31 0.83
Head Start in New Haven, CT 1979 0.26 0.55 1
3.52 0.42 Child care v. Home care for middle-income white families 1981 0.01
0.01 4 0.45 1.67
SC High Scope Pre-K 1983 0.21
0.21 1 4.42 0.75 Children of Poverty: A Multi-level Analysis of the Determinants of Intellectual Development 1983 0.74 0.74 1
0.00 4.50
Infant Health and Development Program (IHDP) 1984 0.04 0.15 18 0.01 72 0.00 3.00 Chicago Parent Center 1985 0.21 0.19 4 0.16 7 3.50 2.89 DC Early Learning Pre-K 1987 0.04
0.04 1 4.10 0.75
Even Start National Evaluation 1991 0.04
0.04 3 4.00 0.67 Effects of Project Preschool PLUS bilingual program vs other LEP students 1991 0.61
0.61 5 4.17 0.83
North Carolina Pre-K Evaluation 1991 0.24
0.24 12 4.42 0.83 Comprehensive Child Development Program 1991 0.05 0.05 6
0.75 3.25
Kentucky Educational Reform Act (KERA) Preschool Program 1992 0.18
0.18 3 3.58 0.75 Georgia Pre-K Program 1993 0.23
0.23 2 4.00 0.92
Michigan School Readiness Program Longitudinal Evaluation 1995 0.27
0.27 23 4.30 0.75 Early Head Start Research and Evaluation Project 1996 0.12 0.13 7 0.12 9 0.32 1.75 Effects of Preschool on Kindergarten readiness 1997 1.12 1.50 1 0.99 3 4.25 0.75 ECLS-K Head Start Study 1997 -0.03 -0.01 6 -0.03 18 4.70 0.83 Language intervention for late talkers 1997 1.07 1.07 5
2.09 0.25
Parent-child intervention for depressed mothers 1997 0.43
0.43 1 0.25 0.25 Southeastern Head Start program of high quality 1998 0.35 0.35 2
4.43 0.63
Third Even Start evaluation 1999 -0.09 -0.19 2 0.00 2 3.06 0.67
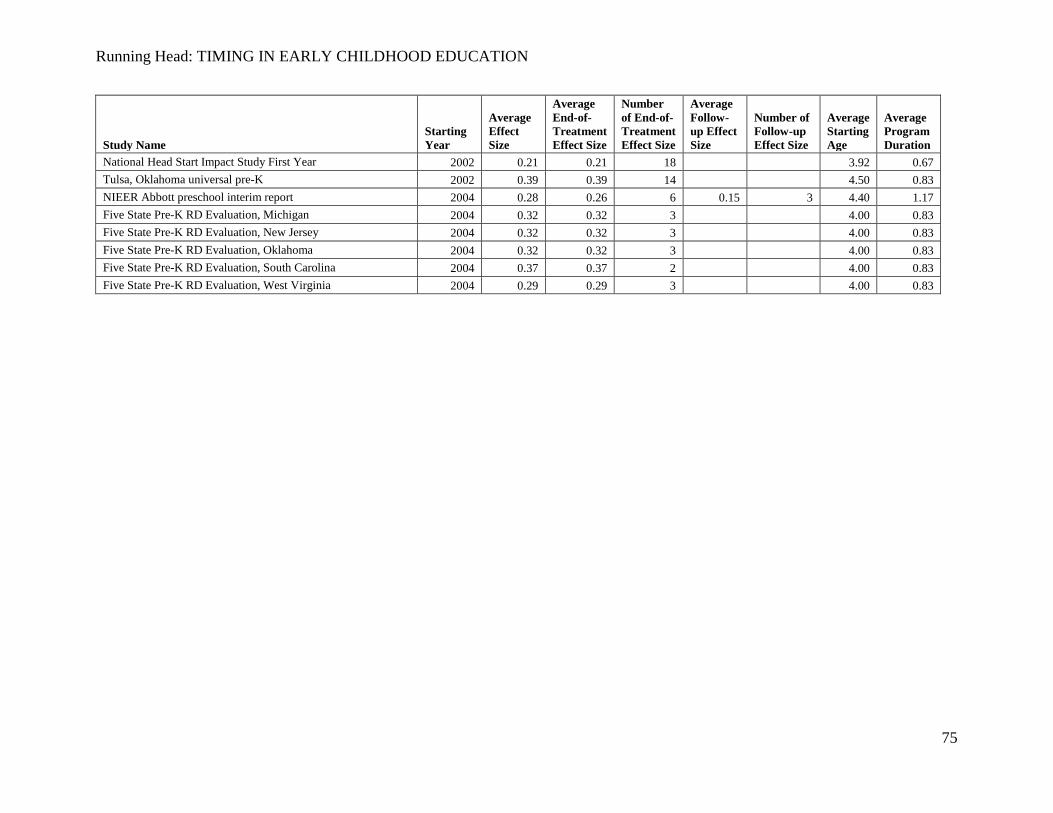
Running Head: TIMING IN EARLY CHILDHOOD EDUCATION
75
Study Name Starting Year
Average Effect Size
Average End-of-Treatment Effect Size
Number of End-of-Treatment Effect Size
Average Follow-up Effect Size
Number of Follow-up Effect Size
Average Starting Age
Average Program Duration
National Head Start Impact Study First Year 2002 0.21 0.21 18
3.92 0.67 Tulsa, Oklahoma universal pre-K 2002 0.39 0.39 14
4.50 0.83
NIEER Abbott preschool interim report 2004 0.28 0.26 6 0.15 3 4.40 1.17 Five State Pre-K RD Evaluation, Michigan 2004 0.32 0.32 3
4.00 0.83
Five State Pre-K RD Evaluation, New Jersey 2004 0.32 0.32 3
4.00 0.83 Five State Pre-K RD Evaluation, Oklahoma 2004 0.32 0.32 3
4.00 0.83
Five State Pre-K RD Evaluation, South Carolina 2004 0.37 0.37 2
4.00 0.83 Five State Pre-K RD Evaluation, West Virginia 2004 0.29 0.29 3
4.00 0.83
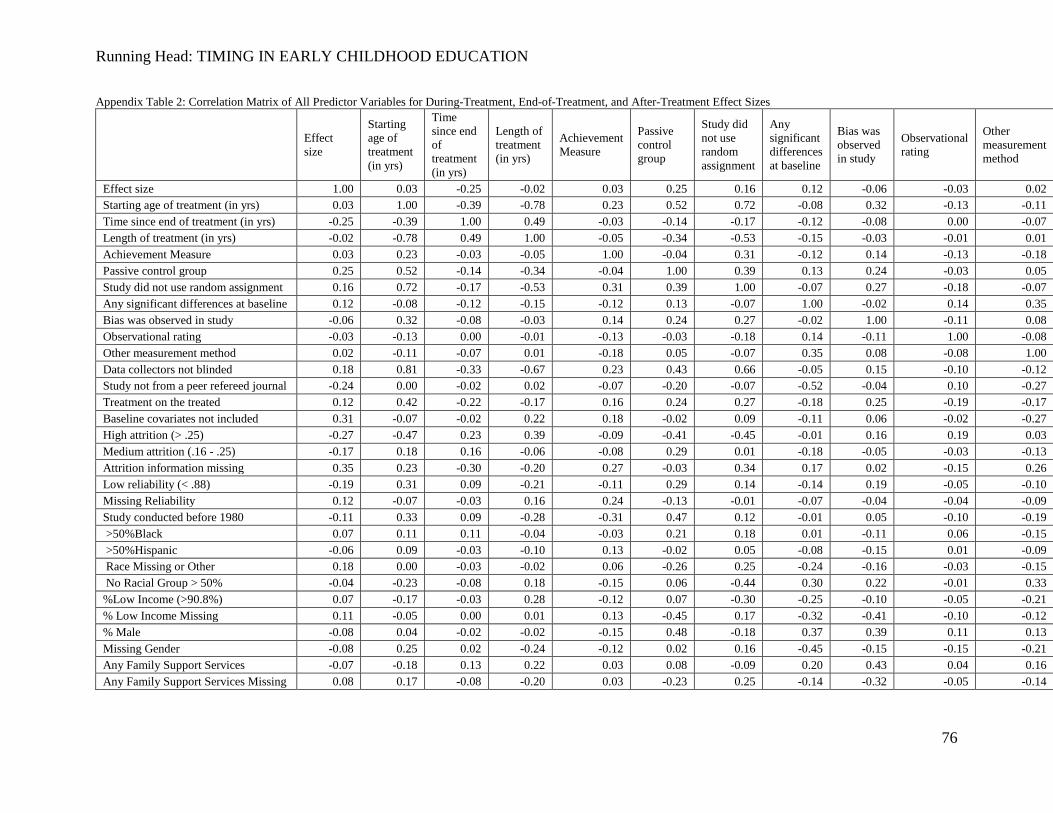
Running Head: TIMING IN EARLY CHILDHOOD EDUCATION
76
Appendix Table 2: Correlation Matrix of All Predictor Variables for During-Treatment, End-of-Treatment, and After-Treatment Effect Sizes
Effect size
Starting age of treatment (in yrs)
Time since end of treatment (in yrs)
Length of treatment (in yrs)
Achievement Measure
Passive control group
Study did not use random assignment
Any significant differences at baseline
Bias was observed in study
Observational rating
Other measurement method
Effect size 1.00 0.03 -0.25 -0.02 0.03 0.25 0.16 0.12 -0.06 -0.03 0.02 Starting age of treatment (in yrs) 0.03 1.00 -0.39 -0.78 0.23 0.52 0.72 -0.08 0.32 -0.13 -0.11 Time since end of treatment (in yrs) -0.25 -0.39 1.00 0.49 -0.03 -0.14 -0.17 -0.12 -0.08 0.00 -0.07 Length of treatment (in yrs) -0.02 -0.78 0.49 1.00 -0.05 -0.34 -0.53 -0.15 -0.03 -0.01 0.01 Achievement Measure 0.03 0.23 -0.03 -0.05 1.00 -0.04 0.31 -0.12 0.14 -0.13 -0.18 Passive control group 0.25 0.52 -0.14 -0.34 -0.04 1.00 0.39 0.13 0.24 -0.03 0.05 Study did not use random assignment 0.16 0.72 -0.17 -0.53 0.31 0.39 1.00 -0.07 0.27 -0.18 -0.07 Any significant differences at baseline 0.12 -0.08 -0.12 -0.15 -0.12 0.13 -0.07 1.00 -0.02 0.14 0.35 Bias was observed in study -0.06 0.32 -0.08 -0.03 0.14 0.24 0.27 -0.02 1.00 -0.11 0.08 Observational rating -0.03 -0.13 0.00 -0.01 -0.13 -0.03 -0.18 0.14 -0.11 1.00 -0.08 Other measurement method 0.02 -0.11 -0.07 0.01 -0.18 0.05 -0.07 0.35 0.08 -0.08 1.00 Data collectors not blinded 0.18 0.81 -0.33 -0.67 0.23 0.43 0.66 -0.05 0.15 -0.10 -0.12 Study not from a peer refereed journal -0.24 0.00 -0.02 0.02 -0.07 -0.20 -0.07 -0.52 -0.04 0.10 -0.27 Treatment on the treated 0.12 0.42 -0.22 -0.17 0.16 0.24 0.27 -0.18 0.25 -0.19 -0.17 Baseline covariates not included 0.31 -0.07 -0.02 0.22 0.18 -0.02 0.09 -0.11 0.06 -0.02 -0.27 High attrition (> .25) -0.27 -0.47 0.23 0.39 -0.09 -0.41 -0.45 -0.01 0.16 0.19 0.03 Medium attrition (.16 - .25) -0.17 0.18 0.16 -0.06 -0.08 0.29 0.01 -0.18 -0.05 -0.03 -0.13 Attrition information missing 0.35 0.23 -0.30 -0.20 0.27 -0.03 0.34 0.17 0.02 -0.15 0.26 Low reliability (< .88) -0.19 0.31 0.09 -0.21 -0.11 0.29 0.14 -0.14 0.19 -0.05 -0.10 Missing Reliability 0.12 -0.07 -0.03 0.16 0.24 -0.13 -0.01 -0.07 -0.04 -0.04 -0.09 Study conducted before 1980 -0.11 0.33 0.09 -0.28 -0.31 0.47 0.12 -0.01 0.05 -0.10 -0.19 >50%Black 0.07 0.11 0.11 -0.04 -0.03 0.21 0.18 0.01 -0.11 0.06 -0.15 >50%Hispanic -0.06 0.09 -0.03 -0.10 0.13 -0.02 0.05 -0.08 -0.15 0.01 -0.09 Race Missing or Other 0.18 0.00 -0.03 -0.02 0.06 -0.26 0.25 -0.24 -0.16 -0.03 -0.15 No Racial Group > 50% -0.04 -0.23 -0.08 0.18 -0.15 0.06 -0.44 0.30 0.22 -0.01 0.33 %Low Income (>90.8%) 0.07 -0.17 -0.03 0.28 -0.12 0.07 -0.30 -0.25 -0.10 -0.05 -0.21 % Low Income Missing 0.11 -0.05 0.00 0.01 0.13 -0.45 0.17 -0.32 -0.41 -0.10 -0.12 % Male -0.08 0.04 -0.02 -0.02 -0.15 0.48 -0.18 0.37 0.39 0.11 0.13 Missing Gender -0.08 0.25 0.02 -0.24 -0.12 0.02 0.16 -0.45 -0.15 -0.15 -0.21 Any Family Support Services -0.07 -0.18 0.13 0.22 0.03 0.08 -0.09 0.20 0.43 0.04 0.16 Any Family Support Services Missing 0.08 0.17 -0.08 -0.20 0.03 -0.23 0.25 -0.14 -0.32 -0.05 -0.14
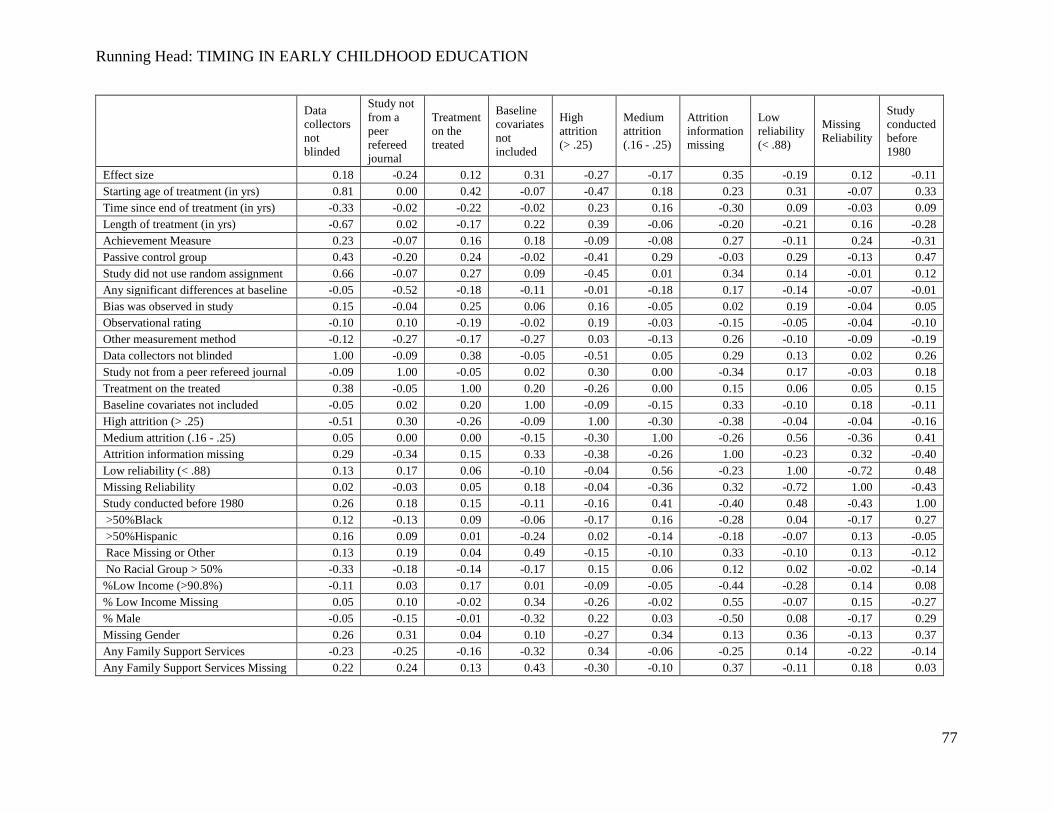
Running Head: TIMING IN EARLY CHILDHOOD EDUCATION
77
Data collectors not blinded
Study not from a peer refereed journal
Treatment on the treated
Baseline covariates not included
High attrition (> .25)
Medium attrition (.16 - .25)
Attrition information missing
Low reliability (< .88)
Missing Reliability
Study conducted before 1980
Effect size 0.18 -0.24 0.12 0.31 -0.27 -0.17 0.35 -0.19 0.12 -0.11 Starting age of treatment (in yrs) 0.81 0.00 0.42 -0.07 -0.47 0.18 0.23 0.31 -0.07 0.33 Time since end of treatment (in yrs) -0.33 -0.02 -0.22 -0.02 0.23 0.16 -0.30 0.09 -0.03 0.09 Length of treatment (in yrs) -0.67 0.02 -0.17 0.22 0.39 -0.06 -0.20 -0.21 0.16 -0.28 Achievement Measure 0.23 -0.07 0.16 0.18 -0.09 -0.08 0.27 -0.11 0.24 -0.31 Passive control group 0.43 -0.20 0.24 -0.02 -0.41 0.29 -0.03 0.29 -0.13 0.47 Study did not use random assignment 0.66 -0.07 0.27 0.09 -0.45 0.01 0.34 0.14 -0.01 0.12 Any significant differences at baseline -0.05 -0.52 -0.18 -0.11 -0.01 -0.18 0.17 -0.14 -0.07 -0.01 Bias was observed in study 0.15 -0.04 0.25 0.06 0.16 -0.05 0.02 0.19 -0.04 0.05 Observational rating -0.10 0.10 -0.19 -0.02 0.19 -0.03 -0.15 -0.05 -0.04 -0.10 Other measurement method -0.12 -0.27 -0.17 -0.27 0.03 -0.13 0.26 -0.10 -0.09 -0.19 Data collectors not blinded 1.00 -0.09 0.38 -0.05 -0.51 0.05 0.29 0.13 0.02 0.26 Study not from a peer refereed journal -0.09 1.00 -0.05 0.02 0.30 0.00 -0.34 0.17 -0.03 0.18 Treatment on the treated 0.38 -0.05 1.00 0.20 -0.26 0.00 0.15 0.06 0.05 0.15 Baseline covariates not included -0.05 0.02 0.20 1.00 -0.09 -0.15 0.33 -0.10 0.18 -0.11 High attrition (> .25) -0.51 0.30 -0.26 -0.09 1.00 -0.30 -0.38 -0.04 -0.04 -0.16 Medium attrition (.16 - .25) 0.05 0.00 0.00 -0.15 -0.30 1.00 -0.26 0.56 -0.36 0.41 Attrition information missing 0.29 -0.34 0.15 0.33 -0.38 -0.26 1.00 -0.23 0.32 -0.40 Low reliability (< .88) 0.13 0.17 0.06 -0.10 -0.04 0.56 -0.23 1.00 -0.72 0.48 Missing Reliability 0.02 -0.03 0.05 0.18 -0.04 -0.36 0.32 -0.72 1.00 -0.43 Study conducted before 1980 0.26 0.18 0.15 -0.11 -0.16 0.41 -0.40 0.48 -0.43 1.00 >50%Black 0.12 -0.13 0.09 -0.06 -0.17 0.16 -0.28 0.04 -0.17 0.27 >50%Hispanic 0.16 0.09 0.01 -0.24 0.02 -0.14 -0.18 -0.07 0.13 -0.05 Race Missing or Other 0.13 0.19 0.04 0.49 -0.15 -0.10 0.33 -0.10 0.13 -0.12 No Racial Group > 50% -0.33 -0.18 -0.14 -0.17 0.15 0.06 0.12 0.02 -0.02 -0.14 %Low Income (>90.8%) -0.11 0.03 0.17 0.01 -0.09 -0.05 -0.44 -0.28 0.14 0.08 % Low Income Missing 0.05 0.10 -0.02 0.34 -0.26 -0.02 0.55 -0.07 0.15 -0.27 % Male -0.05 -0.15 -0.01 -0.32 0.22 0.03 -0.50 0.08 -0.17 0.29 Missing Gender 0.26 0.31 0.04 0.10 -0.27 0.34 0.13 0.36 -0.13 0.37 Any Family Support Services -0.23 -0.25 -0.16 -0.32 0.34 -0.06 -0.25 0.14 -0.22 -0.14 Any Family Support Services Missing 0.22 0.24 0.13 0.43 -0.30 -0.10 0.37 -0.11 0.18 0.03
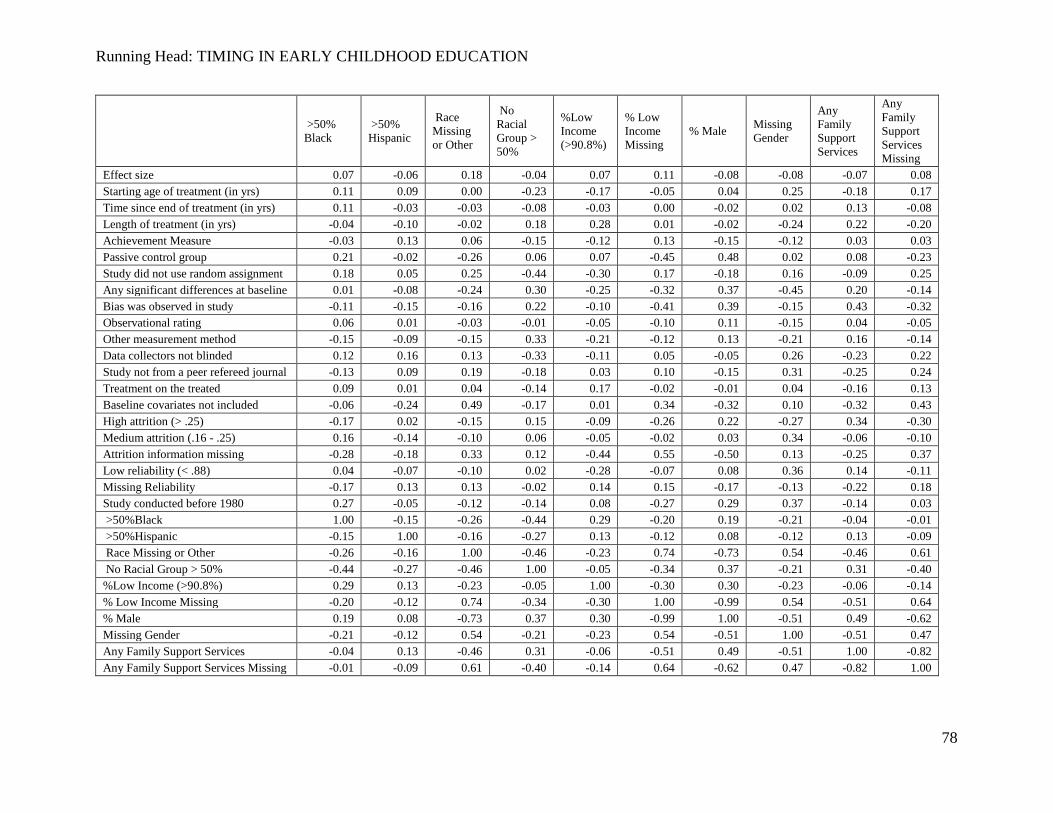
Running Head: TIMING IN EARLY CHILDHOOD EDUCATION
78
>50% Black
>50% Hispanic
Race Missing or Other
No Racial Group > 50%
%Low Income (>90.8%)
% Low Income Missing
% Male Missing Gender
Any Family Support Services
Any Family Support Services Missing
Effect size 0.07 -0.06 0.18 -0.04 0.07 0.11 -0.08 -0.08 -0.07 0.08 Starting age of treatment (in yrs) 0.11 0.09 0.00 -0.23 -0.17 -0.05 0.04 0.25 -0.18 0.17 Time since end of treatment (in yrs) 0.11 -0.03 -0.03 -0.08 -0.03 0.00 -0.02 0.02 0.13 -0.08 Length of treatment (in yrs) -0.04 -0.10 -0.02 0.18 0.28 0.01 -0.02 -0.24 0.22 -0.20 Achievement Measure -0.03 0.13 0.06 -0.15 -0.12 0.13 -0.15 -0.12 0.03 0.03 Passive control group 0.21 -0.02 -0.26 0.06 0.07 -0.45 0.48 0.02 0.08 -0.23 Study did not use random assignment 0.18 0.05 0.25 -0.44 -0.30 0.17 -0.18 0.16 -0.09 0.25 Any significant differences at baseline 0.01 -0.08 -0.24 0.30 -0.25 -0.32 0.37 -0.45 0.20 -0.14 Bias was observed in study -0.11 -0.15 -0.16 0.22 -0.10 -0.41 0.39 -0.15 0.43 -0.32 Observational rating 0.06 0.01 -0.03 -0.01 -0.05 -0.10 0.11 -0.15 0.04 -0.05 Other measurement method -0.15 -0.09 -0.15 0.33 -0.21 -0.12 0.13 -0.21 0.16 -0.14 Data collectors not blinded 0.12 0.16 0.13 -0.33 -0.11 0.05 -0.05 0.26 -0.23 0.22 Study not from a peer refereed journal -0.13 0.09 0.19 -0.18 0.03 0.10 -0.15 0.31 -0.25 0.24 Treatment on the treated 0.09 0.01 0.04 -0.14 0.17 -0.02 -0.01 0.04 -0.16 0.13 Baseline covariates not included -0.06 -0.24 0.49 -0.17 0.01 0.34 -0.32 0.10 -0.32 0.43 High attrition (> .25) -0.17 0.02 -0.15 0.15 -0.09 -0.26 0.22 -0.27 0.34 -0.30 Medium attrition (.16 - .25) 0.16 -0.14 -0.10 0.06 -0.05 -0.02 0.03 0.34 -0.06 -0.10 Attrition information missing -0.28 -0.18 0.33 0.12 -0.44 0.55 -0.50 0.13 -0.25 0.37 Low reliability (< .88) 0.04 -0.07 -0.10 0.02 -0.28 -0.07 0.08 0.36 0.14 -0.11 Missing Reliability -0.17 0.13 0.13 -0.02 0.14 0.15 -0.17 -0.13 -0.22 0.18 Study conducted before 1980 0.27 -0.05 -0.12 -0.14 0.08 -0.27 0.29 0.37 -0.14 0.03 >50%Black 1.00 -0.15 -0.26 -0.44 0.29 -0.20 0.19 -0.21 -0.04 -0.01 >50%Hispanic -0.15 1.00 -0.16 -0.27 0.13 -0.12 0.08 -0.12 0.13 -0.09 Race Missing or Other -0.26 -0.16 1.00 -0.46 -0.23 0.74 -0.73 0.54 -0.46 0.61 No Racial Group > 50% -0.44 -0.27 -0.46 1.00 -0.05 -0.34 0.37 -0.21 0.31 -0.40 %Low Income (>90.8%) 0.29 0.13 -0.23 -0.05 1.00 -0.30 0.30 -0.23 -0.06 -0.14 % Low Income Missing -0.20 -0.12 0.74 -0.34 -0.30 1.00 -0.99 0.54 -0.51 0.64 % Male 0.19 0.08 -0.73 0.37 0.30 -0.99 1.00 -0.51 0.49 -0.62 Missing Gender -0.21 -0.12 0.54 -0.21 -0.23 0.54 -0.51 1.00 -0.51 0.47 Any Family Support Services -0.04 0.13 -0.46 0.31 -0.06 -0.51 0.49 -0.51 1.00 -0.82 Any Family Support Services Missing -0.01 -0.09 0.61 -0.40 -0.14 0.64 -0.62 0.47 -0.82 1.00
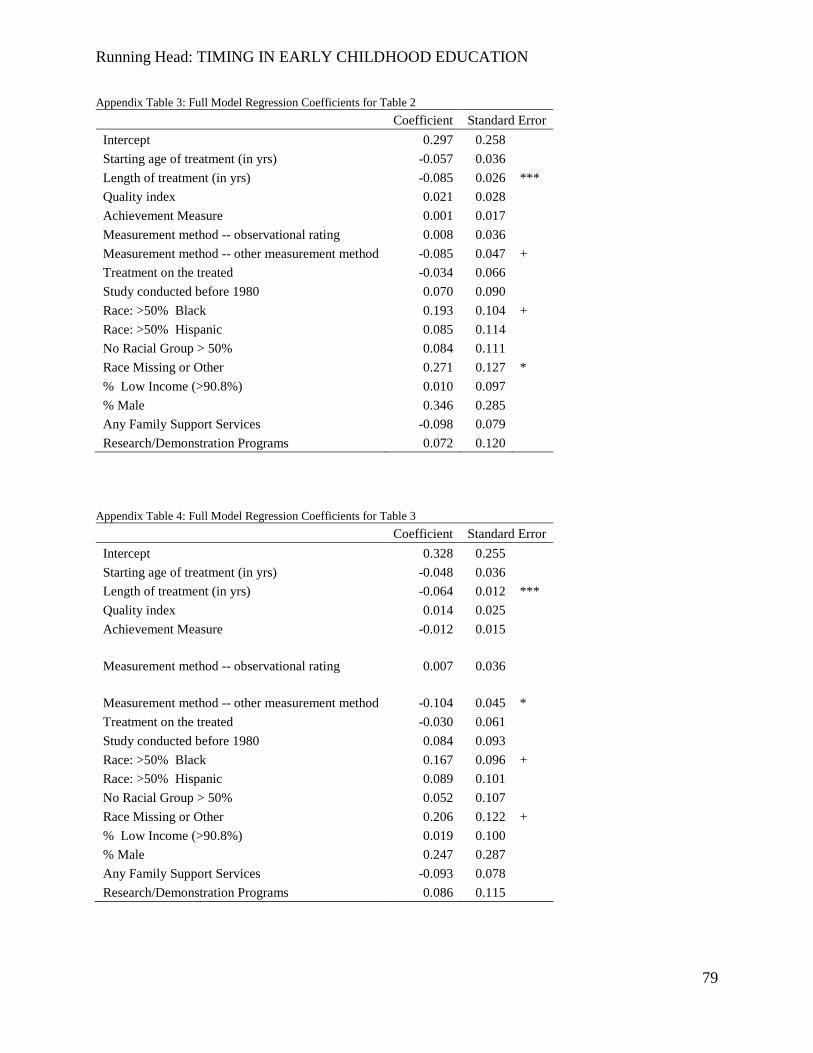
Running Head: TIMING IN EARLY CHILDHOOD EDUCATION
79
Appendix Table 3: Full Model Regression Coefficients for Table 2
Coefficient Standard Error
Intercept 0.297 0.258 Starting age of treatment (in yrs) -0.057 0.036 Length of treatment (in yrs) -0.085 0.026 ***
Quality index 0.021 0.028 Achievement Measure 0.001 0.017 Measurement method -- observational rating 0.008 0.036 Measurement method -- other measurement method -0.085 0.047 +
Treatment on the treated -0.034 0.066 Study conducted before 1980 0.070 0.090 Race: >50% Black 0.193 0.104 +
Race: >50% Hispanic 0.085 0.114 No Racial Group > 50% 0.084 0.111 Race Missing or Other 0.271 0.127 *
% Low Income (>90.8%) 0.010 0.097 % Male 0.346 0.285 Any Family Support Services -0.098 0.079 Research/Demonstration Programs 0.072 0.120
Appendix Table 4: Full Model Regression Coefficients for Table 3
Coefficient Standard Error
Intercept 0.328 0.255 Starting age of treatment (in yrs) -0.048 0.036 Length of treatment (in yrs) -0.064 0.012 ***
Quality index 0.014 0.025 Achievement Measure -0.012 0.015
Measurement method -- observational rating 0.007 0.036
Measurement method -- other measurement method -0.104 0.045 * Treatment on the treated -0.030 0.061
Study conducted before 1980 0.084 0.093 Race: >50% Black 0.167 0.096 +
Race: >50% Hispanic 0.089 0.101 No Racial Group > 50% 0.052 0.107 Race Missing or Other 0.206 0.122 +
% Low Income (>90.8%) 0.019 0.100 % Male 0.247 0.287 Any Family Support Services -0.093 0.078 Research/Demonstration Programs 0.086 0.115
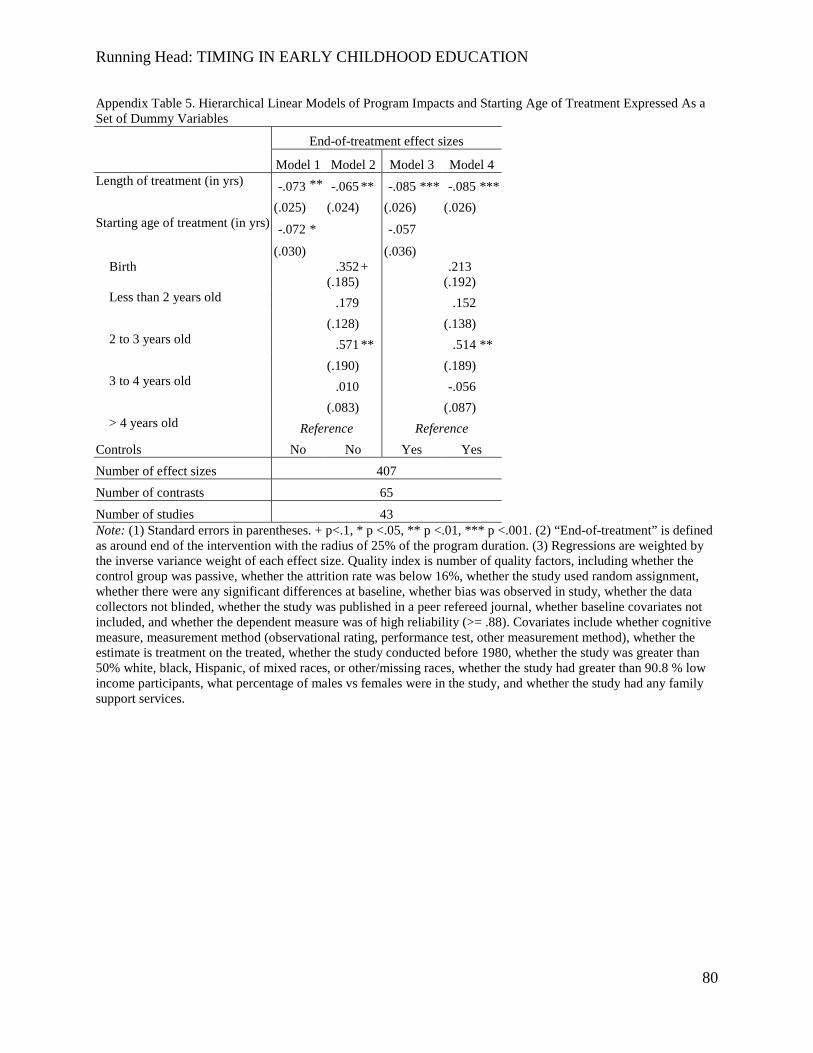
Running Head: TIMING IN EARLY CHILDHOOD EDUCATION
80
Appendix Table 5. Hierarchical Linear Models of Program Impacts and Starting Age of Treatment Expressed As a Set of Dummy Variables
End-of-treatment effect sizes
Model 1 Model 2 Model 3 Model 4
Length of treatment (in yrs) -.073 ** -.065 ** -.085 *** -.085 *** (.025)
(.024) (.026) (.026)
Starting age of treatment (in yrs) -.072 * -.057
(.030) (.036) Birth
.352 +
.213
(.185) (.192) Less than 2 years old .179
.152
(.128) (.138) 2 to 3 years old .571 ** .514 **
(.190) (.189) 3 to 4 years old .010
-.056
(.083) (.087) > 4 years old Reference Reference Controls No No Yes Yes Number of effect sizes 407 Number of contrasts 65 Number of studies 43 Note: (1) Standard errors in parentheses. + p<.1, * p <.05, ** p <.01, *** p <.001. (2) “End-of-treatment” is defined as around end of the intervention with the radius of 25% of the program duration. (3) Regressions are weighted by the inverse variance weight of each effect size. Quality index is number of quality factors, including whether the control group was passive, whether the attrition rate was below 16%, whether the study used random assignment, whether there were any significant differences at baseline, whether bias was observed in study, whether the data collectors not blinded, whether the study was published in a peer refereed journal, whether baseline covariates not included, and whether the dependent measure was of high reliability (>= .88). Covariates include whether cognitive measure, measurement method (observational rating, performance test, other measurement method), whether the estimate is treatment on the treated, whether the study conducted before 1980, whether the study was greater than 50% white, black, Hispanic, of mixed races, or other/missing races, whether the study had greater than 90.8 % low income participants, what percentage of males vs females were in the study, and whether the study had any family support services.
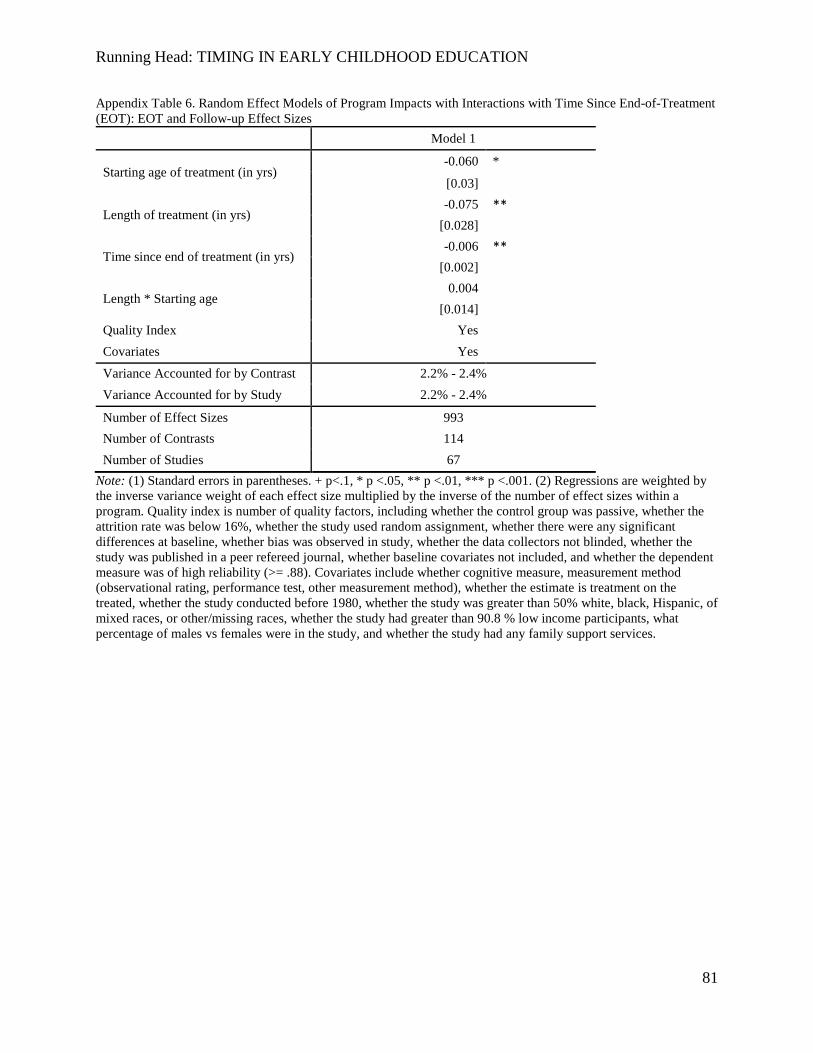
Running Head: TIMING IN EARLY CHILDHOOD EDUCATION
81
Appendix Table 6. Random Effect Models of Program Impacts with Interactions with Time Since End-of-Treatment (EOT): EOT and Follow-up Effect Sizes
Model 1
Starting age of treatment (in yrs) -0.060 *
[0.03]
Length of treatment (in yrs) -0.075 **
[0.028]
Time since end of treatment (in yrs) -0.006 **
[0.002]
Length * Starting age 0.004
[0.014] Quality Index Yes Covariates Yes Variance Accounted for by Contrast 2.2% - 2.4% Variance Accounted for by Study 2.2% - 2.4%
Number of Effect Sizes 993 Number of Contrasts 114 Number of Studies 67
Note: (1) Standard errors in parentheses. + p<.1, * p <.05, ** p <.01, *** p <.001. (2) Regressions are weighted by the inverse variance weight of each effect size multiplied by the inverse of the number of effect sizes within a program. Quality index is number of quality factors, including whether the control group was passive, whether the attrition rate was below 16%, whether the study used random assignment, whether there were any significant differences at baseline, whether bias was observed in study, whether the data collectors not blinded, whether the study was published in a peer refereed journal, whether baseline covariates not included, and whether the dependent measure was of high reliability (>= .88). Covariates include whether cognitive measure, measurement method (observational rating, performance test, other measurement method), whether the estimate is treatment on the treated, whether the study conducted before 1980, whether the study was greater than 50% white, black, Hispanic, of mixed races, or other/missing races, whether the study had greater than 90.8 % low income participants, what percentage of males vs females were in the study, and whether the study had any family support services.
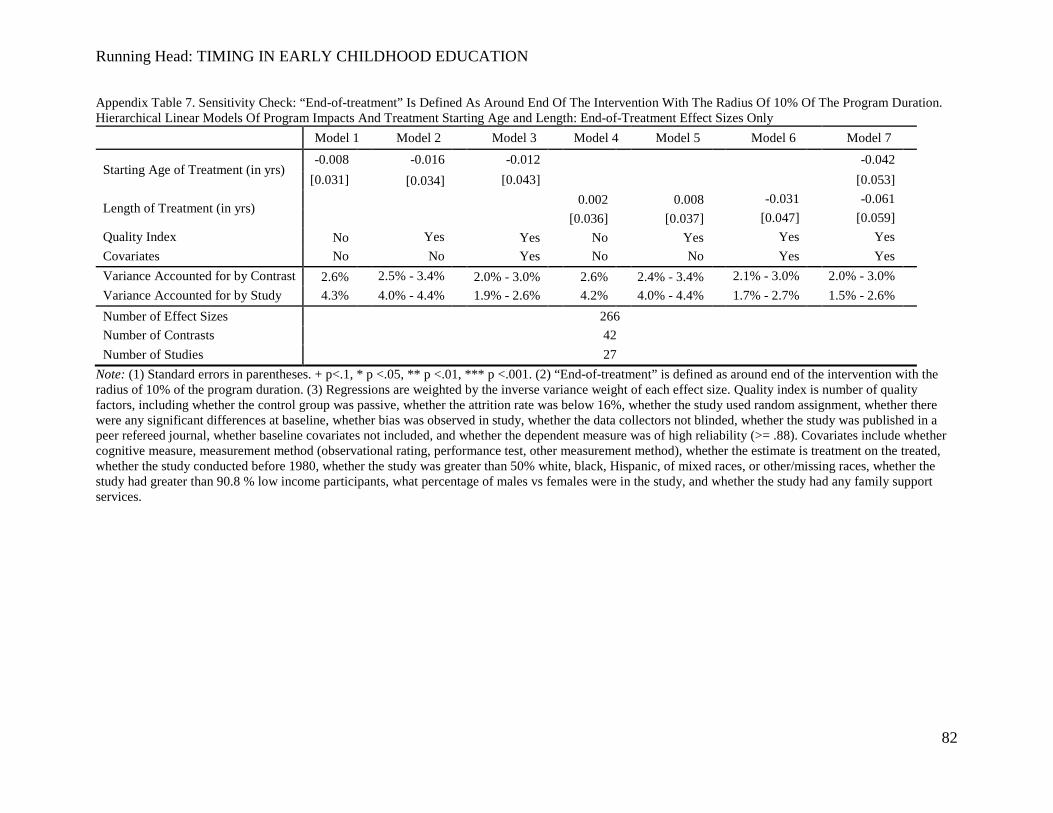
Running Head: TIMING IN EARLY CHILDHOOD EDUCATION
82
Appendix Table 7. Sensitivity Check: “End-of-treatment” Is Defined As Around End Of The Intervention With The Radius Of 10% Of The Program Duration. Hierarchical Linear Models Of Program Impacts And Treatment Starting Age and Length: End-of-Treatment Effect Sizes Only
Model 1 Model 2 Model 3 Model 4 Model 5 Model 6 Model 7
Starting Age of Treatment (in yrs) -0.008
-0.016 -0.012 -0.042
[0.031]
[0.034]
[0.043]
[0.053] Length of Treatment (in yrs)
0.002
0.008
-0.031 -0.061
[0.036]
[0.037]
[0.047] [0.059]
Quality Index No
Yes Yes
No
Yes
Yes Yes Covariates No No Yes No No Yes Yes Variance Accounted for by Contrast 2.6%
2.5% - 3.4% 2.0% - 3.0%
2.6%
2.4% - 3.4%
2.1% - 3.0% 2.0% - 3.0%
Variance Accounted for by Study 4.3% 4.0% - 4.4% 1.9% - 2.6% 4.2% 4.0% - 4.4% 1.7% - 2.7% 1.5% - 2.6% Number of Effect Sizes 266 Number of Contrasts 42 Number of Studies 27
Note: (1) Standard errors in parentheses. + p<.1, * p <.05, ** p <.01, *** p <.001. (2) “End-of-treatment” is defined as around end of the intervention with the radius of 10% of the program duration. (3) Regressions are weighted by the inverse variance weight of each effect size. Quality index is number of quality factors, including whether the control group was passive, whether the attrition rate was below 16%, whether the study used random assignment, whether there were any significant differences at baseline, whether bias was observed in study, whether the data collectors not blinded, whether the study was published in a peer refereed journal, whether baseline covariates not included, and whether the dependent measure was of high reliability (>= .88). Covariates include whether cognitive measure, measurement method (observational rating, performance test, other measurement method), whether the estimate is treatment on the treated, whether the study conducted before 1980, whether the study was greater than 50% white, black, Hispanic, of mixed races, or other/missing races, whether the study had greater than 90.8 % low income participants, what percentage of males vs females were in the study, and whether the study had any family support services.
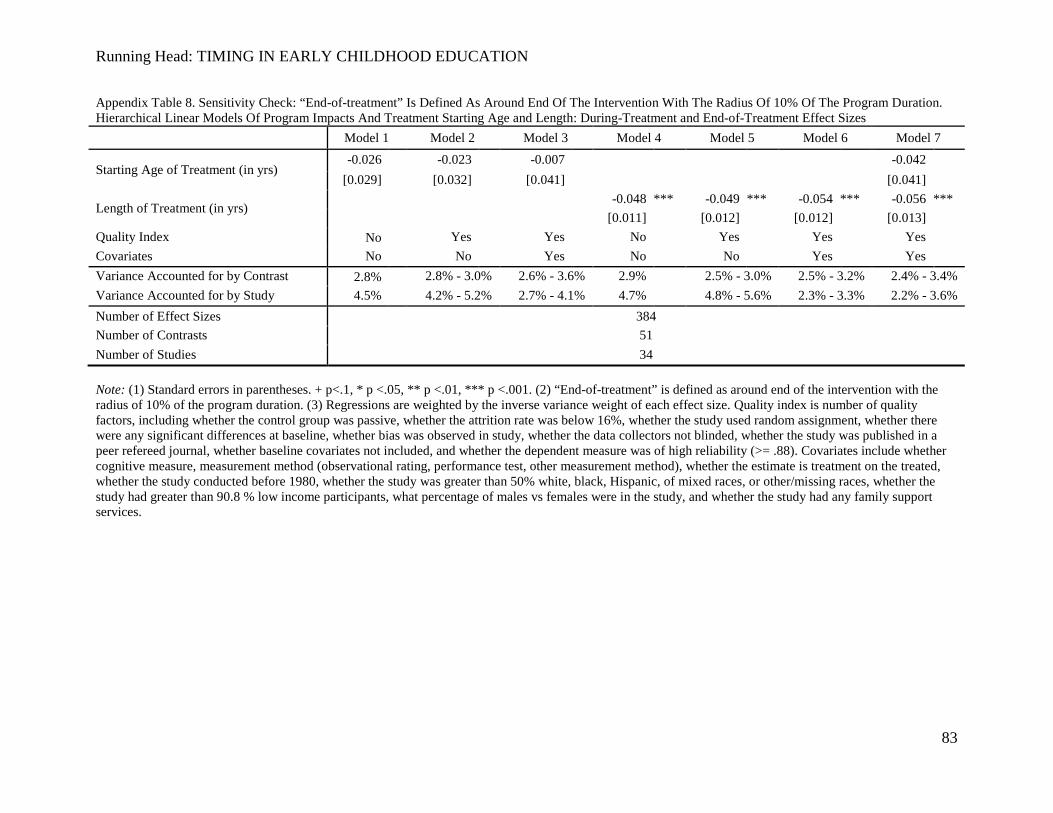
Running Head: TIMING IN EARLY CHILDHOOD EDUCATION
83
Appendix Table 8. Sensitivity Check: “End-of-treatment” Is Defined As Around End Of The Intervention With The Radius Of 10% Of The Program Duration. Hierarchical Linear Models Of Program Impacts And Treatment Starting Age and Length: During-Treatment and End-of-Treatment Effect Sizes
Model 1 Model 2 Model 3 Model 4 Model 5 Model 6 Model 7
Starting Age of Treatment (in yrs) -0.026 -0.023 -0.007 -0.042
[0.029] [0.032] [0.041] [0.041] Length of Treatment (in yrs) -0.048 *** -0.049 *** -0.054 *** -0.056 ***
[0.011] [0.012] [0.012] [0.013] Quality Index No
Yes Yes No Yes Yes Yes
Covariates No No Yes No No Yes Yes Variance Accounted for by Contrast 2.8%
2.8% - 3.0% 2.6% - 3.6% 2.9% 2.5% - 3.0% 2.5% - 3.2% 2.4% - 3.4%
Variance Accounted for by Study 4.5% 4.2% - 5.2% 2.7% - 4.1% 4.7% 4.8% - 5.6% 2.3% - 3.3% 2.2% - 3.6% Number of Effect Sizes 384 Number of Contrasts 51 Number of Studies 34 Note: (1) Standard errors in parentheses. + p<.1, * p <.05, ** p <.01, *** p <.001. (2) “End-of-treatment” is defined as around end of the intervention with the radius of 10% of the program duration. (3) Regressions are weighted by the inverse variance weight of each effect size. Quality index is number of quality factors, including whether the control group was passive, whether the attrition rate was below 16%, whether the study used random assignment, whether there were any significant differences at baseline, whether bias was observed in study, whether the data collectors not blinded, whether the study was published in a peer refereed journal, whether baseline covariates not included, and whether the dependent measure was of high reliability (>= .88). Covariates include whether cognitive measure, measurement method (observational rating, performance test, other measurement method), whether the estimate is treatment on the treated, whether the study conducted before 1980, whether the study was greater than 50% white, black, Hispanic, of mixed races, or other/missing races, whether the study had greater than 90.8 % low income participants, what percentage of males vs females were in the study, and whether the study had any family support services.
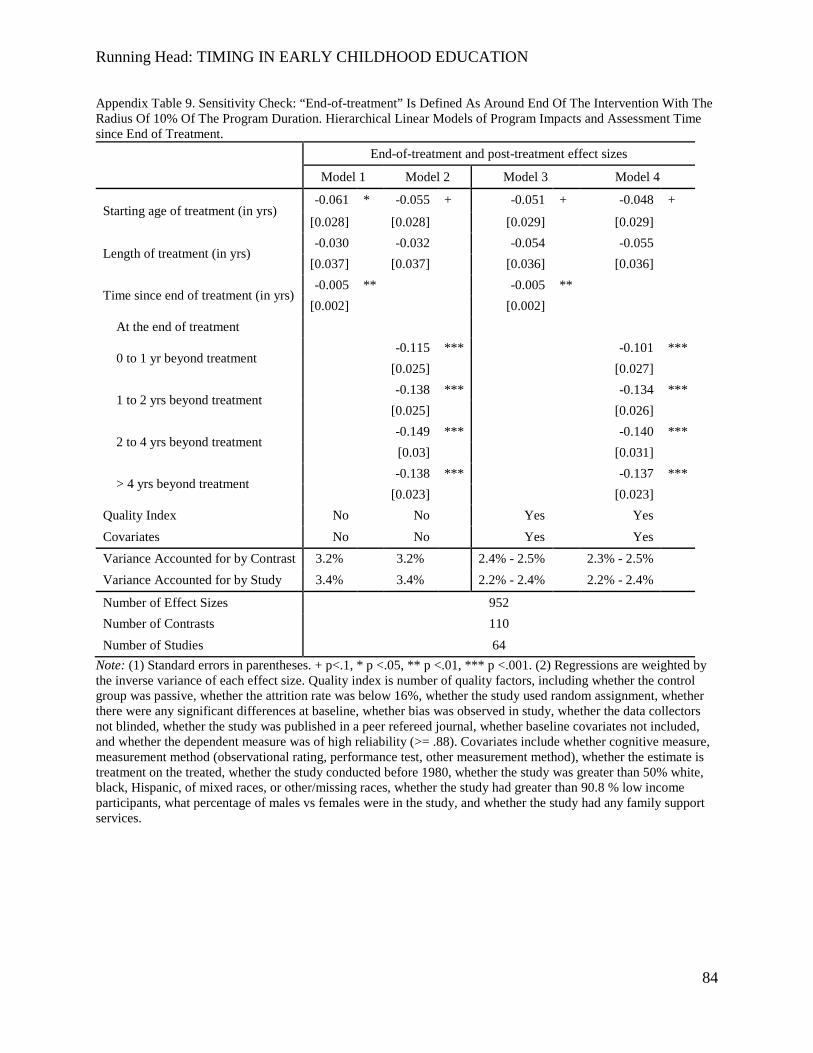
Running Head: TIMING IN EARLY CHILDHOOD EDUCATION
84
Appendix Table 9. Sensitivity Check: “End-of-treatment” Is Defined As Around End Of The Intervention With The Radius Of 10% Of The Program Duration. Hierarchical Linear Models of Program Impacts and Assessment Time since End of Treatment.
End-of-treatment and post-treatment effect sizes
Model 1 Model 2 Model 3 Model 4
Starting age of treatment (in yrs) -0.061 * -0.055 + -0.051 + -0.048 +
[0.028]
[0.028] [0.029] [0.029]
Length of treatment (in yrs) -0.030
-0.032 -0.054 -0.055
[0.037]
[0.037] [0.036] [0.036]
Time since end of treatment (in yrs) -0.005 ** -0.005 **
[0.002] [0.002] At the end of treatment
0 to 1 yr beyond treatment -0.115 *** -0.101 ***
[0.025] [0.027]
1 to 2 yrs beyond treatment -0.138 *** -0.134 ***
[0.025] [0.026]
2 to 4 yrs beyond treatment -0.149 *** -0.140 ***
[0.03] [0.031]
> 4 yrs beyond treatment -0.138 *** -0.137 ***
[0.023] [0.023] Quality Index No No Yes Yes Covariates No No Yes Yes Variance Accounted for by Contrast 3.2% 3.2% 2.4% - 2.5% 2.3% - 2.5% Variance Accounted for by Study 3.4% 3.4% 2.2% - 2.4% 2.2% - 2.4% Number of Effect Sizes 952 Number of Contrasts 110 Number of Studies 64
Note: (1) Standard errors in parentheses. + p<.1, * p <.05, ** p <.01, *** p <.001. (2) Regressions are weighted by the inverse variance of each effect size. Quality index is number of quality factors, including whether the control group was passive, whether the attrition rate was below 16%, whether the study used random assignment, whether there were any significant differences at baseline, whether bias was observed in study, whether the data collectors not blinded, whether the study was published in a peer refereed journal, whether baseline covariates not included, and whether the dependent measure was of high reliability (>= .88). Covariates include whether cognitive measure, measurement method (observational rating, performance test, other measurement method), whether the estimate is treatment on the treated, whether the study conducted before 1980, whether the study was greater than 50% white, black, Hispanic, of mixed races, or other/missing races, whether the study had greater than 90.8 % low income participants, what percentage of males vs females were in the study, and whether the study had any family support services.
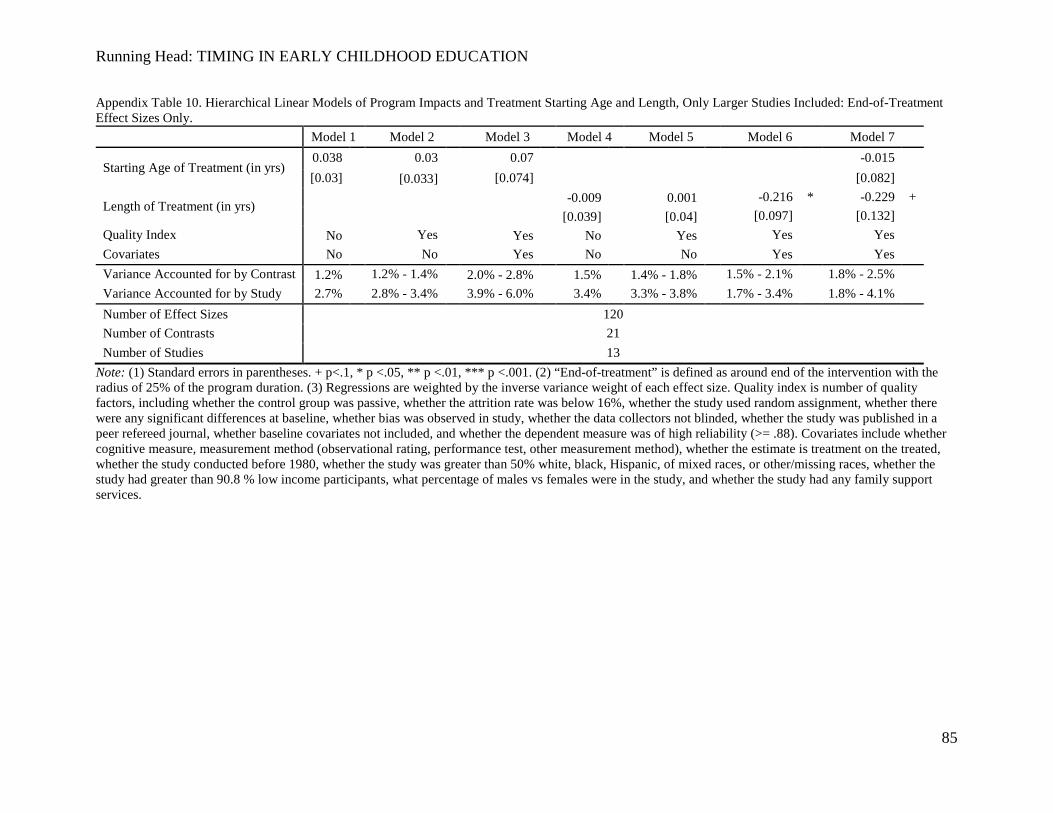
Running Head: TIMING IN EARLY CHILDHOOD EDUCATION
85
Appendix Table 10. Hierarchical Linear Models of Program Impacts and Treatment Starting Age and Length, Only Larger Studies Included: End-of-Treatment Effect Sizes Only.
Model 1 Model 2 Model 3 Model 4 Model 5 Model 6 Model 7
Starting Age of Treatment (in yrs) 0.038
0.03 0.07 -0.015
[0.03]
[0.033]
[0.074]
[0.082] Length of Treatment (in yrs)
-0.009
0.001
-0.216 * -0.229 +
[0.039]
[0.04]
[0.097] [0.132]
Quality Index No
Yes Yes
No
Yes
Yes Yes Covariates No No Yes No No Yes Yes Variance Accounted for by Contrast 1.2%
1.2% - 1.4% 2.0% - 2.8%
1.5%
1.4% - 1.8%
1.5% - 2.1% 1.8% - 2.5%
Variance Accounted for by Study 2.7% 2.8% - 3.4% 3.9% - 6.0% 3.4% 3.3% - 3.8% 1.7% - 3.4% 1.8% - 4.1% Number of Effect Sizes 120 Number of Contrasts 21 Number of Studies 13
Note: (1) Standard errors in parentheses. + p<.1, * p <.05, ** p <.01, *** p <.001. (2) “End-of-treatment” is defined as around end of the intervention with the radius of 25% of the program duration. (3) Regressions are weighted by the inverse variance weight of each effect size. Quality index is number of quality factors, including whether the control group was passive, whether the attrition rate was below 16%, whether the study used random assignment, whether there were any significant differences at baseline, whether bias was observed in study, whether the data collectors not blinded, whether the study was published in a peer refereed journal, whether baseline covariates not included, and whether the dependent measure was of high reliability (>= .88). Covariates include whether cognitive measure, measurement method (observational rating, performance test, other measurement method), whether the estimate is treatment on the treated, whether the study conducted before 1980, whether the study was greater than 50% white, black, Hispanic, of mixed races, or other/missing races, whether the study had greater than 90.8 % low income participants, what percentage of males vs females were in the study, and whether the study had any family support services.
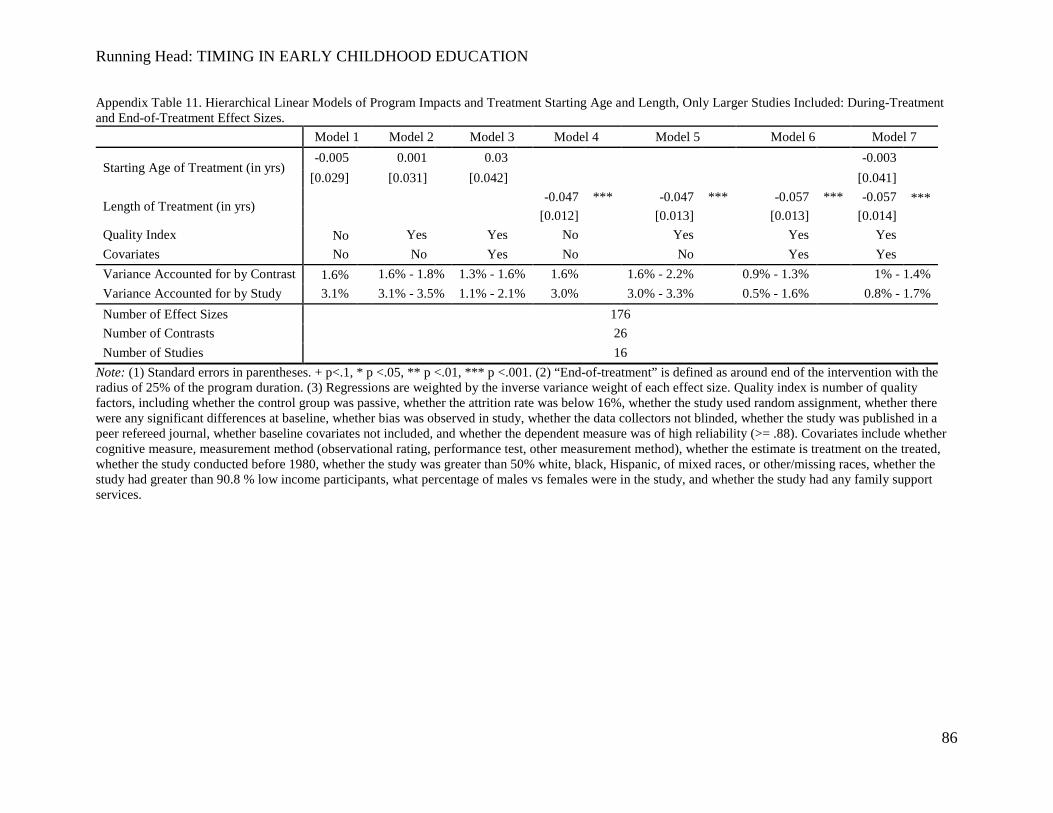
Running Head: TIMING IN EARLY CHILDHOOD EDUCATION
86
Appendix Table 11. Hierarchical Linear Models of Program Impacts and Treatment Starting Age and Length, Only Larger Studies Included: During-Treatment and End-of-Treatment Effect Sizes.
Model 1 Model 2 Model 3 Model 4 Model 5 Model 6 Model 7
Starting Age of Treatment (in yrs) -0.005 0.001 0.03 -0.003
[0.029] [0.031] [0.042] [0.041] Length of Treatment (in yrs) -0.047 *** -0.047 *** -0.057 *** -0.057 ***
[0.012] [0.013] [0.013] [0.014] Quality Index No
Yes Yes No Yes Yes Yes
Covariates No No Yes No No Yes Yes Variance Accounted for by Contrast 1.6%
1.6% - 1.8% 1.3% - 1.6% 1.6% 1.6% - 2.2% 0.9% - 1.3% 1% - 1.4%
Variance Accounted for by Study 3.1% 3.1% - 3.5% 1.1% - 2.1% 3.0% 3.0% - 3.3% 0.5% - 1.6% 0.8% - 1.7% Number of Effect Sizes 176 Number of Contrasts 26 Number of Studies 16
Note: (1) Standard errors in parentheses. + p<.1, * p <.05, ** p <.01, *** p <.001. (2) “End-of-treatment” is defined as around end of the intervention with the radius of 25% of the program duration. (3) Regressions are weighted by the inverse variance weight of each effect size. Quality index is number of quality factors, including whether the control group was passive, whether the attrition rate was below 16%, whether the study used random assignment, whether there were any significant differences at baseline, whether bias was observed in study, whether the data collectors not blinded, whether the study was published in a peer refereed journal, whether baseline covariates not included, and whether the dependent measure was of high reliability (>= .88). Covariates include whether cognitive measure, measurement method (observational rating, performance test, other measurement method), whether the estimate is treatment on the treated, whether the study conducted before 1980, whether the study was greater than 50% white, black, Hispanic, of mixed races, or other/missing races, whether the study had greater than 90.8 % low income participants, what percentage of males vs females were in the study, and whether the study had any family support services.
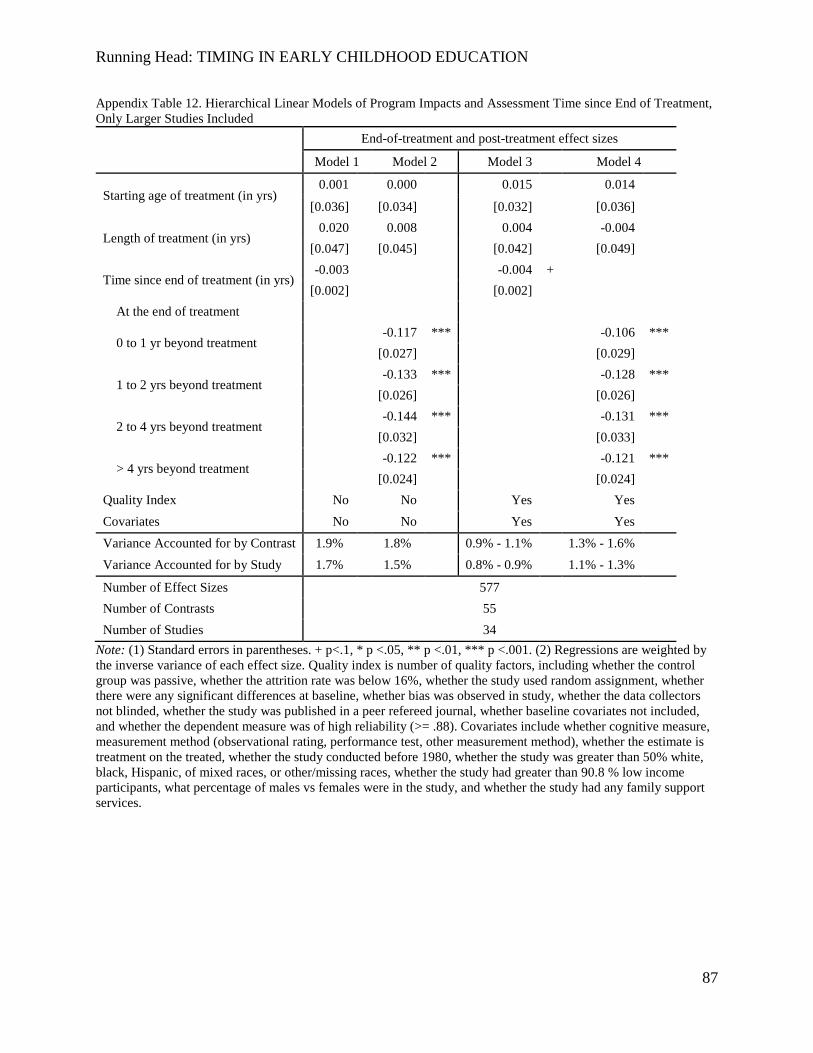
Running Head: TIMING IN EARLY CHILDHOOD EDUCATION
87
Appendix Table 12. Hierarchical Linear Models of Program Impacts and Assessment Time since End of Treatment, Only Larger Studies Included
End-of-treatment and post-treatment effect sizes
Model 1 Model 2 Model 3 Model 4
Starting age of treatment (in yrs) 0.001 0.000 0.015 0.014
[0.036]
[0.034] [0.032] [0.036]
Length of treatment (in yrs) 0.020
0.008 0.004 -0.004
[0.047]
[0.045] [0.042] [0.049]
Time since end of treatment (in yrs) -0.003 -0.004 +
[0.002] [0.002] At the end of treatment
0 to 1 yr beyond treatment -0.117 *** -0.106 ***
[0.027] [0.029]
1 to 2 yrs beyond treatment -0.133 *** -0.128 ***
[0.026] [0.026]
2 to 4 yrs beyond treatment -0.144 *** -0.131 ***
[0.032] [0.033]
> 4 yrs beyond treatment -0.122 *** -0.121 ***
[0.024] [0.024] Quality Index No No Yes Yes Covariates No No Yes Yes Variance Accounted for by Contrast 1.9% 1.8% 0.9% - 1.1% 1.3% - 1.6% Variance Accounted for by Study 1.7% 1.5% 0.8% - 0.9% 1.1% - 1.3% Number of Effect Sizes 577 Number of Contrasts 55 Number of Studies 34
Note: (1) Standard errors in parentheses. + p<.1, * p <.05, ** p <.01, *** p <.001. (2) Regressions are weighted by the inverse variance of each effect size. Quality index is number of quality factors, including whether the control group was passive, whether the attrition rate was below 16%, whether the study used random assignment, whether there were any significant differences at baseline, whether bias was observed in study, whether the data collectors not blinded, whether the study was published in a peer refereed journal, whether baseline covariates not included, and whether the dependent measure was of high reliability (>= .88). Covariates include whether cognitive measure, measurement method (observational rating, performance test, other measurement method), whether the estimate is treatment on the treated, whether the study conducted before 1980, whether the study was greater than 50% white, black, Hispanic, of mixed races, or other/missing races, whether the study had greater than 90.8 % low income participants, what percentage of males vs females were in the study, and whether the study had any family support services.
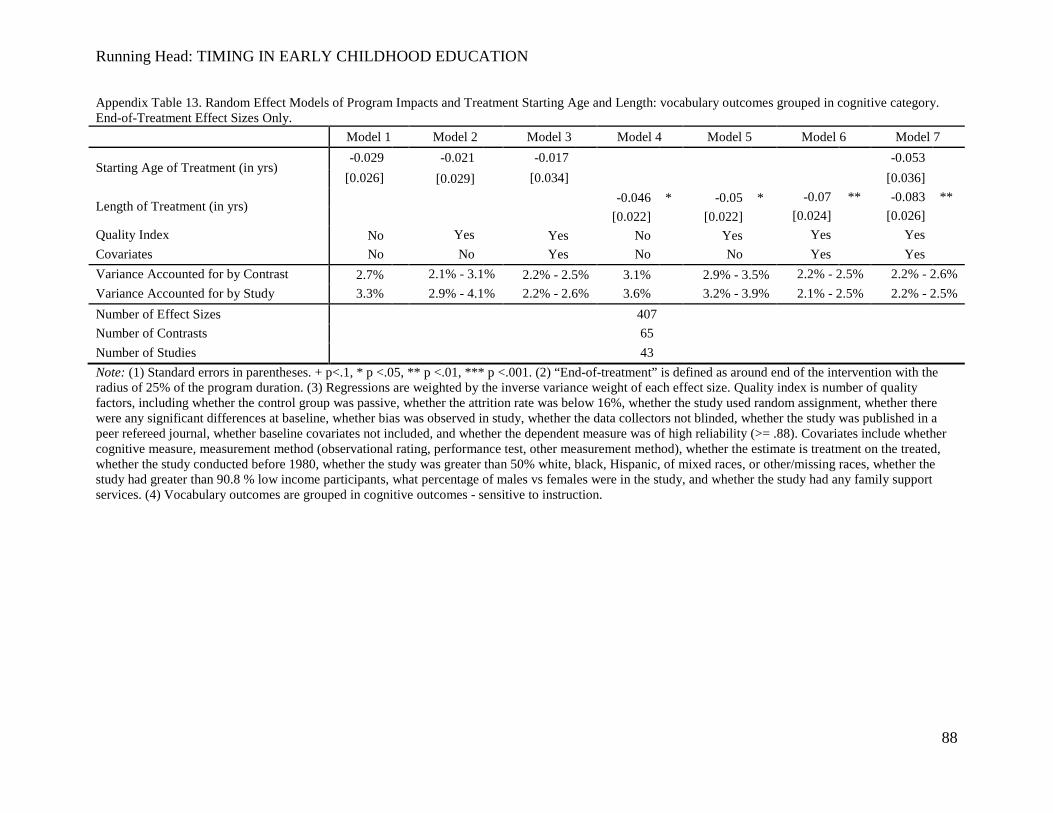
Running Head: TIMING IN EARLY CHILDHOOD EDUCATION
88
Appendix Table 13. Random Effect Models of Program Impacts and Treatment Starting Age and Length: vocabulary outcomes grouped in cognitive category. End-of-Treatment Effect Sizes Only.
Model 1 Model 2 Model 3 Model 4 Model 5 Model 6 Model 7
Starting Age of Treatment (in yrs) -0.029
-0.021 -0.017 -0.053
[0.026]
[0.029]
[0.034]
[0.036] Length of Treatment (in yrs)
-0.046 * -0.05 * -0.07 ** -0.083 **
[0.022]
[0.022]
[0.024] [0.026]
Quality Index No
Yes Yes
No
Yes
Yes Yes Covariates No No Yes No No Yes Yes Variance Accounted for by Contrast 2.7%
2.1% - 3.1% 2.2% - 2.5% 3.1%
2.9% - 3.5% 2.2% - 2.5% 2.2% - 2.6%
Variance Accounted for by Study 3.3% 2.9% - 4.1% 2.2% - 2.6% 3.6% 3.2% - 3.9% 2.1% - 2.5% 2.2% - 2.5% Number of Effect Sizes 407 Number of Contrasts 65 Number of Studies 43 Note: (1) Standard errors in parentheses. + p<.1, * p <.05, ** p <.01, *** p <.001. (2) “End-of-treatment” is defined as around end of the intervention with the radius of 25% of the program duration. (3) Regressions are weighted by the inverse variance weight of each effect size. Quality index is number of quality factors, including whether the control group was passive, whether the attrition rate was below 16%, whether the study used random assignment, whether there were any significant differences at baseline, whether bias was observed in study, whether the data collectors not blinded, whether the study was published in a peer refereed journal, whether baseline covariates not included, and whether the dependent measure was of high reliability (>= .88). Covariates include whether cognitive measure, measurement method (observational rating, performance test, other measurement method), whether the estimate is treatment on the treated, whether the study conducted before 1980, whether the study was greater than 50% white, black, Hispanic, of mixed races, or other/missing races, whether the study had greater than 90.8 % low income participants, what percentage of males vs females were in the study, and whether the study had any family support services. (4) Vocabulary outcomes are grouped in cognitive outcomes - sensitive to instruction.
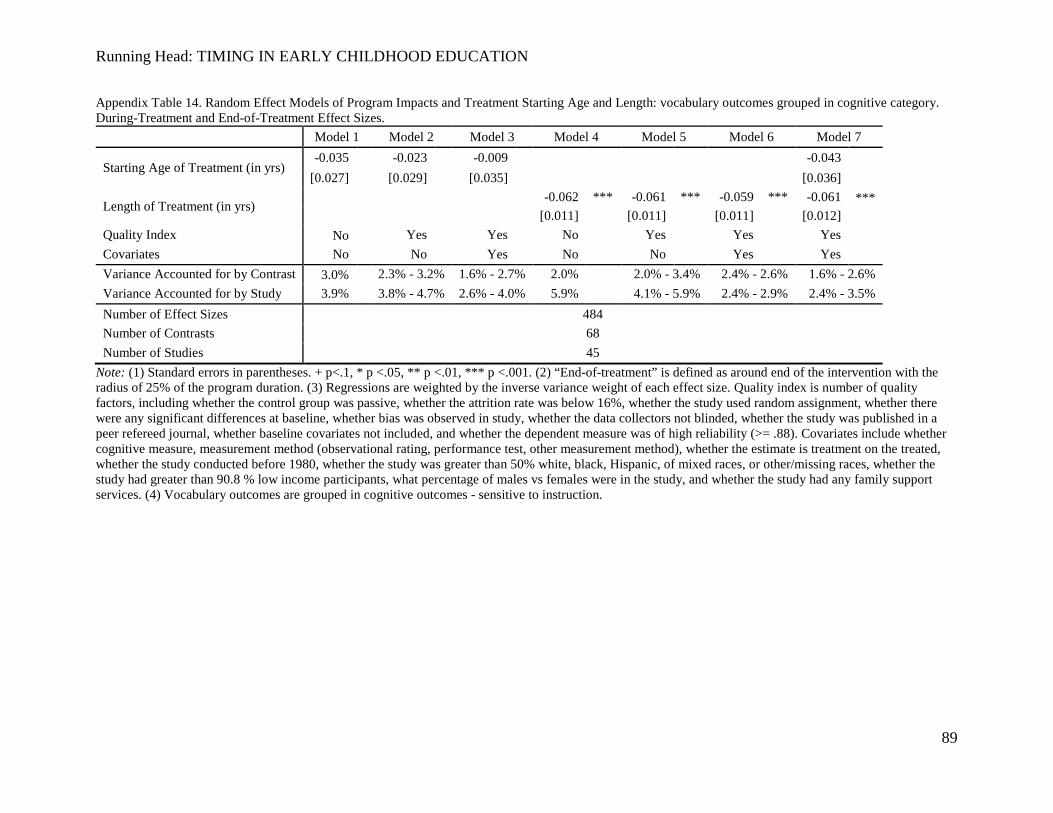
Running Head: TIMING IN EARLY CHILDHOOD EDUCATION
89
Appendix Table 14. Random Effect Models of Program Impacts and Treatment Starting Age and Length: vocabulary outcomes grouped in cognitive category. During-Treatment and End-of-Treatment Effect Sizes.
Model 1 Model 2 Model 3 Model 4 Model 5 Model 6 Model 7
Starting Age of Treatment (in yrs) -0.035 -0.023 -0.009 -0.043
[0.027] [0.029] [0.035] [0.036] Length of Treatment (in yrs) -0.062 *** -0.061 *** -0.059 *** -0.061 ***
[0.011] [0.011] [0.011] [0.012] Quality Index No
Yes Yes No Yes Yes Yes
Covariates No No Yes No No Yes Yes Variance Accounted for by Contrast 3.0%
2.3% - 3.2% 1.6% - 2.7% 2.0% 2.0% - 3.4% 2.4% - 2.6% 1.6% - 2.6%
Variance Accounted for by Study 3.9% 3.8% - 4.7% 2.6% - 4.0% 5.9% 4.1% - 5.9% 2.4% - 2.9% 2.4% - 3.5% Number of Effect Sizes 484 Number of Contrasts 68 Number of Studies 45
Note: (1) Standard errors in parentheses. + p<.1, * p <.05, ** p <.01, *** p <.001. (2) “End-of-treatment” is defined as around end of the intervention with the radius of 25% of the program duration. (3) Regressions are weighted by the inverse variance weight of each effect size. Quality index is number of quality factors, including whether the control group was passive, whether the attrition rate was below 16%, whether the study used random assignment, whether there were any significant differences at baseline, whether bias was observed in study, whether the data collectors not blinded, whether the study was published in a peer refereed journal, whether baseline covariates not included, and whether the dependent measure was of high reliability (>= .88). Covariates include whether cognitive measure, measurement method (observational rating, performance test, other measurement method), whether the estimate is treatment on the treated, whether the study conducted before 1980, whether the study was greater than 50% white, black, Hispanic, of mixed races, or other/missing races, whether the study had greater than 90.8 % low income participants, what percentage of males vs females were in the study, and whether the study had any family support services. (4) Vocabulary outcomes are grouped in cognitive outcomes - sensitive to instruction.
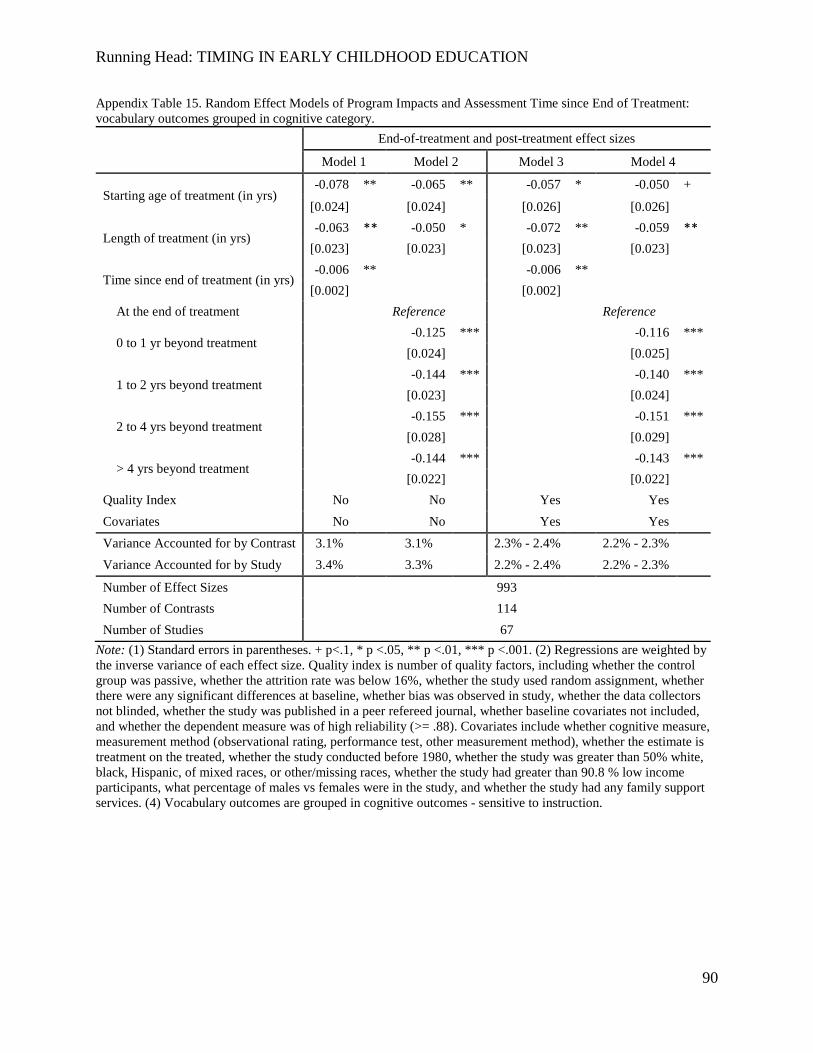
Running Head: TIMING IN EARLY CHILDHOOD EDUCATION
90
Appendix Table 15. Random Effect Models of Program Impacts and Assessment Time since End of Treatment: vocabulary outcomes grouped in cognitive category.
End-of-treatment and post-treatment effect sizes
Model 1 Model 2 Model 3 Model 4
Starting age of treatment (in yrs) -0.078 ** -0.065 ** -0.057 * -0.050 +
[0.024]
[0.024] [0.026] [0.026]
Length of treatment (in yrs) -0.063 ** -0.050 * -0.072 ** -0.059 **
[0.023]
[0.023] [0.023] [0.023]
Time since end of treatment (in yrs) -0.006 ** -0.006 **
[0.002] [0.002] At the end of treatment Reference Reference
0 to 1 yr beyond treatment -0.125 *** -0.116 ***
[0.024] [0.025]
1 to 2 yrs beyond treatment -0.144 *** -0.140 ***
[0.023] [0.024]
2 to 4 yrs beyond treatment -0.155 *** -0.151 ***
[0.028] [0.029]
> 4 yrs beyond treatment -0.144 *** -0.143 ***
[0.022] [0.022] Quality Index No No Yes Yes Covariates No No Yes Yes Variance Accounted for by Contrast 3.1% 3.1% 2.3% - 2.4% 2.2% - 2.3% Variance Accounted for by Study 3.4% 3.3% 2.2% - 2.4% 2.2% - 2.3% Number of Effect Sizes 993 Number of Contrasts 114 Number of Studies 67
Note: (1) Standard errors in parentheses. + p<.1, * p <.05, ** p <.01, *** p <.001. (2) Regressions are weighted by the inverse variance of each effect size. Quality index is number of quality factors, including whether the control group was passive, whether the attrition rate was below 16%, whether the study used random assignment, whether there were any significant differences at baseline, whether bias was observed in study, whether the data collectors not blinded, whether the study was published in a peer refereed journal, whether baseline covariates not included, and whether the dependent measure was of high reliability (>= .88). Covariates include whether cognitive measure, measurement method (observational rating, performance test, other measurement method), whether the estimate is treatment on the treated, whether the study conducted before 1980, whether the study was greater than 50% white, black, Hispanic, of mixed races, or other/missing races, whether the study had greater than 90.8 % low income participants, what percentage of males vs females were in the study, and whether the study had any family support services. (4) Vocabulary outcomes are grouped in cognitive outcomes - sensitive to instruction.
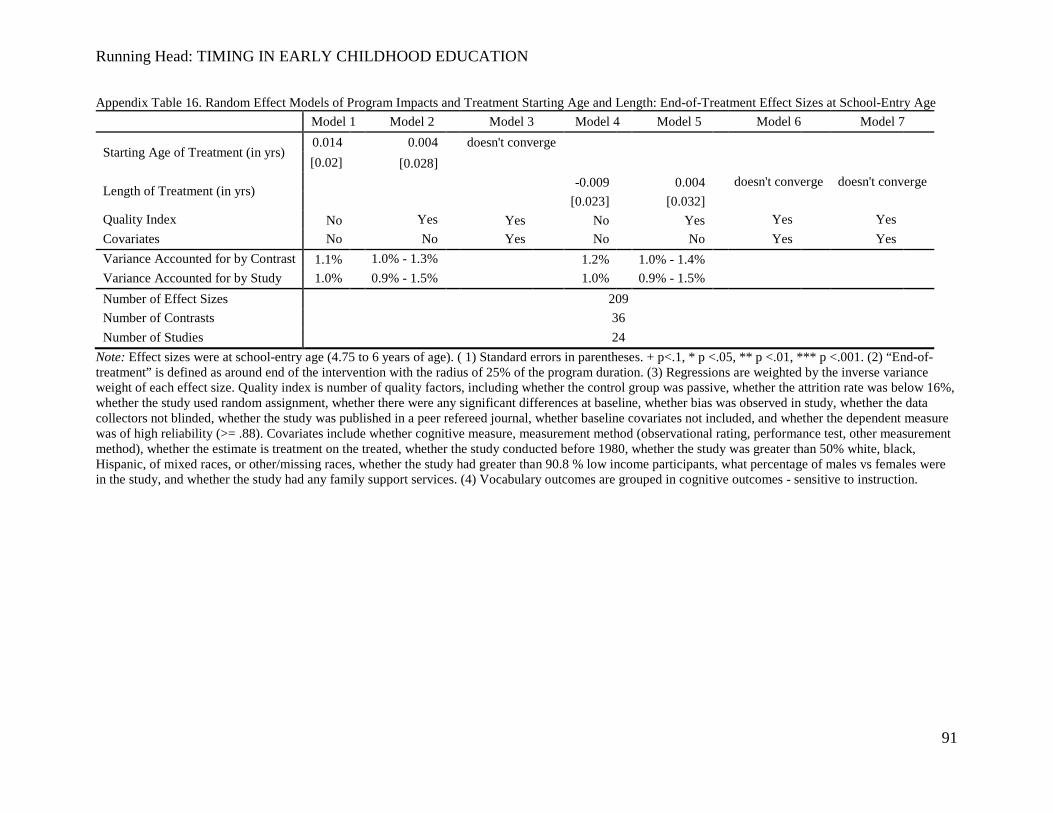
Running Head: TIMING IN EARLY CHILDHOOD EDUCATION
91
Appendix Table 16. Random Effect Models of Program Impacts and Treatment Starting Age and Length: End-of-Treatment Effect Sizes at School-Entry Age
Model 1 Model 2 Model 3 Model 4 Model 5 Model 6 Model 7
Starting Age of Treatment (in yrs) 0.014
0.004 doesn't converge
[0.02]
[0.028]
Length of Treatment (in yrs) -0.009
0.004
doesn't converge doesn't converge
[0.023]
[0.032]
Quality Index No
Yes Yes
No
Yes
Yes Yes
Covariates No No Yes No No Yes Yes Variance Accounted for by Contrast 1.1%
1.0% - 1.3%
1.2%
1.0% - 1.4%
Variance Accounted for by Study 1.0% 0.9% - 1.5% 1.0% 0.9% - 1.5% Number of Effect Sizes 209 Number of Contrasts 36 Number of Studies 24
Note: Effect sizes were at school-entry age (4.75 to 6 years of age). ( 1) Standard errors in parentheses. + p<.1, * p <.05, ** p <.01, *** p <.001. (2) “End-of-treatment” is defined as around end of the intervention with the radius of 25% of the program duration. (3) Regressions are weighted by the inverse variance weight of each effect size. Quality index is number of quality factors, including whether the control group was passive, whether the attrition rate was below 16%, whether the study used random assignment, whether there were any significant differences at baseline, whether bias was observed in study, whether the data collectors not blinded, whether the study was published in a peer refereed journal, whether baseline covariates not included, and whether the dependent measure was of high reliability (>= .88). Covariates include whether cognitive measure, measurement method (observational rating, performance test, other measurement method), whether the estimate is treatment on the treated, whether the study conducted before 1980, whether the study was greater than 50% white, black, Hispanic, of mixed races, or other/missing races, whether the study had greater than 90.8 % low income participants, what percentage of males vs females were in the study, and whether the study had any family support services. (4) Vocabulary outcomes are grouped in cognitive outcomes - sensitive to instruction.
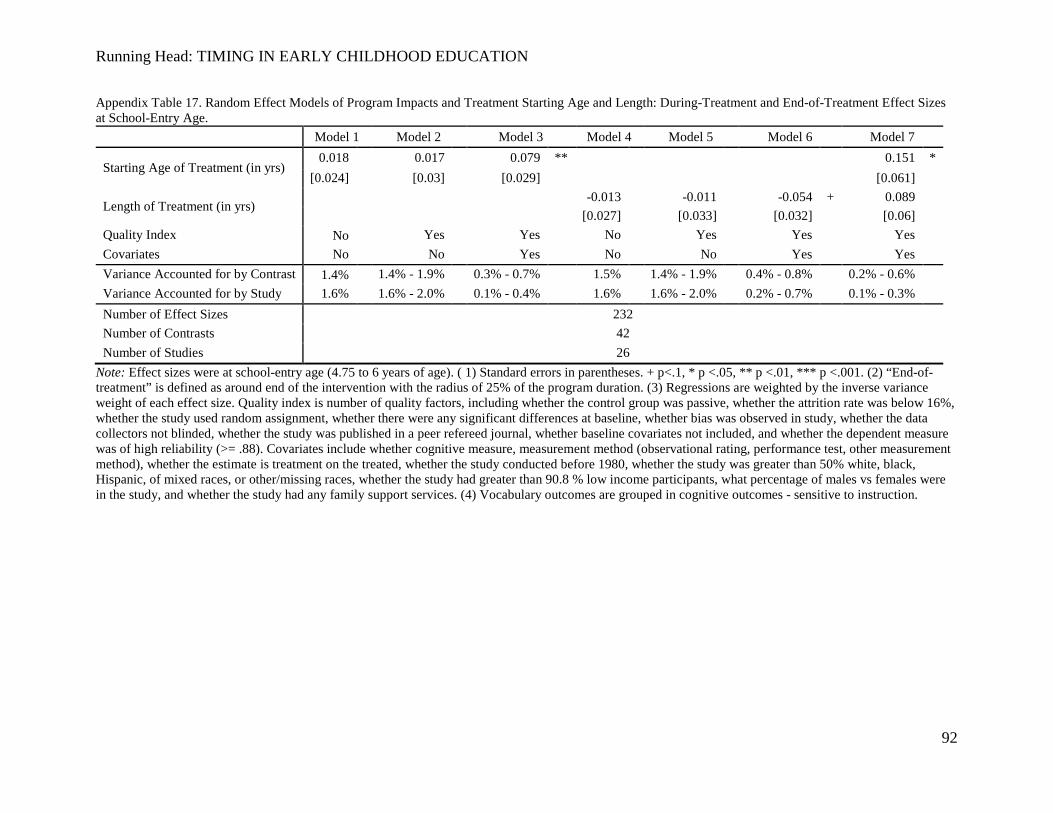
Running Head: TIMING IN EARLY CHILDHOOD EDUCATION
92
Appendix Table 17. Random Effect Models of Program Impacts and Treatment Starting Age and Length: During-Treatment and End-of-Treatment Effect Sizes at School-Entry Age.
Model 1 Model 2 Model 3 Model 4 Model 5 Model 6 Model 7
Starting Age of Treatment (in yrs) 0.018 0.017 0.079 ** 0.151 *
[0.024] [0.03] [0.029] [0.061] Length of Treatment (in yrs) -0.013 -0.011 -0.054 + 0.089
[0.027] [0.033] [0.032] [0.06]
Quality Index No
Yes Yes No Yes Yes Yes Covariates No No Yes No No Yes Yes Variance Accounted for by Contrast 1.4%
1.4% - 1.9% 0.3% - 0.7% 1.5% 1.4% - 1.9% 0.4% - 0.8% 0.2% - 0.6%
Variance Accounted for by Study 1.6% 1.6% - 2.0% 0.1% - 0.4% 1.6% 1.6% - 2.0% 0.2% - 0.7% 0.1% - 0.3% Number of Effect Sizes 232 Number of Contrasts 42 Number of Studies 26
Note: Effect sizes were at school-entry age (4.75 to 6 years of age). ( 1) Standard errors in parentheses. + p<.1, * p <.05, ** p <.01, *** p <.001. (2) “End-of-treatment” is defined as around end of the intervention with the radius of 25% of the program duration. (3) Regressions are weighted by the inverse variance weight of each effect size. Quality index is number of quality factors, including whether the control group was passive, whether the attrition rate was below 16%, whether the study used random assignment, whether there were any significant differences at baseline, whether bias was observed in study, whether the data collectors not blinded, whether the study was published in a peer refereed journal, whether baseline covariates not included, and whether the dependent measure was of high reliability (>= .88). Covariates include whether cognitive measure, measurement method (observational rating, performance test, other measurement method), whether the estimate is treatment on the treated, whether the study conducted before 1980, whether the study was greater than 50% white, black, Hispanic, of mixed races, or other/missing races, whether the study had greater than 90.8 % low income participants, what percentage of males vs females were in the study, and whether the study had any family support services. (4) Vocabulary outcomes are grouped in cognitive outcomes - sensitive to instruction.
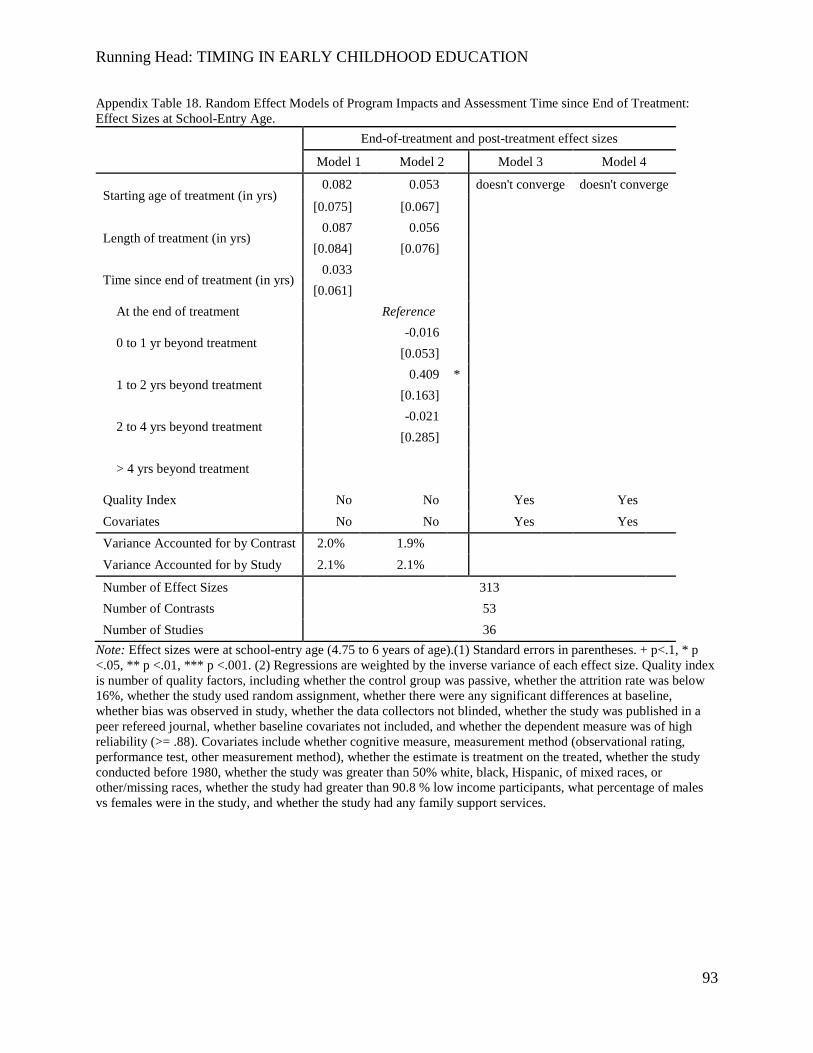
Running Head: TIMING IN EARLY CHILDHOOD EDUCATION
93
Appendix Table 18. Random Effect Models of Program Impacts and Assessment Time since End of Treatment: Effect Sizes at School-Entry Age.
End-of-treatment and post-treatment effect sizes
Model 1 Model 2 Model 3 Model 4
Starting age of treatment (in yrs) 0.082 0.053 doesn't converge doesn't converge
[0.075]
[0.067]
Length of treatment (in yrs) 0.087
0.056
[0.084]
[0.076]
Time since end of treatment (in yrs) 0.033
[0.061] At the end of treatment Reference
0 to 1 yr beyond treatment -0.016 [0.053]
1 to 2 yrs beyond treatment 0.409 * [0.163]
2 to 4 yrs beyond treatment -0.021 [0.285]
> 4 yrs beyond treatment
Quality Index No No Yes Yes Covariates No No Yes Yes Variance Accounted for by Contrast 2.0% 1.9% Variance Accounted for by Study 2.1% 2.1% Number of Effect Sizes 313 Number of Contrasts 53 Number of Studies 36
Note: Effect sizes were at school-entry age (4.75 to 6 years of age).(1) Standard errors in parentheses. + p<.1, * p <.05, ** p <.01, *** p <.001. (2) Regressions are weighted by the inverse variance of each effect size. Quality index is number of quality factors, including whether the control group was passive, whether the attrition rate was below 16%, whether the study used random assignment, whether there were any significant differences at baseline, whether bias was observed in study, whether the data collectors not blinded, whether the study was published in a peer refereed journal, whether baseline covariates not included, and whether the dependent measure was of high reliability (>= .88). Covariates include whether cognitive measure, measurement method (observational rating, performance test, other measurement method), whether the estimate is treatment on the treated, whether the study conducted before 1980, whether the study was greater than 50% white, black, Hispanic, of mixed races, or other/missing races, whether the study had greater than 90.8 % low income participants, what percentage of males vs females were in the study, and whether the study had any family support services.
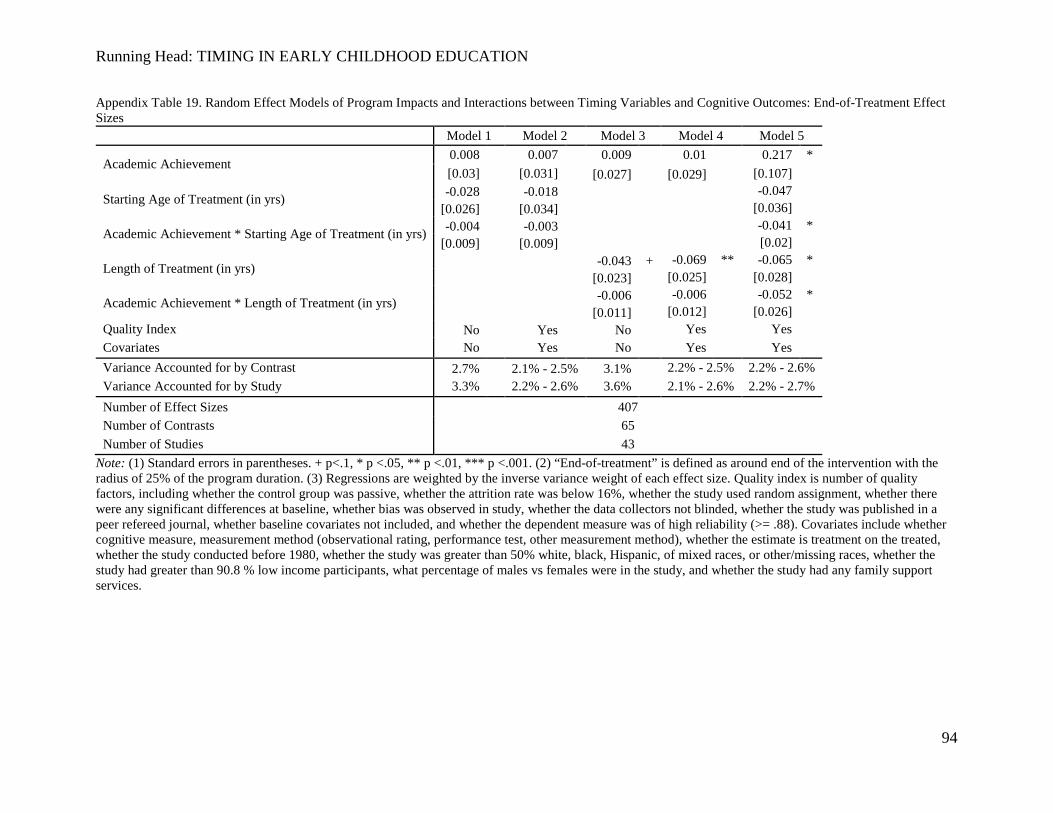
Running Head: TIMING IN EARLY CHILDHOOD EDUCATION
94
Appendix Table 19. Random Effect Models of Program Impacts and Interactions between Timing Variables and Cognitive Outcomes: End-of-Treatment Effect Sizes
Model 1 Model 2 Model 3 Model 4 Model 5
Academic Achievement 0.008
0.007 0.009 0.01 0.217 *
[0.03]
[0.031]
[0.027]
[0.029]
[0.107]
Starting Age of Treatment (in yrs) -0.028
-0.018 -0.047
[0.026]
[0.034] [0.036]
Academic Achievement * Starting Age of Treatment (in yrs) -0.004
-0.003 -0.041 *
[0.009]
[0.009] [0.02]
Length of Treatment (in yrs) -0.043 + -0.069 ** -0.065 *
[0.023]
[0.025] [0.028]
Academic Achievement * Length of Treatment (in yrs) -0.006
-0.006 -0.052 *
[0.011]
[0.012] [0.026]
Quality Index No
Yes
No
Yes Yes Covariates No Yes No Yes Yes Variance Accounted for by Contrast 2.7% 2.1% - 2.5% 3.1% 2.2% - 2.5% 2.2% - 2.6% Variance Accounted for by Study 3.3% 2.2% - 2.6% 3.6% 2.1% - 2.6% 2.2% - 2.7% Number of Effect Sizes 407 Number of Contrasts 65 Number of Studies 43
Note: (1) Standard errors in parentheses. + p<.1, * p <.05, ** p <.01, *** p <.001. (2) “End-of-treatment” is defined as around end of the intervention with the radius of 25% of the program duration. (3) Regressions are weighted by the inverse variance weight of each effect size. Quality index is number of quality factors, including whether the control group was passive, whether the attrition rate was below 16%, whether the study used random assignment, whether there were any significant differences at baseline, whether bias was observed in study, whether the data collectors not blinded, whether the study was published in a peer refereed journal, whether baseline covariates not included, and whether the dependent measure was of high reliability (>= .88). Covariates include whether cognitive measure, measurement method (observational rating, performance test, other measurement method), whether the estimate is treatment on the treated, whether the study conducted before 1980, whether the study was greater than 50% white, black, Hispanic, of mixed races, or other/missing races, whether the study had greater than 90.8 % low income participants, what percentage of males vs females were in the study, and whether the study had any family support services.
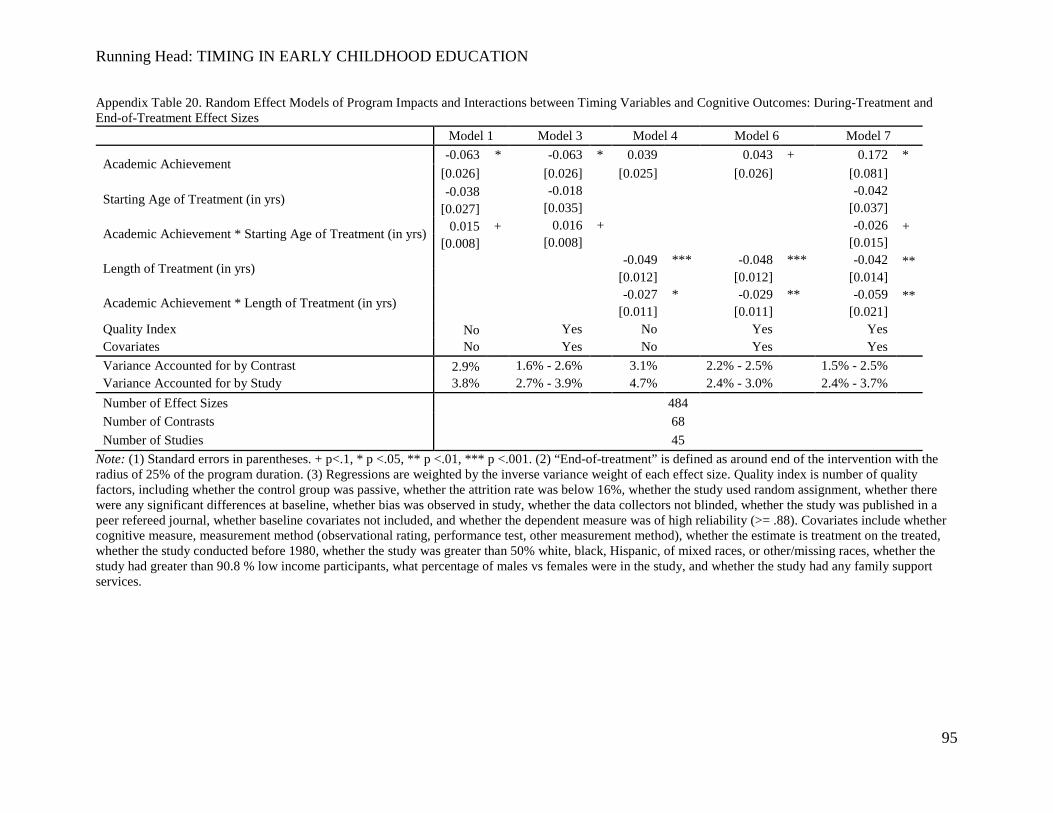
Running Head: TIMING IN EARLY CHILDHOOD EDUCATION
95
Appendix Table 20. Random Effect Models of Program Impacts and Interactions between Timing Variables and Cognitive Outcomes: During-Treatment and End-of-Treatment Effect Sizes
Model 1 Model 3 Model 4 Model 6 Model 7
Academic Achievement -0.063 * -0.063 * 0.039 0.043 + 0.172 *
[0.026] [0.026] [0.025] [0.026] [0.081]
Starting Age of Treatment (in yrs) -0.038
-0.018 -0.042 [0.027]
[0.035] [0.037]
Academic Achievement * Starting Age of Treatment (in yrs) 0.015 + 0.016 + -0.026 + [0.008]
[0.008] [0.015]
Length of Treatment (in yrs) -0.049 *** -0.048 *** -0.042 **
[0.012] [0.012] [0.014]
Academic Achievement * Length of Treatment (in yrs) -0.027 * -0.029 ** -0.059 **
[0.011] [0.011] [0.021]
Quality Index No
Yes No Yes Yes Covariates No Yes No Yes Yes Variance Accounted for by Contrast 2.9%
1.6% - 2.6% 3.1% 2.2% - 2.5% 1.5% - 2.5%
Variance Accounted for by Study 3.8% 2.7% - 3.9% 4.7% 2.4% - 3.0% 2.4% - 3.7% Number of Effect Sizes 484 Number of Contrasts 68 Number of Studies 45
Note: (1) Standard errors in parentheses. + p<.1, * p <.05, ** p <.01, *** p <.001. (2) “End-of-treatment” is defined as around end of the intervention with the radius of 25% of the program duration. (3) Regressions are weighted by the inverse variance weight of each effect size. Quality index is number of quality factors, including whether the control group was passive, whether the attrition rate was below 16%, whether the study used random assignment, whether there were any significant differences at baseline, whether bias was observed in study, whether the data collectors not blinded, whether the study was published in a peer refereed journal, whether baseline covariates not included, and whether the dependent measure was of high reliability (>= .88). Covariates include whether cognitive measure, measurement method (observational rating, performance test, other measurement method), whether the estimate is treatment on the treated, whether the study conducted before 1980, whether the study was greater than 50% white, black, Hispanic, of mixed races, or other/missing races, whether the study had greater than 90.8 % low income participants, what percentage of males vs females were in the study, and whether the study had any family support services.
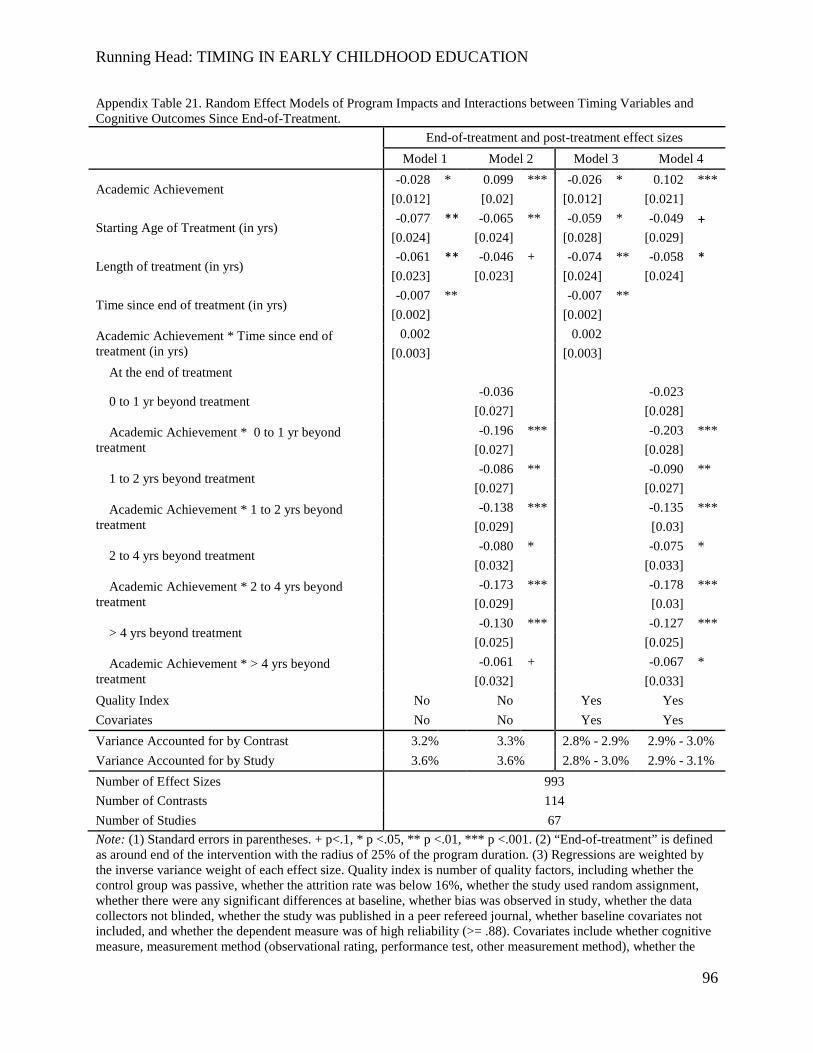
Running Head: TIMING IN EARLY CHILDHOOD EDUCATION
96
Appendix Table 21. Random Effect Models of Program Impacts and Interactions between Timing Variables and Cognitive Outcomes Since End-of-Treatment. End-of-treatment and post-treatment effect sizes
Model 1 Model 2 Model 3 Model 4
Academic Achievement -0.028 * 0.099 *** -0.026 * 0.102 ***
[0.012]
[0.02] [0.012] [0.021] Starting Age of Treatment (in yrs)
-0.077 ** -0.065 ** -0.059 * -0.049 + [0.024]
[0.024] [0.028] [0.029]
Length of treatment (in yrs) -0.061 ** -0.046 + -0.074 ** -0.058 *
[0.023]
[0.023] [0.024] [0.024] Time since end of treatment (in yrs)
-0.007 ** -0.007 ** [0.002] [0.002]
Academic Achievement * Time since end of treatment (in yrs)
0.002 0.002 [0.003] [0.003]
At the end of treatment 0 to 1 yr beyond treatment -0.036 -0.023
[0.027] [0.028] Academic Achievement * 0 to 1 yr beyond treatment
-0.196 *** -0.203 ***
[0.027] [0.028] 1 to 2 yrs beyond treatment -0.086 ** -0.090 **
[0.027] [0.027] Academic Achievement * 1 to 2 yrs beyond treatment
-0.138 *** -0.135 ***
[0.029] [0.03] 2 to 4 yrs beyond treatment -0.080 * -0.075 *
[0.032] [0.033] Academic Achievement * 2 to 4 yrs beyond treatment
-0.173 *** -0.178 ***
[0.029] [0.03] > 4 yrs beyond treatment -0.130 *** -0.127 ***
[0.025] [0.025] Academic Achievement * > 4 yrs beyond treatment
-0.061 + -0.067 *
[0.032] [0.033] Quality Index No No Yes Yes Covariates No No Yes Yes Variance Accounted for by Contrast 3.2% 3.3% 2.8% - 2.9% 2.9% - 3.0% Variance Accounted for by Study 3.6% 3.6% 2.8% - 3.0% 2.9% - 3.1% Number of Effect Sizes 993 Number of Contrasts 114 Number of Studies 67 Note: (1) Standard errors in parentheses. + p<.1, * p <.05, ** p <.01, *** p <.001. (2) “End-of-treatment” is defined as around end of the intervention with the radius of 25% of the program duration. (3) Regressions are weighted by the inverse variance weight of each effect size. Quality index is number of quality factors, including whether the control group was passive, whether the attrition rate was below 16%, whether the study used random assignment, whether there were any significant differences at baseline, whether bias was observed in study, whether the data collectors not blinded, whether the study was published in a peer refereed journal, whether baseline covariates not included, and whether the dependent measure was of high reliability (>= .88). Covariates include whether cognitive measure, measurement method (observational rating, performance test, other measurement method), whether the

Running Head: TIMING IN EARLY CHILDHOOD EDUCATION
97
estimate is treatment on the treated, whether the study conducted before 1980, whether the study was greater than 50% white, black, Hispanic, of mixed races, or other/missing races, whether the study had greater than 90.8 % low income participants, what percentage of males vs females were in the study, and whether the study had any family support services.

Running Head: TIMING IN EARLY CHILDHOOD EDUCATION
98
Appendix 1. Keyword Searches in Meta-Analysis. When determining what studies would be included in our database, we conducted a comprehensive search of the ECE literature from 1960 to 2007. We conducted keyword searches in ERIC, PsycINFO, EconLit, and Dissertation Abstracts databases, resulting in 9,617 documents, as any given program may produce a series of such documents. Our keyword searches included two rounds. The initial search was meant to capture studies that would have been similar to what Abt had included (mainly programs serving 3 to 5 year-olds). We searched studies published between 2003 and 2007 using the following search terms: (early childhood education) or (preschool) or (head start) or (pre-k*). Because we also wanted to locate any additional studies serving 0 to 3 year-olds that were not in Abt's database or were not captured by our above search terms, we used the following terms to search studies published between 1960 and 2007: early childhood education or preschool or head start or pre-k* or early intervention and toddler* or infant* + child care or childcare and center or daycare or day care or nursery school.

Running Head: TIMING IN EARLY CHILDHOOD EDUCATION
99
Appendix 2. Calculation of Effect Size Estimates. Definition of Effect Size An effect size offers a standardized measure of the magnitude of the difference between two groups. Effect size statistics were developed to enable comparisons of measures in different units; obviously, saying that an intervention is associated with a gain of one unit in an outcome measure means something different if the measure is a ten-point scale with mean of 5 and a standard deviation of two versus if the measure is a two-hundred point scale with a mean of 100 and a standard deviation of 15. Effect sizes enable researchers to compare figures presented in different measures in a meaningful way. Comment Effect Size Statistics The most common effect size statistics are Cohen’s d, Hedge’s g, the correlation coefficient r, and the odds ratio. Cohen’s d simply takes the difference between two group means and standardizes them with division by a common standard deviation. That is,
pooledsxxd 21 −= .
Hedge’s g makes an adjustment to Cohen’s d to account for bias in the d estimator when sample sizes are small.
Specifically, it multiplies d by an adjustment factor J: 9)(4
3121 −+
−=nn
J , and
g=d*(J). The correlation coefficient r is a very familiar presentation of effect sizes; correlations may be converted into Cohen’s d statistics with the following formula:
212
rrd−
=
Correlations may also be represented with Fisher’s Z statistics, which is an adjustment that avoids certain problems associated with the standard error of the correlation effect size statistic (Lipsey & Wilson, 2001). Fisher’s Z is related to the correlation coefficient as follows:
−+
=rrZ
11ln5.0 ;
Odds ratios or log odds ratios also give a standard form of effect size. These are used for dichotomous outcomes; say y is a dichotomous outcome variable, A (B) represents the count of events (non-events) in group 1, and C (D) represents the count of events (non-events) in group 2. Events (y=1) Non-events (y=0) Total Group 1 A B N1=A+B Group 2 C D N2=C+D
Then the odds ratio is given by CBDAOR
**
= . If dichotomous outcomes are represented by proportions of people
manifesting the outcome (or event) in each group (i.e., the proportion for whom the indicator on the outcome variable =1), and group sample sizes are known, the event and non-event counts can of course be estimated (A=p1*N1, D=(1-p2)*N2, etc.). If any cell frequency equals 0, add 0.5 to each cell and the odds ratio can be calculated using those adjusted numbers. Odds ratios can be converted to Cohen’s d with the following formula:
π3*)ln(ORd = .