edworkingpaper no. 20-293
TRANSCRIPT

Dual Identification? The Effects of English Learner Status on Special Education Placement
This study examines the effects of English Learner (EL) status on subsequent Special Education (SPED) placement. Through a research-practice partnership, we link student demographic data and initial English proficiency assessment data across seven cohorts of test takers and observe EL and SPED programmatic participation for these students over seven years. Our regression discontinuity estimates consistently differ substantively from results generated through regression analyses. We find evidence that the effect of EL status on SPED placement was either null or tied to slight under-identification. Our results suggest that under-identification occurred two years after EL classification. We also find that EL status led to under-identification for Spanish speakers and proportionate representation for Mandarin/Cantonese speakers and speakers of all other languages.
Acknowledgements - We are grateful for the collaborative efforts of our partner school district and all participating
staff. We appreciate helpful comments from Thomas Dee, Eric Bettinger, David Plank and Kalena Cortes. We also
thank seminar participants at the Stanford Center for Education Policy Analysis (CEPA), the John Gardner Center
for Youth and Their Communities, the University of Hawai`i College of Education and the Association for
Education Finance and Policy. Finally, we acknowledge funding from the California Education Partners and
support from the Institute of Education Sciences, U.S. Department of Education through grant R305B140009 to
the Board of Trustees of the Leland Stanford Junior University. The opinions expressed are those of the authors and
do not represent the views of the Institute, the U.S. Department of Education, the Board of Trustees of the Leland
Stanford Junior University, NWEA, or the Board of Regents of the University of Hawai`i.
Suggested citation: Murphy, Mark, and Angela Johnson. (2020). Dual Identification? The Effects of English Learner Status on Special Education Placement. (EdWorkingPaper: 20-293). Retrieved from Annenberg Institute at Brown University: https://doi.org/10.26300/ykem-n868
VERSION: September 2020
EdWorkingPaper No. 20-293
Mark MurphyUniversity of Hawai`i at Mānoa
Angela JohnsonNWEA

1
Introduction
The effectiveness of educational support services holds tremendous influence on the
academic success of millions of public school students in the U.S. (Thurlow et al., 2006). When
such services meet students’ needs for linguistic or disability support, indicators of student
success can improve (Berkeley et al., 2010; Morgan et al., 2010; Wang & Lam, 2017).
Conversely, when student needs are unmet, student success can falter (Morgan et al., 2010).
Persistent achievement gaps between student populations who are eligible for accommodations
and those who are not suggest that there is substantial room for improvement nationwide (Albus
et al., 2013; Pasternack, 2014). Furthermore, some students rely not solely on English Learner
(EL) services or Special Education (SPED) services, but rather on supports for both a learning
disability and developing English proficiency. We refer to these students as dually identified
students (i.e., identified for both EL and SPED) and they are a central focus of this study
(Carnock & Silva, 2019; Umansky et al., 2017).
Despite a substantive body of descriptive and qualitative research on the relation between
EL and SPED placement, little is known about the causal link between the two. Prior work has
highlighted disproportionate representation of EL students in SPED using descriptive regression
and hazard analyses (Morgan et al., 2015, 2017, 2018; Umansky et al., 2017). This work has
most frequently found EL students to be under-identified in elementary grades, but over-
identified in secondary grades (Umansky et al., 2017). However, a clear evaluation of how EL
status affects subsequent SPED placement has not yet been conducted. Previous studies on this
topic note that to most thoroughly examine disproportionate representation, student-level data are
necessary (Morgan et al., 2017).

2
Through a research partnership with a large, urban school district in California, this study
provides credibly causal evidence on the effects of EL status on subsequent SPED placement.
We make two critical contributions. First, our application of the regression discontinuity (RD)
research design to detailed, student-level administrative data reflects a methodological
advancement over prior work in this area. The RD approach is a powerful quasi-experimental
design that allows for the unbiased examination of the Local Average Treatment Effect (LATE)
by comparing individuals just above and below an arbitrary cut point or threshold that
determines assignment to a particular intervention (Angrist & Pischke, 2009; Thistlewaite &
Campbell, 1960). A core strength of this methodological approach is the modest number of
assumptions that must hold in order for inferences to be considered valid (Angrist & Pischke,
2009). Furthermore, compared with other quasi-experimental research designs (e.g., propensity
score matching; interrupted time series designs, etc.), the RD approach stands out because the
identifying assumptions can be empirically tested (Calonico et al., 2014; McCrary, 2008).
Second, we generate policy-relevant evidence for practitioners that can facilitate the
continuous improvement of SPED identification procedures for ELs. We provide evidence
exploring how the timing of SPED placement may reflect disproportionate representation. We
look specifically at RD results for SPED placement in each year following initial EL
classification in Kindergarten (i.e., Grade 1 to Grade 6). Our results offer targeted evidence to
practitioners that can inform the ongoing development and refinement of SPED identification
procedures. Additionally, we explore effect heterogeneity by primary language to shed light on
possible differences that occurred across language groups. To do this, we split our sample into
three subgroups (i.e., students speaking Spanish as the primary language; students speaking
Cantonese/Mandarin; and students speaking any other non-English language) and apply our RD

3
approach to each subgroup separately. Our findings help to illuminate potential differences in the
way EL students were placed into SPED based on the primary language spoken. Such distilled
information can aid district leaders to develop more targeted approaches for students in each of
the three distinct subgroups. Therefore, this study’s findings are highly relevant for district
stakeholders and decisionmakers.
Our reduced-form RD findings indicate that EL status largely led to proportionate
representation or slight under-identification (i.e., by 2 percentage points or less) of EL students
in SPED placement in this district. In contrast to results from Ordinary Least Squares (OLS)
regression analyses, we find no evidence of a positive association between EL status and SPED
placement. Furthermore, across a wide range of bandwidths, we reject the null hypothesis that
our RD estimate is statistically the same as our OLS estimate, highlighting the novel information
generated by the RD approach. These results, based on the pooled sample, suggest that the
district is effectively identifying a close-to-proportionate number of EL students for SPED
placement. We also find evidence that slight under-identification of EL students for SPED
placement occurred during Grade 2. Furthermore, we observe evidence of heterogeneous effects
by primary language group: Spanish-speaking students were under-identified for SPED;
Chinese-speaking students and students speaking other languages were proportionately
represented in SPED. In combination, these results broadly validate district approaches, but also
suggest areas for adjusting and improving the SPED identification process for ELs. Further,
these findings elucidate the unique value of research-practice partnerships: our results
simultaneously inform and advance the existing literature and provide nuanced details that can
inform district decision-making.

4
Context English Learners
ELs are students between the ages of 3 and 21 who need additional support to improve
their English language listening, speaking, reading and writing abilities to be able to succeed in
academic courses where English is the language of instruction (U.S. Department of Education
(DOE), 2016). Also referred to as students with limited English proficiency (LEP) or as
emergent bilingual/multilingual students, EL students have been a protected class of students
since the 1974 Supreme Court decision in Lau v. Nichols (Hakuta, 2011; Martínez, 2018). Title
III of the Every Student Succeeds Act (ESSA) provides state educational agencies with
substantial latitude in how EL students are to be identified, but most commonly the process
involves a home language survey being sent to newly enrolled students. Students whose families
indicate that a language other than English is spoken at home are then given a formal assessment
to determine if the student qualifies for EL classification (Carnock & Silva, 2019). In California,
for example, the California English Language Development Test (CELDT) was the formal
assessment used to evaluate a student’s English language skills from 2001 to 2017. Students who
classify as EL (i.e., as opposed to English-proficient) are entitled to educational services for
English language development (U.S. DOE, 2016).
Approximately 10 percent of the total US student population was classified as EL in 2015
(Carnock & Silva, 2019; U.S. DOE, 2014). More than three quarters of the “current EL”
population (i.e., students with active EL classification in 2015) at that time identified as Latino/a,
yet the current EL population overall was extremely diverse with regard to race, ethnicity,
nationality and languages spoken (U.S. DOE, 2014). The ten districts enrolling the highest
proportions of current ELs were located in California, Alaska, New Jersey, Arizona and

5
Washington (U.S. DOE, 2014).3 Of the current EL population, approximately 15 percent
qualified for SPED (Carnock & Silva, 2019).
Special Education Students
Students in SPED receive services to enable them to access a free and appropriate public
education (FAPE). Since 1975, federal law and related judicial rulings have required that all
children aged 3-21 nationwide have access to a FAPE. This means that any student with special
needs required due to a disability are to receive individually tailored instructional strategies. The
Individuals with Disabilities in Education Act (IDEA) part B covers students aged 3-21 and
requires schools to provide services in the least restrictive environment (Carnock & Silva, 2019).
As a result, schools must provide necessary educational accommodations while also ensuring the
student is not unnecessarily diverted from typical educational settings. IDEA defines 13 distinct
disability categories.4 When a child aged 3-21 is identified as having a disability in any of these
13 categories, the student is entitled to SPED services and an Individualized Education Program
(IEP) is established.
Since 2007-08, between 13-14 percent of all students nationwide have been placed in
SPED after being identified as having a disability within one of the 13 categories specified in
IDEA. This translates to more than six million students annually receiving SPED services under
IDEA (U.S. Department of Education, 2013, Table 204.30). Students identified with either a
“specific learning disability” or “speech or language impairment” made up more than half of all
disability classifications.5
Dually Identified Students
Students identified as eligible for both EL and SPED services are one of the most
vulnerable student populations, and their unique intersection of needs for educational services

6
calls for greater study and evaluation (Carnock & Silva, 2019). The provision of both EL and
SPED services are required by federal law but implemented at the local level. Federal
appropriations for SPED have historically only covered a limited portion of the actual costs to
provide such services to districts (National Council on Disability, 2018). In recent years, federal
appropriations for SPED have provided just over 15 percent of the actual cost districts
experience when implementing these services. For EL services, real funding levels (i.e., adjusted
for inflation) have recently (i.e., since at least 2015) dropped below the per pupil amount
appropriated in 2002 (Carnock & Silva, 2019). The lack of sufficient funding for both EL and
SPED programs makes concerns regarding the provision of services for dually identified students
who rely on both programs even more stark.
Around 700,000 students nationwide in 2014-15 were dually identified when using a
current-EL framework. Further, current-EL students were more likely to be identified for either
the “specific learning disability” or “speech or language impairment” disability categories than
non-EL students (U.S. DOE, 2014). However, these statistics mask substantial complexity in
defining the presence of EL and dually identified students nationwide by failing to account for
students who were ELs at one time but have since reclassified to English-proficient. In contrast,
an “ever-EL” framework encompasses a broader set of students who are either current ELs or
students who have reclassified out of EL services. A major strength of using the ever-EL
framework is that the underlying sample remains consistent over time, retaining all students who
ever are identified for EL status regardless of reclassification status (Umansky, 2016b). Using
the ever-EL framework is especially important for studying dually identified students because it
helps to compare SPED placement rates for students who were quite similar at baseline (i.e.,
prior to any EL intervention) (Umansky et al., 2017).

7
Prior Literature
Existing research suggests that EL classification can affect later student placement in
SPED (Burr et al., 2015; Burr, 2019; Hibel & Jasper, 2012; Umansky et al., 2017). To the extent
disproportionate classification occurs, SPED placement may be a key moderator of the effect of
EL classification on students’ short- and long-term outcomes. Extant evidence on this topic is
mostly associative in nature and documented using regression or hazard analyses. Our study
contributes meaningfully to existing literature by investigating the causal link between EL status
and SPED placement. In particular, we study the likelihood of SPED participation between one
and six years after being designated for EL status for students who scored only marginally
differently on the CELDT initial assessment during Kindergarten.6 In this review of existing
literature, we discuss the challenging work of disentangling disabilities from language needs, the
prior focus on disproportionate representation, how both under-identification and over-
identification of EL students into SPED can be harmful, and recent methodological advances in
work exploring long-term effects of EL classification.
Disentangling Disabilities from Language Needs
Prior studies highlight the challenge of differentiating student disabilities from English
language developmental needs. Poorly designed language assessments with weak psychometric
properties, for example, can create problems for discerning between language needs and
disability needs (Macswan & Rolstad, 2006). Additionally, an early study noted that a
disproportionate number of Latino/a students were labeled as having a learning disability solely
due to limited English proficiency (Ortiz & Polyzoi, 1986). More recent literature suggests that
difficulty differentiating between a disability and language need continues to challenge
8
educational institutions and staff (Carnock & Silva, 2019). This can be especially true for
students in the early grades and frequently results in diagnoses for a language need earlier than a
disability (Burr, 2019; Carnock & Silva, 2019). Policies pertaining to district SPED
identification processes may be particularly relevant and important to consider relative to this
phenomenon (Burr, 2019).
Disproportionate Identification
Multiple studies highlight the issue of a potential disproportionality (i.e., either
underrepresentation or overrepresentation) of EL student participation in SPED. Crucially,
under-identification of EL students in SPED can be harmful for students academically.
Specifically, under-identification suggests that EL students with learning disabilities are not
receiving necessary services (Greenberg Motamedi et al., 2016). Such a phenomenon could be
occurring as the result of delayed testing for EL students (Samson & Lesaux, 2009). A delay may
be stimulated by some form of explicit or implicit bias against EL students (Figueroa &
Newsome, 2006). An alternative explanation is that EL students may somehow be more difficult
to identify for SPED due to difficulty differentiating between language needs and a disability
(Burr, 2019; Carnock & Silva, 2019). Regardless, under-identification of EL students with a
disability suggests that some students with needs for SPED accommodations are failing to access
essential support services.
On the opposite end of the spectrum, over-identification of EL students for SPED can
also be harmful to students (Burr et al., 2015; Burr, 2019). Over-identification could indicate that
EL students are unnecessarily being designated for additional services that might limit their
inclusion in general education classrooms (Samson & Lesaux, 2009). A key component of
federal law establishing protections for both EL and SPED students dictates that students must be

9
placed in the least restrictive educational environment (Carnock & Silva, 2019). Accordingly,
placement in SPED without a need for accommodations can stymie a student’s ability to
participate in general education class settings, which may be essential for that student’s growth
and development. Furthermore, prior work has highlighted that SPED participation can lead to
stigmatization, which can be harmful for the student (Shifrer, 2013).
Proportionate representation, therefore, would indicate that services are being adequately
provided with students still having access to less restrictive classroom settings. This represents
the appropriate middle ground that districts are seeking to reach (Burr et al., 2015).
Umansky and colleagues (2017) used discrete-time hazard analyses and an “ever-EL”
framework to examine the likelihood that a student subsequently participates in SPED (i.e.,
becomes dually identified). They found that ever-EL students were less present in SPED overall
and within most disability categories (Umansky et al., 2017). However, an important limitation
of this study was that a causal link was not identified. In other words, it is unclear whether
participation in EL services led students to be under-classified in SPED or not. As such,
outstanding research questions about whether EL services cause disproportionate classification
for SPED remain.
Other existing work on the intersection of EL classification and SPED classification also
suggests that ELs tend to be both disproportionately identified for most disability categories and
identified later than non-ELs for SPED services (Hibel & Jasper, 2012; Morgan et al., 2015;
Samson & Lesaux, 2009). Notably, however, these three studies did not report findings for the
subgroup of students that were initially classified for EL, but rather examined samples of
students who either spoke another language at home or were identified as children of immigrants
(i.e., students who may or may not have been eligible for EL services). Still other work has

10
looked exclusively at subgroups of current EL students to analyze disproportionality (e.g.,
Artiles et al., 2005; Sullivan, 2011, Sullivan & Bal, 2013, Wagner et al., 2005). However, as has
been previously noted in the literature, a key shortcoming of these analyses is the inability to
account for reclassification. In other words, the results reported in these articles do not consider
that the sample of EL students changes as students exit EL status (i.e., when a student scores at
the reclassified fluent English proficient level). Retaining reclassified students in the sample is
appropriate as it enables a full and consistent comparison of students over time. Failing to
account for these students may lead to inaccurate evaluations of SPED placement rates. A further
limitation to some extant literature is the reliance on repeated cross section data instead of panel
data (e.g., Klingner et al., 2005; Morgan et al., 2015; Samson & Lesaux, 2009). Such
methodologies inhibit the ability to precisely identify if observed relationships were due to
policy interventions or changes in the underlying sample. In sum, a substantial amount of prior
research has emphasized the importance of understanding the disproportionality of EL students
in SPED. However, to date, the empirical methods applied to this topic, while consistently
becoming more advanced, have been unable to explore a causal link. Our study, combining
panel-based research designs, the ever-EL definition and fine-grain student-level EL and SPED
participation data, allows for a rigorous quantitative analysis of this topic.
Regression Discontinuity Evidence on EL Classification
Up to this point, the application of regression discontinuity (RD) designs to study how
EL status affects SPED placement has not yet occurred. However, recent advances in the
literature pertaining to how EL status affects later educational outcomes illustrates the value of
this approach for studying outcomes of EL students. In particular, several recent studies have
leveraged student scores from the CELDT to employ RD designs that estimate the effect of EL

11
status on academic achievement and attainment (Johnson, 2019; Shin, 2018; Umansky, 2016a,
2016b). Johnson (2019), for example, used a binding score RD framework to examine the effect
of initial EL classification on outcomes such as high school graduation and college attendance.
Initial EL classification and later reclassification were both found to have limited effects on high
school completion and college enrollment. This evidence aligned with other recent RD work that
considered later student achievement via school grades in a different district context (Shin,
2018). In general, Shin (2018) found weak positive effects of initial EL classification. Two other
RD studies that use initial student CELDT scores as the forcing variable found that EL
classification was in fact harmful to the likelihood of taking rigorous academic coursework and
student achievement on standardized tests (Umansky, 2016a, 2016b). Key commonalities across
these articles were the application of the RD design, the use of student-level data, and the
reliance on an initial CELDT assessment score forcing variable. Our study advances the
literature examining disproportionate representation of EL students in SPED by applying these
three key components (i.e., an RD design, student-level data and reliance on an initial CELDT
assessment forcing variable) to important SPED placement outcomes.
Data
We partner with a large urban school district and leverage its longitudinal data from the
California Longitudinal Pupil Achievement Data System (CALPADS). The data include four
essential sets of information: (a) SPED program participation, (b) EL classification; (c) the
official results (overall and by domain) that students obtained during their initial CELDT
assessment; and (d) students’ demographic characteristics. Our study is based on panel data for
SPED participation, EL classification, and demographic characteristics from SY 2006-07

12
through SY 2018-19. Results from the initial CELDT assessment are available from SY 2006-07
through 2016-17.7
To understand the effect of EL status on a consistent set of SPED outcomes, our sample
focuses exclusively on students that took the initial CELDT assessment during their
Kindergarten year.8 The students in our sample, therefore, were those whose families reported
speaking a language other than English at home and entered the district during their Kindergarten
year.9 Critically, our analytical sample includes all students who took the CELDT, whether they
were classified as EL or English-Proficient.10 The presence of both sets of students in our
analytical sample is essential for our quasi-experimental research design.
In order to gain clear insight into the SPED placement outcomes across the elementary
school timespan, we follow 7 cohorts of initial CELDT assessment takers for 7 years (i.e., during
the initial CELDT assessment year and in the 6 subsequent years). Figure 1 provides an
illustration of the cohorts included in our sample. For the main analyses, we keep cohorts of
initial CELDT takers from SY 2006-07 through SY 2012-13 (N=12,607).11 For each of these
cohorts, we observe SPED placement for students in each subsequent year (e.g., in Grade 3).12
Table 1 provides summary statistics.
Our principal outcome variable is an indicator that the student was placed in SPED
between Grades 1 and 6 after the initial CELDT assessment in Kindergarten. Students that were
identified for SPED in the same year (Kindergarten) as the initial CELDT assessment are not
flagged by this outcome. This is because we do not observe the precise start date (day and
month) of SPED participation during Kindergarten and cannot identify whether SPED
participation started before or after the CELDT test. Also, many students enter Kindergarten
having been flagged as needing SPED services through an early childhood education program

13
(e.g., Head Start; Pre-Kindergarten, etc.). Therefore, our analysis focuses on those students
identified for SPED following initial CELDT assessment so that we can directly understand the
influence of EL status. It is important to note that while SPED participation was somewhat rare
(i.e., 7 percent), our uniquely large analytic sample includes 883 students who were identified as
SPED between Grades 1 and 6. With this level of variation and sample size, we are able to
examine the effects of EL status on SPED placement.
We also explore how EL status affects SPED placement in each subsequent year (i.e.,
SPED placement in Grade 1, SPED placement in Grade 2, etc.). A strength of this approach is
that it enables us to identify when, if ever, EL status had an effect on rates of SPED placement.
In addition, our data include baseline demographic characteristics that make up our
student-level controls. We include a flag for whether the student identifies as female. Further, we
have race/ethnicity-based flags for individuals that identify as (a) Hispanic, (b) Chinese, or (c)
Decline to State their Race/Ethnicity. Our data also include measures of the highest level of
education received by the students’ mother or father. We synthesize this information into a flag
for whether the highest-educated parent had at least a high school diploma. Our final baseline
student characteristic approximates the student’s age at the time of the initial assessment.13
Our data from the initial CELDT assessment also include information about the primary
language spoken by the student. More than 40 different languages were represented in the
sample, with large groups of students speaking either Spanish or Chinese (i.e., Mandarin or
Cantonese). As shown in Table 1, approximately 32 percent of students taking the initial CELDT
assessment indicated speaking Spanish. Another 36 percent of students spoke Chinese, and about
33 percent of students indicated speaking another non-English language. Using these language
flags, we explore effect heterogeneity by language groups. This analysis was of interest because

14
the district has this assessment available in English, Spanish and Chinese, but not the other
languages. As a result, we consider the possibility of differential experiences across languages.
Finally, our data identify the school that each student attended and the calendar year of
initial assessment. Using this information, we create school-cohort groups within our data. These
groupings allow us to implement school-cohort fixed effects that help control for common
variation experienced by students in particular schools at particular times.
Methods
One approach to understanding the relationship between EL status and SPED placement
is to simply regress EL status on our SPED outcome variables of interest. Unfortunately, such
regression analysis sheds light only on the correlation between the two variables rather than the
causal relationship. Prior work on this topic has considered the likelihood of SPED placement
based on being an EL, which is a roughly analogous approach. A key shortcoming of this type of
evaluation is an inability to determine how EL status affects SPED placement unless extensive
and likely invalid assumptions (i.e., selection on observables) about the relationship are made.
Table 2 presents OLS regression results for the relationship between EL status and SPED
placement. Across specifications with and without student-level controls and school-cohort fixed
effects, the relationship in our context is significant and positive. The model with all controls
suggests that being assigned EL in Kindergarten is associated with a 3.4 percentage point
increase in SPED placement between Grades 1 and 6. This suggests that EL students were over-
represented in SPED in this district.
A key contribution of our study is the application of a more advanced quasi-experimental
research design that can more rigorously estimate how EL status affected subsequent SPED
placement. Leveraging CELDT scale score data, we differentiate between intent-to-treat and

15
control groups by determining whether the student was assigned to EL status. To do this, we
apply an RD research design to estimate the LATE of EL status on SPED placement. Those
students assigned to EL status based on their CELDT score are the intent-to-treat group. Those
students that were not assigned to EL status (i.e., English-proficient students) based on their
CELDT score are the control group.
Using this approach, we leverage a core underpinning concept from the RD literature—
the idea that students near the EL threshold were quite similar to one another in expectation and
provide a strong counterfactual group (Thistlewaite & Campbell, 1960). Assuming that students
were unable to precisely manipulate their score (an assumption that appears to hold based on
numerous empirical tests presented in Appendix Table A1 and Appendix Figures A1, A2 and A3
in the Supplemental Materials), EL status can be considered as good as randomly assigned for
ranges of the sample near the threshold. Leveraging this natural experiment that occurs near the
arbitrary EL threshold enables a stronger counterfactual comparison group than other quasi-
experimental research designs, such as propensity score matching (Angrist & Pischke, 2009;
Thistlewaite & Campbell, 1960)
Kindergarten students needed to meet a predetermined cut score across multiple language
domains in order to be classified as English-proficient. Students with an Overall Scale Score
below the “Beginning Advanced” level, a Listening Scale Score below the “Intermediate” level,
or a Speaking Scale Score below the “Intermediate” level were classified as ELs. The initial step
to implement the RD approach in this context is to construct a “binding score” forcing variable
that accounts for these three ways that a Kindergarten student could have been classified as an
EL (Papay et al., 2011; Porter et al., 2017; Reardon & Robinson, 2012). To do this, we create
variables for the overall scale score and the listening and speaking scale scores that are centered

16
around the cut scores for each domain and based on initial CELDT assessment results in each
particular year. This allows us to put scores from each Kindergarten cohort on the same scale
despite minor adjustments to the CELDT assessment year to year. For each student, we then take
the minimum value of these three variables to create the binding score forcing variable for
student i in school s and cohort c:
𝐵𝑖𝑛𝑑𝑖𝑛𝑔𝑆𝑐𝑜𝑟𝑒!"#
= 𝑀𝐼𝑁{𝐶𝑒𝑛𝑡𝑒𝑟𝑒𝑑𝑂𝑣𝑒𝑟𝑎𝑙𝑙!"#; 𝐶𝑒𝑛𝑡𝑒𝑟𝑒𝑑𝐿𝑖𝑠𝑡𝑒𝑛𝑖𝑛𝑔!"#; 𝐶𝑒𝑛𝑡𝑒𝑟𝑒𝑑𝑆𝑝𝑒𝑎𝑘𝑖𝑛𝑔!"#}
As reported in Table 1, for 92 percent of students, the binding section was the overall score. For
6 percent of students, the binding section was listening. For the remaining students, speaking was
the binding section.
With the binding score forcing variable established in this way, we test for manipulation
around the cutoff and proceed to apply standard RD methods.14 First, we use the binding score
forcing variable to define the point at which we expect there to be a discontinuous jump in the
probability of treatment:
𝐵𝑒𝑙𝑜𝑤!"# = 𝟏(𝐵𝑖𝑛𝑑𝑖𝑛𝑔𝑆𝑐𝑜𝑟𝑒!"# < 0)
We then apply an RD model that flexibly allows for parametric and non-parametric estimation of
the causal relationship:
𝑌!"# = 𝛼𝐵𝑒𝑙𝑜𝑤!"# + 𝑓(𝐵𝑖𝑛𝑑𝑖𝑛𝑔𝑆𝑐𝑜𝑟𝑒!"#) + 𝜆"# + 𝜷𝑿𝒊𝒔𝒄 + 𝜖!"#

17
In this specification, 𝛼 signifies the discrete jump at the cutoff for EL assignment and is our
coefficient of interest. The indicator 𝐵𝑒𝑙𝑜𝑤!"#, flags observations that were below the cutoff
based on the binding score forcing variable. The 𝑓(𝐵𝑖𝑛𝑑𝑖𝑛𝑔𝑆𝑐𝑜𝑟𝑒!"#) term represents a flexible
function of the binding score forcing variable. We implement this as both non-parametric local
linear regression and as specifications that include both linear and quadratic splines of the
forcing variable.15 𝜆"# represents school-cohort fixed effects, which allows us to remove
variation that is consistent across groups of students testing from the same school-cohort
combination. 𝑿𝒊𝒔𝒄 is a vector of student-level covariates, including an approximation of the
student's age at initial assessment and indicators for being female, Hispanic, Chinese, having
declined to state race/ethnicity, and having the most educated parent being at least a high school
graduate. 𝜖!"# is the mean-zero error term.
As a critical specification check, we test to see how our binding score forcing variable
influenced the probability of actual EL assignment. Table 3 provides point estimates of the first
stage relationships across a variety of specifications. Across the columns of Table 3, we observe
large and statistically significant relationships between our discontinuity parameter, 𝛼, and EL
assignment. Importantly, this indicates that in most cases our binding score forcing variable is
effectively flagging students that ultimately entered EL status. We observe this further by noting
that the F-statistic for our main instrument, 𝐵𝑒𝑙𝑜𝑤!"#, is over 1000 for each reported
specification.16 Still, these results also highlight that our binding score forcing variable does not
perfectly identify treatment. In some cases, a student may have scored below the threshold but
was classified as English-proficient or scored above the threshold but was still classified as EL.
Therefore, we are applying a fuzzy RD specification. Figure 2 illustrates the likelihood of EL

18
classification based on the CELDT binding score. Panel A provides binned averages for the full
analytical sample while Panel B focuses on a narrower range around the threshold. In both
graphs, the number of students within each bin is reported just above the plotted point. Since the
first stage relationship is so strong for both the main sample and sub-samples based on the
primary language spoken by students, we privilege reduced form Intent-To-Treat (ITT) effect
estimates in our main analysis.17
Results
Table 4 presents our main RD results examining the reduced form effect of EL
classification on subsequent SPED placement between Grades 1 and 6. We present three versions
of our main specification. In all models we account for heteroskedasticity of the error term by
reporting Eicker-Huber-White robust standard errors. Column (1) provides results from our main
RD specification that includes a linear spline of the forcing variable, but no other controls.
Column (2) reports a specification that retains the linear spline of the forcing variable and
includes a set of baseline student-level demographic controls. Column (3), our preferred
specification, retains the linear spline of the forcing variable and the student-level controls and
adds in school-cohort fixed effects. Due to the increased set of controls incorporated into this
model, which modestly aid our precision and control for other relevant factors, we focus our
discussion of subsequent results on this specification. The preferred main sample finding is a
marginally significant -1.5 percentage point estimate.
A potential concern for the validity of the RD design is the choice of bandwidth and
functional form. To address this for each variation of our RD specification, Table 5 reports
estimates of the discontinuous jump at the threshold across multiple bandwidth samples. Table 5,
row (1) reports results for the full sample (i.e., +/- 180 points). Row (2) reports results using a

19
sample of students whose scores were within +/- 150 points of the centered cutoff (i.e., a binding
score between -150 and 150). Row (3) presents results for a bandwidth +/- 100 points; row (4)
presents results for a bandwidth of +/- 50 points; and row (5) presents results for a bandwidth of
+/- 34 points around the threshold. Row (5) represents the optimal RD bandwidth suggested by
the Calonico, Cattaneo and Titiunik (2014) approach.
For bandwidths of the full sample, +/- 150 and +/- 100, we observe at least marginally
significant estimates (i.e., p<0.1) of between -0.015 and -0.021 across specifications. This
suggests that students identified as EL were less likely to be placed in SPED between Grades 1
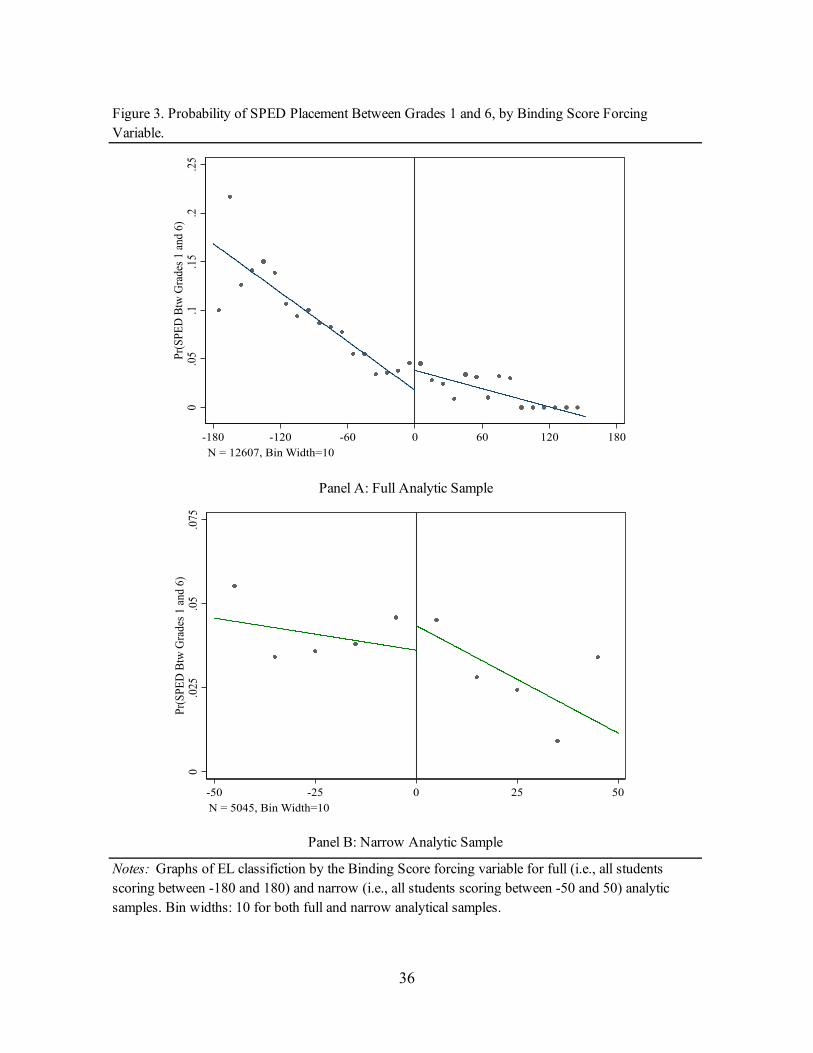
and 6. Figure 3 presents a graphical illustration of this main result for the full sample (Panel A)
and for a narrow sample +/- 50 from the cutoff (Panel B). However, negative point estimates
become slightly larger in magnitude but become statistically insignificant at the +/- 50
bandwidth. Results for all models at the CCT optimal bandwidth similarly indicate that EL status
had no effect on SPED placement between Grades 1 and 6 after initial EL classification in
Kindergarten. These results for narrower bandwidths suggest that EL status led to proportionate
representation in SPED during subsequent years. Examination of both the visual relationships
and the regression results indicates that students classified EL were just as likely as or less likely
than their English-proficient peers to be identified for SPED between Grades 1 and 6. This result
stands in stark contrast to the positive association reported through the naïve regression analysis.
We further probe the robustness of our main results across a range of bandwidth samples
using our preferred specification. Figure 4 presents the point estimates and confidence intervals.
The point estimate is somewhat volatile and confidence intervals are wider at relatively small
bandwidth samples. This is what we would expect given the smaller sample sizes. As our
bandwidths increase, confidence intervals narrow and point estimates stabilize around -0.015

20
(i.e., a decrease of 1.5 percentage points). Importantly, our point estimates are largely
indistinguishable from zero (i.e., the blue dotted line), indicating that we have a precisely
estimated null result. However, these estimates are statistically different from the regression
analysis estimates (i.e., the red dotted line). For all bandwidth samples presented, we reject the
null hypothesis (when 𝛼=0.05) that our regression discontinuity model coefficient of interest is
equal to our OLS regression analysis coefficient.
Table 6 reports reduced form RD results for our preferred specification (i.e., with a linear
spline, student-level controls, and school-cohort fixed effects) for SPED placement in each
particular grade after the initial CELDT assessment. Column (1) replicates the RD result for our
main outcome, SPED placement between Grade 1 and 6. Column (2) reports the RD estimate for
SPED placement in Grade 1. Column (3) presents the RD estimate for SPED placement in Grade
2. Columns (4)-(7) follow in cognate form with Column (7) presenting RD estimates for SPED
placement in Grade 6. In identical form to Table 5, the rows of this table correspond to different
bandwidth samples (i.e., the full sample, +/- 150, +/- 100, +/- 50 and +/- 34).
Results from column (2) indicate no major difference in SPED placement probability for
students classified as EL and English-proficient in Grade 1. Results from column (3), however,
consistently show point estimates of about -0.01, which are statistically significant (i.e., p<0.05)
in bandwidth samples +/- 100 and larger. This provides compelling evidence that EL status was
leading to modest under-identification in Grade 2. Columns (4) and (5) report point estimates
very close to zero that are not statistically significant. Therefore, we observe no discernable
disproportionality emerging in Grade 3 or 4. In column (6), we observe larger negative point
estimates in narrow bandwidth samples that become smaller in the larger bandwidth samples.

21
This provides suggestive evidence that under-identification may have also been occurring in
Grade 5. Column (7) indicates that there was not a disproportionate relationship in Grade 6.
In Table 7, we examine heterogeneous effects by students’ primary language for our main
outcome of interest.18 Column (1) presents results for Spanish speaking students. Here, we
observe quite consistent point estimates, all between -0.043 and -0.055, that are not statistically
significant at the narrowest bandwidths reported but become at least marginally significant for
bandwidths larger than +/- 100 points. These results indicate that Spanish speakers classified as
ELs were between 4.3 and 5.5 percentage points less likely to be placed in SPED between
Grades 1 and 6. To contextualize these results, about 10.5 percent of Spanish speakers in the
sample were placed in SPED between Grades 1 and 6. Our RD estimates suggest that EL status
reduced SPED identification by between 41 and 52 percent for this subgroup. Column (2) of
Table 6 presents RD results for the subsample of students who primarily spoke Mandarin or
Cantonese. Point estimates are close to zero and not statistically significant across all reported
bandwidths. This indicates that there was proportionate representation of these EL students
placed in SPED between Grades 1 and 6. Column (3) of Table 6 shows point estimates for
students who spoke languages other than English, Spanish, Mandarin, or Cantonese. Here, point
estimates for all bandwidths of +/- 50 points around the cutoff or larger are quite consistent. The
point estimates range from -0.007 to -0.017, but none of them are statistically significant.
Figure 5 provides graphical illustrations of these heterogeneous results: Panel A for
Spanish speakers; Panel B for Chinese speakers; and Panel C for speakers of all other languages.
Based on the point estimates and graphical results, we find evidence of under-identification for
Spanish speaking students and no evidence of disproportionate representation for Chinese
speakers and speakers of all other languages.

22
In addition to these results of the main analytic sample, we also present supplemental
analyses in Appendix Tables in the Supplemental Materials. Appendix Table A2 illustrates the
OLS estimate of the relationship between EL status and SPED placement after a varying number
of years. Appendix Table A3 provides main specification estimates for differently structured
analytic samples (e.g., 8 cohorts observed for 6 years each; 9 cohorts observed for 5 years each,
etc.). In Appendix B, we conduct cognate analyses for students who took the initial CELDT
assessment in Grades 1-5. Results are similar to the Kindergarten sample but are imprecise due
to a far smaller sample size. Future work can explore whether these results are similar for
students who took the CELDT assessment in a year after Kindergarten for a longer panel of data.
Discussion
For students with special needs, timely and appropriate placement into educational
support services is essential (Burr, 2019). Delayed identification or misidentification can be
academically and psychologically harmful for students (Carnock & Silva, 2019). Prior research
has documented concerns specifically about EL students’ being misidentified for SPED services
and focused the analyses on disproportionate representation of EL students in SPED (Morgan et
al., 2015, 2018; Umansky et al., 2017). However, largely due to data restrictions, these efforts
have mainly resulted in descriptive findings. This study is the first to directly explore the causal
link between EL status and subsequent SPED placement.
Using a rigorous quasi-experimental research design, we provide compelling new
evidence about the effect of EL status on SPED placement. In clear contrast to positive
correlations suggested by regression analyses, our main RD results indicate a null or slightly
negative overall effect of EL status on SPED placement between Grades 1 and 6 after initial EL
classification in Kindergarten. For nearly all bandwidth samples, our RD estimates differ

23
statistically from the positive correlations estimated through OLS. This clear result poignantly
emphasizes the critical distinction between correlation and causation. Our credibly causal results
indicate that differences are modest when comparing SPED placement rates for students who
barely reach and students who barely miss the English proficiency threshold in Kindergarten. In
fact, EL status led to proportionate or slight under-identification of EL students for SPED. This
finding suggests that qualitative analyses about the districts’ identification protocols and
practices would be informative and valuable.
Furthermore, our methodological approach allowed us to explore when disproportionate
representation might appear. Our results indicate that under-representation by 0.9 to 1.1
percentage points arose during Grade 2. We also found suggestive evidence of slight under-
representation by 0.5 to 0.9 percentage points in Grade 5. One potential explanation for under-
identification of ELs in Grades 2 and 5 is the preparation for academic transition. Students
typically transition from learning to read to reading to learn as they enter Grade 3. It is possible
that to prepare for this transition, school staff are paying extra attention to students’ learning
challenges and needs. Teachers may be more likely to refer students who are native English users
or initially English-proficient to be assessed for disabilities. In contrast, EL students may be less
likely to be referred for a disability assessment if the teacher believes the challenges EL students
experience with learning or literacy are due to developing language proficiency and not due to a
potential disability. District administrators affirmed this possibility and shared that schools tend
to closely students for SPED needs during Grade 2; ELs on the other hand, are usually given
“more time” before they are referred for assessment. A similar scenario might explain the slight
under-identification of ELs for SPED placement in Grade 5. As teachers prepare students for
transition to middle school in Grade 6, native and fluent users of English may be more likely to

24
be referred for a needs assessment, since any academic challenges they experience are not likely
to be attributed to English language proficiency.
We were also able to examine effect heterogeneity by primary language category. Doing
this, we found important results: Spanish speakers were under-identified by a statistically
significant 4-5 percentage points; Chinese speakers and speakers of all other languages were
proportionately identified. These heterogeneous findings by primary language merit further
discussion.
First, practices for identifying special needs used by the district factor prominently into
understanding these results. In our partner district, many tools for assessing needs for disabilities
are provided in English, Spanish, Cantonese, and Mandarin. In other words, when ELs who are
Spanish and Chinese speakers are assessed for special needs, the assessments can often be
conducted in their primary language, while ELs who speak other languages are assessed in
English. We would expect the availability of primary language assessment to lead to more
accurate placement that matches students’ needs. But this could also either increase or decrease
the rate of actual SPED placement relative to using an English assessment. Although both
Spanish speaking and Chinese speaking ELs had access to primary-language SPED assessment,
we find that the Spanish speaking ELs were under-identified for SPED relative to Spanish
speaking English-proficient students while Chinese speaking ELs were proportionately
identified. We do not observe the language of the assessment administered to each student and
are unable to analyze the effect of using primary-language assessment. The contrast in SPED
placement between Spanish and Chinese speaking ELs raises the possibility of future research
investigating the role of primary-language assessment in SPED placement.

25
Second, given the estimated magnitude of the under-identification of Spanish-speaking
EL students for SPED, it is important to further evaluate this result. By considering results by
language group, we demonstrate the value of within group comparisons as opposed to across
group comparisons when considering the issue of disproportionate representation of EL students
in SPED. Our results suggest that it was possible that Spanish speaking ELs were referred for
assessment at lower rates compared to Spanish speaking English-proficient students.
Alternatively, among students whose primary language is Spanish who were assessed for special
needs, ELs and English-proficient student may have been assessed for SPED in different
languages (e.g., ELs in Spanish; English-proficient students in English). Such difference in the
language of assessment may have contributed to differential rates of SPED placement.
Regardless, under-identification warrants attentions because as noted by prior research (e.g.,
Greenberg Motamedi et al. 2016), it can suggest that students needing services may not be
accessing them. We are unable to directly explore the factors that may have led to differential
placement rates by EL status, as we do not observe data on student referral for special needs
assessment, the assessments given, or results from those assessments.19
This study effectively demonstrates the power of research-practice partnerships in
generating research that directly informs education practice and policy. Having discussed the
findings with the research team, the district has begun multiple initiatives. First, both SPED and
EL departments have set out to analyze qualitative data on SPED identification, with a focus on
Grade 2 students and Spanish speaking ELs. Second, the partnership plans to examine additional
data to analyze EL pathways through SPED identification and programs. This study has thus
motivated a series of mixed-methods inquiries aimed at developing equitable practices around
SPED identification and services.

26
Limitations
A few limitations to this study merit consideration. First, the RD design exploits
assignment to treatment that is as good as random at the cut score; thus, results may not be
generalizable to students who scored far above or far below the cut score. Also, in the presence
of treatment heterogeneity, our estimates would only be defined for the compliers, who took up
the EL status assigned by their kindergarten CELDT score. Second, the data come from one
district with a long history of serving a large, diverse EL student population and a mature
research-practice partnership with a large research university, so the findings may be particularly
influenced by this context. Third, the data did not support a robust standalone analysis of ELs
who entered the district between Grade 1 and 5. Future research should consider differential
effects of later district entry on dual identification when more data are available. Finally, this
study was not able to identify the precise mechanisms driving the overall null effect of
kindergarten EL classification or the source of heterogeneous treatment effect by students’
primary language. Detailed mixed methods inquiry into this topic could prove valuable for
identifying such mechanisms in future research.
Concluding Remarks
Our results offer a causal assessment of how EL status in Kindergarten affected
subsequent SPED placement in our partner district. Such results make a substantial contribution
to existing literature in at least two ways. First, they represent a methodological advancement in
the consideration of disproportionate representation of EL students in SPED. Our results
demonstrate the viability of the RD approach in this context and suggest that ongoing research
can use this applied framework to better understand the interaction of these two major
educational service programs. Second, we shed light on when and for whom disproportionate

27
representation occurred. Such information is valuable to our partner district as they look to
improve policy pertaining to the SPED placement process for EL students in the district.
Consideration for the timing of SPED placement following EL classification and for potential
differences among student subgroups is also relevant to the design of SPED placement
procedures across the nation.
This combination of scholarship that advances existing literature and provides directly
usable results for practitioners highlights the uniquely valuable contributions of research
conducted through research-practice partnerships. Furthermore, the application of the RD
methodology to this topic sets the stage for ongoing research studying the interaction of EL and
SPED services in other contexts.
Endnotes 1 University of Hawai`i at Mānoa
2 NWEA
3 Overall, during the 2014-15 school year, the western and southwestern regions had
substantially larger current EL populations than most other parts of the US (U.S. DOE 2014).
4 Specifically, the categories are: (1) autism; (2) deaf-blindness; (3) developmental delay; (4)
emotional disturbance; (5) hearing impairment; (6) intellectual disability; (7) multiple
disabilities; (8) orthopedic impairment; (9) other health impairment; (10) specific learning
disability; (11) speech or language impairment; (12) traumatic brain injury; and (13) visual
impairment (including blindness) (Carnock & Silva, 2019).
5 The next most commonly experienced categories of disability were “other health impairment”
and “autism”, which together accounted for just under one quarter of all disability classifications.
The next three most prominent categories have tended to be “developmental delay”, “intellectual

28
disability” and “emotional disturbance”. Together, these three categories made up approximately
18 percent of all disabilities classified. Finally, hearing impairments, multiple disabilities,
orthopedic impairments, traumatic brain injury and visual impairments consistently made up less
than 5 percent of all disabilities classified. (U.S. DOE, 2013, Table 204.30) In addition to
learning disabilities, approximately 10 percent of SPED students also classified as being an EL
(National Council on Disability, 2018).
6 From this point forward, we refer to one year after being designated for EL status as Grade 1,
two years after as Grade 2, and so on. However, it is possible that a student was retained in a
particular grade for a second year. Due to missingness in the grade level variable in our dataset,
we cannot exactly estimate the frequency of this occurrence. The district reports a low level of
retention overall, however, suggesting that it was quite infrequent.
7 After 2016-17, California began implementing the English Language Proficiency Assessments
for California (ELPAC) and discontinued the same level of reliance on the CELDT.
8 In supplemental analyses (i.e., Appendix Table B1 and Appendix Table B2), we consider an
additional sample of students who took the initial CELDT assessment between Grades 1 and 5.
We privilege the Kindergarten sample in our main analysis because students who enter the
district and are assessed at Kindergarten entry are more comparable to one another than students
who enter the district in later grades. Of the students taking the initial CELDT assessment
between Kindergarten and Grade 5, more than 75 percent of them were assessed during the
Kindergarten year. The focus on Kindergarten CELDT takers is also consistent with other recent
RD studies relying on the CELDT forcing variable (e.g. see Umansky 2016b; Shin 2018).
9 We exclude students that scored the minimum score Overall or on Speaking or Listening
domains because the CELDT assessment simply gives these students the lowest raw score and

29
does not differentiate between abilities at these levels. We also exclude students with missing
outcome or covariate data.
10 California refers to these students as Initially Fluent English Proficient (IFEP); in other
contexts, the term “English-proficient” is more common.
11 A critical tradeoff in our sample construction was between the number of cohorts to include
and the length of time for which we would observe their outcome. We chose this analytical
sample in an effort to study the most relevant time window with the greatest statistical power.
12 In supplemental analyses (i.e., Appendix Table A3), we consider more cohorts of students
across shorter periods of time. We also consider fewer cohorts of students across longer periods
of time.
13 Since our data only provide the birth month and birth year of each student, we necessarily
approximate student age at the initial CELDT assessment.
14 In the supplemental materials, Appendix Figures A1, A2 and A3 and Appendix Table A1
provide evidence pertaining to the continuity of the forcing variable. Appendix Figure A1
presents raw histogram of the forcing variable for full and narrow samples. Appendix Table A2
shows results from the McCrary (2008) density test using bin widths of 10 and 2. Appendix
Table A3 illustrates results from the Cattaneo, Jannson and Ma (2018) density test. Appendix
Table A1 checks covariate balance across the threshold. The combined evidence does not
suggest a violation of the continuity assumption. In addition to these checks, we conducted
density tests for the forcing variable by different primary language subsamples (i.e., Spanish,
Chinese and all other languages). For these subsamples, we similarly observe no evidence of a
discontinuity at the threshold.

30
15 While we examined models that incorporated quadratic splines of the forcing variable, the
Akaike Information Criteria (AIC) indicated that linear specifications should be privileged. As a
result, we principally report specifications with linear splines of the forcing variable.
16 We also test the first stage relationship for three primary language subsamples (i.e., Spanish,
Chinese, and all other languages) and find quite consistent results across language groups. In
these instances, we observe large and statistically significant jumps at the threshold (i.e., all
greater than 0.7) with the first bin to the right of the threshold exhibiting the largest rate of non-
compliance, with a likelihood of EL classification between 0.2 and 0.3. The character of the
observed fuzziness is quite similar across subsamples.
17 Results for 2SLS specifications that scale our treatment effect estimates by levels of
compliance are available upon request. These 2SLS estimates represent our Treatment on the
Treated (TOT) estimates.
18 Note that each language subgroup sample is only about one-third of the main analytic sample,
which reduces the precision of our estimates.
19 One other possible scenario is that concern about over-identification in an equity-focused
district, triggered by the fact that there was a higher SPED identification rate overall for Spanish
speaking ELs as compared to Chinese speaking ELs or ELs that speak of all other languages,
actually led to lower identification rates for Spanish speaking ELs. Reliance on cross-group
comparisons could have guided staff toward reducing identification of Spanish speaking EL
students for SPED in order to ensure they were not overrepresented.

31
References
Albus, D., Lazarus, S. S., & Thurlow, M. L. (2013). 2012-13 Publicly Reported Assessment Results for Students with Disabilities and ELLs with Disabilities (Technical Report 70). University of Minnesota, National Center on Educational Outcomes.
Angrist, J. D., & Pischke, J. S. (2009). Mostly Harmless Econometrics: An Empiricist’s Companion. Princeton University Press.
Artiles, A. J., Rueda, R., Salazar, J. J., & Higareda, I. (2005). Within-Group Diversity in Minority Disproportionate Representation: English Language Learners in Urban Schol Districts. Exceptional Children, 71(3), 283-300.
Berkeley, S., Scruggs, T. E., & Mastropieri, M. A. (2010). Reading Comprehension Instruction for Students with Learning Disabilities, 1995-2006: A Meta-Analysis. Remedial and Special Education, 31(6), 423–436.
Burr, E. (2019). Guidance Manuals for Educators of English Learners with Disabilities: Ideas and Lessons from the Field (NCEO Report 410). University of Minnesota, National Center on Educational Outcomes.
Burr, E., Haas, E., & Ferriere, K. (2015). Identifying and supporting English learner students with learning disabilities: Key issues in the literature and state practice (REL 2015-086). U.S. Department of Education, Institute of Education Sciences, National Center for Education Evaluation and Regional Assistance, Regional Educational Laboratory West.
Calonico, S., Cattaneo, M. D., & Titiunik, R. (2014). Robust data-driven inference in the regression-discontinuity design. Stata Journal, 14(4), 909–946.
Carnock, J. T., & Silva, E. (2019). English Learners with Disabilities: Shining a Light on Dual-Identified Students. New America.
Cattaneo, M. D., Jansson, M., & Ma, X. (2018). Manipulation testing based on density discontinuity. Stata Journal 18(1), 234-261.
Figueroa, R. A., & Newsome, P. (2006). The diagnosis of LD in English learners: Is it nondiscriminatory? Journal of Learning Disabilities, 39(3), 206–214.
Greenberg Motamedi, J., Cox, M., Williams, J., & Deussen, T. (2016). Uncovering Diversity: Examining the Representation of English Learners in Special Education in Washington State. Education Northwest, Regional Educational Laboratory Northwest.
Hakuta, K. (2011). Educating Language Minority Students and Affirming Their Equal Rights: Research and Practical Perspectives. Educational Researcher, 40(4), 163–174.
Hibel, J., & Jasper, A. D. (2012). Delayed special education placement for learning disabilities among children of immigrants. Social Forces, 91, 503-530.
Johnson, A. (2019). The Effects of English Learner Classification on High School Graduation and College Attendance. AERA Open, 5(2).
Klingner, J. K., Artiles, A. J., Kozleski, E., Harry, B., Zion, S., Tate, W., Durán, G. Z., & Riley, D. (2005). Addressing the disproportionate representation of culturally and linguistically diverse students in special education through culturally responsive educational systems. Education Policy Analysis Archives, 13, 1–43.
Macswan, J., & Rolstad, K. (2006). How language proficiency tests mislead us about ability: Implications for English language learner placement in special education. Teachers College Record, 108(11), 2304–2328.
Martínez, R. A. (2018). Beyond the English Learner Label: Recognizing the Richness of Bi/Multilingual Students’ Linguistic Repertoires. Reading Teacher, 71(5), 515–522.

32
McCrary, J. (2008). Manipulation of the running variable in the regression discontinuity design: A density test. Journal of Econometrics, 142(2), 698–714.
Morgan, P. L., Farkas, G., Cook, M., Strassfeld, N. M., Hillemeier, M. M., Pun, W. H., & Schussler, D. L. (2017). Are black children disproportionately overrepresented in special education? A best-evidence synthesis. Exceptional Children, 83(2), 181–198.
Morgan, P. L., Farkas, G., Cook, M., Strassfeld, N. M., Hillemeier, M. M., Pun, W. H., Wang, Y., & Schussler, D. L. (2018). Are hispanic, asian, native american, or language-minority children overrepresented in special education? Exceptional Children, 84(3), 261–279.
Morgan, P. L., Farkas, G., Hillemeier, M. M., Mattison, R., Maczuga, S., Li, H., & Cook, M. (2015). Minorities Are Disproportionately Underrepresented in Special Education: Longitudinal Evidence Across Five Disability Conditions. Educational Researcher, 44(5), 278–292.
Morgan, P. L., Frisco, M. L., Farkas, G., & Hibel, J. (2010). A propensity score matching analysis of the effects of special education services. Journal of Special Education, 43(4), 236–254.
National Council on Disability. (2018). Broken Promises: The Underfunding of IDEA. Ortiz, A. A., & Polyzoi, E. (1986). Characteristics of Limited English Proficient Hispanic
Students in Programs for the Learning Disabled: Implications for Policy, Practice and Research. Part 1. Report Summary. U.S. Department of Education.
Papay, J. P., Willett, J. B., & Murnane, R. J. (2011). High-School Exit Examinations and the Schooling Decisions of Teenagers A Multi-dimentional Regression-Discontinuity Analysis (NBER Working Paper Series 17112). National Bureau of Economic Research.
Pasternack, R. (2014). Reinventing Special Education: Closing the Gap Between Disabled and Non-disabled Students. Interactive Convention, Learning Labs.
Porter, K. E., Reardon, S. F., Unlu, F., Bloom, H. S., & Cimpian, J. R. (2017). Estimating Causal Effects of Education Interventions Using a Two-Rating Regression Discontinuity Design: Lessons From a Simulation Study and an Application. Journal of Research on Educational Effectiveness, 10(1), 138-167.
Reardon, S. F., & Robinson, J. P. (2012). Regression Discontinuity Designs With Multiple Rating-Score Variables. Journal of Research on Educational Effectiveness, 5(1), 83–104.
Samson, J. F., & Lesaux, N. K. (2009). Language-Minority Learners in Special Education: Rates and Predictors of Identification for Services. Journal of Learning Disabilities, 42(2), 148–162.
Shifrer, D. (2013). Stigma of a Label: Educational Expectations for High School Students Labeled with Learning Disabilities. Journal of Health and Social Behavior, 54(4), 462–480.
Shin, N. (2018). The Effects of the Initial English Language Learner Classification on Students’ Later Academic Outcomes. Educational Evaluation and Policy Analysis, 40(2), 175–195.
Sullivan, A. (2011). Disproportionality in Special Education Identification and Placement of English Langauge Learners. Exceptional Children, 77(3), 317-334.
Sullivan, A. & Bal, A. (2013). Disproportionality in Special Education: Effects of Individual and School Variables on Disability Risk. Exceptional Children 79(4), 475-494.
Thistlewaite, D. L., & Campbell, D. T. (1960). Regression-Discontinuity Analysis: An Alternative to the Ex-Post Facto Experiment. Journal of Educational Psychology, 51, 309–317.
Thurlow, M. L., Quenemoen, R. F., & Lazarus, S. S. (2006). Meeting the Needs of Special Education Students: Recommenations for the Race to the Top Consortia and States. College

33
and Research Libraries News, 67(9), 548–550. U.S. Department of Education. (2014). Our Nation’s English Learners. U.S. Department of
Education. U.S. Department of Education. (2016). Non-regulatory guidance: English learners and Title III
of the Elementary and Secondary Education Act (ESEA), as amended by the Every Student Succeeds Act (ESSA). U.S. Department of Education, Office of Elementary and Secondary Education.
U.S. Department of Education, National Center for Education Statistics. (2013). Table 204.30: Children 3 to 21 years old served under Individuals with Disabilities Education Act (IDEA), Part B, by disability: Selected years, 1976-77 through 2011-12. In U.S. Department of Education, National Center for Education Statistics (Ed.), Digest of Education Statistics (2013 ed.).
Umansky, I. M. (2016a). Leveled and Exclusionary Tracking: English Learners’ Access to Academic Content in Middle School. American Educational Research Journal, 53(6), 1792–1833.
Umansky, I. M. (2016b). To Be or Not to Be EL: An Examination of the Impact of Classifying Students as English Learners. Educational Evaluation and Policy Analysis, 38(4), 714–737.
Umansky, I. M., Thompson, K. D., & Díaz, G. (2017). Using an ever-english learner framework to examine disproportionality in special education. Exceptional Children, 84(1), 76–96.
Wagner, R. K., Francis, D. J., & Morris, R. D. (2005). Identifying English language learners with learning disabilities: Key challenges and possible approaches. Learning Disabilities Research and Practice, 20, 6-15.
Wang, M., & Lam, Y. (2017). Evidence-Based Practice in Special Education and Cultural Adaptations: Challenges and Implications for Research. Research and Practice for Persons with Severe Disabilities, 42(1), 53–61.

34
Kindergarten Cohort t=0 t=1 t=2 t=3 t=4 t=5 t=6 t=7 t=8 t=9 t=10 t=11 t=122006-07 m m m m m m m s s s s e e2007-08 m m m m m m m s s s s e2008-09 m m m m m m m s s s s2009-10 m m m m m m m s s s2010-11 m m m m m m m s s2011-12 m m m m m m m s2012-13 m m m m m m m2013-14 s s s s s s2014-15 s s s s s2015-16 s s s s2016-17 e e e2017-18 e e2018-19 e
Figure 1. CELDT Cohort Data Visual
Notes: Student-level data for individuals who took their initial CELDT assessment in Kindergarten are from CALPADS for SY 2006-07 through SY 2018-19. Our main analysis includes cohorts who took the initial assessment from SY 2006-07 through SY 2012-13, observed annually during the assessment year and the six subsequent years. Our supplemental analyses include cohorts who took the inital assessment from SY 2006-07 through SY 2015-16 observed in three to ten subsequent years. We exclude data from cohorts after SY 2015-16 cohorts and we exclude data after the 10th subsequent year for SY 2006-07 and SY 2007-08 cohorts. In the graphic above, "m" indicates that the data were used in the main analysis; "s" indicates that the data were used in supplemental analyses, and "e" indicates that the data were excluded.

35
Figure 2. Probability of EL Classfication by Binding Score, Graphical Results.
Panel A: Full Analytic Sample
Panel B: Narrow Analytic Sample
Notes: Graphs of EL classifiction by the Binding Score forcing variable for full (i.e., all students scoring between -180 and 180) and narrow (i.e., all students scoring between -50 and 50) analytic samples. Bin width: 10. In Panel B, the number of students in each bin is labeled above each binned average.
36
Figure 3. Probability of SPED Placement Between Grades 1 and 6, by Binding Score Forcing Variable.
Panel A: Full Analytic Sample
Panel B: Narrow Analytic Sample
Notes: Graphs of EL classifiction by the Binding Score forcing variable for full (i.e., all students scoring between -180 and 180) and narrow (i.e., all students scoring between -50 and 50) analytic samples. Bin widths: 10 for both full and narrow analytical samples.
0.0
5.1
.15
.2.2
5Pr
(SPE
D B
tw G
rade
s 1 an
d 6)
-180 -120 -60 0 60 120 180N = 12607, Bin Width=10
0.0
25.0
5.0
75Pr
(SPE
D B
tw G
rade
s 1 an
d 6)
-50 -25 0 25 50N = 5045, Bin Width=10

37
Figure 4. Sensitivity of Effect Estimates Across Bandwidths.
Notes: The dependent variable is a flag for being placed in SPED between Grades 1 and 6. All models include a linear spline of the forcing variable, school-cohort fixed effects and the following student-level controls: an indicator for female; an indicator for the student's most educated parent being at least a HS graduate; an indicator for being Hispanic; an indicator for being Chinese; an indicator for declining to state race/ethnicity; and the student's age at initial assessment. We exclude point estimates for samples with bandwidths less than or equal to +/- 7. The 95 percent confidence interval around each estimate is also graphed. The blue line is 0 and the red dotted line is the full analytic sample OLS benchmark estimate of 0.034.

38
Full
Ana
lytic
Sam
ple
Figu
re 5
. Pro
babi
lity
of S
PED
Pla
cem
ent B
etw
een
Gra
des
1 an
d 6,
by
Bin
ding
Sco
re F
orci
ng V
aria
ble
and
Prim
ary
Lang
uage
.
Nar
row
Ana
lytic
Sam
ple
Notes:
Gra
phs
of E
L cl
assi
fictio
n by
the
Bin
ding
Sco
re fo
rcin
g va
riabl
e fo
r ful
l (i.e
., al
l stu
dent
s sc
orin
g be
twee
n -1
80 a
nd 1
80) a
nd
narr
ow (i
.e.,
all s
tude
nts
scor
ing
betw
een
-50
and
50) a
naly
tic s
ampl
es b
y pr
imar
y la
ngua
ge. T
he tw
o le
ft m
ost g
raph
s (i.
e., P
anel
A)
are
for S
pani
sh s
peak
ers;
the
two
mid
dle
grap
hs (i
.e.,
Pane
l B) a
re fo
r Chi
nese
spe
aker
s; a
nd th
e tw
o rig
htm
ost g
raph
(i.e
., Pa
nel C
) ar
e fo
r spe
aker
s of
all
othe
r non
-Eng
lish
lang
uage
s. B
in w
idth
s: 1
0 fo
r bot
h an
alyt
ical
sam
ples
.
Pane
l A:
Span
ish
Spea
kers
Pane
l B: C
hine
se S
peak
ers
Pane
l C: A
ll O
ther
Lan
guag
e Sp
eake
rs
0.025.05.075Pr(SPED Btw Grades 1 and 6)
-50
-25
025
50N
= 2
145,
Bin
Wid
th=1
0
0.05.1.15.2.25Pr(SPED Btw Grades 1 and 6)
-180
-120
-60
060
120
180
N =
413
4, B
in W
idth
=10
0.025.05.075Pr(SPED Btw Grades 1 and 6)
-50
-25
025
50N
= 1
625,
Bin
Wid
th=1
0
0.05.1.15.2.25Pr(SPED Btw Grades 1 and 6)
-180
-120
-60
060
120
180
N =
448
3, B
in W
idth
=10
0.025.05.075Pr(SPED Btw Grades 1 and 6)
-50
-25
025
50N
= 1
275,
Bin
Wid
th=1
0
0.05.1.15.2.25Pr(SPED Btw Grades 1 and 6)
-180
-120
-60
060
120
180
N =
399
0, B
in W
idth
=10

39
Table 1. Summary Statistics Variable Mean Std. Dev. Min MaxStudent Characteristics in Year of Initial Assessment
Female 0.50 0.50 0 1Hispanic 0.35 0.48 0 1Chinese 0.38 0.48 0 1Decline to State Race/Ethnicity 0.04 0.20 0 1Parent's Highest Education Level >= High School Diploma 0.49 0.50 0 1Age at Initial Assessment (approximation) 6.4 0.3 4.6 7.4Primary Language: Spanish 0.32 0.47 0 1Primary Language: Mandarin/Cantonese 0.36 0.48 0 1Primary Language: Other 0.33 0.47 0 1
Binding Score -56 52 -176 151Centered Overall Scale Score -55 52 -176 151Centered Listening Scale Score -18 56 -147 161Centered Speaking Scale Score 3 60 -156 225Binding Section: Overall 0.92 0.27 0 1Binding Section: Listening 0.06 0.25 0 1Binding Section: Listening 0.01 0.12 0 1
English Learner and Special EducationAssigned EL by District 0.836 0.37 0 1Below (Binding Score < 0) 0.863 0.34 0 1Special Education Between Grade 1 and 6 0.070 0.26 0 1Special Education in Grade 1 0.016 0.12 0 1Special Education in Grade 2 0.012 0.11 0 1Special Education in Grade 3 0.014 0.12 0 1Special Education in Grade 4 0.012 0.11 0 1Special Education in Grade 5 0.010 0.10 0 1Special Education in Grade 6 0.006 0.08 0 1
Source: California Longitudinal Pupil Achievement Data System (CALPADS), SY 2006-07 through SY 2018-19. Notes: The full sample includes students from this district who took the California English Language Development Test (CELDT) for the first time in Kindergarten between SY 2006-07 and SY 2012-13, had valid covariate and outcome data, and scored above the minimum score Overall and in Listening and Speaking domains (N=12,607). Excluded from the sample are students who took the initial CELDT assessment for the first time in 1st grade or later. The intent-to-treat group includes students who scored below the cutoff (N=10,880). The control group includes students who scored above the cutoff (N=1,727).
California English Language Development Test

40
Independent Variable: (1) (2) (3)
Assigned EL by District 0.027*** 0.023*** 0.034***(0.005) (0.006) (0.006)
Controls no yes yesSchool-Cohort FE no no yes
R2 0.001 0.026 0.077
*** p < 0.01 ** p < 0.05 * p < 0.1
Table 2. OLS: Estimated Association Between EL Assignment and SPED PlacementDependent Variable: Placed in SPED between
Grades 1 and 6
Notes: Robust standard errors are in parentheses. Each model reports the OLS relationship between being Assigned EL by the District and placement in SPED between Grades 1 and 6. The analytic sample (N=12,607) includes students that took the CELDT initial assessment in Kindergarten between SY 2006-07 and SY 2012-13, had covariates and outcome measures available, and scored above the minimum score Overall and in Listening and Speaking domains. The model in column (2) includes the following student-level controls: an indicator for female; an indicator for the student's most educated parent being at least a HS graduate; an indicator for being Hispanic; an indicator for being Chinese; an indicator for declining to state race/ethnicity; and the student's age at initial assessment (coefficients suppressed). The model in column (3) includes the same set of student-level controls and adds school-cohort fixed effects (coefficients suppressed). The OLS estimate in column (3) is used to compare to subsequent Regression Discontinuity estimates.

41
Table 3. The Effect of English Learner Eligibility on being Assigned EL by District, Full Sample
Independent Variable: (1) (2) (3)
I(BindingScorei < 0) 0.829*** 0.829*** 0.829***(0.012) (0.012) (0.012)
N 12,607 12,607 12,607 R2 0.681 0.685 0.734
Controls no yes yesSchool-Cohort FE no no yes
*** p < 0.01 ** p < 0.05 * p < 0.1
Notes: Robust standard errors are in parentheses. Each coefficient represents the results from a separate regression discontinuity model of the effect of the intent-to-treat on treatment status. Results for the three types of models for the +/- 34, +/- 50, +/-100, +/- 150 bandwidth samples were qualitatively similar to the results for the full sample (i.e, reflecting a large, statistically significant jump at the threshold).
Dependent Variable: Assigned EL by District

42
Independent Variable: (1) (2) (3)
I(BindingScorei < 0) -0.020** -0.020** -0.015*(0.008) (0.008) (0.008)
Student-Level Controls no yes yesCohort-School FE no no yes
*** p < 0.01 ** p < 0.05 * p < 0.1
Table 4. Reduced Form Effect of EL Classification on Subsequent SPED Placement, Full Sample
Dependent Variable: Placed in SPED between Grades 1 and 6
Notes: Robust standard errors are in parentheses. All models include a linear spline of the forcing variable and rely on the full sample (N=12,607). Each cell represents a separate regression. Models reported in columns (2) and (3) include the following student-level controls: an indicator for female; an indicator for the student's most educated parent being at least a HS graduate; an indicator for being Hispanic; an indicator for being Chinese; an indicator for declining to state race/ethnicity; and the student's age at initial assessment (coefficients suppressed). The model reported in column (3) also includes school-cohort fixed effects (coefficients suppressed).

43
Bandwidth Sample (1) (2) (3) N
Full Sample -0.020** -0.020** -0.015* 12,607(0.008) (0.008) (0.008)
+/- 150 -0.021*** -0.021** -0.017** 12,261(0.008) (0.008) (0.008)
+/- 100 -0.018** -0.018** -0.018* 9,999(0.009) (0.009) (0.009)
+/- 50 -0.007 -0.009 -0.010 5,045(0.012) (0.012) (0.012)
+/- 34 -0.002 -0.002 -0.007 3,267(0.014) (0.014) (0.015)
Student-Level Controls no yes yes -Cohort-School FE no no yes -
*** p < 0.01 ** p < 0.05 * p < 0.1
Notes: Robust standard errors are in parentheses. All models include a linear spline of the forcing variable. Each cell represents a separate regression. The +/- 34 bandwidth is the CCT optimal bandwidth. Models reported in columns (2) and (3) include the following student-level controls: an indicator for female; an indicator for the student's most educated parent being at least a HS graduate; an indicator for being Hispanic; an indicator for being Chinese; an indicator for declining to state race/ethnicity; and the student's age at initial assessment (coefficients suppressed). The model reported in column (3) also includes school-cohort fixed effects (coefficients suppressed). The point estimate for our preferred specification, model (3), is statisically different (p<0.01) from the OLS point estimate (i.e., from Table 2, column (3)) for all bandwidth samples.
Table 5. Reduced Form Effect of EL Classification on Subsequent SPED Placement, by Bandwidth
Dependent Variable: Placed in SPED between Grades 1 and 6

44
Between Grades 1
and 6
During Grade 1
During Grade 2
During Grade 3
During Grade 4
During Grade 5
During Grade 6
Bandwidth Sample (1) (2) (3) (4) (5) (6) (7) N
Full Sample -0.015* -0.003 -0.010** 0.001 0.003 -0.005 -0.001 12,607(0.008) (0.004) (0.004) (0.004) (0.003) (0.003) (0.003)
+/- 150 -0.017** -0.005 -0.010** 0.003 0.000 -0.005 -0.001 12,261(0.008) (0.004) (0.004) (0.004) (0.003) (0.003) (0.003)
+/- 100 -0.018* -0.003 -0.011** 0.003 0.002 -0.006* -0.002 9,999(0.009) (0.004) (0.005) (0.004) (0.003) (0.004) (0.003)
+/- 50 -0.010 -0.004 -0.009 0.008 0.004 -0.009** -0.001 5,045(0.012) (0.005) (0.006) (0.006) (0.005) (0.005) (0.005)
+/- 34 -0.007 0.001 -0.011 0.009 0.006 -0.008 -0.005 3,267(0.015) (0.007) (0.007) (0.007) (0.006) (0.005) (0.006)
*** p < 0.01 ** p < 0.05 * p < 0.1
Table 6. Reduced Form Effects on Other SPED Placement Outcomes, by Bandwidth
Notes: Robust standard errors are in parentheses. Each cell represents a separate regression. The +/- 34 bandwidth is the CCT optimal bandwidth. All models include a linear spline of the forcing variable, student-level controls and school-cohort fixed effects (coefficients suppressed). The student-level controls include the following: an indicator for female; an indicator for the student's most educated parent being at least a HS graduate; an indicator for being Hispanic; an indicator for being Chinese; an indicator for declining to state race/ethnicity; and the student's age at initial assessment.
Dependent Variable: Placed in SPED:

45
Bandwidth Sample (1) N (2) N (3) N
Full Sample -0.043* 3,990 -0.002 4,483 -0.007 4,134(0.023) (0.010) (0.014)
+/- 150 -0.051** 3,826 -0.001 4,363 -0.012 4,072(0.023) (0.010) (0.014)
+/- 100 -0.054** 2,948 -0.003 3,487 -0.017 3,564(0.026) (0.011) (0.016)
+/- 50 -0.055 1,275 0.008 1,625 -0.009 2,145(0.037) (0.014) (0.020)
+/- 34 -0.053 785 0.006 1,044 -0.001 1,438(0.050) (0.019) (0.026)
*** p < 0.01 ** p < 0.05 * p < 0.1
Notes: Robust standard errors are in parentheses. Each cell represents a separate regression. The +/- 34 bandwidth is the CCT optimal bandwidth. All models include school-cohort fixed effects and the following student-level controls: an indicator for female; an indicator for the highest educated parent being at least a HS graduate; an indicator for being Hispanic; an indicator for being Chinese; the student's age at initial assessment (coefficients suppressed). The mean SPED placement rate between Grades 1 and 6 after the initial CELDT assessment for key subgroups are as follows: 0.105 for Spanish speakers overall; 0.111 for Spanish speakers scoring below the threshold; 0.047 for Spanish speakers score above the threshold; 0.034 for Cantonese or Mandarin speakers overall; 0.038 for Cantonese or Mandarin speakers below the threshold; 0.007 for Cantonese or Mandarin speakers above the threshld; 0.060 for speakers of all other languages overall; 0.069 for speakers of all other languages below the threshold; and 0.024 for speakers of all other langauges above the threshold.
Table 7. Heterogeneous Reduced Form Effects, by Bandwidth and Language CategoryDependent Variable: Placed in SPED Between Grades 1 and 6
Spanish Mandarin or Cantonese All Other Languages

46
Appendix A
Appendix Figures A1-A3 all provide graphical evidence pertaining to assessing the
continuity of our underlying binding score forcing variable. While the RD design relies on far
fewer assumptions than most other quasi-experimental research designs, it is critical to
thoroughly interrogate the validity of the assumption that underpins this approach.
Appendix Figure A1 presents two histograms of the binding score forcing variable. Using
bin widths of 5 points, Panel A depicts the density of the binding score forcing variable for the
full sample. Panel B presents the density of the binding score forcing variable using bin widths
of 2 for a narrower sample, +/- 50 points from the cutoff. Visual inspections of both histograms
do not suggest manipulation (i.e., heaping) of the forcing variables at the cut score.
Appendix Figure A2 presents visual results from two iterations of the McCrary (2008)
density test. These tests look to identify evidence of manipulation of the binding score forcing
variable. Panel A offers the results when using the full sample and a bin width of 10 points. For
this test, the discontinuity estimate reported is -0.027 with a standard error of (0.059). This result
is not statistically significant and the corresponding visual suggests smoothness through the
threshold. Panel B reports results when using the full sample and a bin width of 2 points. Again,
our discontinuity estimate is not statistically significant. The point estimate is -0.048 and the
standard error is (0.058). A visual inspection of the graph again shows no evidence of a jump at
the threshold. These tests provide no evidence of a discontinuity in the forcing variable.
Appendix Figure A3 presents graphical results for the Cattaneo, Jansson and Ma (2018)
test for manipulation at the threshold. Here, we again don’t see clear evidence of a discontinuity,
though the robust p-value reported is marginally significant (p=0.078). A key component of this
density test is the use of the CCT optimal bandwidth, which may partially explain why the

47
results appear somewhat different from the McCrary (2008) density test. Based on the results
from Appendix Figures A1-A3, we find no clear evidence that suggests our continuity
assumption is invalid.
Appendix Table A1 provides an additional check on our continuity assumption by
interrogating the pretreatment covariates in our sample. If the threshold cannot be precisely
manipulated, we expect that the density of our covariates through the threshold would be smooth.
Appendix Table A1 presents evidence about the continuity of covariate balance across the cutoff.
In particular, we employ a two-step process for evaluating whether our covariates appear to be
imbalanced across the threshold. First, we regress our “SPED placement between Grades 1 and
6” outcome variable on our set of student-level controls. Then we obtain the predicted values,𝑌K ,
from this regression. In the second stage, we regress𝑌K on the “SPED placement between Grades
1 and 6” outcome variable and a linear spline of the forcing variable. We retain school-cohort
fixed effects in each step. Results are presented for the same set of selected bandwidth samples
reported in Tables 5-7 of the main analysis. A statistically significant result would indicate
imbalance of our baseline covariates. However, across all bandwidths, we do not observe
statistically significant results. Therefore, we do not find evidence of covariate imbalance at the
threshold for any of the bandwidth samples reported.
Appendix Table A2 reports results from regression analyses that include all student-level
controls and school-cohort fixed effects. These analyses look to delineate the OLS relationship
between EL status and SPED placement. Different from the main analytic sample, where we
look for SPED placement between 1-6 years after EL classification, here we adjust the period of
time over which we observe SPED placements. Column (1) shows SPED placement between 1-3
years after EL classification. Each subsequent column adds one year. Column (8) shows SPED

48
placement between 1-10 years after EL classification. The underlying sample of each regression
is changing. In Column (1), we include the largest number of cohorts but observe them for the
shortest amount of time. In Column (8), we include the fewest number of cohorts but observe
them for the longest amount of time. Interestingly, the relationship is always positive and the
point estimates are quite stable, hovering between 2.1 and 3.5 percentage points.
Appendix Table A3 reports results from RD specifications that include a linear spline of
the forcing variable, student-level controls, and school-cohort fixed effects. This table presents
RD results as we adjust the length of time we observe each student and the number of cohorts we
include in the sample. In Column (1), we observe the most cohorts for the shortest amount of
time. In Column (8), we observe the fewest cohorts for the longest amount of time. While many
of the results are not statistically significant, there is clear consistency in the point estimates. We
observe negative point estimates for all bandwidths except the CCT optimal bandwidth. The
positive point estimates we observe are less than or equal to 0.007. This set of evidence offers
additional validation to our main finding of null or slight underrepresentation of EL students in
SPED.
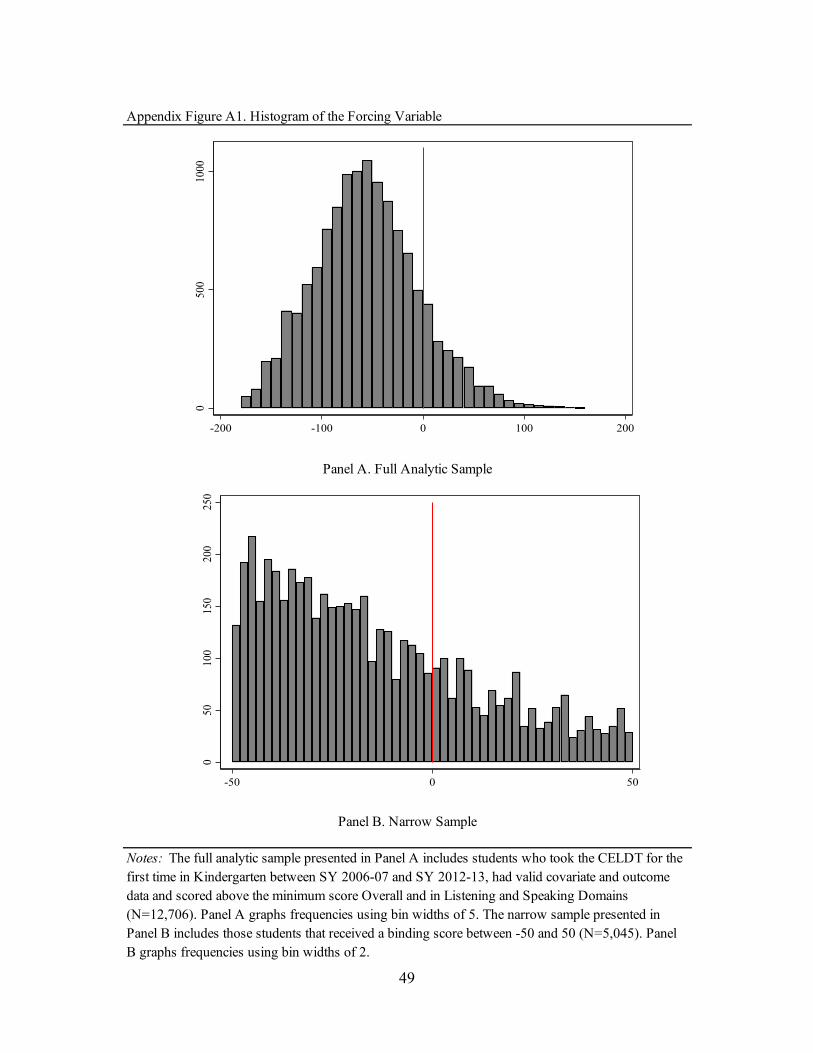
49
Appendix Figure A1. Histogram of the Forcing Variable
Panel A. Full Analytic Sample
Panel B. Narrow Sample
Notes: The full analytic sample presented in Panel A includes students who took the CELDT for the first time in Kindergarten between SY 2006-07 and SY 2012-13, had valid covariate and outcome data and scored above the minimum score Overall and in Listening and Speaking Domains (N=12,706). Panel A graphs frequencies using bin widths of 5. The narrow sample presented in Panel B includes those students that received a binding score between -50 and 50 (N=5,045). Panel B graphs frequencies using bin widths of 2.
050
100
150
200
250
-50 0 50
0500
1000
-200 -100 0 100 200

50
Panel A: Full Analytic Sample, Bin Width of 10
Panel B: Full Analytic Sample, Bin Width of 2
Notes: Panel A provides graphical results of the McCrary (2008) test for forcing variable manipulation using bin widths of 10. For this panel, the discontinuity estimate is not statistically significant, with a point estimate of 0.032 with a standard error of 0.070. Panel B provides graphical results of the McCrary (2008) test for forcing variable manipulation using bin widths of 2. For this panel, the discontinuity estimate is not statistically significant, with a point estimate of -0.010 and a standard error of 0.069.
Appendix Figure A2. McCrary (2008) Manipulation Tests
0.002
.004
.006
.008
.01
-200 -100 0 100 200
0.002
.004
.006
.008
-200 -100 0 100 200

51
Appendix Figure A3. Cattaneo, Jannson and Ma (2017) Manipulation Test
Notes: These graphical results are for the Cattaneo, Jansson and Ma (2017) manipulation test at the threshold. The p-value of the robust discontinuity estimate is 0.0776, indicating that we fail to reject the null hypothesis (⍺=0.05) that the forcing variable is continuous through the threshold.
0.0
02.0
04.0
06.0
08
-200 -100 0 100 200Forcing Variable
point estimate 95% C.I.
Cattaneo et al. (2017) Density Test

52
Appendix Table A1. Auxiliary RD Estimates of Baseline Covariate Balance, by Bandwidth SampleDependent Variable:
(Placed in SPED Between Grades 1 and 6)
Bandwidth Sample (1) NFull Sample 0.00208 12,607
(0.00150)+/- 150 0.00227 12,261
(0.00147)+/- 100 0.00170 9,999
(0.00147)+/- 50 0.00202 5,045
(0.00155)+/- 34 0.00035 3,267
(0.00161)
*** p < 0.01 ** p < 0.05 * p < 0.1
Notes : Robust standard errors are in parentheses. Each cell shows the estimate from a two-stage regression. In the first stage, the "Placed in SPED Between Grades 1 and 6" indicator is regressed on all baseline covariates and a predicted index is generated. In the second stage, the predicted index is regressed on the "Placed in SPED Between Grades 1 and 6" indicator and a linear spline of the binding score forcing variable. The +/- 34 bandwidth is the CCT optimal bandwidth. School-cohort fixed effects are included in each step of each model.
!"
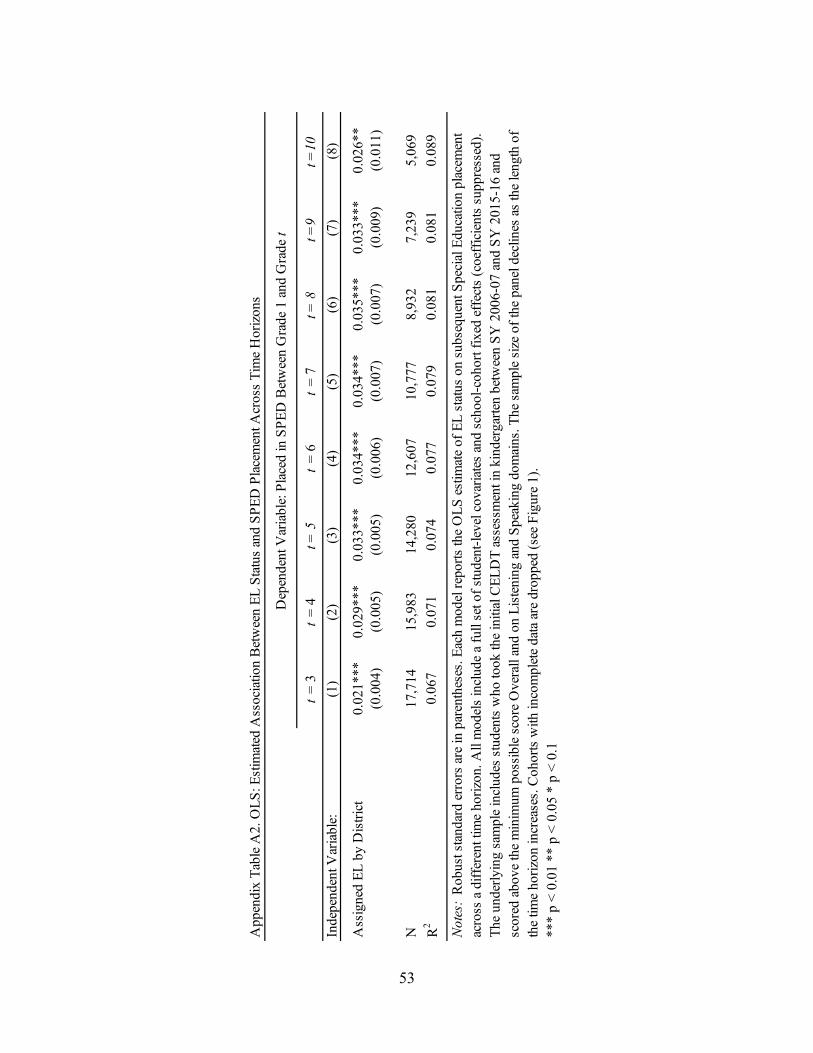
53
t =
3t
= 4
t = 5
t =
6t
= 7
t = 8
t =9
t =10
Inde
pend
ent V
aria
ble:
(1)
(2)
(3)
(4)
(5)
(6)
(7)
(8)
Ass
igne
d EL
by
Dis
trict
0.02
1***
0.02
9***
0.03
3***
0.03
4***
0.03
4***
0.03
5***
0.03
3***
0.02
6**
(0.0
04)
(0.0
05)
(0.0
05)
(0.0
06)
(0.0
07)
(0.0
07)
(0.0
09)
(0.0
11)
N17
,714
15,9
8314
,280
12,6
0710
,777
8,93
27,
239
5,06
9R
20.
067
0.07
10.
074
0.07
70.
079
0.08
10.
081
0.08
9
***
p <
0.01
**
p <
0.05
* p
< 0
.1
App
endi
x Ta
ble
A2.
OLS
: Est
imat
ed A
ssoc
iatio
n B
etw
een
EL S
tatu
s an
d SP
ED P
lace
men
t Acr
oss
Tim
e H
oriz
ons
Dep
ende
nt V
aria
ble:
Pla
ced
in S
PED
Bet
wee
n G
rade
1 a
nd G
rade
t
Not
es:
Rob
ust s
tand
ard
erro
rs a
re in
par
enth
eses
. Eac
h m
odel
repo
rts th
e O
LS e
stim
ate
of E
L st
atus
on
subs
eque
nt S
peci
al E
duca
tion
plac
emen
t ac
ross
a d
iffer
ent t
ime
horiz
on. A
ll m
odel
s in
clud
e a
full
set o
f stu
dent
-leve
l cov
aria
tes
and
scho
ol-c
ohor
t fix
ed e
ffec
ts (c
oeff
icie
nts
supp
ress
ed).
The
unde
rlyin
g sa
mpl
e in
clud
es s
tude
nts
who
took
the
initi
al C
ELD
T as
sess
men
t in
kind
erga
rten
betw
een
SY 2
006-
07 a
nd S
Y 2
015-
16 a
nd
scor
ed a
bove
the
min
imum
pos
sibl
e sc
ore
Ove
rall
and
on L
iste
ning
and
Spe
akin
g do
mai
ns. T
he s
ampl
e si
ze o
f the
pan
el d
eclin
es a
s th
e le
ngth
of
the
time
horiz
on in
crea
ses.
Coh
orts
with
inco
mpl
ete
data
are
dro
pped
(see
Fig
ure
1).

54
t=3
t=4
t=5
t=6
t=7
t=8
t=9
t=10
Ban
dwid
th S
ampl
e(1
)N
(2)
N(3
)N
(4)
N(5
)N
(6)
N(7
)N
(8)
N
Full
Sam
ple
-0.0
0617
,714
-0.0
0315
,983
-0.0
1114
,280
-0.0
15*
12,6
07-0
.016
*10
,777
-0.0
158,
932
-0.0
187,
239
-0.0
105,
069
(0.0
05)
(0.0
06)
(0.0
07)
(0.0
08)
(0.0
09)
(0.0
10)
(0.0
12)
(0.0
15)
+/- 1
50-0
.006
17,2
82-0
.005
15,5
84-0
.012
*13
,901
-0.0
17**
12,2
61-0
.018
*10
,455
-0.0
178,
627
-0.0
196,
959
-0.0
154,
827
(0.0
05)
(0.0
06)
(0.0
07)
(0.0
08)
(0.0
09)
(0.0
10)
(0.0
12)
(0.0
15)
+/- 1
00-0
.007
14,2
42-0
.004
12,7
88-0
.012
11,3
75-0
.018
*9,
999
-0.0
148,
556
-0.0
107,
029
-0.0
175,
630
-0.0
143,
832
(0.0
06)
(0.0
07)
(0.0
08)
(0.0
09)
(0.0
11)
(0.0
12)
(0.0
14)
(0.0
17)
+/- 5
0-0
.006
7,41
4-0
.002
6,57
6-0
.010
5,79
3-0
.010
5,04
5-0
.009
4,32
0-0
.006
3,60
0-0
.020
2,87
4-0
.038
*1,
823
(0.0
08)
(0.0
09)
(0.0
11)
(0.0
12)
(0.0
14)
(0.0
16)
(0.0
19)
(0.0
22)
+/- 3
4-0
.002
4,88
20.
006
4,32
2-0
.002
3,78
3-0
.007
3,26
7-0
.002
2,79
90.
007
2,35
6-0
.007
1,89
4-0
.024
1,18
3(0
.009
)(0
.011
)(0
.012
)(0
.015
)(0
.018
)(0
.020
)(0
.023
)(0
.026
)
***
p <
0.01
**
p <
0.05
* p
< 0
.1
Not
es:
Rob
ust s
tand
ard
erro
rs a
re in
par
enth
eses
. Eac
h ce
ll re
pres
ents
a s
epar
ate
regr
essi
on. T
he +
/- 34
ban
dwid
th is
the
CC
T op
timal
ban
dwid
th. A
ll m
odel
s in
clud
e a
linea
r spl
ine
of th
e fo
rcin
g va
riabl
e, c
ohor
t-sch
ool f
ixed
eff
ects
, and
the
follo
win
g st
uden
t-lev
el c
ontro
ls: a
n in
dica
tor f
or fe
mal
e; a
n in
dica
tor f
or th
e st
uden
t's h
ighe
st e
duca
ted
pare
nt b
eing
at l
east
a H
S gr
adua
te; a
n in
dica
tor f
or b
eing
His
pani
c; a
n in
dica
tor f
or b
eing
Chi
nese
; an
indi
cato
r for
dec
linin
g to
sta
te ra
ce/e
thni
city
; and
the
stud
ent's
age
at i
nitia
l ass
essm
ent (
coef
ficie
nts
supp
ress
ed).
Coh
orts
with
in
com
plet
e da
ta a
re d
ropp
ed (s
ee F
igur
e 1)
.
App
endi
x Ta
ble
A3.
Red
uced
For
m E
ffec
t of E
L C
lass
ifica
tion
on S
ubse
quen
t SPE
D P
lace
men
t ove
r Lon
ger T
ime
Hor
izon
s, b
y B
andw
idth
Dep
ende
nt V
aria
ble:
Pla
ced
in S
PED
bet
wee
n G
rade
s 1
and
t

55
Appendix B
An important component of our current study is the focus on students who took the
CELDT assessment during the Kindergarten year. In an effort to ensure common comparisons
over time, we restrict our analytic sample to this particular subset of test takers. However, it is
important to note that this subset accounted for 56 percent of all initial CELDT assessments
administered by the district. The remaining 44 percent were spread across students transferring
into the district and taking the initial assessment at other grade levels. Importantly, these
numbers were quite evenly distributed with no other grade level having more than 8 percent of
the initial CELDT assessments overall. After Kindergarten, the next most common grade levels
for initial assessments were grade 9, grade 1, grade 10, and grade 2.
An additional RD analysis on students taking the initial CELDT assessment at other
grade levels is warranted but makes interpretation of findings less straightforward. In this
Appendix we provide initial results for the sample of students that took the initial CELDT
assessment in Grades 1-5 (i.e., excluding our main cohorts of Kindergarten initial CELDT
assessment takers). Appendix Table B1 reports summary statistics for this additional sample.
Here, we notice several key points that differentiate this sample from the set of students who
enter the district in Kindergarten. First, students taking the initial CELDT assessment in later
grades were less likely to speak either Spanish or Chinese and more likely to speak another non-
English language as their primary language. Second, these students were more likely to have a
parent with at least a high school diploma. Third, students in this subsample were less likely to
be classified as ELs than students who took the assessment in Kindergarten. Fourth, SPED
identification rates were slightly higher for this subset of students.
56
We also explore the results from our main RD specification on this subsample of
students. Importantly, the sample size is smaller than the sample included in the main panel,
somewhat reducing our statistical power. Appendix Table B2 presents results from these
specifications. Column (1) reports RD results for being identified as a SPED student between 1
and 6 years after the initial CELDT assessment. In Column (2), we report RD results for the
same outcome, but including individual-level controls. In Column (3), we retain these individual-
level controls and also add school-cohort fixed effects. In cognate form to the results presented in
Tables 5-7 of the main analysis, we report our results across multiple bandwidth samples.
Across bandwidth samples and specifications with and without controls, our results are
not statistically significant. In Column (1), we observe a slightly positive point estimate for the
full sample and for the CCT optimal bandwidth. For all other bandwidth samples, our estimates
are small and negative. A similar pattern is observed when we include student-level controls in
Column (2). In Column (3), we see that the full sample result remains slightly positive, but the
point estimate for the CCT optimal bandwidth sample becomes slightly negative. Largely, these
estimates all suggest that the representation of EL students who took the initial assessment in
Grades 1-5 was fairly close to proportionate. While this result is quite similar to what we found
for the Kindergarten sample, a more detailed interrogation of the differences between these
subsets across a longer period of time is worth exploring in future work.

57
Appendix Table B1. Summary Statistics for the Grade 1-5 Initial CELDT Taker Sample Variable Mean Std. Dev. Min MaxStudent Characteristics in Year of Initial Assessment
Female 0.46 0.50 0 1Hispanic 0.32 0.47 0 1Chinese 0.24 0.43 0 1Decline to State Race/Ethnicity 0.04 0.19 0 1Parent's Highest Education Level >= High School Diploma 0.60 0.49 0 1Age at Initial Assessment (approximation) 8.21 1.90 5.2 12.8Primary Language: Spanish 0.26 0.44 0 1Primary Language: Mandarin/Cantonese 0.21 0.41 0 1Primary Language: Other 0.53 0.50 0 1
Binding Score -40.72 69.83 -179 148Centered Overall Scale Score -40.04 69.90 -179 148Centered Listening Scale Score 44.92 73.42 -178 197Centered Speaking Scale Score 56.32 81.36 -177 284Binding Section: Overall 0.96 0.20 0 1Binding Section: Listening 0.03 0.17 0 1Binding Section: Listening 0.01 0.12 0 1
English Learner and Special EducationAssigned EL by District 0.597 0.491 0 1Below (Binding Score < 0) 0.704 0.456 0 1Special Education Between 1 and 6 Years Later 0.086 0.280 0 1Special Education 1 Year Later 0.023 0.151 0 1Special Education 2 Years Later 0.020 0.139 0 1Special Education 3 Years Later 0.019 0.136 0 1Special Education 4 Years Later 0.010 0.099 0 1Special Education 5 Years Later 0.008 0.089 0 1Special Education 6 Years Later 0.006 0.080 0 1
California English Language Development Test
Source: California Longitudinal Pupil Achievement Data System (CALPADS), SY 2006-07 through SY 2018-19. Notes: The full sample includes students from this district who took the California English Language Development Test (CELDT) for the first time in Grades 1-5 between SY 2006-07 and SY 2012-13, had valid covariate and outcome data, and scored above the minimum score Overall and in Listening and Speaking domains (N=2,502). Excluded from the sample are students who took the initial CELDT assessment for the first time in Kindergarten. The intent-to-treat group includes students who scored below the cutoff (N=1,762). The control group includes students who scored above the cutoff (N=740).

58
Bandwidth Sample (1) (2) (3) N
Full Sample 0.015 0.006 0.013 2,502(0.017) (0.017) (0.021)
+/- 150 0.000 -0.006 0.009 2,339(0.018) (0.018) (0.021)
+/- 100 -0.018 -0.021 -0.013 1,886(0.020) (0.020) (0.025)
+/- 50 -0.012 -0.015 -0.007 1,101(0.028) (0.027) (0.039)
+/- 34 0.024 0.026 -0.001 774(0.033) (0.032) (0.047)
Student-Level Controls no yes yes -Cohort-School FE no no yes -
*** p < 0.01 ** p < 0.05 * p < 0.1
Appendix Table B2. Reduced Form Effect of EL Classification on Subsequent SPED Placement for the Grade 1-5 Initial CELDT Taker Sample, by Bandwidth
Dependent Variable: Placed in SPED between 1 and 6 Years After EL Classification
Notes: Robust standard errors are in parentheses. All models include a linear spline of the forcing variable. Each cell represents a separate regression. The +/- 34 bandwidth is the CCT optimal bandwidth. Models reported in columns (2) and (3) include the following student-level controls: an indicator for female; an indicator for the student's most educated parent being at least a HS graduate; an indicator for being Hispanic; an indicator for being Chinese; an indicator for declining to state race/ethnicity; and the student's age at initial assessment (coefficients suppressed). The model reported in column (3) also includes school-cohort fixed effects (coefficients suppressed).