edworkingpaper no. 20-340
TRANSCRIPT
Advanced Placement and Initial College Enrollment: Evidence from an Experiment
To evaluate how Advanced Placement courses affect college-going, we randomly assigned the offer of enrollment into an AP science course to over 1,800 students in 23 schools that had not previously offered the course. We find no substantial AP course effects on students’ plans to enroll in college or on their college entrance exam scores. Yet AP course-takers enroll in less selective colleges than their control group counterparts. Negative treatment effects on college selectivity appear to be driven more by low student preparation than teacher inexperience and by students’ matriculation decisions rather than institutional admissions decisions.
Suggested citation: Conger, Dylan, Mark C. Long, and Raymond McGhee Jr.. (2020). Advanced Placement and Initial College Enrollment: Evidence from an Experiment. (EdWorkingPaper: 20-340). Retrieved from Annenberg Institute at Brown University: https://doi.org/10.26300/cx24-vx18
VERSION: December 2020
EdWorkingPaper No. 20-340
Dylan CongerGeorge WashingtonUniversity
Mark C. LongUniversity of Washington
Raymond McGhee Jr.Robert Wood Johnson Foundation
1
Advanced Placement and Initial College Enrollment: Evidence from an Experiment
Dylan Conger Mark C. Long Raymond McGhee Jr.
December 15, 2020
Abstract: To evaluate how Advanced Placement courses affect college-going, we randomly assigned the offer of enrollment into an AP science course to over 1,800 students in 23 schools that had not previously offered the course. We find no substantial AP course effects on students’ plans to enroll in college or on their college entrance exam scores. Yet AP course-takers enroll in less selective colleges than their control group counterparts. Negative treatment effects on college selectivity appear to be driven more by low student preparation than teacher inexperience and by students’ matriculation decisions rather than institutional admissions decisions. Key words: human capital, course-taking, college enrollment JEL codes: I20, J24
____________ We thank Nicole Bateman, Kerry Beldoff, Grant H. Blume, Jordan Brown, Sarah Coffey, Bonnee Groover, Josette Arevalo Gross, Hernando Grueso Hurtado, Alec Kennedy, Jessica Mislevy, Kelsey Rote, Massiel Sepulveda, and Mariam Zameer for excellent research assistance. We are also grateful for the guidance and insights provided by Del Harnisch, Michal Kurlaender, Richard Murnane, Helen Quinn, and Aaron Rogat. The College Board staff provided answers to the study team’s questions about the AP program and general feedback on the research design, but the College Board did not provide financial support and was otherwise not involved in the production of this research. The research was funded by the National Science Foundation (Award 1220092) and is registered in the American Economic Association’s Registry for RCTs (ID 000140). Dylan Conger: George Washington University, [email protected]. Mark C. Long: University of Washington, [email protected]. Raymond McGhee Jr., Robert Wood Johnson Foundation, [email protected].
2
Secondary school students who seek a bachelor’s degree at a competitive institution often
look to the Advanced Placement (AP) program to increase their skill, admissions prospects,
and ability to pay for their degrees. AP offers college-level courses and exams to high school
students, and colleges often treat AP course enrollment and high scores on the exams
favorably in admissions. At many colleges, students with high AP exam scores can lower
the cost of their degrees by waiving out of introductory courses and/or receiving college
credit. The potential benefits of AP courses and exams have led to several public
investments in the program (such as subsidies to cover exam fees) and a five-fold increase
in AP exam taking over the last 30 years (Holstead et al. 2010; Dounay Zinth 2016; College
Board 2020). Previous research, all of which is observational, has found that students who
take AP courses (especially those who earn high scores on AP exams) are more likely to
enroll in bachelors’ degree granting colleges and more likely to earn spots in selective colleges
(e.g., Chajewski et al. 2011). Other evidence confirms that many college students use high
scores on their AP exams to bypass core courses, take higher-level courses in their field, and
shorten their time to diploma (Avery et al. 2018, Gurantz forthcoming, Smith et al. 2017).
This is the first paper to experimentally evaluate the impact of AP course enrollment on
four-year college attendance and selectivity.
We launched the experiment in 2012 and randomly assigned over 1,800 students in 23
high schools across the country the offer of enrollment in a newly offered AP Biology or AP
Chemistry course. Like most schools that had not previously offered AP Biology or AP
Chemistry, our study schools are disproportionately located in areas with low to middle
socioeconomic status (Malkus 2016). Participating schools also offered an average of 7 AP
courses prior to joining the study, only 2 courses shy of the average number of AP courses
offered by US schools (Malkus 2016). Consequently, our results generalize to the impact of
AP science on schools that are at the frontier of AP course expansion. In a companion
3
manuscript on short-run impacts, we find suggestive evidence that taking an AP science
course increases students’ science skill and their interest in pursuing a Science, Technology,
Engineering, or Math (STEM) major in college (Conger et al. forthcoming). AP science
classes also increase students’ stress levels, reduce their confidence in successfully completing
college science courses, and lower their high school grade point averages. In this paper, we
examine whether these short-run impacts translate to medium-run impacts on four-year
college enrollment and selectivity. With records from the National Student Clearinghouse
(NSC), the College Board, ACT Inc., and student surveys, we estimate the effects of AP
on students’ college aspirations and applications, preparedness, and enrollment. Taken
together, we examine whether and how AP science affects students’ plans for college and
their ability to execute on those plans.
From our survey of students, we find that taking AP science does not substantially
affect students’ plans or applications to four-year colleges. We also see no evidence of
treatment effects on students’ probability of taking an SAT or ACT exam or their scores
on these college entrance exams. Unsurprisingly, AP course enrollment has a large positive
impact on students’ probability of taking the exam associated with the course. But
treatment group course-takers are not significantly more likely to pass the AP exam (earn
a 3 or above on a scale of 1 to 5) than control group students.1 The exam failure rate among
students in our study is higher than that of AP test takers nationally, which may be due
to lower levels of student and teacher preparation in these AP expansion schools.
We find no substantial AP course impact on four-year college enrollment, but estimates
suggest negative treatment effects on matriculation at colleges that are moderately selective.
1 Control group students could take other courses, including other science courses, offered by the high school (i.e., business as usual). In Conger et al. (forthcoming) we find that taking AP science predominately crowded out taking regular courses (e.g., not honors courses or other AP courses) in subjects other than science.
4
When we rank colleges on the Barron’s selectivity scale of 1 (most competitive) to 6 (not
competitive), AP science takers are less likely to enroll in colleges ranked in the top four
selectivity categories than their control group counterparts. Off a control group complier
mean of 86%, competitive college enrollment is 9 percentage points lower for treatment
group course-takers. This effect is driven entirely by a reduction in the likelihood of
attending a college in the fourth tier (competitive) as there is no effect on enrollment in the
top three tiers (most, highly, and very competitive).
What seems to be driving the negative treatment effect on competitive college
enrollment? Two leading contenders are that the teachers were inadequately prepared to
deliver the course and/or the students were insufficiently prepared to take it. If success in
AP hinges on sufficient teacher and student preparation then the negative effects on college
selectivity should decrease as teacher experience and student academic preparation increase.
Heterogeneity analyses along these dimensions allow us to partially isolate the source of the
college selectivity effects. We first explore whether treatment effects differ for students in
classes with teachers who have had prior experience teaching AP classes and for cohorts
who receive a second or third wave of AP course administration. Point estimates differ
across these subsamples, but they are all large and negative (ranging from -8 to -11
percentage points) lending little support to the notion that teachers more familiar with AP
might have lessened the negative effects on college selectivity. In contrast, we find
treatment-control differences in competitive college matriculation only among students with
lower pretreatment academics (math test scores, prerequisite course enrollment, and
grades). The impact on students with below median pretreatment academics is substantial;
relative to a control group complier mean of 81%, AP course-taking reduced enrollment by
21 percentage points (p-value=0.01). Students who enroll with more preparation show a
modest increase in competitive college enrollment but the results are not precise enough to
5
rule out zero. This result corroborates concerns among some critics that the push to increase
access to AP courses has resulted in poor outcomes for students who are weakly prepared
(Dougherty and Mellor 2009; Tierney 2012; Bowie 2013). Most of this concern has focused
on students’ stress and grades; here, we find that the courses may also influence college
choices.
The hit to college selectivity for these less-prepared students could be driven by reduced
student aspirations at the application or matriculation stage or by institutional responses
to students’ college applications. To distinguish among these explanations, we estimate
treatment effects separately for students who took the course in the 12th grade versus an
earlier grade. By the end of the 12th grade, most students already know which colleges have
accepted them and the amount of aid they have been offered. Courses taken in the senior
year may affect students’ plans to matriculate but not their applications and admissions.
The treatment-control difference in competitive college enrollment is -16 (p-value = 0.05)
among 12th graders and near zero (p-value = 0.93) among younger students (mostly 11th
graders). Failure to matriculate at more selective colleges seems unlikely to be driven by
reduced admissions prospects. Instead, students’ experience in the course may have lowered
their post application aspirations to matriculate at these colleges. We are unable to isolate
the exact mechanism driving the change in students’ plans; reduced confidence in academic
ability or increased concerns about college costs (given the foregone cost savings associated
with the exam) may play a role.
Our study contributes directly to the body of research suggesting that rigorous high
school courses increase students’ preparation for college, college enrollment, and later
earnings (Altonji 1995, Levine and Zimmerman 1995, Rose 2004, Rose and Betts 2004,
Joensen and Nielsen 2009, Long et al. 2012, Goodman 2019, Hemelt et al. 2020). Previous
research on AP is consistent with this narrative. Though most of the prior research on AP
6
and college-going is correlational, one non-experimental evaluation of the AP Incentive
Program (APIP) in Texas provides more causally sound evidence by relying on a difference-
in-differences framework (Jackson 2010, 2014). The APIP offered cash incentives to teachers
and students for passing scores on AP exams, as well as funds for training teachers and
convening teams of teachers to align pre-AP curriculum with the needs of the AP class. In
two papers, Jackson (2010, 2014) finds suggestive evidence of APIP effects on college
preparedness (including SAT scores), enrollment, and graduation as well as post-graduation
earnings. Jackson (2014) documents larger impacts in schools with established AP programs
and in schools with high-powered incentives for students and teachers.2 The findings provide
evidence that the AP program may lead to higher rates of college enrollment; however, the
paper did not examine college selectivity and does not generalize to AP programs that
operate without financial incentives. Our results suggest that taking an AP course might
not always benefit students when the course is offered without incentives and to students
who have lower levels of preparation. This setting is perhaps more common than not. The
AP program originated in relatively wealthy schools, but much of the expansion in recent
decades has occurred in less-resourced settings (Judson and Hobson 2015). Surveys of
teachers also reveal that many schools now rely on open access or modest admissions criteria
to determine eligibility for AP courses (Farkas and Duffett 2009).
The findings also inform several policy areas in secondary and postsecondary education.
Growing concern over the validity of college entrance exams and grade inflation have led
some college admissions committees to place more value on AP exams in admissions and
2 In some schools, the incentives were quite substantial. For instance, AP teachers received between $100 and $500 for each AP score of three or over earned by a student enrolled in their course. Some teachers also received discretionary bonuses. The program also paid for half of students’ AP exam fees and between $100 and $500 for each score of three or above in an eligible subject.
7
aid decisions. Many colleges ask students to self-report their AP exam scores on the
application, and some high schools report AP exam scores on students’ transcripts, which
make the scores readily available to admissions committees even when students do not self-
report. In a recent survey of colleges conducted by the National Association of College
Admissions Counseling (NACAC), 25% report that AP and IB exams are of moderate to
considerable importance in admissions (NACAC 2019).3 Our results suggest that students
are aware of the importance of AP courses and exams to some competitive institutions, and
that failure to earn high grades or pass exams might reduce their confidence in succeeding
at those institutions. Some students who had planned to use high AP exam scores to lower
the cost of college might also shift to less competitive institutions (where costs may be
lower) once they learn that they have not earned a passing score.
Related, this study’s findings suggest a potentially new avenue for research to explain
the undermatch phenomenon for low-income high school students. Previous research
demonstrates that low-income students with strong high school grade point averages and
college entrance exam scores tend to under enroll in selective colleges that are likely to
admit them (Griffith et al. 2009, Hoxby and Avery 2013, Smith et al. 2013, Black et al.
2015, Dillon and Smith 2017). Explanations for the undermatch lie partially in the fact that
many students do not apply to selective colleges because they underestimate their chances
of admission. Some of this perception comes from students making assumptions about
college admissions and their ability to succeed in competitive colleges. Here, we find that
failure to succeed in a college-level course (either by earning a low grade or low score on
3 For instance, the University of California at Berkeley offers the following guidance to students “We recommend that students who complete Advanced Placement courses complete the related AP examination to demonstrate subject mastery,” suggesting that high scores will increase the probability of admission. https://admissions.berkeley.edu/documentation.
8
the exam) might also reduce students’ matriculation at colleges that have admitted them.
Finally, a growing body of evidence suggests that institutional quality increases students’
likelihood of completing a bachelor’s degree (Long 2008, Smith 2013, Goodman et al. 2017,
Dillon and Smith 2020) and increases later earnings (Black and Smith 2004, 2006,
Zimmerman 2014, Dillon and Smith 2020). And yet low-income students are less likely to
attend high quality postsecondary institutions, and less likely to graduate, than their
wealthier peers (Bowen et al. 2009, Smith et al. 2013, Dillon and Smith 2013). Our research
suggests that weak AP course outcomes might be a partial explanation for college quality
gaps between lower and higher income college entrants.
1 Experimental Design and Previous Findings
1.1 Design
We recruited 23 schools from 12 districts across the United States and offered monetary
compensation to pay for equipment and teacher training and as an incentive to secure
participation. 4 Eligible schools included ones that had not offered AP Biology or AP
Chemistry in recent years; were willing to add such a course and comply with study
protocol; and had more eligible students than could be served in one class to allow for a
control group. Of the 23 schools, 12 schools added AP Chemistry, 10 schools added AP
Biology, and 1 school added both courses. We recruited two waves of schools (those that
4 Participating districts include Anaheim Union High School District, California; East Side Union High School District, California; Lynwood Unified School District, California; Jefferson Parish, Louisiana; Education Achievement Authority, Michigan; Charlotte-Mecklenburg Schools, North Carolina; Winston-Salem/Forsyth Schools, North Carolina; Cranston Public Schools, Rhode Island; El Paso Independent School District, Texas; Metropolitan Nashville Public Schools, Tennessee; and Richmond Public Schools, Virginia. Some of the text in this section is also included in our previous papers.
9
offered the course for the first time in 2013 and those that offered it for the first time in
2014). Both waves of schools fielded the course for two years, and the earlier-joining schools
had the option of fielding the course for three years. The study includes 47 school by cohort
groups and 27 teachers.
We asked each participating school to identify students that they deemed eligible to
take the new AP course in the spring of the year prior to when the course would be offered.
All of the schools already offered a number of AP courses in other subjects (including science
and math) and relied on their usual procedures to identify AP-eligible students. These
methods for determining eligibility varied - ranging from open access to review of prior
academics and/or teacher recommendations - consistent with how many schools nationwide
determine AP eligibility (Milewski and Gillie 2002), Farkas and Duffett 2009).
Upon receipt of signed consent/assent forms, we randomly offered enrollment in the
newly launched course to a subset of participating students.5 The total study population
includes 1,819 students and this paper focuses on the 1,809 study participants with expected
high school graduation in spring 2017 or earlier. The first-stage estimates indicate that the
randomized offer substantially increased the likelihood of the student taking the AP science
course by 38 percentage points. Noncompliance came from two sources. First, 42% of the
students who received an offer chose not to enroll; interviews with school administrators
revealed that these changes of heart about taking challenging courses are quite common
5 One district in our study offered both AP courses. Students in this school were randomly offered enrollment in an AP course and then given the option of Chemistry or Biology. To account for the two courses offered, we treat the school as two separate groups: School-Chemistry and School-Biology. For those students who were not offered an AP course, we randomly assign them to one of two control groups proportional to the number of treated students who chose each course. For example, if 60% of the treated students chose Biology, then we randomly assign 60% of the control students to the School-Biology control group. In Appendix Table 1 we show that our results are also robust to dropping this school entirely.
10
among high school students. Second, some schools violated the study protocol and registered
control students for the new AP course, which resulted in 19% of control group students
receiving the treatment.
1.2 Previous Findings from the Experiment
In this section, we summarize our published findings prior to this manuscript. We first
evaluated the degree to which study schools and teachers implemented the courses as
intended by the College Board through student and teacher surveys, course syllabi, student
transcripts, and interviews with teachers and school administrators. AP courses are designed
to be more rigorous than other high school courses, and to offer more inquiry-based
approaches, where teachers encourage students to ask questions, gather and interpret data,
arrive at explanations grounded in scientific principles, and communicate their observations
with technology (College Board 2011a, 2011b). In Long et al. (2019), we report that most
teachers were able to implement a rigorous AP science classroom, yet they struggled with
the inquiry-based approach and with integrating technology into the classroom. This finding
is consistent with research on high school science teachers nationally, many of whom have
not had opportunities to engage in scientific inquiry or to learn science using inquiry-based
approaches (NRC 2000). The inquiry-component of AP courses is also a relatively new
feature (introduced to science courses in 2012) with most AP teachers lacking extensive
training in inquiry-based instruction.
Many teachers in the study also reported concerns that the students in the course were
not able to handle the rigor of AP course assignments and expectations. Consistent with
these teacher reports, students in the AP science course reported a higher degree of academic
rigor, but not substantially more inquiry-based learning than students in the control group.
Approximately 78% of the control group compliers took another science course, with 34%
taking a non-AP advanced science course (almost entirely honors courses) during the study
11
year. We find no evidence that taking an AP course diverted students away from other
advanced courses, such as International Baccalaureate (IB) or dual enrollment courses; nor
do we find evidence that taking AP science crowds out course-taking in other AP subjects.6
In Conger et al. (forthcoming), we report the immediate effects of AP science on
students’ human capital and social-emotional outcomes. The estimates from that analysis
suggest that AP science increases students’ science skill (e.g., the ability to analyze data
and make scientific arguments) and interest in pursuing STEM majors should they enroll
in college. We also find substantial increases in students’ stress and decreases in confidence
and grades as a result of AP science course enrollment.
2 Data and Sample
2.1 Data Sources and Measures
We compiled data from several primary and secondary data sources for impact
estimates. The first source is students’ high school transcripts, which contain data on
demographic and socioeconomic background, grades, courses, standardized exams taken in
the 8th and 10th grades as well as high school completion. We use these data to determine
the balance of randomization on pretreatment covariates, estimate the effect of
randomization on AP course-taking (compliance), and improve the precision of our
estimates with statistical controls.
We also designed and administered a survey of students, which included questions about
their plans after high school and the names of colleges to which they have applied or planned
6 The International Baccalaureate program is an alternative college-level curriculum offered to high school students that aims to develop students’ critical thinking skills and their knowledge of international affairs. Dual enrollment are college courses available to some students at nearby colleges or online that can be used for credit in high school and at some colleges.
12
to apply. The survey was administered to all study participants towards the end of spring,
with most students answering questions in early March and mid-April. We use these survey
data to construct the following outcome measures: whether the student plans to attend a
four-year college and whether the student plans to attend a “highly selective” four-year
college.7 We attached a competitiveness rank to each college that survey respondents listed
using the 2015 Barron’s Profiles of American Colleges. The Barron’s classifies colleges in
2014 into the following six categories: 1) most competitive (those that admit less than one
third of applicants); 2) highly competitive (those that generally admit 33-50% of applicants);
3) very competitive (those that generally admit 50-75% of applicants); 4) competitive (those
that generally admit 75-85% of applicants); 5) less competitive (those that admit 85% or
more of applicants); and 6) noncompetitive (those that have minimal admissions
requirement and/or admit 98% or more of applicants). For our analysis of applications, we
estimate the effect of AP on the total number four-year colleges listed, and the average
Barron’s ranking of the four-year colleges listed.
Twenty two percent of the study population did not take the survey primarily due to
being absent on the day of survey administration. Students who we randomly assigned to
the treatment have a 9 percentage point higher survey response rate. Given the possibility
of nonrandom sample attrition, we weight all regressions with survey-based outcomes by
the inverse of the probability of completing the survey conditional on student
characteristics.8
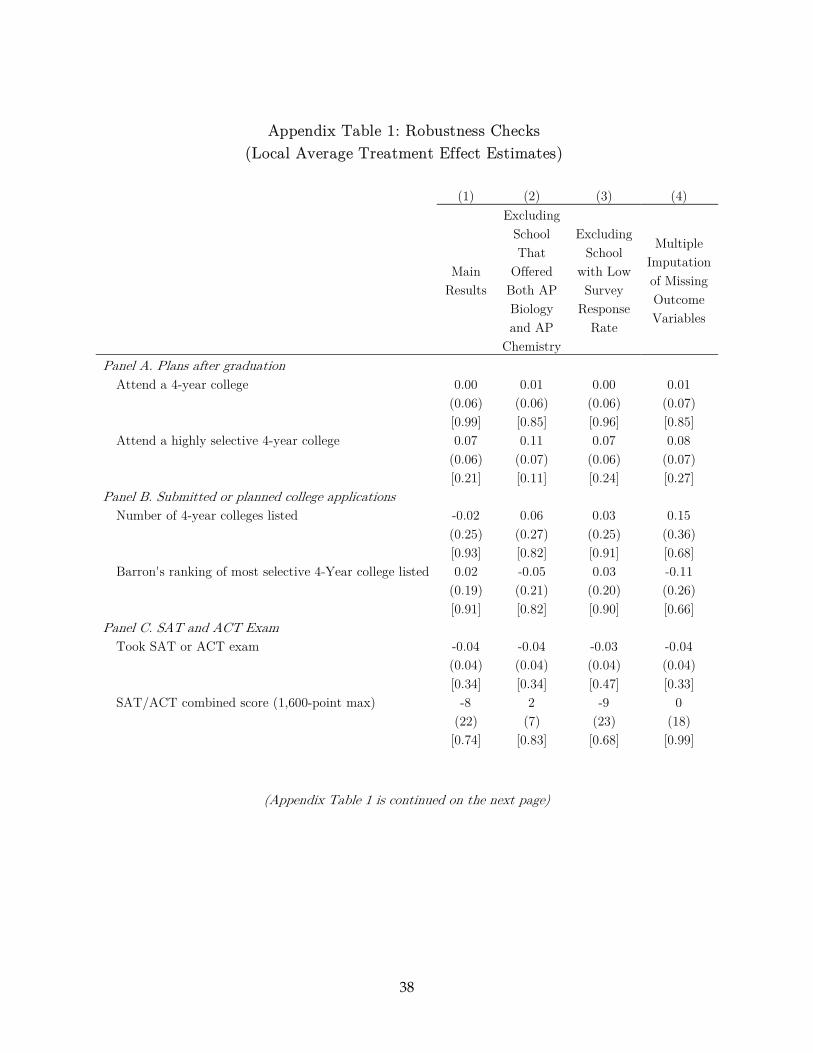
7 The survey also included questions about students’ plans to attend a two-year college or a vocational/technical school. The estimated impacts on these outcomes are imprecise and we are unable to draw meaningful conclusions. We provide these results in Appendix Table 2. 8 We implement a variety of robustness checks as additional means to account for nonresponse. These include multiple imputation of missing outcome variables and
13
To evaluate AP effects on college enrollment, we use data from the NSC. These data
record the names of all the colleges and the duration of enrollment for all 1,809 study
participants through fall 2019. We code each of the study participants’ colleges with the
Barron’s ranking. To simplify the analysis, we estimate treatment effects on students’
likelihood of attending a college ranked in the top four Barron’s categories (which we refer
to as “Competitive”); the top three categories (which we refer to as “Competitive +”); and
the top two categories (which we refer to as “Competitive++”). Barron’s rankings also list
some colleges as having “special” admissions systems (typically art and music academies).
For our analysis of enrollment behavior, we group these special admissions colleges and
four-year colleges that are not assessed by Barron’s with the less competitive and
noncompetitive colleges.
For outcome data on college preparedness, we obtained SAT (range of 200 to 800) and
AP exam scores (range of 1 to 5) from the College Board and ACT exam scores (range of
1 to 36) from ACT, Inc. AP exams (taken by students in the late spring of each year) are
graded by external examiners and provide an externally-validated measure of student
learning. Most AP exams include both an essay or problem-solving component and multiple-
choice questions, all of which are aligned with the course descriptions. The College Board
has determined that students who receive a 3 or above on an AP exam are qualified to
receive college credit for that course, yet some institutions only give credit for a score of 4
or 5 on particular exams (Smith et al. 2017).
We supplement these data with interviews that we conducted with teachers of the AP
course, focusing on the challenges that they faced in fielding the course.
excluding one high school that had a low response rate. These results are shown in Appendix Table 1.
14
2.2 Sample Characteristics and Balance
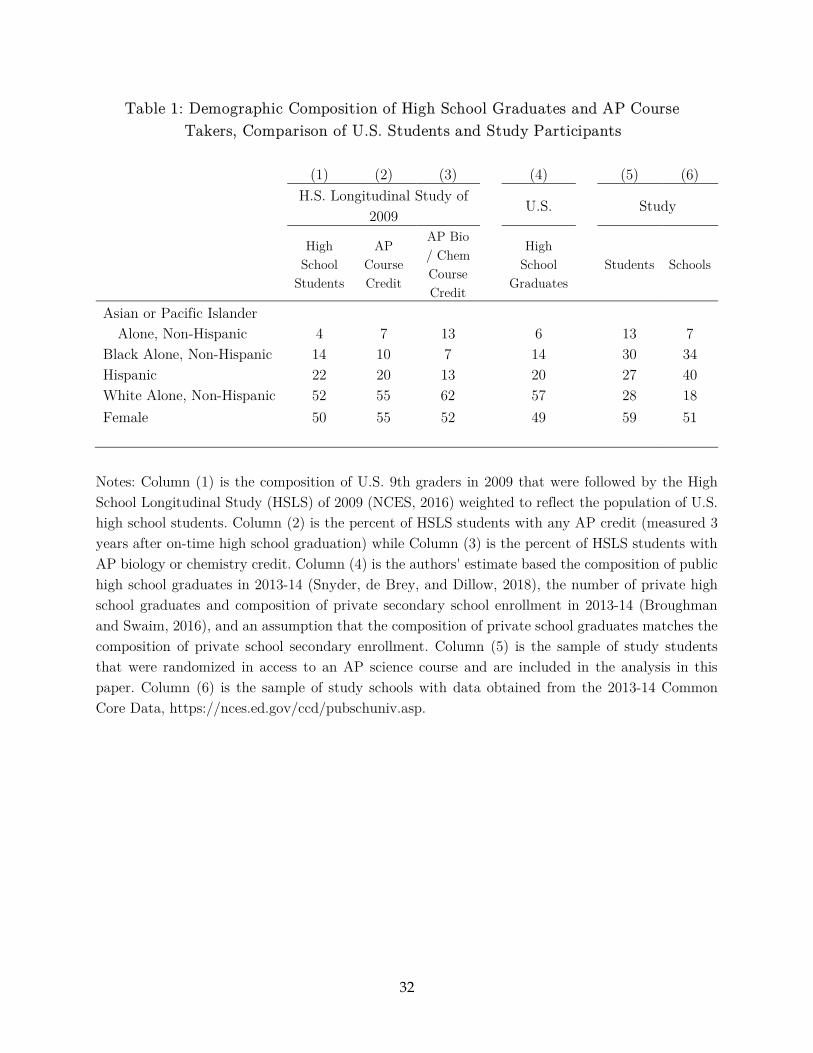
Table 1 provides a comparison of the race and gender of schools and students
participating in the study to the demographics of the nation’s high school graduates and
AP course-takers in 2013.9 The first three columns report data from the High School
Longitudinal Study (HSLS), which followed 9th grade students from 2009 past high school
graduation. These data reveal substantial differences in the racial composition of U.S. high
school students and AP science course takers. For example, Asian or Pacific Islander
students comprise 4% of high school students yet reach up to 13% of students who graduate
with course credit in AP Biology or AP Chemistry. In contrast, Hispanic and Black students
comprise only 13% and 7% of the AP chem/bio credit-earning population while comprising
22% and 14% of the population of high school students. Column (4) shows that U.S. high
school graduates are also disproportionately White and Asian/Pacific Islander (57% and
6%, respectively) relative to the population of high school students (52% and 4%,
respectively).
Columns (5) and (6) provide the composition of our study sample. As a reminder, these
are students who expressed a strong interest in taking an AP Biology or AP Chemistry
course by assenting to participate in the study. Participating students are much more likely
to be Black and Hispanic than students who graduate with credit in AP Biology and AP
Chemistry courses nationally. Correspondingly, our sample includes far fewer White
students than the national average. The reason for the difference lies primarily in the racial
composition of participating schools (shown in Column 6). In the planning phase of the
study, an estimated 50% of high schools already offered AP science classes and they tended
to be in communities with a disproportionate share of White students (Malkus 2016). We
9 These data sources do not include comparable measures of family income, wealth, parental education, or parental occupation, precluding such comparisons.
15
thus recruited from among the other half of schools that had not previously offered these
AP science classes and tended to educate larger shares of Black and Hispanic students.
Columns (5) and (6) also indicate some within-school racial differences in eligibility for the
new courses with White and Asian/Pacific Islander students overrepresented in the student
sample. 10 The study also includes a higher share of female students than the AP
Biology/Chemistry credit-earners nationally. This difference appears to be driven more by
within-school gender differences in enrollment eligibility than by higher female
representation in the study schools.11
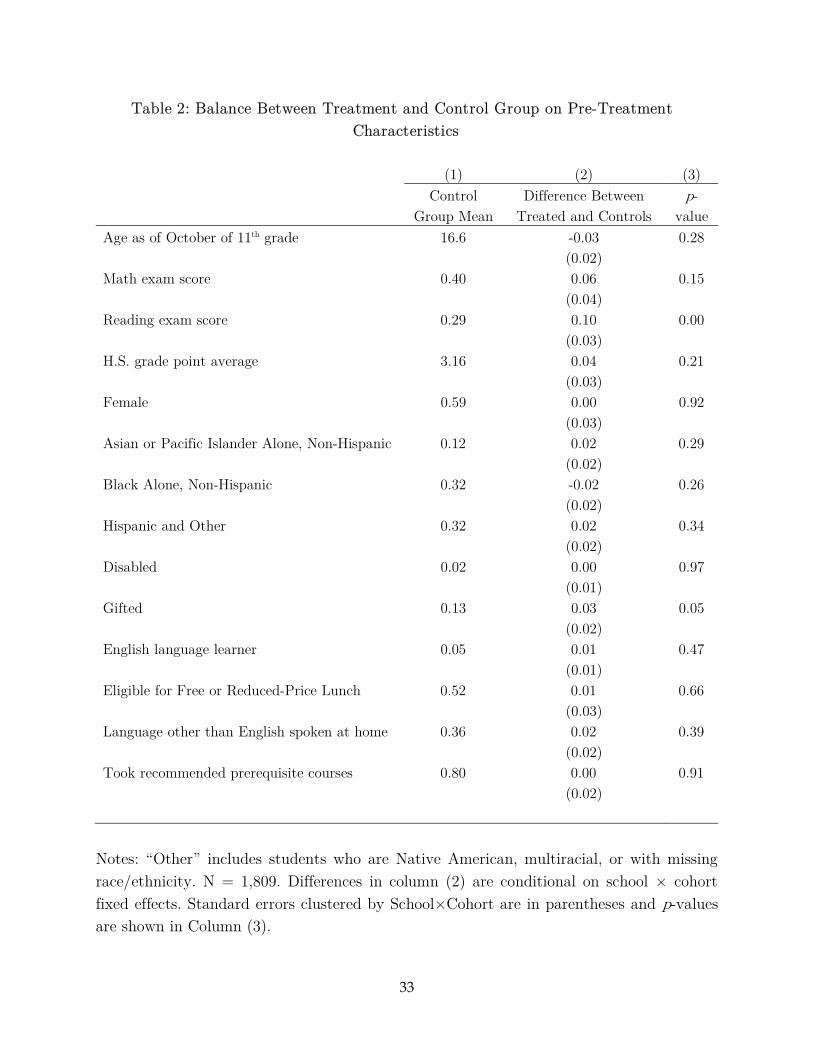
In Conger et al. (forthcoming), we document that pretreatment characteristics are
mostly balanced between treatment and control groups in the entire study population and
the survey respondents. In Table 2, we replicate these balance tests on the subsample of
students who are included in the analysis in this paper.12 Most of the estimated differences,
which are conditional on school by cohort fixed effects, are small with some exceptions.
Treatment group students have higher pretreatment reading exam scores (point estimate of
0.10 standard deviations) and are more likely to be designated as gifted (point estimate of
0.03). To adjust for these chance imbalances, we include all student covariates as predictors
of outcomes in the models.
3 Empirical Strategy
To estimate the effect of taking the AP science course on college aspirations,
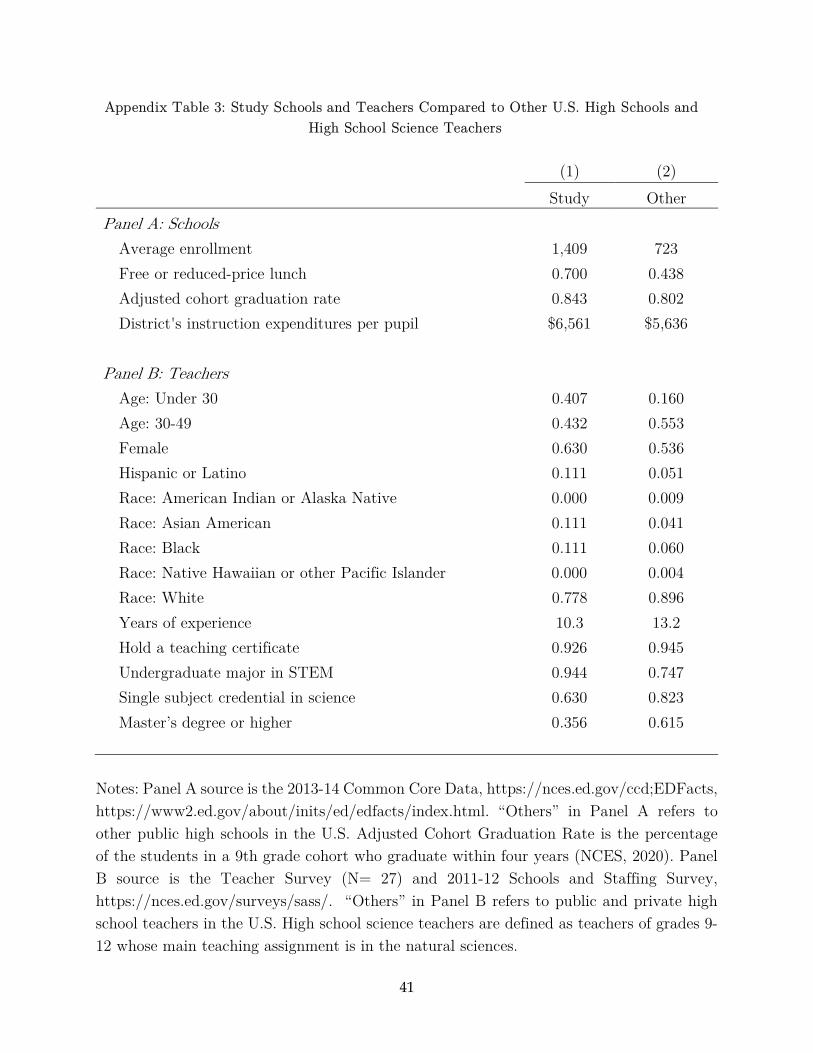
10 AP coursetaking gaps by race within schools have been documented in other studies (e.g., Klopfenstein 2004). 11 Appendix Table 3 provides additional descriptive statistics on study schools and teachers. 12 The difference with the table in our prior paper is that we exclude 10 students whose expected high school graduation is after spring 2017.
16
preparedness, and enrollment, we use the instrumental variable specification as follows:
(1) 𝑌 = 𝛼 + 𝐴𝑃 𝛽 + 𝑿 𝛾 + 𝜖 ,
(2) 𝐴𝑃 = 𝛿 + 𝑂𝑓𝑓𝑒𝑟𝑒𝑑 𝜃 + 𝑿 𝜇 + 𝜖 ,
where 𝐴𝑃 = 1 if student i enrolled in the AP science course in school by cohort stratum
𝑗; 𝐴𝑃 is the fitted value based on the estimates of the parameters in Equation (2);
𝑂𝑓𝑓𝑒𝑟𝑒𝑑 = 1 if the student is randomized into the treatment group; 𝑿 is a vector of
pretreatment covariates (including age, math and reading exam scores from 8th and 10th
grade (standardized and averaged for math and reading separately), cumulative GPA prior
to the year when the AP science course was offered, and indicator variables for female,
racial group (Asian or Pacific Islander; Black; or Hispanic, Native American, or Multiracial),
disability, gifted, English Language Learner, eligible for free or reduced-price lunch, home
language is not English, and took recommended prerequisite courses); and 𝛼 and 𝛿 are
school by cohort fixed effects.13 We use two-stage least squares to estimate the model for all
outcomes. The local average treatment effect (LATE) estimate is given by 𝛽.
The intent to treat (ITT) estimate is obtained by replacing 𝐴𝑃 with 𝑂𝑓𝑓𝑒𝑟𝑒𝑑 in
Equation (1) as shown in Equation (3). The coefficient on 𝑂𝑓𝑓𝑒𝑟𝑒𝑑 in Equation (3)
provides the effect of being offered enrollment in the new AP science course and is a
weighted average of effects on those who do and do not choose to enroll.
(3) 𝑌 = 𝜁 + 𝑂𝑓𝑓𝑒𝑟𝑒𝑑 𝜏 + 𝑿 𝜆 + 𝜖 .
To estimate heterogeneity in effects, we implement the following fully-interacted
13 Given the high degree of correlation between students’ 8th and 10th grade scores (and the fact that some students did not have 10th grade scores), we created one reading and math score for each student that is the average of both scores or just the 8th grade score. For the 23 participating students who were in 10th grade during the year in which the AP course was offered to their cohort, we only use the student’s 8th grade test scores as their 10th grade test scores would be endogenous.
17
specification:
(4) 𝑌 = 𝛼 + 𝐼𝑛𝑑𝑖𝑐𝑎𝑡𝑜𝑟 𝐴𝑃 𝛽 + (1 − 𝐼𝑛𝑑𝑖𝑐𝑎𝑡𝑜𝑟 )𝐴𝑃 𝛽 + 𝑿 𝛾 + 𝐼𝑛𝑑𝑖𝑐𝑎𝑡𝑜𝑟 𝑿 𝜆 +
𝜖 ,
where 𝐼𝑛𝑑𝑖𝑐𝑎𝑡𝑜𝑟 equals 1 if the student is in a subgroup of interest (e.g., 12th grade) and
we test for equality of 𝛽 and 𝛽 . To address the endogeneity of 𝐼𝑛𝑑𝑖𝑐𝑎𝑡𝑜𝑟 𝐴𝑃 and
(1 − 𝐼𝑛𝑑𝑖𝑐𝑎𝑡𝑜𝑟 )𝐴𝑃 we instrument for both with their randomized course offer equivalents
(i.e., 𝐼𝑛𝑑𝑖𝑐𝑎𝑡𝑜𝑟 𝑂𝑓𝑓𝑒𝑟𝑒𝑑 and (1 − 𝐼𝑛𝑑𝑖𝑐𝑎𝑡𝑜𝑟 )𝑂𝑓𝑓𝑒𝑟𝑒𝑑 ).
For outcomes that we measure from the survey, we weight regressions by the inverse of
the estimated probability of completing the survey.14 Since we have some missingness in
student characteristics as a result of either missing student transcripts or certain data
elements not collected by the district, we use multiple imputation by chained equations
creating 50 imputed datasets, and combine the results.15 For inference, we cluster standard
errors at the level of treatment assignment (school by cohort) in our analysis of main effects.
14 To compute these weights, we first estimate the parameters of the following equation using a probit regression: Pr 𝐶𝑜𝑚𝑝𝑙𝑒𝑡𝑒𝑑𝑆𝑢𝑟𝑣𝑒𝑦 = 1 = Φ 𝜇 + 𝑿 𝜌 + 𝜖 , where 𝐶𝑜𝑚𝑝𝑙𝑒𝑡𝑒𝑑𝑆𝑢𝑟𝑣𝑒𝑦 equals 1 if student 𝑖 in school by cohort 𝑗 completed any part of the end-of-year survey; 𝑿 is the same vector of pretreatment characteristics in the previous equations; 𝜇 are school by cohort fixed effects; and Φ(. ) is the cumulative normal distribution function. Students who had higher pretreatment grades, Black students, those who were not disabled, and those who took prerequisite courses were more likely to complete the survey. The inverse probability weight is computed as 1 Φ 𝜇 + 𝑿 𝜌 + 𝜖⁄ , and gives more weight in the regression to study participants who completed the survey and yet had pre-study characteristics that were similar to those study participants who did not complete the survey. These weights range from 1.0 to 15.5, with a median (mean) weight of 1.2 (1.5), and with 90% of students receiving a weight less than 2.0. 15 We impute with the full dataset, yet only estimate regressions on the sample for which we observe each outcome variable. This follows a multiple imputation then deletion strategy suggested by von Hippel (2007), which improves efficiency while protecting against problematic imputed outcome values.
18
4 Results
4.1 Effects on College Plans and Exams
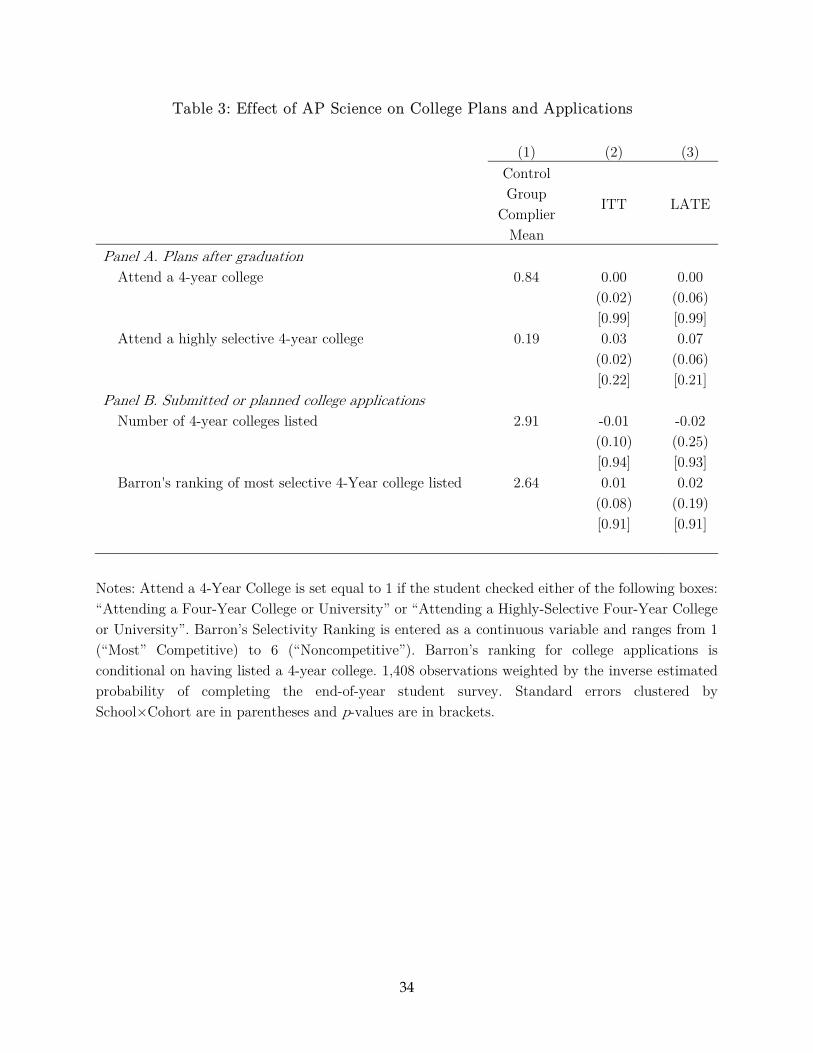
Table 3 provides estimated effects of the course on students’ aspirations after high school
(Panel A) and their planned or submitted college applications (Panel B). The control group
complier means indicate a high rate of interest in enrolling in a four-year college (84%),
with far lower aspirations to enroll in a highly selective four-year college (19%). The ITT
and LATE estimates show that neither the offer of enrollment nor enrollment affected
students’ aspirations to attend a four-year college. In contrast to the precisely estimated
zeros on plans to enroll in a four-year college, the impact estimates on highly selective
enrollment plans are somewhat noisy.16 Though the LATE is a substantial 7 percentage
point increase off a control group complier mean of 19%, the p-value of 0.21 renders this
result more suggestive than definitive.
Turning to Panel B, we find that control group compliers listed approximately three
four-year colleges on average with the most selective having a rank of 2.64 on the Barron’s
scale of 1 to 6. Using California colleges as an example, in 2014, Loyola Marymount
University and three of the University of California (Irvine, San Diego, and Santa Cruz)
schools ranked as very competitive (tier 3). California Polytechnic State University,
Pepperdine University, and two of the other UC colleges (Davis and Santa Barbara) are
examples of institutions considered highly competitive (tier 2).
The results in Columns (2) and (3) show no economic or statistical difference in the
number of four-year colleges listed, or in the average rankings of the colleges listed between
treatment group course takers and control group compliers.
16 The term “highly selective” was used in the survey question but was not defined for the student respondents. Thus, the responses are based on students’ subjective understanding of this term.
19
In Conger et al. (forthcoming), we document a negative effect of taking an AP science
course on students’ grades during the study year. We also find that upweighting AP science
courses by one point (for instance, treating a grade of B in an AP course as a grade of A in
the grade-point average calculation) would not be enough to offset the negative effect on
high school grades in science and adverse spillover effects on grades in other subjects. The
students who assented to participate in the study represent a highly motivated group of
students willing to take on the challenge of an AP science course. The negative results on
grades indicate that the course demands a great deal of effort from students that may reduce
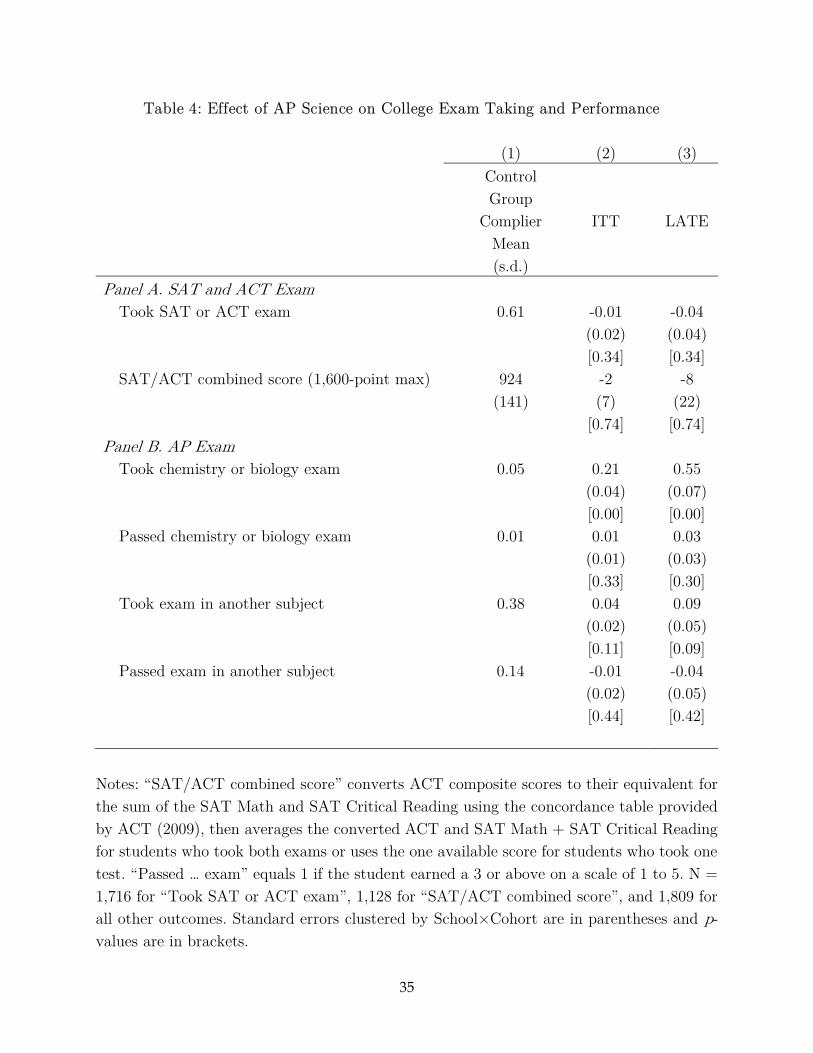
time spent on other college-going activities. Table 4 presents estimates of AP treatment
effects on two additional metrics of college preparedness: students’ college entrance exam
scores (Panel A) and AP exams (Panel B).
Panel A reports treatment effects on combined SAT and ACT scores. To create these
scores, we convert ACT composite scores to their equivalent for the sum of the SAT Math
and SAT Critical Reading using the concordance table provided by ACT (2009), then
average the converted ACT and SAT Math + SAT Critical Reading for students who took
both exams. For students who took only one exam, we use the one available score.17 We
find modest negative and statistically insignificant effects of AP science on students’
probability of taking a college entrance exam as well as their combined scores. Estimated
treatment impacts on the separate subject exams (math, reading, and science) are also small
and statistically insignificant (results available upon request).
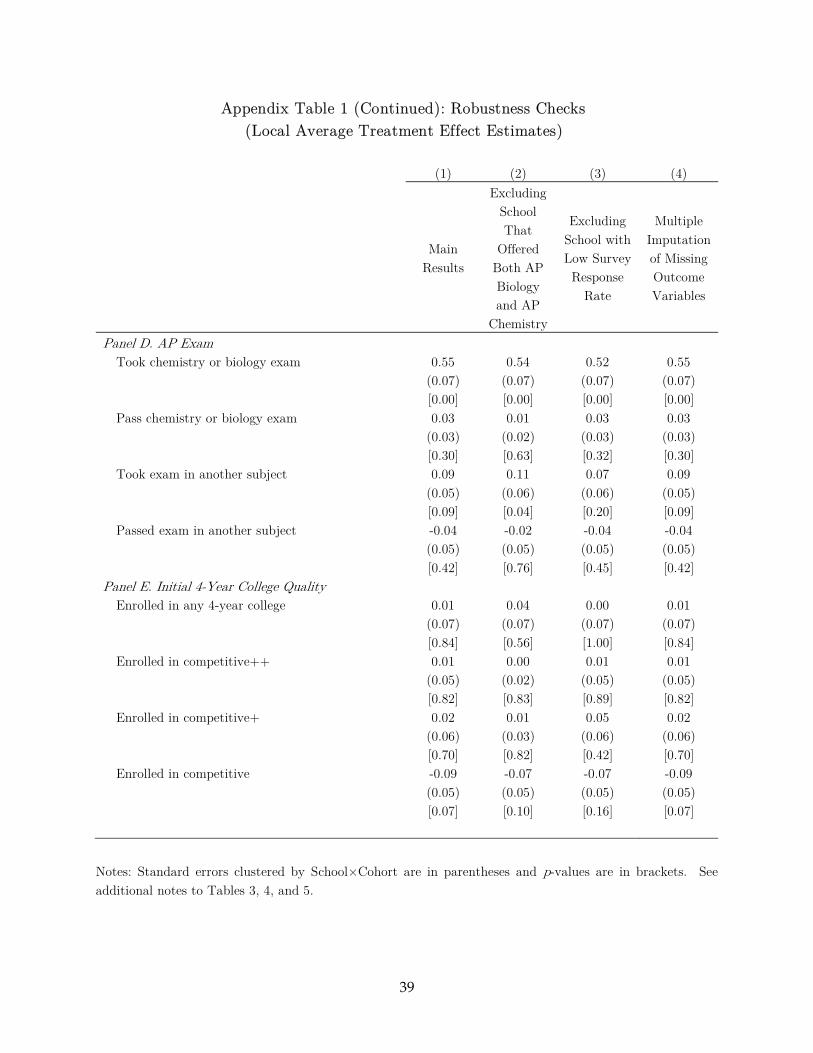
As expected, Panel B of Table 4 reveals larger effects on AP exams. Students who take
the AP Biology or AP Chemistry course are much more likely to take an AP exam in those
subjects, with an ITT of 21 percentage points and a LATE of 55 percentage points (relative
17 We were unable to obtain complete records on students’ ACT scores, which resulted in a sample of 1,716 for estimated effects on SAT or ACT taking.
20
to the 5% of control group compliers who take the exam). Yet, the pass rates on the exams
(scoring a 3 or above) are very low for both control and treatment group compliers. The
implied pass rate for control group compliers is 11%, while the implied pass rate for
treatment group course-takers is only an estimated 6%.18 A 95% confidence interval on this
latter estimate includes negative and zero treatment effects, but even the upper end of the
interval suggests a pass rate of only 15% for treatment group course-takers. Together, these
results suggest that the course substantially increases students’ likelihood of taking the
exam but does not increase their success on the exam. Nationally, AP exam pass rates in
biology and chemistry are low for students from traditionally underrepresented groups.
Based on data from 2014, only 28% of Black students who took the AP Chemistry exam
earned a passing score in comparison to 69% of Asian students and 61% of White students
(College Board 2014).19
Turning to the results on other exams, we see a similar pattern though some of the
results are less precise. We find a positive treatment effect on the probability of taking
another AP exam: the probability increases by 9 percentage points relative to a control
group complier mean of 0.38 (p-value = 0.09). The point estimates also suggest that
treatment group course-takers take more AP exams in other subjects, but they are less
likely to pass those exams. These results should be interpreted with caution given the lack
18 The point estimates presented in Table 4 have been rounded to two decimal place accuracy. Based on these estimates to four decimal places, the implied pass rate for control group compliers is calculated as 0.0058/0.0549 = 10.6%, while the implied pass rate for treatment group course-takers is calculated as [(0.0058+0.0299)/(0.0549+0.5473)]=5.9%. It is important to note that we did not randomly assign students to take the AP exam (only the offer of enrollment in the course), which may explain the higher pass rate among control group members who opted to take the exam despite not taking the course. 19 The College Board does not present AP exam pass rates by student preparation so we are unable to determine whether the pass rates in our study resemble the pass rates in similar settings.
21
of precision.
The poor performance of AP science course-takers on the exam is consistent with many
of the interviews that we conducted with AP science teachers. Several teachers commented
on having to keep students engaged and encourage them to do the hard work, especially at
schools where there were few other AP classes. At several schools, teachers reported that
students who enrolled in the class with low math skills were struggling with the AP material.
Some teachers also expressed concern that students were not ready to take the AP exam,
and that they found it difficult to motivate students to prepare for the exam outside of
class.
4.2 Effects on College Enrollment and Selectivity
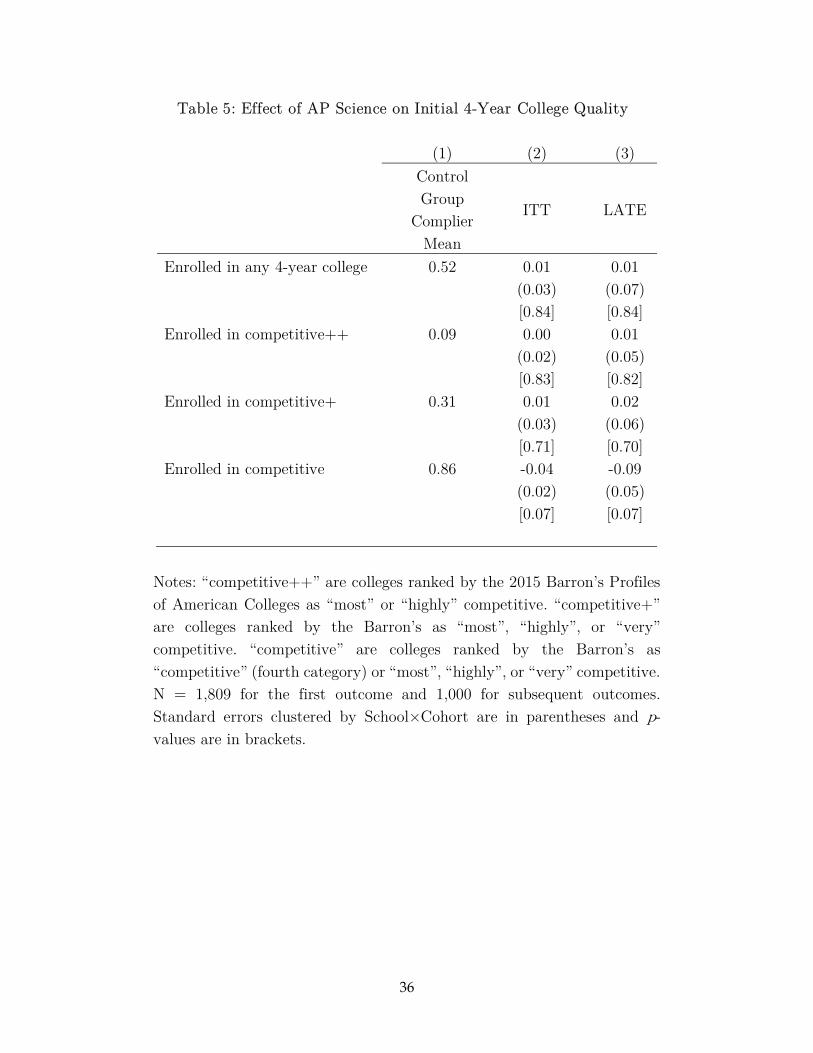
Next, we evaluate how AP course enrollment affects students’ initial four-year college
enrollment and the selectivity of the colleges chosen (Table 5). Approximately 52% of
control group compliers enrolled in a four-year college immediately upon graduation, which
is slightly higher than the national average of 44% in 2014 (Kena et al. 2016). We find a
modest and statistically insignificant impact of the treatment on four-year college
enrollment.
Estimated effects of AP science on whether students enrolled in a college ranked in the
top two Barron’s categories (Competitive++) or the top three Barron’s categories
(Competitive+) are both positive, yet highly imprecise, as shown in Table 5. We find the
most significant impact (in both quantitative and statistical terms) on enrollment in a
college ranked in the top four categories (Competitive). Most of the control group compliers
enrolled in a competitive college (86%), while treatment group course-takers were 9
percentage points less likely to do so. This impact estimate is quite large. As an example,
if we were to evaluate the effect off a base of enrollment in a less or non-competitive colleges
(the bottom two Barron’s ranks), special colleges, or colleges not assessed by Barron’s, the
22
treatment effect is a 9 percentage point increase in enrollment in these types of colleges off
a base of only 14%.
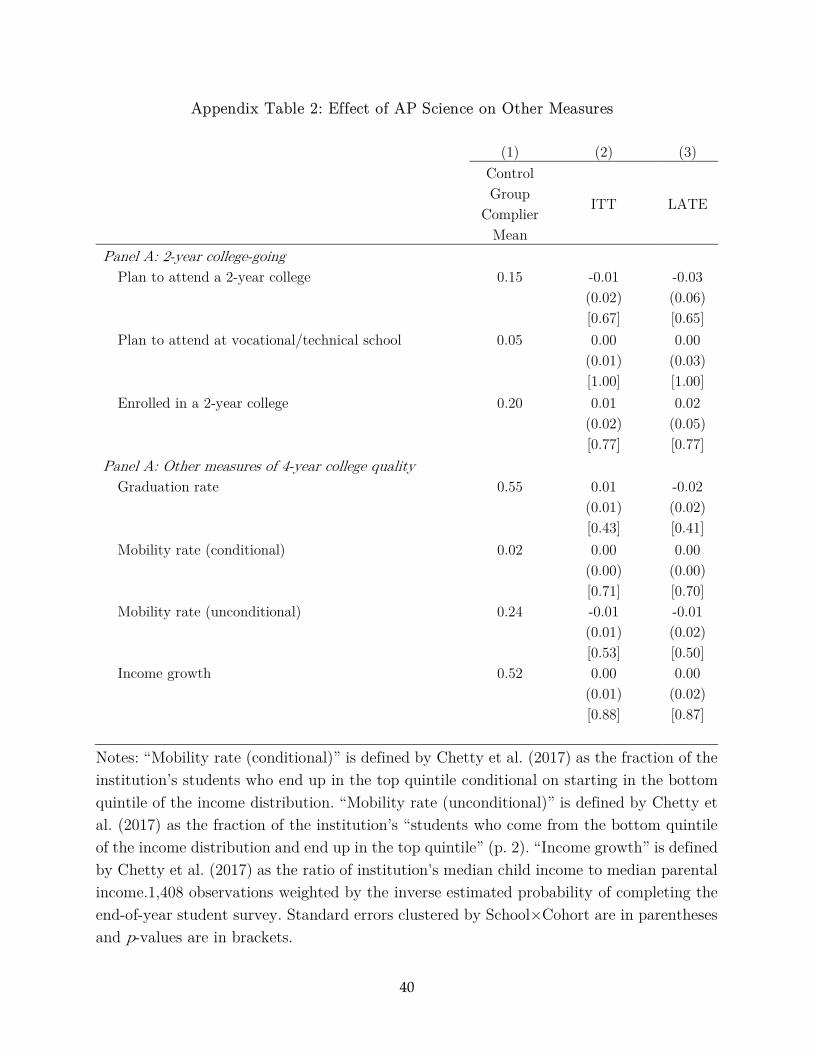
In Appendix Table 2, we show no evidence of treatment effects on other average
measures of college quality. Specifically, we estimate effects on institutional graduation rates
(using IPEDS, 2014 data) as well as mobility and income growth rates (using data from the
Equality of Opportunity Project, Chetty et al. 2017).20 The treatment effect seems to lie
primarily in shifting students downward from competitive colleges to less competitive
colleges, which differ on selectivity rates, but perhaps not on graduation rates and these
other metrics. Using California colleges again as an example, while most of the CSU colleges
are ranked as competitive (tier 4), three (Bakersfield, Dominguez Hills, and Monterey Bay)
are ranked as less competitive (tier 5).
4.3 Explanation for Effects on College Selectivity
There are several potential explanations for the negative treatment effects on college
selectivity. Two leading candidates are that the teachers and the students in the study are
ill-prepared to deliver and receive AP course instruction. Though our analysis of treatment
contrast indicates a high degree of rigor in the new AP classes, teachers were relatively new
to the AP science curriculum and may have faced challenges in course delivery. Many AP
teachers also expressed concerns about the limited preparation of their students. And the
implied exam pass rates for our students are lower than national averages, even for students
from traditionally underrepresented groups. To shed light on the relative weight of teacher
20 We estimate effects on the following three measures from Chetty et al. (2017): (1) Mobility Rate- fraction of institution's students who end up in the top quintile conditional on starting in the bottom quintile of the income distribution; (2) Mobility Rate (Unconditional)- fraction of institution’s “students who come from the bottom quintile of the income distribution and end up in the top quintile.” (p.2); and (3) Income Growth- ratio of institution's median child income to median parental income.
23
versus student preparation, we look within our sample for variation in effects along these
dimensions.
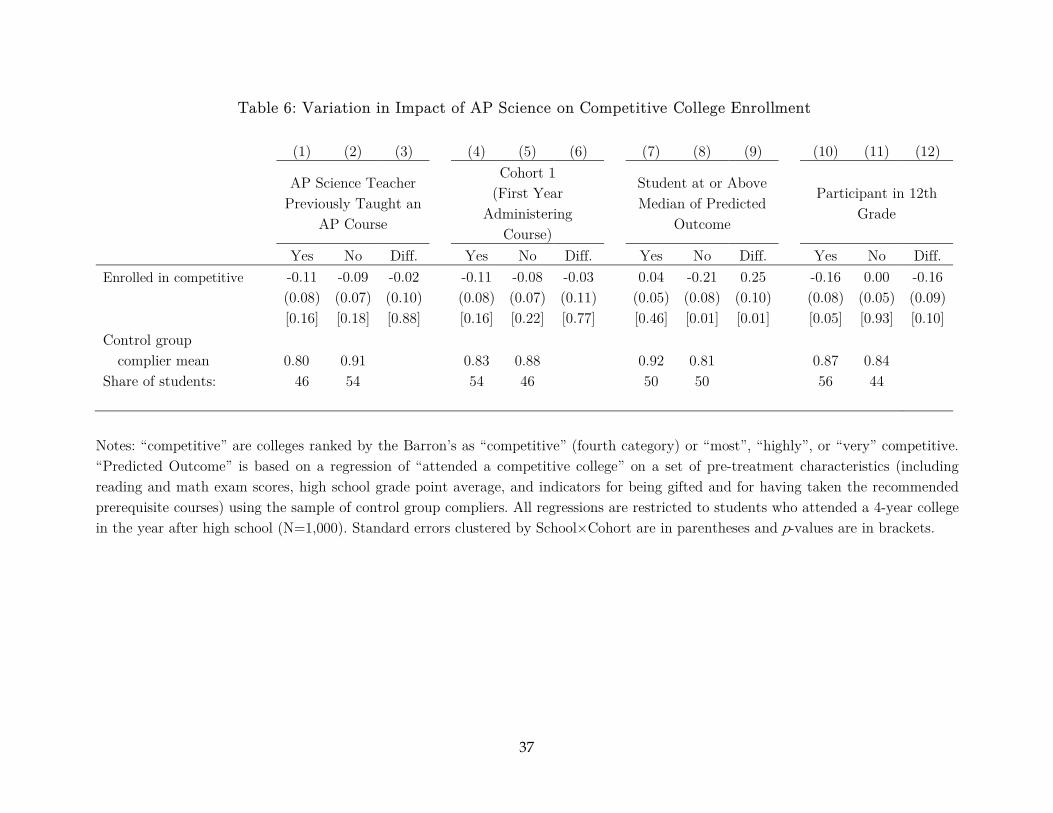
Teacher preparation: Columns (1)-(3) of Table 6 show negative and large AP science
treatment effects on competitive college enrollment for students in classes with teachers
who have taught an AP course before and those who have not. We find similar results when
we test for variation in treatment effects according to whether the student was in their
school’s first administration of the new AP course (Columns (4)-(6) of Table 6). The point
estimates differ slightly for each subgroup, but they all remain negative and large and tests
for equality prevent us from ruling out no differences with a high degree of confidence.
These two heterogeneity analyses indicate that the negative treatment effects are unlikely
to be driven by poorly prepared or inexperienced teachers (at least within the study sample).
Student preparation: We next turn to variation in treatment effects according to
whether students test above or below median on their predicted outcome based on
pretreatment academic qualifications. To identify students on this last dimension, we first
regress each outcome on all pretreatment academics (math scores, whether the student took
the prerequistite course, and grade point average) using data from the sample of control
group compliers, and then apply the estimated coefficients to predict the outcome for all
participants. For this analysis, we use the leave-out-one method recommended by Abadie,
Chingos, and West (2018) to correct for the bias caused by endogenous stratification.
Columns (7) through (9) of Table 6 present the results of this analysis. The adverse
effect of taking the course on attending a competitive 4-year college are far more pronounced
among less-prepared students. Treatment effects are -21 percentage points for students with
below median predicted likelihood of attending a competitive 4-year college (p-value=0.01)
and +4 percentage points for students above the median (p-value= 0.46). The difference in
treatment effects is large (and highly statistically significant) lending support for the
24
hypothesis that the reduction in competitive college enrollment is driven by insufficient
student preparation.
Next, we offer a partial investigation into the mechanisms through which the course
operates on college choice and enrollment. AP courses can shape students’ preferences for
college or their assessment of their own probability of gaining admission (or succeeding) in
certain colleges. An increased interest in pursuing a STEM major, for instance, could
increase students’ interest in institutions with stronger STEM programs. Getting poor
grades in AP and not succeeding on an AP exam could lower students’ assessment of their
academic performance at competitive colleges (Black et al. 2015). Failing to earn passing
AP exam scores could also increase students’ estimates of college costs (as passing the exam
could reduce tuition expenses and speed time to degree (Smith et al. 2017)). Independent
of aspirations, many of these metrics affect students’ likelihood of admission to (and receipt
of funding from) competitive institutions. All competitive colleges rely on students’ high
school GPAs as an indicator of their preparedness for college courses. Most competitive
institutions also consider student scores on college entrance exams and some consider
student scores on AP exams in the admissions decision. Many colleges also consider these
metrics in determining which students are eligible for merit-based scholarships.
To partially distinguish between institutional responses to students’ applications and
students’ decisions, we examine whether treatment effects on competitive college enrollment
differ for students who take the course in the 12th grade versus those who take it earlier.21
Seniors are much farther along in their pursuit of college by the end of the course.
Admissions decisions are unlikely to be influenced by poor AP grades or exam results that
are not revealed until early July. If the course influences these students’ enrollment
21 Conveniently, our sample includes roughly half of each group (56 % of the study population received an offer of enrollment in the 12th grade).
25
decisions, it should largely be driven by the students’ decision not to enroll. The results of
this analysis, shown in Columns (10)-(12), indicate that taking the AP science course has
no impact on enrollment in competitive institutions for 11th graders and a substantial
negative impact for 12th graders. The difference in these LATE estimates is 16 percentage
points (p-value = 0.10). This finding suggests that the negative treatment effect on college
selectivity has less to do with admissions and financial aid than with students’ decisions not
to matriculate.
5 Conclusion
This study uses an experimental design to estimate the effect of taking an AP science
class on initial four-year college going. The estimated impacts on college plans, applications,
college entrance exams, and probability of enrolling in a four-year college are negligible. At
the same time, we find that the overwhelming majority of treatment group course-takers
failed the AP exam associated with the course and are substantially less likely to enroll in
moderately selective institutions, and these results are particularly true for students with
low prior preparation and who took the course in 12th grade.
Our results on initial college going suggest that taking a rigorous AP course comes with
some tradeoffs for students in schools at the frontier of AP course expansion. Our prior
research indicates that students gain genuine skill from these classes, yet their low grades
and AP exam scores may alter their college going decisions. Secondary high school
counselors should consider these tradeoffs in the advice given to students about what courses
to take and how the course might affect their aspirations and college choices. Further,
though not all postsecondary institutions consider AP exam scores in their admissions
decisions, the cost savings that is attached to high scores suggest that they weigh heavily
in the college-going decisions of low-income students. Like all standardized tests, the AP
26
exam will be more challenging for students who have fewer family resources. Students in
schools with less experience delivering the AP curriculum will also have more difficulty
succeeding on the exam than students in schools with a long tradition of delivering AP.
Policymakers and educators should consider providing additional AP exam preparation for
students from less wealthy families and in frontier schools to reduce the disparity in exam
success. The College Board might also consider publicizing AP exam performance for
students with different levels of prior preparation. This information may be useful to
students, secondary schools, and post-secondary institutions who rely on the AP program
for quality early college training.
27
References
Abadie, A., M.M. Chingos, and M.R. West. 2018. Endogenous Stratification in Randomized
Experiments. Review of Economics and Statistics 100(4): 567-580.
Altonji, J.G. 1995. The Effects of High School Curriculum on Education and Labor Market
Outcomes. Journal of Human Resources 30(3): 409–438.
Avery, C.N., O. Gurantz, M. Hurwitz, and J. Smith. 2018. Shifting College Majors in
Response to Advanced Placement Exam Scores. Journal of Human Resources 53(4):
918-956.
Barron's Educational Series, Inc. 2014. Barron's Profiles of American Colleges 2015.
Black, D.A., and J.A. Smith. 2004. How Robust is the Evidence on the Effects of College
Quality? Evidence from Matching. Journal of Econometrics 121(1): 99-124.
_____. 2006. Estimating the Returns to College Quality with Multiple Proxies for
Quality. Journal of Labor Economics 24(3): 701-728.
Black, S.E., K.E. Cortes, and J.A. Lincove. 2015. Academic Undermatching of High-
Achieving Minority Students: Evidence from Race-Neutral and Holistic Admissions
Policies. American Economic Review 105(5): 604-10.
Bowen, W.G., M.M. Chingos, and M.S. McPherson. 2009. Crossing the Finish Line:
Completing College at America’s Public Universities. Princeton University Press.
Bowie, L. (2013). Maryland Schools have been Leader in Advanced Placement, but Results
are Mixed. The Baltimore Sun.
Chajewski, M., K.D. Mattern, and E.J. Shaw. 2011. Examining the Role of Advanced
Placement® Exam Participation in Four-Year College Enrollment. Educational
Measurement: Issues and Practice 30(4): 16–27.
28
Chetty, R., J. Friedman, E. Saez, N. Turner, and D. Yagan. 2017. Mobility Report Cards:
The Role of Colleges in Intergenerational Mobility. National Bureau of Economic
Research Working Paper 23618.
College Board. 2011a. AP Biology Curriculum Framework 2012-2013. New York, NY.
______. 2011b. AP Chemistry: Curriculum Framework 2013-2014. New York, NY.
______. 2014. AP Program Participation and Performance Data. New York, NY.
______. 2020. AP Program Participation and Performance Data. New York, NY.
Conger, D., A.I. Kennedy, M.C. Long, and R. McGee, Jr. Forthcoming, 2021. The Effect of
Advanced Placement Science on Students’ Skills, Confidence, and Stress. Journal of
Human Resources 56 (1): 93-124.
Dillon, E.W., and J.A. Smith. 2017. Determinants of the Match between Student Ability
and College Quality. Journal of Labor Economics 35 (1): 45-66.
Dillon, E.W., and J.A. Smith. 2020. The Consequences of Academic Match between
Students and Colleges. Journal of Human Resources 55(3): 767-808.
Dougherty, C. and L. Mellor. 2009. Preparation Matters. National Center for Educational
Achievement.
Dounay Zinth, Jennifer. 2016. 50-State Comparison: Advanced Placement Policies.
Education Commission of the States.
Farkas, S., and A. Duffett. 2009. Growing Pains in the Advanced Placement Program: Do
Tough Trade Offs Lie Ahead? Thomas B. Fordham Institute.
Goodman, J. 2019. The Labor of Division: Returns to Compulsory High School Math
Coursework. Journal of Labor Economics 37(4): 1141-1182.
Goodman, J., M. Hurwitz, and J. Smith. 2017. Access to Public Four-Year Colleges and
Degree Completion. Journal of Labor Economics 35 (3): 829-867.
29
Griffith, A.L., and D.S. Rothstein. 2009. Can’t Get There from Here: The Decision to Apply
to a Selective College. Economics of Education Review 28(5): 620–28.
Gurantz, O. Forthcoming. How College Credit in High School Impacts Postsecondary
Course-taking: The Role of AP Exams. Education Finance and Policy.
Hemelt, S.W, N.L. Schwartz, and S.M. Dynarski. 2020. Dual-Credit Courses and the Road
to College: Experimental Evidence from Tennessee. Journal of Policy Analysis and
Management 39(3): 686-719.
Hoxby, C., and C. Avery. 2013. The Missing ‘One-Offs’: The Hidden Supply of High-
Achieving, Low-Income Students. Brookings Papers on Economic Activity (Spring):
1–61.
Jackson, C.K. 2010. A Little Now for a Lot Later: A Look at a Texas Advanced Placement
Incentive Program. Journal of Human Resources 45(3): 591–639.
______. 2014. Do College-Preparatory Programs Improve Long-Term Outcomes?
Economic Inquiry 52(1): 72–99.
Joensen, J.S., and H.S. Nielsen. 2009. Is there a Causal Effect of High School Math on Labor
Market Outcomes? Journal of Human Resources 44(1): 171–198.
Judson, E., and A. Hobson. 2015. Growth and Achievement Trends of Advanced Placement
(AP) Exams in American High Schools. American Secondary Education 43(2): 59–
76.
Kena, G., W. Hussar, J. McFarland, C. de Brey, L. Musu-Gillette, X. Wang, J. Zhang, A.
Rathbun, S. Wilkinson-Flicker, M. Diliberti, A. Barmer, F. Bullock Mann, and E.
Dunlop Velez. 2016. The Condition of Education 2016 (NCES 2016-144). U.S.
Department of Education, National Center for Education Statistics. Washington,
DC.
30
Klopfenstein, K. 2004. Advanced Placement: Do Minorities Have Equal Opportunity?
Economics of Education Review 23(2): 115-131.
Levine, P.B., and D.J. Zimmerman. 1995. The Benefit of Additional High School Math and
Science Classes for Young Men and Women. Journal of Business & Economic
Statistics 13(2): 137–149.
Long, M.C. 2008. College Quality and Early Adult Outcomes. Economics of Education
Review 27(5): 588-602.
Long, M.C., D. Conger, and P. Iatarola. 2012. Effects of High School Course-taking on
Secondary and Postsecondary Success. American Educational Research Journal
49(2): 285–322.
Long, M.C., D. Conger, and R. McGhee, Jr. 2019. Life on the Frontier of AP Expansion:
Can Schools in Less-Resourced Communities Successfully Implement Advanced
Placement Science Courses? Educational Researcher 48(6): 356–368.
Malkus, N. 2016. AP at Scale: Public School Students in Advanced Placement, 1990–2013.
American Enterprise Institute. Washington, DC.
Milewski, G.B. and J.M. Gillie. 2002. What are the Characteristics of AP Teachers? An
Examination of Survey Research. College Board Research Report No. 2002-10.
NACAC (National Association for College Admissions Counseling). 2019. The State of
College Admission.
NCES (National Center for Education Statistics). 2011. The Nation’s Report Card: Science
2012. Institute of Education Sciences, U.S. Department of Education.
______. 2016. High School Longitudinal Study of 2009, Second Follow-up. Distributed
by U.S. Department of Education, Institute for Education Sciences.
https://nces.ed.gov/surveys/hsls09/.
31
______. 2020. Public High School Graduation Rates Accessed December 13, 2020 from
https://nces.ed.gov/programs/coe/indicator_coi.asp#info.
National Research Council. 2002. Inquiry and the National Science Education Standards.
Washington, DC: National Academy Press.
Rose, H. 2004. Has Curriculum Closed the Test Score Gap in Math? The B.E. Journal of
Economic Analysis & Policy 4(1): 1–30.
Rose, H., and J.R Betts. 2004. The Effect of High School Courses on Earnings. The Review
of Economics and Statistics 86(2): 497–513.
Smith, J. 2013. Ova and Out: Using Twins to Estimate the Educational Returns to
Attending Selective Colleges. Economics of Education Review 36: 166-180.
Smith, J., M. Hurwitz, and C. Avery. 2017. Giving College Credit Where it is Due:
Advanced Placement Exam Scores and College Outcomes. Journal of Labor
Economics 35(1): 67–147.
Smith, J., M. Pender, and J. Howell. 2013. The Full Extent of Student-College Academic
Undermatch. Economics of Education Review 32: 247–61.
Tierney, J. 2012. AP Classes are a Scam. The Atlantic. October 13.
von Hippel, P.T. 2007. Regression with Missing Ys: An Improved Strategy for Analyzing
Multiply Imputed Data. Sociological Methodology 37(1): 83–117.
Zimmerman, S. 2014. The Returns to College Admissions for Academically Marginal
Students. Journal of Labor Economics 32 (4): 711-754.
32
Table 1: Demographic Composition of High School Graduates and AP Course Takers, Comparison of U.S. Students and Study Participants
(1) (2) (3) (4) (5) (6)
H.S. Longitudinal Study of 2009
U.S. Study
High School
Students
AP Course Credit
AP Bio / Chem Course Credit
High
School Graduates
Students Schools
Asian or Pacific Islander
Alone, Non-Hispanic 4 7 13 6 13 7 Black Alone, Non-Hispanic 14 10 7 14 30 34 Hispanic 22 20 13 20 27 40 White Alone, Non-Hispanic 52 55 62 57 28 18 Female 50 55 52 49 59 51
Notes: Column (1) is the composition of U.S. 9th graders in 2009 that were followed by the High School Longitudinal Study (HSLS) of 2009 (NCES, 2016) weighted to reflect the population of U.S. high school students. Column (2) is the percent of HSLS students with any AP credit (measured 3 years after on-time high school graduation) while Column (3) is the percent of HSLS students with AP biology or chemistry credit. Column (4) is the authors' estimate based the composition of public high school graduates in 2013-14 (Snyder, de Brey, and Dillow, 2018), the number of private high school graduates and composition of private secondary school enrollment in 2013-14 (Broughman and Swaim, 2016), and an assumption that the composition of private school graduates matches the composition of private school secondary enrollment. Column (5) is the sample of study students that were randomized in access to an AP science course and are included in the analysis in this paper. Column (6) is the sample of study schools with data obtained from the 2013-14 Common Core Data, https://nces.ed.gov/ccd/pubschuniv.asp.
33
Table 2: Balance Between Treatment and Control Group on Pre-Treatment Characteristics
(1) (2) (3)
Control
Group Mean Difference Between
Treated and Controls p-
value Age as of October of 11th grade 16.6 -0.03 0.28
(0.02)
Math exam score 0.40 0.06 0.15
(0.04)
Reading exam score 0.29 0.10 0.00
(0.03)
H.S. grade point average 3.16 0.04 0.21
(0.03)
Female 0.59 0.00 0.92
(0.03)
Asian or Pacific Islander Alone, Non-Hispanic 0.12 0.02 0.29
(0.02)
Black Alone, Non-Hispanic 0.32 -0.02 0.26
(0.02)
Hispanic and Other 0.32 0.02 0.34
(0.02)
Disabled 0.02 0.00 0.97
(0.01)
Gifted 0.13 0.03 0.05
(0.02)
English language learner 0.05 0.01 0.47
(0.01)
Eligible for Free or Reduced-Price Lunch 0.52 0.01 0.66
(0.03)
Language other than English spoken at home 0.36 0.02 0.39
(0.02)
Took recommended prerequisite courses 0.80 0.00 0.91
(0.02)
Notes: “Other” includes students who are Native American, multiracial, or with missing race/ethnicity. N = 1,809. Differences in column (2) are conditional on school × cohort fixed effects. Standard errors clustered by School×Cohort are in parentheses and p-values are shown in Column (3).
34
Table 3: Effect of AP Science on College Plans and Applications
(1) (2) (3)
Control Group
Complier Mean
ITT LATE
Panel A. Plans after graduation
Attend a 4-year college 0.84 0.00 0.00 (0.02) (0.06) [0.99] [0.99]
Attend a highly selective 4-year college 0.19 0.03 0.07 (0.02) (0.06) [0.22] [0.21]
Panel B. Submitted or planned college applications Number of 4-year colleges listed 2.91 -0.01 -0.02
(0.10) (0.25) [0.94] [0.93]
Barron's ranking of most selective 4-Year college listed 2.64 0.01 0.02 (0.08) (0.19) [0.91] [0.91]
Notes: Attend a 4-Year College is set equal to 1 if the student checked either of the following boxes: “Attending a Four-Year College or University” or “Attending a Highly-Selective Four-Year College or University”. Barron’s Selectivity Ranking is entered as a continuous variable and ranges from 1 (“Most” Competitive) to 6 (“Noncompetitive”). Barron’s ranking for college applications is conditional on having listed a 4-year college. 1,408 observations weighted by the inverse estimated probability of completing the end-of-year student survey. Standard errors clustered by School×Cohort are in parentheses and p-values are in brackets.
35
Table 4: Effect of AP Science on College Exam Taking and Performance
(1) (2) (3)
Control Group
Complier Mean (s.d.)
ITT LATE
Panel A. SAT and ACT Exam Took SAT or ACT exam 0.61 -0.01 -0.04
(0.02) (0.04) [0.34] [0.34]
SAT/ACT combined score (1,600-point max) 924 -2 -8 (141) (7) (22) [0.74] [0.74]
Panel B. AP Exam Took chemistry or biology exam 0.05 0.21 0.55
(0.04) (0.07) [0.00] [0.00]
Passed chemistry or biology exam 0.01 0.01 0.03 (0.01) (0.03) [0.33] [0.30]
Took exam in another subject 0.38 0.04 0.09 (0.02) (0.05) [0.11] [0.09]
Passed exam in another subject 0.14 -0.01 -0.04 (0.02) (0.05) [0.44] [0.42]
Notes: “SAT/ACT combined score” converts ACT composite scores to their equivalent for the sum of the SAT Math and SAT Critical Reading using the concordance table provided by ACT (2009), then averages the converted ACT and SAT Math + SAT Critical Reading for students who took both exams or uses the one available score for students who took one test. “Passed … exam” equals 1 if the student earned a 3 or above on a scale of 1 to 5. N = 1,716 for “Took SAT or ACT exam”, 1,128 for “SAT/ACT combined score”, and 1,809 for all other outcomes. Standard errors clustered by School×Cohort are in parentheses and p-values are in brackets.
36
Table 5: Effect of AP Science on Initial 4-Year College Quality
(1) (2) (3)
Control Group
Complier Mean
ITT LATE
Enrolled in any 4-year college 0.52 0.01 0.01 (0.03) (0.07) [0.84] [0.84]
Enrolled in competitive++ 0.09 0.00 0.01 (0.02) (0.05) [0.83] [0.82]
Enrolled in competitive+ 0.31 0.01 0.02 (0.03) (0.06) [0.71] [0.70]
Enrolled in competitive 0.86 -0.04 -0.09 (0.02) (0.05) [0.07] [0.07]
Notes: “competitive++” are colleges ranked by the 2015 Barron’s Profiles of American Colleges as “most” or “highly” competitive. “competitive+” are colleges ranked by the Barron’s as “most”, “highly”, or “very” competitive. “competitive” are colleges ranked by the Barron’s as “competitive” (fourth category) or “most”, “highly”, or “very” competitive. N = 1,809 for the first outcome and 1,000 for subsequent outcomes. Standard errors clustered by School×Cohort are in parentheses and p-values are in brackets.
37
Table 6: Variation in Impact of AP Science on Competitive College Enrollment
(1) (2) (3) (4) (5) (6) (7) (8) (9) (10) (11) (12)
AP Science Teacher
Previously Taught an AP Course
Cohort 1
(First Year Administering
Course)
Student at or Above Median of Predicted
Outcome
Participant in 12th Grade
Yes No Diff. Yes No Diff. Yes No Diff. Yes No Diff. Enrolled in competitive -0.11 -0.09 -0.02 -0.11 -0.08 -0.03 0.04 -0.21 0.25 -0.16 0.00 -0.16
(0.08) (0.07) (0.10) (0.08) (0.07) (0.11) (0.05) (0.08) (0.10) (0.08) (0.05) (0.09) [0.16] [0.18] [0.88] [0.16] [0.22] [0.77] [0.46] [0.01] [0.01] [0.05] [0.93] [0.10]
Control group
complier mean 0.80 0.91 0.83 0.88 0.92 0.81 0.87 0.84
Share of students: 46 54 54 46 50 50 56 44
Notes: “competitive” are colleges ranked by the Barron’s as “competitive” (fourth category) or “most”, “highly”, or “very” competitive. “Predicted Outcome” is based on a regression of “attended a competitive college” on a set of pre-treatment characteristics (including reading and math exam scores, high school grade point average, and indicators for being gifted and for having taken the recommended prerequisite courses) using the sample of control group compliers. All regressions are restricted to students who attended a 4-year college in the year after high school (N=1,000). Standard errors clustered by School×Cohort are in parentheses and p-values are in brackets.
38
Appendix Table 1: Robustness Checks
(Local Average Treatment Effect Estimates)
(1) (2) (3) (4)
Main
Results
Excluding School That
Offered Both AP Biology and AP
Chemistry
Excluding School
with Low Survey
Response Rate
Multiple Imputation of Missing Outcome Variables
Panel A. Plans after graduation
Attend a 4-year college 0.00 0.01 0.00 0.01 (0.06) (0.06) (0.06) (0.07) [0.99] [0.85] [0.96] [0.85]
Attend a highly selective 4-year college 0.07 0.11 0.07 0.08 (0.06) (0.07) (0.06) (0.07) [0.21] [0.11] [0.24] [0.27]
Panel B. Submitted or planned college applications Number of 4-year colleges listed -0.02 0.06 0.03 0.15
(0.25) (0.27) (0.25) (0.36) [0.93] [0.82] [0.91] [0.68]
Barron's ranking of most selective 4-Year college listed 0.02 -0.05 0.03 -0.11 (0.19) (0.21) (0.20) (0.26) [0.91] [0.82] [0.90] [0.66]
Panel C. SAT and ACT Exam
Took SAT or ACT exam -0.04 -0.04 -0.03 -0.04 (0.04) (0.04) (0.04) (0.04) [0.34] [0.34] [0.47] [0.33]
SAT/ACT combined score (1,600-point max) -8 2 -9 0 (22) (7) (23) (18) [0.74] [0.83] [0.68] [0.99]
(Appendix Table 1 is continued on the next page)
39
Appendix Table 1 (Continued): Robustness Checks (Local Average Treatment Effect Estimates)
(1) (2) (3) (4)
Main
Results
Excluding School That
Offered Both AP Biology and AP
Chemistry
Excluding School with Low Survey Response
Rate
Multiple Imputation of Missing Outcome Variables
Panel D. AP Exam Took chemistry or biology exam 0.55 0.54 0.52 0.55
(0.07) (0.07) (0.07) (0.07) [0.00] [0.00] [0.00] [0.00]
Pass chemistry or biology exam 0.03 0.01 0.03 0.03 (0.03) (0.02) (0.03) (0.03) [0.30] [0.63] [0.32] [0.30]
Took exam in another subject 0.09 0.11 0.07 0.09 (0.05) (0.06) (0.06) (0.05) [0.09] [0.04] [0.20] [0.09]
Passed exam in another subject -0.04 -0.02 -0.04 -0.04 (0.05) (0.05) (0.05) (0.05) [0.42] [0.76] [0.45] [0.42]
Panel E. Initial 4-Year College Quality Enrolled in any 4-year college 0.01 0.04 0.00 0.01
(0.07) (0.07) (0.07) (0.07) [0.84] [0.56] [1.00] [0.84]
Enrolled in competitive++ 0.01 0.00 0.01 0.01 (0.05) (0.02) (0.05) (0.05) [0.82] [0.83] [0.89] [0.82]
Enrolled in competitive+ 0.02 0.01 0.05 0.02 (0.06) (0.03) (0.06) (0.06) [0.70] [0.82] [0.42] [0.70]
Enrolled in competitive -0.09 -0.07 -0.07 -0.09 (0.05) (0.05) (0.05) (0.05) [0.07] [0.10] [0.16] [0.07]
Notes: Standard errors clustered by School×Cohort are in parentheses and p-values are in brackets. See additional notes to Tables 3, 4, and 5.
40
Appendix Table 2: Effect of AP Science on Other Measures
(1) (2) (3)
Control Group
Complier Mean
ITT LATE
Panel A: 2-year college-going
Plan to attend a 2-year college 0.15 -0.01 -0.03 (0.02) (0.06) [0.67] [0.65]
Plan to attend at vocational/technical school 0.05 0.00 0.00 (0.01) (0.03) [1.00] [1.00]
Enrolled in a 2-year college 0.20 0.01 0.02 (0.02) (0.05) [0.77] [0.77]
Panel A: Other measures of 4-year college quality Graduation rate 0.55 0.01 -0.02
(0.01) (0.02) [0.43] [0.41]
Mobility rate (conditional) 0.02 0.00 0.00 (0.00) (0.00) [0.71] [0.70]
Mobility rate (unconditional) 0.24 -0.01 -0.01 (0.01) (0.02) [0.53] [0.50]
Income growth 0.52 0.00 0.00 (0.01) (0.02) [0.88] [0.87]
Notes: “Mobility rate (conditional)” is defined by Chetty et al. (2017) as the fraction of the institution’s students who end up in the top quintile conditional on starting in the bottom quintile of the income distribution. “Mobility rate (unconditional)” is defined by Chetty et al. (2017) as the fraction of the institution’s “students who come from the bottom quintile of the income distribution and end up in the top quintile” (p. 2). “Income growth” is defined by Chetty et al. (2017) as the ratio of institution's median child income to median parental income.1,408 observations weighted by the inverse estimated probability of completing the end-of-year student survey. Standard errors clustered by School×Cohort are in parentheses and p-values are in brackets.
41
Appendix Table 3: Study Schools and Teachers Compared to Other U.S. High Schools and High School Science Teachers
(1) (2) Study Other Panel A: Schools
Average enrollment 1,409 723 Free or reduced-price lunch 0.700 0.438 Adjusted cohort graduation rate 0.843 0.802 District's instruction expenditures per pupil $6,561 $5,636
Panel B: Teachers
Age: Under 30 0.407 0.160 Age: 30-49 0.432 0.553 Female 0.630 0.536 Hispanic or Latino 0.111 0.051 Race: American Indian or Alaska Native 0.000 0.009 Race: Asian American 0.111 0.041 Race: Black 0.111 0.060 Race: Native Hawaiian or other Pacific Islander 0.000 0.004 Race: White 0.778 0.896 Years of experience 10.3 13.2 Hold a teaching certificate 0.926 0.945 Undergraduate major in STEM 0.944 0.747 Single subject credential in science 0.630 0.823 Master’s degree or higher 0.356 0.615
Notes: Panel A source is the 2013-14 Common Core Data, https://nces.ed.gov/ccd;EDFacts, https://www2.ed.gov/about/inits/ed/edfacts/index.html. “Others” in Panel A refers to other public high schools in the U.S. Adjusted Cohort Graduation Rate is the percentage of the students in a 9th grade cohort who graduate within four years (NCES, 2020). Panel B source is the Teacher Survey (N= 27) and 2011-12 Schools and Staffing Survey, https://nces.ed.gov/surveys/sass/. “Others” in Panel B refers to public and private high school teachers in the U.S. High school science teachers are defined as teachers of grades 9-12 whose main teaching assignment is in the natural sciences.