education and poverty in kenya a district level...
TRANSCRIPT

Education and Poverty in Kenya: A District-Level Analysis
by Emily MacDougall
B.Comm., Queen’s University, 2008
Research Project Submitted In Partial Fulfillment of the
Requirements for the Degree of
Master of Arts
in the
School for International Studies
Faculty of Arts and Social Sciences
© Emily MacDougall 2013
SIMON FRASER UNIVERSITY Summer 2013

ii
Approval
Name: Emily MacDougall
Degree: Master of Arts (International Studies)
Title of Thesis: Education and Poverty in Kenya: A District-Level Analysis
Examining Committee:
Chair:
Dr. Alec Dawson Professor
Morten Jerven Senior Supervisor Assistant Professor
Elizabeth Cooper Supervisor Assistant Professor
Date Approved: August 14 2013

iii
Partial Copyright License

iv
Abstract
The main research question addressed in this paper is to assess whether theories in the
education literature on enrollment, absenteeism and drop out in developing countries are
consistent with district-level data in Kenya. One of the central issues that emerges is
poverty, as it impacts both the supply and demand side of education, and is discussed
as both a cause and consequence of lack of education. This project seeks to explore to
what extent poverty is correlated with enrollment rates, attendance, dropouts,
educational attainment, and literacy rates in district-level data in Kenya, also considering
the impact of gender. In addition, this paper analyzes the reasons given for children not
being enrolled in school by district. The findings in this paper suggest that: Kenya’s
focus on access and Free Primary Education is well founded, promoting female
education can be a means of alleviating poverty, and feeding programs and adult
education may be successful ways to promote demand.
Keywords: education; poverty; Kenya; literacy; gender in education; Free Primary Education

v
Acknowledgements
I would like to thank my supervisor Morten Jerven for his guidance throughout this
program and in the evolution of this paper. I would also like to thank the faculty
members at the School for International Studies and the 2012 MAIS cohort for making
this year a deep, memorable learning experience. Thank you to Melissa Gregg who
assisted with proofreading, and more importantly helped the hours at the library go by
with at least a few laughs. I am grateful to my Mom, Dad and sister Tessa who have, as
always, been a constant support. And finally, “asante sana” to all the dedicated students
and teachers at Salabwek, Emorijoi, Motony, Pimbiniet, Olosiyoi, Sikirarr, Naikarra and
Enelerai Primary Schools, who were the inspiration for this paper.

vi
Table of Contents
Approval ............................................................................................................................. ii Partial Copyright License .................................................................................................. iii Abstract ............................................................................................................................. iv Acknowledgements ............................................................................................................ v Table of Contents .............................................................................................................. vi List of Tables ................................................................................................................... viii List of Figures ................................................................................................................... ix List of Acronyms ............................................................................................................... xi
1. Introduction .............................................................................................................. 1
2. Promoting Education in Developing Countries: A Literature Review ................ 4 2.1. Supply-Side Factors ................................................................................................. 5
2.1.1. Quantity versus Quality in Education ........................................................... 5 2.1.2. Availability and Physical Infrastructure ......................................................... 6
2.2. Demand-Side Factors .............................................................................................. 7 2.2.1. Individual and Household Level ................................................................... 8 2.2.2. Community Level ........................................................................................ 12
2.3. Supply-Demand Interaction ................................................................................... 14 2.4. Analysis and Conclusions ...................................................................................... 15
3. Education in Kenya ................................................................................................ 17
4. Empirical Analysis and Discussion ..................................................................... 20 4.1. Data and Method ................................................................................................... 20 4.2. Education, Poverty, Literacy and Gender .............................................................. 21
4.2.1. Poverty and Primary Attendance ................................................................ 23 4.2.2. Poverty and Preschool Attendance ............................................................ 25 4.2.3. Poverty and Literacy ................................................................................... 28 4.2.4. Literacy and Attendance ............................................................................. 29
4.3. Enrollment Decisions: Reasons for Not Attending School ..................................... 32 4.3.1. Age Barriers ............................................................................................... 32 4.3.2. Monetary Barriers ....................................................................................... 34 4.3.3. Commitment and Motivation ....................................................................... 37 4.3.4. Restrictive Distance .................................................................................... 40
5. Policy Implications and Conclusions .................................................................. 43
References ..................................................................................................................... 46
Appendices .................................................................................................................... 50 Appendix A. District-Level Education Data ................................................................ 51 Appendix B. Correlation Coefficient Summary for Education Data ............................ 53

vii
Appendix C. Correlation Coefficient Summary for Poverty and Reasons for Non-Attendance ..................................................................................................... 54
Appendix D. Reasons for Non-Attendance by District ............................................... 55
viii
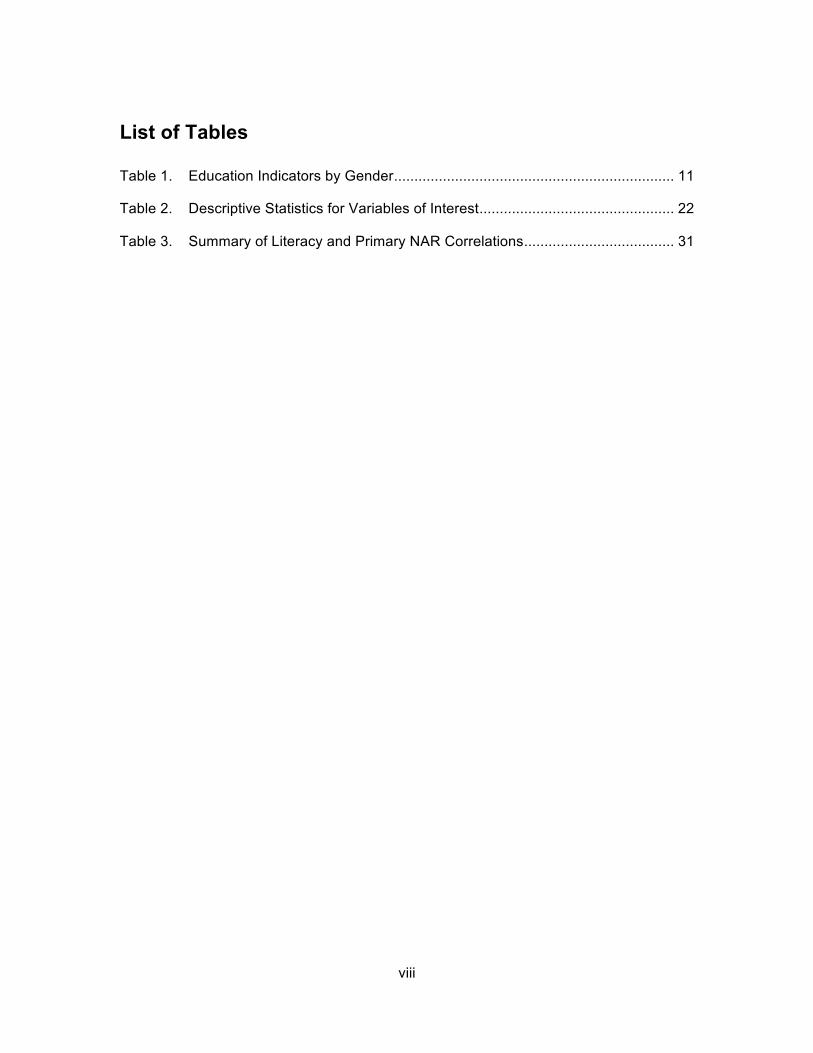
List of Tables
Table 1. Education Indicators by Gender ..................................................................... 11
Table 2. Descriptive Statistics for Variables of Interest ................................................ 22
Table 3. Summary of Literacy and Primary NAR Correlations ..................................... 31

ix
List of Figures
Figure 1. Relationships Between Poverty, Gender Relations and Schooling ............... 12
Figure 2. Proportion of Children Aged 6-15 Attending School, 1999 and 2005/06 ...... 18
Figure 3. Poverty Rate versus Percent Ever Attended School by District .................... 23
Figure 4. Poverty Rate versus Primary NAR by District ............................................... 24
Figure 5. Poverty Rate versus Boys NAR by District ................................................... 25
Figure 6. Poverty Rate versus Girls NAR by District .................................................... 25
Figure 7. Poverty Rate versus Percent of 3-5 Year Olds Attending School ................. 26
Figure 8. Turkana District Education Profile (2005) ..................................................... 28
Figure 9. Poverty Rate versus Literacy Rate by District ............................................... 29
Figure 10. Literacy Rate versus Primary NAR by District ............................................... 30
Figure 11. Literacy Rate versus Girls Primary NAR by District ...................................... 31
Figure 12. Literacy Rate versus Boys Primary NAR by District ...................................... 31
Figure 13. Poverty Rate versus Never Attending School because “Too Young” ........... 33
Figure 14. Poverty Rate versus Not Currently Attending School because “Too Young” .......................................................................................................... 34
Figure 15. Poverty Rate versus Never Attending School because “No Money for School Costs” ................................................................................................ 35
Figure 16. Poverty Rate versus Not Currently Attending School because “No Money for School Costs” ............................................................................... 35
Figure 17. Poverty Rate versus Never Attending School because “Had to Work” ......... 37
Figure 18. Poverty Rate versus Not Currently Attending School because “Had to Work” ............................................................................................................ 37
Figure 19. Poverty Rate versus Never Attending School because “Not Interested/Lazy” ............................................................................................ 38
Figure 20. Poverty Rate versus Not Currently Attending School because “Not Interested/Lazy” ............................................................................................ 39
x
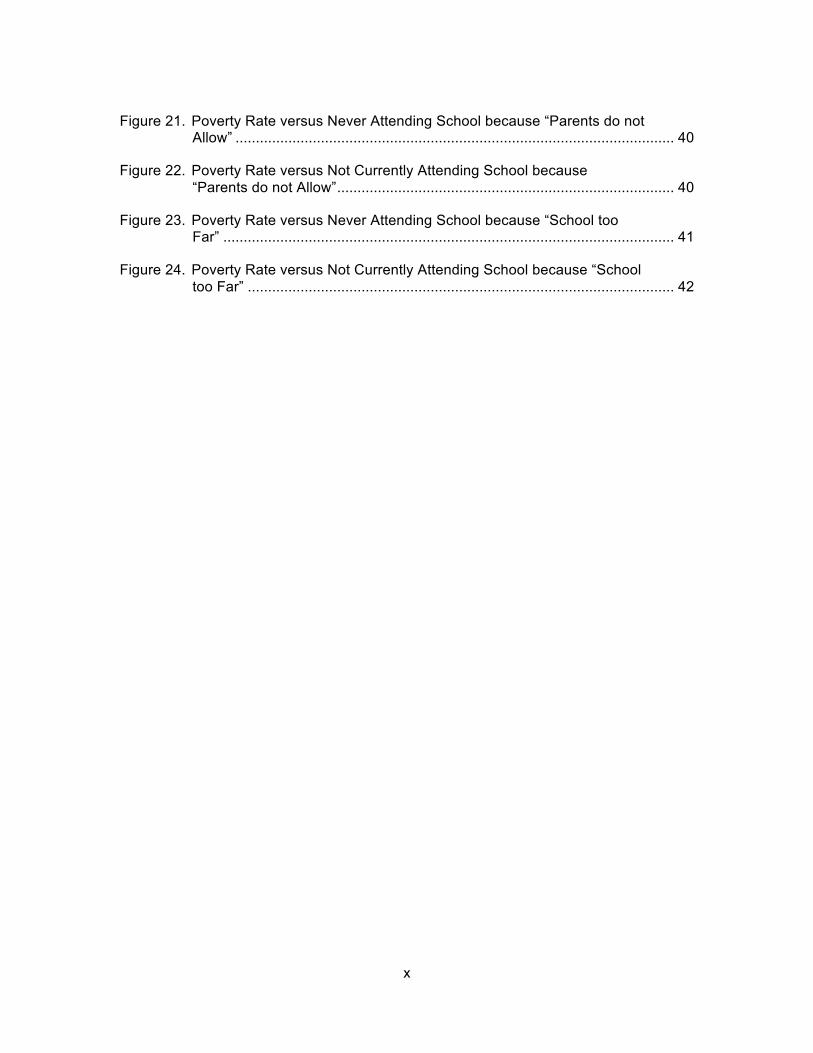
Figure 21. Poverty Rate versus Never Attending School because “Parents do not Allow” ............................................................................................................ 40
Figure 22. Poverty Rate versus Not Currently Attending School because “Parents do not Allow” ................................................................................... 40
Figure 23. Poverty Rate versus Never Attending School because “School too Far” ............................................................................................................... 41
Figure 24. Poverty Rate versus Not Currently Attending School because “School too Far” ......................................................................................................... 42

xi
List of Acronyms
FPE Free Primary Education
GDP Gross Domestic Product
GER Gross Enrollment Rate
KIHBS 2005/06 Kenya Integrated Household Budget Survey 2005/06
KCPE Kenya Certificate of Primary Education
KRCS Kenya Red Cross Society
MDGs Millennium Development Goals
NAR Net Attendance Rate
NARC National Alliance of Rainbow Coalition
UNGEI United Nations Girls Education Initiative
UPE Universal Primary Education

1
1. Introduction
Investment in human capital, through increases in access to and participation in
education, is important to promoting development and economic growth (Lucas, 1990;
Schultz, 1961). Hypotheses supporting this case include claims that the expansion of
education promotes macroeconomic growth, grows personal incomes, reduces social
inequalities and discrimination, improves social indicators, encourages democratic
politics, and reduces conflict (Colclough, 2012, p.136). While some disagreement
persists over the realized benefits of educational expansion and investment in terms of
economic growth (Pritchett, 2001), many argue that there is a body of rigorous evidence
demonstrating the far-reaching effects and benefits of education beyond macro GDP
indicators (Banerjee and Duflo, 2011, p.82). Furthermore, the standing of primary
education as a basic universal human right, irrespective of its impact on economic
growth, has made the promotion of education a major policy focus both in the developing
and developed world.
Debate over the most effective way to successfully promote educational
attainment persists, specifically on whether it is investment in expanding the supply of
education, or encouraging demand for education that is fundamental. Governments,
especially in developing countries, face a debate between investing in infrastructure,
availability, and the overall supply of education, or promoting demand through improving
incentives and the actual benefits to education. Finding an effective balance between
these interacting factors is an ongoing challenge, especially in low-income countries,
where scarce public funds are available for investment in human capital. Achieving
education for all in sub-Saharan Africa has been particularly difficult, where more than
half of the world’s out-of-school children live, while accounting for only 10 percent of the
population of developing countries (Colclough, Al-Samarrai, Rose and Tembon, 2003,
p.1).

2
Kenya is a developing country in sub-Saharan Africa that has experienced
significant development of its education system since independence in 1963, seeing
some successes in the delivery of primary education given its level of development,
while also facing ongoing challenges. The educational policy focus in Kenya has been
one of investing mainly in the supply-side of education, geared toward universal
education. Most recently, Free Primary Education (FPE) was introduced in 2003, which
resulted in the enrollment of an additional 1.2 million pupils (Bold et al, 2010, p.293-94).
Kenya’s education policy has been guided by the view that growth in the education
sector and investments in human capital are crucial to both improving the well-being of
the population and for economic development (Omwami and Omwami, 2009, p.243).
Despite these initiatives, the cost of education in Kenya has restricted both state supply
and local access to education, where both limited government capacity for delivery and
local poverty have resulted in failure to sustain universal access to primary education
(Omwami and Omwami, 2009, p.251). Furthermore, given the challenges of the ‘youth
bulge’ not uncommon on the continent, education is an important identified area for
building human capital, raising worker productivity, promoting youth development and
providing young people with the tools to become effective agents of change (Hope,
2012, p.219,229). This emphasis on youth is reflected and entrenched in the 2010
constitution in its emphasis on youth access to relevant education and training (Hope,
2012, p.229).
The main research question considered in this paper is to assess whether the
main theories in the literature on enrollment, absenteeism and drop out, and generally
when people invest in education and when they do not, are consistent with district-level
data in Kenya. One of the central issues addressed in the literature on education in
developing countries is poverty. Poverty impacts both on the supply and demand side of
education, and is discussed as both a cause and consequence of lack of education;
there is lower quality and quantity of education provision in areas of high poverty, while
the demand for education is also lower in areas of greater poverty. This project primarily
seeks to explore to what extent poverty is correlated with enrollment rates, attendance,
dropouts, educational attainment, and literacy rates in district-level data in Kenya, also
considering the impact of gender. In addition, this paper evaluates the reasons given for
not currently attending and never attending school by district, and whether the reasons

3
given reflect theories of barriers to education presented in the literature and their
relationship with poverty.
This paper explores this research question by examining district-level data from
the Kenya Integrated Household Budgets Survey (KIHBS) 2005/06. First, relationships
between poverty, literacy, gender and education, main themes emerging in the literature,
are analyzed and discussed given the data available from KIHBS 2005/06. Then, the
analysis is pushed further by evaluating the reasons given for young people never
attending and not currently attending school, seeking insights into the supply and
demand-side barriers to education persistent in Kenya.
This research question is significant because substantial energy and resources
are invested in human capital and education in developing countries, Kenya included. It
is important to evaluate the connection between poverty and education, whether the
reasons people give for not attending school are potentially impacted by laudable
supply-side initiatives, and to evaluate what barriers persist despite FPE policy
initiatives. Additional policy implications may be drawn from persisting barriers.
The organization of this paper is as follows. First, this paper provides a review of
the literature on education in developing countries, specifically with regards to the
demand and supply-side factors influencing educational attainment. Second,
background on the education system in Kenya is examined. Third, the empirical
analysis section begins with an explanation of the data and method employed. This is
followed by analysis of the relationships between education, poverty, literacy and
gender, and a subsequent analysis of reasons for non-enrollment in Kenya. Fourth, this
paper closes with policy implications and conclusions based on the findings and
connections with theories from the literature.

4
2. Promoting Education in Developing Countries: A Literature Review
While disagreement persists over the actual realized benefits of educational
expansion and investment on economic growth (Pritchett, 2001), many argue that there
is a significant body of rigorous evidence proving the far-reaching effects and benefits of
education, especially at the household level (Banerjee and Duflo, 2011, p.82).
Hypotheses supporting this case include claims that the expansion of education
promotes economic growth, raises personal incomes, reduces social inequalities and
discrimination, improves social indicators, encourages democratic politics, and reduces
conflict (Colclough, 2012, p.136). Furthermore, the status of primary education as a
basic universal human right, and its prominent standing as one of the Millennium
Development Goals (MDGs), has made the promotion of education a major policy focus
both in the developing and developed world. This literature review is organized around
the debate in the literature over the most effective way to successfully promote
educational attainment, specifically whether it is investment in the supply of education, or
policies promoting demand for education, which should form the central policy focus.
This literature review first evaluates supply-side factors, where scholars generally
argue that investing in the supply of schools and education programs is the most
beneficial way to enhance enrollment and educational attainment. There are two
overarching issues within the supply-side factors of education, including the tension
between quality and quantity and the basic problem of school availability and physical
infrastructure. Second, demand-side influences are reviewed, including at the individual,
household and community level. Demand-side factors centre around incentives to invest
in education and the future, where quality education results from engaged students,
parent monitoring, and teachers facing pressure to teach. Third, the interaction between
supply and demand factors are considered, where poverty impacts both demand for
schooling and the state’s supply. Last, the impact of methodology is considered and
conclusions offered. This review suggests that there is room for further research on the

5
relationships between poverty, enrollment, educational attainment, gender, and
generally to what extent poverty explains reasons for non-enrollment.
2.1. Supply-Side Factors
The main overarching argument on the supply-side of education is that getting
children into a classroom, taught by qualified teachers, is the most important goal of
education policy. This view is evident in the global emphasis of the MDGs, and their
focus on the supply of primary schooling. Certainly in some contexts, it is the physical
provision of education and the supply of school infrastructure, teachers and opportunities
that are limiting factors. For example, Chimombo argues that in the case of Malawi, the
core problem is one of supply, where levels of supply of education by the state, in terms
of physical provision, are so low that the result is a low effective demand for education
(Chimombo, 2005, p.169). Within the literature, the two overarching issues addressed in
terms of the supply of education are the tension between quality and quantity provision,
and the problem of school availability and physical infrastructure.
2.1.1. Quantity versus Quality in Education
There is an evident tension emphasized in the literature between the accessibility
of education to as many people as possible, and the quality of the education being
supplied. Although this is not a challenge unique to developing countries, and is a
debate that rages even in the United States, the danger of sacrificing one for the other in
the resources-scarce context of developing countries is more pronounced. Challenges
faced are diverse across different countries and regions. For example, the PROBE team
(1999) finds that quality is a major factor influencing access, attendance and student
retention in India. In other contexts, for example in Malawi, mere physical access and
supply of schools remains the main issue and limiting factor in demand for education
(Chimombo, 2005, p.169). More generally, the problem of quality education is also
presented at the macro-level as an explanation for the disappointing impact of increased
educational attainment on economic growth (Pritchett, 2001, p.367).

6
A major issue explored in the surveyed literature is the subject of Universal
Primary Education, and divergent conclusions are drawn on the efficacy of such policies
in promoting the overall goals of human capital development and universal access to
basic education. One of the identified problems with these programs is a general focus
on quantity at the expense of quality, and in some cases, “converting the problem” from
a lack of supply to a lack of quality (Chimombo, 2005, p.170). Chimombo found that for
the schools visited in Malawi, the “minimum material conditions for meaningful teaching
and learning to take place were simply not fulfilled”, arguing that the challenge of
universal primary education is not just to enroll children in school, but to ensure a certain
quality standard (2005, p.168-69). Furthermore, he argues that in the case of Malawi,
education for all has been “counter-productive”, where the proclaimed benefits of
education for all will not be realized without a certain quality standard being reached first
(2005, p.168). Wedgwood finds similar conclusions in the case of Tanzania, where
achieving mass access has come at the expense of quality, which in turn has negatively
impacted inequality (2007, p.383). In the case of Free Primary Education (FPE) in
Kenya, there are somewhat more mixed opinions in the literature. Ngware, Oketch,
Ezeh and Mudege find that contrary to expectations, FPE has not actually been a pro-
poor policy in that better-off households are more represented in the FPE program
(2009, p.591). However, Lucas and Mbiti find that FPE, at least in the short-run, has
been welfare enhancing because it promoted access without reducing the test scores of
those who would have been enrolled anyway, thereby enhancing quantity not at the
expense of quality (2012, p.226).
2.1.2. Availability and Physical Infrastructure
A state’s commitment to education can be seen most evidently in the physical
provision of school infrastructure. The availability and physical infrastructure of schools
is a main point on which to draw a distinction between issues of initial access and
dropping out. If initial enrollment is high and subsequent dropout is substantial, then it is
likely that demand-side issues are at play. However if initial enrollment is low, then
issues around the physical accessibility and supply of schools are more likely factors.
The salience of the issue of infrastructure and accessibility differs widely across
contexts. Colclough, Rose and Tembon find that an inadequate supply of schools is still

7
a major problem in many countries, including Guinea and Ethiopia where the distribution
of primary schools is still very irregular (2000, p.21). The PROBE team also addresses
the myth that schools are always available, in terms of both physical and social distance
in India (1999, p.17). As distance between school and home increases, the likelihood a
child will attend decreases (Colclough et al, 2000, p.21). As one may expect, the issue
of accessibility and physical infrastructure is addressed in the literature as a more
pressing issue in rural contexts (Colclough et al, 2000, p.21).
However, Filmer and Pritchett find that the physical availability of schools is not
the key issue in many countries (1999). They find that the pattern in South Asia and
Western and Central Africa is high non-enrollment of poor households, whereas in Latin
America dropout is the main issue (Filmer and Pritchett, 1999, p.86). For example, in
South America they find over 90 percent of the shortfall from primary completion is
children who have completed grade one and yet fail to complete primary school (Filmer
and Pritchett, 1999, p.86), implying that the problem is not in access and infrastructure,
but is instead in retention and demand-related issues.
2.2. Demand-Side Factors
The importance of demand-side factors in influencing education outcomes is
widely argued in the literature. Easterly contends that education is about incentives, and
if the incentives to invest in the future are not present, then investing in expanding
education supply is futile (2001, p.73). With incentives to invest in the future, quality
education will result from engaged students, parental monitoring, and teachers actually
facing pressures to teach (Easterly, 2001, p.82). Easterly’s emphasis on incentives
echoes North’s argument that when the basic institutional framework encourages
redistribution, a very different development of knowledge and skills will result than when
the institutional framework promotes productivity-increasing economic opportunity
(North, 1990, from Pritchett, 2001, p.367). Similarly, Colclough et al suggest that the
cross-country evidence points to the importance of demand-side factors in determining
overall enrollment outcomes (2003, p.88). Characteristics at the individual, household
level, community level influence education outcomes.
8
2.2.1. Individual and Household Level
The most common and prevalent explanation in the literature in explaining under-
enrollment and low retention in developing countries is high poverty and low household
income. The impact of both direct and indirect costs of education is argued to play an
important role in enrollment, attendance and retention; simply not having enough money
to pay for the costs associated with education, as well as the opportunity costs of
attendance, limits schooling attainment. Kabubo-Mariara and Mwabu (2007, p.586) find,
consistent with previous literature, that cost is an important deterrent of primary school
enrollment. Similarly, Colclough et al (2000, p.15) find that in most surveys carried out in
Ethiopia and Guinea, the inability to meet the direct costs of schooling was one of the
most frequently cited reasons of non-attendance, dropping out as well as those who
never enrolled in school. In Columbia and Peru, more than 70 percent of the deficit in
achieving universal primary education is attributable to poverty (1999, p.86). Mukudi
argues that, in Kenya before Free Primary Education (FPE), user fees limited access
and contributed to attrition and absenteeism (2004, p.447). The context of poverty and
low income can create a situation of a conflict of capabilities, where there is a choice to
be made between the capability to be fed and housed, and the capability to be educated
(Githitho-Muriithi, 2009, p.4621).
In addition to the impact of poverty and the lack of ability to pay for school costs,
the poor are particularly vulnerable to income shocks that can cause early drop out or
absenteeism as household circumstances change (Hunter and May, 2003). However,
this is not always the case, and depends on values and commitment at the household
and community level. Hunter and May find that in South Africa, although the poor are
more likely to experience these shocks and episodes of disruption, poor households
attempt to defend the future of their children as their “most important asset and their
pathway out of poverty” (2003, p.32). When certain incentives and values are present,
families may make every attempt to have their children remain in school (Hunter and
May, 2003, p.32). Furthermore, Coclough argues that the evidence shows that poverty
adversely affects both quality and quantity of education, in turn adversely affecting its
income benefits, and preventing the poor from capturing its rewards (2012, p.145).
There can be a “complex interaction between the circumstances of poverty and
9
education which can combine to keep the poor in poverty rather than liberating them
from it” (Colclough, 2012, p.145).
Parental education and motivation is argued to impact educational outcomes.
Higher parental education levels are shown to be associated with increased likeliness of
children staying in school, both in urban and rural contexts in the cases of Zimbabwe,
Nepal and Peru (Ersado, 2004, p.477). Ersado suggests that efforts to enhance adult
education levels can help improve the probability that children remain in school (2004).
Al Samarrai and Peasgood find evidence that the father’s education has a greater
influence on boys’ enrollment, while a mother’s primary education has a greater
influence on girls’ enrollment (1998, p.410). Generally speaking, Al Samarrai and
Peasgood also argue that educated households are able to ensure that their children
receive high levels of education, although the mechanism through which this occurs, for
example whether this is a result of income effects of help with homework, is uncertain
(1998, p.410).
Al Samarrai and Peasgood find that where a child is born in relation to other
siblings may impact schooling decisions (1998, p.397). Ngware et al investigate the
impact of household characteristics on schooling decisions in urban Kenya, and find that
households are disposed towards primary school enrollment if they are richer, smaller,
proximate to a primary school, not residing in informal settlements, and headed by a
more educated female head (2009, p.604). The impacts of disease also influence
attendance and subsequent drop out, where the PROBE team in India find that illness-
related absence is a major concern leading to dropout, implying major synergies with the
presence of schooling and health facilities (PROBE, 1999, p.33).
One of the major issues cited in the literature is the impact of perceptions of and
attitudes towards education at the household level on educational outcomes. In a study
of ten schools in Malawi, Chimombo found that the perception of both students and
parents is often that there is no reason to attend school, as no material benefit seemed
to result (2005, p.168). However, in India the PROBE team found that the “myth of
parental indifference”, although astonishingly widespread and a convenient excuse for
low schooling levels, is not actually the norm, where in reality typical parents are very
keen for their children to receive a good education (1999, p.14). The PROBE team also
10
cites a significant discouragement effect, in that frustration over the quality of education
discourages parents from sending their children to school regularly who, far from
indifferent, are actually genuinely interested in their children’s education (1999, p.27).
Jensen argues that perceptions of returns to education can be very different from
reality, where in the case of the Dominican Republic, perceived returns to secondary
education are low when in reality returns are high (2010, p.515). The sharing of
information on actual returns to education increased years of schooling in this study
(Jensen, 2010, p.544). This is also consistent with Nguyen’s findings in Madagascar,
where remedying imperfect information about the returns to education increased
schooling on average (2008, p.33). Nguyen argues that this sharing of statistical
information on returns to schooling changes schooling decisions, and reduces the gap
between perceived and actual average returns, while test scores and attendance also
improved (2008, p.33).
Furthermore, parents tend to believe that the first few years of education pay
much less than later years of education, when in reality estimates show that income
usually increases proportionally with years of education (Bhanerjee and Duflo, 2011,
p.88). These perceptions encourage parents to invest in one child to go further through
their studies, rather than spreading education out evenly across all their children
(Bhanerjee and Duflo, 2011, p.88). Banerjee and Duflo argue that these perceived
benefits to education create a poverty trap by families behaving as if there is one (2011,
p.89).
Finally, gender is an important issue discussed in development literature
generally, and in great detail in the literature on education in developing countries. Table
1 shows that despite progress in educational outcomes and gender equality in
enrollment over time, substantial gender gaps remain both between OECD and sub-
Saharan African developing countries and within sub-Saharan African developing
countries. The issue of gender equality has been identified by the international
community as a crucial barrier to development, given that two of the eight Millennium
Development Goals (MDGs) address achieving universal participation with gender
equality in primary schooling.

11
Table 1. Education Indicators by Gender
Country Name Indicator 1970 1980 1990 2000 2010 SSA Developing Ratio of girls to boys in primary and secondary 69.0 76.2 81.4 84.5 89.9
OECD Ratio of girls to boys in primary and secondary 90.9 99.8 100.3 100.2 99.5
SSA Developing Primary education, pupils (% female) 41.0 44.0 45.0 45.7 47.7
OECD Primary education, pupils (% female) 48.7 48.7 48.7 48.4 48.6
SSA Developing Gross intake ratio in first grade, male 98.1 88.0 98.9 117.0
OECD Gross intake ratio in first grade, male 101.6 99.9 103.5 103.2 100.9
SSA Developing Gross intake ratio in first grade, female 80.8 74.2 87.0 108.9
OECD Gross intake ratio in first grade, female 101.3 99.6 102.0 100.7 99.6
Source: World Bank World Development Indicators
Figure 1 shows Colclough et al’s representation of the relationships and interplay
between income, education, and gender (2003, p.23). It represents how low income
impacts both the supply and demand side of education, through the impact of low
income on poor households and poor states, causing some children to not attend school.
Then, it is gender relations in households, schools, labour markets and society that are
the proximate cause of the under-enrollment of girls in comparison to boys.
Colclough et al (2003, p.249) find limited evidence that under enrollment at the
primary level, both in general and for girls, is primarily caused by low national incomes.
They find that achieving higher levels of per capita income is neither a necessary nor a
sufficient condition for higher enrollments. They do find that household incomes, for
which GDP per capita figures are a poor proxy, do have a major influence on
enrollments. However, they find that the gendered pattern of enrollment is considerably
impacted by other variables in addition to household income (2000, p.4). Colclough et al
contend that it is the gender roles in society shaping the “balance of incentives for girls
and boys to attend school”, and the shortfall in female enrollment is the product of
cultural practice, rather than poverty, and that these gender inequalities in schooling
outcomes will not necessarily reduce as income rises (ibid). They conclude that
achieving gender parity in education will require more than strictly economic growth, and
will need to be accompanied by broader changes in social systems.

12
Figure 1. Relationships Between Poverty, Gender Relations and Schooling
Source: Colclough et al, 2003, p.23
2.2.2. Community Level
Not unlike the general claims in the development literature about the rural/urban
divide, Birdsall et al argue that in many countries, the rural/urban education gap is the
most important factor in explaining education differentials and attainments (2005, p.338).
For example, in Benin the national completion rate is 39 percent, while the rural rate is
29 percent, and in Mozambique the national completion rate is 26 percent, while the
rural rate is just 12 percent (Birdsall et al, 2005, p.338). However, Mugisha finds that
this “urban advantage” in education does not necessarily hold true in urban slums in
Kenya, where although initial enrollment in urban slums is higher than for rural areas,
beyond the age of 9 for females and 11 for males, rates of enrollment in urban areas
declines faster than for rural areas (2006, p.471).
!
Low Income
Poor States Poor Households
Direct costs of schooling too
high
Child Labour Required
Insufficient School Places
Low School Quality
Some Children do not attend School
Gender relations in
Society Labour Market !
School Household
Fewer Girls than Boys attend School Girls’ Learning Outcomes lower than Boys’

13
In some contexts, regions and countries, discrimination against underprivileged
and disadvantaged groups is endemic and impacts demand for education. For example,
the PROBE report finds that multiple tracks, differentiated facilities, classroom prejudices
and blatant unequal treatment prevent the equal treatment of all pupils within the
education system in India, contributing to a “gradual discouragement from attending”
(1999, p.50). Hanna and Linden measure discrimination in education in India and find
that teachers discriminate against low-caste children, where low-performing, low caste
children and top-performing females lose the most (2009, p.31). They argue that due to
discrimination, disadvantaged groups do not reap the full benefits of education (Hanna
and Linden, 2009, p.31).
There are many incentive schemes and programs intended to stimulate local
demand for education. Several such schemes have been implemented in India, for
example, with the principal goal of making schooling more affordable for parents and
more appealing to children by lowering the real and opportunity costs for parents to send
their children to school (De, Samson and Kumar, 2010, p.23). There are two main
centrally sponsored universal incentive institutions in India, including free textbooks and
the provision of cooked midday meals in schools (De et al., 2010, p.24). These
institutions are intended to reduce the costs of the parents’ decision to send their
children to school, and encourage students to attend as well. However, sometimes the
reality of these programs turns out rather different than intended, as one district collector
explains “the national school-meal programme is a good example of how a well-
intentioned intervention degenerates into a farce due to bureaucratic apathy and
corruption” (PROBE Team, 1999, p.96). Easterly provides similar arguments, where
issues of corruption and teacher accountability result in the ineffectiveness of such
programs (2001, p.83).
Omwami, Neumann and Bwibo find that in the context of Kenya, feeding program
interventions do have an impact on education participation, but that parallel interventions
at the household level are required for children not to lose ground (2011, p.192). Birdsall
et al argue that institutional problems both generally, and within the mentioned incentive
programs, can be addressed through parental and community involvement (2005,
p.341). Communities’ knowledge of their rights and responsibilities, and their

14
involvement in decisions, allows citizens to fully utilize the commitments of the
government through infrastructure and incentive programs.
2.3. Supply-Demand Interaction
Banerjee and Duflo relate the ongoing debate between supply and demand in
education to the similar debate over aid (2011, p.72). They explain that “it seems, then,
that once again the polarized debate between philosophically opposed strategies largely
misses the point…supply and demand strategies have no reason to be mutually
exclusive” (2011, p.82). Given the reviewed literature, it seems that the same theory can
apply to education, where both sides must be promoted for education delivery systems
to be successful and as effective as possible.
Moreover, this focus on the interaction of both the supply and demand sides of
education is consistent with the understanding that the continuity of a student’s
enrollment is a process occurring over time and is not the result of a single event (Hunt,
date, p.44). Hunt argues that drop out is the result of a process rather than a single
event, having more than one proximate cause (Hunt, 2008, p.5). With this
understanding, it is difficult to refute the importance and interconnectedness of both
supply and demand factors on education outcomes. However, Hunt argues that the
literature focuses on one or several explanations for one event in time (dropping out, for
example) and looks at the characteristics of that person rather than a process of inter-
related events, factors and contexts unfolding over time (2008, p.5).
Poverty is both an important, and also very interesting factor influencing
education outcomes explored in the literature, given that it impacts both the supply and
demand sides of education in a way that perpetuates its very existence. As explored
above, poverty influences schooling demand, through lack of money for school costs for
example. Poverty also influences school supply, given that schools serving poorer
communities are of lower quality, with fewer resources and fewer physical schools (Hunt,
2008, p.52). This interaction of poverty between supply and demand creates a situation
where “households from poorer backgrounds who struggle to send their children to
school often find the educational provision they receive lacking, increasing the pressure

15
on children to withdraw” (Hunt, 2008, p.52). Banerjee and Duflo argue similarly that
many school systems are unfair and wasteful, in that those in poverty end up attending
poor quality schools that “make it very clear quite early that they [poorer students] are
not wanted unless they show some exceptional gifts, and they are expected to suffer in
silence until they drop out.” (2011, p.95).
2.4. Analysis and Conclusions
There are several methodological approaches in the surveyed literature. First,
there are scholars who take a quantitative, large-N approach who employ data from
large-scale household surveys or questionnaires (for example, Filmer and Pritchett,
1999) and macro-level data. These scholars tend to find general, macro patterns and
relationships. For example, Filmer and Pritchett (1999) find cross-country patterns in
school enrollment and educational attainment by household wealth. With this approach,
in evaluating their research findings it seems to be a challenge to capture the importance
of the interaction of both supply and demand factors in the process of education
decisions and outcomes. Second, several of the authors approach their research with a
small-n or case study method, where they examine education in the context of one or
several countries, or several cases within a country (for example, Chimombo, 2005;
Hunter and May, 2003). These studies are often able to provide more context-specific
understandings of barriers to education. Third, several of the authors use a mixed-
methods approach, where they are able to understand both some of the macro issues
while also getting an understanding of the processes and causal mechanisms at work
(Colclough et al, 2000; PROBE team, 1999). Fourth, there are several qualitative case
studies that go deeper into context-specific understanding of educational outcomes as a
process over time (for example, Warrington and Kiragu, 2011).
Within this literature, qualitative and quantitative methods seek to answer
different types of questions. For example, Warrington and Kiragu qualitatively attempt to
understand why girls stayed in school despite living in the kinds of circumstances that
could have prevented them from doing so (2012). This is a very different type of
question than understanding quantitatively the characteristics of who drops out of school
and when. Mixed-methods and qualitative cases studies may be better able to address

16
education as a process, instead of a single outcome. Hunt identifies this as a significant
gap within much of the literature, in that “few studies account for the complexities of
access, and the interactive, dynamic nature of factors which may contribute to dropping
out..rather, much of the available literature identifies one factor leading to drop out,
which is identified as the final push or pull out of school” (Hunt, 2008, p.5).
The main point of disagreement in the surveyed literature, and the disconnect
structuring this review, is the debate between whether supply or demand side factors are
the most crucial in determining the success of education programs in developing
countries. The main conclusion emerging from this analysis is the importance of poverty
as an explanatory factor for educational attainment, especially given its impact both on
the supply and demand side of education. Thus, it would be interesting to evaluate,
looking at one developing country with the necessary data available, the relationships
between poverty, enrollment, and literacy as a proxy for educational attainment, to find
to what extent poverty is correlated with education variables. Given the impact of
gender of education outcomes identified in the literature, these relationships may also be
tested with respect to gender. Useful lessons could be drawn from this analysis, lessons
may be learned from outliers, and relevant policy analysis would follow. For example,
the literature on education in Kenya disagrees on the impact of Free Primary Education,
and whether it has been a pro-poor policy and its impact on education quality.
17
3. Education in Kenya
Kenya’s education system was modeled after Britain’s 8-4-4 system, where
students attend four years of primary, four years of secondary, and four years of
university education. An Early Childhood Development (preschool) program targets
young children between 3 and 5 years old. Primary school includes grades (standards)
1 to 8, culminating in national exams at the end of standard 8, the Kenya Certificate of
Primary Education (KCPE). While 93.4 percent of the population aged 6 to 17 years has
attended at least one term of school, only 79 percent of the primary school age
population is attending primary school (KIHBS Basic Report, p.33), and as such delayed
entry, grade repetition and dropouts are not uncommon (Lucas and Mbiti, 2012, p.229).
Since Kenya’s independence from Britain in 1963, education has been an
important focus of the government’s national development strategy. Kenya’s
development plan for 1964 to 1970, African Socialism and Its Application to Planning in
Kenya, stipulated a focus on universal primary education (UPE) (Bold, Sandefur,
Kimenyi, and Mwabu, 2010, p.293). In addition, in 1964 the Ominde Commission was
established to plan the development of the education sector, underscoring UPE as an
important guiding principle (The World Bank, 2009, p.127). Rapid growth in primary
enrollment rates ensued, where the gross enrollment rate increased from 50 percent in
1963 to 105 percent in 1989. However, due to economic decline, structural adjustment
and subsequent implementation of school fees for students, as well as the perceived low
returns to education, enrollment declined to 87 percent by 1999 (Bold et al, 2010, p.293).
In 2003, in response to declining enrollment, newly elected President Mwai Kibaki of the
National Alliance of Rainbow Coalition (NARC) delivered on their promise to implement
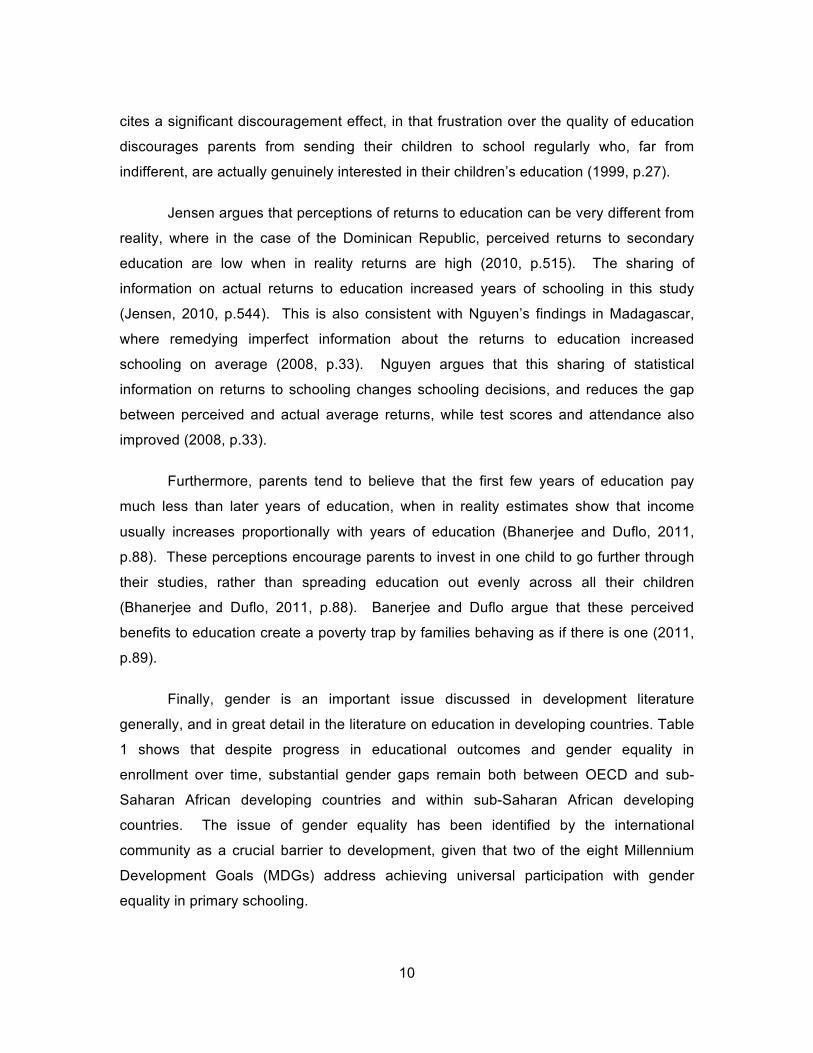
Free Primary Education (FPE) nationwide, and enrollments immediately spiked. Figure
2 shows the proportion of children aged 6 to 15 attending school in 1999 and in 2005/06,
showing a dramatic increase in the proportion of students attending school, an especially
large increase at younger ages.
18
Figure 2. Proportion of Children Aged 6-15 Attending School, 1999 and 2005/06
Source: KIHBS 2005/06 Basic Report, p.35
The initial dramatic increase in enrolment raised concern that such an increase in
the quantity of students attending school without an equivalent increase in funding would
negatively impact the quality of education for students. Consequently, there are
conflicting assessments along different dimensions of the long-term impacts of FPE.
Furthermore, impacts have not been the same across districts, and there is particular
concern of a dramatic lapse in quality in a subset of districts (Bold et al, 2010, p.294).
Bold et al argue that overall FPE has been a successful pro-poor policy, given that it has
led to a 22 percent increase in enrollment with a negligible decline in KCPE scores at the
national level, with larger increases in enrollment in poorer districts and some catch up
with respect to achievement (Bold et al, 2010, p.294). Lucas and Mbiti find that FPE, at
least in the short-run, has been welfare enhancing because it promoted access without
reducing the test scores of those who would have been enrolled anyway, therefore
enhancing quantity not at the expense of quality (2012, p.226). However, Ngware et al
disagree, and find that FPE has not actually been a pro-poor policy given that better-off
households are more represented in the FPE program (2009, p.591). In addition to
impacts on quality, Bold et al argue that the FPE policy altered patron-client
relationships, where client power has been weakened as the role for parental

19
involvement has been restrained (Bold et al, 2010, p.294). This is reason for concern
given that parental support and local accountability have been shown to be important
correlates of educational achievement (ibid, p.294).

20
4. Empirical Analysis and Discussion
4.1. Data and Method
Given Kenya’s commitment to “evidence-based policy making” (KIHBS Basic
Report, p.ii), Kenya’s Central Bureau of Statistics undertook the Kenya Integrated
Household Budget Survey (KIHBS) 2005/06. The goal of KIHBS 2005/06 was to collect
information on a wide spectrum of socio-economic indicators to measure, monitor and
evaluate progress in living standards, providing critical data to the government and
private sector to guide investment and development policy decisions (ibid, p.ii,1). KIHBS
2005/06 was designed to strengthen the national statistical database including the
Consumer Price Index, measures of living standards, poverty and inequality, and the
System of National Accounts (ibid, p.1). The survey was conducted in 1,343 randomly
selected clusters, with 10 households randomly selected with equal probability in each
cluster, resulting in a sample size of 13,430 households. The total sample was designed
to be representative and descriptive of the unequal distribution of the population across
districts, generating representative statistics at the national, provincial and district levels
(ibid, p.3). KIHBS 2005/06 was organized into four questionnaires: a household
questionnaire, household diaries to record consumption and purchases, a market price
questionnaire and a community questionnaire (ibid, p.7).
The empirical analysis in this study uses district-level data from KIHBS 2005/061.
First, this data will be used to examine relationships between enrollment, attendance,
1 The majority of the data in this paper were downloaded from Kenya Open Data, a freely
accessible open data portal making key government data easily available to the public in a
useable format. Kenya is the first country in sub-Saharan Africa to have such a data portal. It has
been acknowledged as an important step to improving governance, reflecting the new
constitution’s commitment to access to information and accountability (Kenya Open Data, Vision).

21
dropping out, poverty, literacy and gender. Second, data from KIHBS 2005/06 is used to
analyze enrollment decisions and the impact of poverty on the reasons given for children
never attending and not currently attending school. The analysis will involve observing
scatterplots and correlation statistics in order to find consistencies and contradictions
between theories presented from the literature and Kenyan data from KIHBS 2005/06.
Although such empirical investigations are often made at the cross-country level
(Filmer and Pritchett, 1999, for example), a comprehensive empirical examination of
these relationships at a district level can provide useful insights. In comparing district-
level data, this study aims to account for characteristics and circumstances at a more
local level, in order to determine micro-determinants of educational outcomes. So while
there were over 13,000 respondents in the KIHBS survey, for the analysis in this paper,
representative data for 69 districts are used as observations. This approach is guided
by Colclough et al’s (2003, p.249) finding that higher per capita income is neither a
necessary nor sufficient condition for solving issues of under-enrollment at the primary
level, both in general and for girls. However, they do find that when narrowing down to
local household-level data, household incomes do influence enrollments. This is not an
uncommon contradiction, and is argued to be similar between returns to investments in
education at the national versus household levels. The apparent disconnect between
national level and household data, as well as the geographic, economic and cultural
diversity across the 69 districts (as of the time of KIHBS 2005/06) in Kenya, is the
motivation for examining district-level data for this evaluation.
4.2. Education, Poverty, Literacy and Gender
Considering the emphasis on the relationship between poverty and education
outcomes in the reviewed literature, this section will seek to explore relationships
between poverty, various education variables, as well as several socio-economic
indicators. As defined in KIHBS 2005/06, the poverty rate is the percent of the
population below the poverty line of KSH 1,562 in rural areas and KSH 2,913 in urban
areas, per person per month. These figures are based on estimated expenditures on
minimum provisions of food and non-food items (Kenya Open Data, Poverty Rate by
District). Although there are issues with defining a poverty line using a headcount index

22
given the complex dynamics of poverty, in the context of this analysis comparing poverty
rates across districts at a given point in time is a useful way to make relative
comparisons between districts.
Table 2 shows descriptive statistics for variables discussed in this section. The
mean district poverty rate is 51 percent, however there is a large range in poverty rates
between districts. The most well off district, Kajiado, only has 12 percent of the
population below the poverty line, whereas Turkana district has a poverty rate of 94
percent. The percentage of those aged 6 to 17 years old who have ever attended
school, but are not necessarily currently in school, falls between 46 and 100 percent,
whereas the percent of those who are currently still in school (i.e. have not dropped out)
is high, between 89 and 99 percent. See Appendix A for the data for each district for
these variables, and Appendix B for a table summarizing the correlation statistics
discussed subsequently.
Table 2. Descriptive Statistics for Variables of Interest
N Min Max Mean Population Adjusted
Mean
St. Dev.
Poverty Rate 69 0.12 0.94 0.51 0.18
% Ever Attended School 69 0.46 1 0.92 0.93 0.12
Currently in School of % Ever Attended 68 0.89 0.99 0.95 0.95 0.02
Primary NAR 68 0.43 0.98 0.78 0.79 0.12
Primary Girls NAR 68 0.34 0.97 0.78 0.80 0.15
Primary Boys NAR 68 0.46 0.98 0.77 0.78 0.11
% 3-5 Year Olds Attending Preschool 68 0.06 0.60 0.27 0.28 0.12
Male Literacy 68 0.27 0.97 0.81 0.79 0.17
Female Literacy 68 0.06 0.94 0.67 0.74 0.21
Literacy 69 0.19 0.95 0.73 0.84 0.19
Gender Literacy Gap 69 -0.02 0.35 0.14 n/a 0.08

23
4.2.1. Poverty and Primary Attendance
Figure 3 shows a scatterplot of the poverty rate versus the percentage of the
population 6 to 17 years old who have ever attended school by district, with a correlation
of -0.586 significant at the .01 level. Overall, 93.4 percent of the population aged 6 to 17
years old has attend primary school for at least one term, with no major gender disparity.
This very high percentage in the majority of districts is not surprising given the
implementation of Free Primary Education (FPE) in 2003. In districts below a poverty
rate of approximately 70 percent, there appears to be no substantial relationship
between poverty and the percentage of young people having attended school for at least
one term. Again this is not unexpected given that school is free and compulsory, and
poverty does not seem to be a major barrier to attending school for at least one school
term. However, above a poverty rate of 70 percent, the percent of young people having
ever attended school drops off fairly dramatically, where the four poorest districts, Wajir,
Turkana, Marsabit, and Mandera, have percentages of those ever attending below 65
percent. Garissa is also an outlier, with a much lower poverty rate of only 50 percent,
where only 60 percent of 6 to 17 year olds have ever attended school.
Figure 3. Poverty Rate versus Percent Ever Attended School by District
Figure 4 shows the poverty rate versus the primary net attendance rate (NAR) by
district. The primary NAR is defined as the percentage of the primary school age
0.0
0.2
0.4
0.6
0.8
1.0
0.0 0.2 0.4 0.6 0.8 1.0
% E
ver A
ttend
ed S
choo
l
Poverty Rate

24
population (6 to 13 years) that is attending primary school. The national primary NAR
was 79 percent, while the secondary NAR was 18.1 percent (KIHBS Basic Report, p.34).
The district-level data shows a negative relationship between poverty and the primary
NAR. The poverty rate is more negatively correlated with the primary NAR than the
percent of those having ever attended school, with a correlation of -0.615, significant at
the .01 level. This relationship shows again, although not as dramatic, a general drop-
off in the primary NAR after a poverty rate of around 70 percent. Thus, the poverty rate
seems to matter less to the primary NAR below a poverty rate of 70 percent, while above
70 percent there is a more observable negative relationship.
Figure 4. Poverty Rate versus Primary NAR by District
Figure 5 and 6 show the relationship between poverty rates and the primary NAR
by gender, with correlations of -0.554 for boys and -0.590 for girls. Poverty has a slightly
higher negative correlation with girls primary NAR than for boys, meaning that changes
in poverty may have a stronger impact on girls attendance than boys. This difference is
consistent with arguments made in the education and gender literature, where some
authors suggest that the elasticity of income with respect to girls’ enrollment is likely to
be higher than for boys, and in the context of poverty and constrained income “if the
costs of sending a girl to school are higher and the benefits lower than those for boys,
the latter will tend to be favoured in the schooling decision (Colclough et al, 2003, p.75).
0.0
0.2
0.4
0.6
0.8
1.0
0.0 0.2 0.4 0.6 0.8 1.0
Prim
ary
Net
Atte
ndan
ce R
atio
Poverty Rate

25
Figure 5. Poverty Rate versus Boys NAR by District
Figure 6. Poverty Rate versus Girls NAR by District
4.2.2. Poverty and Preschool Attendance
Figure 7 shows the poverty rate per district versus the percentage of children
aged 3 to 5 enrolled in preschool. There is a weak negative relationship between a
district’s poverty rate and the percent of 3 to 5 year olds attending preschool, with a
correlation of -0.346 significant at the .01 level. One might expect to find a stronger
0.0
0.2
0.4
0.6
0.8
1.0
0.0 0.2 0.4 0.6 0.8 1.0
Boy
s N
et A
ttend
ance
Rat
io
Poverty Rate
0.0
0.2
0.4
0.6
0.8
1.0
0.0 0.2 0.4 0.6 0.8 1.0
Girl
s N
et A
ttend
ance
Rat
io
Poverty Rate

26
negative correlation, where districts with higher poverty have less young children able to
attend preschool. This could be due to various factors, including for example the
restrictive distance for young children to travel on foot in rural areas. However, there
may be some opposite effects at play to consider, where districts with higher poverty
may also be regions receiving more aid for school feeding programs from the
government and NGOs. In this way, areas that are higher in poverty could plausibly also
have higher enrollments in preschool.
Figure 7. Poverty Rate versus Percent of 3-5 Year Olds Attending School
Turkana district is a noticeable outliner in this scatterplot showing preschool
enrollment in Figure 7, Kenya’s largest district by area at the time of KIHBS 2005/06.
Turkana district has a poverty rate of 94.3 percent, compared with the national average
of 46 percent (Kenya National Bureau of Statistics, p.13). However in Turkana district,
60 percent of 3 to 5 year olds attend school, compared with a national average of 28
percent. This was noted as a “surprising” finding by KIHBS Basic Report (p.35), where
Turkana district may be an exception to the hypothesis of a negative relationship
between poverty rates and the percent of children attending preschool. However,
Turkana may be an exception that proves this rule, given intervention programs aimed at
boosting enrollment.
0.0
0.2
0.4
0.6
0.8
1.0
0.0 0.2 0.4 0.6 0.8 1.0 % o
f 3-5
Yea
r Old
s A
tteni
ng
Scho
ol
Poverty Rate

27
Turkana district is located in the arid northwest of Kenya, bordering Uganda,
South Sudan and Ethiopia. Education and other socioeconomic indicators for Turkana
district are very low compared with other districts and national averages, having a
primary NAR of 44 percent and a literacy rate of 19 percent, compared with national
averages of 79 percent for each. The interaction of drought, poverty, and inadequate
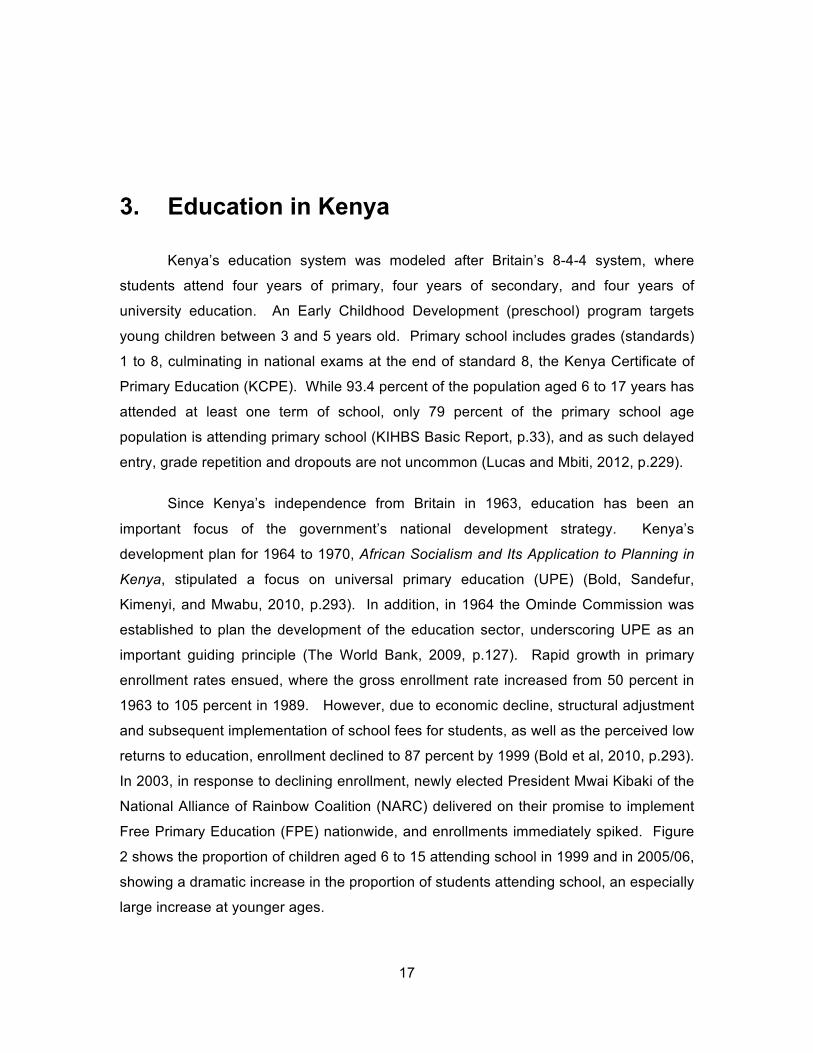
facilities have made “education the exception rather than the rule” in this remote district
(UNEGI, 2005). As Figure 8 shows, the pre-primary gross enrollment rate (GER) in
Turkana district is substantially higher than national averages for both girls and boys.
However, in primary school, Turkana district ranks far below national averages in
enrollment of both boys and girls, a dramatic change between preschool and primary
school.
One intervention in Turkana district that has been particularly pronounced due to
the arid geography, unpredictable rainfall, and frequent and prolonged droughts is
school feeding programs. The World Food Program, UNICEF, and the Kenya Red
Cross Society (KRCS) are providing maize flour, and sometimes UNIMIX, to students in
schools in the region. Provided especially consistently in early childhood development
centres is a high protein porridge, which is the only reliable source of food for some
families (UNGEI, 2005). United Nations Girls Education Initiative (UNGEI) reports that
school feeding programs in Turkana district have been a very effective way of keeping
students, and especially girls in the classroom (2005). It is possible that this outlier exists
due to schools “functioning as feeding centres, life-saving centres” (Palk, CNN, 2011).
Corroborating this explanation, “it has been established in Turkana that most children
are sent to preschool to be fed, and when there is no food the children do not turn up”
(The Kenya NGO CRC Coalition, 2001, p.14). However, this is not the only possible
explanation for this outlier, and it does not necessarily explain the major attrition after
preschool to a primary NAR of only 44 percent in Turkana district. Although preschool
feeding program interventions are one possible explanation for this outlier, more
research is required to explain why preschool enrollment in Turkana is so “surprisingly”
high in comparison with other districts despite the noteworthy difficulties and challenges
faced in the district. Qualitative research in the district may be helpful in explaining high
preschool enrollments and the subsequent drop-off at the primary level.
28
Figure 8. Turkana District Education Profile (2005)
Source: Education Policy and Data Center, Data to Policy, Turkana Kenya District Primary
Education Profile
4.2.3. Poverty and Literacy
Given the central relationship commonly cited in the literature between poverty
and education, one would expect to find a significant negative correlation between
poverty and literacy rates as a proxy for educational attainment. The literacy rate is
defined by KIHBS as the percentage distribution of the population 15 years and older
with the ability to read and write. It is important to note that for KIHBS 2005/06, these
are self-reported figures, and no objective test validated the given responses (KIHBS
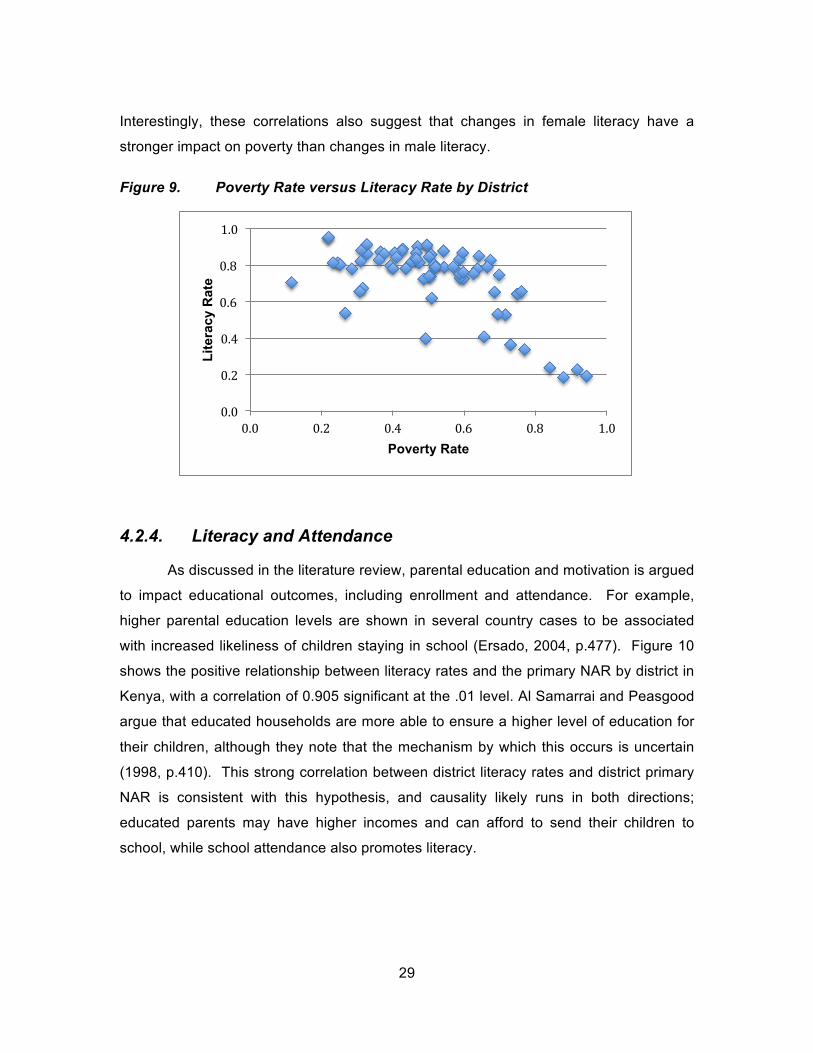
Basic Report, p.8). Figure 9 shows a negative relationship between the poverty rate and
the literacy rate by district, having a significant correlation coefficient of -0.64. This
relationship broken down by gender follows a nearly identical pattern, and both have a
significant correlation at the .01 level of -0.607 for male literacy and -0.647 for female
literacy. Poverty is slightly more negatively correlated with female literacy than male
literacy, meaning that variations in poverty have a stronger impact on female literacy and
educational attainment than for males. This finding is consistent with the theory that the
elasticity of income on girl’s enrollment is higher than for boys in the context of poverty
(Colclough et al, 2003, p.75), and this correlation shows the longer-term impact of
gender discrepancies in enrollment on the literacy of the population 15 years and above.
29
Interestingly, these correlations also suggest that changes in female literacy have a
stronger impact on poverty than changes in male literacy.
Figure 9. Poverty Rate versus Literacy Rate by District
4.2.4. Literacy and Attendance
As discussed in the literature review, parental education and motivation is argued
to impact educational outcomes, including enrollment and attendance. For example,
higher parental education levels are shown in several country cases to be associated
with increased likeliness of children staying in school (Ersado, 2004, p.477). Figure 10
shows the positive relationship between literacy rates and the primary NAR by district in
Kenya, with a correlation of 0.905 significant at the .01 level. Al Samarrai and Peasgood
argue that educated households are more able to ensure a higher level of education for
their children, although they note that the mechanism by which this occurs is uncertain
(1998, p.410). This strong correlation between district literacy rates and district primary
NAR is consistent with this hypothesis, and causality likely runs in both directions;
educated parents may have higher incomes and can afford to send their children to
school, while school attendance also promotes literacy.
0.0
0.2
0.4
0.6
0.8
1.0
0.0 0.2 0.4 0.6 0.8 1.0
Lite
racy
Rat
e
Poverty Rate

30
Figure 10. Literacy Rate versus Primary NAR by District
There is evidence presented in the literature that a father’s education has a
greater impact on boys enrollment, and a mother’s primary education has a greater
influence on girl’s enrollment in Tanzania (Al Samarrai and Peasgood, 1998, p.410).
Although considering district level instead of household data, and examining male
literacy as opposed to a father’s education, the district-level evidence in Kenya generally
corroborates the latter of this hypothesis, while contradicting the former. See Table 3 for
a summary of the correlations between girls and boys NARs, and male and female
literacy. Female literacy is highly correlated with girls NAR, with a correlation of 0.908
significant at the .01 level. Male literacy is also correlated with boys NAR, although to a
lesser extent at 0.729. Male literacy is highly correlated with female attendance, with a
correlation of 0.905, nearly as high as the correlation for girls NAR with female literacy.
Therefore, evaluating district-level data, female enrollment is highly correlated with both
female and male literacy. However, his does not suggest the direction of causality, and
likely it is working in both directions. These correlations imply that enhancing education,
and subsequently literacy, for both genders will positively impact male, and to a greater
extent female, enrollment in primary education. Conversely, this correlation suggests
that actively promoting girls enrollment can also enhance both female and male literacy
in the long-term.
0.0
0.2
0.4
0.6
0.8
1.0
0.0 0.2 0.4 0.6 0.8 1.0
Net
Atte
ndan
ce R
atio
Literacy Rate

31
Table 3. Summary of Literacy and Primary NAR Correlations
Male Literacy Female Literacy
Girls Primary Net Attendance Ratio .905** .908**
Boys Primary Net Attendance Ratio .729** .712**
**Correlation is significant at the .01 level
Figure 11. Literacy Rate versus Girls Primary NAR by District
Figure 12. Literacy Rate versus Boys Primary NAR by District
0.0
0.2
0.4
0.6
0.8
1.0
1.2
0.0 0.2 0.4 0.6 0.8 1.0
Net
Atte
ndan
ce R
atio
Girl
s
Female Literacy Rate
0.0
0.2
0.4
0.6
0.8
1.0
0.0 0.2 0.4 0.6 0.8 1.0
Net
Atte
ndan
ce R
atio
Boy
s
Male Literacy Rate

32
4.3. Enrollment Decisions: Reasons for Not Attending School
For those 6 to 17 years old who responded that they had never attended or were
currently not attending school, KIHBS 2005/06 included follow up questions, seeking the
main reason for this result. Possible responses included the following:
• too young*
• not enough money*
• poor quality schools
• own illness/disability
• family illness/disability
• not interested/lazy*
• parents do not allow*
• had to work*
• school too far*
• school conflicts with beliefs
• other reasons
See Appendix D for a summary of the responses given for never attending and
not currently attending school by district. The purpose of this section is to evaluate the
reasons given qualitatively, to investigate relationships between the reasons given and
poverty rates, and to compare the responses between not and never attending school to
differentiate between barriers to entry versus the continuation of enrollment. Responses
to be discussed in this section are marked with an asterisk above, and are explored in
further detail because they either have a significant correlation with district level poverty,
or have greater than 10 percent of overall responses for either never or not currently
attending school. See Appendix C for a summary of the correlations between each of
the responses and poverty.
4.3.1. Age Barriers
The national average of those 6 to 17 years old who have never attended school
because they were too young was 12.6 percent, and for those who have dropped out

33
and are not currently attending school was only 1.5 percent. Age is therefore an
important barrier to first enrolling in school, but is not a common barrier for those who
have been in school and have subsequently dropped out. This makes sense, given that
if a child enrolls it is because they are believed to have reached the appropriate age, and
this would not be a likely reason for not enrolling following a subsequent dropout. There
is no significant correlation between the poverty rate and too young as the reason for
never or not currently being in school. Age as a reason for never attending school is not
directly intuitively connected with poverty as a barrier to education. However, it is
possible that deeming a child too young for school could perhaps be one of the easier
reasons to admit than some of the other possible responses.
In Kiambu, a district with a relatively low poverty rate of 21.8 percent, 100
percent of the students that have never attended school gave “too young” as the reason.
This means that all students who are not yet in school between ages 6 and 17 are still
deemed to be too young to attend school, with no other barriers to education being cited
by KIHBS 2005/06 respondents. Kiambu also has 99.6 percent of the population aged 6
to 17 years having attended primary school for at least one term, above the national
average of 93 percent, and a primary NAR of 89 percent versus the national average of
79 percent.
Figure 13. Poverty Rate versus Never Attending School because “Too Young”
0.0
0.2
0.4
0.6
0.8
1.0
0.0 0.2 0.4 0.6 0.8 1.0
% G
ave
Too
Youn
g as
Rea
son
Poverty Rate

34
Figure 14. Poverty Rate versus Not Currently Attending School because “Too Young”
4.3.2. Monetary Barriers
Twenty percent of the overall population aged 6 to 17 years reported not having
enough money for school costs as the reason for never attending school, while 45
percent for those who have dropped out cited not having enough money for school costs
as the reason. This implies a large proportion of the school-aged population is unable or
unwilling to take advantage of Free Primary Education (KIHBS Basic Report, p.33). This
common response shows that, for some, there are still financial barriers to education,
and especially sustained attendance, despite this government initiative. The incidental
costs of education remain an influencing factor in attendance and enrollment. Direct
costs can be substantial in influencing schooling decisions, putting even basic education
out of reach for some young people.
One may expect to find a positive relationship between “no money” as a
response and poverty rates, given the direct connection between not having enough
money to attend school and poverty. However, interestingly there is no such apparent
relationship in Figures 15 and 16, and the correlation between poverty and no money for
school fees is insignificant for both not currently and never attending school. Qualitative
research may help to explain the reasons why respondents do not have enough money
for school costs, and in what ways this response is related to poverty.
0.0
0.2
0.4
0.6
0.8
1.0
0.0 0.2 0.4 0.6 0.8 1.0
% G
ave
Too
Youn
g as
Rea
son
Poverty Rate
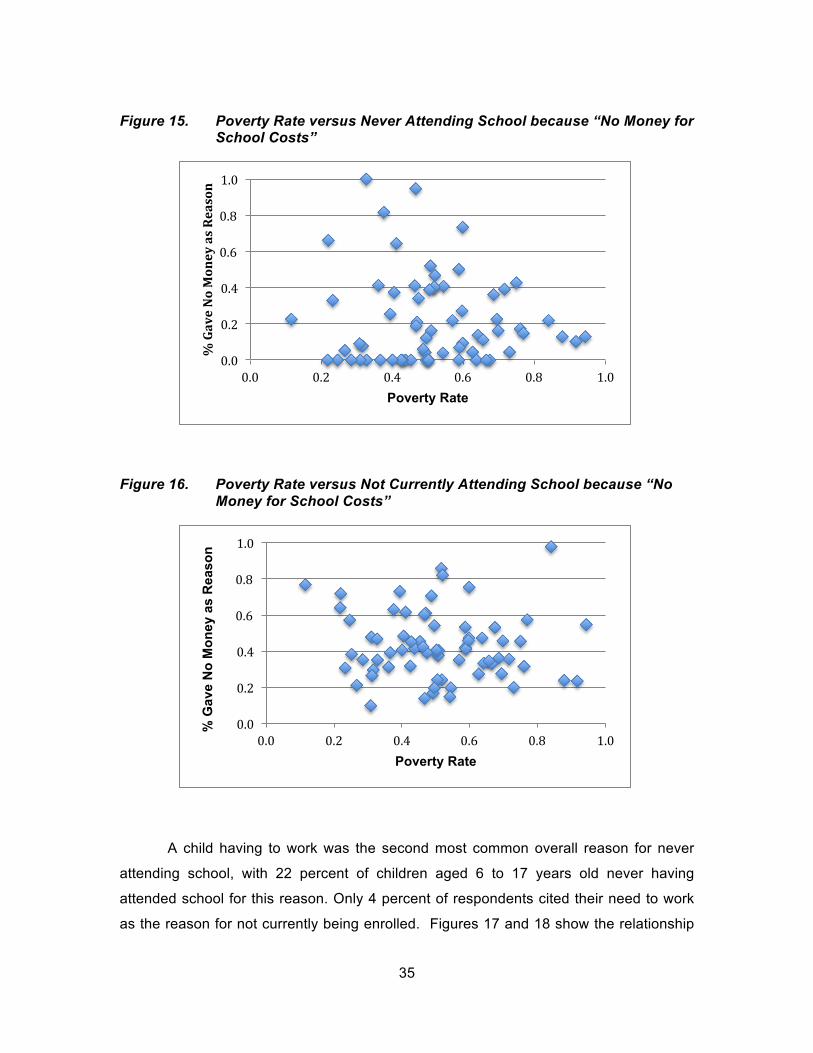
35
Figure 15. Poverty Rate versus Never Attending School because “No Money for School Costs”
Figure 16. Poverty Rate versus Not Currently Attending School because “No Money for School Costs”
A child having to work was the second most common overall reason for never
attending school, with 22 percent of children aged 6 to 17 years old never having
attended school for this reason. Only 4 percent of respondents cited their need to work
as the reason for not currently being enrolled. Figures 17 and 18 show the relationship
0.0
0.2
0.4
0.6
0.8
1.0
0.0 0.2 0.4 0.6 0.8 1.0
% Gave No Money as Reason
Poverty Rate
0.0
0.2
0.4
0.6
0.8
1.0
0.0 0.2 0.4 0.6 0.8 1.0
% G
ave
No
Mon
ey a
s R
easo
n
Poverty Rate

36
between having to work as the reason for not being in school and poverty by district, for
those never having attended school and then those not currently in school. Both have a
positive correlation of 0.33 and 0.4 respectively, both significant at the .01 level. These
correlations are unsurprising, given that children would be more likely to need to work to
support their families in situations of greater poverty, unless the perceived benefits to
schooling outweighed the foregone income.
Having to work may be interpreted as a somewhat similar response as not
having enough money as the reason for not being in school, given that both stem from
cost barriers, and ultimately poverty. However, these responses may indicate a
distinction between direct costs and opportunity costs of attending school. Not enough
money implies that the direct costs of education, including exam fees and uniform costs
for example, are the limiting factor. Perhaps it is not that they need income from their
child, but that they do not have the money to afford these additional costs despite Free
Primary Education (FPE). Not attending school because children have to work indicates
that the family cannot forego the income from their child, or the opportunity cost of their
help in generating household income, for them to attend school. Although both are
interconnected with poverty, having to work may imply a deeper link to poverty, and this
could explain why the response of having to work is correlated with poverty, while not
having enough money is not. Alternatively, these responses could also indicate a
miscalculation of the benefits to education, as discussed in the literature review, where
the perceived monetary benefits to education are underestimated and may be perceived
to be below the long-term returns to education. Overall, the results from KIHBS 2005/06
corroborate Kabubo-Mariara and Mwabu’s conclusion that in Kenya, the cost of sending
a child to school is an important deterrent of primary school enrollment (2007, p. 586).

37
Figure 17. Poverty Rate versus Never Attending School because “Had to Work”
Figure 18. Poverty Rate versus Not Currently Attending School because “Had to Work”
4.3.3. Commitment and Motivation
“Not interested/lazy” as a response is difficult to interpret, and the deeper causes
of this barrier to education in Kenya would require further research. There is no
significant relationship between poverty and “not interested/lazy”, neither for young
0.0
0.2
0.4
0.6
0.8
1.0
0.0 0.2 0.4 0.6 0.8 1.0 % G
ave
Had
to W
ork
as R
easo
n
Poverty Rate
0.0
0.2
0.4
0.6
0.8
1.0
0.0 0.2 0.4 0.6 0.8 1.0 % G
ave
Had
to W
ork
as R
easo
n
Poverty Rate

38
people never attending and not currently attending school. Interestingly, though, it is a
much more common response given for not currently attending versus never attending
school, with a national average of 22.4 and 5.9 percent respectively. Thus, “not
interested/lazy” is a limiting factor for reenrollment, but not initial enrollment, implying
that the motivation behind this response is an experience, factor or context that has
impact once a young person has been enrolled in at least one school term. Qualitative
research would provide insight into what the real mechanism underlying this barrier.
However discouragement effects, discussed in the literature review and by the PROBE
team (1999, p.27, 50) could be a relevant factor, or this response may also be influenced
by a community’s commitment to education.
Figure 19. Poverty Rate versus Never Attending School because “Not Interested/Lazy”
0.0
0.2
0.4
0.6
0.8
1.0
0.0 0.2 0.4 0.6 0.8 1.0 % G
ave
Not
Inte
rest
ed/L
azy
as
Rea
son
Poverty Rate

39
Figure 20. Poverty Rate versus Not Currently Attending School because “Not Interested/Lazy”
Parents not allowing their children to go to school was the most common overall
reason for students never having attended school at 29 percent, while only 4 percent of
respondents cited parental opposition as the reason for not currently being enrolled.
The correlation coefficient between parental opposition as the reason for never attending
school and poverty is 0.25, significant at the .05 level, and the relationship is shown in
Figure 21. The correlation between parental opposition as the reason for not currently
attending school and poverty is insignificant, and shown in figure 22. Given that the
most common reason for children never attending school is parental opposition, as well
as the discussed correlation between district level literacy and enrollment, this evidence
corroborates Ersado’s conclusion that efforts to enhance adult education levels can
improve the probability that children remain in school (2004, p.477). Parent commitment
to their children’s education has been identified in the literature review as paramount,
however understanding the specific reasons that parents do not allow their children to
school through further research would provide useful insight into this prominent barrier to
students ever enrolling in school in Kenya.
0.0
0.2
0.4
0.6
0.8
1.0
0.0 0.2 0.4 0.6 0.8 1.0 % G
ave
Not
Inte
rest
ed/L
azy
as
Rea
son
Poverty Rate

40
Figure 21. Poverty Rate versus Never Attending School because “Parents do not Allow”
Figure 22. Poverty Rate versus Not Currently Attending School because “Parents do not Allow”
4.3.4. Restrictive Distance
School being too far away is not a common reason given for not being in school,
cited by 7.9 percent of those who have never attended and 0.7 percent of those not
currently attending school. However, the response is significantly correlated with
0.0
0.2
0.4
0.6
0.8
1.0
0.0 0.2 0.4 0.6 0.8 1.0 % G
ave
Pare
nts
do n
ot A
llow
as
Rea
son
Poverty Rate
0.0
0.2
0.4
0.6
0.8
1.0
0.0 0.2 0.4 0.6 0.8 1.0 % G
ave
Pare
nts
do n
ot A
llow
as
Rea
son
Poverty Rate

41
poverty by district. For those never attending school and district-level poverty, the
correlation coefficient is .459, and .393 for those not currently attending school with
poverty. The relationships are shown in figures 23 and 24. So although not attending
school because of the restrictive distance is not a prevalent reason for not and never
attending school, it is correlated with poverty.
School being too far as the reason for never attending school, and its correlation
with poverty, exemplifies well the interaction of the supply and demand side issues in
education delivery discussed in the literature review section. Poverty influences
schooling demand, through lack of money to pay for uniforms, notebooks, exam fees,
and other required costs, despite Free Primary Education. Poverty also influences
school supply, given that schools serving poorer communities and districts are often of
lower quality, with fewer resources and fewer physical schools (Hunt, 2008, p.52). This
interaction of poverty between the supply and demand of education results in
“households from poorer backgrounds who struggle to send their children to school often
find the educational provision they receive lacking” (Hunt, 2008, p.52).
Figure 23. Poverty Rate versus Never Attending School because “School too Far”
0.0
0.2
0.4
0.6
0.8
1.0
0.0 0.2 0.4 0.6 0.8 1.0
% G
ave
Scho
ol to
o Fa
r as
Rea
son
Poverty Rate

42
Figure 24. Poverty Rate versus Not Currently Attending School because “School too Far”
0.0
0.2
0.4
0.6
0.8
1.0
0.0 0.2 0.4 0.6 0.8 1.0
% G
ave
Scho
ol to
o Fa
r as
Rea
son
Poverty Rate

43
5. Policy Implications and Conclusions
From this analysis of the KIHBS 2005/06 data, there are several important
findings, policy implications and conclusions to consider. First, the basic analysis in this
study suggests that Kenya’s main focus on the supply of universal primary education, as
opposed to promoting demand through quality reforms for example, is well founded.
The percentage of those aged 6 to 17 years old who have ever attended at least one
school term falls between 46 and 100 percent, while the range of those who have ever
enrolled are currently still attending in school is much higher, between 89 and 99
percent. This suggests that in Kenya, more of the shortfall in enrollment is with initial
enrollment, not drop out, and therefore policy should continue to focus on ensuring the
possibility for students to attend school in the first place. Although issues of quality
education are certainly a concern in Kenya, especially given the expansion of the system
through Free Primary Education (FPE), poor quality schools was a very infrequent
reason for not currently or never attending. This further indicates, although quality is
always relevant, that a policy focus on access is of particular importance at this stage in
the development of Kenya’s education system. This conclusion is encouraging, given
that Colcough et al find that access reforms are much easier to implement than quality
reforms, particularly if they are financed from either general taxation or from aid sources
(2003, p.254-55).
Furthermore, although poverty is moderately correlated with several enrollment
indicators, including primary NAR, below a poverty rate of approximately 70 percent
poverty does not seem to be a distinguishing factor for enrollment rates between
districts. However, despite poverty not having a differential impact on enrollment below a
poverty rate of 70 percent, it is important to note that not having enough money and
needing to work were commonly cited reason for not enrollling in school.
In districts with higher incidences of poverty, supplementary programs
encouraging demand from the poor may enhance the effectiveness of FPE. The data
from KIHBS 2005/06 suggests that Early Child Development Preschool programs are

44
generally very poorly attended, with a national average of 28 percent of those aged three
to five years enrolled in the program. However, in Turkana district 60 percent are
enrolled in the program, despite being the poorest district in Kenya. This outlier lends
some support to the hypothesis that intervention programs, such as feeding programs,
can help to achieve higher enrollment despite high poverty and barriers to education.
Given the emphasis in the MDGs on gender parity in education, there are two
interesting findings regarding poverty, literacy, enrollment and their connections with
gender. First, the correlation between female literacy and poverty is stronger than the
correlation between male literacy and poverty. This means that changes in poverty may
have a greater impact on female literacy than male literacy, as has been discussed in
this paper. However, this correlation also means that enhancing female literacy may
have a greater impact on poverty than changes in male literacy, supporting the case for
promoting female education as a way of alleviating poverty. Second, analysis in this
study found strong correlations between girls primary NAR, and both female and male
literacy. Girls primary NAR is more highly correlated with literacy, both female and male,
than boys primary NAR. These correlations suggest that promoting enrollment and
literacy for both genders is important, while the enrollment of girls is more impacted by
both male and female literacy rates than boys’ enrollment. This finding suggests that
programs promoting demand for education including, for example, awareness
campaigns on the returns to education as discussed in the literature review, can have an
impact on enrollment, and subsequently literacy and poverty. Concurrently, efforts to
enhance adult education and literacy levels could also promote enrollment, as Ersado
finds that this initiative can help improve the probability that children remain in school
(2004). The findings in this paper suggest that such adult education programs could
have a stronger impact on girls’ enrollment.
Emphasized in this paper is the conflict between national data and district level
data, where Colclough et al find that there is little evidence for the view that under-
enrollment at the primary level is a phenomena primarily caused by low national incomes
(2003, p.249). They find that achieving higher levels of per capita income is neither a
necessary nor a sufficient condition for higher enrollment. Bringing the analysis down to
the district-level in this study, there is evidence to suggest that poverty rates at the
district level are significantly correlated with educational outcomes including primary

45
NAR and literacy rates, both overall and by gender. Similarly, Colclough et al (2003,
p.249) do find that household incomes, for which GDP per capita figures are a poor
proxy, have major influence on enrollment, and this study corroborates this finding.
Colclough et al suggest that pro-poor growth is required for problems of enrollment to be
alleviated, and the findings here substantiate this policy implication.
Finally, this paper suggests several areas for further research that may offer
relevant insights into improving education delivery and demand in Kenya. Additional
research designed to help explain Turkana as a “surprising” outlier for preschool
attendance may provide useful strategies for maintaining high enrollment despite rural,
arid settings with populations living largely nomadic lifestyles. Such strategies may
prove to be applicable in other districts, and perhaps countries. In building on KIHBS
2005/06 data on reasons for non-attendance, further qualitative research may afford
valuable information on the mechanisms underlying the reasons for non-attendance. A
deeper understanding, through qualitative research, of the barriers to education can
illuminate ways of overcoming them. For example, understanding what “not
interested/lazy”, a common reason for not currently attending school, really means to
respondents would help to develop strategies for promoting continuous enrollment and
demand for education.
What emerges from this paper is that promoting education in developing
countries is a complicated endeavour. As Colclough et al argue, “there is no single
package of policies that can be applied to address gender inequality in schooling. Local
analysis and diagnosis of the problem is crucial, and the relevance of particular policy
changes depends entirely upon local circumstances” (2003, p.251). As such, further
research is crucial to develop our understanding of strategies to tackle these complex
issues, ensuring education for all in Kenya and beyond.

46
References
Al Samarrai, S., and Peasgood, T. (1998). Educational Attainments and Household Characteristics in Tanzania. Economics of Education Review, 17(4), 395-417.
Banerjee, A., and Duflo, E. (2011). Poor Economics: A Radial Rethinking of the Way to Fight Global Poverty. New York: Public Affairs.
Birdsall, N., Levine, R., and Ibrahim, A. (2005). Towards Universal Primary Education: investments, incentives, and institutions. European Journal of Education, 40(3), 337-349.
Bold, T., Sandefur, J., Kimenyi, M., and Mwabu, G. (2010). Education for Prosperity: Improving Access and Quality. In C. Adam, P. Collier and N. Ndung’u (Eds.), Kenya: Policies for Prosperity (pp.293-308). Oxford: Oxford University Press.
Chimombo, J. (2005). Quantity versus Quality in Education: Case Studies in Malawi. International Review of Education, 51(2/3), 155-172.
Colclough, C., Rose, P., and Tembon, M. (2000). Gender inequalities in primary schooling: the roles of poverty and adverse cultural practice. International Journal of Education Development, 20, 5-27.
Colclough, C., Al-Samarrai, S., Rose, P., and Tembon, M. (2003). Achieving Schooling for All in Africa: Costs: Commitment and Gender. Aldershot: Ashgate Publishing Limited.
Colclough, C. (2012). Education, Poverty and Development: mapping their interconnections. Comparative Education, 48(2), 135-148.
De, A., Khera, R., Samson, M., and Kumar, A.K. (2010). PROBE Revisited: A Report on Elementary Education in India. New Delhi: Oxford University Press.
Easterly, W. (2001). The Elusive Quest for Growth: Economists’ Adventures and Misadventures in the Tropics. Cambridge MA: MIT Press.
Education Policy and Data Centre. Turkana: Kenya District Primary Education Profile. (nd). Retrieved from: http://www.epdc.org/education-data-research/kenya-turkana-district-primary-education-profile.
Ersado, L. (2004). Child Labor and Schooling Decisions in Urban and Rural Areas: Comparative Evidence from Nepal, Peru, and Zimbabwe. World Development, 33(3), 455-480.

47
Filmer, D., and Pritchett, L. (1999). The Effect of Household Wealth on Educational Attainment: Evidence from 35 Countries. Population and Development Review, 25(1)85-120.
Githitho-Muriithi, A. (2009). Education for all and child labour in Kenya: A conflict of capabilities? Procedia Social and Behavioral Sciences, 2, 4613-4621.
Hanna, R., and Linden, L. (2009). Measuring Discrimination in Education. NBER WORKING PAPER SERIES, Working Paper 15057.
Hunt, F. (2008). Dropping Out from School: A Cross Country Review of the Literature. Consortium for Research on Educational Access, Transitions and Equity. CREATE Pathways to Access, Research Monograph No 16.
Hunter, N., and May, J. (2003). Poverty, Shocks and School Disruption Episodes among Adolescents in South Africa. CSDS Working Paper No 35.
Jensen, R. (2010). The (Perceived) Returns to Education and the Demand for Schooling. Quarterly Journal of Economics, 515-548.
Kabubo-Mariara, J., and Mwabu, D. (2007). Determinants of School Enrolment and Education Attainment: Empirical Evidence from Kenya. South African Journal of Economics, 75(3), 572-593.
Kenya Integrated Household Budget Survey 2005/06: Basic Report. (nd). Retrieved from: http://www.knbs.or.ke/pdf/Basic%20Report%20(Revised%20Edition).pdf
Kenya National Bureau of Statistics. (nd). Constituency Report on Well-being in Kenya: Based on the Kenya Integrated Household Budget Survey 2005/06. Retrieved from: http://www.knbs.or.ke/pdf/Constituency%20Report%20on%20Well%20Being.pdf
The Kenya NGO CRC Coalition. (nd). Supplementary Report to Kenya’s First Country Report on Implementation of the UN Convention on the Rights of the Child. Retrieved from: http://www.google.ca/url?sa=t&rct=j&q=&esrc=s&source=web&cd=1&ved=0CCoQFjAA&url=http%3A%2F%2Fwww.crin.org%2Fdocs%2Fresources%2Ftreaties%2Fcrc.28%2FKenya.doc&ei=CtjHUYiQMsi6iwLyw4HwBA&usg=AFQjCNHNN7h7_uMNWyRzngsAkYiVNZeeTA&sig2=qbkmbtiYnXmtopHTdCpTIQ&bvm=bv.48293060,d.cGE
Kenya Open Data. Vision. Retrieved from: https://opendata.go.ke/vision.
Kenya Open Data. Poverty Rate, by District. Retrieved from: https://opendata.go.ke/Poverty/Poverty-Rate-by-District/i5bp-z9aq
Lucas, R. (1990). Why Doesn’t Capital Flow from Rich to Poor Countries? The American Economic Review, 80(2), 92-96.

48
Lucas, A., and Mbiti, I. (2012). Access, Sorting, and Achievement: The Short-Run Effects of Free Primary Education in Kenya. American Economic Journal: Applied Economics, 4(4), 226-253.
Mugisha, F. (2006). School enrollment among urban non-slum, slum and rural children in Kenya: Is the urban advantage eroding? International Journal of Educational Development, 26, 471-482.
Mukudi, E. (2004). The effects of user-fee policy on attendance rates among Kenyan elementary schoolchildren. International Review of Education, 50(5-6), 447-461.
Nguyen, T. (2008). Information, Role Models and Perceived Returns to Education: Experimental Evidence from Madagascar. MIT Working Paper.
Ngware, M., Oketch, M., Ezeh, A., and Mudege, N. (2009). Do household characteristics matter in schooling decisions in urban Kenya? Equal Opportunities International, 28(7), 591-608.
Omwami, E., and Omwami, R. (2009). Public investment and the goal of providing universal access to primary education by 2015 in Kenya. International Journal of Educational Development, 30, 243-253.
Omwami, E., Neumann, C., and Bwibo, N. (2011). Effects of a school feeding intervention on school attendance rates among elementary schoolchildren in rural Kenya. Nutrition, 27, 188-193.
Palk, S. (2011). School food lifeline under threat in drought-hit Kenya. CNN World. Retrieved from: http://www.cnn.com/2011/WORLD/africa/07/28/school.food.drought .kenya/index.html
Pritchett, L. (2001). Where Has All the Education Gone? The World Bank Economic Review, 15(3), 367-391.
PROBE Team (India) & Centre for Development Economics (Delhi, India). (1999). Public Report on Basic Education in India. New Delhi: Oxford University Press.
Schultz, T. (1961). Investment in Human Capital. The American Economic Review, 51(1), 1-17.
The United Nations Girls’ Education Initiative (UNEGI). (2005). Kenya: Regional disparities threaten progress towards education for all. Retrieved from: http://www.ungei.org/infobycountry/kenya_209.html
Warrington, M. and Kiragu, S. (2012). “It makes more sense to educate a boy”: Girls ‘against the odds’ in Kajiado, Kenya. International Journal of Educational Development, 32, 301-309.

49
Wedgwood, R. (2007). Education and poverty reduction in Tanzania. International Journal of Educational Development, 27, 383-396.
The World Bank. (2009). Abolishing School Fees in Africa: Lessons from Ethiopia, Ghana, Kenya, Malawi, and Mozambique. Retrieved from: http://www.unicef.org/publications/files/Aboloshing_School_Fees_in_Africa.pdf

50
Appendices

51
Appendix A. District-Level Education Data
District Name
Poverty Rate
% Ever Attended School
In School of % Ever Attended
Primary NAR
Primary Girls NAR
Primary Boys NAR
% 3-5 Year Olds Attending School
Male Literacy Rate
Female Literacy Rate
Literacy Rate
Kenya 0.046 0.934 0.95 0.79 0.802 0.78 0.282 0.848 0.736 0.079
Baringo 0.5980 0.8640 0.9821 0.7434 0.7230 0.7638 0.2500 0.7138 0.7360 0.7250
Bomet 0.5870 0.9830 0.9604 0.8851 0.9232 0.8487 0.2508 0.8908 0.7739 0.8320
Bondo 0.2460 0.9810 0.9552 0.8615 0.8889 0.8371 0.4779 0.9446 0.7036 0.8130
Bungoma 0.5070 0.9590 0.9696 0.8190 0.8593 0.7772 0.1554 0.8979 0.8197 0.8580
Buret 0.3280 0.9710 0.9743 0.8546 0.8694 0.8386 0.2189 0.8777 0.8443 0.8620
Busia 0.6980 0.9580 0.9380 0.7913 0.7641 0.8153 0.2784 0.8560 0.6453 0.7460 Butere Mumias 0.5160 0.9670 0.9474 0.7915 0.8300 0.7569 0.1392 0.8779 0.7378 0.8020
Embu 0.3660 0.9810 0.9877 0.9089 0.9239 0.8933 0.2572 0.9120 0.8327 0.8720
Garissa 0.4920 0.5950 0.9229 0.5058 0.4455 0.5737 0.1221 0.5345 0.2433 0.3970
Gucha 0.6740 0.9680 0.9789 0.8043 0.8446 0.7671 0.2849 0.9003 0.7564 0.8270
Homa Bay 0.4370 0.9780 0.9379 0.7685 0.7610 0.7772 0.3072 0.9046 0.6691 0.7810
Isiolo 0.7160 0.8530 0.8952 0.6961 0.7403 0.6481 0.3179 0.6251 0.4213 0.5270
Kajiado 0.1160 0.8270 0.9381 0.6781 0.7031 0.6493 0.4572 0.7554 0.6518 0.7050
Kakamega 0.5440 0.9580 0.9557 0.8262 0.8430 0.8181 0.1742 0.8343 0.7512 0.7880
Keiyo 0.4530 0.9790 0.9653 0.8193 0.8592 0.7713 0.3116 0.8553 0.7799 0.8170
Kericho 0.4280 0.9810 0.9686 0.8202 0.8353 0.8067 0.2049 0.9496 0.8112 0.8880
Kiambu 0.2180 0.9960 0.9443 0.8887 0.9335 0.8356 0.5263 0.9725 0.9263 0.9480
Kilifi 0.6850 0.9030 0.9769 0.7227 0.7444 0.7002 0.1247 0.8423 0.4897 0.6510
Kirinyaga 0.2520 1.0000 0.9470 0.7993 0.8109 0.7855 0.4543 0.8486 0.7609 0.8030
Kisii 0.5420 0.9840 0.9827 0.7932 0.8909 0.7036 0.3011 0.9361 0.8281 0.8780
Kisumu 0.4960 0.9650 0.9339 0.8499 0.8648 0.8343 0.2258 0.9561 0.8705 0.9110
Kitui 0.6370 0.9970 0.9647 0.8008 0.8503 0.7514 0.1816 0.8531 0.7202 0.7800
Koibatek 0.5180 0.9720 0.9752 0.8536 0.8684 0.8381 0.2485 0.8591 0.7126 0.7870
Kuria 0.5890 0.9250 0.9580 0.7284 0.7883 0.6819 0.2790 0.8293 0.6258 0.7300
Kwale 0.7490 0.9520 0.9507 0.7297 0.6884 0.7736 0.2164 0.8017 0.4853 0.6420
Laikipia 0.5050 0.9530 0.9550 0.8579 0.7922 0.9074 0.3146 0.8085 0.6547 0.7370
Lamu 0.3160 0.9510 0.9392 0.7987 0.7998 0.7977 0.2637 0.7484 0.5958 0.6730
Lugari 0.4700 0.9880 0.9203 0.8536 0.9010 0.8057 0.3895 0.9281 0.8767 0.9020
Machakos 0.5960 0.9880 0.9472 0.8926 0.9214 0.8641 0.1758 0.9180 0.8231 0.8670
Makueni 0.6410 0.9740 0.9513 0.8670 0.9037 0.8375 0.1559 0.9234 0.7775 0.8490

52
Malindi 0.7600 0.8630 0.9497 0.6725 0.6605 0.6841 0.1657 0.7890 0.5455 0.6560
Mandera 0.8780 0.4630 0.9777 0.4338 0.3392 0.5281 0.0633 0.3101 0.0607 0.1850
Maragua 0.3100 0.9870 0.9255 0.8724 0.8427 0.9034 0.2483 0.8907 0.7594 0.8210
Marakwet 0.6650 0.9710 0.9697 0.7728 0.8097 0.7330 0.1735 0.8290 0.7495 0.7900
Marsabit 0.9170 0.5210 0.9481 0.4580 0.4584 0.4576 0.2585 0.2683 0.1862 0.2270
Mbeere 0.5020 0.9930 0.9444 0.9188 0.9467 0.8900 0.2210 0.9274 0.7667 0.8460
Meru Central 0.2330 0.9610 0.9095 0.8911 0.8937 0.8887 0.0981 0.8130 0.8136 0.8130
Meru North 0.3080 0.9620 0.6560
Meru South 0.3120 0.9960 0.9671 0.9033 0.9313 0.8729 0.2250 0.9352 0.8316 0.8820
Migori 0.4250 0.9970 0.9555 0.8016 0.7715 0.8378 0.4280 0.9559 0.8136 0.8790
Mombasa 0.3760 0.9330 0.8922 0.6753 0.7399 0.6052 0.3439 0.9148 0.8146 0.8620
Moyale 0.6560 0.8040 0.9508 0.6627 0.6332 0.9604 0.1154 0.5066 0.3016 0.4070
Mt. Elgon 0.5870 0.9760 0.9769 0.7462 0.7774 0.7069 0.1666 0.8066 0.6983 0.7520
Muranga 0.2850 0.9940 0.9400 0.9753 0.9708 0.9811 0.2900 0.8397 0.7299 0.7800
Mwingi 0.6260 0.9710 0.9676 0.7994 0.8286 0.7675 0.2217 0.8559 0.6624 0.7540
Nairobi 0.2200 0.9780 0.9599 0.8897 0.9169 0.8612 0.5892 0.9658 0.9395 .95300
Nakuru 0.3940 0.9800 0.9230 0.8384 0.8789 0.8002 0.3109 0.8444 0.7458 0.7970
Nandi 0.4740 0.9770 0.9752 0.7974 0.8139 0.7813 0.1489 0.8203 0.8055 0.8130
Narok 0.2670 0.8610 0.9499 0.6107 0.5520 0.6600 0.1625 0.5735 0.5021 0.5370
Nyamira 0.4660 0.9900 0.9653 0.8653 0.8588 0.8726 0.3780 0.9065 0.8346 0.8670
Nyandarua 0.4630 0.9890 0.9383 0.9324 0.9431 0.9229 0.3181 0.8933 0.7879 0.8380
Nyando 0.4670 0.9840 0.9478 0.7845 0.7290 0.8373 0.3251 0.9040 0.7689 0.8320
Nyeri 0.3270 0.9950 0.9283 0.8702 0.8428 0.8982 0.3765 0.9520 0.8791 0.9130
Rachuonyo 0.4050 0.9760 0.9686 0.8483 0.8394 0.8609 0.5628 0.9232 0.8191 0.8680
Samburu 0.7300 0.7470 0.9648 0.5698 0.3524 0.6149 0.3068 0.4966 0.2369 0.3630
Siaya 0.4010 0.9610 0.9236 0.8488 0.8588 0.8381 0.2545 0.8921 0.6868 0.7820
Suba 0.5200 0.9870 0.9801 0.8306 0.8558 0.8074 0.3052 0.9005 0.6941 0.7900
Taita Taveta 0.5690 0.9730 0.9386 0.8549 0.8818 0.8307 0.2865 0.9286 0.6772 0.7910
Tana River 0.7690 0.7370 0.9679 0.5691 0.5129 0.6207 0.1899 0.4020 0.2763 0.3370
Teso 0.5980 0.9360 0.9794 0.7821 0.7974 0.7681 0.1377 0.8421 0.6814 0.7600
Tharaka 0.4870 0.9490 0.9567 0.7967 0.7801 0.8249 0.0614 0.8324 0.6243 0.7230
Thika 0.3610 0.9670 0.9153 0.8589 0.8849 0.8314 0.3575 0.9088 0.7585 0.8280
Trans Mara 0.5090 0.9420 0.9621 0.6526 0.7100 0.6030 0.1471 0.7056 0.5341 0.6190
Trans Nzoia 0.5020 0.9140 0.9688 0.7434 0.7389 0.7489 0.3140 0.7661 0.7118 0.7390
Turkana 0.9430 0.6450 0.9529 0.4414 0.4059 0.4740 0.6003 0.2931 0.0786 0.1910
Uasin Gishu 0.4960 0.9670 0.9296 0.8484 0.8897 0.8114 0.4292 0.9327 0.8845 0.9100
Vihiga 0.4110 0.9700 0.9153 0.8064 0.8367 0.7706 0.1752 0.8951 0.7943 0.8420
Wajir 0.8400 0.6070 0.9724 0.5294 0.4077 0.6081 0.0731 0.3878 0.0910 0.2360
West Pokot 0.6940 0.7130 0.9436 0.5628 0.5230 0.5962 0.2334 0.6032 0.4638 0.5310
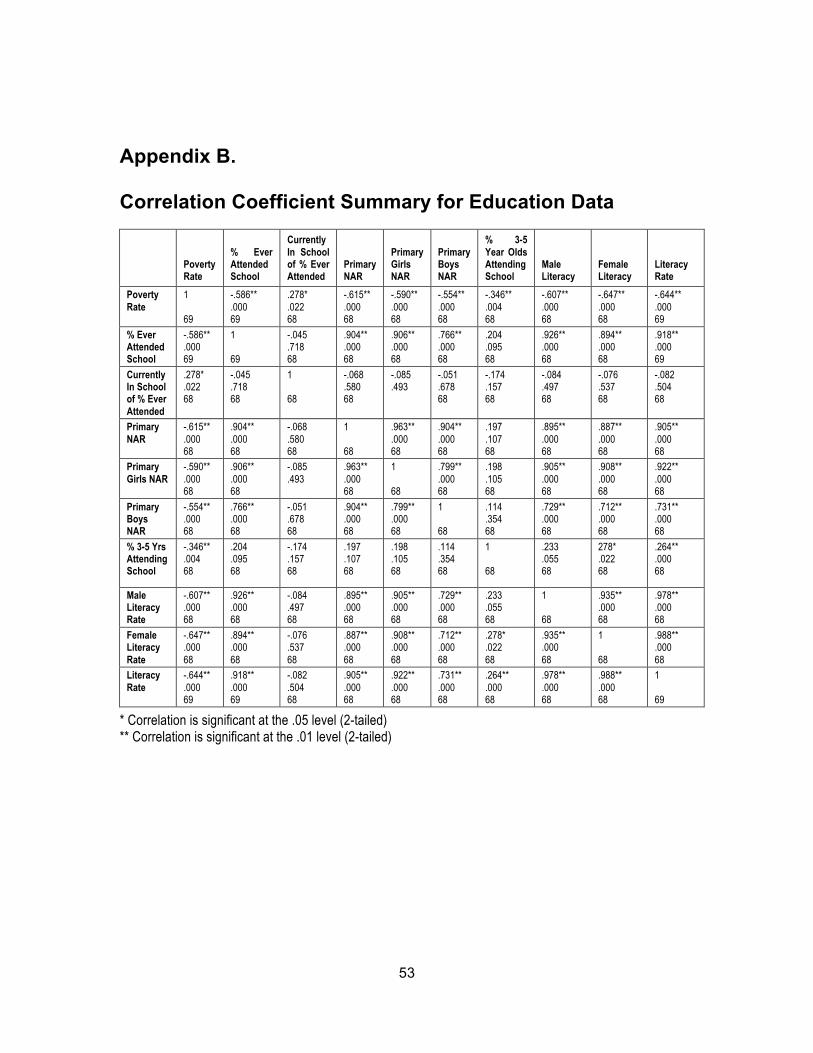
53
Appendix B. Correlation Coefficient Summary for Education Data
Poverty Rate
% Ever Attended School
Currently In School of % Ever Attended
Primary NAR
Primary Girls NAR
Primary Boys NAR
% 3-5 Year Olds Attending School
Male Literacy
Female Literacy
Literacy Rate
Poverty Rate
1 69
-.586** .000 69
.278*
.022 68
-.615** .000 68
-.590** .000 68
-.554** .000 68
-.346** .004 68
-.607** .000 68
-.647** .000 68
-.644** .000 69
% Ever Attended School
-.586** .000 69
1 69
-.045 .718 68
.904**
.000 68
.906**
.000 68
.766**
.000 68
.204
.095 68
.926**
.000 68
.894**
.000 68
.918**
.000 69
Currently In School of % Ever Attended
.278*
.022 68
-.045 .718 68
1 68
-.068 .580 68
-.085 .493
-.051 .678 68
-.174 .157 68
-.084 .497 68
-.076 .537 68
-.082 .504 68
Primary NAR
-.615** .000 68
.904**
.000 68
-.068 .580 68
1 68
.963**
.000 68
.904**
.000 68
.197
.107 68
.895**
.000 68
.887**
.000 68
.905**
.000 68
Primary Girls NAR
-.590** .000 68
.906**
.000 68
-.085 .493
.963**
.000 68
1 68
.799**
.000 68
.198
.105 68
.905**
.000 68
.908**
.000 68
.922**
.000 68
Primary Boys NAR
-.554** .000 68
.766**
.000 68
-.051 .678 68
.904**
.000 68
.799**
.000 68
1 68
.114
.354 68
.729**
.000 68
.712**
.000 68
.731**
.000 68
% 3-5 Yrs Attending School
-.346** .004 68
.204
.095 68
-.174 .157 68
.197
.107 68
.198
.105 68
.114
.354 68
1 68
.233
.055 68
278* .022 68
.264**
.000 68
Male Literacy Rate
-.607** .000 68
.926**
.000 68
-.084 .497 68
.895**
.000 68
.905**
.000 68
.729**
.000 68
.233
.055 68
1 68
.935**
.000 68
.978**
.000 68
Female Literacy Rate
-.647** .000 68
.894**
.000 68
-.076 .537 68
.887**
.000 68
.908**
.000 68
.712**
.000 68
.278*
.022 68
.935**
.000 68
1 68
.988**
.000 68
Literacy Rate
-.644** .000 69
.918**
.000 69
-.082 .504 68
.905**
.000 68
.922**
.000 68
.731**
.000 68
.264**
.000 68
.978**
.000 68
.988**
.000 68
1 69
* Correlation is significant at the .05 level (2-tailed) ** Correlation is significant at the .01 level (2-tailed)
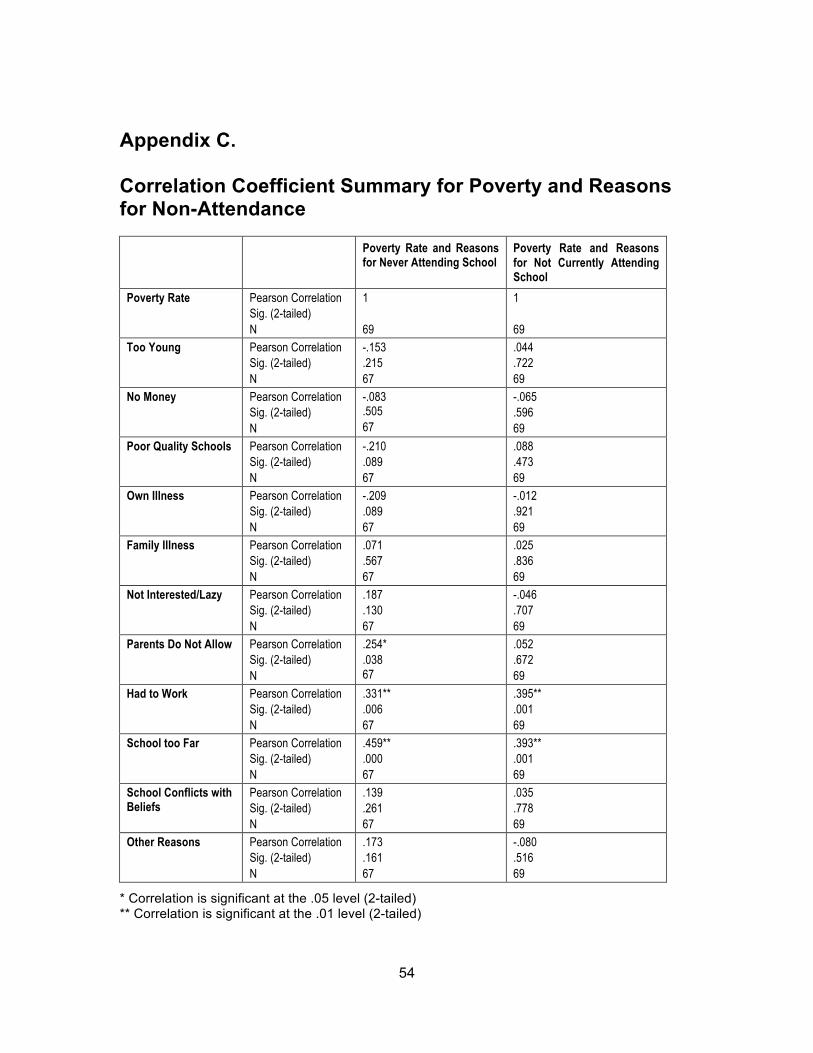
54
Appendix C. Correlation Coefficient Summary for Poverty and Reasons for Non-Attendance
Poverty Rate and Reasons for Never Attending School
Poverty Rate and Reasons for Not Currently Attending School
Poverty Rate Pearson Correlation Sig. (2-tailed) N
1 69
1 69
Too Young Pearson Correlation Sig. (2-tailed) N
-.153 .215 67
.044
.722 69
No Money Pearson Correlation Sig. (2-tailed) N
-.083 .505 67
-.065 .596 69
Poor Quality Schools Pearson Correlation Sig. (2-tailed) N
-.210 .089 67
.088
.473 69
Own Illness Pearson Correlation Sig. (2-tailed) N
-.209 .089 67
-.012 .921 69
Family Illness Pearson Correlation Sig. (2-tailed) N
.071
.567 67
.025
.836 69
Not Interested/Lazy Pearson Correlation Sig. (2-tailed) N
.187
.130 67
-.046 .707 69
Parents Do Not Allow Pearson Correlation Sig. (2-tailed) N
.254*
.038 67
.052
.672 69
Had to Work Pearson Correlation Sig. (2-tailed) N
.331**
.006 67
.395**
.001 69
School too Far Pearson Correlation Sig. (2-tailed) N
.459**
.000 67
.393**
.001 69
School Conflicts with Beliefs
Pearson Correlation Sig. (2-tailed) N
.139
.261 67
.035
.778 69
Other Reasons Pearson Correlation Sig. (2-tailed) N
.173
.161 67
-.080 .516 69
* Correlation is significant at the .05 level (2-tailed) ** Correlation is significant at the .01 level (2-tailed)

55
Appendix D. Reasons for Non-Attendance by District Percentage Distribution of Population (6-17 years) Who Never Attended School by
Reason and District
District Name Too Young
No Money
Poor Quality Schools
Own Illness
Family Illness
Not Interested/Lazy
Parents Do Not Allow
Had to Work
School too Far
School Conflicts with Beliefs
Kenya 0.126 0.198 0.019 0.066 0.033 0.059 0.291 0.224 0.079 0.052
Baringo 0.0680 0.0930 0.0000 0.0200 0.0000 0.3570 0.5270 0.0760 0.1030 0.0000
Bomet 0.5000 0.5000 0.0000 0.0000 0.0000 0.0000 0.0000 0.0000 0.0000 0.0000
Bondo 0.3580 0.0000 0.0000 0.4540 0.0000 0.0000 0.1880 0.0000 0.0000 0.0000
Bungoma 0.1210 0.5200 0.0000 0.1180 0.1700 0.1210 0.1210 0.0000 0.0000 0.0000
Buret 0.4720 0.0000 0.5280 0.0000 0.0000 0.0000 0.0000 0.0000 0.0000 0.0000
Busia 0.4010 0.1620 0.0000 0.0000 0.0000 0.1500 0.0000 0.0000 0.0000 0.0000
Butere Mumias 0.3000 0.3970 0.0000 0.0230 0.0000 0.0000 0.1130 0.0000 0.0000 0.0000
Embu 0.3810 0.0000 0.0000 0.5420 0.0000 0.0770 0.0000 0.0000 0.0000 0.0000
Garissa 0.0220 0.0420 0.0240 0.0000 0.0030 0.0000 0.5810 0.1580 0.2030 0.0030
Gucha 0.5360 0.0000 0.0000 0.0000 0.0000 0.0000 0.0000 0.0000 0.0000 0.0000
Homa Bay 1.0000 0.0000 0.0000 0.0000 0.0000 0.0000 0.0000 0.0000 0.0000 0.0000
Isiolo 0.0390 0.3920 0.0000 0.0610 0.0000 0.0520 0.3280 0.3380 0.3560 0.0140
Kajiado 0.0250 0.2260 0.0000 0.0250 0.0000 0.0870 0.4700 0.5570 0.0000 0.2440
Kakamega 0.4940 0.4080 0.0000 0.0000 0.0320 0.0000 0.0000 0.0000 0.0000 0.0000
Keiyo 0.5690 0.0000 0.0000 0.4310 0.0000 0.0000 0.0000 0.0000 0.0000 0.0000
Kericho 0.0000 0.0000 0.0000 0.4490 0.0000 0.0000 0.1220 0.0000 0.0000 0.0000
Kiambu 1.0000 0.0000 0.0000 0.0000 0.0000 0.0000 0.0000 0.0000 0.0000 0.0000
Kilifi 0.1770 0.3610 0.0000 0.0510 0.0000 0.1140 0.0000 0.0000 0.0510 0.0000
Kirinyaga
Kisii 0.4810 0.0390 0.0000 0.0000 0.0000 0.0000 0.0000 0.0000 0.0000 0.0000
Kisumu 0.0870 0.0000 0.0690 0.8440 0.0000 0.0000 0.0000 0.0000 0.0000 0.0000
Kitui 0.0000 0.0000 0.0000 1.0000 0.0000 0.0000 0.0000 0.0000 0.0000 0.0000
Koibatek 0.3080 0.4040 0.0000 0.1010 0.0000 0.0000 0.0930 0.0000 0.0000 0.0000
Kuria 0.5540 0.0690 0.0000 0.0000 0.0570 0.0240 0.0440 0.0000 0.0000 0.0000
Kwale 0.2500 0.4260 0.0000 0.0250 0.0000 0.0000 0.1290 0.0000 0.0000 0.0000
Laikipia 0.1120 0.3880 0.0000 0.0000 0.0000 0.4180 0.0000 0.0000 0.0000 0.0000
Lamu 0.2170 0.0780 0.0000 0.0760 0.0000 0.0670 0.1810 0.0900 0.0000 0.0000
Lugari 0.3520 0.2100 0.0000 0.0000 0.0000 0.0360 0.0000 0.0000 0.0000 0.0000
Machakos 0.0000 0.2710 0.0000 0.5350 0.0000 0.1940 0.0000 0.0000 0.0000 0.0000

56
Makueni 0.3490 0.1380 0.0000 0.2550 0.0000 0.0000 0.1000 0.1000 0.0000 0.0000
Malindi 0.2040 0.1730 0.0000 0.0000 0.0000 0.1590 0.0540 0.0000 0.0000 0.0000
Mandera 0.0530 0.1280 0.0530 0.0100 0.0330 0.0390 0.2650 0.2660 0.0550 0.0850
Maragua 0.2710 0.0000 0.0000 0.7290 0.0000 0.0000 0.0000 0.0000 0.0000 0.0000
Marakwet 0.4270 0.0000 0.0000 0.0000 0.0000 0.0000 0.0140 0.1680 0.0000 0.0000
Marsabit 0.0710 0.1020 0.0000 0.0130 0.0130 0.0380 0.1840 0.2430 0.2840 0.0000
Mbeere 0.5830 0.0000 0.0000 0.0000 0.0000 0.0000 0.0000 0.0000 0.0000 0.0000
Meru Central 0.1350 0.3290 0.3290 0.2360 0.0000 0.0000 0.0000 0.0000 0.0000 0.0000
Meru North 0.1410 0.0890 0.1220 0.0000 0.0000 0.0890 0.1220 0.0000 0.0000 0.0000
Meru South
Migori 0.0560 0.0000 0.0000 0.3220 0.2300 0.0000 0.0000 0.2440 0.0000 0.0000
Mombasa 0.0480 0.8170 0.0000 0.0000 0.0000 0.0000 0.1340 0.0000 0.0000 0.0000
Moyale 0.0770 0.1100 0.0000 0.0000 0.0000 0.0180 0.7220 0.6470 0.0330 0.0000
Mt. Elgon 0.5760 0.0000 0.1070 0.0000 0.0000 0.1380 0.0810 0.0000 0.0000 0.0000
Muranga 0.0000 0.0000 0.0000 1.0000 0.0000 0.0000 0.0000 0.0000 0.0000 0.0000
Mwingi 0.2630 0.0430 0.0000 0.5420 0.0000 0.0000 0.1530 0.0000 0.0000 0.0000
Nairobi 0.1990 0.6620 0.0180 0.1210 0.0000 0.0000 0.0180 0.3310 0.0000 0.0000
Nakuru 0.0670 0.2530 0.0000 0.4790 0.0140 0.0000 0.0000 0.1860 0.0000 0.0000
Nandi 0.0870 0.3410 0.0000 0.0000 0.2050 0.0000 0.0000 0.0000 0.0000 0.0000
Narok 0.1540 0.0520 0.0180 0.0360 0.0200 0.0130 0.5240 0.0730 0.0360 0.0000
Nyamira 0.0520 0.9480 0.0000 0.0000 0.0000 0.0000 0.0000 0.0000 0.0000 0.0000
Nyandarua 0.5890 0.4110 0.0000 0.0000 0.0000 0.0000 0.0000 0.0000 0.0000 0.0000
Nyando 0.1780 0.1890 0.0000 0.3110 0.0000 0.0000 0.0000 0.0000 0.0000 0.0000
Nyeri 0.0000 1.0000 0.0000 0.0000 0.0000 0.0000 0.0000 0.0000 0.0000 0.0000
Rachuonyo 0.0110 0.3740 0.0000 0.1650 0.1340 0.0000 0.0000 0.0000 0.0000 0.0000
Samburu 0.0310 0.0430 0.0000 0.0210 0.0210 0.1050 0.7090 0.7680 0.0100 0.0000
Siaya 0.9890 0.0000 0.0000 0.0110 0.0000 0.0000 0.0000 0.0000 0.0000 0.0000
Suba 0.0000 0.4680 0.0000 0.3940 0.5320 0.0000 0.0000 0.0000 0.0000 0.0000
Taita Taveta 0.0000 0.2180 0.0000 0.1230 0.0000 0.0000 0.6590 0.0000 0.0000 0.0000
Tana River 0.1250 0.1470 0.0000 0.0370 0.0030 0.0610 0.4490 0.3760 0.0610 0.3900
Teso 0.1040 0.7340 0.0000 0.0000 0.0000 0.0620 0.0000 0.0000 0.0000 0.0000
Tharaka 0.5080 0.0590 0.0000 0.1000 0.0000 0.0000 0.0410 0.0000 0.1430 0.0000
Thika 0.0000 0.4130 0.0000 0.4330 0.0000 0.0000 0.0670 0.0000 0.0000 0.0000
Trans Mara 0.2600 0.1620 0.0000 0.0510 0.0000 0.0580 0.2550 0.0700 0.0000 0.0000
Trans Nzoia 0.3450 0.0000 0.0900 0.0830 0.0000 0.0000 0.0740 0.0000 0.0500 0.0000
Turkana 0.0140 0.1280 0.0000 0.1310 0.2100 0.0580 0.2590 0.5580 0.2340 0.0480
Uasin Gishu 0.3620 0.1220 0.0000 0.0000 0.1140 0.3660 0.0000 0.0000 0.0000 0.0000
Vihiga 0.1790 0.6430 0.0000 0.0000 0.0000 0.0000 0.1810 0.0000 0.0000 0.0000
Wajir 0.0740 0.2180 0.0270 0.0380 0.0050 0.0900 0.3470 0.5090 0.0740 0.0000
West Pokot 0.0320 0.2250 0.0220 0.0000 0.0000 0.0110 0.6790 0.1210 0.1050 0.2810

57
Percentage Distribution of Population (6-17 years) Who Ever Attended School and are not Currently Attending by Reason and District
District Name Too Young
No Money
Poor Quality Schools
Own Illness
Family Illness
Not Interested/Lazy
Parents Do Not Allow
Had to Work
School too Far
School Conflicts with Beliefs
Kenya 0.015 0.455 0.004 0.042 0.015 0.224 0.042 0.037 0.007 0.007
Baringo 0.0350 0.4720 0.0000 0.0860 0.0000 0.0000 0.1590 0.2490 0.0000 0.0000
Bomet 0.0000 0.4190 0.0000 0.1130 0.0000 0.4080 0.0000 0.0000 0.0000 0.0000
Bondo 0.0000 0.5720 0.0000 0.0230 0.0000 0.2720 0.0000 0.0160 0.0000 0.0000
Bungoma 0.0000 0.3760 0.0000 0.0830 0.0000 0.1920 0.0000 0.0000 0.0000 0.0000
Buret 0.0000 0.3500 0.0000 0.0000 0.0000 0.3410 0.0000 0.0000 0.0000 0.0000
Busia 0.0000 0.4570 0.0000 0.0000 0.0000 0.3000 0.1010 0.0000 0.0000 0.0000
Butere Mumias 0.0000 0.8570 0.0000 0.0150 0.0670 0.0850 0.0290 0.0000 0.0000 0.0000
Embu 0.0000 0.3910 0.0000 0.6090 0.0000 0.0000 0.0000 0.0000 0.0000 0.0000
Garissa 0.1490 0.1670 0.0000 0.0290 0.0000 0.0000 0.0770 0.2370 0.1250 0.0000
Gucha 0.0000 0.5300 0.0000 0.0000 0.0000 0.6570 0.2840 0.0000 0.0000 0.0000
Homa Bay 0.0340 0.4140 0.0000 0.1150 0.0000 0.1730 0.0000 0.0000 0.0000 0.0000
Isiolo 0.0000 0.3560 0.0000 0.0560 0.0000 0.3730 0.1850 0.2140 0.2960 0.0000
Kajiado 0.0000 0.7670 0.0000 0.0000 0.0000 0.0850 0.0850 0.0850 0.0000 0.0850
Kakamega 0.0800 0.1970 0.0000 0.1800 0.1440 0.3640 0.1070 0.1270 0.0200 0.0000
Keiyo 0.0000 0.4530 0.0890 0.1740 0.0000 0.3560 0.0000 0.0000 0.0000 0.0000
Kericho 0.1090 0.4520 0.0000 0.0000 0.0000 0.2780 0.1090 0.0000 0.0000 0.0000
Kiambu 0.0000 0.6400 0.0000 0.0000 0.0000 0.1610 0.7000 0.0000 0.0000 0.0000
Kilifi 0.0000 0.3620 0.0000 0.3010 0.0000 0.1980 0.0000 0.0000 0.0000 0.0000
Kirinyaga 0.0000 0.3820 0.0000 0.0000 0.0490 0.2400 0.0000 0.0000 0.0000 0.0000
Kisii 0.0000 0.1470 0.0540 0.0000 0.0000 0.3770 0.0000 0.0000 0.0000 0.0000
Kisumu 0.0000 0.5420 0.0000 0.0000 0.0000 0.0630 0.0000 0.0000 0.0000 0.0000
Kitui 0.0000 0.4720 0.0000 0.0000 0.0000 0.4410 0.0000 0.0000 0.0000 0.0000
Koibatek 0.0920 0.2420 0.1140 0.0000 0.0000 0.6660 0.0000 0.0000 0.0000 0.0000
Kuria 0.0460 0.4130 0.0000 0.0000 0.0000 0.6950 0.0000 0.3160 0.0000 0.0000
Kwale 0.0000 0.4540 0.0000 0.1260 0.0000 0.2440 0.0000 0.0000 0.0000 0.0000
Laikipia 0.0930 0.2420 0.0000 0.0000 0.0000 0.0000 0.0000 0.0000 0.0000 0.0000
Lamu 0.0000 0.2960 0.0000 0.1590 0.0550 0.2380 0.0550 0.0000 0.0000 0.0000
Lugari 0.0000 0.6100 0.0000 0.0000 0.0000 0.2190 0.0000 0.0050 0.0000 0.0000
Machakos 0.0000 0.4590 0.0000 0.0000 0.0050 0.1500 0.0000 0.0000 0.0000 0.0000
Makueni 0.0000 0.3330 0.0440 0.0350 0.0000 0.2860 0.0000 0.0100 0.0000 0.0000
Malindi 0.0000 0.3160 0.0000 0.0000 0.0000 0.4350 0.0000 0.1270 0.0000 0.0000
Mandera 0.0000 0.2380 0.0000 0.0000 0.0000 0.0380 0.0000 0.1620 0.0000 0.0380
Maragua 0.0000 0.4770 0.0000 0.0680 0.0000 0.2780 0.0000 0.0000 0.0000 0.0000
Marakwet 0.0000 0.3300 0.0000 0.1520 0.0000 0.3830 0.0000 0.0140 0.0000 0.0000
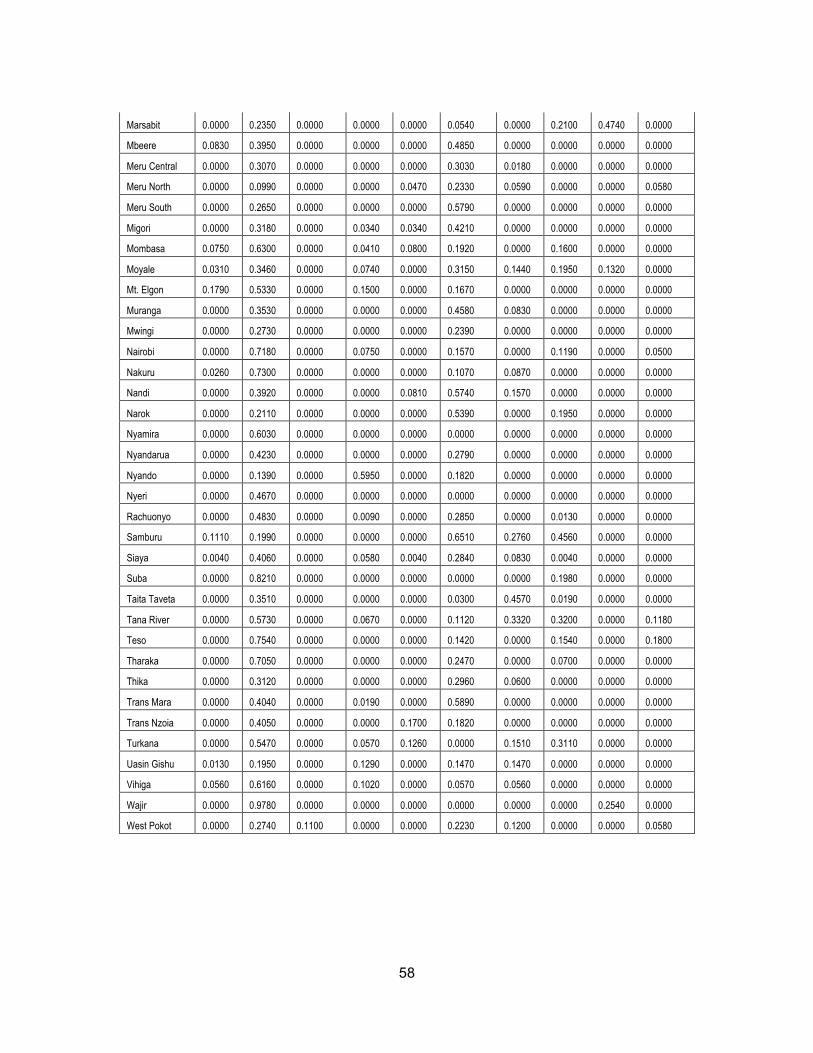
58
Marsabit 0.0000 0.2350 0.0000 0.0000 0.0000 0.0540 0.0000 0.2100 0.4740 0.0000
Mbeere 0.0830 0.3950 0.0000 0.0000 0.0000 0.4850 0.0000 0.0000 0.0000 0.0000
Meru Central 0.0000 0.3070 0.0000 0.0000 0.0000 0.3030 0.0180 0.0000 0.0000 0.0000
Meru North 0.0000 0.0990 0.0000 0.0000 0.0470 0.2330 0.0590 0.0000 0.0000 0.0580
Meru South 0.0000 0.2650 0.0000 0.0000 0.0000 0.5790 0.0000 0.0000 0.0000 0.0000
Migori 0.0000 0.3180 0.0000 0.0340 0.0340 0.4210 0.0000 0.0000 0.0000 0.0000
Mombasa 0.0750 0.6300 0.0000 0.0410 0.0800 0.1920 0.0000 0.1600 0.0000 0.0000
Moyale 0.0310 0.3460 0.0000 0.0740 0.0000 0.3150 0.1440 0.1950 0.1320 0.0000
Mt. Elgon 0.1790 0.5330 0.0000 0.1500 0.0000 0.1670 0.0000 0.0000 0.0000 0.0000
Muranga 0.0000 0.3530 0.0000 0.0000 0.0000 0.4580 0.0830 0.0000 0.0000 0.0000
Mwingi 0.0000 0.2730 0.0000 0.0000 0.0000 0.2390 0.0000 0.0000 0.0000 0.0000
Nairobi 0.0000 0.7180 0.0000 0.0750 0.0000 0.1570 0.0000 0.1190 0.0000 0.0500
Nakuru 0.0260 0.7300 0.0000 0.0000 0.0000 0.1070 0.0870 0.0000 0.0000 0.0000
Nandi 0.0000 0.3920 0.0000 0.0000 0.0810 0.5740 0.1570 0.0000 0.0000 0.0000
Narok 0.0000 0.2110 0.0000 0.0000 0.0000 0.5390 0.0000 0.1950 0.0000 0.0000
Nyamira 0.0000 0.6030 0.0000 0.0000 0.0000 0.0000 0.0000 0.0000 0.0000 0.0000
Nyandarua 0.0000 0.4230 0.0000 0.0000 0.0000 0.2790 0.0000 0.0000 0.0000 0.0000
Nyando 0.0000 0.1390 0.0000 0.5950 0.0000 0.1820 0.0000 0.0000 0.0000 0.0000
Nyeri 0.0000 0.4670 0.0000 0.0000 0.0000 0.0000 0.0000 0.0000 0.0000 0.0000
Rachuonyo 0.0000 0.4830 0.0000 0.0090 0.0000 0.2850 0.0000 0.0130 0.0000 0.0000
Samburu 0.1110 0.1990 0.0000 0.0000 0.0000 0.6510 0.2760 0.4560 0.0000 0.0000
Siaya 0.0040 0.4060 0.0000 0.0580 0.0040 0.2840 0.0830 0.0040 0.0000 0.0000
Suba 0.0000 0.8210 0.0000 0.0000 0.0000 0.0000 0.0000 0.1980 0.0000 0.0000
Taita Taveta 0.0000 0.3510 0.0000 0.0000 0.0000 0.0300 0.4570 0.0190 0.0000 0.0000
Tana River 0.0000 0.5730 0.0000 0.0670 0.0000 0.1120 0.3320 0.3200 0.0000 0.1180
Teso 0.0000 0.7540 0.0000 0.0000 0.0000 0.1420 0.0000 0.1540 0.0000 0.1800
Tharaka 0.0000 0.7050 0.0000 0.0000 0.0000 0.2470 0.0000 0.0700 0.0000 0.0000
Thika 0.0000 0.3120 0.0000 0.0000 0.0000 0.2960 0.0600 0.0000 0.0000 0.0000
Trans Mara 0.0000 0.4040 0.0000 0.0190 0.0000 0.5890 0.0000 0.0000 0.0000 0.0000
Trans Nzoia 0.0000 0.4050 0.0000 0.0000 0.1700 0.1820 0.0000 0.0000 0.0000 0.0000
Turkana 0.0000 0.5470 0.0000 0.0570 0.1260 0.0000 0.1510 0.3110 0.0000 0.0000
Uasin Gishu 0.0130 0.1950 0.0000 0.1290 0.0000 0.1470 0.1470 0.0000 0.0000 0.0000
Vihiga 0.0560 0.6160 0.0000 0.1020 0.0000 0.0570 0.0560 0.0000 0.0000 0.0000
Wajir 0.0000 0.9780 0.0000 0.0000 0.0000 0.0000 0.0000 0.0000 0.2540 0.0000
West Pokot 0.0000 0.2740 0.1100 0.0000 0.0000 0.2230 0.1200 0.0000 0.0000 0.0580