economic value of advanced transfemoral prosthetics are grateful to audrey el-gamil and nikolay...
TRANSCRIPT

RESEARCH REPORT
Economic Value of Advanced Transfemoral Prosthetics
Hangsheng Liu, Christine Chen, Mark Hanson, Ritika Chaturvedi,
Soeren Mattke, Richard Hillestad
C O R P O R A T I O N

Limited Print and Electronic Distribution Rights
This document and trademark(s) contained herein are protected by law. This representation of RAND intellectual property is provided for noncommercial use only. Unauthorized posting of this publication online is prohibited. Permission is given to duplicate this document for personal use only, as long as it is unaltered and complete. Permission is required from RAND to reproduce, or reuse in another form, any of its research documents for commercial use. For information on reprint and linking permissions, please visit www.rand.org/pubs/permissions.html.
The RAND Corporation is a research organization that develops solutions to public policy challenges to help make communities throughout the world safer and more secure, healthier and more prosperous. RAND is nonprofit, nonpartisan, and committed to the public interest.
RAND’s publications do not necessarily reflect the opinions of its research clients and sponsors.
Support RANDMake a tax-deductible charitable contribution at
www.rand.org/giving/contribute
www.rand.org
For more information on this publication, visit www.rand.org/t/rr2096
Published by the RAND Corporation, Santa Monica, Calif.
© Copyright 2017 RAND Corporation
R® is a registered trademark.
Cover image courtesy of the American Orthotic and Prosthetic Association
Library of Congress Cataloging-in-Publication Data is available for this publication.
ISBN: 978-0-8330-9888-7
iii
Preface
Advanced prosthetics with microprocessor-controlled knees offer improved quality of life for many patients who must live with a transfemoral amputation. However, such prosthetics are more expensive than traditional mechanical devices, and payers have recently started questioning their value for money.
To explore this issue, we developed a simulation model to assess the differential clinical outcomes and costs of microprocessor-controlled knees compared with non–microprocessor-controlled knees. The model utilizes parameters mined from existing literature regarding clinical and economic outcomes achieved by transfemoral amputees. This report is targeted to payers and policymakers with roles in the regulation and functioning of the prosthetics market, payments for prosthetic procurement and services, and public investment in innovation.
This research was sponsored by the American Orthotic and Prosthetic Association (AOPA), and conducted in RAND Health, a division of the RAND Corporation. A profile of RAND Health, abstracts of its publications, and ordering information can be found at www.rand.org/health. We note that the material contained in this report is the responsibility of the research team and does not necessarily reflect policy positions of AOPA. Comments or inquiries concerning this report should be sent to the lead author, Hangsheng Liu, at [email protected].

iv
Contents
Preface ............................................................................................................................................ iii Figures............................................................................................................................................. v Tables ............................................................................................................................................. vi Summary ....................................................................................................................................... vii Acknowledgments ........................................................................................................................ viii Abbreviations ................................................................................................................................. ix Chapter One. Introduction .............................................................................................................. 1 Chapter Two. Methods .................................................................................................................... 4
Analytic Framework ..................................................................................................................................4 Target Population ......................................................................................................................................5 Data Sources ..............................................................................................................................................6
Literature Review ..................................................................................................................................6 Expert Panel Process .............................................................................................................................6 Cost of Device Acquisition ...................................................................................................................6
Simulation Model ......................................................................................................................................7 Structure ................................................................................................................................................7 Parameters and Assumptions ................................................................................................................8 Sensitivity Analysis .............................................................................................................................10
Chapter Three. Results .................................................................................................................. 11 Clinical Benefits ......................................................................................................................................11
Physical Function ................................................................................................................................11 Falls and Fall-Related Mortality .........................................................................................................13 Incidence of Osteoarthritis ..................................................................................................................13 Quality of Life .....................................................................................................................................14
Economic Benefits ..................................................................................................................................15 Direct Health Care Cost ......................................................................................................................15 Indirect Cost ........................................................................................................................................15 Cost of Device Acquisition .................................................................................................................16 Total Cost ............................................................................................................................................16
Combining Economic and Clinical Benefits ...........................................................................................17 Chapter Four. Discussion .............................................................................................................. 19
Clinical Benefits ......................................................................................................................................19 Economic Benefits ..................................................................................................................................20 Limitations ...............................................................................................................................................21
Chapter Five. Conclusion .............................................................................................................. 23 Appendix ....................................................................................................................................... 25 References ..................................................................................................................................... 34
v
Figures
Figure 2.1. Analytic Framework ..................................................................................................... 5 Figure 3.1. Physical Function Among MPK and NMPK Users ................................................... 12 Figure 3.2. Injurious Falls and Fall-Related Deaths Among MPK and NMPK Users ................. 13 Figure 3.3. Quality of Life Among MPK and NMPK Users ........................................................ 14 Figure 3.4. Savings Derived from the Use of MPKs in Direct Health Care Cost and
Indirect Cost .......................................................................................................................... 16 Figure 3.5. Incremental Cost and Effectiveness of MPKs in Comparison to NMPKs in
K3/K4 Amputees .................................................................................................................. 18 Figure A.1. Potential Pathways Through Which MPKs Impact Clinical and Economic
Outcomes .............................................................................................................................. 30 Figure A.2. Fall-Related Transitional Probabilities and Associated Cost Outcomes ................... 31 Figure A.3. One-Way Sensitivity Analysis of Total Cost ............................................................ 32 Figure A.4. Incremental Cost and Effectiveness of MPKs Compared with NMPKs in
K1/K2 Amputees .................................................................................................................. 33

vi
Tables
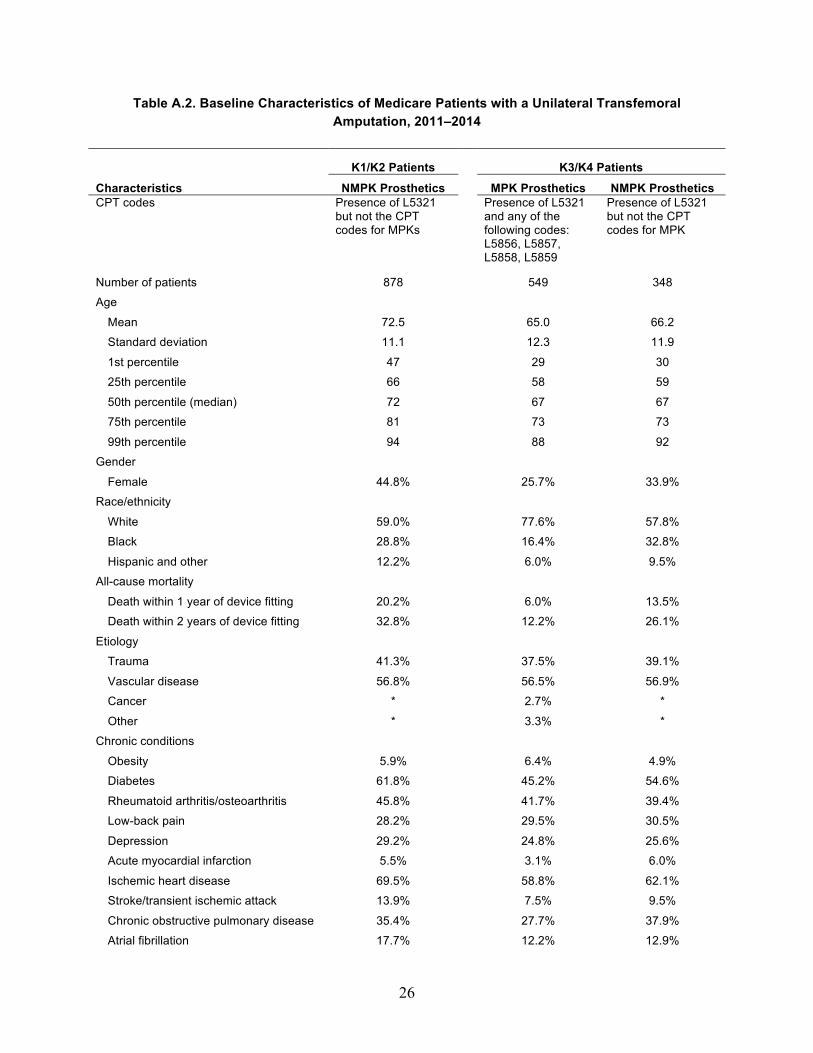
Table A.1. Medicare Functional Classification Levels ................................................................. 25 Table A.2. Baseline Characteristics of Medicare Patients with a Unilateral Transfemoral
Amputation, 2011–2014 ....................................................................................................... 26 Table A.3. Model Parameters, Assumptions, and Data Sources .................................................. 28

vii
Summary
It is estimated that about 1.9 million individuals in the United States are living with the loss of a limb. Of that number, 18.5 percent are transfemoral amputees. Due to recent advances in technology, prosthetic knees and feet allow for more-dynamic movements and improved quality of life, but payers have recently started questioning their value for money. To answer this question, we developed a simulation model to assess the differential clinical outcomes and costs of microprocessor-controlled knees (MPKs) compared with non-MPKs (NMPKs).
We conducted a literature review of the clinical and economic impacts of prosthetic knees, convened technical expert panel meetings, compiled the input parameters required, and constructed and implemented a simulation model over a ten-year time period for unilateral transfemoral amputees with Medicare Functional Classification Levels of 3 and 4. The results are summarized as an incremental cost-effectiveness ratio (ICER) from a societal perspective, i.e., the incremental cost of MPKs compared with NMPKs for each quality-adjusted life year gained. All costs were adjusted to 2016 U.S. dollars and discounted using a 3-percent rate to the present time.
We found that compared with NMPKs, MPKs are associated with substantial improvement in physical function and reductions in incidences of falls and osteoarthritis. The effect on low-back pain, depression, obesity, diabetes, and cardiovascular disease could not be quantified due to the lack of data. Our simulation results show that compared with NMPKs over a ten-year time period:
• for every 100 people, MPKs result in 82 fewer major injurious falls, 62 fewer minor injurious falls, and save 11 lives
• for every 100 people, MPKs result in 16 fewer incidences of osteoarthritis • on a per-person-per-year basis, MPKs reduce direct health care costs by $3,676 and
indirect costs by $909, but increase device acquisition and repair costs by $6,287 and total costs by $1,702
• on a per-person basis, MPKs are associated with an incremental total cost of $10,604 • on a per-person basis, MPKs increase the number of life years by 0.11 and quality-
adjusted life years by 0.91 • MPKs have an ICER of $11,606 per quality-adjusted life year • the economic benefits of MPKs are robust in various sensitivity analyses. Our study demonstrates that advanced prosthetics for transfemoral amputees, specifically
MPKs, are associated with improved clinical benefits compared with conventional prosthetic knees. Translated into economic benefits, MPKs are associated with reductions in direct health care costs and indirect costs, and provide good value for the money using the standard criterion of $50,000 per quality-adjusted life year gained. The economic benefits of MPKs are similar to or even greater than those of other medical technologies currently reimbursed by U.S. payers.

viii
Acknowledgments
We would like to acknowledge current and past presidents of the American Orthotic and Prosthetic Association (AOPA), including Charles Dankmeyer, James Campbell, and Michael Oros, together with the Prosthetics 2020 Medical Advisory Board, the Steering Committee, and all the members of the Technical Advisory Committee for their knowledge and expertise. Thanks also to the AOPA staff, in particular, Tom Fise, Joe McTernan, and Ashlie White for their support and guidance.
We want to express our gratitude to our panel of experts who helped facilitate discussions and refine our methodology, literature review, and analysis, including Andreas Kannenberg, M.D., Ph.D. (Otto Bock Healthcare LP); Kenton Kaufman, Ph.D. (Mayo Clinic); Stephen Blatchford, M.Sc., M.B.A. (Chas A. Blatchford and Sons, Ltd.); Kim De Roy, M.Ed., M.Sc. (Ossur); Michael Oros, Certified Prosthetist and Orthotist, Fellow of the American Academy of Orthotists and Prosthetists (Scheck and Siress); Sam Liang, B.S.E., M.B.A. (Hanger Clinic); Jim Campbell, Ph.D. (Hanger Clinic); Michael Jason Highsmith, Ph.D. (Department of Veterans Affairs); David Moser, Ph.D. (Blatchford Group); Mike McGrath, Ph.D. (Blatchford Group); Saeed Zahedi, Ph.D. (Chas A. Blatchford and Sons, Ltd.); Maynard Carkhuff, B.S., M.B.A. (Freedom Innovations); Jim Colvin, B.S.E, M.S.E (WillowWood); Robert Gailey, Ph.D. (University of Miami); and Brian Kaluf, B.S.E., Certified Prosthetist (Ability Prosthetics and Orthotics). In addition, special thanks go to David Felson, Ph.D., with the University of Manchester for his expert guidance on osteoarthritis and David Ganz, Ph.D., at the RAND Corporation for his help with the modeling of falls. We are grateful to Audrey El-Gamil and Nikolay Manolov at Dobson and DaVanzo, LLC, for their expertise and for providing information from Medicare claims data.
We want to express our appreciation to our reviewers, Tom Concannon at RAND and Kenton Kaufman at Mayo Clinic, for their great comments and constructive suggestions, and to Kristin Sereyko for supporting the project team and helping with the report preparation. Finally, we thank a number of other individuals and organizations that participated anonymously.

ix
Abbreviations
AOPA American Orthotic and Prosthetic Association
CMS Centers for Medicare and Medicaid Services
EQ-5D EuroQol five dimensions questionnaire
ICER incremental cost-effectiveness ratio
K0 Medicare Functional Classification Level 0
K1 Medicare Functional Classification Level 1
K2 Medicare Functional Classification Level 2
K3 Medicare Functional Classification Level 3
K4 Medicare Functional Classification Level 4
MPK microprocessor-controlled prosthetic knee
NMPK non–microprocessor-controlled prosthetic knee
PEQ Prosthesis Evaluation Questionnaire
QALY quality-adjusted life year
SF-36 36-Item Short Form Health Survey
1
Chapter One. Introduction
It is estimated that 185,000 amputations are performed annually in the United States (Ziegler-Graham et al., 2008). The Centers for Disease Control and Prevention estimates that there are roughly 1.9 million individuals living with the loss of a limb, a figure expected to rise to 3.6 million by 2050 (Centers for Disease Control and Prevention, 2015; Ziegler-Graham et al., 2008). Of this number, it is estimated that 18.5 to 21.0 percent are transfemoral amputees (Adams, Hendershot, and Marano, 1999; National Center for Health Statistics, 2004). Transfemoral amputation, or the removal of a limb above the knee joint, is performed to remove ischemic, infected, or irreversibly damaged tissue and is generally a life-saving procedure. The majority (about 82 percent) of transfemoral amputations are due to peripheral artery disease and/or diabetes, followed by trauma, cancer, infection, and congenital defects (Dillingham and Pezzin, 2005; Remes et al., 2008).
Transfemoral amputation is classified as a disability by the International Classification of Functioning, Disability, and Health. Consistent with this, transfemoral amputees experience profound lifestyle changes following rehabilitation. The consequences of transfemoral amputation include impairment of body function (e.g., decreased muscle strength, decreased range of motion, balance problems, changed gait pattern, low-back pain, osteoarthritis, phantom pain, and skin problems), activity limitations (mobility and activities of daily living), and participation restrictions (e.g., employment) (Pell et al., 1993). Mobility restoration and independent ambulation is variable and dependent on a number of factors, including patient motivation, strength, coordination, and prosthetic management.
Conventionally, transfemoral prosthetics have included a socket to attach to the residual limb, a prosthetic knee, shank, and a foot-ankle assembly. Together, these component parts aim to help patients regain basic ambulation (Hafner et al., 2007). However, transfemoral amputees can have a very difficult time regaining normal movement. It is estimated that a transfemoral amputee must use 35- to 65-percent more energy to walk than a person with two legs due to complexities in the knee joint (Traugh, Corcoran, and Reyes, 1975; Gjovaag et al., 2014; Starholm et al., 2016; Russell Esposito, Rábago, and Wilken, 2017). Over the last decade, major technological advancements, such as bionics, osseo-integration, and microprocessors have catalyzed the modernization of prosthetics (Seymour et al., 2007). Such advances are driven by an increasing number of young, otherwise healthy service members suffering from war-related traumatic amputations, who are more demanding of a return to their normal activity levels. As a result, advanced prosthetic knees and feet were developed to allow for more-dynamic movements (running, jumping, climbing stairs, walking on uneven ground), thus improving user quality of life (Seymour et al., 2007; Bellmann, Schmalz, and Blumentritt, 2010; Kaufman, Frittoli, and Frigo, 2012).
2
The payment system, however, has not yet evolved with the advancement in technology, and remains rooted in the historical treatment of prosthetics as commodity products and an ensuing emphasis on unit cost, which can result in restricting patient access to clinically superior prosthetics.
Prosthetic devices are reimbursed by five main payers in the United States: private insurance, Medicare, Medicaid, the U.S. Department of Defense, and the Veterans Health Administration. Government payers account for a majority of reimbursements for limb prosthetics, setting the market standards for reimbursement in the United States. Currently, the Centers for Medicare and Medicaid Services (CMS) reimburses prosthetic devices and services based on the L-code system, whereby a single payment covers the device, supplies, and auxiliary services. CMS and other payers restrict reimbursement of prosthetics based on the Medicare Functional Classification Level, an index for classifying the functional mobility and productivity potential of individuals with lower-limb loss (Gailey et al., 2002; Hafner and Smith, 2009). Prior to the passage of the Affordable Care Act (ACA) in 2010, private insurers used a lifetime cap for prosthetics, exerting downward pressure on the prosthetics market. Such lifetime caps made it difficult for patients to obtain reimbursement for replacement devices or repairs. The ACA included rehabilitative services as an essential health benefit, eliminating such lifetime caps. However, the current congressional debate surrounding health care reform may reverse the provisions included in the ACA, casting doubt on the future of reimbursement for prosthetic services. In general, amputees can expect to pay roughly 20 percent of the device cost out of pocket each time they acquire a new device that is covered under Medicare. If, however, patients desire a device outside of their designated functional level, they may be expected to pay for the entire device out of pocket. As a result, patients often opt for low-cost devices and may not achieve their full rehabilitation potential (Rice and Matsuoka, 2004).
In addition, payers are increasingly under cost-cutting pressure, which in turn has increased pressure on the prosthetics industry. After a downward trend in the Medicare payment for orthotics and prosthetics and associated services since 2010, CMS aimed to further tighten the rules for reimbursing lower-limb prosthetics by issuing new local coverage decisions in July 2015, on the basis of a 2011 report by the Office of the Inspector General (American Orthotic and Prosthetic Association [AOPA], 2015). These new rules included provisions restricting the reimbursement of certain advanced prosthetics to those amputees who ever used a cane, crutches, walker, or wheelchair. Although CMS has held off on its proposal for now, the possible implementation of such a proposal will have important consequences for the 1.9 million people living with limb loss in the United States (National Limb Loss Information Center, 2007), especially if private payers and the Veterans Health Administration follow suit.
Evidence for the incremental value of advanced prosthetics in comparison to conventional prosthetics can be used to facilitate a dialog between stakeholders. On the one hand, it is important to ensure that patients have access to advanced technologies with proven health benefits. On the other hand, payers have the fiduciary obligation to contain ever-expanding
3
health care costs. It is apparent that pure cost-cutting without considering value likely dampens the utilization of advanced technologies and therefore deprives patients of potential benefits. To address this issue, quality clinical and economic data as well as rigorous studies are required to demonstrate the value of prosthetics and associated required services. The Prosthetics 2020 Initiative launched by the AOPA has started collecting clinical and economic data, and it is planning to establish a patient registry in the future to inform this dialogue.
In the absence of head-to-head clinical trial data, in the short term a simulation study can leverage existing evidence to determine the economic value of advanced prosthetics and associated services. The AOPA therefore commissioned this report to compare conventional and advanced prosthetic knees.
4
Chapter Two. Methods
We quantified the value of advanced transfemoral prosthetics in comparison to conventional prosthetics from a societal perspective based on clinical endpoints, such as physical function and quality of life, and economic endpoints, including direct health care costs and indirect costs such as the impact on caregiving expenses, transportation expenses, and work productivity. To implement the analysis, we conducted a literature review of the clinical and economic impacts of advanced prosthetics, convened technical expert panel meetings, compiled the input parameters required, and constructed and implemented a simulation model.
We conducted a formal cost-effectiveness analysis that compared clinical and economic benefits of microprocessor-controlled prosthetic knees (MPKs) with non-MPKs (NMPKs). This analysis generated an incremental cost-effectiveness ratio (ICER), which is a commonly accepted measure for cost-effectiveness, or value for money. ICERs measure the additional resource requirements per unit of additional health gained, typically in quality-adjusted life years (QALYs).
Higher ICERs mean that more money has to be spent to achieve gains in health, i.e., lower cost-effectiveness, or value for money. Unlike in national health systems, such as in the United Kingdom, no formal threshold for acceptable ICERs exist in the United States, but ratios of $50,000 to $150,000 per QALY are typically used (Neumann, Cohen, and Weinstein, 2014; Institute for Clinical and Economic Review, 2017). This method allows us to compare the ICER for MPKs to that of other health care technologies that are reimbursed by Medicare and other payers in the United States to put its value for money into perspective.
All costs were inflated to 2016 U.S. dollars using the medical care component of the Consumer Price Index (Bureau of Labor Statistics, 2017) and, when applicable, were converted to U.S. dollars using the exchange rate at the time the study was conducted (OANDA Corporation, 2017). This study was approved by RAND’s Human Subjects Protection Committee.
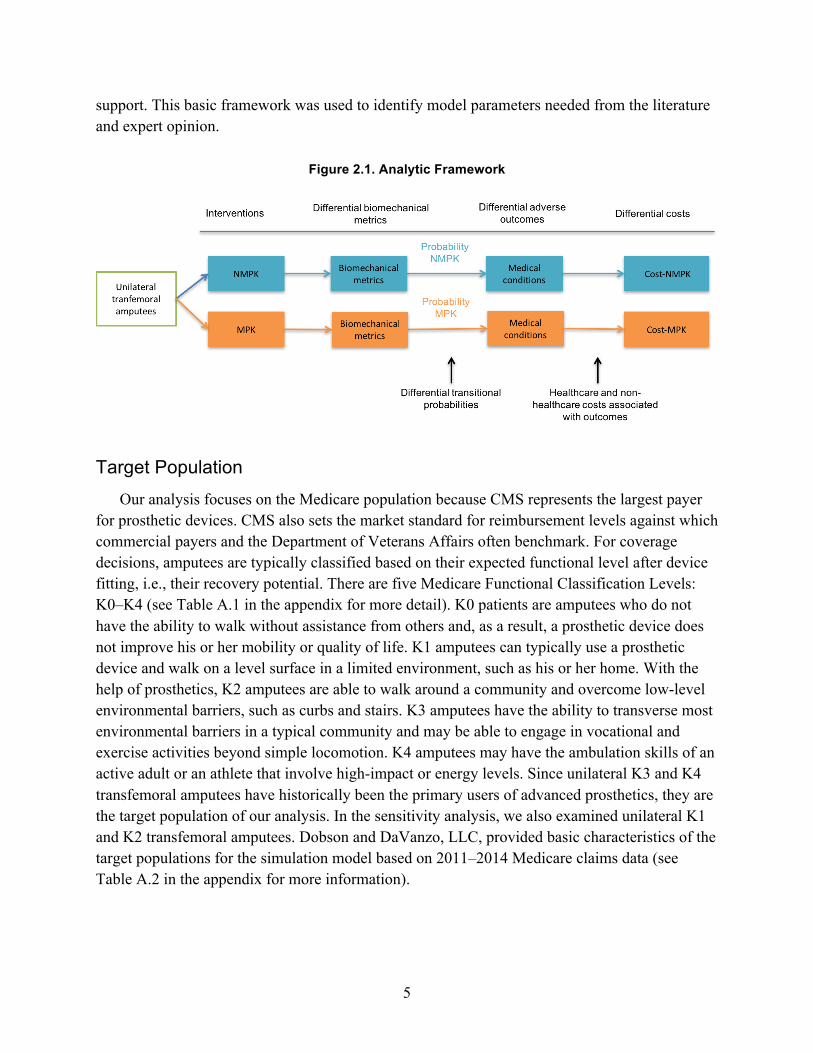
Analytic Framework Figure 2.1 illustrates the analytic framework informing our literature review and cost-
effectiveness model. We assumed that the prosthetic literature would provide evidence on differences in biomechanical metrics (e.g., gait, step length, walking speed, kinetics, kinematics) based on the prosthetic intervention (MPK versus NMPK). We further assumed that such biomechanical differences based on intervention type would be linked to clinically relevant health outcomes through differential probabilities in developing medical conditions. For example, improved gait symmetry may lead to lower rates of osteoarthritis in the healthy limb. Finally, differential health outcomes are assumed to be associated with differential costs, including direct health care costs and indirect costs such as lost wages and cost of caregivers for
5
support. This basic framework was used to identify model parameters needed from the literature and expert opinion.
Figure 2.1. Analytic Framework
Target Population Our analysis focuses on the Medicare population because CMS represents the largest payer
for prosthetic devices. CMS also sets the market standard for reimbursement levels against which commercial payers and the Department of Veterans Affairs often benchmark. For coverage decisions, amputees are typically classified based on their expected functional level after device fitting, i.e., their recovery potential. There are five Medicare Functional Classification Levels: K0–K4 (see Table A.1 in the appendix for more detail). K0 patients are amputees who do not have the ability to walk without assistance from others and, as a result, a prosthetic device does not improve his or her mobility or quality of life. K1 amputees can typically use a prosthetic device and walk on a level surface in a limited environment, such as his or her home. With the help of prosthetics, K2 amputees are able to walk around a community and overcome low-level environmental barriers, such as curbs and stairs. K3 amputees have the ability to transverse most environmental barriers in a typical community and may be able to engage in vocational and exercise activities beyond simple locomotion. K4 amputees may have the ambulation skills of an active adult or an athlete that involve high-impact or energy levels. Since unilateral K3 and K4 transfemoral amputees have historically been the primary users of advanced prosthetics, they are the target population of our analysis. In the sensitivity analysis, we also examined unilateral K1 and K2 transfemoral amputees. Dobson and DaVanzo, LLC, provided basic characteristics of the target populations for the simulation model based on 2011–2014 Medicare claims data (see Table A.2 in the appendix for more information).

6
Data Sources
Literature Review
Based on the analytic framework, we conducted a comprehensive literature search for input parameters, including physical function, health outcomes, quality of life, direct health care costs, and non–health care or indirect costs. The health outcomes included falls; musculoskeletal diseases, such as osteoarthritis and low-back pain; and chronic illnesses, such as obesity, diabetes, cardiovascular diseases, and depression. To the extent possible, we established the links between the use of prosthetics and health and cost outcomes in transfemoral amputees.
We searched peer-reviewed literature via databases including PubMed, Embase, CINAHL, PsycINFO, Web of Science, and Google Scholar. The non–peer-reviewed literature was examined for technical reports produced by government agencies or industry associations. Forward and backward searches based on the identified articles complemented our initial search.
Comparative studies evaluating differential biomechanical, health, and economic benefits between advanced and conventional prosthetics were prioritized. Input parameters that are not relevant to the direct comparison of MPKs to NMPKs, such as baseline mortality rates of the target population and the cost of falls, may be extracted from publications that provide such parameters in similar populations, such as general lower-extremity amputees, the elderly population, or Medicare beneficiaries. For each input parameter, we compiled a range of estimates from the literature whenever possible, where the median value served as the base case while the upper and lower bounds were used in the sensitivity analysis.
Expert Panel Process
We convened an expert panel to supplement our literature review, to validate our assumptions, to ensure adequate and complete understanding of the prosthetics literature, and to ensure appropriate model development and construction. In addition, experts provided estimates of input parameters that were not available in the literature.
Fifteen experts were selected based on their publication record in the various topics that informed our model. Several consultation methods were used. First, we convened two telephone-based panel discussions with a majority of participating experts. In addition, we conducted one-on-one interviews with several experts to thoroughly understand a particular research area. Each interview was semi-structured, consisting of open-ended questions developed iteratively based on the literature review, and lasted approximately 60 minutes.
Cost of Device Acquisition
The costs of device acquisition, repair, and physical therapy were based on the analysis of 2011–2014 Medicare claims conducted by Dobson and DaVanzo, LLC. In our analysis, cost of device acquisition does not represent the manufacturer list price but instead is approximated using the current Medicare payment amount. Ideally, we would like to use the cost of
7
manufacturing the devices for the simulation. In the absence of data on the actual cost of producing the devices, we used Medicare payment amounts to approximate costs. As mentioned above, CMS is the largest payer for prosthetic devices, and once it sets a payment rate for a device, other payers in the market will follow suit. In this context, Medicare payments better represent the actual amount of resources consumed than the manufacturer list price. Throughout the report, we use Medicare device payment and device acquisition cost interchangeably. To quantify the current Medicare payment amount, we identified the two most frequent combinations of L codes among the new unilateral transfemoral amputees in the Medicare claims data and applied the allowed payments on the 2016 Medicare fee schedule (Medicare Payment Advisory Commission, 2010). We constructed the base-case value using expert input on acquisition cost and computed the upper and lower bounds by summarizing the 2016 Medicare fee schedule–allowed payments for the two most frequent combinations of L codes. The cost of device repair and physical therapy was identified as the median of the Medicare-allowed payments in the two years after the device fitting.
Simulation Model
Structure
We developed a cohort-level Markov model suited to this analytic problem to simulate the clinical and economic outcomes for a hypothetical K3 and K4 Medicare population with a unilateral transfemoral amputation (Sonnenberg and Beck, 1993; Hazen, 2011). This hypothetical cohort was assigned to two different treatment strategies, NMPK or MPK, with all other prosthetic components being the same. For this modeling process, we limited the simulation to up to ten years because the existing evidence comes from relatively short-term studies, which make longer predictions subject to large uncertainty.
We constructed two modules for the model: a fall module and an osteoarthritis module because the data available from the literature allowed us to convert clinical benefits for these two conditions into economic benefits. The lack of data prevented us from quantifying the potential benefit for other medical conditions, such as obesity and vascular disease.
In the fall module, there are three health states: fall, no fall, and death. Falls can be either medical, i.e., require medical attention, or nonmedical. Medical falls can be minor, major, or lead to death. Major injurious falls are associated with an admission to a medical facility. A patient may enter the “death” state from the “no fall” state due to causes other than falling. While Markov models are “memoryless,” meaning the health state at a subsequent step depends only on the state at the previous step, our model updates the annual probability of falling to simulate the effect of learning. The osteoarthritis module has three states as well: no osteoarthritis, osteoarthritis, and death. Based on the transitional probabilities from the literature, patients can move from one state to another until the end of the ten-year time period or death.

8
Once populated with parameters, the model records health experiences of each cohort and associated economic consequences annually over a ten-year period. All health outcomes and cost outcomes were discounted to the present time using a 3-percent discount rate. After implementing the model, we performed validation testing to ensure that the computations were done correctly and the outputs responded appropriately to changes under a range of key parameter input values. In particular, the model was validated during and after development through the checking of code by a second researcher. The model was programmed in Visual Basic for Applications for Microsoft Excel and we followed the modeling guidelines of the International Society for Pharmacoeconomics and Outcomes Research (Weinstein et al., 2003).
Parameters and Assumptions
Model parameters were compiled from the literature review, expert consultation, and the analysis of Medicare claims data. When parameters were not available from published literature, expert opinion was used and, if needed, assumptions were made. The model incorporates two target population characteristics from Medicare claims: the baseline mortality rate, 9.3 percent and 18.0 percent in K3/K4 and K1/K2 prosthetics users, respectively; and the baseline prevalence of intact knee arthritis, 19.1 percent and 16.3 percent in K3/K4 and K1/K2 prosthetics users, respectively. The model parameters, data assumptions, and data sources are listed in Table A.3 in the appendix to this report.
The probabilities of falling among MPK and NMPK users were estimated by the percentages of fallers in each group reported in Kahle, Highsmith, and Hubbard (2008) and Dederer (2013). Dederer conducted a prospective survey in a cohort of community-dwelling transfemoral amputees and compared the probability of falling in MPK users to that in NMPK users. Kahle, Highsmith, and Hubbard reported the number of participants who fell during a 60-day time period. In the latter case, we assumed that the percentage of fallers remains constant over a one-year period. In addition, the probability of falling was assumed to decline over time due to learning or other compensation strategies. According to Miller et al. (2001), having an amputation for more than four years is protective against falling, and the chance of falling decreased by 47 percent compared with those who were amputated within three years. Therefore, we assumed the probability of falling declines linearly in the first four years with an odds ratio of 0.53 by the end of the fourth year and then the probability of falling remains unchanged throughout the rest of the ten-year time frame.
Kahle, Highsmith, and Hubbard (2008) and Wong, Rheinstein, and Stern (2015) reported the number of falls per person per year over the past 60 days and the past year, respectively. Considering the potential recall bias resulting from a recall period as long as 12 months, we used Kahle, Highsmith, and Hubbard’s estimates as the base case and included Wong, Rheinstein, and Stern’s results in the sensitivity analysis.
Medical (or injurious) falls are defined as falls that require medical attention. The proportion of nonfatal medical falls out of all falls was computed from various sources that report incidence
9
rates of falls and/or injurious falls based on National Health Interview Survey 2001–2003, MOBILIZE Boston, and National Health and Nutrition Examination Survey 2004–2013 data sets (Schiller, Kramarow, and Dey, 2007; Kelsey et al., 2010; Verma et al., 2016). The estimates were derived as the ratios of the incidence rates of injurious falls to the incidence rates of any falls from all possible combinations of the sources. The estimate for the proportion of fatal medical falls was derived from Sterling, O’Connor, and Bonadies (2001), where the authors examined fall outcomes in a sample of elderly patients. All of these parameters came from a nonamputee population.
Medical falls were further categorized by severity due to their cost implications; where minor injuries only require visits to a physician’s office or an emergency room, major injuries necessitate hospitalization or admission to a skilled nursing facility. The worst scenario is when injuries lead to death despite treatments. The estimates for the proportions of medical falls in each category were derived from two studies. Mundell et al. (2017) examined fall episodes of 77 adults with above-knee amputations enrolled in the Rochester Epidemiology Project between 2000 and 2014. Due to the lack of studies that assess the severity of fall injuries in transfemoral amputees, we also included the estimates from Kim et al. (2016), who analyzed the Medicare claims data of 2,011 community-dwelling elderly patients with a high risk of falling and identified fall episodes that required care in acute inpatient or skilled nursing facilities in addition to emergency visits.
The estimates of direct costs per fall by severity come from publications that utilized Medicare claims data, Medical Expenditure Panel Survey data, Healthcare Cost and Utilization Project data, and the Centers for Disease Control and Prevention’s Web-Based Injury Statistics Query and Reporting System (Stevens et al., 2006; Burns, Stevens, and Lee, 2016; Kim et al., 2016). In particular, we utilized a recent publication on the cost of falls among transfemoral amputees who had a prosthetic knee, the only study that provides fall-related cost data in an amputee population (Mundell et al., 2017).
It is well accepted in the prosthetics research community that osteoarthritis of the intact limb is associated with chronic prosthetic use (Gailey et al., 2008). It is estimated that 63 percent (range: 17–75 percent) of amputees have knee osteoarthritis in their residual limb based on cross-sectional studies (Hungerford and Cockin, 1975; Burke, Roman, and Wright, 1978; Mussman et al., 1983; Kulkarni et al., 1998). However, currently published studies do not assign differential probabilities of osteoarthritis onset and progression based on type of prosthetic intervention. Gait asymmetry may be the cause of osteoarthritis, although the literature on gait metrics is conflicting (Datta, Heller, and Howitt, 2005; Kaufman et al., 2007). The major difference between the two prosthetics is demonstrated in Kaufman et al.’s study of knee moments, an indirect measurement of the force absorbed by the knee (2007). In the absence of published literature, we consulted experts on knee mechanics associated with osteoarthritis, who suggested that the moment about the knee is a reasonable surrogate for osteoarthritis. As such, we assumed the moment to be linearly associated with the incidence of osteoarthritis.
10
There is limited literature comparing the indirect costs attributable to the use of MPK and NMPK in the United States. The indirect cost estimates are based on the work of Gerzeli, Torbica, and Fattore (2009), conducted in Italy. Caregiving cost includes the time cost from taking care of a patient during leisure time and lost working days. We converted the mean hours of leisure time spent per patient per day and the mean lost working days per year into annual costs using the 2015 wage estimates from the Bureau of Labor Statistics (2015b). Wage loss results from lost jobs, switching from full-time to part-time jobs, and lost working days. The total annual cost of lost productivity was calculated based on the median wage of people older than 65 and adjusted by the employment rate (18.2 percent) within this age group (Bureau of Labor Statistics, 2015a; Pension Rights Center, 2016).
Quality of life metrics in MPK and NMPK users, as measured by health utilities, come from several European studies (Brodtkorb et al., 2008; Gerzeli, Torbica, and Fattore, 2009; Seelen et al., 2009; Cutti et al., 2017). Several U.S. studies report the Prosthesis Evaluation Questionnaire (PEQ) scores (Hafner et al., 2007; Kaufman et al., 2008; Hafner and Smith, 2009; William, Beasley, and Shaw, 2013; Prinsen et al., 2015), but there are no published methods to convert these estimates into health utilities. One study (Seelen et al., 2009) reports the 36-Item Short Form Health Survey (SF-36) scores; we converted them to the EuroQol five dimensions questionnaire (EQ-5D) utility scores according to Ara and Brazier (2008).
Due to the limitations of the literature, we were not able to extract K-level specific input parameters other than the baseline mortality and the prevalence of osteoarthritis. Both Kahle, Highsmith, and Hubbard (2008) and Wong, Rheinstein, and Stern (2015) studied K1/K2 and K3/K4 amputees. However, because of small sample sizes, the probability of falling and the average number of falls per person per year became unstable once we extracted data for K1/K2 and K3/K4 separately. Therefore, we derived these parameters by including all K-level amputees.
Sensitivity Analysis
To assess model performance and the robustness of model results, we conducted one-way sensitivity analyses where we changed input parameters one at a time. The one-way sensitivity analysis allowed us to inspect the sensitivity of model results to changes in key input parameter values as they were varied individually. We also conducted probabilistic sensitivity analyses on model inputs, assuming uniform distributions for all variables. That is, we randomly drew one data point from each parameter range and ran the model, and repeated the process 1,000 times. The probabilistic sensitivity analysis allows us to observe the uncertainty in the final estimated differences between the MPK cohort and the NMPK cohort. Sensitivity analyses were also conducted to examine the effectiveness of MPKs in the K1 and K2 transfemoral amputees.

11
Chapter Three. Results
Overall, we found that compared with NMPKs, MPKs are associated with meaningful improvement in physical function and reductions in incidences of falls and osteoarthritis. The effect on additional, more-distal health outcomes, such as low-back pain, depression, obesity, diabetes, or cardiovascular disease, could not be quantified due to the lack of data.
MPKs are associated with considerable reductions in direct health care costs and indirect costs, such as lost wages. After considering device acquisition and repair cost, MPKs provide good value for money, if the standard evaluation criterion of $50,000 per QALY is applied, and its economic benefits are comparable to technologies commonly reimbursed by U.S. payers.
Clinical Benefits
Physical Function
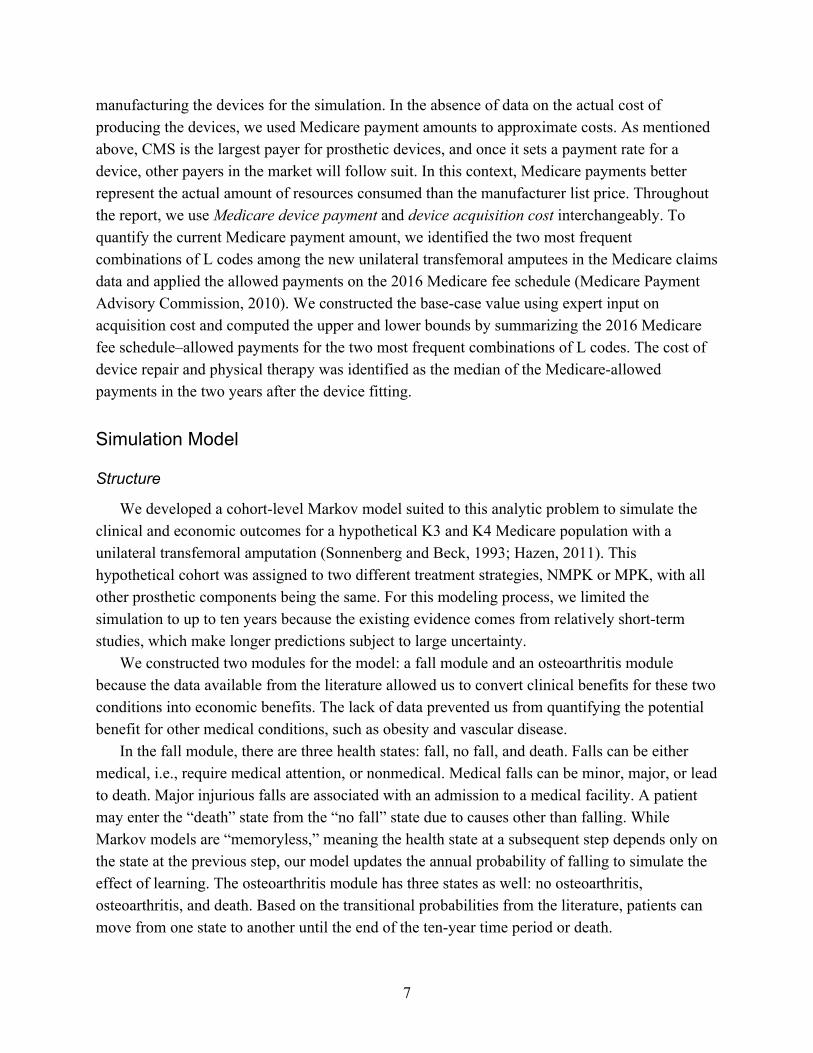
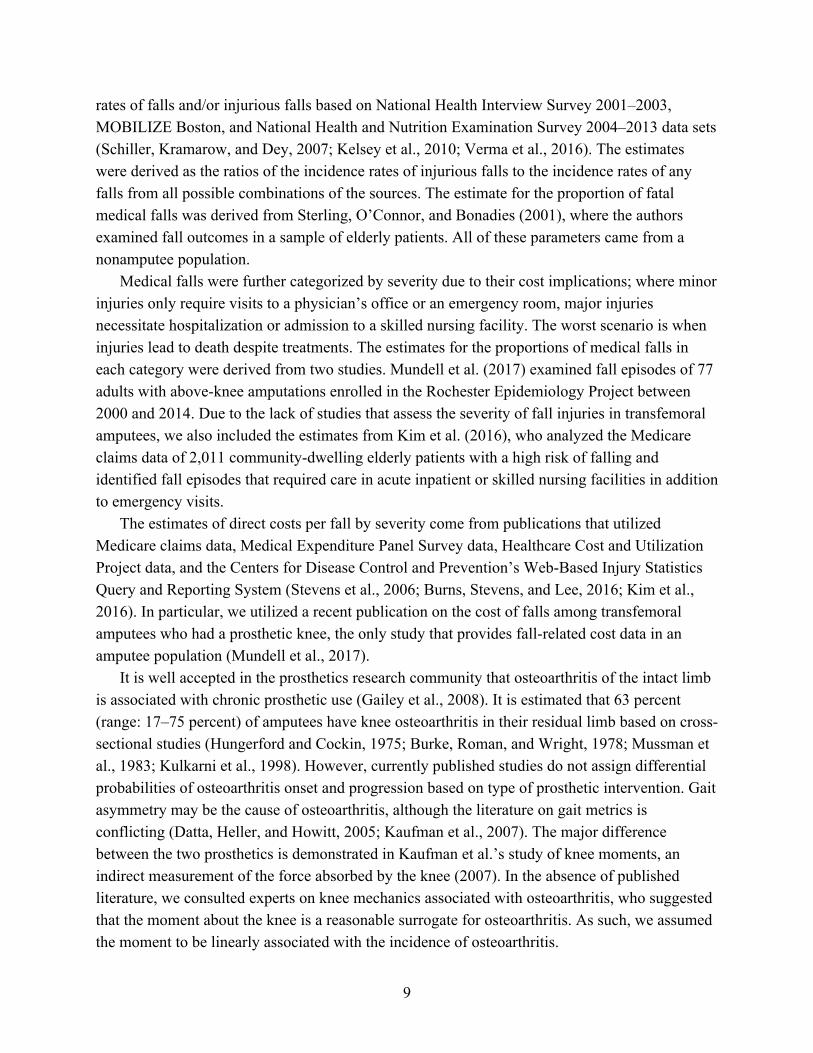
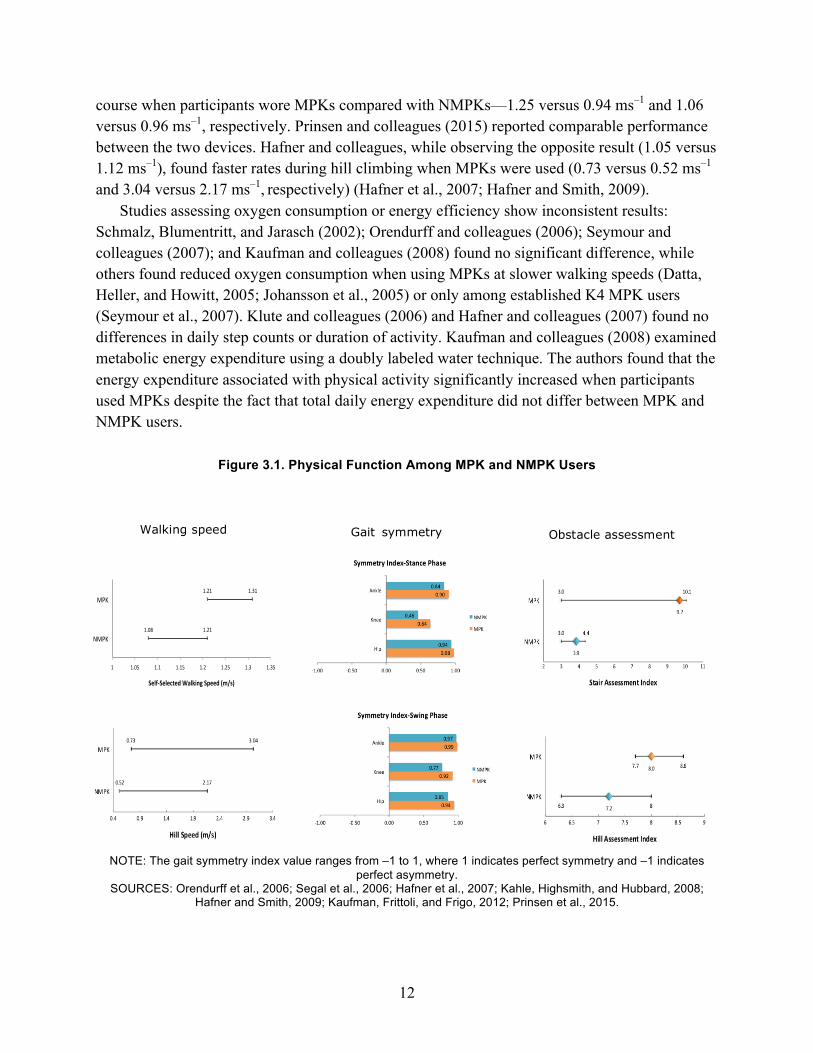
There are a number of publications employing repeated measures to examine the effects of advanced prosthetics on physical function. In these studies, biomechanical and physical performances were often compared when subjects wore NMPKs and after subjects were fitted with MPKs. Overall, there is strong evidence suggesting that compared with NMPKs, MPKs are associated with improvements in walking speed, gait symmetry, and the ability to negotiate obstacles in the environment; however, while there is some evidence suggesting improvement in other dimensions, such as energy efficiency and physical activity, the evidence is not clear.
Orendurff and colleagues (2006), Segal and colleagues (2006), and Kahle, Highsmith, and Hubbard (2008) compared self-selected walking speeds on MPKs versus NMPKs. On average, transfemoral amputees walked at the rate of 1.21–1.31 ms–1 on MPKs, slightly faster than the rate on NMPKs (1.08–1.21 ms–1).
Kaufman, Frittoli, and Frigo (2012) compared the symmetry of kinematic (joint motion) and kinetic (moments produced by the forces applied at the joints) characteristics for hip, knee, and ankle joints when subjects walked on level ground with the two prosthetics. While there was no significant difference in the symmetry of kinematics, significant improvement was observed in kinetic symmetry when MPKs were used, as measured by the symmetry index. The index value ranges from –1 to 1, where 1 indicates perfect symmetry and –1 indicates perfect asymmetry. As shown in Figure 3.1, the use of MPKs appears to improve the symmetry index values on all three joints. Asymmetric gait biomechanics that increase joint loading were found to be associated with the development of osteoarthritis in the amputee population (Morgenroth, Gellhorn, and Suri, 2012).
In general, MPKs outperform NMPKs in environmental negotiation. Kahle, Highsmith, and Hubbard (2008) and Seymour and colleagues (2007) recorded faster speeds on an obstacle
12
course when participants wore MPKs compared with NMPKs—1.25 versus 0.94 ms–1 and 1.06 versus 0.96 ms–1, respectively. Prinsen and colleagues (2015) reported comparable performance between the two devices. Hafner and colleagues, while observing the opposite result (1.05 versus 1.12 ms–1), found faster rates during hill climbing when MPKs were used (0.73 versus 0.52 ms–1 and 3.04 versus 2.17 ms–1, respectively) (Hafner et al., 2007; Hafner and Smith, 2009).
Studies assessing oxygen consumption or energy efficiency show inconsistent results: Schmalz, Blumentritt, and Jarasch (2002); Orendurff and colleagues (2006); Seymour and colleagues (2007); and Kaufman and colleagues (2008) found no significant difference, while others found reduced oxygen consumption when using MPKs at slower walking speeds (Datta, Heller, and Howitt, 2005; Johansson et al., 2005) or only among established K4 MPK users (Seymour et al., 2007). Klute and colleagues (2006) and Hafner and colleagues (2007) found no differences in daily step counts or duration of activity. Kaufman and colleagues (2008) examined metabolic energy expenditure using a doubly labeled water technique. The authors found that the energy expenditure associated with physical activity significantly increased when participants used MPKs despite the fact that total daily energy expenditure did not differ between MPK and NMPK users.
Figure 3.1. Physical Function Among MPK and NMPK Users
NOTE: The gait symmetry index value ranges from –1 to 1, where 1 indicates perfect symmetry and –1 indicates perfect asymmetry.
SOURCES: Orendurff et al., 2006;; Segal et al., 2006;; Hafner et al., 2007;; Kahle, Highsmith, and Hubbard, 2008;; Hafner and Smith, 2009;; Kaufman, Frittoli, and Frigo, 2012;; Prinsen et al., 2015.
Walking speed Gait symmetry Obstacle assessment
1.31
1.21
1.21
1.08
1 1.05 1.1 1.15 1.2 1.25 1.3 1.35
MPK
NMPK
Self-SelectedWalkingSpeed(m/s)
13
Falls and Fall-Related Mortality
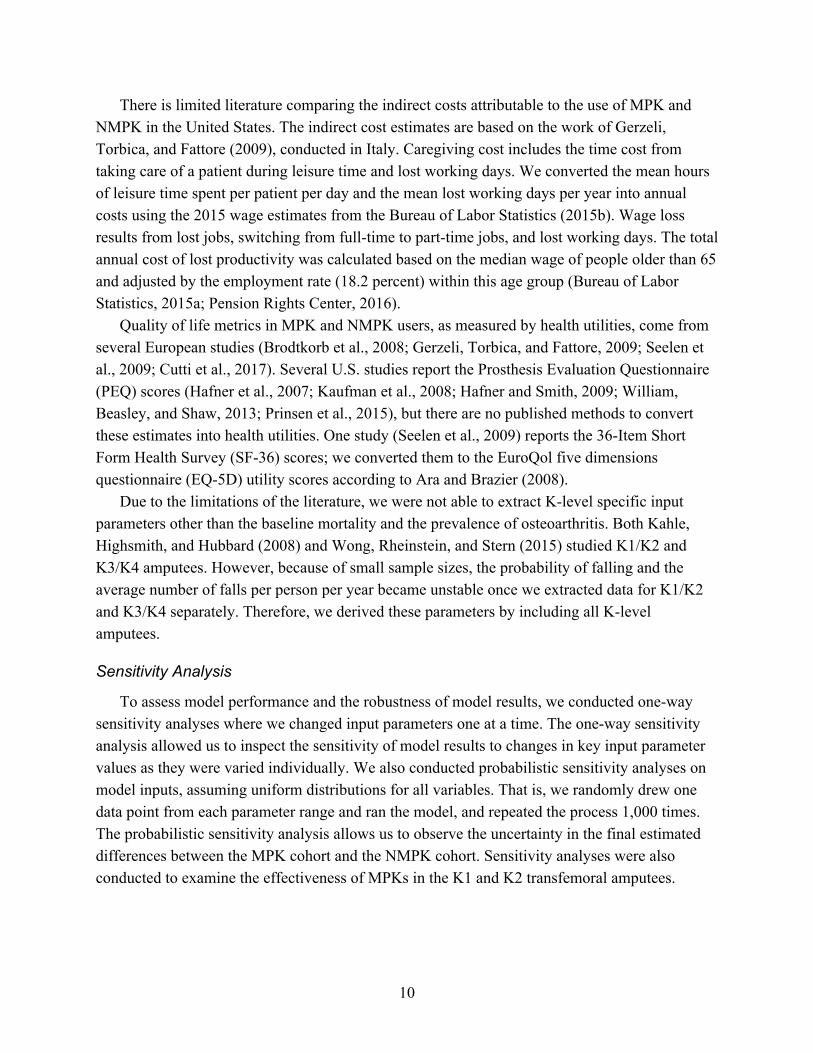
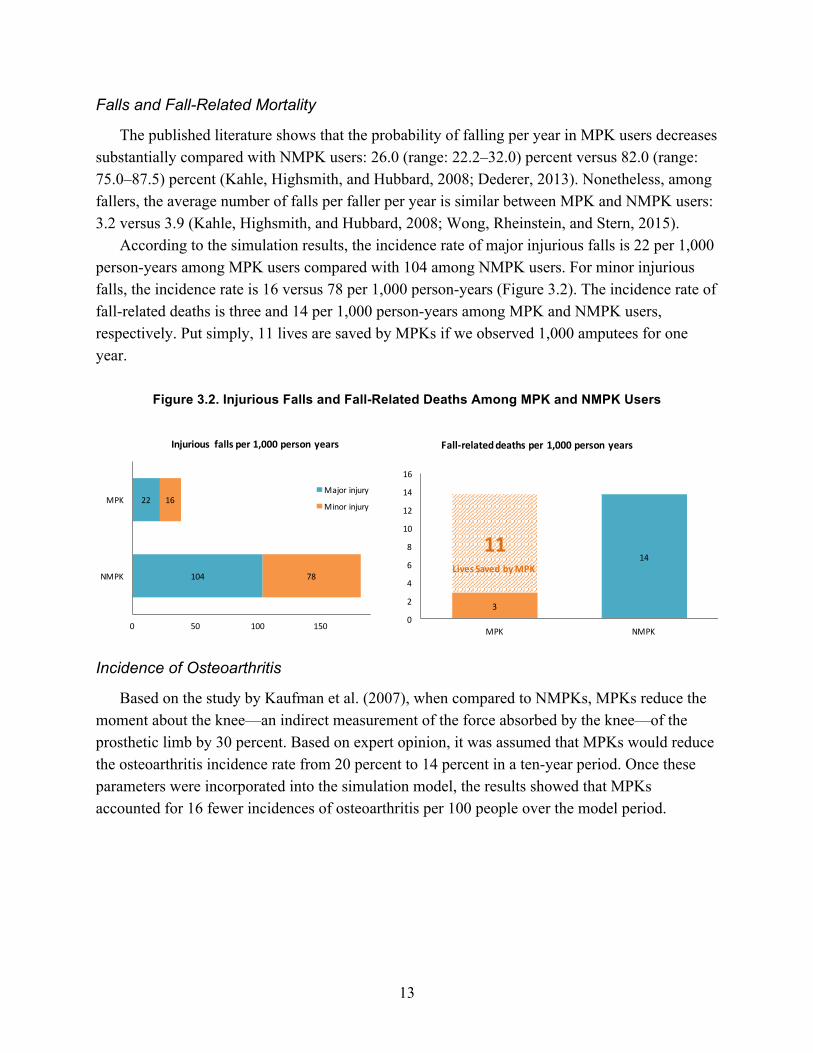
The published literature shows that the probability of falling per year in MPK users decreases substantially compared with NMPK users: 26.0 (range: 22.2–32.0) percent versus 82.0 (range: 75.0–87.5) percent (Kahle, Highsmith, and Hubbard, 2008; Dederer, 2013). Nonetheless, among fallers, the average number of falls per faller per year is similar between MPK and NMPK users: 3.2 versus 3.9 (Kahle, Highsmith, and Hubbard, 2008; Wong, Rheinstein, and Stern, 2015).
According to the simulation results, the incidence rate of major injurious falls is 22 per 1,000 person-years among MPK users compared with 104 among NMPK users. For minor injurious falls, the incidence rate is 16 versus 78 per 1,000 person-years (Figure 3.2). The incidence rate of fall-related deaths is three and 14 per 1,000 person-years among MPK and NMPK users, respectively. Put simply, 11 lives are saved by MPKs if we observed 1,000 amputees for one year.
Figure 3.2. Injurious Falls and Fall-Related Deaths Among MPK and NMPK Users
Incidence of Osteoarthritis
Based on the study by Kaufman et al. (2007), when compared to NMPKs, MPKs reduce the moment about the knee—an indirect measurement of the force absorbed by the knee—of the prosthetic limb by 30 percent. Based on expert opinion, it was assumed that MPKs would reduce the osteoarthritis incidence rate from 20 percent to 14 percent in a ten-year period. Once these parameters were incorporated into the simulation model, the results showed that MPKs accounted for 16 fewer incidences of osteoarthritis per 100 people over the model period.
104
22
78
16
0 50 100 150 200
NMPK
MPK
Injurious fallsper1,000personyears
Majorinjury
Minorinjury
3
1411
0
2
4
6
8
10
12
14
16
MPK NMPK
Fall-relateddeathsper1,000personyears
LivesSavedbyMPK

14
Quality of Life
Various instruments were used to assess subjects’ self-reported function and quality of life, including the PEQ, SF-36, and EQ-5D. Collectively, compared with NMPKs, MPKs are associated with improved quality of life.
Hafner and colleagues (2007), Hafner and Smith (2009), Kaufman and colleagues (2008), and Prinsen and colleagues (2015) compared PEQ scores when MPKs and NMPKs were used, while William, Beasley, and Shaw (2013) only assessed subjects who used MPKs. On average, subjects had a 10-percent improvement in the summary score of nine items when using MPKs. In terms of the SF-36, Seelen and colleagues (2009) reports significantly higher summary scores of nine items among all amputees as well as recent amputees when subjects wore MPKs compared with NMPKs (Figure 3.3). Overall, amputees experienced 37-percent improvement in quality of life as measured by the SF-36 when MPKs were used. Once converted, SF-36 scores correspond to an EQ-5D score of 0.92 and 0.71 for MPK and NMPK users, respectively. Brodtkorb and colleagues (2008), Gerzeli, Torbica, and Fattore (2009), and Cutti and colleagues (2017) assessed utilities among patients wearing MPKs and NMPKs using EQ-5D. On average, the MPK group scored 21-percent higher in EQ-5D than the NMPK group.
Figure 3.3. Quality of Life Among MPK and NMPK Users
SOURCES: Hafner et al., 2007;; Brodtkorb et al., 2008;; Kaufman et al., 2008;; Gerzeli, Torbica, and Fattore, 2009;; Hafner and Smith, 2009;; Seelen et al., 2009;; William, Beasley, and Shaw, 2013;; Prinsen et al., 2015;; Cutti et al.,
2017.
15
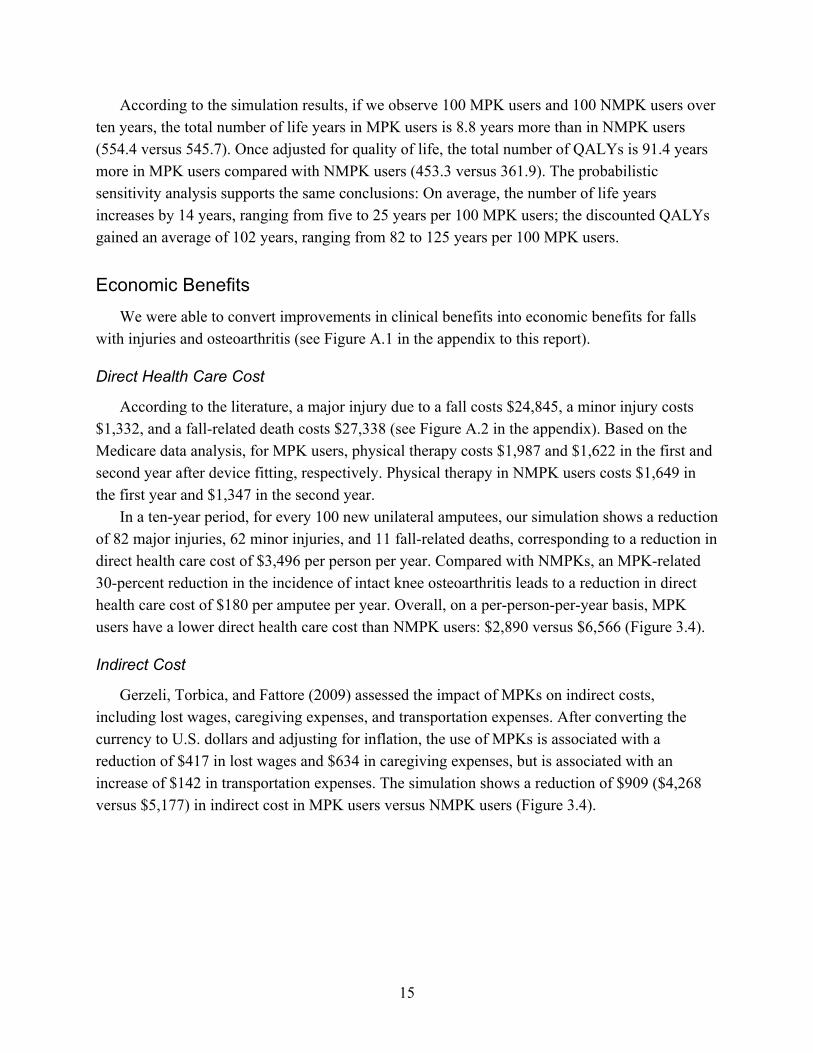
According to the simulation results, if we observe 100 MPK users and 100 NMPK users over ten years, the total number of life years in MPK users is 8.8 years more than in NMPK users (554.4 versus 545.7). Once adjusted for quality of life, the total number of QALYs is 91.4 years more in MPK users compared with NMPK users (453.3 versus 361.9). The probabilistic sensitivity analysis supports the same conclusions: On average, the number of life years increases by 14 years, ranging from five to 25 years per 100 MPK users; the discounted QALYs gained an average of 102 years, ranging from 82 to 125 years per 100 MPK users.
Economic Benefits We were able to convert improvements in clinical benefits into economic benefits for falls
with injuries and osteoarthritis (see Figure A.1 in the appendix to this report).
Direct Health Care Cost
According to the literature, a major injury due to a fall costs $24,845, a minor injury costs $1,332, and a fall-related death costs $27,338 (see Figure A.2 in the appendix). Based on the Medicare data analysis, for MPK users, physical therapy costs $1,987 and $1,622 in the first and second year after device fitting, respectively. Physical therapy in NMPK users costs $1,649 in the first year and $1,347 in the second year.
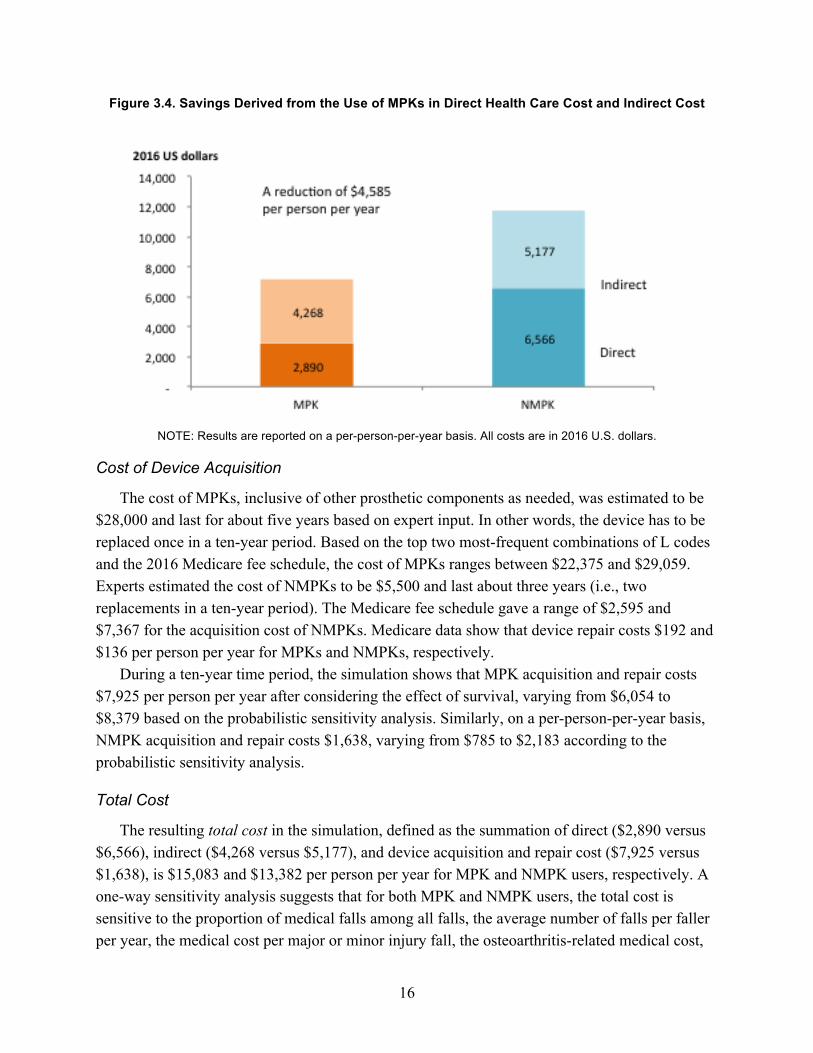
In a ten-year period, for every 100 new unilateral amputees, our simulation shows a reduction of 82 major injuries, 62 minor injuries, and 11 fall-related deaths, corresponding to a reduction in direct health care cost of $3,496 per person per year. Compared with NMPKs, an MPK-related 30-percent reduction in the incidence of intact knee osteoarthritis leads to a reduction in direct health care cost of $180 per amputee per year. Overall, on a per-person-per-year basis, MPK users have a lower direct health care cost than NMPK users: $2,890 versus $6,566 (Figure 3.4).
Indirect Cost
Gerzeli, Torbica, and Fattore (2009) assessed the impact of MPKs on indirect costs, including lost wages, caregiving expenses, and transportation expenses. After converting the currency to U.S. dollars and adjusting for inflation, the use of MPKs is associated with a reduction of $417 in lost wages and $634 in caregiving expenses, but is associated with an increase of $142 in transportation expenses. The simulation shows a reduction of $909 ($4,268 versus $5,177) in indirect cost in MPK users versus NMPK users (Figure 3.4).
16
Figure 3.4. Savings Derived from the Use of MPKs in Direct Health Care Cost and Indirect Cost
NOTE: Results are reported on a per-person-per-year basis. All costs are in 2016 U.S. dollars.
Cost of Device Acquisition
The cost of MPKs, inclusive of other prosthetic components as needed, was estimated to be $28,000 and last for about five years based on expert input. In other words, the device has to be replaced once in a ten-year period. Based on the top two most-frequent combinations of L codes and the 2016 Medicare fee schedule, the cost of MPKs ranges between $22,375 and $29,059. Experts estimated the cost of NMPKs to be $5,500 and last about three years (i.e., two replacements in a ten-year period). The Medicare fee schedule gave a range of $2,595 and $7,367 for the acquisition cost of NMPKs. Medicare data show that device repair costs $192 and $136 per person per year for MPKs and NMPKs, respectively.
During a ten-year time period, the simulation shows that MPK acquisition and repair costs $7,925 per person per year after considering the effect of survival, varying from $6,054 to $8,379 based on the probabilistic sensitivity analysis. Similarly, on a per-person-per-year basis, NMPK acquisition and repair costs $1,638, varying from $785 to $2,183 according to the probabilistic sensitivity analysis.
Total Cost
The resulting total cost in the simulation, defined as the summation of direct ($2,890 versus $6,566), indirect ($4,268 versus $5,177), and device acquisition and repair cost ($7,925 versus $1,638), is $15,083 and $13,382 per person per year for MPK and NMPK users, respectively. A one-way sensitivity analysis suggests that for both MPK and NMPK users, the total cost is sensitive to the proportion of medical falls among all falls, the average number of falls per faller per year, the medical cost per major or minor injury fall, the osteoarthritis-related medical cost,
17
and the discount rate (see Figure A.3 in the appendix). Of note, the total cost for MPK users is sensitive to device acquisition cost but the cost for NMPK users is not. Based on the probabilistic sensitivity analysis, the total cost for MPK users ranges from $8,545 to $22,551 while that for NMPK users ranges from $11,484 to $17,906 per person per year. In the best scenario, the total cost of MPKs is $5,042 lower per person per year than that of NMPKs; in the worst scenario, MPKs cost on average $5,268 more per year compared with NMPKs.
In the K1 and K2 population, the benefits of using MPKs decrease slightly compared with the K3 and K4 population, but MPKs remain cost-effective. MPKs are associated with a reduction of $4,237 per person per year in direct cost and $928 in indirect cost. The total cost associated with MPKs is $2,022 higher per person per year compared with NMPKs. In the best scenario, the total cost of MPKs is actually $5,671 lower and in the worst scenario, it is $6,074 higher than the cost of NMPKs.
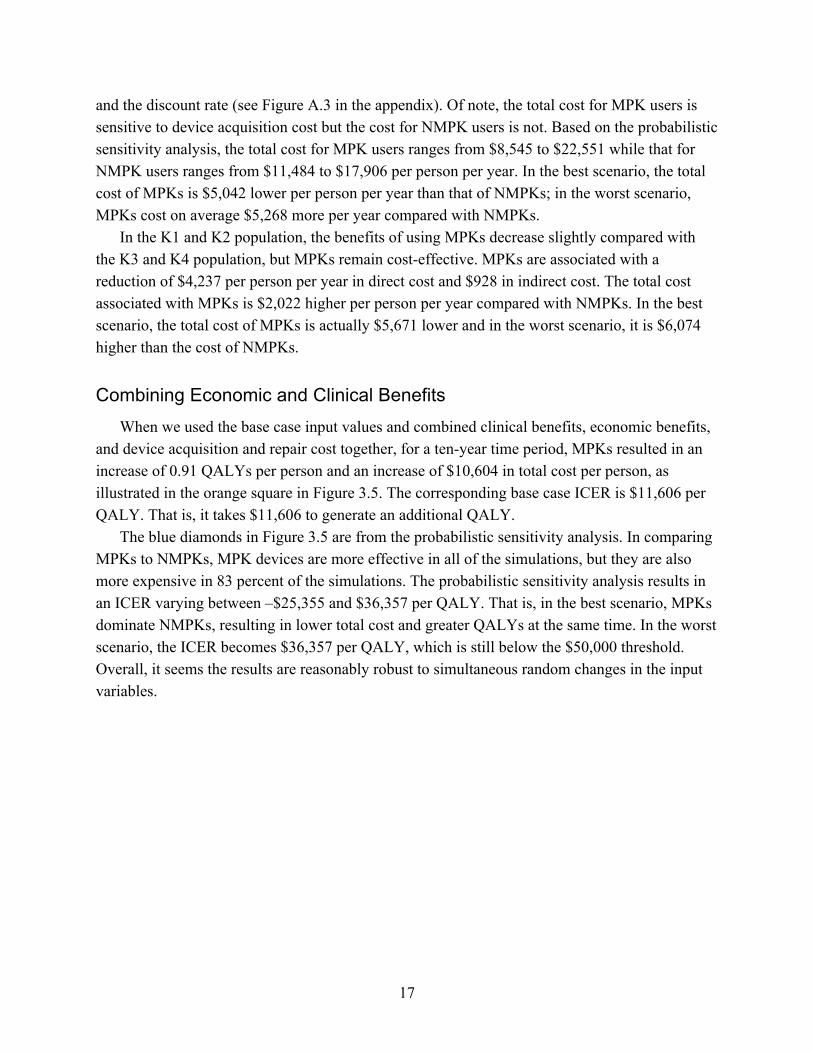
Combining Economic and Clinical Benefits When we used the base case input values and combined clinical benefits, economic benefits,
and device acquisition and repair cost together, for a ten-year time period, MPKs resulted in an increase of 0.91 QALYs per person and an increase of $10,604 in total cost per person, as illustrated in the orange square in Figure 3.5. The corresponding base case ICER is $11,606 per QALY. That is, it takes $11,606 to generate an additional QALY.
The blue diamonds in Figure 3.5 are from the probabilistic sensitivity analysis. In comparing MPKs to NMPKs, MPK devices are more effective in all of the simulations, but they are also more expensive in 83 percent of the simulations. The probabilistic sensitivity analysis results in an ICER varying between –$25,355 and $36,357 per QALY. That is, in the best scenario, MPKs dominate NMPKs, resulting in lower total cost and greater QALYs at the same time. In the worst scenario, the ICER becomes $36,357 per QALY, which is still below the $50,000 threshold. Overall, it seems the results are reasonably robust to simultaneous random changes in the input variables.
18
Figure 3.5. Incremental Cost and Effectiveness of MPKs in Comparison to NMPKs in K3/K4 Amputees
NOTE: All costs are in 2016 U.S. dollars.
In the K1 and K2 population, MPKs have an ICER of $13,568 per QALY, which is still less than the $50,000 threshold. MPKs may dominate NMPKs, as suggested in the probabilistic analysis, and have an ICER of –$28,302 per QALY, meaning they incur lower total cost and lead to higher health status than NMPKs (see Figure A.4 in the appendix). The highest ICER is $41,498 per QALY in the probabilistic sensitivity analysis.

19
Chapter Four. Discussion
Clinical Benefits Our study, the first of its kind in the prosthetics literature in the United States, demonstrates
that advanced prosthetics for transfemoral amputees, specifically MPKs, are associated with substantial clinical benefits compared with conventional knees, or NMPKs. The published literature has consistently shown functional improvements, such as improved walking speed, gait symmetry, and obstacle assessment. Improved function turns into clinical benefits, such as fewer falls, a lower incidence rate of osteoarthritis, and a lower mortality rate.
Our findings suggest that the main clinical benefit of MPKs is derived from reductions of falls with injuries and osteoarthritis incidences, which is plausible from a functional perspective. The computer software in MPKs allows for the knee to dynamically adjust to uneven terrain, leading to improved stability and user confidence. The increased stability is thought to reduce cognitive burden and energy expenditure (Highsmith et al., 2010). The combination of these aspects is assumed to reduce the risk of falls (Hafner and Smith, 2009; Hafner and Askew, 2015). This reduction in falls is primarily a consequence of a lower probability of falling: MPK users are about two-thirds less likely to have any falls than NMPK users (26 percent versus 82 percent), whereas the average number of falls among fallers does not differ much between MPK and NMPK users. The fact that MPK users are two times less likely to become fallers is critical, as it helps MPK users avoid fall-related injuries, expenses, and mortalities completely. To illustrate, if we observed 1,000 people for one year, MPK users would experience 82 fewer falls with major injuries, 62 fewer falls with minor injuries, and 11 fewer deaths.
Another key improvement in biomechanics in MPK users is the reduction in the knee moment, which is a surrogate for the force an individual absorbs when striking the ground during walking. NMPKs do not dynamically adjust to uneven ground, and therefore NMPK users are exposed to stronger forces than MPK users are due to the need for compensation. The forces are absorbed by the lower limb joints of the intact limb and increase the burden on the healthy knee, hip, and ankle, which is the expected mechanism through which osteoarthritis develops in the healthy limb (Felson, 2013).
In addition, there are hypothesized effects of MPKs on other clinical outcomes, such as low-back pain, residual limb tissue injury, obesity, diabetes, cardiovascular disease, and depression, that we could not quantify due to the lack of data in the published literature. Transfemoral amputation leads to impairment of body function, such as changed gait pattern, balance problems, low-back pain, osteoarthritis, and soft tissue injuries. Because MPKs mitigate these issues better than NMPKs, theoretically, MPKs would reduce musculoskeletal problems including low-back pain and soft tissue injuries as well. Better mobility due to the use of MPKs

20
may enable amputees to live independently and may increase the chance of participation in the workforce or social activities, which could be related to the incidence of depression. Better mobility could also potentially lead to more physical activity and thus, in the long run, reduce the incidence of obesity, diabetes, and cardiovascular disease. However, robust evidence from long-term studies is needed to support the claim of such benefits of MPKs.
MPK users gain about 0.09 life years per person over a ten-year time period compared with NMPK users, but about 0.91 QALYs per person, with the difference attributed to the improvement in quality of life. This finding is consistent with prior evidence that MPKs are associated with improved mobility, safety, user confidence, activities of daily living, ability to live independently, and satisfaction, and thus substantially better quality of life for amputees, with improvements ranging from 10 percent to 37 percent (Berry, Olson, and Larntz, 2009; Theeven et al., 2011; Theeven et al., 2012; Sawers and Hafner, 2013; Kannenberg, Zacharias, and Pröbsting, 2014).
Economic Benefits Once translated into economic benefits, we found that MPKs are associated with large
reductions in direct health care cost and indirect cost and provide good value for the money, after considering device acquisition and repair costs.
On the benefit side, MPKs are associated with a reduction of $3,676 per person per year in direct health care cost and $909 per person per year in indirect cost, such as lost wages and caregiving expenses. The majority of economic benefits comes from the reduction in falls, accounting for about 95 percent of direct health care cost reduction, and the improvement in quality of life. Because of the higher cost of MPK devices, overall annual cost is $15,083 per MPK patient and $13,382 per NMPK patient, a net increase of $1,702, based on current payment levels for devices and repair services.
As we explained earlier, a cost-effectiveness analysis evaluates whether incremental spending for a medical technology is commensurate with its incremental cost by calculating incremental cost per QALY gained, referred to as ICER. In some cases where a medical innovation leads to net cost savings, i.e., reduces direct and indirect cost by more than the additional cost of the innovation, its ICER would be negative. A majority of medical innovations would result in a positive ICER, where a new technology leads to better health but costs more than conventional technologies. While no nationally binding ICER threshold exists in the United States, experts have argued that a range of $50,000 to $150,000 should be used (Weinstein, 2008; Neumann, Cohen, and Weinstein, 2014; Institute for Clinical and Economic Review, 2017). Simply speaking, spending between $50,000 and $150,000 to gain one QALY is regarded as acceptable value for money.
21
Over a ten-year time horizon, compared with NMPKs, MPKs increase QALYs by 0.91 per person for additional payments of $10,604. That is, MPKs have an ICER of $11,606 per QALY, which is substantially less than the lower bound of the accepted threshold for value for money.
Our sensitivity analysis, which estimates a range from –$25,355 to $36,357 per QALY, underscores the robustness of this finding. The estimated range implies that, in the best case, MPKs actually cost less than NMPKs due to reduction in health care costs and indirect costs; even in the worst case, MPKs cost an additional $36,357 for every QALY gained, which is still well below the $50,000 threshold.
That said, we should be aware that U.S. law does not allow CMS to use cost-effectiveness criteria to make coverage decisions, but specifies that technologies must be covered if they are necessary and reasonable for diagnosis or treatment of conditions, which has not been clearly defined. Nevertheless, prior research shows cost-effective technologies are more likely to get coverage and fewer restrictions on access (Chambers et al., 2012).
The economic benefits of MPKs are comparable to other medical technologies commonly reimbursed by U.S. payers. We reviewed the literature on total knee arthroplasty and prophylactic cardioverter defibrillator implantation, two commonly used devices in the Medicare population, and found that the average ICERs for these two technologies are $14,572 and $76,396 per QALY, respectively (Losina et al., 2009; Ruiz et al., 2013; Waimann et al., 2014; García-Pérez et al., 2015; Elmallah et al., 2017). It appears that the economic benefits of MPKs are comparable to those of total knee replacement and better than the implantable cardioverter defibrillator. Therefore, MPKs do provide good value for money from a societal perspective.
Limitations In general, there is a dearth of research that compares advanced prosthetics with conventional
prosthetics directly, specifically MPKs to NMPKs. For a number of model parameters, we had to use published studies examining a nonamputee population. For example, the proportion of medical falls to all falls came from the nonamputee literature. We also needed to make the assumption that the cost of osteoarthritis in an amputee population was similar to that in a nonamputee population. The estimates of these model parameters from a nonamputee population could be different for an amputee population.
The quality of the studies used to extract model parameters was not ideal in terms of sample size, observation period, and the population examined. The existing studies that compare MPKs and NMPKs are either prospective or retrospective cohort studies, but they often have small sample sizes that could lead to large uncertainty in estimates of the impact of MPKs. For example, the two studies used to derive the average number of falls per faller have a sample size of 19 and eight, respectively (Kahle, Highsmith, and Hubbard, 2008; Wong, Rheinstein, and Stern, 2015). Lacking other sources that better represent the target population, we included the

22
estimates for probability of falling from a dissertation by Dederer (2013), which is based on a relatively large sample of 151 community-dwelling transfemoral amputees.
The absence of literature also represents a major limitation in determining costs associated with osteoarthritis. While it is generally accepted that differences in gait mechanics manifest in the development of osteoarthritis, there are no studies that demonstrate the causality. Expert consultation suggested that knee moments may represent a reasonable surrogate for the development of osteoarthritis; however, in the absence of long-term studies, it is a true limitation.
In addition, studies comparing MPKs to NMPKs are short-term in nature, with an observation period varying between several weeks to one year. For the studies with an observation period of less than one year, we had to extrapolate the findings beyond the study period for modeling purposes. One limitation of having short-term studies is that long-term health outcomes have not been studied, such as obesity, diabetes, and cardiovascular diseases. Because we were not able to include these long-term outcomes, we might have underestimated the economic impact of MPKs. This also affected our decision to model the economic outcomes for a ten-year time horizon, although it is likely sufficient for payers’ decisionmaking.
Another limitation of existing studies is that they focus on younger amputees and K3 or K4 amputees and, as a result, the effects of MPKs on various outcomes might not be the same in the Medicare population. For the same reason, we do not have strong confidence in the sensitivity analyses for the K1 and K2 population based on current data, where the differences from the main analysis were the baseline mortality and the prevalence of osteoarthritis.
One potential bias in the estimates of the impact of MPKs could be due to the industry sponsorship of the studies cited. One of the three studies, from which the probability of falling and the average number of falls per faller per year were extracted, was sponsored by the industry (Wong, Rheinstein, and Stern, 2015). Two out of the four studies contributing to the health utilities of MPKs were partially funded by the industry (Brodtkorb et al., 2008; Gerzeli, Torbica, and Fattore, 2009). Nevertheless, all industry-sponsored studies were conducted by academic researchers.
Finally, there are limitations of ICERs. For example, the numerator of an ICER, or the cost difference between two devices, is influenced by current payment levels. If payment levels of MPKs and NMPKs change in the future, the ICERs will change accordingly. Also, by default, MPKs are compared with NMPKs when calculating ICERs. However, it is possible that some amputees do not use NMPKs because of their limited functional improvement. The emergence of MPK technology may lead to MPK usage among these amputees. In this scenario, MPKs should be compared with no prosthetic knees, for which we do not have data at this point.

23
Chapter Five. Conclusion
Our study represents the first attempt to quantify the economic benefits of MPKs in the United States. Given the gaps in current knowledge, more studies are needed to expand the evidence on advanced prosthetics and to validate and refine our estimates. More research should be conducted in the areas of falls, fall-related costs, and osteoarthritis to either confirm the findings from the few existing studies we cited or fill the knowledge gaps for the amputee population. For example, the probabilities of falls and the average number of falls per faller per year were based on only three studies and most fall-related cost data came from studies of nonamputee populations. Similarly, more studies should be conducted to link osteoarthritis to the type of prosthetic used, because the current analysis is based on expert opinion. To further develop the simulation model, in the short term, studies can be conducted to establish the link between type of prosthetics and the quantifiable biomechanical metrics that can be connected to health outcomes based on existing studies. For example, external flexion moments associated with knee instability, or external adduction moments, have been demonstrated to be associated with osteoarthritis or cause varus deformity (Henriksen et al., 2014), but little research has examined the relationship between destabilizing external moments in transfemoral amputees and knee devices. More importantly, long-term population-based studies are often required to establish the link between type of prosthetics and health outcomes that can only be measured during a long observation time period, including obesity, diabetes, or cardiovascular disease. The prosthetics research community may leverage existing medical record data and claims data, or establish patient registries for prosthetics users and accumulate data for future long-term studies. Finally, it might be fruitful to develop methodologies to convert PEQ scores to health utility scores, or develop a preference-weighted utility score system directly, which can be used for quality of life adjustment purposes.
Given the rapid advances in prosthetics technologies, the reimbursement system often lags behind and such challenges may signify a need to shift the dialogue from a cost-driven payment approach to a value-based payment approach, which is consistent with where the U.S. health care system is headed. For example, CMS is moving quickly toward the goal of tying 50 percent of payments to value by 2018 (CMS, 2016). The prosthetics industry and payers may consider similar payment arrangements for prosthetics. As a matter of fact, the prosthetics industry has a good start because the current L code–based system bundles devices and services together, probably due to a significant need for customization in fitting; such a bundled payment method is exactly what CMS is advocating for joint replacement and treatments of other medical conditions. In contrast, cost-driven payment approaches, such as competitive bidding, tend to separate prosthetics from services, which could potentially negatively impact patient outcomes because prosthetics fitting requires significant customization. However, in setting up a payment
24
system to tie payments to outcomes associated with L codes or incorporate risk-sharing arrangements, sophisticated methodologies and robust evidence have to be developed. The industry has recognized the need for evidence, as reflected in AOPA’s Prosthetics 2020 Initiative that will build the infrastructure needed for evidence generation, such as establishing patient registries and collecting clinical and economic data. The initiative will help facilitate such a transition, while our analysis and the research gaps identified could serve as a good starting point.
In summary, the existing published literature shows that among transfemoral amputees, MPKs are superior to NMPKs in improving parameters of physical function, such as walking speed, gait symmetry, and obstacle assessments. Those improvements lead to fewer falls and lower incidences of osteoarthritis in the intact limb. Economically speaking, MPKs also provide good value for the money compared with NMPKs. The economic benefits of MPKs are comparable to widely reimbursed technologies, such as total knee replacement and the implantable cardioverter defibrillator. It should be emphasized that the current analysis probably underestimates the clinical benefit and thus the value for money of MPKs because the effect on a number of outcomes, such as back pain and cardiovascular disease, could not be included in the model due to lack of data. If they become available, those data may increase the overall impact of MPKs. More long-term population-based studies are warranted to overcome the limitations of existing studies and provide better evidence for a value-based payment system for prosthetics.

25
Appendix
Table A.1. Medicare Functional Classification Levels
K-Level Descriptor Foot/Ankle Knee
K0 This patient does not have the ability or potential to ambulate or transfer safely with or without assistance, and a prosthesis does not enhance his or her quality of life or mobility
Not eligible for prosthesis
Not eligible for prosthesis
K1 This patient has the ability or potential to use a prosthesis for transfers or ambulation on level surfaces at fixed cadence—a typical limited or unlimited household ambulator
External keel, SACH feet, or single-axis ankle/feet
Single-axis, constant-friction knee
K2 This patient has the ability or potential for ambulation with the ability to traverse low-level environmental barriers, such as curbs, stairs, or uneven surfaces—a typical community ambulator
Flexible-keel feet and multiaxial ankle/feet
Single-axis, constant-friction knee
K3 This patient has the ability or potential for ambulation with variable cadence—a typical community ambulator with the ability to traverse most environmental barriers and may have vocational, therapeutic, or exercise activity that demands prosthetic use beyond simple locomotion
Flex-foot and flex-walk systems, energy-storing feet, multiaxial ankle/feet, or dynamic-response feet
Fluid and pneumatic-control knees
K4 This patient has the ability or potential for prosthetic ambulation that exceeds basic ambulation skills, exhibiting high impact, stress, or energy levels—typical of the prosthetic demands of the child, active adult, or athlete
Any are appropriate Any are appropriate
SOURCE: Table data found in Hafner and Smith, 2009, and derived from CMS. NOTE: SACH = solid ankle cushion heel.
26
Table A.2. Baseline Characteristics of Medicare Patients with a Unilateral Transfemoral Amputation, 2011–2014
Characteristics K1/K2 Patients
K3/K4 Patients
NMPK Prosthetics MPK Prosthetics NMPK Prosthetics CPT codes Presence of L5321
but not the CPT codes for MPKs
Presence of L5321 and any of the following codes: L5856, L5857, L5858, L5859
Presence of L5321 but not the CPT codes for MPK
Number of patients 878 549 348 Age Mean 72.5 65.0 66.2 Standard deviation 11.1 12.3 11.9 1st percentile 47 29 30 25th percentile 66 58 59 50th percentile (median) 72 67 67 75th percentile 81 73 73 99th percentile 94 88 92
Gender Female 44.8% 25.7% 33.9%
Race/ethnicity White 59.0% 77.6% 57.8% Black 28.8% 16.4% 32.8% Hispanic and other 12.2% 6.0% 9.5%
All-cause mortality Death within 1 year of device fitting 20.2% 6.0% 13.5% Death within 2 years of device fitting 32.8% 12.2% 26.1%
Etiology Trauma 41.3% 37.5% 39.1% Vascular disease 56.8% 56.5% 56.9% Cancer * 2.7% * Other * 3.3% *
Chronic conditions Obesity 5.9% 6.4% 4.9% Diabetes 61.8% 45.2% 54.6% Rheumatoid arthritis/osteoarthritis 45.8% 41.7% 39.4% Low-back pain 28.2% 29.5% 30.5% Depression 29.2% 24.8% 25.6% Acute myocardial infarction 5.5% 3.1% 6.0% Ischemic heart disease 69.5% 58.8% 62.1% Stroke/transient ischemic attack 13.9% 7.5% 9.5% Chronic obstructive pulmonary disease 35.4% 27.7% 37.9% Atrial fibrillation 17.7% 12.2% 12.9%

27
Characteristics K1/K2 Patients
K3/K4 Patients
NMPK Prosthetics MPK Prosthetics NMPK Prosthetics Heart failure 48.3% 25.7% 36.2% Hypertension 88.7% 78.3% 83.3% Osteoarthritis (hip) 9.1% 8.4% 8.3% Osteoarthritis (knee) 16.3% 20.6% 16.7%
NOTES: CPT = Current Procedure Terminology. The analysis included all patients who had a unilateral transfemoral amputation and received a prosthetic device during 2012–2013, allowing for a 12-month observation period pre- and postdevice fitting for baseline and follow-up, respectively. There was a total of 2,635 Medicare beneficiaries included in the analysis, with 860 of them having a missing K-level classification. After 2011, only K3 or K4 patients were eligible for MPKs under Medicare reimbursement rules. The mortality rate for K1/K2 and K3/K4 patients is 18.0 percent and 9.3 percent, respectively, and the knee osteoarthritis prevalence is 16.3 percent and 19.1 percent, respectively. Asterisks indicate device categories and cells with fewer than 11 observations (including zero) or are otherwise blinded for Health Insurance Portability and Accountability Act (HIPAA) compliance.
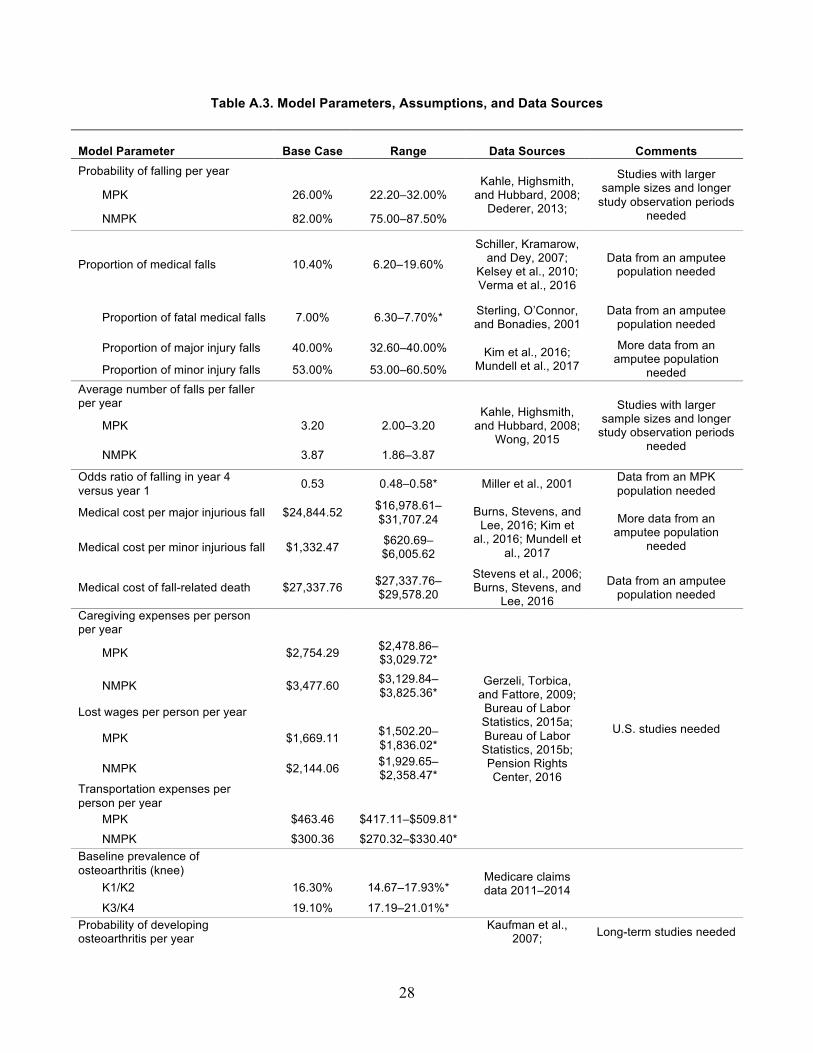
28
Table A.3. Model Parameters, Assumptions, and Data Sources
Model Parameter Base Case Range Data Sources Comments Probability of falling per year
Kahle, Highsmith, and Hubbard, 2008;; Dederer, 2013;;
Studies with larger sample sizes and longer study observation periods
needed
MPK 26.00% 22.20–32.00%
NMPK 82.00% 75.00–87.50%
Proportion of medical falls 10.40% 6.20–19.60%
Schiller, Kramarow, and Dey, 2007;;
Kelsey et al., 2010;; Verma et al., 2016
Data from an amputee population needed
Proportion of fatal medical falls 7.00% 6.30–7.70%* Sterling, O’Connor, and Bonadies, 2001
Data from an amputee population needed
Proportion of major injury falls 40.00% 32.60–40.00% Kim et al., 2016;; Mundell et al., 2017
More data from an amputee population
needed Proportion of minor injury falls 53.00% 53.00–60.50% Average number of falls per faller per year
Kahle, Highsmith, and Hubbard, 2008;;
Wong, 2015
Studies with larger sample sizes and longer study observation periods
needed
MPK 3.20 2.00–3.20
NMPK 3.87 1.86–3.87
Odds ratio of falling in year 4 versus year 1 0.53 0.48–0.58* Miller et al., 2001 Data from an MPK
population needed
Medical cost per major injurious fall $24,844.52 $16,978.61–$31,707.24 Burns, Stevens, and
Lee, 2016;; Kim et al., 2016;; Mundell et
al., 2017
More data from an amputee population
needed Medical cost per minor injurious fall $1,332.47 $620.69–$6,005.62
Medical cost of fall-related death $27,337.76 $27,337.76–$29,578.20
Stevens et al., 2006;; Burns, Stevens, and
Lee, 2016
Data from an amputee population needed
Caregiving expenses per person per year
Gerzeli, Torbica, and Fattore, 2009;; Bureau of Labor Statistics, 2015a;; Bureau of Labor Statistics, 2015b;; Pension Rights Center, 2016
U.S. studies needed
MPK $2,754.29 $2,478.86–$3,029.72*
NMPK $3,477.60 $3,129.84–$3,825.36*
Lost wages per person per year MPK $1,669.11 $1,502.20–
$1,836.02*
NMPK $2,144.06 $1,929.65–$2,358.47*
Transportation expenses per person per year
MPK $463.46 $417.11–$509.81* NMPK $300.36 $270.32–$330.40*
Baseline prevalence of osteoarthritis (knee) Medicare claims
data 2011–2014
K1/K2 16.30% 14.67–17.93%*
K3/K4 19.10% 17.19–21.01%* Probability of developing osteoarthritis per year
Kaufman et al., 2007;; Long-term studies needed
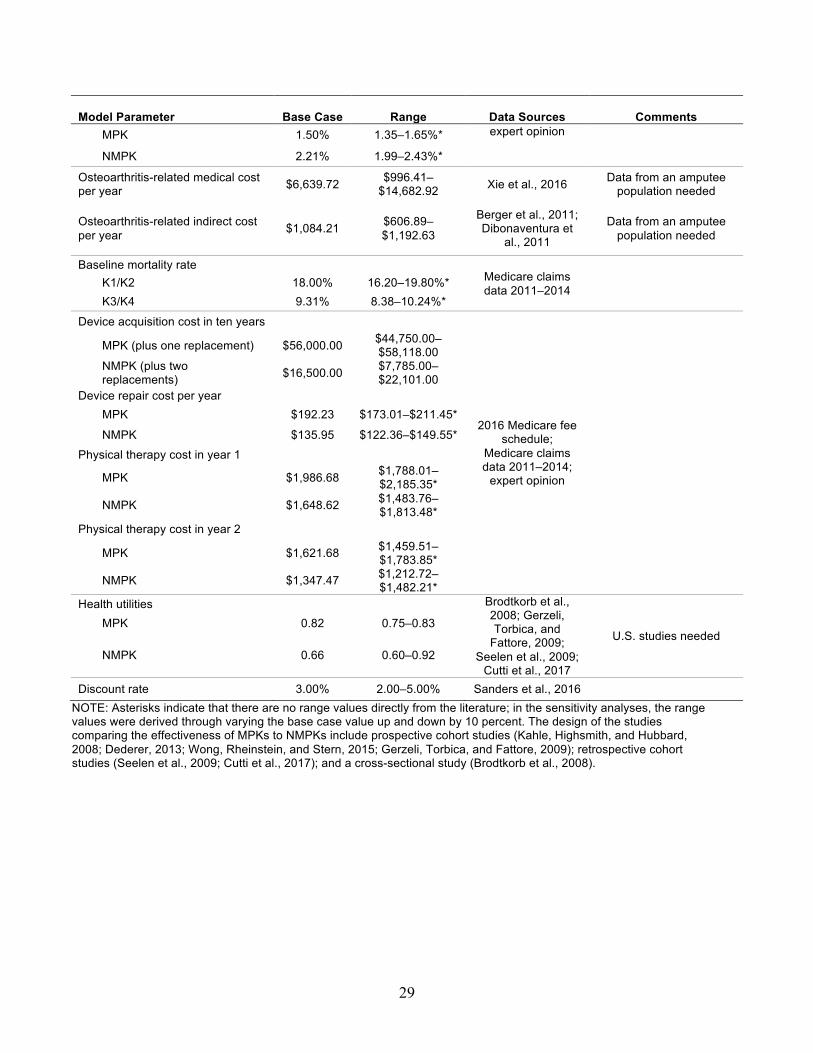
29
Model Parameter Base Case Range Data Sources Comments MPK 1.50% 1.35–1.65%* expert opinion
NMPK 2.21% 1.99–2.43%*
Osteoarthritis-related medical cost per year $6,639.72 $996.41–
$14,682.92 Xie et al., 2016 Data from an amputee population needed
Osteoarthritis-related indirect cost per year $1,084.21 $606.89–
$1,192.63
Berger et al., 2011;; Dibonaventura et
al., 2011
Data from an amputee population needed
Baseline mortality rate Medicare claims data 2011–2014 K1/K2 18.00% 16.20–19.80%*
K3/K4 9.31% 8.38–10.24%* Device acquisition cost in ten years
2016 Medicare fee schedule;;
Medicare claims data 2011–2014;; expert opinion
MPK (plus one replacement) $56,000.00 $44,750.00–$58,118.00
NMPK (plus two replacements) $16,500.00 $7,785.00–
$22,101.00 Device repair cost per year
MPK $192.23 $173.01–$211.45*
NMPK $135.95 $122.36–$149.55* Physical therapy cost in year 1
MPK $1,986.68 $1,788.01–$2,185.35*
NMPK $1,648.62 $1,483.76–$1,813.48*
Physical therapy cost in year 2 MPK $1,621.68 $1,459.51–
$1,783.85*
NMPK $1,347.47 $1,212.72–$1,482.21*
Health utilities Brodtkorb et al., 2008;; Gerzeli, Torbica, and Fattore, 2009;;
Seelen et al., 2009;; Cutti et al., 2017
U.S. studies needed MPK 0.82 0.75–0.83
NMPK 0.66 0.60–0.92
Discount rate 3.00% 2.00–5.00% Sanders et al., 2016 NOTE: Asterisks indicate that there are no range values directly from the literature;; in the sensitivity analyses, the range values were derived through varying the base case value up and down by 10 percent. The design of the studies comparing the effectiveness of MPKs to NMPKs include prospective cohort studies (Kahle, Highsmith, and Hubbard, 2008;; Dederer, 2013;; Wong, Rheinstein, and Stern, 2015;; Gerzeli, Torbica, and Fattore, 2009);; retrospective cohort studies (Seelen et al., 2009;; Cutti et al., 2017);; and a cross-sectional study (Brodtkorb et al., 2008).

30
Figure A.1. Potential Pathways Through Which MPKs Impact Clinical and Economic Outcomes
NOTE: CVD: cardiovascular diseases. The boxes with type in white represent the medical conditions for which we
could not find data in the literature.
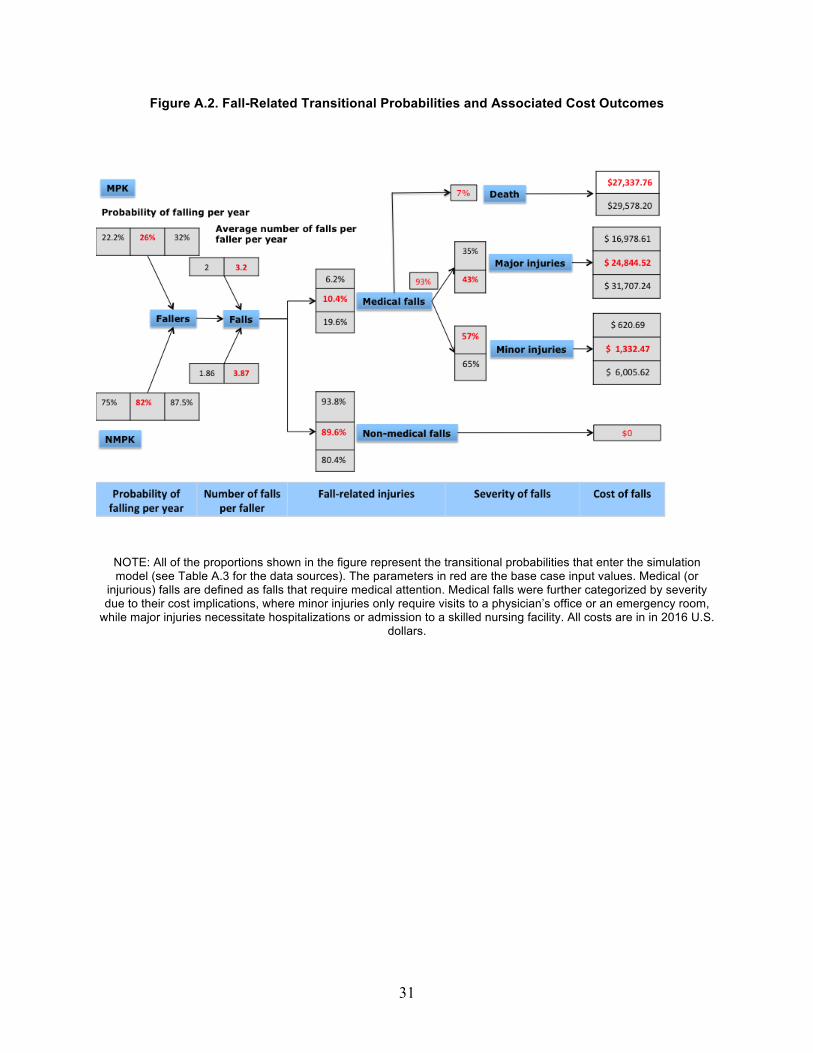
31
Figure A.2. Fall-Related Transitional Probabilities and Associated Cost Outcomes
NOTE: All of the proportions shown in the figure represent the transitional probabilities that enter the simulation model (see Table A.3 for the data sources). The parameters in red are the base case input values. Medical (or injurious) falls are defined as falls that require medical attention. Medical falls were further categorized by severity due to their cost implications, where minor injuries only require visits to a physician’s office or an emergency room, while major injuries necessitate hospitalizations or admission to a skilled nursing facility. All costs are in in 2016 U.S.
dollars.

32
Figure A.3. One-Way Sensitivity Analysis of Total Cost
NOTE: The red bars represent reductions in total cost per person per year, whereas the blue bars represent increases in total cost. All costs are in 2016 U.S. dollars.
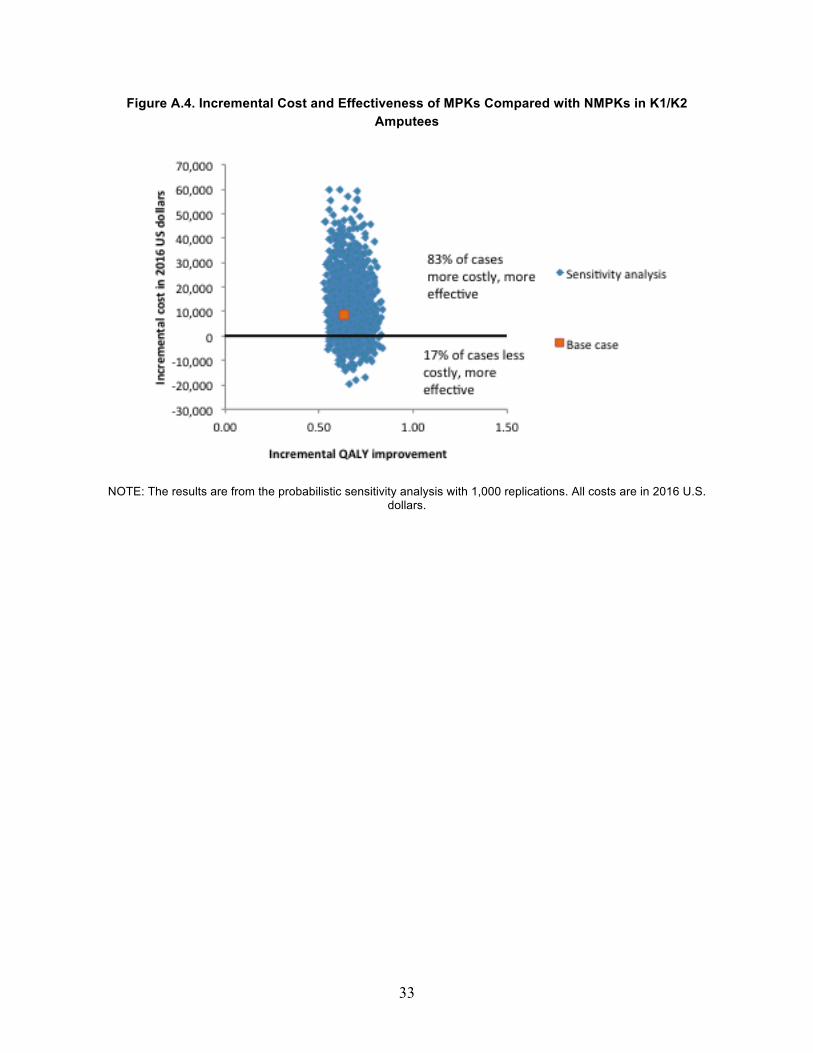
33
Figure A.4. Incremental Cost and Effectiveness of MPKs Compared with NMPKs in K1/K2 Amputees
NOTE: The results are from the probabilistic sensitivity analysis with 1,000 replications. All costs are in 2016 U.S. dollars.

34
References
Adams, Patricia F., Gerry E. Hendershot, and Marie A. Marano, “Current Estimates from the National Health Interview Survey, 1996,” Vital and Health Statistics, Vol. 10, No. 200, 1999, pp. 1–203.
American Orthotic and Prosthetic Association, “Breaking News: DME MACs Issue Draft Policy Revision for Lower Limb Prostheses,” July 16, 2015. As of January 15, 2016: http://www.aopanet.org/2015/07/breaking-news-dme-macs-issue-draft-policy-revision-for-lower-limb-prostheses
AOPA—See American Orthotic and Prosthetic Association.
Ara, Roberta, and John Brazier, “Deriving an Algorithm to Convert the Eight Mean SF-36 Dimension Scores into a Mean EQ-5D Preference-Based Score from Published Studies (Where Patient Level Data Are Not Available),” Value in Health, Vol. 11, No. 7, 2008, pp. 1131–1143.
Bellmann, Malte, Thomas Schmalz, and Siegmar Blumentritt, “Comparative Biomechanical Analysis of Current Microprocessor-Controlled Prosthetic Knee Joints,” Archives of Physical Medicine and Rehabilitation, Vol. 91, No. 4, 2010, pp. 644–652.
Berger, Ariel, Craig Hartrick, John Edelsberg, Alesia Sadosky, and Gerry Oster, “Direct and Indirect Economic Costs Among Private-Sector Employees with Osteoarthritis,” Journal of Occupational and Environmental Medicine, Vol. 53, No. 11, 2011, pp. 1228–1235.
Berry, Dale, Mark D. Olson, and Kinley Larntz, “Perceived Stability, Function, and Satisfaction Among Transfemoral Amputees Using Microprocessor and Nonmicroprocessor Controlled Prosthetic Knees: A Multicenter Survey,” Journal of Prosthetics and Orthotics, Vol. 21, No. 1, 2009, pp. 32–42.
Brodtkorb, Thor-Henrik, Martin Henriksson, Kasper Johannesen-Munk, and Fredrik Thidell, “Cost-Effectiveness of C-Leg Compared with Non-Microprocessor-Controlled Knees: A Modeling Approach,” Archives of Physical Medicine and Rehabilitation, Vol. 89, No. 1, 2008, pp. 24–30.
Bureau of Labor Statistics, “Labor Force Statistics from the Current Population Survey—Employment Status of the Civilian Noninstitutional Population by Age, Sex, and Race,” 2015a. As of May 5, 2016: https://www.bls.gov/cps/aa2015/cpsaat03.htm

35
Bureau of Labor Statistics, “May 2015 National Occupational Employment and Wage Estimates,” 2015b. As of May 5, 2016: https://www.bls.gov/oes/current/oes_nat.htm
Bureau of Labor Statistics, “Consumer Price Index—All Items and Medical Care (2000–2016),” 2017. As of February 14, 2017: https://www.bls.gov/cpi/data.htm
Burke, M. J., V. Roman, and V. Wright, “Bone and Joint Changes in Lower Limb Amputees,” Annals of the Rheumatic Diseases, Vol. 37, No. 3, 1978, pp. 252–254.
Burns, Elizabeth R., Judy A. Stevens, and Robin Lee, “The Direct Costs of Fatal and Non-Fatal Falls Among Older Adults—United States,” Journal of Safety Research, Vol. 58, 2016, pp. 99–103.
Centers for Disease Control and Prevention, “Limb Loss Awareness,” April 20, 2015.
Centers for Medicare and Medicaid Services, “Better Care. Smarter Spending. Healthier People: Improving Quality and Paying for What Works,” fact sheet, 2016. As of March 25, 2016: https://www.cms.gov/Newsroom/MediaReleaseDatabase/Fact-sheets/2016-Fact-sheets-items/2016-03-03-2.html
Chambers, James D., Stephen Morris, Peter J. Neumann, and Martin J. Buxton, “Factors Predicting Medicare National Coverage: An Empirical Analysis,” Medical Care, Vol. 50, No. 3, 2012, pp. 249–256.
CMS—See Centers for Medicare and Medicaid Services.
Cutti, Andrea Giovanni, Emanuele Lettieri, Martina Del Maestro, Giovanni Radaelli, Martina Luchetti, Gennero Verni, and Cristina Masella, “Stratified Cost-Utility Analysis of C-Leg Versus Mechanical Knees: Findings from an Italian Sample of Transfemoral Amputees,” Prosthetics and Orthotics International, Vol. 41, No. 3, 2017, pp. 227–236.
Datta, Dipak, Ben Heller, and John Howitt, “A Comparative Evaluation of Oxygen Consumption and Gait Pattern in Amputees Using Intelligent Prostheses and Conventionally Damped Knee Swing-Phase Control,” Clinical Rehabilitation, Vol. 19, No. 4, 2005, pp. 398–403.
Dederer, L., Quality of Life of Amputee Patients After Supply with the Electronically Controlled Knee Pass Part “C-Leg”: Prospective Consultation of Patients with Care, dissertation (in German), Westfälische Wilhelms-Universität Münster, Germany, 2013.
Dibonaventura, Marco daCosta, Shaloo Gupta, Margaret McDonald, and Alesia Sadosky, “Evaluating the Health and Economic Impact of Osteoarthritis Pain in the Workforce: Results from the National Health and Wellness Survey,” BMC Musculoskeletal Disorders, Vol. 12, No. 83, 2011, pp. 1–9.

36
Dillingham, Timothy R., and Liliana E. Pezzin, “Postacute Care Services Use for Dysvascular Amputees: A Population-Based Study of Massachusetts,” American Journal of Physical Medicine & Rehabilitation, Vol. 84, No. 3, 2005, pp. 147–152.
Elmallah, Randa K., Morad Chughtai, Anton Khlopas, Manoshi Bhowmik-Stoker, Kevin J. Bozic, Steven M. Kurtz, and Michael A. Mont, “Determining Cost-Effectiveness of Total Hip and Knee Arthroplasty Using the Short Form-6D Utility Measure,” Journal of Arthroplasty, Vol. 32, No. 2, 2017, pp. 351–354.
Felson, D. T., “Osteoarthritis as a Disease of Mechanics,” Osteoarthritis and Cartilage, Vol. 21, No. 1, 2013, pp. 10–15.
Gailey, Robert, Kerry Allen, Julie Castles, Jennifer Kucharik, and Mariah Roeder, “Review of Secondary Physical Conditions Associated with Lower-Limb Amputation and Long-Term Prosthesis Use,” Journal of Rehabilitation Research and Development, Vol. 45, No. 1, 2008, pp. 15–29.
Gailey, Robert S., Kathryn E. Roach, E. Brooks Applegate, Brandon Cho, Bridgid Cunniffe, Stephanie Licht, Melanie Maguire, and Mark S. Nash, “The Amputee Mobility Predictor: An Instrument to Assess Determinants of the Lower-Limb Amputee’s Ability to Ambulate,” Archives of Physical Medicine and Rehabilitation, Vol. 83, No. 5, 2002, pp. 613–627.
García-Pérez, Lidia, Pilar Pinilla-Domínguez, Antonio García-Quintana, Eduardo Caballero-Dorta, F. Javier García-García, Renata Linertová, and Iñaki Imaz-Iglesia, “Economic Evaluations of Implantable Cardioverter Defibrillators: A Systematic Review,” European Journal of Health Economics, Vol. 16, No. 8, 2015, pp. 879–893.
Gerzeli, Simone, Aleksandra Torbica, and Giovanni Fattore, “Cost Utility Analysis of Knee Prosthesis with Complete Microprocessor Control (C-Leg) Compared with Mechanical Technology in Trans-Femoral Amputees,” European Journal of Health Economics, Vol. 10, No. 1, 2009, pp. 47–55.
Gjovaag, Terje, Inger M. Starholm, Peyman Mirtaheri, Fride W. Hegge, and Katrine Skjetne, “Assessment of Aerobic Capacity and Walking Economy of Unilateral Transfemoral Amputees,” Prosthetics and Orthotics International, Vol. 38, No. 2, 2014, pp. 140–147.
Hafner, Brian J., and Robert L. Askew, “Physical Performance and Self-Report Outcomes Associated with Use of Passive, Adaptive, and Active Prosthetic Knees in Persons with Unilateral, Transfemoral Amputation: Randomized Crossover Trial,” Journal of Rehabilitation Research and Development, Vol. 52, No. 6, 2015, pp. 677–699.
Hafner, Brian J. and Douglas G. Smith, “Differences in Function and Safety Between Medicare Functional Classification Level-2 and -3 Transfemoral Amputees and Influence of Prosthetic Knee Joint Control,” Journal of Rehabilitation Research & Development, Vol. 46, No. 3, 2009, pp. 417–433.

37
Hafner, Brian J., Laura L. Willingham, Noelle C. Buell, Katheryn J. Allyn, and Douglas G. Smith, “Evaluation of Function, Performance, and Preference as Transfemoral Amputees Transition from Mechanical to Microprocessor Control of the Prosthetic Knee,” Archives of Physical Medicine & Rehabilitation, Vol. 88, No. 2, 2007, pp. 207–217.
Hazen, Gordon, “Cohort Decomposition for Markov Cost-Effectiveness Models,” Medical Decision Making, Vol. 31, No. 1, 2011, pp. 19–34.
Henriksen, Marius, Mark W. Creaby, Hans Lund, Carsten Juhl, and Robin Christensen, “Is There a Causal Link Between Knee Loading and Knee Osteoarthritis Progression? A Systematic Review and Meta-Analysis of Cohort Studies and Randomised Trials,” BMJ Open, Vol. 4, No. 7, 2014.
Highsmith, M. Jason, Jason T. Kahle, Dennis R. Bongiorni, Bryce S. Sutton, Shirley Groer, and Kenton R. Kaufman, “Safety, Energy Efficiency, and Cost Efficacy of the C-Leg for Transfemoral Amputees: A Review of the Literature,” Prosthetics and Orthotics International, Vol. 34, No. 4, 2010, pp. 362–377.
Hungerford, D. S., and J. Cockin, “Fate of the Retained Lower Limb Joints in Second World War Amputees,” Journal of Bone and Joint Surgery, Vol. 57, No. 1, 1975, p. 111.
Institute for Clinical and Economic Review, “Final Value Assessment Framework: Updates for 2017–2019,” 2017. As of August 1, 2017: https://icer-review.org/material/final-vaf-2017-2019
Johansson, Jennifer L., Delsey M. Sherrill, Patrick O. Riley, Paolo Bonato, and Hugh Herr, “A Clinical Comparison of Variable-Damping and Mechanically Passive Prosthetic Knee Devices,” American Journal of Physical Medicine and Rehabilitation, Vol. 84, No. 8, 2005, pp. 563–575.
Kahle, Jason T., M. Jason Highsmith, and Sandra L. Hubbard, “Comparison of Nonmicroprocessor Knee Mechanism Versus C-Leg on Prosthesis Evaluation Questionnaire, Stumbles, Falls, Walking Tests, Stair Descent, and Knee Preference,” Journal of Rehabilitation Research and Development, Vol. 45, No. 1, 2008, pp. 1–13.
Kannenberg, Andreas, Britta Zacharias, and Eva Pröbsting, “Benefits of Microprocessor-Controlled Prosthetic Knees to Limited Community Ambulators: Systematic Review,” Journal of Rehabilitation Research and Development, Vol. 51, No. 10, 2014, pp. 1469–1496.
Kaufman, Kenton R., Serena Frittoli, and Carlo A. Frigo, “Gait Asymmetry of Transfemoral Amputees Using Mechanical and Microprocessor-Controlled Prosthetic Knees,” Clinical Biomechanics, Vol. 27, No. 5, 2012, pp. 460–465.
Kaufman, K. R., J. A. Levine, R. H. Brey, B. K. Iverson, S. K. McCrady, D. J. Padgett, and M. J. Joyner, “Gait and Balance of Transfemoral Amputees Using Passive Mechanical and

38
Microprocessor-Controlled Prosthetic Knees,” Gait and Posture, Vol. 26, No. 4, 2007, pp. 489–493.
Kaufman, Kenton R., James A. Levine, Robert H. Brey, Shelly K. McCrady, Denny J. Padgett, and Michael J. Joyner, “Energy Expenditure and Activity of Transfemoral Amputees Using Mechanical and Microprocessor-Controlled Prosthetic Knees,” Archives of Physical Medicine and Rehabilitation, Vol. 89, No. 7, 2008, pp. 1380–1385.
Kelsey, Jennifer L., Sarah D. Berry, Elizabeth Procter-Gray, Lien Quach, Uyen-Sa D. T. Nguyen, Wenjun Li, Douglas P. Kiel, Lewis A. Lipsitz, and Marian T. Hannan, “Indoor and Outdoor Falls in Older Adults Are Different: The Maintenance of Balance, Independent Living, Intellect, and Zest in the Elderly of Boston Study,” Journal of the American Geriatrics Society, Vol. 58, No. 11, 2010, pp. 2135–2141.
Kim, Sung-Bou, David S. Zingmond, Emmett B. Keeler, Lee A. Jennings, Neil S. Wenger, David B. Reuben, and David A. Ganz, “Development of an Algorithm to Identify Fall-Related Injuries and Costs in Medicare Data,” Injury Epidemiology, Vol. 3, No. 1, 2016, pp. 1–11.
Klute, Glenn K., Jocelyn S. Berge, Michael S. Orendurff, Rhonda M. Williams, and Joseph M. Czerniecki, “Prosthetic Intervention Effects on Activity of Lower-Extremity Amputees,” Archives of Physical Medicine and Rehabilitation, Vol. 87, No. 5, 2006, pp. 717–722.
Kulkarni, Jai, Judith Adams, Elaine Thomas, and Alan Silman, “Association Between Amputation, Arthritis and Osteopenia in British Male War Veterans with Major Lower Limb Amputations,” Clinical Rehabilitation, Vol. 12, No. 4, 1998, pp. 348–353.
Losina, Elena, Rochelle P. Walensky, Courtenay L. Kessler, Parastu S. Emrani, William M. Reichmann, Elizabeth A. Wright, Holly L. Holt, Daniel H. Solomon, Edward Yelin, A. David Paltiel, and Jeffrey N. Katz, “Cost-Effectiveness of Total Knee Arthroplasty in the United States: Patient Risk and Hospital Volume,” Archives of Internal Medicine, Vol. 169, No. 12, 2009, pp. 1113–1121.
Medicare Payment Advisory Commission, “Medicare Payment Advisory Commission Report to the Congress, March 2010,” Journal of Pain and Palliative Care Pharmacotherapy, Vol. 24, No. 3, August 18, 2010, pp. 302–305.
Miller, William C., A. Barry Deathe, Mark Speechley, and John Koval, “The Influence of Falling, Fear of Falling, and Balance Confidence on Prosthetic Mobility and Social Activity Among Individuals with a Lower Extremity Amputation,” Archives of Physical Medicine and Rehabilitation, Vol. 82, No. 9, 2001, pp. 1238–1244.
Morgenroth, David C., Alfred C. Gellhorn, and Pradeep Suri, “Osteoarthritis in the Disabled Population: A Mechanical Perspective,” American Journal of Physical Medicine and Rehabilitation, Vol. 4, No. 5, 2012, pp. S20–S27.

39
Mundell, Benjamin, Hilal Maradit Kremers, Sue Visscher, Kurtis Hoppe, and Kenton Kaufman, “Direct Medical Costs of Accidental Falls for Adults with Transfemoral Amputations,” Prosthetics and Orthotics International, June 22, 2017.
Mussman, M., W. Altwerger, J. Eisenstein, A. Turturro, A. Glockenberg, and L. Bubbers, “Contralateral Lower Extremity Evaluation with a Lower Limb Prosthesis,” Journal of the American Podiatry Association, Vol. 73, No. 7, 1983, pp. 344–346.
National Center for Health Statistics, “Health, United States, 2004: With Chartbook on Trends in the Health of Americans,” Hyattsville, Md., 2004.
National Limb Loss Information Center, “Limb Loss in the United States,” fact sheet, 2007. As of January 15, 2016: http://www.amputee-coalition.org/fact_sheets/limbloss_us.html
Neumann, Peter J., Joshua T. Cohen, and Milton C. Weinstein, “Updating Cost-Effectiveness—The Curious Resilience of the $50,000-per-QALY Threshold,” New England Journal of Medicine, Vol. 371, No. 9, 2014, pp. 796–797.
OANDA Corporation, “Average Exchange Rates,” 2017. As of May 5, 2016: https://www.oanda.com/currency/average
Orendurff, Michael S., Ava D. Segal, Glenn K. Klute, Martin L. McDowell, Janice A. Pecoraro, and Joseph M. Czerniecki, “Gait Efficiency Using the C-Leg,” Journal of Rehabilitation Research and Development, Vol. 43, No. 2, 2006, pp. 239–246.
Pell, J. P., P. T. Donnan, F. G. Fowkes, and C. V. Ruckley, “Quality of Life Following Lower Limb Amputation for Peripheral Arterial Disease,” European Journal of Vascular Surgery, Vol. 7, No. 4, 1993, pp. 448–451.
Pension Rights Center, “Sources for Income of Older Adults,” 2016. As of June 7, 2017: http://www.pensionrights.org/publications/statistic/sources-income-older-adults-0
Prinsen, Erik C., Marc J. Nederhand, Jeroen Olsman, and Johan S. Rietman, “Influence of a User-Adaptive Prosthetic Knee on Quality of Life, Balance Confidence, and Measures of Mobility: A Randomised Cross-Over Trial,” Clinical Rehabilitation, Vol. 29, No. 6, 2015, pp. 581–591.
Remes, Leena, Raimo Isoaho, Tero Vahlberg, Heikki Hiekkanen, Kimmo Korhonen, Matti Viitanen, and Päivi Rautava, “Major Lower Extremity Amputation in Elderly Patients with Peripheral Arterial Disease: Incidence and Survival Rates,” Aging Clinical and Experimental Research, Vol. 20, No. 5, 2008, pp. 385–393.
Rice, Thomas, and Karen Y. Matsuoka, “The Impact of Cost-Sharing on Appropriate Utilization and Health Status: A Review of the Literature on Seniors,” Medical Care Research and Review, Vol. 61, No. 4, December 2004, pp. 415–452.

40
Ruiz, David, Lane Koenig, Timothy M. Dall, Paul Gallo, Alexa Narzikul, Javad Parvizi, and John Tongue, “The Direct and Indirect Costs to Society of Treatment for End-Stage Knee Osteoarthritis,” Journal of Bone and Joint Surgery, Vol. 95, No. 16, 2013, pp. 1473–1480.
Russell Esposito, Elizabeth, Christopher A. Rábago, and Jason Wilken, “The Influence of Traumatic Transfemoral Amputation on Metabolic Cost Across Walking Speeds,” Prosthetics and Orthotics International, June 27, 2017.
Sanders, Gillian D., Peter J. Neumann, Anirban Basu, Dan W. Brock, David Feeny, Murray Krahn, Karen M. Kuntz, David O. Meltzer, Douglas K. Owens, and Lisa A. Prosser, “Recommendations for Conduct, Methodological Practices, and Reporting of Cost-Effectiveness Analyses: Second Panel on Cost-Effectiveness in Health and Medicine,” Journal of the American Medical Association, Vol. 316, No. 10, 2016, pp. 1093–1103.
Sawers, Andrew B., and Brian J. Hafner, “Outcomes Associated with the Use of Microprocessor-Controlled Prosthetic Knees Among Individuals with Unilateral Transfemoral Limb Loss: A Systematic Review,” Journal of Rehabilitation Research and Development, Vol. 50, No. 3, 2013, pp. 273–314.
Schiller, Jeannine S., Ellen A. Kramarow, and Achintya N. Dey, “Fall Injury Episodes Among Noninstitutionalized Older Adults: United States, 2001–2003,” Advance Data, Vol. 392, 2007, pp. 1–16.
Schmalz, Thomas, Siegmar Blumentritt, and Rolf Jarasch, “Energy Expenditure and Biomechanical Characteristics of Lower Limb Amputee Gait: The Influence of Prosthetic Alignment and Different Prosthetic Components,” Gait Posture, Vol. 16, No. 3, 2002, pp. 255–263.
Seelen, Henk A. M., Bea Hemmen, A. J. Schmeets, A. J. H. Ament, and Silvia M. A. Evers, “Costs and Consequences of a Prosthesis with an Electronically Stance and Swing Phase Controlled Knee Joint,” Technology and Disability, Vol. 21, No. 1–2, 2009, pp. 25–34.
Segal, Ava D., Michael S. Orendurff, Glenn K. Klute, Martin L. McDowell, Janice A. Pecoraro, Jane Shofer, and Joseph M. Czerniecki, “Kinematic and Kinetic Comparisons of Transfemoral Amputee Gait Using C-LEG and MAUCH SNS Prosthetic Knees,” Journal of Rehabilitation Research and Development, Vol. 43, No. 7, 2006, pp. 857–869.
Seymour, Ron, Brenda Engbretson, Karen Kott, Nathaniel Ordway, Gary Brooks, Jessica Crannell, Elise Hickernell, and Katie Wheeler, “Comparison Between the C-Leg® Microprocessor-Controlled Prosthetic Knee and Non-Microprocessor Control Prosthetic Knees: A Preliminary Study of Energy Expenditure, Obstacle Course Performance, and Quality of Life Survey,” Prosthetics and Orthotics International, Vol. 31, No. 1, March 1, 2007, pp. 51–61.
41
Sonnenberg, Frank A., and J. Robert Beck, “Markov Models in Medical Decision Making: A Practical Guide,” Medical Decision Making, Vol. 13, No. 4, 1993, pp. 322–338.
Starholm, Inger Marie, Peyman Mirtaheri, Nihad Kapetanovic, Tarjei Versto, Gjermund Skyttemyr, Fredrik Tobias Westby, and Terje Gjovaag, “Energy Expenditure of Transfemoral Amputees During Floor and Treadmill Walking with Different Speeds,” Prosthetics and Orthotics International, Vol. 40, No. 3, 2016, pp. 336–342.
Sterling, D. A., J. A. O’Connor, and J. Bonadies, “Geriatric Falls: Injury Severity Is High and Disproportionate to Mechanism,” Journal of Trauma, Vol. 50, No. 1, 2001, pp. 116–119.
Stevens, J. A., P. S. Corso, E. A. Finkelstein, and T. R. Miller, “The Costs of Fatal and Nonfatal Falls Among Older Adults,” Injury Prevention, Vol. 12, No. 5, 2006, pp. 290–295.
Theeven, Patrick J. R., Bea Hemmen, Richard P. J. Geers, Rob J. E. M. Smeets, Peter R. G. Brink, and Henk A. M. Seelen, “Influence of Advanced Prosthetic Knee Joints on Perceived Performance and Everyday Life Activity Level of Low-Functional Persons with a Transfemoral Amputation or Knee Disarticulation,” Journal of Rehabilitation Medicine, Vol. 44, No. 5, 2012, pp. 454–461.
Theeven, Patrick, Bea Hemmen, Frans Rings, Guido Meys, Peter Brink, Rob Smeets, and Henk Seelen, “Functional Added Value of Microprocessor-Controlled Knee Joints in Daily Life Performance of Medicare Functional Classification Level-2 Amputees,” Journal of Rehabilitation Medicine, Vol. 43, No. 10, 2011, pp. 906–915.
Traugh, G., P. Corcoran, and R. Reyes, “Energy Expenditure of Ambulation in Patients with Above-Knee Amputations,” Archives of Physical Medicine and Rehabilitation, Vol. 56, No. 2, 1975, pp. 67–71.
Verma, Santosh K., Joanna L. Willetts, Helen L. Corns, Helen R. Marucci-Wellman, David A. Lombardi, and Theodore K. Courtney, “Falls and Fall-Related Injuries Among Community-Dwelling Adults in the United States,” PLoS One, Vol. 11, No. 3, 2016.
Waimann, Christian A., Rodrigo J. Fernandez-Mazarambroz, Scott B. Cantor, Maria A. Lopez-Olivo, Hong Zhang, Glenn C. Landon, Sherwin J. Siff, and Maria E. Suarez-Almazor, “Cost-Effectiveness of Total Knee Replacement: A Prospective Cohort Study,” Arthritis Care and Research, Vol. 66, No. 4, 2014, pp. 592–599.
Weinstein, Milton C., “How Much Are Americans Willing to Pay for a Quality-Adjusted Life Year?” Medical Care, Vol. 46, No. 4, 2008, pp. 343–345.
Weinstein, Milton C., Bernie O’Brien, John Hornberger, Joseph Jackson, Magnus Johannesson, Chris McCabe, and Bryan R. Luce, “Principles of Good Practice for Decision Analytic Modeling in Health-Care Evaluation: Report of the ISPOR Task Force on Good Research Practices—Modeling Studies,” Value in Health, Vol. 6, No. 1, 2003, pp. 9–17.
42
William, Damon, Elizabeth Beasley, and Ashley Shaw, “Investigation of the Quality of Life of Persons with a Transfemoral Amputation Who Use a C-Leg® Prosthetic Device,” Journal of Prosthetics and Orthotics, Vol. 25, No. 3, 2013, pp. 100–109.
Wong, Christopher Kevin, John Rheinstein, and Michelle A. Stern, “Benefits for Adults with Transfemoral Amputations and Peripheral Artery Disease Using Microprocessor Compared with Nonmicroprocessor Prosthetic Knees,” American Journal of Physical Medicine and Rehabilitation, Vol. 94, No. 10, 2015, pp. 804–810.
Xie, Feng, Bruno Kovic, Xuejing Jin, Xiaoning He, Mengxiao Wang, and Camila Silvestre, “Economic and Humanistic Burden of Osteoarthritis: A Systematic Review of Large Sample Studies,” Pharmacoeconomics, Vol. 34, No. 11, 2016, pp. 1087–1100.
Ziegler-Graham, Kathryn, Ellen J. MacKenzie, Patti L. Ephraim, Thomas G. Travison, and Ron Brookmeyer, “Estimating the Prevalence of Limb Loss in the United States: 2005 to 2050,” Archives of Physical Medicine and Rehabilitation, Vol. 89, No. 3, 2008, pp. 422–429.