economic development strategic plan · james mangold wells fargo bank ... appendix a: economic...
TRANSCRIPT

MAY 2017
ECONOMIC DEVELOPMENT STRATEGIC PLAN GREATER GREEN BAY CHAMBER

GREATER GREEN BAY CHAMBER
GREATER GREEN BAY STRATEGIC PLAN PAGE | II
ACKNOWLEDGEMENTS TIP Strategies would like to thank all of the individuals and organizations who have participated in this planning process, especially the leadership and staff of the Greater Green Bay Chamber and the business and community leaders that have served on the Strategic Planning Executive Committee.
STRATEGIC PLANNING EXECUTIVE COMMITTEE (SPEC)
NAME ORGANIZATION Craig Aderhold Wisconsin Bank & Trust Kim Allen Humana Robert Atwell Nicolet National Bank Mike Aubinger Ashwaubenon Village President Paul Belschner Base Companies, LLC David Bishop UnitedHealthcare Todd Cullen Georgia-Pacific Mike Devereux Nature’s Way Craig Dickman Breakthrough Fuel, LLC Erik Goerke Alliance Management, LLC Mike Haddad Schreiber Foods Mark Higgins Johnson Bank Pat Hopkins Imaginasium Inc. Mark Kaiser Lindquist Machine Corporation Jim Kratowicz Titletown Brewing Company Thomas Kunkel St. Norbert College Christine Loose Kohler Company Scott McMeans Aurora BayCare Medical Center Gary Miller, Ph.D. University of Wisconsin-Green Bay Christopher Niles Associated Bank David Pamperin Greater Green Bay Community Foundation Dave Pisani Camera Corner Connecting Point Ed Policy Green Bay Packers Inc. Aaron Popkey Green Bay Packers Inc. Jeff Rafn, Ph.D. Northeast Wisconsin Technical College Dr. Ashok Rai Prevea Health Pat Schillinger Wisconsin Public Service Jim Schmitt City of Green Bay Mayor Troy Streckenbach Brown County Executive Jake Swenson RR Donnelley Brad Toll Greater Green Bay Convention & Visitors Bureau
GREATER GREEN BAY CHAMBER
GREATER GREEN BAY STRATEGIC PLAN PAGE | III
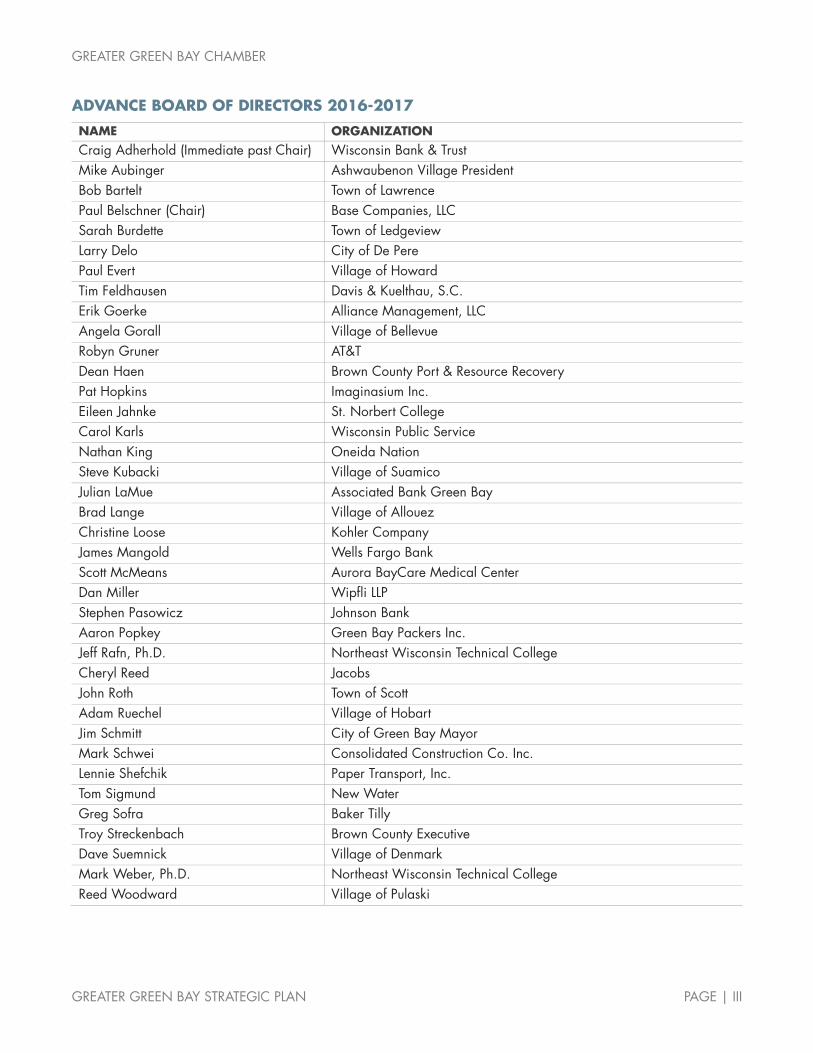
ADVANCE BOARD OF DIRECTORS 2016-2017
NAME ORGANIZATION Craig Adherhold (Immediate past Chair) Wisconsin Bank & Trust Mike Aubinger Ashwaubenon Village President Bob Bartelt Town of Lawrence Paul Belschner (Chair) Base Companies, LLC Sarah Burdette Town of Ledgeview Larry Delo City of De Pere Paul Evert Village of Howard Tim Feldhausen Davis & Kuelthau, S.C. Erik Goerke Alliance Management, LLC Angela Gorall Village of Bellevue Robyn Gruner AT&T Dean Haen Brown County Port & Resource Recovery Pat Hopkins Imaginasium Inc. Eileen Jahnke St. Norbert College Carol Karls Wisconsin Public Service Nathan King Oneida Nation Steve Kubacki Village of Suamico Julian LaMue Associated Bank Green Bay Brad Lange Village of Allouez Christine Loose Kohler Company James Mangold Wells Fargo Bank Scott McMeans Aurora BayCare Medical Center Dan Miller Wipfli LLP Stephen Pasowicz Johnson Bank Aaron Popkey Green Bay Packers Inc. Jeff Rafn, Ph.D. Northeast Wisconsin Technical College Cheryl Reed Jacobs John Roth Town of Scott Adam Ruechel Village of Hobart Jim Schmitt City of Green Bay Mayor Mark Schwei Consolidated Construction Co. Inc. Lennie Shefchik Paper Transport, Inc. Tom Sigmund New Water Greg Sofra Baker Tilly Troy Streckenbach Brown County Executive Dave Suemnick Village of Denmark Mark Weber, Ph.D. Northeast Wisconsin Technical College Reed Woodward Village of Pulaski

GREATER GREEN BAY CHAMBER
GREATER GREEN BAY STRATEGIC PLAN PAGE | IV
GREATER GREEN BAY CHAMBER BOARD OF DIRECTORS 2016-2017
GREATER GREEN BAY CHAMBER & ADVANCE STAFF
TIP STRATEGIES CONSULTING TEAM
NAME ROLE Craig Aderhold Wisconsin Bank & Trust Steve Baue ERC Paul Belschner Base Companies, LLC Dave Bishop UnitedHealthcare Cole Buergi Leonard & Finco Public Relations Robert Byrne Schreiber Foods Louise Cornelius Oneida Nation Todd Cullen Georgia-Pacific James Dietsche Bellin Health Dan Fabry Cellcom Mark Graul Arena Strategy Group Mark Higgins Johnson Bank Mark Kaiser Lindquist Machine Corporation Mike Kirschling Prevea Health Ryan Krumrie Hager, Dewick & Zuengler, S.C. Michelle Langenfeld, Ed.D. Green Bay Area Public School District Mark Matzke Humana Jim Michels Schenck Gary Miller, Ph.D. University of Wisconsin-Green Bay Christopher Del Moral-Niles Associated Bank Rich Otradovec RODAC Development & Construction LLC Dan Pichler Wipfli LLP Dave Pisani Camera Corner Connecting Point Aaron Popkey Green Bay Packers Inc. Pat Schillinger Wisconsin Public Service Troy Streckenbach Brown County Executive Brad Toll Greater Green Bay Convention & Visitors Bureau Cindy Treleven Metzler Timm Treleven, S.C. Lynie Vincent NEW Plastics
NAME ROLE Peter Zaehringer Vice President, Economic Development (Advance) Laurie Radke President & CEO, Greater Green Bay Chamber
NAME ROLE Jon Roberts Managing Principal John Karras Senior Consultant Meredith Eberle Project Support

GREATER GREEN BAY CHAMBER
GREATER GREEN BAY STRATEGIC PLAN PAGE | V
CONTENTS STRATEGIC PLAN ...................................................................................................................................... 1
INTRODUCTION ................................................................................................................................... 1 STRATEGIC PLAN .................................................................................................................................. 1 PERFORMANCE METRICS .................................................................................................................... 24
APPENDIX A: ECONOMIC ASSESSMENT & SWOT .................................................................................... 25 KEY FINDINGS ................................................................................................................................... 25 SWOT ANALYSIS ................................................................................................................................ 25 ECONOMIC TRENDS .......................................................................................................................... 29 COMMUTING PATTERNS ..................................................................................................................... 34 INDUSTRY ANALYSIS ........................................................................................................................... 40 WORKFORCE & OCCUPATIONAL ANALYSIS ......................................................................................... 47 HIGHER EDUCATION TRENDS.............................................................................................................. 51 DOWNTOWN GROWTH TRENDS ....................................................................................................... 52
APPENDIX B: BENCHMARKING ASSESSMENT ........................................................................................... 53 APPENDIX C: DISCOVERY PHASE SUMMARY ............................................................................................ 62
ONLINE SURVEY SUMMARY ................................................................................................................ 69 APPENDIX D: TARGET INDUSTRIES............................................................................................................ 78
APPROACH ........................................................................................................................................ 78 ADVANCED MANUFACTURING ........................................................................................................... 81 DIGITAL MEDIA & ENTERTAINMENT ...................................................................................................... 86 HEALTH CARE & MEDICAL TECHNOLOGY ............................................................................................ 89 LOGISTICS & DISTRIBUTION ................................................................................................................ 92 CORPORATE HQS .............................................................................................................................. 95 FINANCIAL SERVICES ......................................................................................................................... 98
APPENDIX E: IMPLEMENTATION MATRIX ................................................................................................. 101
Image credit (front cover): "Downtown Green Bay CityDeck along the Fox River" by Chris Rand via Wikimedia Commons (CC BY-SA 4.0)
GREATER GREEN BAY CHAMBER
GREATER GREEN BAY STRATEGIC PLAN PAGE | 1
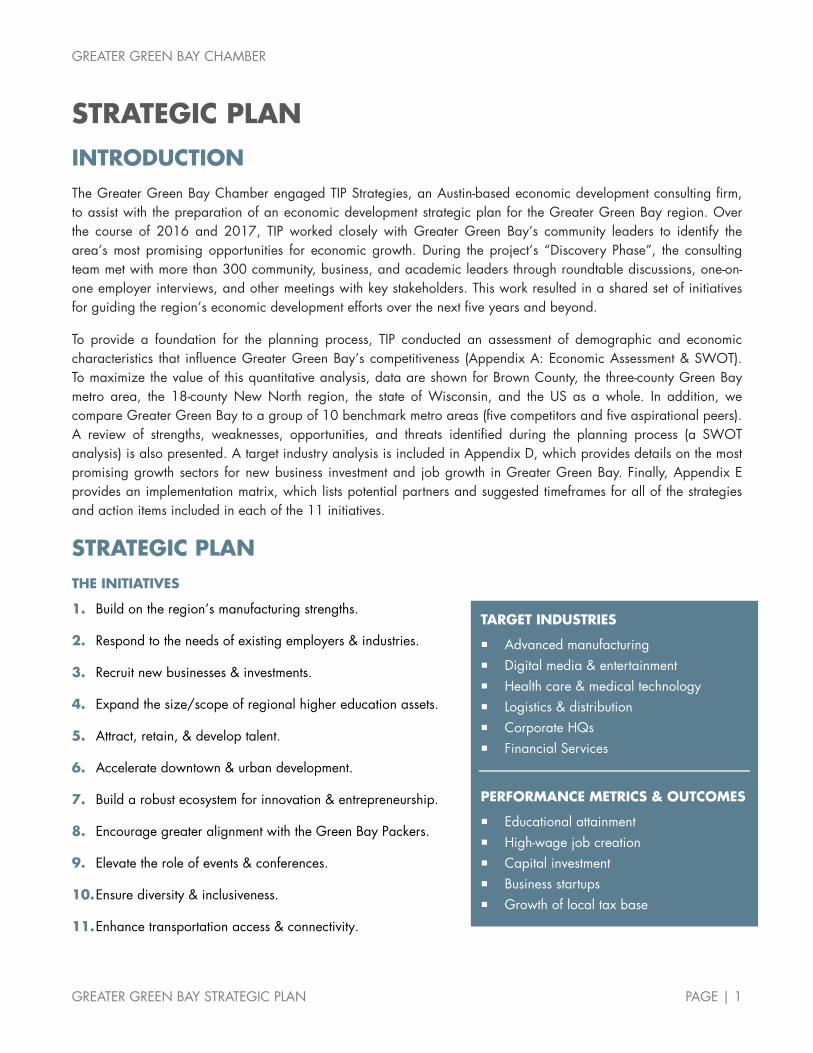
STRATEGIC PLAN INTRODUCTION The Greater Green Bay Chamber engaged TIP Strategies, an Austin-based economic development consulting firm, to assist with the preparation of an economic development strategic plan for the Greater Green Bay region. Over the course of 2016 and 2017, TIP worked closely with Greater Green Bay’s community leaders to identify the area’s most promising opportunities for economic growth. During the project’s “Discovery Phase”, the consulting team met with more than 300 community, business, and academic leaders through roundtable discussions, one-on-one employer interviews, and other meetings with key stakeholders. This work resulted in a shared set of initiatives for guiding the region’s economic development efforts over the next five years and beyond.
To provide a foundation for the planning process, TIP conducted an assessment of demographic and economic characteristics that influence Greater Green Bay’s competitiveness (Appendix A: Economic Assessment & SWOT). To maximize the value of this quantitative analysis, data are shown for Brown County, the three-county Green Bay metro area, the 18-county New North region, the state of Wisconsin, and the US as a whole. In addition, we compare Greater Green Bay to a group of 10 benchmark metro areas (five competitors and five aspirational peers). A review of strengths, weaknesses, opportunities, and threats identified during the planning process (a SWOT analysis) is also presented. A target industry analysis is included in Appendix D, which provides details on the most promising growth sectors for new business investment and job growth in Greater Green Bay. Finally, Appendix E provides an implementation matrix, which lists potential partners and suggested timeframes for all of the strategies and action items included in each of the 11 initiatives.
STRATEGIC PLAN THE INITIATIVES
1. Build on the region’s manufacturing strengths.
2. Respond to the needs of existing employers & industries.
3. Recruit new businesses & investments.
4. Expand the size/scope of regional higher education assets.
5. Attract, retain, & develop talent.
6. Accelerate downtown & urban development.
7. Build a robust ecosystem for innovation & entrepreneurship.
8. Encourage greater alignment with the Green Bay Packers.
9. Elevate the role of events & conferences.
10. Ensure diversity & inclusiveness.
11. Enhance transportation access & connectivity.
TARGET INDUSTRIES
Advanced manufacturing Digital media & entertainment Health care & medical technology Logistics & distribution Corporate HQs Financial Services
PERFORMANCE METRICS & OUTCOMES
Educational attainment High-wage job creation Capital investment Business startups Growth of local tax base
GREATER GREEN BAY CHAMBER
GREATER GREEN BAY STRATEGIC PLAN PAGE | 2
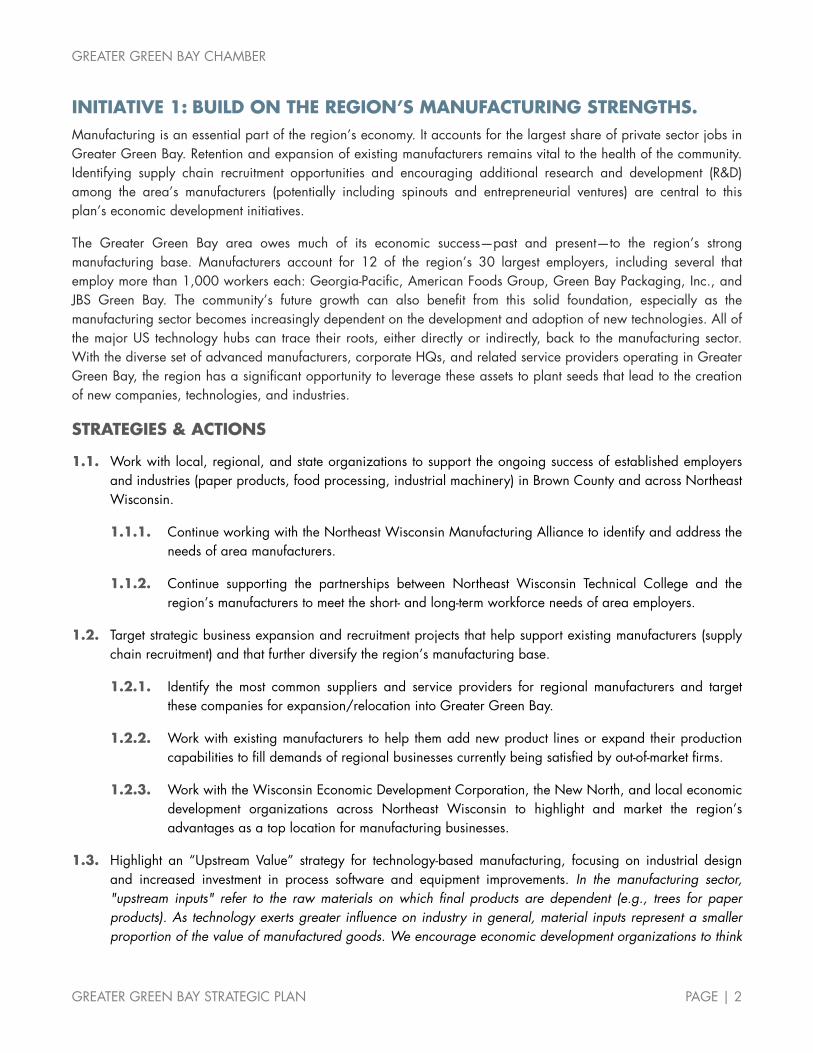
INITIATIVE 1: BUILD ON THE REGION’S MANUFACTURING STRENGTHS. Manufacturing is an essential part of the region’s economy. It accounts for the largest share of private sector jobs in Greater Green Bay. Retention and expansion of existing manufacturers remains vital to the health of the community. Identifying supply chain recruitment opportunities and encouraging additional research and development (R&D) among the area’s manufacturers (potentially including spinouts and entrepreneurial ventures) are central to this plan’s economic development initiatives.
The Greater Green Bay area owes much of its economic success—past and present—to the region’s strong manufacturing base. Manufacturers account for 12 of the region’s 30 largest employers, including several that employ more than 1,000 workers each: Georgia-Pacific, American Foods Group, Green Bay Packaging, Inc., and JBS Green Bay. The community’s future growth can also benefit from this solid foundation, especially as the manufacturing sector becomes increasingly dependent on the development and adoption of new technologies. All of the major US technology hubs can trace their roots, either directly or indirectly, back to the manufacturing sector. With the diverse set of advanced manufacturers, corporate HQs, and related service providers operating in Greater Green Bay, the region has a significant opportunity to leverage these assets to plant seeds that lead to the creation of new companies, technologies, and industries.
STRATEGIES & ACTIONS
1.1. Work with local, regional, and state organizations to support the ongoing success of established employers and industries (paper products, food processing, industrial machinery) in Brown County and across Northeast Wisconsin.
1.1.1. Continue working with the Northeast Wisconsin Manufacturing Alliance to identify and address the needs of area manufacturers.
1.1.2. Continue supporting the partnerships between Northeast Wisconsin Technical College and the region’s manufacturers to meet the short- and long-term workforce needs of area employers.
1.2. Target strategic business expansion and recruitment projects that help support existing manufacturers (supply chain recruitment) and that further diversify the region’s manufacturing base.
1.2.1. Identify the most common suppliers and service providers for regional manufacturers and target these companies for expansion/relocation into Greater Green Bay.
1.2.2. Work with existing manufacturers to help them add new product lines or expand their production capabilities to fill demands of regional businesses currently being satisfied by out-of-market firms.
1.2.3. Work with the Wisconsin Economic Development Corporation, the New North, and local economic development organizations across Northeast Wisconsin to highlight and market the region’s advantages as a top location for manufacturing businesses.
1.3. Highlight an “Upstream Value” strategy for technology-based manufacturing, focusing on industrial design and increased investment in process software and equipment improvements. In the manufacturing sector, "upstream inputs" refer to the raw materials on which final products are dependent (e.g., trees for paper products). As technology exerts greater influence on industry in general, material inputs represent a smaller proportion of the value of manufactured goods. We encourage economic development organizations to think

GREATER GREEN BAY CHAMBER
GREATER GREEN BAY STRATEGIC PLAN PAGE | 3
of upstream inputs as those representing the most valuable inputs to the production process. From this perspective, R&D, industrial design, software-driven equipment, and process control are "the new upstream." These inputs require more creativity, ensure greater efficiency, and attract the skilled engineers and workers that keep companies competitive.
1.3.1. Pursue automation and advanced technologies that fuel the growth of local manufacturers (e.g., Autonomous Guided Vehicles, or AGVs, to operate heavy industrial processes).
1.3.2. Encourage networking among the region’s industrial design, engineering, and R&D workers employed by area manufacturers.

GREATER GREEN BAY CHAMBER
GREATER GREEN BAY STRATEGIC PLAN PAGE | 4
INITIATIVE 2: RESPOND TO THE NEEDS OF EXISTING EMPLOYERS AND INDUSTRIES. The business expansion and retention (BEAR) program is the most important aspect of a successful economic development organization. The US Small Business Administration estimates that roughly 60 percent of new jobs in a community are created through the expansion of existing businesses. Existing employers form the foundation of the Greater Green Bay economy and are its most valuable asset.
A strong business expansion and retention program is more important than a recruitment program, not only because of job creation, but because it is extremely difficult to recruit a new company if existing businesses are not thriving, especially if they have a negative attitude about the local business climate. A strong BEAR program for Greater Green Bay should also include efforts to mitigate risk and vulnerabilities facing existing employers. Businesses that have recently been acquired by out-of-state companies are at risk of downsizing or relocation. And the region’s leadership cannot afford to assume that local corporate HQs (e.g., Schreiber Foods, Associated Bank, and Shopko Stores) will remain forever anchored to Greater Green Bay.
STRATEGIES & ACTIONS
2.1. Establish, maintain, and grow a database of existing businesses in Brown County.
2.1.1. Update and evaluate the database continually.
2.1.2. Include all large employers and also focus on high-growth firms, companies that serve external markets, and firms that are suppliers or service providers for the area’s major employers.
2.2. Expand the Advance employer visitation program to meet with all major employers, high-growth firms, and other key businesses on an annual basis.
2.2.1. Prioritize business visits by employer size and growth rates (employment and revenue), target industries, and lease expiration dates.
2.2.2. Visits should be structured to gauge the abilities and needs of local employers in order to operate successfully and possibly expand in Brown County.
2.2.3. Each employer visit should achieve several outcomes:
Educate the employer about Advance and its services;
Collect answers to a standard set of questions about the employer’s challenges and identify opportunities to address these challenges;
Identify employers that are expanding their operations within and outside of Greater Green Bay or are considering relocating outside of the region;
Probe supplier attraction opportunities that would benefit existing employers; and
Capture testimonials from local companies about why they have chosen Greater Green Bay as their business location.

GREATER GREEN BAY CHAMBER
GREATER GREEN BAY STRATEGIC PLAN PAGE | 5
2.3. Increase the level of CEO engagement as part of the BEAR program.
2.3.1. Host regular CEO breakfasts and other networking events to encourage relationship-building and informal connections among the local business community.
2.3.2. Cultivate relationships with CEOs of local firms that are based outside of Brown County to build channels of communication with corporate leadership, including annual visits to out-of-market corporate HQs. Greater Green Bay is fortunate to have many corporate HQs locally, but there are also numerous local plants and offices that belong to a larger business based elsewhere. Making connections with key decision makers outside of Brown County could lead to future retention/expansion of local operations.
2.4. Work with existing employers, local governments, and utility providers to identify gaps in the region’s infrastructure and look for solutions to address these gaps to support the growth of existing employers and recruitment of new businesses.
2.4.1. Continue working with the Advance Municipal Issues Committee to address local and regional infrastructure issues impacting the success of area employers.
2.4.2. Involve local government partners in the BEAR program as appropriate.
GREATER GREEN BAY CHAMBER
GREATER GREEN BAY STRATEGIC PLAN PAGE | 6
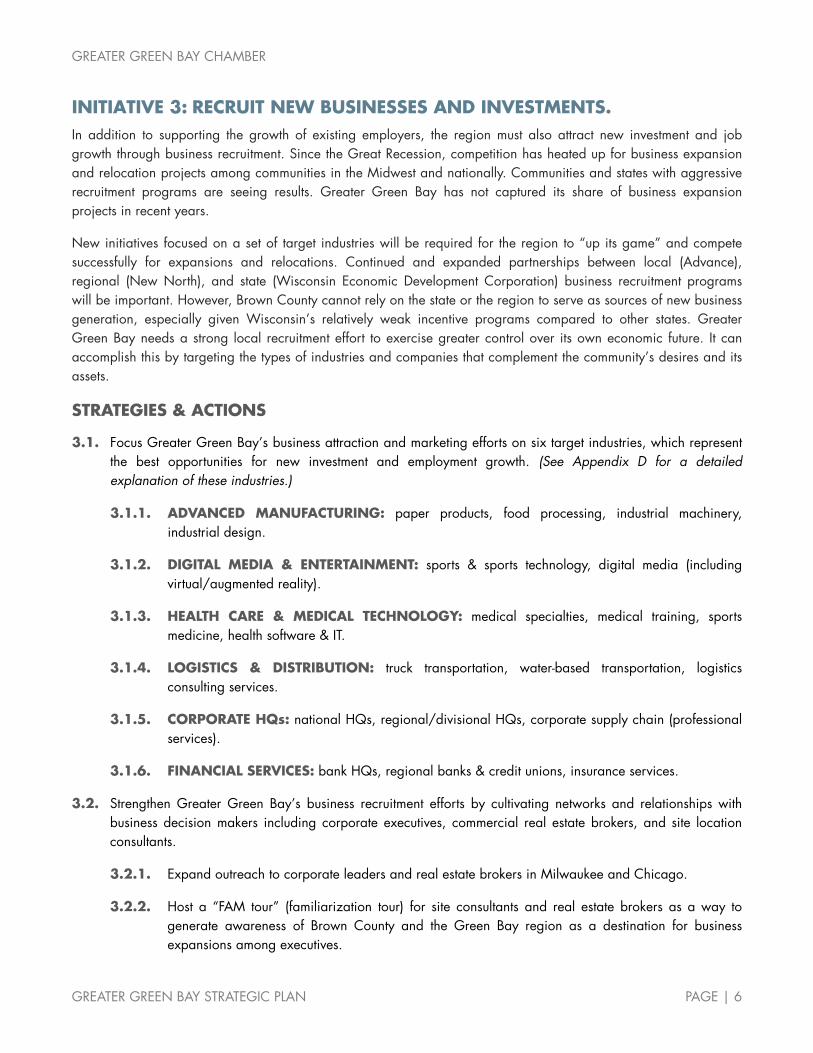
INITIATIVE 3: RECRUIT NEW BUSINESSES AND INVESTMENTS. In addition to supporting the growth of existing employers, the region must also attract new investment and job growth through business recruitment. Since the Great Recession, competition has heated up for business expansion and relocation projects among communities in the Midwest and nationally. Communities and states with aggressive recruitment programs are seeing results. Greater Green Bay has not captured its share of business expansion projects in recent years.
New initiatives focused on a set of target industries will be required for the region to “up its game” and compete successfully for expansions and relocations. Continued and expanded partnerships between local (Advance), regional (New North), and state (Wisconsin Economic Development Corporation) business recruitment programs will be important. However, Brown County cannot rely on the state or the region to serve as sources of new business generation, especially given Wisconsin’s relatively weak incentive programs compared to other states. Greater Green Bay needs a strong local recruitment effort to exercise greater control over its own economic future. It can accomplish this by targeting the types of industries and companies that complement the community’s desires and its assets.
STRATEGIES & ACTIONS
3.1. Focus Greater Green Bay’s business attraction and marketing efforts on six target industries, which represent the best opportunities for new investment and employment growth. (See Appendix D for a detailed explanation of these industries.)
3.1.1. ADVANCED MANUFACTURING: paper products, food processing, industrial machinery, industrial design.
3.1.2. DIGITAL MEDIA & ENTERTAINMENT: sports & sports technology, digital media (including virtual/augmented reality).
3.1.3. HEALTH CARE & MEDICAL TECHNOLOGY: medical specialties, medical training, sports medicine, health software & IT.
3.1.4. LOGISTICS & DISTRIBUTION: truck transportation, water-based transportation, logistics consulting services.
3.1.5. CORPORATE HQs: national HQs, regional/divisional HQs, corporate supply chain (professional services).
3.1.6. FINANCIAL SERVICES: bank HQs, regional banks & credit unions, insurance services.
3.2. Strengthen Greater Green Bay’s business recruitment efforts by cultivating networks and relationships with business decision makers including corporate executives, commercial real estate brokers, and site location consultants.
3.2.1. Expand outreach to corporate leaders and real estate brokers in Milwaukee and Chicago.
3.2.2. Host a “FAM tour” (familiarization tour) for site consultants and real estate brokers as a way to generate awareness of Brown County and the Green Bay region as a destination for business expansions among executives.

GREATER GREEN BAY CHAMBER
GREATER GREEN BAY STRATEGIC PLAN PAGE | 7
Ensure that the tour is focused on business opportunities, including potential real estate development projects for the site selectors to provide input on (e.g., the Titletown District, corridor development between Lambeau Field and downtown Green Bay).
Leverage the event to showcase the region’s amenities and assets, but keep in mind the end goal—to develop relationships with key business decision makers that can lead to new investments and business expansions in Greater Green Bay.
3.3. Enhance Greater Green Bay’s image as a destination for new businesses and investment through focused marketing channels (e.g., online, social media, and networks of trained local “ambassadors”).
3.3.1. Create new online marketing materials specific to target industries and showcasing up-to-date information on the region’s workforce and business climate.
3.3.2. Conduct an economic impact analysis of each target industry to showcase its importance to the regional economy in terms of jobs, wages, and tax base impacts. This should be done internally by Advance using economic modeling software such as IMPLAN or EMSI, but can also be accomplished by working with a consulting firm that specializes in economic impact analysis.
3.4. Leverage business and personal relationships to encourage international business investment.
3.4.1. Work closely with Greater Green Bay companies that have an existing global presence (e.g., KI Furniture, Schreiber Foods, Schneider) to explore international business development opportunities.
3.4.2. Assist regional businesses with their existing and future global expansion plans.
3.5. Recruit satellite offices of firms based in nearby larger markets and suppliers/service providers with existing business ties to Greater Green Bay’s major employers.
3.5.1. This should include targeted, industry-specific strategies for attracting business expansions from companies with major facilities or based in the four communities with nonstop flights to/from Green Bay: Chicago, Minneapolis-St. Paul, Detroit, and Atlanta.
3.5.2. Conduct quarterly business development missions to the four nonstop flight destination metro areas so that each market is visited once per year.
3.5.3. Take a small group of business executives (5–10) on each business development mission.
3.5.4. Develop specific approaches for each target market that leverage existing business relationships.
3.5.5. Include small divisions of existing Brown County corporate HQs as a potential target under this recruitment initiative. Since many of the region’s locally based companies operate facilities nationwide, there is a significant opportunity to attract small expansion projects (e.g., marketing and sales offices, regional operations centers) associated with existing businesses.

GREATER GREEN BAY CHAMBER
GREATER GREEN BAY STRATEGIC PLAN PAGE | 8
INITIATIVE 4: EXPAND THE SIZE AND SCOPE OF THE REGION’S HIGHER EDUCATION ASSETS. The region benefits from several quality higher education institutions—the University of Wisconsin-Green Bay (UW-GB), Northeast Wisconsin Technical College (NWTC), St. Norbert College, Medical College of Wisconsin, and Bellin College—but the role of UW-GB must be elevated. Enrollment levels at UW-GB are among the lowest in the entire UW system and it is one of the few universities in the state to experience a decline in its academic R&D investments over the last 10 years (even from its low starting point). The Green Bay region needs a large, growing university with a broader range of programs (especially engineering, science, and technology) and a greater emphasis on research and technology commercialization.
The link between higher education—especially engineering—and economic development is well established. Besides the most obvious examples (Stanford University in Silicon Valley, Harvard and MIT in Boston, and the University of Texas in Austin), dozens of communities across the US can trace their economic development success to the role of higher education.
Greater Green Bay competes with Chicago, Minneapolis-St. Paul, Grand Rapids, and many other communities in the Midwest and nationally. The ability to draw skilled workers into the area is essential. The presence of engineering programs and engineering talent is a vital element of forward-looking communities. This allows the community to build a pipeline of its own talent, focused on technology skills. The region’s current and future employers will increasingly demand people with these qualifications. Moreover, the future growth of entrepreneurship and innovation in Greater Green Bay will be closely linked with the expansion of UW-GB’s programs in science, engineering, technology, and business.
A skilled workforce is similarly critical for long-standing employers such as Georgia-Pacific and Schreiber Foods. In addition, new high-growth firms such as Breakthrough Fuels will put increasing demands on the talent pool. Attracting students and employees is an essential component of successful economic development programs. And there is no better way to execute on this strategy than through support of and collaboration with higher education.
STRATEGIES & ACTIONS
4.1. Encourage UW-GB and NWTC to expand into downtown Green Bay with specific programs and facilities.
4.1.1. Expand portions of UW-GB’s computer science, technology, engineering, and business programs into downtown.
4.1.2. Expand non-academic functions into downtown (e.g., university engagement and student housing).
4.1.3. Launch new academic/training partnerships between UW-GB and NWTC that serve the region’s existing employers and emerging industries. Start by creating programs with a downtown location geared toward downtown employers.
4.2. Re-mission UW-GB to be a larger, more R&D-focused, broader-reaching university.
4.2.1. Position UW-GB to compete with UW-Milwaukee through the introduction of highly focused engineering programs, including the creation of an engineering school at UW-GB.
GREATER GREEN BAY CHAMBER
GREATER GREEN BAY STRATEGIC PLAN PAGE | 9
4.2.2. Set ambitious long-term enrollment growth targets to more than double UW-GB’s enrollment over the next 10-15 years. A potential target could be to grow enrollment to 15,000 students by 2030 (compared to 6,784 as of 2015).
4.2.3. Pursue major growth in UW-GB’s R&D programs over the next five years and beyond. A potential target could be to grow annual R&D investments to $5 million by 2022 and to $25 million by 2030 (compared to $1.2 million in 2014).
4.3. Support the new STEM Innovation Center—a partnership between UW-GB, NWTC, and Brown County—to build a strong pipeline of science and technology talent for Greater Green Bay.
4.3.1. Leverage this new collaboration to benefit the region’s existing employers and use it to promote the area for new business expansion projects.
4.3.2. Include the region’s K-12 schools in this effort to help grow a larger foundation of future science and technology workers.
4.4. Develop a “center of excellence” (COE) that brings together the region’s higher education institutions, major employers, and investment partners to address a specific set of research and training opportunities. Centers of excellence are typically a collaboration between higher education institutions and businesses. These centers leverage the unique assets found within a region to support research or training within a specific industry or focus area. They often serve as a magnet for industry expertise and are dedicated to the success of companies within a region.
4.4.1. Establish a COE in downtown Green Bay that capitalizes on the region’s higher education and industry assets to attract and nurture new talent, businesses, and investment.
4.4.2. Examples currently under consideration include sports-related media and advanced manufacturing specific to food processing.
4.5. Bring together regional higher education and medical organizations to leverage the new Medical College of Wisconsin-Green Bay for economic development.
4.5.1. Hold a summit to evaluate and prioritize initiatives that could lead to new business creation, talent retention/attraction, recruitment of medical service providers and technology companies, and other outcomes.
4.5.2. Explore the long-term potential to develop a med-tech innovation district centered on the new medical school.
EXAMPLES & BEST PRACTICES
Examples of major downtown higher education expansions include: Arizona State University in Phoenix, University of Washington in Tacoma, University of Texas-San Antonio, and University of Central Florida in Orlando, just to name a few. There are also numerous smaller scale university expansions in downtown districts—UW-Eau Claire, University of Minnesota-Rochester, University of Massachusetts in Springfield, and University of Oregon in Portland.

GREATER GREEN BAY CHAMBER
GREATER GREEN BAY STRATEGIC PLAN PAGE | 10
Center of excellence examples: Sematech & MCC in Austin, The Water Council in Milwaukee, NBAF (National Bio and Agro Defense Facility) in Manhattan (KS), and The Collider focused on climate science in Asheville (NC).
Med-Tech innovation district examples: Dell Medical School and surrounding Med-Tech Innovation District in Austin, Global Center for Health Innovation in Cleveland, and the WestEdge innovation district in Charleston centered on the Medical University of South Carolina.

GREATER GREEN BAY CHAMBER
GREATER GREEN BAY STRATEGIC PLAN PAGE | 11
INITIATIVE 5: ATTRACT, RETAIN, AND DEVELOP TALENT. Access to a skilled workforce is the critical factor affecting the success of businesses in today’s economy. According to Area Development’s “30th Annual Survey of Corporate Executives (Q1 2016)”, access to a skilled workforce ranked at the top of the list among 36 site selection factors. The table below details the top 10 site selection factors and how they have changed over the last three decades. Thirty years ago, labor costs were the most important consideration for business expansion projects. Today, the availability of skilled labor—regardless of labor costs—is the most important factor.
National demographic trends will lead to shrinkage of the working age population in the next couple of decades. If job growth continues, even at a minimal rate, employers will continue to have difficulties finding skilled workers. Thus, one of the most urgent priorities for communities is to attract, retain, and develop a pipeline of talent to support the growth of existing and future employers. Regions with a skilled population have a dramatic advantage over other areas. Addressing this issue is critical for the region’s future growth. The Green Bay region needs to rise above its competition and offer a compelling reason for young, educated workers to choose Greater Green Bay.
FIGURE 1. TOP 10 SITE SELECTION FACTORS (RANKED BY SCORE IN 2015) WITH 30-YEAR COMPARISON
Source: Area Development magazine, 30th Annual Survey of Corporate Executives Note: All figures are percentages and are the total of “very important” and “important” ratings. *Quality of life rating for prior years’ surveys is the average of rating of nine quality of life factors (climate, housing availability, housing costs, healthcare facilities, ratings of public schools, cultural opportunities, recreational opportunities, colleges and universities in the area, and low crime rate).
STRATEGIES & ACTIONS
5.1. Encourage greater alignment and partnerships between the region’s employers, educational providers (K-12 and higher education), and workforce development organizations.
5.1.1. Continue to work with NWTC, UW-GB and other higher education institutions, the region’s K-12 schools, and employers to implement more internships, create greater awareness of job opportunities among students and parents, and place more educators in “externships” with local employers.
5.1.2. Continue to work with the Northeast Wisconsin Manufacturers Alliance and other groups to raise awareness of career options in the region and to provide hands-on opportunities for exposing
RANK FACTOR 2015 2010 2005 2000 1995 1990 1986
1 Availability of skilled labor 92.9 85.9 87.2 87.7 87.9 87.1 84.8
2 Highway accessibility 88.0 97.3 91.4 95.9 93.6 92.3 91.3
3 Quality of life* 87.6 62.1 54.7 58.8 70.4 70.6 60.4
4 Occupancy or construction costs 85.4 89.8 83.7 83.0 90.2 88.5 N/A
5 Available buildings 83.7 81.0 N/A N/A N/A N/A N/A
6 Labor costs 80.8 91.0 87.9 91.6 94.2 92.1 96.6
7 Corporate tax rate 78.8 86.3 85.0 84.7 N/A N/A N/A
8 Proximity to major markets 76.3 66.4 83.2 76.8 74.5 74.9 84.8
9 State and local incentives 75.8 89.3 86.0 83.6 87.8 88.7 79.6
10 Energy availability and costs 75.3 82.1 82.8 77.7 89.6 88.1 N/A

GREATER GREEN BAY CHAMBER
GREATER GREEN BAY STRATEGIC PLAN PAGE | 12
students, teachers, and parents to potential career opportunities (e.g., manufacturing day and similar events). This should build on the success of Manufacturing Month (announced by Governor Walker in October 2016), but should include similar efforts to boost awareness of career options in manufacturing and other sectors throughout the year.
5.1.3. Continue to work with the Bay Area Workforce Development Board, Achieve Brown County, and other local workforce development organizations to enhance the skills of Brown County’s workforce and connect workers to employment opportunities.
5.2. Launch a campaign to build awareness of the career opportunities available in Greater Green Bay.
5.2.1. Leverage social media tools, university/college alumni networks, and other forums to engage target audiences and promote the region as a great option for job seekers.
5.2.2. Create a digital ambassadors program as a channel to promote positive messages about the Greater Green Bay area. Social Toaster is a good example of an online tool for managing this type of program. Organizations including universities, corporations, pro sports teams, and economic development organizations have used this approach successfully to engage “super fans” who share content through their social networks and increase awareness/excitement for the organization among target audiences.
5.3. Pool together resources from regional employers seeking to recruit and retain skilled workers.
5.3.1. Pursue joint job fairs and workforce recruitment trips that benefit multiple employers.
5.3.2. For example, the Chamber could lead a mission of several large employers with similar workforce needs to visit Chicago, Detroit, Minneapolis, or Atlanta to host job fairs/recruitment events to tap into talent in nearby major metro areas.
5.3.3. Create and share community-marketing collateral with employers to support and augment their talent recruitment efforts.
5.4. Survey local employers regularly about their “hardest to fill” jobs and “hardest to find” skills.
5.4.1. Use information from employer surveys to develop training programs with educational providers and to recruit talent from outside of the region.
5.4.2. Work with employers to survey employees regularly to understand their desires/needs from employers and from the community as a whole (including information about quality of place and amenities).

GREATER GREEN BAY CHAMBER
GREATER GREEN BAY STRATEGIC PLAN PAGE | 13
INITIATIVE 6: ACCELERATE DOWNTOWN AND URBAN DEVELOPMENT. Today’s generation of young adults favors urban living and everything that comes with it (walking, biking, and patronizing locally owned shops and restaurants). Providing an attractive environment that appeals to young professionals is critical for economic development. This does not apply only to large cities, nor does it apply only to a younger generation. A growing number of small and mid-size cities offer walkable neighborhoods and downtown districts that attract both young people and baby boomers.
The most successful downtowns are not necessarily the ones with the most jobs (or hotels, bars, entertainment venues, or any single thing). A vibrant downtown district usually has multiple primary functions that work together to attract people from all walks of life. Successful downtowns (and, by extension, successful communities) are all about growth and diversity. Greater Green Bay has made positive strides around these trends, thanks to adding public amenities (e.g., The CityDeck), corporate expansions (e.g., Schreiber Foods’ downtown HQ), new urban residential options, and entertainment venues (e.g., Titletown Brewing Company).
The new Titletown District adjacent to Lambeau Field is another exciting catalyst project that will play a key role in attracting additional investments and urban amenities that can make the region a top destination for talent. The addition of new businesses, jobs, and residents in the region’s urban core will lead to far-reaching economic benefits throughout Brown County and beyond.
Major investments from the public and private sectors will be essential for the continued transformation of downtown Green Bay. However, big and bold investments are not the only successful approach to urban revitalization. The emerging “tactical urbanism” movement favors quick and cheap actions that create nearly instantaneous positive results. This new approach—led by groups such as the Project for Public Spaces and the Better Block Project—is helping to re-energize hundreds of downtowns and urban corridors in small and large cities across the US. This strategy could provide significant benefits to downtown Green Bay, especially if it provides a forum for engaging and connecting the region’s design professionals (e.g., architects, urban planners, and civil engineers) with the needs of area employers seeking to attract and retain talent.
STRATEGIES & ACTIONS
6.1. Establish an “innovation district” centered on downtown Green Bay.
6.1.1. As part of the innovation district, launch a pilot project to encourage the region’s IT & software workers to locate downtown.
Start with 5-10 of the region’s major employers and work with them to set up a shared co-working space for a portion of their IT workforce (10-20 workers initially).
Use this as a networking and talent retention strategy for the technology workers already employed by local businesses.
Depending on the success of the pilot, expand the initiative to include additional employers and organizations that can help create an environment that is favorable to innovation and creativity.
Encourage the region’s higher education institutions, led by UW-GB, to play a role in this program.
6.1.2. Work with the City of Green Bay and Brown County to establish public incentives that encourage new investment in a specified area in downtown Green Bay.

GREATER GREEN BAY CHAMBER
GREATER GREEN BAY STRATEGIC PLAN PAGE | 14
6.1.3. Continue to engage the local arts and design community in projects that elevate the role of arts and culture in downtown Green Bay to create an atmosphere of creativity.
6.2. Capitalize on Greater Green Bay’s most important natural asset—the waterfront.
6.2.1. Continue to invest in urban amenities such as CityDeck and the hike/bike trails along the Fox River to make downtown attractive for residents and businesses.
6.2.2. Enhance access to the Fox River and the bay through public investments and partnerships with the real estate community for new developments along the waterfront.
6.2.3. Explore the potential to add new trails along the Fox River and pedestrian/bike bridges spanning the river in multiple areas of Green Bay, De Pere, and throughout Brown County.
6.3. Go “all in” to encourage new mixed-use commercial and residential development in downtown and in the Titletown District, but also maximize the development potential of the area between the two districts.
6.3.1. Evaluate and revise zoning and land use regulations to allow and encourage mixed-use (office, retail/restaurant, residential) and, where appropriate, dense residential development.
6.3.2. Ensure that prime employment sites are developed to allow the maximum amount of capital investment and high-wage job growth.
6.4. Embrace a “tactical urbanism” approach for activating empty spaces and underutilized assets in Green Bay’s downtown area and in communities throughout Brown County.
6.4.1. Work with Downtown Green Bay, Inc. to support the growth of existing events—like the Wednesday Farmers Market—that bring people into the downtown on a regular basis.
6.4.2. Host alley fairs, parking lot music+food+art festivals, PARK(ing) Day events (temporarily turning an on-street parking spot into a public space), and other new events that enhance the downtown’s role as the region’s center of activity.
6.4.3. Engage the region’s architecture and urban design professionals (e.g., architecture firms, landscape architecture firms, urban planning, and civil engineering firms) in creative efforts to bring new energy and life into downtown Green Bay.
6.4.4. Support the urban revitalization efforts and place-making initiatives in urban districts and corridors in communities throughout Brown County (e.g., Main Avenue and Broadway in De Pere).
EXAMPLES & BEST PRACTICES
Downtown innovation district examples: Chattanooga, TN; Kansas City, MO; Austin, TX; Clearwater, FL; 16 Tech innovation district in Indianapolis, IN.
Downtown waterfront best practices: Grand Rapids, MI; Eau Claire, WI; Pueblo, CO; Bend, OR; Austin, TX.
Tactical urbanism best practices: Alley Fair in Fargo, ND; PARK(ing) Day, the Better Block Project.

GREATER GREEN BAY CHAMBER
GREATER GREEN BAY STRATEGIC PLAN PAGE | 15
INITIATIVE 7: BUILD A ROBUST ECOSYSTEM FOR INNOVATION AND ENTREPRENEURSHIP. Innovative companies, entrepreneurs, creative workers, and technology are critical elements of thriving regional economies. Greater Green Bay already has a number of the ingredients needed to become a center for innovation and entrepreneurship, but these elements are not connected. The region benefits from innovation within its large employers (e.g., Georgia-Pacific, Schreiber Foods) and smaller, high-growth firms (e.g., Breakthrough Fuels, Forsite Benefits), yet these benefits are not widely shared across companies and industries. Too much of the innovation and R&D taking place in Brown County stays within the confines of single companies. The region’s startup community, capital/funding sources, educational institutions, business support organizations, and real estate sector need better alignment and strategic direction.
The regional economy’s long-term success depends on how whole-heartedly the community’s leadership embraces the role of innovation. Innovation must become a core component of the Greater Green Bay economic development program. There is a substantial unmet need and untapped opportunity for new investments and a coordinated approach toward accelerating entrepreneurship and innovation in Brown County.
STRATEGIES & ACTIONS
7.1. Launch a major entrepreneurship and innovation program for Greater Green Bay, as part of Advance.
7.1.1. The purpose of this program will be to coordinate and connect resources, people, and businesses across Greater Green Bay and to create a robust environment for innovation, technology commercialization, and entrepreneurial businesses.
7.1.2. Brand the new program as the resource for accelerating entrepreneurship and innovation across the region.
7.1.3. Potential names for the new program include Greater Green Bay Technology Partners, Innovate Green Bay, or Greater Green Bay Ventures.
7.1.4. This initiative should be led by a full-time, dedicated staff person and should include supporting staff and resources. Ideally, the person leading this effort will have experience running a high-profile accelerator or incubator. Experience with startup companies and with investment funds is essential.
7.2. Expand established networking channels and create new opportunities for relationship building among the region’s entrepreneurs, startups, and technology workers.
7.2.1. Create a mentor program that connects regional business executives with entrepreneurs to expose emerging business leaders to the experience and expertise of seasoned executives.
7.2.2. Strengthen the connections between entrepreneurs and tech workers in Green Bay and surrounding regions with a concentration of technology firms and startups (e.g., Madison, Milwaukee, Chicago, Minneapolis-St. Paul, Detroit, and Atlanta).
7.2.3. Encourage Brown County entrepreneurs to engage with the 1 Million Cups (1MC) chapters in Appleton, Madison, and Milwaukee.

GREATER GREEN BAY CHAMBER
GREATER GREEN BAY STRATEGIC PLAN PAGE | 16
1MC is a national program designed to educate, engage, and connect entrepreneurs. Developed by the Kauffman Foundation, 1MC is based on the notion that entrepreneurs discover solutions and network over a million cups of coffee. One hundred chapters exist in communities across the US.
Explore the potential to establish a One Million Cups chapter in Green Bay.
7.2.4. Also, establish linkages to other national technology hubs such as Silicon Valley, Boston, and Austin.
7.3. Expand access to capital in Greater Green Bay area for high-growth firms and startups.
7.3.1. Include local banks, angel investors, and high net worth individuals in addition to capital resources in nearby larger metro areas.
7.3.2. Explore the potential to create a new angel investment fund for Greater Green Bay risk capital model based on a REIT (real estate investment trust) structure.
Ensure that the fund is professionally managed.
Design the fund to benefit a specific geographic area (e.g., Brown County, the New North).
Orient the fund toward re-investment opportunities that benefit local firms and real estate developments.
7.4. Recruit high-growth firms from other Midwest and national markets.
7.4.1. Start recruitment efforts targeting high-growth firms in Milwaukee and Madison, then extend out to other metro areas with regional and national innovation hubs.
7.4.2. Instead of aiming for total relocation from a larger market to Green Bay, pursue expansions and satellite offices of existing firms.
7.4.3. Use resources like the Inc. 5000 (a list of the fastest growing private firms in the US based on year-over-year revenue growth) to identify firms in other markets that would be a good fit for Greater Green Bay. Additional resources for identifying high-growth firms that could expand in the region include:
CrunchBase (for identifying recent recipients of venture funding)
Fast Company Magazine (World’s Most Innovative Companies)
Forbes (World’s Most Innovative Companies)
MIT Technology Review (Smartest Companies)
Thomson Reuters (Top 100 Global Innovators)
EXAMPLES & BEST PRACTICES
The Venture Asheville program (part of the Asheville-Buncombe County Economic Development Coalition) is a good model of a successful entrepreneurial support initiative.
Emerging Prairie in Fargo, North Dakota, is another good example of a program that is building a robust environment for entrepreneurs.

GREATER GREEN BAY CHAMBER
GREATER GREEN BAY STRATEGIC PLAN PAGE | 17
INITIATIVE 8: ENCOURAGE GREATER ALIGNMENT WITH THE GREEN BAY PACKERS. Greater Green Bay has a unique asset among smaller US metros (fewer than one million residents)—a professional sports franchise. And the Packers are not just any team. With one of the most storied franchises in sports history and a global following that makes them the third most televised NFL team, they represent an unparalleled positive brand and image for Green Bay. The community has always been supportive, but there are many more opportunities for capitalizing on the range of economic development opportunities presented by the Packers.
The team is already addressing some of these opportunities, most notably with the Titletown District. But there are numerous areas of untapped potential where the community can align its efforts more closely with the Packers. Partnerships between the region’s higher education institutions and the Packers related to research, technology commercialization, startups, and innovation are just a few examples of what could and should be pursued as part of a “Packers + community” economic development strategy.
FIGURE 2. THE MOST & LEAST TELEVISED TEAMS IN THE NFL, 2009-2014. BASED ON AVG. NO. OF ANNUAL TELEVISED GAMES IN US TV MARKETS, 2009-2014 REGULAR SEASONS
1 Dallas Cowboys 17 Washington Redskins 2 New York Giants 18 Houston Texans 3 Green Bay Packers 19 Miami Dolphins 4 Pittsburgh Steelers 20 Cincinnati Bengals 5 New England Patriots 21 Detroit Lions 6 Philadelphia Eagles 22 Kansas City Chiefs 7 Denver Broncos 23 Seattle Seahawks 8 Chicago Bears 24 Carolina Panthers 9 New Orleans Saints 25 Tennessee Titans 10 Indianapolis Colts 26 Oakland Raiders 11 San Francisco 49ers 27 Arizona Cardinals 12 Baltimore Ravens 28 St. Louis Rams (now Los Angeles) 13 New York Jets 29 Tampa Bay Buccaneers 14 San Diego Chargers (now Los Angeles) 30 Jacksonville Jaguars 15 Minnesota Vikings 31 Cleveland Browns 16 Atlanta Falcons 32 Buffalo Bills
Source: FiveThirtyEight.
STRATEGIES & ACTIONS
8.1. Work closely with the Packers to support the success of the Titletown District.
8.1.1. Help to identify the appropriate anchors and supporting tenants to occupy space in the district.
8.1.2. Where appropriate, work with the Packers to recruit strategic businesses into the district that complement the team’s unique strengths (e.g., companies involved in media, entertainment, and sports medicine).
8.1.3. Encourage compatible development in adjacent and surrounding properties to create a growing hub of urban vitality.

GREATER GREEN BAY CHAMBER
GREATER GREEN BAY STRATEGIC PLAN PAGE | 18
8.2. Partner with the Packers to explore options to link the Titletown District with downtown Green Bay.
8.2.1. Launch a collaborative effort between the Packers, the City of Green Bay, the Village of Ashwaubenon, Brown County, Advance, and the Chamber to revitalize and activate the districts and corridors connecting downtown Green Bay and the Lambeau Field/Titletown District area.
8.2.2. Engage the real estate community to identify and encourage new investment and development to incorporate a mixture of uses (office, retail, restaurants/bars, hotels, and dense residential).
8.2.3. Identify opportunities to improve physical connectivity (roads, signage, bike/pedestrian & trail access) and virtual connectivity (partnerships between businesses in both districts).
8.2.4. Work with higher education partners and other groups to incorporate creative approaches (e.g., design competitions, art installations, and festivals/events) that help energize the space between the two districts. Focus on key nodes, gateways, and highly visible sites along the corridor.
8.3. Capitalize on the Packers’ relationships with the NFL and the league’s other 31 teams by convening an NFL owners/presidents summit in Greater Green Bay.
8.3.1. The joint meeting should be focused on exploring best practices around NFL teams and their role in economic development.
8.3.2. Representatives from NFL teams, local government leaders, and economic development organizations should take part in this summit.
8.3.3. Discussions should cover the following topics:
The “two-way street” of community support for its team (including incentives for stadiums) and the investment from the team into the community.
Leveraging the team’s brand for business recruitment and marketing.
Real estate development and public-private partnerships, focusing on what different teams have done beyond the stadium itself.
Innovation, technology development, and startup growth associated with the team.
8.3.4. During the summit, showcase the Packers’ role in regional economic development, including the Titletown District and community partnerships.
EXAMPLES & BEST PRACTICES
Frisco, Texas partnership with the Dallas Cowboys’ corporate HQ & training facility as part of “$5 Billion Mile.”
San Antonio Spurs and the SAGE (San Antonio for Growth on the Eastside) partnership to revitalize the area around the AT&T Center and neighborhoods connecting downtown San Antonio to the near Eastside.
Fantag sports & social media technology startup in Sacramento (partnership with Greater Sacramento Economic Council and Sacramento Kings).

GREATER GREEN BAY CHAMBER
GREATER GREEN BAY STRATEGIC PLAN PAGE | 19
INITIATIVE 9: ELEVATE THE ROLE OF EVENTS AND CONFERENCES. Far too many communities have weak ties between their economic development program and their convention & visitors bureau. This can lead to missed opportunities for connecting the hospitality sector to broader economic development outcomes, such as target industry recruitment and talent attraction. The Green Bay region has a unique opportunity to connect its tourism and event promotion efforts, led by the Greater Green Bay Convention & Visitors Bureau, with its overall economic development activities led by the Greater Green Bay Chamber and Advance. The recruitment of new businesses and investments into the region can be facilitated through strategic partnerships between the CVB and the Chamber.
The Packers organization and its role in global media channels provide the region with another advantage that can be leveraged through events and conferences that attract new businesses and talent into the region. The potential of large-scale events to influence how the world views Green Bay should not be underestimated. A prime example of how events can translate into significant economic development outcomes (beyond just the tourism spending associated with the event itself) is how the SXSW Music+Interactive Festival has accelerated Austin’s position as a national technology and innovation hub. These types of linkages between tourism and economic development should be encouraged in Greater Green Bay as well.
Public sector investments in tourism promotion and destination development (e.g., convention centers and urban amenities) are a key factor in catalyzing economic growth in many communities. The acclaimed Oklahoma City MAPS projects, funded through a one-cent sales tax, are a good example of strategic public investments that have played a central role in the transformation of the city’s downtown and in supporting region-wide economic growth. A major benefit of these types of investments is that, in addition to boosting tourism and visitor attraction, they enhance the community’s appeal for existing and future residents.
STRATEGIES & ACTIONS
9.1. Evaluate committing to a ½ percent Brown County sales tax and other public and private funding sources and dedicate the revenue toward catalyst projects.
9.1.1. Replace the existing Shopko Hall/Brown County Veterans Memorial Arena complex with a new facility to host major events.
9.1.2. In addition to the events center, a portion of the sales tax revenue and/or other public and private funding sources could also be used to fund other key projects to strengthen local amenities (e.g., trails, bike/pedestrian bridge over the Fox River, and enhanced physical connections between Titletown and downtown) and other economic development initiatives/projects identified in this plan.
9.2. Encourage greater levels of collaboration between the CVB’s event promotion efforts and Advance’s business recruitment activities.
9.2.1. Identify specific events related to Greater Green Bay’s target industries and host them locally, providing a unique marketing channel to key business decision makers within specific sectors.
9.2.2. Initiate a “backyard marketing” program in partnership with the CVB to bring relevant conferences into Brown County.

GREATER GREEN BAY CHAMBER
GREATER GREEN BAY STRATEGIC PLAN PAGE | 20
Conduct a regular survey of local employers regularly about which out-of-market conferences they are attending.
Depending on a range of factors (number of local professionals attending the event, size of the event, relevance to target industries, etc.), the CVB would pursue new events and work with local partners to host them in Brown County.
9.3. Work with the CVB and other partners to support the growth of Greater Green Bay’s tourism industry.
9.3.1. Support the continued success and growth of existing events that bring in tourism spending and also create a strong sense of place and create new events that draw in outside visitors.
9.3.2. Market the Greater Green Bay area as a destination/point-of-departure for nearby tourism destinations including the Door Peninsula and the Upper Peninsula of Michigan.
EXAMPLES & BEST PRACTICES
SXSW Music+Interactive Festival in Austin
ArtPrize in Grand Rapids
OKC MAPS program in Oklahoma City

GREATER GREEN BAY CHAMBER
GREATER GREEN BAY STRATEGIC PLAN PAGE | 21
INITIATIVE 10: ENSURE DIVERSITY AND INCLUSIVENESS. The need to share economic prosperity across a wider range of groups (women, ethnic/racial minorities, young people) is a national imperative. Part of the challenge is to improve economic opportunities for all of the region’s existing residents, including groups with access to fewer educational and financial resources.
Organizations such as the Greater Green Bay Chamber, the Community Foundation, and United Way are already spearheading efforts in this direction. However, the other equally important issue is encouraging greater diversity overall. Greater Green Bay is not as diverse as the US as a whole and this is a growing challenge given the need to attract and retain talented workers, especially in light of the large pool of baby boomers reaching retirement age. The region will need to broaden its appeal to non-traditional populations, including those already residing in the region and those who might consider moving to Greater Green Bay.
Working more closely with the region’s existing employers is a promising approach to improving access to jobs and providing pathways toward greater economic opportunities for all of the region’s populations. Existing employers represent the majority of current and future job openings and are more invested in the community than out-of-state market firms seeking to expand into the region are. Furthermore, these employers have many middle-skills positions and, in health care in particular, strong career pathways. It is these existing employers—well-established institutions with roots in the community—that are considered “anchor” institutions.
Anchor institutions, such as hospitals, universities, arts/cultural institutions, and sports venues, play a critical role in urban economic development in cities across the US. The Green Bay region is blessed with a wide range of anchors (e.g., hospitals, UW-GB, NWTC, St. Norbert College, Brown County, City of Green Bay, and the Packers) that can serve as foundations for additional economic development. The Greater Green Bay Chamber, the Community Foundation, and other groups should partner with these anchors to identify and implement new programs that provide better economic opportunities to underserved populations.
Partnering with anchor institutions to increase local procurement and hiring is a fairly new type of strategy that is promising. Though the strategy is still being refined, engaging these anchor institutions and ensuring that they can fill their human resource needs with local talent and their procurement needs with local suppliers will no doubt be one of the most effective ways to create new jobs in Greater Green Bay for residents seeking to enhance their earning potential and economic opportunities.
STRATEGIES & ACTIONS
10.1. Embark on a regional anchor institution strategy.
10.1.1. Encourage anchors to engage in subcontracting that seeks out minority and women-owned businesses.
10.1.2. Assist anchors with setting up homebuyer assistance programs that encourage employees to become local homeowners near their place of employment.
10.1.3. Work with anchors to expand/create workforce-training programs that hire local residents.
10.2. Align economic development initiatives closely with the region’s foundations and philanthropic community, led by the Greater Green Bay Community Foundation.
10.3. Raise the profile of inclusive development and diversity across the region’s partner organizations.

GREATER GREEN BAY CHAMBER
GREATER GREEN BAY STRATEGIC PLAN PAGE | 22
10.3.1. Encourage companies and nonprofit organizations to seek diverse board representation.
10.3.2. Enhance the awareness of and connections to organizations that champion the needs of diverse populations.
EXAMPLES & BEST PRACTICES
Minneapolis-St Paul: McKnight Foundation & Corridors of Opportunity
Northeast Ohio: Fund for our Economic Future
Anchor institution examples: Cleveland Clinic, Midtown Detroit (Wayne State University, Detroit Medical Center, Henry Ford Health System), Mayo Clinic & Mayo Clinic Ventures in Rochester (MN)
GREATER GREEN BAY CHAMBER
GREATER GREEN BAY STRATEGIC PLAN PAGE | 23
INITIATIVE 11: ENHANCE TRANSPORTATION ACCESS AND CONNECTIVITY. Greater Green Bay has good transportation infrastructure and connections, but improvements are needed, especially to the region’s highway infrastructure (a new bridge in De Pere) and additional flights to/from Green Bay Austin Straubel International Airport. Green Bay currently offers nonstop flights to the three major Midwest hub airports (Chicago-O’Hare, Detroit, and Minneapolis-St. Paul) as well as the recently added daily flight to Atlanta. This is similar to the level of connectivity offered at Appleton’s airport and is comparable to other similarly sized communities, but additional nonstop destinations would make a huge positive impact on the area’s business opportunities.
If Greater Green Bay can align its community and business leaders toward gaining additional connections to major national business centers and airport hubs (such as Dallas-Fort Worth, New York, DC, Denver, and Phoenix), the region will significantly improve its ability to recruit corporate headquarters, professional services firms, and other businesses that rely on frequent air travel. Over time, the addition of new nonstop flights from Green Bay Austin Straubel International Airport would eliminate most of the “leakage” caused by Northeast Wisconsin residents who drive south an extra one to three hours to fly out of the Milwaukee and Chicago airports. Brown County’s business and government leaders must remain focused on leveraging and enhancing all of the community’s existing transportation assets—the airport, the rail network, the highways, the Port of Green Bay—in order to enhance the region’s long-term economic competitiveness.
STRATEGIES & ACTIONS
11.1. Continue working with regional business leaders and other stakeholders to support and expand the passenger and freight operations at Green Bay Austin Straubel International Airport.
11.2. Leverage the Port of Green Bay to expand the role of water-based transport as an economic engine and in support of related sectors including manufacturing, construction, and agriculture.
11.3. Advocate for regional transportation infrastructure investments in new highway and rail capacity to enhance Greater Green Bay’s connections to outside markets.
11.4. Convene a regular freight mobility working group meeting (bi-monthly or quarterly) of public and private sector leaders involved in freight mobility to discuss transportation issues affecting the region’s economy.
11.4.1. This meeting should be designed to encourage networking within the region’s logistics and distribution industry, including representation from the public and private sectors.
11.4.2. Design the meeting to engage Schneider and other regional businesses involved in goods movement to identify and evaluate the region’s needs and opportunities associated with freight transportation.
11.4.3. The meeting should also include presentations from local/state/federal transportation planners and knowledge sharing about major transportation policies and infrastructure projects.

GREATER GREEN BAY CHAMBER
GREATER GREEN BAY STRATEGIC PLAN PAGE | 24
PERFORMANCE METRICS A critical component of successful strategic plans is the set of metrics by which the plan’s implementation is tracked. Below are the suggested measures of success that should be tracked on a continual basis (monthly or quarterly if possible, but at least annually).
METRIC EXPLANATION DATA SOURCES
Employment Growth Increase the number of jobs from existing and new employers.
US Bureau of Labor Statistics (Quarterly Census of Employment and Wages), business interviews, surveys, and media reports
High-Wage Employment Growth
Increase the number of jobs that pay above area median wages and/or above the median wage within the industry.
US Bureau of Labor Statistics (Quarterly Census of Employment and Wages), business interviews, surveys, and media reports
Capital Investment Attract a higher level of new investment from new and existing companies, real estate developers, and other investors.
Business interviews, surveys, and media reports
Business Startups Increase the number of new businesses created locally and startups attracted from outside of the region.
Business interviews, surveys, and media reports
Business Recruitment & Relocation
Attract business expansion and/or relocation projects from outside of the community.
Business interviews, surveys, and media reports
Educational Attainment
Increase the share of adult population with bachelor’s degrees.
U.S. Census Bureau – American Community Survey (1-year estimates)
Tax Base Growth Expand the local property tax and sales tax base for Brown County and for local municipalities.
Brown County, local municipalities

GREATER GREEN BAY CHAMBER
GREATER GREEN BAY STRATEGIC PLAN PAGE | 25
APPENDIX A: ECONOMIC ASSESSMENT & SWOT KEY FINDINGS The economic assessment revealed numerous insights into the Greater Green Bay economy. The most significant findings are highlighted below:
The Greater Green Bay metro area population has grown at a steady pace for the last couple of decades. The metro area grew from 244,000 residents in 1990 to 316,000 in 2015, an increase of nearly 30 percent.
The area’s employment base has grown slowly since 2010. The local economy added roughly 9,300 jobs between 2010 and 2016, an annual growth rate of about one percent, roughly half the two percent growth rate in the US as a whole.
Manufacturing is strong at the local, regional, and statewide levels. Greater Green Bay has a significantly higher concentration of manufacturing jobs than the US economy.
The largest employers in Brown County are primarily in paper products, food processing, and health care. These three sectors account for 18 of the county’s 30 largest employers.
Brown County is a major employment center for all of Northeast Wisconsin, drawing in 23,000 net inbound commuters from outside the county on a daily basis. The sectors bringing in the largest number of commuters include manufacturing, health care, and finance & insurance.
Brown County has gained nearly 500 net new residents from Cook County, Illinois since 2010. The county gained a total of more than 650 net new residents from 2010 to 2015 due to migration. This includes net losses of residents to Outagamie County, Milwaukee County, and Dane County.
Air passenger traffic has declined significantly at Green Bay Austin Straubel International Airport, while traffic at Appleton’s airport has increased in recent years. The number of passengers flying in/out of Green Bay has decreased by nearly 40 percent since May 2008.
UW-Green Bay remains one of the smallest campuses in the UW system (less than 7,000 students), despite growing its enrollment by 20 percent from 2005 to 2015. UW-Green Bay also has a smaller amount of academic R&D spending than many UW system universities, and has seen its level of R&D investments decline faster than any other higher education institution in Wisconsin from 2004 to 2014.
Downtown Green Bay’s population declined from 2000 to 2010, but has grown slightly from 2010 to 2016. The city’s downtown population has expanded at a slower pace than many other cities, including competitors such as Milwaukee, Chicago, and Minneapolis.
SWOT ANALYSIS In addition to our review of economic and demographic data, our understanding of Greater Green Bay was informed by roundtable discussions and meetings with regional business, community, and academic leaders. Based on these qualitative insights, along with our experience working with communities across the country, we have developed an analysis of the region’s strengths, weaknesses, opportunities, and threats—commonly referred to as a SWOT analysis.

GREATER GREEN BAY CHAMBER
GREATER GREEN BAY STRATEGIC PLAN PAGE | 26
A SWOT analysis can be defined as follows:
STRENGTHS. Advantages that can be built on to grow and strengthen the regional economy.
WEAKNESSES. Liabilities and obstacles to economic development that could limit the region’s growth potential.
OPPORTUNITIES. Assets and positive trends that hold significant potential for increased regional prosperity and the attraction of new businesses, investments, and people.
THREATS. Unfavorable external factors and trends that could negatively impact the regional economy.
The results of our analysis are outlined below.
STRENGTHS
• Greater Green Bay Chamber, including Advance, is a strong organization with broad-based support from the community’s leadership (public and private sectors)
• Additional strong organizations supportive of economic development in the region (Greater Green Bay Convention & Visitors Bureau, Greater Green Bay Community Foundation, New North)
• Green Bay Packers organization and its global brand • Second largest media market in Wisconsin (after Milwaukee, but larger than Madison) • New Medical College of Wisconsin-Green Bay facility • Multiple major health care systems • Strong group of higher education institutions in region (UW-GB, NWTC, St. Norbert College, Medical College
of Wisconsin-GB, Bellin College) • Numerous strong K-12 school districts and private schools in region • Successful initiatives aimed at inclusive economic development (e.g., Achieve Brown County, Partners in Education) • Green Bay is the nexus of the New North regional effort • Advance Business & Manufacturing Center • Rapidly improving downtown district driven by the City of Green Bay, with new private investment in office
space (Schreiber Foods, Inc. and Associated Bank HQs), residential development, and restaurant/entertainment venues
• Brown County Resource Recovery programs to enhance environmental sustainability and support economic development
• Second largest farmers market in Wisconsin • Downtown is free from major physical barriers limiting development potential such as an interstate highway • Titletown District adjacent to Lambeau Field • Community culture of collaboration and support for local businesses • Strong support system for regional manufacturers, led by Northeast Wisconsin Technical College and
Northeast Wisconsin Manufacturers Alliance • Emerging group of high-growth startups in the region (including Breakthrough Fuels, Forsite Benefits, and others)

GREATER GREEN BAY CHAMBER
GREATER GREEN BAY STRATEGIC PLAN PAGE | 27
STRENGTHS (CONTINUED)
• Geographic location and proximity to natural assets and tourism destinations (Door Peninsula, Upper Peninsula of Michigan)
• Affordable real estate (residential, commercial, and industrial) compared with larger markets such as Chicago • Green Bay Austin Straubel International Airport has room for expansion and additional nonstop flights • Commitment among local nonprofit organizations to support inclusiveness (such as seeking diversity in boards
of directors) • Large pools of capital available in the community through local financial institutions and high-net-worth
individuals • The region is relatively compact and easily accessible (short commute times relative to US average)
WEAKNESSES
• Relatively low share of professional services firms and professional job opportunities • Relatively low educational attainment levels (share of adults with a Bachelor’s degree or higher) • Regional collaboration is sometimes made more difficult due to the large number of municipalities in Brown
County, each of which has its own priorities and vision for success in economic development • Lack of diversity (racial, ethnic, cultural, geographic) is a challenge for attracting new residents • Major new highway bridge needed in De Pere has been delayed for 20 years • Perceptions of East vs. West barrier (Fox River) within the region • Many employers struggle to fill professional positions and skilled trades positions • Perceptions of Green Bay as a blue-collar community that lacks professional job opportunities • Many young adults desire to leave Green Bay for larger urban environments (Milwaukee, Chicago,
Minneapolis-St. Paul)
OPPORTUNITIES
• Potential for greater alignment and leadership among key regional entities (Chamber, Advance, CVB, Community Foundation) and private sector
• Expansion of University of Wisconsin-Green Bay (including enrollment growth, academic R&D growth, and physical expansion into the downtown)
• Continued development of downtown Green Bay • Leverage Titletown District to attract businesses and additional nearby development • Capitalize on new Medical College of Wisconsin campus for economic development (partnerships, R&D) • Opportunity for medical information technology innovation through major hospitals and startups, as well as
medical supply vendors that would benefit from proximity to hospitals • Potential for a dedicated county sales tax to fund catalyst projects for economic development (similar to the
Oklahoma City MAPS program) • Leverage the media and global brand awareness of the Green Bay Packers • Promote the region’s natural assets for economic development, especially water

GREATER GREEN BAY CHAMBER
GREATER GREEN BAY STRATEGIC PLAN PAGE | 28
OPPORTUNITIES (CONTINUED)
• Enhance the region’s connections to tech startup communities in Milwaukee, Madison, Chicago, and Minneapolis-St. Paul
• Build additional linkages between economic development and tourism (Advance + CVB + Packers) • Leverage Green Bay’s existing nonstop flight destinations (Chicago, MSP, Detroit, and Atlanta) for talent
attraction and business recruitment efforts • Pursue additional nonstop flight destinations at Green Bay Austin Straubel International Airport (potentially
Dallas-Fort Worth, Denver, New York) • Support the region’s entrepreneurship ecosystem through new programs, support services, networking
opportunities, and facilities • Establish a “science & industry” museum to engage K-12 students and for tourism • Expand networking opportunities, support systems, and leadership engagement for diverse segments of the
community’s population • Move regional employers toward skills-based hiring, instead of only credentials-based hiring • Build on Green Bay’s role as a regional service center (additional retail, restaurants, services, health care) for
the large rural areas outside of the community • Potential for a major new multi-use sports facility to serve the community and bring in tourism spending • Potential for more strategic use of TIF (tax increment financing) to support economic development
THREATS
• Loss of talent to larger metro areas in the state (Milwaukee and Madison) and Midwest (Chicago, Minneapolis-St. Paul)
• Changes in sports viewing habits at the national level, such as a potential future decline in NFL viewership, which may impact the Packers
• Risk-averse culture in the region and state limits growth potential, in comparison to communities that place a higher priority on innovation and entrepreneurship (such as Austin, Silicon Valley, and even smaller communities like Asheville and Boulder)
• Major employers vulnerable due to ongoing/potential acquisitions, technology disruptions, and changing consumer behaviors
• Continued decline in passenger traffic at Green Bay Austin Straubel International Airport
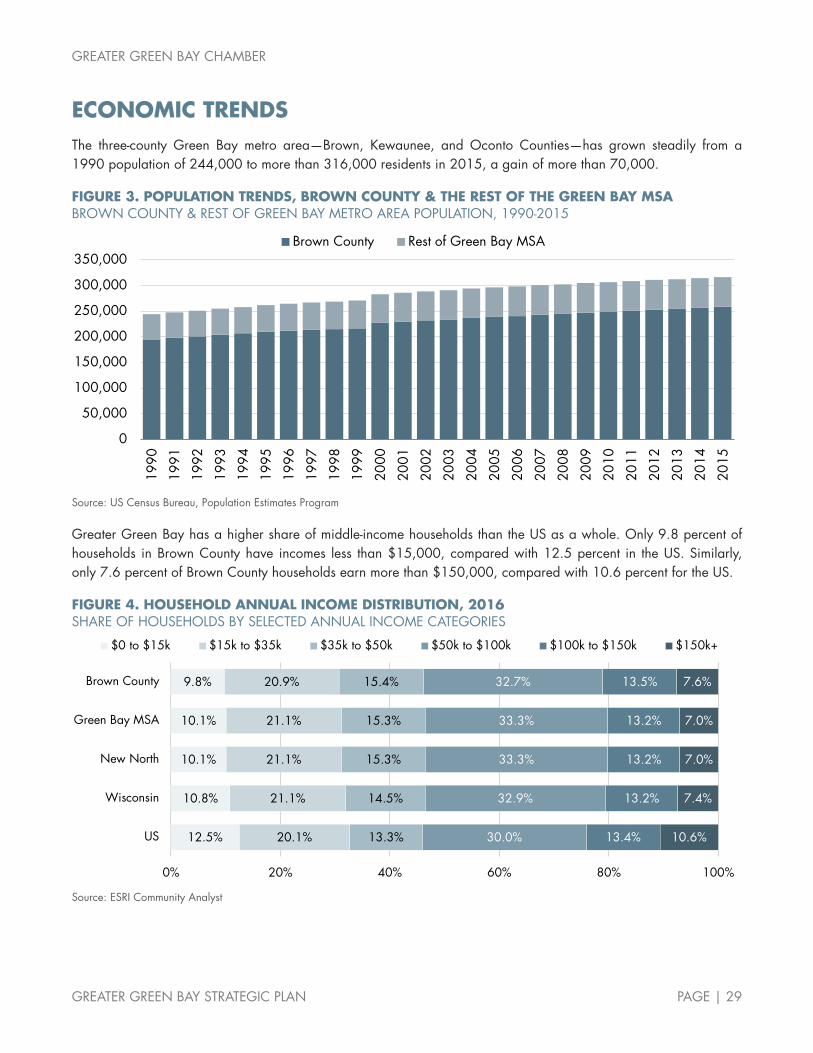
GREATER GREEN BAY CHAMBER
GREATER GREEN BAY STRATEGIC PLAN PAGE | 29
ECONOMIC TRENDS The three-county Green Bay metro area—Brown, Kewaunee, and Oconto Counties—has grown steadily from a 1990 population of 244,000 to more than 316,000 residents in 2015, a gain of more than 70,000.
FIGURE 3. POPULATION TRENDS, BROWN COUNTY & THE REST OF THE GREEN BAY MSA BROWN COUNTY & REST OF GREEN BAY METRO AREA POPULATION, 1990-2015
Source: US Census Bureau, Population Estimates Program
Greater Green Bay has a higher share of middle-income households than the US as a whole. Only 9.8 percent of households in Brown County have incomes less than $15,000, compared with 12.5 percent in the US. Similarly, only 7.6 percent of Brown County households earn more than $150,000, compared with 10.6 percent for the US.
FIGURE 4. HOUSEHOLD ANNUAL INCOME DISTRIBUTION, 2016 SHARE OF HOUSEHOLDS BY SELECTED ANNUAL INCOME CATEGORIES
Source: ESRI Community Analyst
0
50,000
100,000
150,000
200,000
250,000
300,000
350,000
1990
1991
1992
1993
1994
1995
1996
1997
1998
1999
2000
2001
2002
2003
2004
2005
2006
2007
2008
2009
2010
2011
2012
2013
2014
2015
Brown County Rest of Green Bay MSA
12.5%
10.8%
10.1%
10.1%
9.8%
20.1%
21.1%
21.1%
21.1%
20.9%
13.3%
14.5%
15.3%
15.3%
15.4%
30.0%
32.9%
33.3%
33.3%
32.7%
13.4%
13.2%
13.2%
13.2%
13.5%
10.6%
7.4%
7.0%
7.0%
7.6%
0% 20% 40% 60% 80% 100%
US
Wisconsin
New North
Green Bay MSA
Brown County
$0 to $15k $15k to $35k $35k to $50k $50k to $100k $100k to $150k $150k+

GREATER GREEN BAY CHAMBER
GREATER GREEN BAY STRATEGIC PLAN PAGE | 30
The Greater Green Bay economy is driven by dozens of large employers across several industries. Among the 30 largest employers in Brown County, 18 are in the health care, paper products, and food processing sectors. The majority (17 out of 30) of the largest employers are headquartered in Brown County.
FIGURE 5. MAJOR EMPLOYERS IN GREATER GREEN BAY, 2016 30 LARGEST PRIVATE EMPLOYERS, RANKED BY NUMBER OF JOBS IN BROWN COUNTY
TOP 30 EMPLOYERS IN GREATER GREEN BAY, 2016 (BROWN COUNTY-BASED EMPLOYERS HIGHLIGHTED)
NO. EMPLOYER INDUSTRY/PRODUCT TYPE HQ LOCATION JOBS
1 Humana Health Care Louisville, KY 3,283
2 Bellin Health Health Care Green Bay, WI 2,729
3 Oneida Nation Tribal Government Oneida, WI 2,700
4 Schneider Truck Transportation Ashwaubenon, WI 2,633
5 Georgia-Pacific Paper Products Mfg. Atlanta, GA 2,100
6 UnitedHealthcare Health Care Minnetonka, MN 2,050
7 Aurora Health Care Health Care Milwaukee, WI 2,009
8 St. Vincent Hospital Health Care Springfield, IL 1,605
9 American Foods Group Food Processing (Meat) Green Bay, WI 1,467
10 Prevea Health Health Care Ashwaubenon, WI 1,417
11 Green Bay Packaging, Inc. Paper Products Mfg. Green Bay, WI 1,401
12 Wisconsin Public Service Utilities Green Bay, WI 1,162
13 JBS Green Bay Food Processing (Meat) Greeley, CO 1,142
14 Shopko Retail Ashwaubenon, WI 1,129
15 Wal-Mart Stores, Inc. Retail Bentonville, AR 1,119
16 Associated Banc-Corp. Finance Green Bay, WI 1,108
17 Ameriprise Auto & Home Insurance Insurance Ashwaubenon, WI 994
18 Festival Foods Grocery Stores De Pere, WI 900
19 KI Furniture Furniture Manufacturing Bellevue, WI 862
20 Schreiber Foods Dairy Products Green Bay, WI 760
21 Paper Converting Machine Company Industrial Machinery Mfg. Green Bay, WI 750
22 RR Donnelley Printing Products Chicago, IL 716
23 Belmark, Inc. Paper Products Mfg. De Pere, WI 697
24 Proctor & Gamble Paper Products Paper Products Mfg. Cincinnati, OH 691
25 St. Norbert College Higher Education De Pere, WI 550
26 EGS (formerly APAC Customer Services) Call Center Plano, TX 530
27 Nsight & Cellcom Telecommunications Green Bay, WI 513
28 St. Mary’s Hospital Medical Center Health Care Springfield, IL 483
29 Prolamina Paper Products Mfg. Westfield, MA 482
30 Nature’s Way Food Processing (Herbal) Green Bay, WI 439 Source: Greater Green Bay Chamber, May 2016

GREATER GREEN BAY CHAMBER
GREATER GREEN BAY STRATEGIC PLAN PAGE | 31
The number of passengers traveling through Green Bay Austin Straubel International Airport has declined significantly since 2008. Over the 12-month period ending in July 2016, there were an average of 23,055 passengers at Green Bay’s airport, compared with 36,757 passengers for the 12 months ending in May 2008, the highest level of traffic before the Great Recession began. This is a decline of more than 37 percent. During this same period, Appleton’s airport traffic has remained relatively constant. A concerning trend in recent months, beginning in early 2015, is the continued decline of passenger traffic in Green Bay, along with a notable increase of traffic in Appleton. A decade ago, Green Bay’s monthly air passenger traffic was consistently 30 to 40 percent higher than Appleton’s was. Today, Green Bay’s traffic is only 5 percent higher than Appleton’s is. Two potential explanations for this include: 1) travelers that previously flew out of Green Bay are now choosing Appleton; and/or 2) Appleton residents that previously flew out of Green Bay are now choosing Appleton’s airport. These trends are worrisome for Green Bay’s economic development leaders, given the importance of air travel for the retention and attraction of businesses.
FIGURE 6. AIR TRAVEL PASSENGERS, GREEN BAY & APPLETON AIRPORTS AVERAGE MONTHLY DOMESTIC PASSENGERS (12-MONTH ROLLING AVG.), SEPT. 2003-JULY 2016
Source: US Department of Transportation, Bureau of Transportation Statistics
10,000
15,000
20,000
25,000
30,000
35,000
40,000
Sep2003
Sep2004
Sep2005
Sep2006
Sep2007
Sep2008
Sep2009
Sep2010
Sep2011
Sep2012
Sep2013
Sep2014
Sep2015
Green Bay Appleton

GREATER GREEN BAY CHAMBER
GREATER GREEN BAY STRATEGIC PLAN PAGE | 32
County-to-county migration flow data from the US Internal Revenue Service help to illustrate the geographic mobility of residents. The table below presents the top 20 county-to-county migration flows to and from Brown County. Between 2010 and 2015, Brown County experienced a total inflow of 41,221 residents and a total outflow of 40,565 residents, for a grand total of 656 net new residents in the county due to migration. The top county sending new residents to Brown County during this period was Cook County, Illinois, which sent 458 net new residents to Brown County. Other counties from which Brown County gained at least 100 net new residents include Manitowoc (315), Shawano (177), Door (137), Winnebago (127), Kewaunee (109), and Marinette (102). Brown County experienced a net outflow of at least 100 people to the following counties: Outagamie (243), Dane (206), Milwaukee (205), Hennepin County, MN (165), and Maricopa County, AZ (105). Brown County also experienced significant inflows to and outflows from Oconto County, with roughly 3,000 residents moving in both directions.
In addition to measuring the flow of people, this data source sheds light on the adjusted gross income levels of households moving across county lines. Despite gaining a small share of residents due to migration from 2010 to 2015, Brown County lost a net annual $22 million in AGI (adjusted gross income) during this period. This finding suggests that people moving away from Brown County have slightly higher incomes than people moving into the county do.
FIGURE 7. COUNTY-TO-COUNTY MIGRATION FLOWS FOR BROWN COUNTY, 2010-2015 TOP 20 CUMULATIVE NET FLOWS OF RESIDENTS & ADJUSTED GROSS INCOME TO/FROM BROWN COUNTY
Source: US Internal Revenue Service
Geography Inflow Outflow Net Inflow Outflow NetCook County, IL 1,316 858 458 $20,742 $19,700 $1,042Manitowoc County, WI 1,489 1,174 315 $36,358 $24,410 $11,948Shawano County, WI 1,445 1,268 177 $31,119 $24,289 $6,830Door County, WI 903 766 137 $23,178 $26,539 -$3,361Winnebago County, WI 1,341 1,214 127 $28,712 $26,454 $2,258Kewaunee County, WI 1,732 1,623 109 $38,574 $32,947 $5,627Marinette County, WI 1,169 1,067 102 $22,389 $22,922 -$533Marathon County, WI 580 485 95 $14,456 $18,085 -$3,629Calumet County, WI 679 604 75 $17,722 $12,795 $4,927Portage County, WI 328 255 73 $7,593 $5,346 $2,247Sheboygan County, WI 560 489 71 $17,981 $6,793 $11,188Fond du Lac County, WI 328 271 57 $7,276 $5,839 $1,437Oconto County, WI 3,049 3,001 48 $65,656 $76,178 -$10,522Waupaca County, WI 319 315 4 $5,704 $6,150 -$446Waukesha County, WI 447 458 (11) $15,169 $15,906 -$737Maricopa County, AZ 368 473 (105) $7,366 $12,672 -$5,306Hennepin County, MN 412 577 (165) $8,505 $13,384 -$4,879Milwaukee County, WI 1,617 1,822 (205) $33,544 $33,587 -$43Dane County, WI 798 1,004 (206) $27,610 $28,181 -$571Outagamie County, WI 4,555 4,798 (243) $100,626 $108,198 -$7,572
Migration Adj. Gross Income (in $1,000s)

GREATER GREEN BAY CHAMBER
GREATER GREEN BAY STRATEGIC PLAN PAGE | 33
Average annual wages in Brown County grew from just over $36,000 in 2005 to nearly $47,000 in 2015 (not adjusted for inflation). Wages in Brown County have consistently been about two to three percent higher than wages in the Green Bay MSA and in Wisconsin as a whole, but have lagged US average wages by nearly 15 percent during this period. Wages in the New North region have remained between six and eight percent lower than Brown County, due to the rural counties in the region with significantly lower wages.
FIGURE 8. WAGE GROWTH TRENDS AVERAGE ANNUAL WAGES, 2005-2015
Source: US Bureau of Labor Statistics, QCEW
Before the Great Recession, the construction of new homes in the Green Bay metro area averaged well over 1,000 new housing units each year. Similar to the rest of the US, new home construction declined dramatically in 2008 and stayed far below previous levels for several years. However, the region’s housing sector showed new signs of life in 2015, which was the first year since before the recession that more than 1,000 housing permits were issued.
FIGURE 9. NEW HOME CONSTRUCTION IN GREEN BAY MSA, 1980-2015 NUMBER OF SINGLE-FAMILY & MULTI-FAMILY HOUSING PERMITS ISSUED BY YEAR
Source: US Dept. of Housing & Urban Development, Building Permits Database
$30,000
$35,000
$40,000
$45,000
$50,000
$55,000
2005
2006
2007
2008
2009
2010
2011
2012
2013
2014
2015
Brown County Green Bay MSA New North Wisconsin US
0
500
1,000
1,500
2,000
2,500
1980
1981
1982
1983
1984
1985
1986
1987
1988
1989
1990
1991
1992
1993
1994
1995
1996
1997
1998
1999
2000
2001
2002
2003
2004
2005
2006
2007
2008
2009
2010
2011
2012
2013
2014
2015
Single-Family Multi-Family

GREATER GREEN BAY CHAMBER
GREATER GREEN BAY STRATEGIC PLAN PAGE | 34
COMMUTING PATTERNS Nearly 85,000 people live and work in Brown County, representing 61 percent of the county’s employment and 73 percent of its employed residents. However, the county has strong economic ties to other parts of Wisconsin. Thanks to its role as a regional employment center, Brown County is a net importer of workers from surrounding counties.
FIGURE 10. INFLOW/OUTFLOW FOR BROWN COUNTY, 2014 FLOW OF WORKERS TO/FROM THE COUNTY
Source: US Census Bureau, Local Employment Dynamics. Notes: Overlay arrows are for illustrative purposes and do not indicate directionality of worker flow between home and employment locations.
The number of people that live and work in Brown County has declined slightly over the last 10 years, while inbound and outbound commuting has increased significantly (by 26 percent and 38 percent, respectively).
FIGURE 11. COMMUTING FLOWS, 2004 TO 2014 NUMBER OF JOB HOLDERS
Source: US Census Bureau, Local Employment Dynamics
84,828 Live and work in Brown County
54,740
Commute to jobs in Brown County from outside
Of the 139,568 workers that held jobs in Brown County in 2014, 39 percent lived outside the county.
31,843
Live in Brown County and commute to jobs
outside
Of the 116,671 residents employed in 2014, 27 percent commuted to jobs outside the county.
0
10,000
20,000
30,000
40,000
50,000
60,000
70,000
80,000
90,000
100,000
2004
2005
2006
2007
2008
2009
2010
2011
2012
2013
2014
OUTBOUND (Commute from Brown County to jobs outside)INBOUND (Commute into Brown County from outside)LIVE & WORK (Live & work in Brown County)
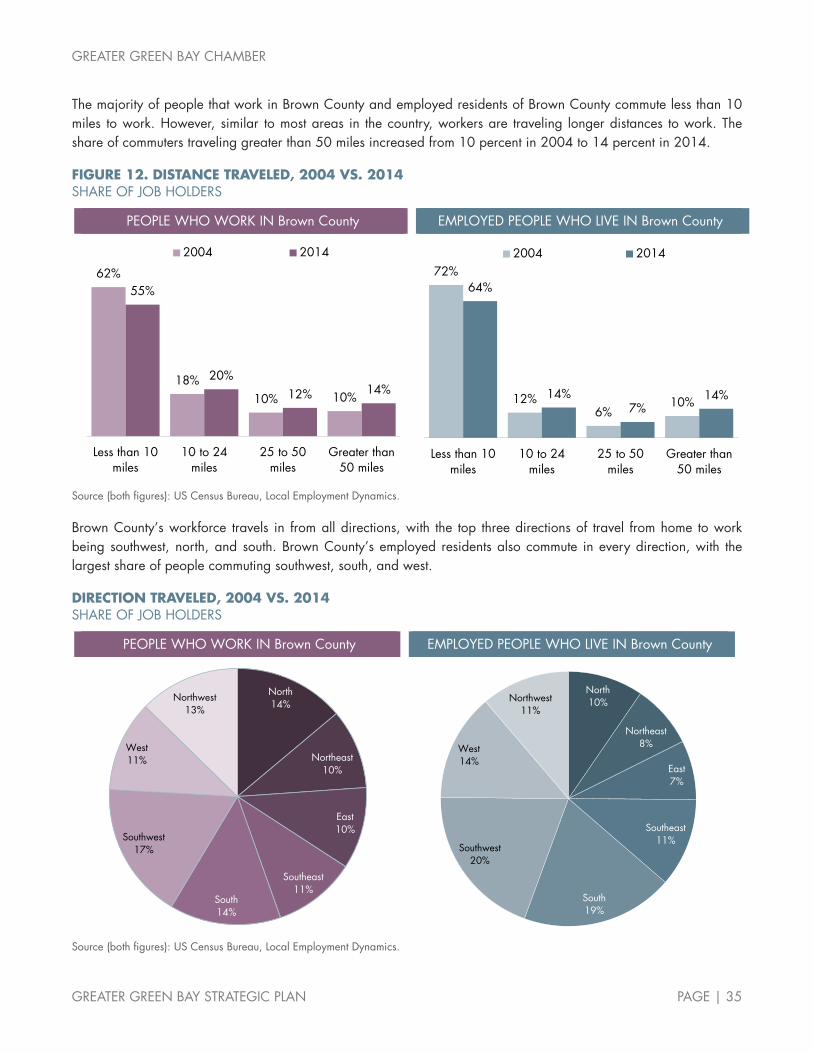
GREATER GREEN BAY CHAMBER
GREATER GREEN BAY STRATEGIC PLAN PAGE | 35
The majority of people that work in Brown County and employed residents of Brown County commute less than 10 miles to work. However, similar to most areas in the country, workers are traveling longer distances to work. The share of commuters traveling greater than 50 miles increased from 10 percent in 2004 to 14 percent in 2014.
FIGURE 12. DISTANCE TRAVELED, 2004 VS. 2014 SHARE OF JOB HOLDERS
PEOPLE WHO WORK IN Brown County EMPLOYED PEOPLE WHO LIVE IN Brown County
Source (both figures): US Census Bureau, Local Employment Dynamics.
Brown County’s workforce travels in from all directions, with the top three directions of travel from home to work being southwest, north, and south. Brown County’s employed residents also commute in every direction, with the largest share of people commuting southwest, south, and west.
DIRECTION TRAVELED, 2004 VS. 2014 SHARE OF JOB HOLDERS
PEOPLE WHO WORK IN Brown County EMPLOYED PEOPLE WHO LIVE IN Brown County
Source (both figures): US Census Bureau, Local Employment Dynamics.
62%
18%10% 10%
55%
20%12% 14%
Less than 10miles
10 to 24miles
25 to 50miles
Greater than50 miles
2004 201472%
12%6%
10%
64%
14%7%
14%
Less than 10miles
10 to 24miles
25 to 50miles
Greater than50 miles
2004 2014
North14%
Northeast10%
East10%
Southeast11%
South14%
Southwest17%
West11%
Northwest13%
North10%
Northeast8%
East7%
Southeast11%
South19%
Southwest20%
West14%
Northwest11%

GREATER GREEN BAY CHAMBER
GREATER GREEN BAY STRATEGIC PLAN PAGE | 36
Technological advancements and changing social norms have enabled a growing share of workers to live anywhere because their work can be done anywhere. According to recent estimates from the US Census Bureau, 4.4 percent of the population works from home. Communities with a much higher or lower share than the US average can be defined as places that people are either choosing to live or choosing not to live. The bottom 10 metro areas (among the 100 largest) are generally places with struggling economies. This includes Memphis, Toledo, Buffalo, Jackson and other areas with far fewer people working from home than the US average. At the other end of the spectrum, the top 10 metro areas combine high desirability with robust economies. Austin, Portland, Denver, San Francisco, and other metro areas in this group have a much higher work-from-home population. People making the decision to live in these areas are not necessarily choosing "place over work". They are simply choosing "place" and the work can be done anywhere. Green Bay lies in the middle of this spectrum, with 4.1 percent of workers working from home. This indicates that Green Bay is not losing large numbers of mobile workers to other areas, but is also not a destination for workers that can choose to live anywhere.
FIGURE 13. PERCENT OF ADULT WORKERS (AGE 16+) WORKING FROM HOME, 2014 GREEN BAY VS. 10 LOWEST & 10 HIGHEST METRO AREAS AMONG 100 LARGEST
Source: U.S. Census Bureau, American Community Survey 5-Year Estimates (2014)
2.3%
2.4%
2.5%
2.6%
2.6%
2.6%
2.7%
2.8%
2.9%
3.0%
4.1%
4.1%
4.4%
5.8%
5.8%
5.9%
6.1%
6.4%
6.4%
6.5%
6.5%
6.9%
7.0%
Augusta, GA
Buffalo, NY
New Orleans, LA
Baton Rouge, LA
Toledo, OH
Jackson, MS
Memphis, TN
Little Rock, AR
Birmingham, AL
Youngstown, OH
Green Bay, WI
Wisconsin
US
Atlanta, GA
Colorado Springs, CO
Phoenix, AZ
San Francisco, CA
Denver, CO
Raleigh, NC
San Diego, CA
Portland, OR
Austin, TX
Boise, ID

GREATER GREEN BAY CHAMBER
GREATER GREEN BAY STRATEGIC PLAN PAGE | 37
FIGURE 14. SELECT JOBHOLDER CHARACTERISTICS SHARE OF WORKERS BY TYPE OF COMMUTING FLOW (INTERNAL, OUTBOUND, INBOUND), 2014
AGE Most jobs held by internal, outbound, and inbound commuters in Brown County are held by people age 30 to 54. Young jobholders in Brown County (age 29 and younger) are more likely to commute outbound than to stay within the county for employment (27.4 percent vs. 22.7 percent). People age 55 and older are more likely to stay within the county for employment than to commute outside the county (21.5 percent vs. 18.9 percent).
EARNINGS Inbound commuters are more likely to hold jobs with high earnings (more than $3,333 per month) than internal and outbound commuters. This is an indication of Brown County’s role as a regional economic center and illustrates the high quality of employment options available within the county relative to surrounding counties.
INDUSTRY CLASS Internal jobholders are more likely to work in goods-producing jobs than outbound and inbound commuters are (24.1 percent vs. 20 percent and 21.5 percent, respectively). This figure highlights the important role that manufacturing plays in Brown County’s economy. Outbound and inbound commuters are much more likely to work in trade, transportation, and utilities jobs than internal jobholders. Nonetheless, service sector jobs represent the majority of jobs held by internal, outbound, and inbound commuters.
Source (all figures): US Census Bureau, Local Employment Dynamics
22.7% 27.4% 23.7%
55.7% 53.7% 55.8%
21.5% 18.9% 20.5%
0%
25%
50%
75%
100%
Internal jobholders
Outboundcommuters
Inboundcommuters
55 years or older30 to 54 years29 years or younger
20.1% 24.0% 20.1%
38.7% 34.7% 35.6%
41.2% 41.4% 44.3%
0%
25%
50%
75%
100%
Internal jobholders
Outboundcommuters
Inboundcommuters
More than $3,333 per month$1,251 to $3,333 per month$1,250 per month or less
24.1% 20.0% 21.5%
16.6% 27.3% 24.9%
59.3% 52.7% 53.6%
0%
25%
50%
75%
100%
Internal jobholders
Outboundcommuters
Inboundcommuters
All other servicesTrade, transportation, and utilitiesGoods-producing

GREATER GREEN BAY CHAMBER
GREATER GREEN BAY STRATEGIC PLAN PAGE | 38
Brown County experiences a net inflow of workers on a daily basis across nearly every sector. Manufacturing represents the largest net inflow of workers, with nearly 4,700 net inbound commuters. At least 2,000 net workers commute into the county to work in health care, finance & insurance, and transportation & warehousing. A combined total of nearly 3,000 net workers commute into the county for professional services and corporate & regional HQs, two sectors that contain many of the highest-paying local jobs. The only sectors in which Brown County exports workers to surrounding counties are utilities, agriculture, and oil, gas, & mining.
FIGURE 15. NET COMMUTING FLOWS BY SECTOR NET FLOWS = INBOUND - OUTBOUND FLOWS
Net Inbound (net commuting into Brown County) Net Outbound (net commuting out from Brown County)
Source: US Census Bureau, Local Employment Dynamics
-277
-183
-6
94
103
324
356
370
655
1,054
1,156
1,380
1,418
1,562
1,776
1,825
2,063
2,368
2,821
4,674
Utilities
Agriculture
Oil, gas, & mining
Property sales & leasing
Government
Arts & entertainment
Personal & other services
Information & media
Administrative services
Education
Construction
Corporate & regional HQs
Professional services
Wholesale Trade
Retail Trade
Restaurants, bars, & hotels
Transportation & warehousing
Finance & insurance
Healthcare
Manufacturing

GREATER GREEN BAY CHAMBER
GREATER GREEN BAY STRATEGIC PLAN PAGE | 39
The figures below indicate the top 10 counties in Brown County’s laborshed (where workers live) and commute-shed (where employed residents work). In both cases, Brown County’s economy is relatively self-sufficient, with a majority of people living and working within Brown County. However, the county does exhibit important ties to other Wisconsin counties. The strongest linkages are with Outagamie County, which accounts for 7.6 percent of Brown County’s workforce (10,600 people that live in Outagamie County and work in Brown County).
FIGURE 16. LABORSHED & COMMUTE-SHED DESTINATIONS, 2014 TOP 10 COUNTIES IN BROWN COUNTY’S LABORSHED (WHERE WORKERS LIVE) & COMMUTE-SHED (WHERE EMPLOYED RESIDENTS WORK)
Where Brown County Workers LIVE Where employed Brown County residents WORK
Source (both figures): US Census Bureau, Local Employment Dynamics.
On a net basis, Brown County gains workers from all of the surrounding counties except for Milwaukee and Dane.
FIGURE 17. TOP 20 SOURCES OF WORKERS, 2014 NET COMMUTING FLOWS FOR TOP 10 COUNTIES WHERE BROWN COUNTY WORKERS LIVE
Source (both figures): US Census Bureau, Local Employment Dynamics.
County Count Share1 Brown County, WI 84,828 60.8%2 Outagamie County, WI 10,594 7.6%3 Oconto County, WI 6,660 4.8%4 Winnebago County, WI 3,628 2.6%5 Manitowoc County, WI 3,336 2.4%6 Kewaunee County, WI 3,163 2.3%7 Shawano County, WI 3,047 2.2%8 Milwaukee County, WI 2,249 1.6%9 Calumet County, WI 2,030 1.5%10 Marinette County, WI 1,537 1.1%
All Other Locations 18,496 13.3%Total 139,568 100.0%
County Count Share1 Brown County, WI 84,828 72.7%2 Outagamie County, WI 7,169 6.1%3 Milwaukee County, WI 3,408 2.9%4 Winnebago County, WI 2,488 2.1%5 Waukesha County, WI 1,990 1.7%6 Dane County, WI 1,762 1.5%7 Manitowoc County, WI 1,452 1.2%8 Kewaunee County, WI 1,092 0.9%9 Calumet County, WI 951 0.8%10 Sheboygan County, WI 840 0.7%
All Other Locations 10,691 9.2%Total 116,671 100.0%
People who WORK in Brown County and live in this county
People who LIVE in Brown County and work in this county Net flow
1 Outagamie County, WI 10,594 7,169 3,425 2 Oconto County, WI 6,660 739 5,921 3 Winnebago County, WI 3,628 2,488 1,140 4 Manitowoc County, WI 3,336 1,452 1,884 5 Kewaunee County, WI 3,163 1,092 2,071 6 Shawano County, WI 3,047 602 2,445 7 Milwaukee County, WI 2,249 3,408 -1,1598 Calumet County, WI 2,030 951 1,079 9 Marinette County, WI 1,537 596 941 10 Dane County, WI 1,276 1,762 -486

GREATER GREEN BAY CHAMBER
GREATER GREEN BAY STRATEGIC PLAN PAGE | 40
INDUSTRY ANALYSIS Brown County has gained jobs each year since 2010. Total employment in the county for 2016 is estimated at just over 165,000 jobs. This is only 2.3 percent higher than the county’s total employment in 2006.
FIGURE 18. BROWN COUNTY EMPLOYMENT, 2006-2016 TOTAL NONFARM JOBS IN BROWN COUNTY
Source: EMSI 2016.3 – QCEW Employees, Non-QCEW Employees, and Self-Employed
161.6157.4
165.2
0
20
40
60
80
100
120
140
160
180
2006
2007
2008
2009
2010
2011
2012
2013
2014
2015
2016
THO
USA
ND
S

GREATER GREEN BAY CHAMBER
GREATER GREEN BAY STRATEGIC PLAN PAGE | 41
The Great Recession affected the entire US with significant job losses between 2007 and 2009. However, Brown County and the Green Bay metro area weathered the recession somewhat better than the surrounding New North region, Wisconsin, and the US. The annual decline in employment during 2008 in Brown County and the Green Bay area was about three percent, compared with four percent for the national economy as a whole. Since 2010, the Greater Green Bay economy has recovered more slowly than the US, with modest annual job growth rates equivalent to roughly half of the US. Brown County and the Green Bay metro area have experienced job growth rates in line with the larger New North region, with the exception of 2014, during which Green Bay’s economy added jobs at nearly double the rate of the New North as a whole.
FIGURE 19. EMPLOYMENT TRENDS, 2006-2016 ANNUAL JOB GROWTH RATE (% CHANGE FROM PRIOR YEAR)
Source: EMSI 2016.3 – QCEW Employees, Non-QCEW Employees, and Self-Employed
-5.0%
-4.0%
-3.0%
-2.0%
-1.0%
0.0%
1.0%
2.0%
3.0%
2006
2007
2008
2009
2010
2011
2012
2013
2014
2015
2016
Brown County Green Bay MSA New North Wisconsin US

GREATER GREEN BAY CHAMBER
GREATER GREEN BAY STRATEGIC PLAN PAGE | 42
This section looks at employment in Brown County and comparison geographies according to different categories of industries based on the North American Industry Classification System (NAICS). The top three industries in Brown County and the Green Bay metro area ranked by percentage of total jobs are manufacturing, health care, and retail trade. These three sectors represent 38 percent of all jobs in Brown County and in the surrounding metro area. The percent of jobs in the manufacturing sector in Brown County, the Green Bay metro area, and Wisconsin is about two times higher than the nation’s share of jobs in manufacturing. The New North region has an even higher share of manufacturing jobs. Education and professional services represent a significantly lower share of total employment in Greater Green Bay compared to the US as a whole.
FIGURE 20. INDUSTRY DISTRIBUTION (% OF TOTAL), 2016 COMPARISON OF BROWN COUNTY WITH STATES AND NATION
Source: EMSI 2016.3 – QCEW Employees, Non-QCEW Employees, and Self-Employed Notes: *Note: Education includes all public schools, colleges, & universities, and healthcare includes all public hospitals. Excludes military and unclassified employment. Three largest industries are highlighted.
NAICS Code & Description31-33 Manufacturing 15.7% 16.3% 20.9% 15.4% 8.0%
62 Healthcare & social assistance* 13.1% 12.8% 11.7% 13.5% 13.5%44-45 Retail trade 9.3% 9.2% 10.2% 10.4% 10.6%
61 Education* 7.4% 7.4% 7.4% 8.3% 9.3%72 Lodging, restaurants, & bars 7.4% 7.2% 7.5% 7.7% 8.6%52 Finance & insurance 6.4% 5.9% 4.2% 4.2% 3.9%23 Construction 4.9% 5.0% 5.5% 4.8% 5.5%42 Wholesale trade 4.8% 4.4% 3.6% 4.0% 3.9%
48-49 Transportation & warehousing 4.4% 4.3% 3.3% 3.5% 3.4%56 Administrative & support services 4.3% 4.0% 4.3% 5.0% 6.4%54 Professional services 4.3% 4.0% 2.9% 3.9% 6.5%
9039 Local govt. 4.0% 4.4% 4.4% 4.1% 3.6%81 Personal & other services 3.7% 3.7% 4.5% 4.7% 4.8%55 Corporate & regional offices 3.5% 3.2% 1.9% 2.1% 1.4%71 Arts, entertainment, & recreation 2.0% 1.9% 1.4% 1.4% 1.7%51 Information 1.1% 1.0% 1.1% 1.6% 1.9%11 Agriculture & forestry 1.1% 2.6% 2.7% 1.8% 1.2%53 Property sales & leasing 1.0% 1.0% 0.9% 1.0% 1.7%
9011 Federal govt. (civilian) 0.7% 0.7% 0.5% 1.0% 1.8%9029 State govt. 0.6% 0.5% 0.6% 1.1% 1.5%
22 Utilities 0.3% 0.4% 0.3% 0.4% 0.4%21 Mining (incl. oil & gas) 0.0% 0.0% 0.1% 0.1% 0.4%
Brown County
Green Bay MSA New North Wisconsin US

GREATER GREEN BAY CHAMBER
GREATER GREEN BAY STRATEGIC PLAN PAGE | 43
Location quotient (LQ) analysis can provide an understanding of an area’s relative strengths. A comparison of industry employment LQs reveals significant differences between Greater Green Bay’s economy in comparison to the New North region, Wisconsin, and the US. The most highly concentrated sectors in Brown County are corporate & regional offices (2.47 LQ), manufacturing (1.99 LQ), finance & insurance (1.63 LQ), and transportation & warehousing (1.32 LQ). Sectors that are significantly under-represented in Brown County include administrative & support services (0.68 LQ), professional services (0.66 LQ), property sales & leasing (0.64 LQ), and information (0.62 LQ). The growth of professional services should be a focus area for Green Bay’s leadership since this sector contains high-paying jobs and would be a key support structure for the area’s existing corporate HQs. Additional sectors with growth potential include health care (0.97 LQ), retail trade (0.88 LQ), and lodging, restaurants, & bars (0.86 LQ). Given Green Bay’s role as a regional service center, these sectors could expand to better serve the larger New North region.
FIGURE 21. INDUSTRY CONCENTRATION (LQ), 2016 BROWN COUNTY AND COMPARISON GEOGRAPHIES
Source: EMSI 2016.3 – QCEW Employees, Non-QCEW Employees, and Self-Employed Notes: *Note: Education includes all public schools, colleges, & universities, and healthcare includes all public hospitals. Excludes military and unclassified employment. LQs greater than 1.25 are presumed to show competitive advantage and are highlighted.
NAICS Code & DescriptionBrown County US
55 Corporate & regional offices 2.47 2.22 1.33 1.48 1.0031-33 Manufacturing 1.99 2.06 2.65 1.93 1.00
52 Finance & insurance 1.63 1.51 1.09 1.06 1.0048-49 Transportation & warehousing 1.32 1.29 0.99 1.04 1.00
42 Wholesale trade 1.24 1.14 0.93 1.04 1.0071 Arts, entertainment, & recreation 1.15 1.10 0.81 0.82 1.00
9039 Local govt. 1.13 1.23 1.22 1.16 1.0062 Healthcare & social assistance* 0.97 0.95 0.87 1.00 1.0023 Construction 0.90 0.92 1.00 0.88 1.0011 Agriculture & forestry 0.89 2.14 2.21 1.49 1.00
44-45 Retail trade 0.88 0.87 0.97 0.98 1.0072 Lodging, restaurants, & bars 0.86 0.85 0.88 0.90 1.0022 Utilities 0.83 1.05 0.90 0.97 1.0061 Education* 0.80 0.80 0.79 0.90 1.0081 Personal & other services 0.77 0.77 0.94 0.97 1.0056 Administrative & support services 0.68 0.64 0.68 0.79 1.0054 Professional services 0.66 0.62 0.45 0.60 1.0053 Property sales & leasing 0.64 0.60 0.52 0.62 1.0051 Information 0.62 0.56 0.59 0.86 1.00
9029 State govt. 0.41 0.37 0.45 0.75 1.009011 Federal govt. (civilian) 0.39 0.39 0.30 0.52 1.0021 Mining (incl. oil & gas) 0.09 0.11 0.25 0.27 1.00
Green Bay MSA New North Wisconsin
LOCATION QUOTIENT (LQ) ANALYSIS is a statistical technique used to suggest areas of relative advantage based on a region’s employment base. LQs are calculated as an industry’s share of total local employment divided by the same industry’s share of employment at the national level. If the local industry and national industry are perfectly proportional, the LQ will be 1.00. LQs greater than 1.25 are presumed to indicate a comparative advantage; those below 0.75 suggest areas of weakness but may also point to opportunities for expansion or attraction.

GREATER GREEN BAY CHAMBER
GREATER GREEN BAY STRATEGIC PLAN PAGE | 44
Health care has been the leading job creator in Brown County from 2010 to 2016, accounting for more than 2,600 net new jobs. Manufacturing, construction, and transportation & warehousing have each added more than 1,000 new jobs since 2010. Sectors with significant job declines (greater than 500 jobs) between 2010 and 2016 include personal services and administrative services.
FIGURE 22. NET JOB CHANGE IN BROWN COUNTY BY INDUSTRY, 2010-2016
Source: EMSI 2016.3 – QCEW Employees, Non-QCEW Employees, and Self-Employed Notes: *Note: Education includes all public schools, colleges, & universities, i.e., these jobs are not included with local or state government.
2,623
1,536
1,047
1,010
905
848
678
612
584
330
326
299
110
56
56
39
0
-23
-123
-156
-590
-702
Healthcare*
Manufacturing
Construction
Transportation & warehousing
Wholesale trade
Arts & entertainment
Professional services
Corporate & regional HQs
Retail trade
Education*
Property sales & leasing
Local government
Utilities
Agriculture
Federal government (civilian)
State government
Restaurants, bars, & hotels
Oil, gas, & mining
Information & media
Finance & insurance
Personal & other services
Administrative services

GREATER GREEN BAY CHAMBER
GREATER GREEN BAY STRATEGIC PLAN PAGE | 45
The table on this page highlights the top 30 industries (at the 4-digit NAICS level) ranked by LQ in Brown County. This more detailed analysis of industries illustrates some of Greater Green Bay’s unique economic strengths. The paper industry figures prominently in the local economy: pulp, paper, and paperboard mills (33.84 LQ); converted paper product manufacturing (9.46 LQ); and printing and related support services (5.54 LQ). Food products are also a major strength: dairy product manufacturing (8.45 LQ); animal slaughtering and processing (5.70 LQ); fruit & vegetable preserving & specialty food manufacturing (4.05 LQ); animal production and aquaculture (2.88 LQ); and bakeries and tortilla manufacturing (2.62 LQ). And the Green Bay Packers’ influence on the local economy is illustrated through spectator sports (4.58 LQ), promoters of performing arts, sports, & similar events (4.00 LQ), and radio and television broadcasting (2.37 LQ).
FIGURE 23. TOP 30 INDUSTRIES IN BROWN COUNTY RANKED BY LQ, 2016
Source: EMSI, 2016.3 – QCEW Employees, Non-QCEW Employees, and Self-Employed Notes: *Directional trend of EMSI employment projections through 2020. **Earnings per worker (EPW) = Total annual earnings of a regional industry (wages, salaries, profits, benefits, and other compensation) divided by the number of jobs in the industry. It is intended to provide an indication of the industry’s impact and is not equivalent to wages paid to individual workers.
Jobs2010
Jobs2016
Net Chg., 2010-16
Projected Chg.* EPW**
LQ 2016
3221 Pulp, Paper, and Paperboard Mills 4,119 3,499 -620 $88,265 33.843332 Industrial Machinery Manufacturing 1,323 1,354 +31 $80,166 11.513222 Converted Paper Product Manufacturing 2,456 2,647 +192 $68,284 9.463115 Dairy Product Manufacturing 1,211 1,207 -5 $79,597 8.453371 Household & Institutional Furniture & Kitchen Cabinet Mfg. 1,404 1,702 +298 $53,376 6.203116 Animal Slaughtering and Processing 3,028 2,891 -137 $48,465 5.703231 Printing and Related Support Activities 2,372 2,657 +286 $57,937 5.547112 Spectator Sports 506 918 +412 $262,771 4.583114 Fruit & Vegetable Preserving & Specialty Food Mfg. 545 729 +183 $65,167 4.057113 Promoters of Performing Arts, Sports, & Similar Events 466 628 +162 $20,834 4.005241 Insurance Carriers 4,562 4,617 +55 $70,352 3.643325 Hardware Manufacturing 26 83 +56 $36,929 3.393132 Fabric Mills 180 189 +8 $63,317 3.334237 Hardware, Plumbing & Heat. Equip. Wholesalers 555 858 +303 $67,067 3.324841 General Freight Trucking 3,205 3,859 +654 $57,183 3.123328 Coating, Engraving, Heat Treating, & Allied Activities 412 435 +23 $52,431 3.091120 Animal Production and Aquaculture 1,329 1,271 -57 $33,347 2.887224 Drinking Places (Alcoholic Beverages) 1,108 1,081 -27 $14,082 2.694854 School and Employee Bus Transportation 421 534 +113 $24,896 2.663118 Bakeries and Tortilla Manufacturing 825 866 +40 $44,969 2.62
5172 Wireless Telecommunications Carriers (except Satellite) 328 358 +29 $66,348 2.59
4233 Lumber & Other Construction Materials Wholesalers 687 559 -128 $63,735 2.51
3336 Engine, Turbine, and Power Transmission Equip. Mfg. 249 256 +7 $83,429 2.51
3274 Lime and Gypsum Product Manufacturing 15 38 +23 $75,269 2.49
3329 Other Fabricated Metal Product Manufacturing 469 691 +222 $61,360 2.47
5511 Management of Companies and Enterprises 5,154 5,766 +612 $105,098 2.47
5151 Radio and Television Broadcasting 592 562 -30 $72,063 2.37
3323 Architectural and Structural Metals Manufacturing 487 854 +368 $60,849 2.26
5242 Agencies, Brokerages, & Other Insurance Rel. Activities 3,012 2,942 -70 $69,208 2.18
4238 Machinery, Equip., & Supplies Merchant Wholesalers 1,249 1,547 +298 $77,973 2.18
NAICS Code & Description

GREATER GREEN BAY CHAMBER
GREATER GREEN BAY STRATEGIC PLAN PAGE | 46
The table on this page shows the top 30 industries (at the 4-digit NAICS level) ranked by net job change in Brown County from 2010 to 2016. The top 30 job-creating sectors in Brown County are spread across a wide range of industries and include a mix of low-wage, mid-wage, and high-wage sectors. Four of the top 10 sectors are in health care and education: general medical and surgical hospitals (1,021 new jobs); colleges, universities, and professional schools (536 new jobs); offices of other health practitioners (426 new jobs); and offices of physicians (365 new jobs). Thanks to the Green Bay Packers, the spectator sports industry was one of the top job creators in the county, with 412 net new jobs and average earnings per worker of nearly $263,000. The top manufacturing sectors ranked by net new jobs include architectural and structural metals (368 new jobs); household & institutional furniture & kitchen cabinets (298 new jobs); printing and related support services (286 new jobs); other fabricated metal products (222 new jobs); converted paper products (192 new jobs); fruit & vegetable preserving & specialty foods (183 new jobs); and commercial & service industry machinery (129 new jobs).
FIGURE 24. TOP 30 INDUSTRIES IN BROWN COUNTY RANKED BY NET JOB GROWTH, 2016
EMSI, 2016.3 – QCEW Employees, Non-QCEW Employees, and Self-Employed Notes: *Directional trend of EMSI employment projections through 2020. **Earnings per worker (EPW) = Total annual earnings of a regional industry (wages, salaries, profits, benefits, and other compensation) divided by the number of jobs in the industry. It is intended to provide an indication of the industry’s impact and is not equivalent to wages paid to individual workers.
Jobs2010
Jobs2016
Net Chg., 2010-16
Projected Chg.* EPW**
LQ 2016
6221 General Medical and Surgical Hospitals 6,425 7,446 +1,021 $78,745 1.544841 General Freight Trucking 3,205 3,859 +654 $57,183 3.125511 Management of Companies and Enterprises 5,154 5,766 +612 $105,098 2.476113 Colleges, Universities, and Professional Schools 1,600 2,136 +536 $33,219 1.066213 Offices of Other Health Practitioners 597 1,024 +426 $33,780 1.017112 Spectator Sports 506 918 +412 $262,771 4.582382 Building Equipment Contractors 1,981 2,365 +384 $71,934 1.003323 Architectural and Structural Metals Manufacturing 487 854 +368 $60,849 2.266211 Offices of Physicians 2,556 2,921 +365 $134,869 1.064237 Hardware, Plumbing & Heat. Equip. Wholesalers 555 858 +303 $67,067 3.327139 Other Amusement and Recreation Industries 1,014 1,315 +302 $18,770 0.939039 Local Government, Excluding Education and Hospitals 6,267 6,566 +299 $60,805 1.134238 Machinery, Equip., & Supplies Merchant Wholesalers 1,249 1,547 +298 $77,973 2.183371 Household & Institutional Furniture & Kitchen Cabinet Mfg. 1,404 1,702 +298 $53,376 6.203231 Printing and Related Support Activities 2,372 2,657 +286 $57,937 5.545413 Architectural, Engineering, and Related Services 1,241 1,476 +236 $82,200 0.936233 Continuing Care Retirement Communities & Assisted Living 873 1,107 +235 $28,207 1.193329 Other Fabricated Metal Product Manufacturing 469 691 +222 $61,360 2.474533 Used Merchandise Stores 118 337 +218 $20,638 1.463222 Converted Paper Product Manufacturing 2,456 2,647 +192 $68,284 9.46
3114 Fruit & Vegetable Preserving & Specialty Food Mfg. 545 729 +183 $65,167 4.05
2371 Utility System Construction 326 509 +183 $80,694 0.97
7113 Promoters of Performing Arts, Sports, and Similar Events 466 628 +162 $20,834 4.00
4411 Automobile Dealers 1,100 1,261 +161 $57,123 0.91
4231 Motor Vehicle & Related Parts/Supplies Wholesalers 414 572 +158 $55,945 1.60
4244 Grocery and Related Product Merchant Wholesalers 1,159 1,300 +142 $48,386 1.62
4441 Building Material and Supplies Dealers 1,072 1,203 +131 $36,595 1.01
4234 Professional & Commercial Equip. & Supplies Wholesalers 614 745 +131 $83,688 1.14
4842 Specialized Freight Trucking 799 928 +130 $60,805 1.91
3333 Commercial and Service Industry Machinery Mfg. 27 155 +129 $79,663 1.73
NAICS Code & Description

GREATER GREEN BAY CHAMBER
GREATER GREEN BAY STRATEGIC PLAN PAGE | 47
WORKFORCE & OCCUPATIONAL ANALYSIS
The age structure of residents in Brown County and the Green Bay metro area generally reflects national demographics, with similar levels of youth (0 to 19), young adults (20 to 34), and experienced working age (35 to 64). However, Brown County’s 13 percent share of seniors (65+) is slightly below the US share of 15 percent.
FIGURE 25. AGE STRUCTURE, 2016 SHARE OF POPULATION BY SELECTED AGE GROUPS
Source: ESRI Community Analyst
Brown County’s educational attainment levels are nearly identical to Wisconsin as a whole. County residents possessing a bachelor’s degree or higher account for 27.5 percent of the population, less than the US (29.3 percent), but higher than the Green Bay metro area (25 percent) and substantially higher than the New North region (23 percent).
FIGURE 26. EDUCATIONAL ATTAINMENT, 2014 HIGHEST LEVEL OF EDUCATIONAL ATTAINMENT, POPULATION AGE 25+
Source: 2010-2014 American Community Survey 5-Year Estimates
26%
25%
24%
26%
26%
21%
20%
19%
20%
21%
39%
40%
41%
40%
39%
15%
16%
16%
14%
13%
0% 20% 40% 60% 80% 100%
US
Wisconsin
New North
Green BayMSA
Brown County
Youth (0 to 19) Young adults (20 to 34) Experienced working age (35 to 64) Seniors (65+)
13.7%
9.2%
9.0%
9.4%
9.4%
28.0%
32.4%
36.9%
34.3%
31.8%
29.1%
31.0%
31.1%
31.3%
31.4%
29.3%
27.4%
23.0%
25.0%
27.5%
0% 20% 40% 60% 80% 100%
US
Wisconsin
New North
Green BayMSA
Brown County
Less than High School HS Diploma/GED Some College (incl. Associate's) Bachelor's or Above

GREATER GREEN BAY CHAMBER
GREATER GREEN BAY STRATEGIC PLAN PAGE | 48
The earlier Industry Analysis section focused on the distribution of jobs by sector according to NAICS codes. This section uses the Standard Occupational Classification (SOC) system to look at the structure of employment by occupation. The top three occupational groups in Brown County—office & administrative support, sales, and production—account for more than 36 percent of total employment. The most notable difference between Greater Green Bay and the US is the larger share of production jobs, which account for roughly 10 percent of all jobs in Brown County, the Green Bay metro area, and Wisconsin, compared with only 6 percent of total employment in the US. This reflects the importance of manufacturing to the regional and state economies. In the New North region, production jobs represent an even greater share of total employment, 13.2 percent.
FIGURE 27. DISTRIBUTION OF EMPLOYMENT BY OCCUPATION, 2016 SHARE OF TOTAL EMPLOYMENT BY MAJOR OCCUPATIONAL GROUP
EMSI 2016.3 – QCEW Employees, Non-QCEW Employees, and Self-Employed
SOC Code & Description
43 Office & Administrative Support 16.1% 15.5% 14.1% 14.5% 15.3%
41 Sales & Related 10.4% 10.1% 9.6% 9.5% 10.3%
51 Production 9.9% 10.2% 13.2% 10.3% 6.1%
35 Food Preparation & Serving Related 8.0% 7.9% 8.0% 7.8% 8.4%
53 Transportation & Material Moving 7.7% 7.6% 7.2% 7.2% 6.6%
29 Healthcare Practitioners & Technical 5.4% 5.2% 4.6% 5.3% 5.5%
11 Management 5.0% 5.7% 5.7% 5.6% 5.5%
13 Business & Financial Operations 5.0% 4.7% 4.1% 4.5% 5.0%
25 Education, Training, & Library 4.9% 5.0% 5.1% 5.6% 5.8%
39 Personal Care & Service 4.6% 4.7% 4.3% 5.0% 4.1%
47 Construction & Extraction 3.9% 4.0% 4.5% 4.0% 4.5%
49 Installation, Maintenance, & Repair 3.8% 3.8% 4.0% 3.7% 3.9%
37 Building/Grounds Cleaning & Maint. 2.8% 2.8% 3.0% 3.3% 3.8%
15 Computer & Mathematical 2.7% 2.5% 1.7% 2.4% 2.8%
31 Healthcare Support 2.1% 2.1% 2.3% 2.5% 2.8%
33 Protective Service 2.0% 2.0% 1.9% 1.8% 2.3%
27 Arts, Design, Entertainment, & Media 1.6% 1.5% 1.3% 1.6% 1.8%
17 Architecture & Engineering 1.5% 1.5% 1.8% 1.7% 1.7%
21 Community & Social Service 1.3% 1.3% 1.6% 1.6% 1.6%
19 Life, Physical, & Social Science 0.6% 0.6% 0.6% 0.7% 0.8%
45 Farming, Fishing, & Forestry 0.5% 1.1% 1.1% 0.8% 0.8%
23 Legal 0.3% 0.3% 0.3% 0.5% 0.8%
Brown County
Green Bay MSA New North Wisconsin US

GREATER GREEN BAY CHAMBER
GREATER GREEN BAY STRATEGIC PLAN PAGE | 49
Occupational concentrations in the region tend to align with industry specializations. Again, given the regional and statewide strengths in manufacturing, the most notable concentration of jobs across all geographies, relative to the US, is production occupations. Each of the four geographies has an LQ well above 1.50 for production occupations. Brown County’s occupational concentration within several high-wage, high-skill occupational categories is comparable to the US as a whole, including business & finance (0.99 LQ), computer & math (0.97 LQ), management (0.91 LQ), and architecture & engineering (0.89 LQ). The least concentrated occupation locally and statewide is legal workers, with an LQ of 0.38 in Brown County and 0.64 in Wisconsin.
FIGURE 28. CONCENTRATION OF EMPLOYMENT BY OCCUPATION, 2016 LOCATION QUOTIENT (LQ) ANALYSIS BY MAJOR OCCUPATIONAL GROUP, US=1.00
EMSI 2016.3 – QCEW Employees, Non-QCEW Employees, and Self-Employed
SOC Code & Description
51 Production 1.63 1.67 2.18 1.69 1.00
53 Transportation & Material Moving 1.16 1.15 1.10 1.08 1.00
39 Personal Care & Service 1.12 1.15 1.06 1.23 1.00
43 Office & Administrative Support 1.05 1.01 0.92 0.95 1.00
41 Sales & Related 1.02 0.98 0.93 0.93 1.00
29 Healthcare Practitioners & Technical 0.99 0.95 0.85 0.98 1.00
49 Installation, Maintenance, & Repair 0.99 0.99 1.03 0.96 1.00
13 Business & Financial Operations 0.99 0.94 0.81 0.89 1.00
15 Computer & Mathematical 0.97 0.89 0.62 0.87 1.00
35 Food Preparation & Serving Related 0.95 0.95 0.96 0.94 1.00
11 Management 0.91 1.03 1.04 1.01 1.00
27 Arts, Design, Entertainment, & Media 0.89 0.86 0.75 0.87 1.00
17 Architecture & Engineering 0.89 0.89 1.08 1.03 1.00
33 Protective Service 0.87 0.89 0.83 0.81 1.00
47 Construction & Extraction 0.86 0.89 0.99 0.89 1.00
25 Education, Training, & Library 0.84 0.86 0.87 0.97 1.00
21 Community & Social Service 0.79 0.79 0.95 0.99 1.00
31 Healthcare Support 0.77 0.76 0.83 0.90 1.00
37 Building/Grounds Cleaning & Maint. 0.73 0.73 0.78 0.86 1.00
19 Life, Physical, & Social Science 0.69 0.70 0.73 0.83 1.00
45 Farming, Fishing, & Forestry 0.67 1.38 1.44 1.04 1.00
23 Legal 0.38 0.36 0.39 0.64 1.00
Brown County
Green Bay MSA New North Wisconsin US

GREATER GREEN BAY CHAMBER
GREATER GREEN BAY STRATEGIC PLAN PAGE | 50
Most of the highest paying occupational groups pay significantly lower wages in Brown County than the US, including life, physical, & social science; business & finance; architecture & engineering; computer & math; legal; and management. Occupations that pay slightly higher median wages in Brown County compared to the US include health care support; farming, fishing, & forestry; transportation & materials moving; production; installation, maintenance, & repair; and construction & extraction.
FIGURE 29. BROWN COUNTY MEDIAN HOURLY WAGE RATES BY OCCUPATION, 2016 BROWN COUNTY WAGES PRESENTED IN THE CONTEXT OF US WAGE RANGE
Line = US wage range from 10th to 90th percentile; Markers = median hourly wage rates for US (x) and Brown County (dot)
EMSI 2016.3 – QCEW Employees, Non-QCEW Employees, and Self-Employed
$0.00
$10.00
$20.00
$30.00
$40.00
$50.00
$60.00
$70.00
$80.00
$90.00
Food
Pre
para
tion
& S
ervi
ng R
elat
ed
Pers
onal
Car
e &
Ser
vice
Build
ing/
Gro
unds
Cle
anin
g &
Mai
nt.
Hea
lthca
re S
uppo
rt
Farm
ing,
Fis
hing
, & F
ores
try
Sale
s &
Rel
ated
Tran
spor
tatio
n &
Mat
eria
l Mov
ing
Offi
ce &
Adm
inis
trativ
e Su
ppor
t
Arts
, Des
ign,
Ent
erta
inm
ent,
& M
edia
Prod
uctio
n
Prot
ectiv
e Se
rvic
e
Com
mun
ity &
Soc
ial S
ervi
ce
Insta
llatio
n, M
aint
enan
ce, &
Rep
air
Con
struc
tion
& E
xtra
ctio
n
Educ
atio
n, T
rain
ing,
& L
ibra
ry
Life,
Phy
sica
l, &
Soc
ial S
cien
ce
Busi
ness
& F
inan
cial
Ope
ratio
ns
Arc
hite
ctur
e &
Eng
inee
ring
Com
pute
r & M
athe
mat
ical
Lega
l
Hea
lthca
re P
ract
ition
ers
& T
echn
ical
Man
agem
ent
US Median Brown County Median

GREATER GREEN BAY CHAMBER
GREATER GREEN BAY STRATEGIC PLAN PAGE | 51
HIGHER EDUCATION TRENDS The University of Wisconsin-Green Bay has grown its enrollment by more than 20 percent from 2005 to 2015, a higher growth rate than all of the UW system campuses besides Platteville and Oshkosh. However, UW-Green Bay remains one of the smallest campuses in the state, with the 11th largest student population out of 14 UW campuses.
FIGURE 30. UNIVERSITY OF WISCONSIN SYSTEM ENROLLMENT & ACADEMIC R&D FALL ENROLLMENT AT UW CAMPUSES, 2005-2015; ACADEMIC R&D SPENDING, 2014
Sources: National Center for Education Statistics, National Science Foundation
UW-Green Bay has experienced the greatest percentage decline in academic R&D spending since 2004 among Wisconsin higher education institutions, decreasing from $1,615,000 in 2004 to $1,171,000 in 2014.
FIGURE 31. ACADEMIC R&D SPENDING TRENDS IN WISCONSIN, 2004-2014 PERCENT CHANGE IN ACADEMIC R&D SPENDING AT WISCONSIN HIGHER EDUCATION INSTITUTIONS
Source: National Science Foundation
University 2005 2015 Net Chg. % Chg.UW-Platteville 6,493 8,945 +2,452 37.8% $1,000,000UW-Oshkosh 11,433 14,051 +2,618 22.9% $2,196,000UW-Green Bay 5,628 6,784 +1,156 20.5% $1,171,000UW-Stout 8,227 9,554 +1,327 16.1% $0UW-Whitewater 10,750 12,360 +1,610 15.0% $0UW-La Crosse 9,397 10,490 +1,093 11.6% $3,424,000UW Colleges 12,374 13,454 +1,080 8.7% $0UW-Stevens Point 8,747 9,265 +518 5.9% $4,450,000UW-Madison 40,793 42,716 +1,923 4.7% $1,108,564,000UW-Eau Claire 10,688 10,592 -96 -0.9% $915,000UW-River Falls 6,118 5,949 -169 -2.8% $0UW-Milwaukeee 27,502 26,726 -776 -2.8% $60,752,000UW-Parkside 4,923 4,412 -511 -10.4% $0UW-Superior 2,872 2,497 -375 -13.1% $1,000,000
2005 to 2015 2014 Academic R&D Spending ($1,000s)
Fall Enrollment
-27.5%
-26.5%
-13.3%
-2.4%
26.6%
37.8%
39.1%
41.4%
67.8%
122.6%
123.2%
123.7%
U. Wisconsin-Green Bay
U. Wisconsin-Eau Claire
U. Wisconsin-Superior
U. Wisconsin-La Crosse
U. Wisconsin-Madison
U. Wisconsin-Oshkosh
Medical C. Wisconsin
U. Wisconsin-Milwaukee
Milwaukee School of Engineering
Marquette U.
U. Wisconsin-Stevens Point
U. Wisconsin-Platteville

GREATER GREEN BAY CHAMBER
GREATER GREEN BAY STRATEGIC PLAN PAGE | 52
DOWNTOWN GROWTH TRENDS The map below illustrates three levels of concentric rings around downtown Green Bay. The table below the map highlights the population growth trends in these three zones compared to the entire metro area.
FIGURE 32. 1-MILE, 2-MILE, & 4-MILE RADIUS AROUND DOWNTOWN GREEN BAY 1-MILE RING = CENTRAL BUSINESS DISTRICT (CBD); CBD 2-MILE RING; CBD-4-MILE RING
Source: ESRI Community Analyst
Downtown Green Bay and surrounding areas lost population from 2000 to 2010. However, this trend has reversed, with residential growth in the downtown area from 2010 to 2016, albeit at a slower pace than the metro area.
FIGURE 33. DOWNTOWN POPULATION GROWTH TRENDS, 2000-2016 POPULATION CHANGE IN CBD 1-MILE, CBD 2-MILE, AND CBD-4 MILE RINGS VS. GREEN BAY METRO AREA
Source: ESRI Community Analyst
Geography 2000 2010 2016 Net Chg. Annual Chg. Net Chg. Annual Chg.CBD 1-Mile 14,906 13,552 13,589 -1,354 -0.9% +37 0.0%CBD 2-Mile 46,269 44,182 44,752 -2,087 -0.5% +570 0.2%CBD 4-Mile 115,651 113,013 114,855 -2,638 -0.2% +1,842 0.3%Green Bay MSA 282,599 306,241 318,291 +23,642 0.8% +12,050 0.7%
Population 2000 to 2010 2010 to 2016

GREATER GREEN BAY CHAMBER
GREATER GREEN BAY STRATEGIC PLAN PAGE | 53
APPENDIX B: BENCHMARKING ASSESSMENT In addition to the economic and demographic comparisons of Brown County, the three-county Green Bay metro area, the 18-county New North region, the State of Wisconsin and the US, it is also important to understand how Greater Green Bay compares with other communities. This section provides insights on how the Green Bay economy is performing vis-à-vis its nearby competitors in Wisconsin and Minnesota, along with a handful of aspirational peer communities across the Midwest and Eastern US.
For the purposes of this benchmarking assessment, the benchmark metro areas include a mix of regional competitor markets and aspirational metro areas. The competitors—Appleton, Chicago, Madison, Milwaukee, and Minneapolis-St. Paul—are places that Greater Green Bay battles on a continual basis for new businesses, investments, and talent. The aspirational benchmarks—Asheville, Des Moines, Fargo, Grand Rapids, and Nashville—are successful economies in the Midwest and Eastern US. They are not so much “competitors” of Green Bay as they are examples of similarly situated regions that can yield a combination of case studies and inspiration for Greater Green Bay’s leadership.
FIGURE 34. GREEN BAY & BENCHMARK METRO AREAS (5 COMPETITORS & 5 ASPIRATIONAL PEERS)
BENCHMARK METRO AREA
METRO POP. (2015)
CENTRAL COUNTY
COUNTY POP. (2015) CENTRAL CITY
CITY POP. (2015)
Appleton, WI 233,007 Outagamie 183,245 Appleton 74,139
Chicago, IL-IN-WI 9,551,031 Cook 5,238,216 Chicago 2,720,546
Madison, WI 641,385 Dane 523,643 Madison 248,951
Milwaukee, WI 1,575,747 Milwaukee 957,735 Milwaukee 600,155
Minneapolis-St. Paul, MN-WI 3,524,583 Hennepin 1,223,149 Minneapolis 410,939
REGIONAL COMPETITORS ↑
Green Bay, WI 316,519 Brown 258,718 Green Bay 105,207
ASPIRATIONAL BENCHMARKS ↓
Asheville, NC 446,840 Buncombe 253,178 Asheville 88,512
Des Moines, IA 622,899 Polk 467,711 Des Moines 210,330
Fargo, ND-MN 233,836 Cass 171,512 Fargo 118,523
Grand Rapids, MI 1,038,583 Kent 636,369 Grand Rapids 195,097
Nashville, TN 1,830,345 Davidson 678,889 Nashville 654,610

GREATER GREEN BAY CHAMBER
GREATER GREEN BAY STRATEGIC PLAN PAGE | 54
Green Bay’s population has grown by 3.4 percent from 2010 to 2015, less than the 4.1 percent US growth rate, and below 7 of the 10 benchmark metro areas. The metro area’s median age of 37.4 is slightly younger than the US median age of 38.
FIGURE 35. POPULATION GROWTH & MEDIAN AGE
Sources: US Census Bureau, Population Estimates Program. ESRI Community Analyst.
The labor force in Greater Green Bay grew by just over 1,000 from 2010 to 2015, an increase of only 0.6 percent and a slower growth rate than all of the benchmark geographies except Chicago. The labor force growth rates in Grand Rapids, Fargo, and Nashville were more than 10 times higher than Green Bay’s rate. Nonetheless, Green Bay’s latest unemployment rate (August 2016) of 3.7 percent is well below the national rate of five percent.
FIGURE 36. LABOR FORCE GROWTH & UNEMPLOYMENT & LABOR FORCE PARTICIPATION RATES
Source: US Bureau of Labor Statistics
Geography 2010 2015 Net Chg. % Chg.Fargo 208,777 233,836 +25,059 +12.0% 32.9Nashville 1,670,890 1,830,345 +159,455 +9.5% 37Des Moines 569,633 622,899 +53,266 +9.4% 36.1Madison 605,435 641,385 +35,950 +5.9% 36.7Minneapolis-St. Paul 3,348,859 3,524,583 +175,724 +5.2% 37Asheville 424,858 446,840 +21,982 +5.2% 44Grand Rapids 988,938 1,038,583 +49,645 +5.0% 36.1US 308.7 M 321.4 M +12.7 M +4.1% 38Green Bay 306,241 316,519 +10,278 +3.4% 37.4Appleton 225,666 233,007 +7,341 +3.3% 38.4Milwaukee 1,555,908 1,575,747 +19,839 +1.3% 37.8Chicago 9,461,105 9,551,031 +89,926 +1.0% 36.7
2010 to 2015Median Age
UnemploymentGeography 2010 2015 Net Chg. % Chg. Rate (Aug. 2016)
Grand Rapids 513,987 555,089 +41,102 +8.0% 3.3%Fargo 122,707 130,872 +8,165 +6.7% 2.3%Nashville 878,271 934,339 +56,068 +6.4% 3.9%Des Moines 322,911 339,510 +16,599 +5.1% 3.9%Asheville 209,300 219,077 +9,777 +4.7% 4.1%Madison 360,359 376,680 +16,321 +4.5% 2.8%Minneapolis-St. Paul 1,870,769 1,938,857 +68,088 +3.6% 3.6%US 153.9 M 157.1 M +3.2 M +2.1% 5.0%Appleton 127,899 129,447 +1,548 +1.2% 3.5%Milwaukee 817,477 822,946 +5,469 +0.7% 4.7%Green Bay 169,659 170,741 +1,082 +0.6% 3.7%Chicago 4,872,833 4,888,024 +15,191 +0.3% 5.4%
2010 to 2015

GREATER GREEN BAY CHAMBER
GREATER GREEN BAY STRATEGIC PLAN PAGE | 55
The Greater Green Bay economy has added more than 9,000 jobs since 2010. The metro area’s 5.3 percent job growth rate during this period was lower than all of the benchmark geographies, and about half of the 10.2 percent US job growth rate. Green Bay’s average annual earnings per worker are nearly $55,000, higher than four of the 10 benchmarks’ rates, but lower than the US rate of more than $61,000.
FIGURE 37. EMPLOYMENT GROWTH & EARNINGS PER WORKER
Source: EMSI, 2016.3 – QCEW Employees, Non-QCEW Employees, and Self-Employed
New home construction between 2010 and 2015 in Green Bay took place at a higher rate than Minneapolis-St. Paul, Grand Rapids, Milwaukee, and Chicago. Fargo’s new housing construction rate was much higher than the rest of the group during this period, with Des Moines and Nashville coming in second and third place, respectively.
FIGURE 38. HOUSING PERMITS ISSUED PER 1,000 RESIDENTS, 2010-2015
Source: US Dept. of Housing & Urban Development, Building Permits Database
Avg. AnnualGeography 2010 2016 Net Chg. % Chg. Earnings per Worker
Grand Rapids 478,309 579,876 +101,567 +21.2% $52,988Nashville 850,445 1,004,903 +154,458 +18.2% $59,925Fargo 131,885 150,565 +18,680 +14.2% $52,861Asheville 188,033 210,845 +22,812 +12.1% $44,793Des Moines 344,207 383,825 +39,618 +11.5% $61,526Minneapolis-St. Paul 1,857,901 2,052,286 +194,385 +10.5% $66,550Madison 374,430 412,611 +38,181 +10.2% $61,319US 144.2 M 155.9 M +14.7 M +10.2% $61,396Chicago 4,447,161 4,845,764 +398,603 +9.0% $68,807Appleton 121,540 130,792 +9,252 +7.6% $52,207Milwaukee 841,871 890,145 +48,274 +5.7% $60,173Green Bay 174,307 183,608 +9,301 +5.3% $54,616
2010 to 2016
7.1 8.113.4 16.4 19.7 21.3 22.0 24.2
35.439.6
62.6
Chi
cago
Milw
auke
e
Gra
nd R
apid
s
Min
neap
olis
-St.
Paul
Gre
en B
ay
App
leto
n
Ash
evill
e
Mad
ison
Nas
hvill
e
Des
Moi
nes
Farg
o
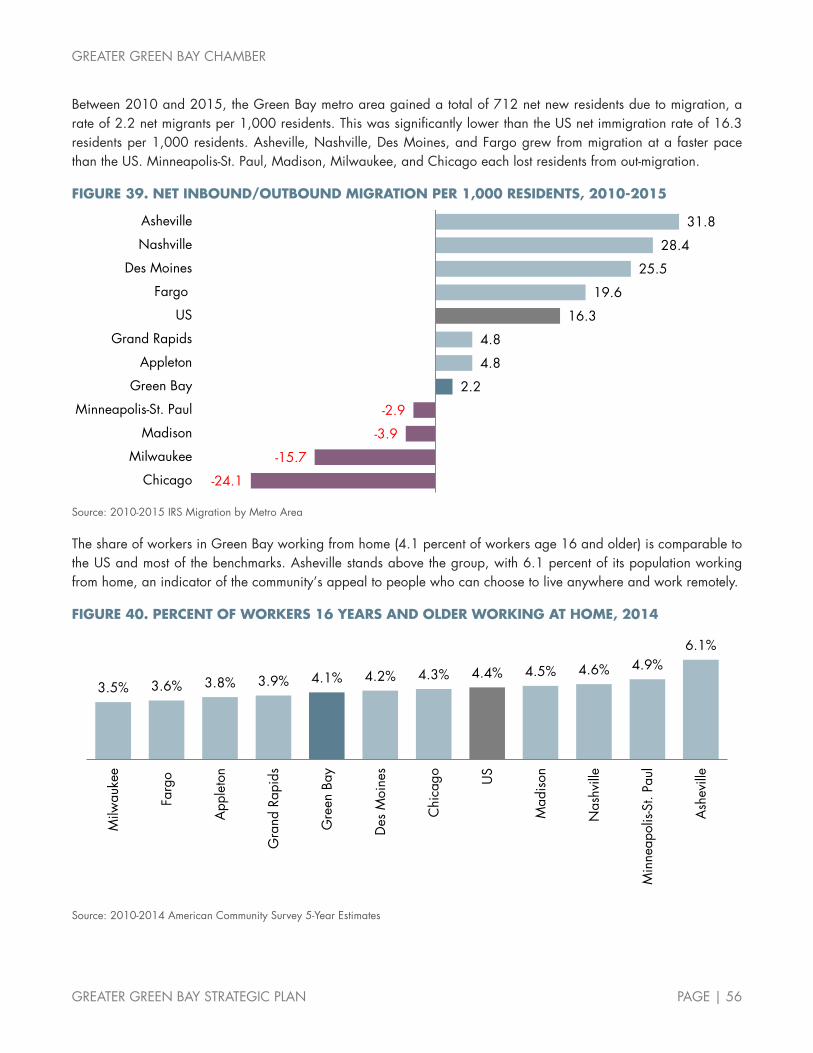
GREATER GREEN BAY CHAMBER
GREATER GREEN BAY STRATEGIC PLAN PAGE | 56
Between 2010 and 2015, the Green Bay metro area gained a total of 712 net new residents due to migration, a rate of 2.2 net migrants per 1,000 residents. This was significantly lower than the US net immigration rate of 16.3 residents per 1,000 residents. Asheville, Nashville, Des Moines, and Fargo grew from migration at a faster pace than the US. Minneapolis-St. Paul, Madison, Milwaukee, and Chicago each lost residents from out-migration.
FIGURE 39. NET INBOUND/OUTBOUND MIGRATION PER 1,000 RESIDENTS, 2010-2015
Source: 2010-2015 IRS Migration by Metro Area
The share of workers in Green Bay working from home (4.1 percent of workers age 16 and older) is comparable to the US and most of the benchmarks. Asheville stands above the group, with 6.1 percent of its population working from home, an indicator of the community’s appeal to people who can choose to live anywhere and work remotely.
FIGURE 40. PERCENT OF WORKERS 16 YEARS AND OLDER WORKING AT HOME, 2014
Source: 2010-2014 American Community Survey 5-Year Estimates
-24.1
-15.7
-3.9
-2.9
2.2
4.8
4.8
16.3
19.6
25.5
28.4
31.8
Chicago
Milwaukee
Madison
Minneapolis-St. Paul
Green Bay
Appleton
Grand Rapids
US
Fargo
Des Moines
Nashville
Asheville
3.5% 3.6% 3.8% 3.9% 4.1% 4.2% 4.3% 4.4% 4.5% 4.6% 4.9%6.1%
Milw
auke
e
Farg
o
App
leto
n
Gra
nd R
apid
s
Gre
en B
ay
Des
Moi
nes
Chi
cago US
Mad
ison
Nas
hvill
e
Min
neap
olis
-St.
Paul
Ash
evill
e

GREATER GREEN BAY CHAMBER
GREATER GREEN BAY STRATEGIC PLAN PAGE | 57
Green Bay has the lowest share of adults with at least a bachelor’s degree (25 percent) among the benchmarks. Madison has the highest level of educational attainment among the group, with 42.5 percent of its residents holding a bachelor’s degree or higher. Minneapolis-St. Paul is a close second with 39 percent.
FIGURE 41. EDUCATIONAL ATTAINMENT, 2014 PERCENT OF POPULATION (AGE 25+) WITH A BACHELOR’S DEGREE OR HIGHER, 2014
Source: 2010-2014 American Community Survey 5-Year Estimates
Green Bay has a relatively low share of residents without a high school diploma, with less than 10 percent of the metro area’s population lacking this basic credential. This compares favorably to the US rate of nearly 14 percent and is significantly better than Chicago, Nashville, and Asheville. Fargo and Madison have the lowest share of residents without a high school diploma.
FIGURE 42. EDUCATIONAL ATTAINMENT PERCENT OF POPULATION (AGE 25+) WITHOUT HIGH SCHOOL DIPLOMA, 2014
Source: 2010-2014 American Community Survey 5-Year Estimates
25.0% 27.1% 29.3% 29.9% 31.1% 31.3% 32.9% 35.1% 35.1% 35.5%39.0% 42.5%
Gre
en B
ay
App
leto
n
US
Gra
nd R
apid
s
Ash
evill
e
Nas
hvill
e
Milw
auke
e
Chi
cago
Des
Moi
nes
Farg
o
Min
neap
olis
-St.
Paul
Mad
ison
5.4% 5.7% 6.9% 7.0% 7.4%9.4% 10.1% 10.2% 11.3% 12.4% 13.1% 13.7%
Farg
o
Mad
ison
Min
neap
olis
-St.
Paul
App
leto
n
Des
Moi
nes
Gre
en B
ay
Milw
auke
e
Gra
nd R
apid
s
Ash
evill
e
Nas
hvill
e
Chi
cago US

GREATER GREEN BAY CHAMBER
GREATER GREEN BAY STRATEGIC PLAN PAGE | 58
Green Bay’s white population accounts for 87 percent of all residents, making the metro area far less diverse than the US as a whole. In addition to Green Bay, six of the 10 the benchmark metro areas have white populations that account for more than 80 percent of all residents. Only Chicago has a higher share of non-whites than the US.
FIGURE 43. RACIAL DIVERSITY WHITE POPULATION AS A PERCENTAGE OF TOTAL, 2016
Source: ESRI Community Analyst
Another indicator of diversity is the share of foreign-born residents. By this measure, Green Bay is more diverse than Appleton is, but is less diverse than the rest of the benchmarks are. Only Chicago has a higher share of foreign-born residents than the US.
FIGURE 44. FOREIGN-BORN POPULATION (AS PERCENT OF TOTAL), 2014
Source: 2010-2014 American Community Survey 5-Year Estimates
64% 71% 72% 76% 79% 83% 85% 86% 87% 88% 90% 90%
Chi
cago US
Milw
auke
e
Nas
hvill
e
Min
neap
olis
-St.
Paul
Gra
nd R
apid
s
Mad
ison
Des
Moi
nes
Gre
en B
ay
Ash
evill
e
App
leto
n
Farg
o3.9% 4.5% 5.2% 5.4% 6.3% 6.8% 6.9% 7.4% 7.5%
9.7%
13.1%
17.6%
App
leto
n
Gre
en B
ay
Farg
o
Ash
evill
e
Gra
nd R
apid
s
Mad
ison
Milw
auke
e
Nas
hvill
e
Des
Moi
nes
Min
neap
olis
-St.
Paul US
Chi
cago

GREATER GREEN BAY CHAMBER
GREATER GREEN BAY STRATEGIC PLAN PAGE | 59
Walk Score is a ranking between 0 and 100 that grades the walkability of cities and neighborhoods across the US using a patented system that analyzes data from a wide range of sources. Green Bay has a Walk Score of 40, higher than Nashville (Walk Score of 28), Asheville (36), and Appleton (39). Not surprisingly, Chicago is the most walkable city among the group, with a Walk Score of 78, followed by Minneapolis (68) and Milwaukee (61).
FIGURE 45. WALK SCORE, CITY
Source: WalkScore.com
Downtown Green Bay is much more walkable than the city as a whole, with a Walk Score of 78. Each of the benchmark cities’ downtowns are significantly more walkable than the cities overall. The top three most walkable downtowns among the group are Milwaukee (95), Grand Rapids (94), and Chicago (94).
FIGURE 46. WALK SCORE, DOWNTOWN
Source: WalkScore.com
2836 39 40 43 44
4855 58 61
68
78
Nas
hvill
e
Ash
evill
e
App
leto
n
Gre
en B
ay
Farg
o
Des
Moi
nes
Mad
ison
Gra
nd R
apid
s
St. P
aul
Milw
auke
e
Min
neap
olis
Chi
cago
75 78 80 83 86 8792 92 92 94 94 95
Des
Moi
nes
Gre
en B
ay
App
leto
n
Nas
hvill
e
Farg
o
Ash
evill
e
Mad
ison
Min
neap
olis
St. P
aul
Chi
cago
Gra
nd R
apid
s
Milw
auke
e

GREATER GREEN BAY CHAMBER
GREATER GREEN BAY STRATEGIC PLAN PAGE | 60
Downtown Green Bay, defined as the one-mile radius extending from the center of the city’s Central Business District (CBD), experienced a 9.1 percent population decline from 2000 to 2010. Only two other benchmark cities—Appleton and Fargo—also lost downtown residents during this period. All of the benchmark cities grew their downtown populations from 2010 to 2016, but Green Bay’s growth rate was the slowest. However, downtown Green Bay represents 4.3 percent of the metro area’s total population, a higher share than most of the benchmarks. Nashville, Des Moines, and Chicago experienced the highest downtown growth rates from 2010 to 2016. Downtown Chicago has gained more residents since 2000 than all the other benchmarks combined.
FIGURE 47. DOWNTOWN POPULATION GROWTH TRENDS, CBD 1-MILE RADIUS
Source: ESRI Community Analyst
The greater downtown area of Green Bay, the zone extending out two miles from the CBD, accounts for 14.1 percent of the metro area’s total population, a higher share than all of the benchmarks except Appleton and Fargo. This CBD two-mile radius zone experienced a loss of residents in about half of the benchmarks between 2000 and 2010, including Green Bay, but grew in each city from 2010 to 2016. The highest downtown population growth rates since 2010 were in Nashville, Chicago, and Des Moines. Downtown Green Bay had the slowest growth.
FIGURE 48. DOWNTOWN POPULATION GROWTH TRENDS, CBD 2-MILE RADIUS
Source: ESRI Community Analyst
Geography 2000 2010 2016 Net Chg. Annual Chg. Net Chg. Annual Chg.Nashville 5,551 7,716 9,407 +2,165 3.9% +1,691 3.7% 0.5%Des Moines 8,517 8,624 10,479 +107 0.1% +1,855 3.6% 1.7%Chicago 22,930 45,151 51,727 +22,221 9.7% +6,576 2.4% 0.5%Minneapolis 25,764 30,723 34,233 +4,959 1.9% +3,510 1.9% 1.0%Fargo 15,363 14,637 16,253 -726 -0.5% +1,616 1.8% 6.8%St. Paul 13,186 15,111 16,446 +1,925 1.5% +1,335 1.5% 0.5%Asheville 9,113 9,293 10,004 +180 0.2% +711 1.3% 2.2%Grand Rapids 15,864 16,057 17,212 +193 0.1% +1,155 1.2% 1.7%Madison 28,797 30,727 32,791 +1,930 0.7% +2,064 1.1% 5.2%Milwaukee 14,046 17,504 18,244 +3,458 2.5% +740 0.7% 1.2%Appleton 16,679 15,664 16,046 -1,015 -0.6% +382 0.4% 6.8%Green Bay 14,906 13,552 13,589 -1,354 -0.9% +37 0.0% 4.3%
Population 2000 to 2010 2010 to 2016 Share of MSA Pop.
Geography 2000 2010 2016 Net Chg. Annual Chg. Net Chg. Annual Chg.Nashville 46,499 48,278 53,301 +1,779 0.4% +5,023 1.7% 2.9%Chicago 117,510 166,407 183,198 +48,897 4.2% +16,791 1.7% 1.9%Des Moines 42,912 41,977 46,154 -935 -0.2% +4,177 1.7% 7.3%Minneapolis 113,857 120,928 131,847 +7,071 0.6% +10,919 1.5% 3.7%Fargo 52,919 52,048 56,511 -871 -0.2% +4,463 1.4% 23.6%Asheville 25,277 27,844 30,213 +2,567 1.0% +2,369 1.4% 6.6%Grand Rapids 76,711 71,707 76,196 -5,004 -0.7% +4,489 1.0% 7.3%Madison 54,716 55,834 59,134 +1,118 0.2% +3,300 1.0% 9.3%St. Paul 77,593 74,433 77,812 -3,160 -0.4% +3,379 0.8% 2.2%Appleton 53,820 52,165 53,549 -1,655 -0.3% +1,384 0.4% 22.7%Milwaukee 74,639 78,062 79,620 +3,423 0.5% +1,558 0.3% 5.1%Green Bay 46,269 44,182 44,752 -2,087 -0.5% +570 0.2% 14.1%
Population 2000 to 2010 2010 to 2016 Share of MSA Pop.

GREATER GREEN BAY CHAMBER
GREATER GREEN BAY STRATEGIC PLAN PAGE | 61
Within the four-mile zone surrounding the CBD, half of the benchmarks lost population from 2000 to 2010, but all of them gained residents from 2010 to 2016. The three fastest growing CBD four-mile zones since 2010 were Fargo, Asheville, and Nashville. The three slowest growing CBD four-mile zones during this period were Appleton, Green Bay, and Milwaukee. Well over one-third of Green Bay’s entire metro area resides within four miles of the CBD, a higher share than all of the benchmarks, except for Fargo and Appleton.
FIGURE 49. DOWNTOWN POPULATION GROWTH TRENDS, CBD 4-MILE RADIUS
Source: ESRI Community Analyst
Green Bay has among the most affordable home prices among the benchmarks, with a Zillow Home Value Index of $154,300 in September 2016 and a median list price of $159,900. Greater Green Bay’s housing market consists of 7.7 percent of homes with “underwater” mortgages, compared to a 12.2 percent negative equity rate nationally.
FIGURE 50. HOME VALUE TRENDS
Source: Zillow
Geography 2000 2010 2016 Net Chg. Annual Chg. Net Chg. Annual Chg.Fargo 116,538 121,250 133,401 +4,712 0.4% +12,151 1.7% 55.8%Asheville 65,498 71,106 77,303 +5,608 0.9% +6,197 1.5% 16.8%Nashville 150,075 148,800 160,567 -1,275 -0.1% +11,767 1.3% 8.7%Minneapolis 314,692 315,799 339,117 +1,107 0.0% +23,318 1.2% 9.6%Des Moines 155,481 154,027 165,011 -1,454 -0.1% +10,984 1.2% 26.0%Chicago 449,791 465,406 494,421 +15,615 0.3% +29,015 1.0% 5.1%Madison 133,022 133,565 140,321 +543 0.0% +6,756 0.8% 22.1%Grand Rapids 196,155 186,824 195,843 -9,331 -0.5% +9,019 0.8% 18.9%St. Paul 250,005 246,574 257,964 -3,431 -0.1% +11,390 0.8% 7.3%Appleton 114,874 119,441 124,198 +4,567 0.4% +4,757 0.7% 52.7%Green Bay 115,651 113,013 114,855 -2,638 -0.2% +1,842 0.3% 36.1%Milwaukee 309,996 306,560 306,711 -3,436 -0.1% +151 0.0% 19.5%
Population 2000 to 2010 2010 to 2016 Share of MSA Pop.
Geography Sep. 2016 1-yr. % chg. Sep. 2016 1-yr. % chg.Grand Rapids $160,200 7.4% $195,000 14.8% 5.0%Asheville $208,400 9.6% $295,000 13.5% 4.5%Des Moines $164,700 3.3% $200,000 11.2% 6.9%Milwaukee $205,900 8.1% $230,000 9.6% 26.1%Madison $220,800 6.9% $249,900 9.1% 5.5%Appleton $131,000 4.3% $162,000 8.0% 7.3%Chicago $202,200 4.7% $248,000 7.9% 22.2%Nashville $201,100 11.0% $290,000 7.4% 7.1%Green Bay $154,300 7.2% $159,900 6.7% 7.7%US $189,400 5.5% $239,900 4.8% 12.2%Fargo $197,500 5.7% $244,900 3.3% 4.3%Minneapolis-St. Paul $230,200 5.9% $264,900 1.9% 9.5%
Median List Price Q2 2016 Negative Equity
Zillow Home Value Index
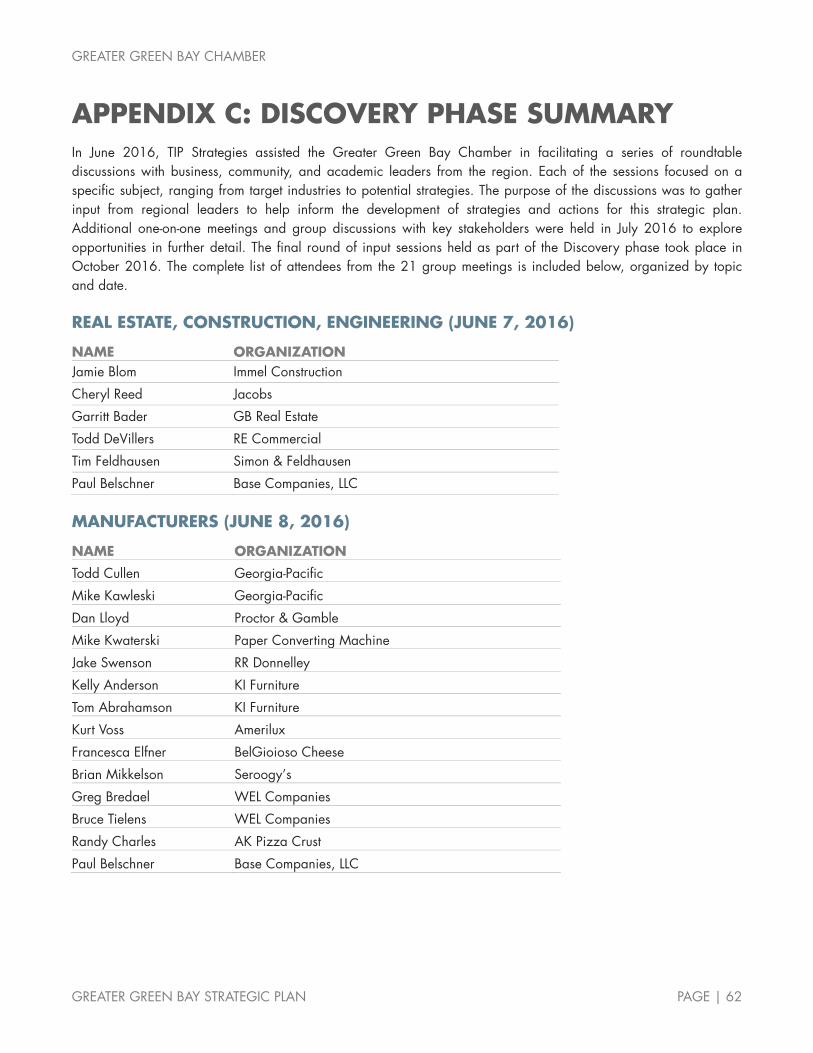
GREATER GREEN BAY CHAMBER
GREATER GREEN BAY STRATEGIC PLAN PAGE | 62
APPENDIX C: DISCOVERY PHASE SUMMARY In June 2016, TIP Strategies assisted the Greater Green Bay Chamber in facilitating a series of roundtable discussions with business, community, and academic leaders from the region. Each of the sessions focused on a specific subject, ranging from target industries to potential strategies. The purpose of the discussions was to gather input from regional leaders to help inform the development of strategies and actions for this strategic plan. Additional one-on-one meetings and group discussions with key stakeholders were held in July 2016 to explore opportunities in further detail. The final round of input sessions held as part of the Discovery phase took place in October 2016. The complete list of attendees from the 21 group meetings is included below, organized by topic and date.
REAL ESTATE, CONSTRUCTION, ENGINEERING (JUNE 7, 2016)
NAME ORGANIZATION Jamie Blom Immel Construction
Cheryl Reed Jacobs
Garritt Bader GB Real Estate
Todd DeVillers RE Commercial
Tim Feldhausen Simon & Feldhausen
Paul Belschner Base Companies, LLC
MANUFACTURERS (JUNE 8, 2016)
NAME ORGANIZATION
Todd Cullen Georgia-Pacific
Mike Kawleski Georgia-Pacific
Dan Lloyd Proctor & Gamble
Mike Kwaterski Paper Converting Machine
Jake Swenson RR Donnelley
Kelly Anderson KI Furniture
Tom Abrahamson KI Furniture
Kurt Voss Amerilux
Francesca Elfner BelGioioso Cheese
Brian Mikkelson Seroogy’s
Greg Bredael WEL Companies
Bruce Tielens WEL Companies
Randy Charles AK Pizza Crust
Paul Belschner Base Companies, LLC

GREATER GREEN BAY CHAMBER
GREATER GREEN BAY STRATEGIC PLAN PAGE | 63
ECONOMIC DEVELOPMENT PARTNERS (JUNE 8, 2016)
NAME ORGANIZATION
Jim Schmitt City of Green Bay Mayor
Larry Delo City of De Pere
Kim Flom City of De Pere
Andrew Vickers Village of Hobart
Angela Gorall Village of Bellevue
Bob Bartelt Town of Lawrence
Kristan Sanchez Village of Ashwaubenon
Mike Aubinger Village of Ashwaubenon
Paul Evert Village of Howard
Reed Woodward Village of Pulaski
Sarah Burdette Town of Ledgeview
Troy Streckenbach Brown County Executive
Cole Runge Brown County Government
Mark Walter Brown County Port & Resource Recovery
Allison Swanson Village of Ashwaubenon
Brad Toll Greater Green Bay Convention and Visitors Bureau
Jerry Murphy New North, Inc.
Jeff Mirkes Downtown Green Bay
Matt Hohner Definitely De Pere
Naletta Burr WEDC
Tony Parr Oneida Nation
Todd Cullen Georgia-Pacific
RECYCLING ECONOMIC DEVELOPMENT PROGRAMS (JUNE 8, 2016)
NAME ORGANIZATION Bill Seleen Habitat for Humanity
Matt Bergeon Golder Associates
Dean Haen Brown County Port & Resource Recovery
John Arendt UW-GB
John Katers UW-GB
Troy Streckenbach Brown County Executive
Chad Weininger Brown County

GREATER GREEN BAY CHAMBER
GREATER GREEN BAY STRATEGIC PLAN PAGE | 64
INCLUSIVE DEVELOPMENT (JUNE 8, 2016)
NAME ORGANIZATION David Pamperin Greater Green Bay Community Foundation Greg Maass Brown County United Way Adam Hardy Achieve Brown County Amanda Kim St. Norbert College Ngosong Fonkem Corneille Law Group Michelle Langenfeld, Ed.D. Green Bay Area Public School District Brittany Zaehringer Brown County Government Robyn Davis Freedom House Dr. Bola Delano-Oriaran St. Norbert College Mohammed Bey NWTC, Diversity & Inclusion Director Anna Steinfest AFF Research Dan Fabry Cellcom
STARTUPS, TECH SECTOR, & HOME-GROWN BUSINESSES (JUNE 8, 2016)
NAME ORGANIZATION Peter Nugent Docking Station Jamie Veeser Machine Plus Mark Moran Shift Visuals Scott Johnson Green Bay Press Gazette Jim Kratowicz Titletown Brewing Company Dave Stauffacher SBDC Chris Schmitz Digital Fertilizer Lennie Shefchik Paper Transport, Inc. Jeff Shefchik Paper Transport, Inc. Drew Leatherberry Forsite Benefits Kevin Edwards SharpLogixx Paul Belschner Base Companies, LLC
YOUNG PROFESSIONALS (JUNE 8, 2016)
NAME ORGANIZATION Drew Leatherberry Forsite Benefits Garritt R. Bader GB Real Estate Ryan Krumrie Hager, Dewick & Zuengler, S.C. Joshua Oliver Humana Nicole Tilot Thrivent Financial Barbara Koldos Somerville Inc. Tyler Welch Student

GREATER GREEN BAY CHAMBER
GREATER GREEN BAY STRATEGIC PLAN PAGE | 65
PROFESSIONAL SERVICES & CORPORATE HEADQUARTERS (JUNE 9, 2016)
NAME ORGANIZATION
George Grossardt Master Fleet, LLC
Carol Karls Wisconsin Public Service
Dan Miller Wipfli LLP
Sara Funk Wipfli LLP
Pat Hopkins Imaginasium Inc.
Mark Higgins Johnson Bank
Steve Pasowicz Johnson Bank
Bruce Zak Chase
Matt Schueller Nature’s Way
Tom Rohen Davis & Kuelthau, S.C.
Al Timmerman Jet Air Group
Jamee Mangold Wells Fargo Bank
Dan Sweeney Wells Fargo Bank
Christine Loose Kohler
Cheryl Reed Jacobs
Paul Belschner Base Companies, LLC
HEALTHCARE (JUNE 9, 2016)
NAME ORGANIZATION Kim Allen Humana
David Bishop United Healthcare
Gwen Christensen Aurora Health Care
Dr. Ashok Rai Prevea Health
Kaitlin Swanson St. Vincent Hospital
Jim Dietsche Bellin Health
WORKFORCE & EDUCATION (JUNE 9, 2016)
NAME ORGANIZATION Ron Pfeifer UW-GB
Tom Hoh Green Bay Area Public Schools
John Benberg Boys & Girls Club of Green Bay
Brian Hanes Ashwaubenon School District
Norbert Hill Oneida Nation
Adam Hardy Achieve Brown County
Todd Cullen Georgia-Pacific

GREATER GREEN BAY CHAMBER
GREATER GREEN BAY STRATEGIC PLAN PAGE | 66
ECONOMIC DEVELOPMENT PARTNERS (JULY 26, 2016)
NAME ORGANIZATION
Dave Wiese Village of Howard
Andrew Vickers Village of Hobart
Bob Bartelt Town of Lawrence
Troy Streckenbach Brown County Executive
Larry Delo City of De Pere
Andrew Vissers Village of Bellevue
Brad Lange Village of Allouez
Troy Parr Oneida Nation
Brad Toll Greater Green Bay Convention & Visitors Bureau
Jeff Mirkes Downtown Green Bay
Barb Lamue WEDC
Tom Miller Green Bay Austin Straubel International Airport
Chuck Lamine Brown County
Jim Schmitt City of Green Bay Mayor
Jerry Murphy New North
Allison Swanson Village of Ashwaubenon
Craig Aderhold Wisconsin Bank & Trust
LEADERSHIP GREEN BAY (JULY 26, 2016)
NAME ORGANIZATION Matt Brault Schreiber Foods
Tanessa Klug Medical College of Wisconsin
Jessica Hopp UW-GB
Steve Krueger Conway, Olejniczak & Jerry, S.C.
Tamy Ashauer PAI
Nicholas Linz Hager, Dewick & Zuengler, S.C.
BETTER BY THE BAY (JULY 26, 2016)
NAME ORGANIZATION Larry Delo City of De Pere
Jim Rivett Khrome
Karen Sinette Elevate97
Jennifer Kalies Performa
Bridget O’Connor O’Connor Connective
Brad Toll Greater Green Bay Convention & Visitors Bureau
Deborah (Deb) Mauthe Prevea Health

GREATER GREEN BAY CHAMBER
GREATER GREEN BAY STRATEGIC PLAN PAGE | 67
GREATER GREEN BAY CHAMBER BOARD OF DIRECTORS (JULY 28, 2016) See Acknowledgements section for list of members.
STRATEGIC PLANNING EXECUTIVE COMMITTEE (JULY 28, 2016) See Acknowledgements section for list of members.
ECONOMIC DEVELOPMENT PARTNERS (OCTOBER 25, 2016)
NAME ORGANIZATION
Angela Gorall Village of Bellevue
Larry Delo Village of De Pere
Kim Flom Village of De Pere
Carol Karls Wisconsin Public Service
Troy Streckenbach Brown County Executive
Chuck Lamine Brown County
Allison Swanson Village of Ashwaubenon
Brad Toll Greater Green Bay Convention & Visitors Bureau
Jeff Mirkes Downtown Green Bay
Marty Piette Green Bay Austin Straubel International Airport
Barb LaMue WEDC
Troy Parr Oneida Nation
Jim Schmitt City of Green Bay Mayor
Paul Evert Village of Howard
Brad Lange Village of Allouez
Dean Haen Brown County Port & Resource Recovery
HIGHER EDUCATION (OCTOBER 25, 2016)
NAME ORGANIZATION
Jeff Rafn, Ph.D. Northeast Wisconsin Technical College
Tom Kunkel St. Norbert College
MANUFACTURING (OCTOBER 26, 2016)
NAME ORGANIZATION
Todd Cullen Georgia-Pacific
Kelly Anderson KI Furniture
Tom Abrahamson KI Furniture
Ann Franz NEW Manufacturing Alliance
Scott Kettler EMT
Francesca Elfner Belgioioso
Randy Charles AK Pizza Crust

GREATER GREEN BAY CHAMBER
GREATER GREEN BAY STRATEGIC PLAN PAGE | 68
INNOVATION & ENTREPRENEURSHIP (OCTOBER 26, 2016)
NAME ORGANIZATION
Tom Hedge Schreiber Foods
Debra Cherney Cherney Microbiological Services
Scott Koffarnus Cineviz
Pat Hopkins Imaginasium Inc.
Ryan Hatch Resultech
Paul Belschner Base Companies, LLC
Dan Miller Wipfli LLP
Elizabeth Slade Greater Green Bay Chamber (Advance)
Tim Feldhausen Davis & Kuelthau, S.C.
ADVANCE BOARD OF DIRECTORS (OCTOBER 27, 2016) See Acknowledgements section for list of members.
STRATEGIC PLANNING EXECUTIVE COMMITTEE (OCTOBER 27, 2016) See Acknowledgements section for list of members.

GREATER GREEN BAY CHAMBER
GREATER GREEN BAY STRATEGIC PLAN PAGE | 69
ONLINE SURVEY SUMMARY To better understand the opportunities and challenges associated with Green Bay’s workforce, an online survey was conducted as part of the strategic planning process. The survey afforded employers the opportunity to share their experience with hiring, retaining, and training workers in the region. The survey was distributed to employers in Brown County. A total of 93 employers participated.
The summary below is intended to provide a snapshot of the responses received. Numeric responses are presented as charts. Figures 59 and 60 utilize “Word Clouds” to summarize open-ended text responses. Word Clouds are visual representations of the most commonly used words and phrases contained in participant responses. The relative size of the words represents their frequency among responses. Open-ended responses were used as submitted by the participants and may contain typos, misspellings, or other errors.
FIGURE 51. INDUSTRY FOCUS Which of the following best describes the primary industry focus of your organization?
16
12
10
9
8
7
3
3
3
3
3
3
2
2
1
1
Public Administration
Education
Manufacturing
Professional Services
Finance/Insurance
Health Care
IT (Hardware and Software)
Management of Companies
Real Estate
Shipping/Storage
Utilities
Other
Construction
Hospitality
Support Services
Wholesale Trade
Number of responses by primary industry

GREATER GREEN BAY CHAMBER
GREATER GREEN BAY STRATEGIC PLAN PAGE | 70
FIGURE 52. NUMBER OF EMPLOYEES How many full-time workers are employed by your business in the Greater Green Bay area?
FIGURE 53. NUMBER OF YEARS IN BUSINESS How long has your organization been located in the Greater Green Bay area?
FIGURE 54. HEADQUARTERS LOCATION Is your organization headquartered in the Greater Green Bay area?
36.5%
17.6%
4.7%
9.4%
16.5%
15.3%
More than 500
101-500
51-100
26-50
11-25
10 or fewer
Share of responding firms by size (number of employees)
80.7%
10.2%
4.5%
1.1%
3.4%
20+ years
10-20 years
5-10 years
2-5 years
0-2 years
Share of responding firms by number of years in Greater Green Bay area
24.7%
75.3%
No
Yes
Share of responding firms

GREATER GREEN BAY CHAMBER
GREATER GREEN BAY STRATEGIC PLAN PAGE | 71
FIGURE 55. WORKFORCE CATEGORIES Approximately what percentage of your workforce is employed in the following categories?
*Skilled Labor (e.g., skilled production, craft workers, machinists, welders)
0% 20% 40% 60% 80% 100%
Unskilled/Laborers
Sales/Marketing
Skilled Labor*
Clerical/Administrative
Management
Professional/Technical
Share of firms reporting employment in the category
None Less than 10% 10 to 24% 24% to 49% 50 to 74% 75% or more
MOST COMMON
LEASTCOMMON
Share occupational category comprises of firm's total employment:
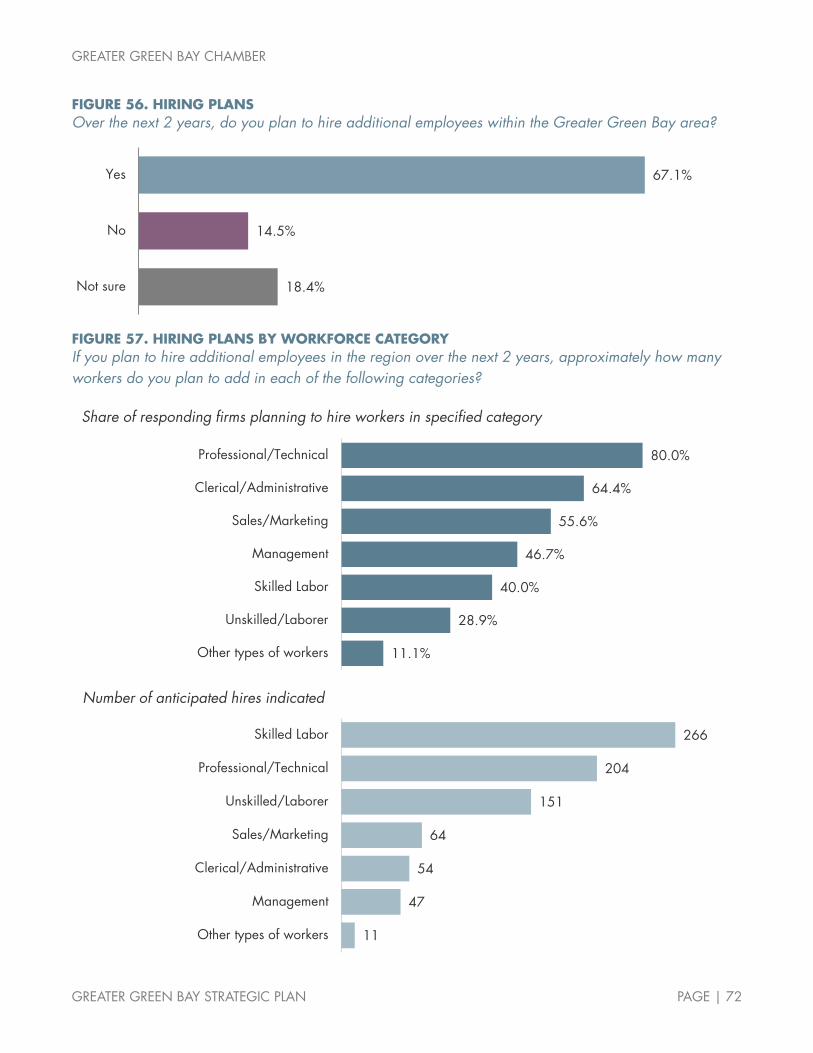
GREATER GREEN BAY CHAMBER
GREATER GREEN BAY STRATEGIC PLAN PAGE | 72
FIGURE 56. HIRING PLANS Over the next 2 years, do you plan to hire additional employees within the Greater Green Bay area?
FIGURE 57. HIRING PLANS BY WORKFORCE CATEGORY If you plan to hire additional employees in the region over the next 2 years, approximately how many workers do you plan to add in each of the following categories?
67.1%
14.5%
18.4%
Yes
No
Not sure
11.1%
28.9%
40.0%
46.7%
55.6%
64.4%
80.0%
Other types of workers
Unskilled/Laborer
Skilled Labor
Management
Sales/Marketing
Clerical/Administrative
Professional/Technical
Share of responding firms planning to hire workers in specified category
11
47
54
64
151
204
266
Other types of workers
Management
Clerical/Administrative
Sales/Marketing
Unskilled/Laborer
Professional/Technical
Skilled Labor
Number of anticipated hires indicated

GREATER GREEN BAY CHAMBER
GREATER GREEN BAY STRATEGIC PLAN PAGE | 73
FIGURE 58. TYPICAL HIRING TIMEFRAME BY WORKFORCE CATEGORY Approximately, how long does it typically take to fill a vacancy for each of the following classifications of workers?
*Skilled Labor (e.g., skilled production, craft workers, machinists, welders)
FIGURE 59. HARD TO FILL POSITIONS Which occupations are difficult to recruit in your industry?
0% 20% 40% 60% 80% 100%
Unskilled/Laborer
Clerical/Administrative
Skilled Labor*
Sales/Marketing
Professional/Technical
Management
Share of firms for which the category was applicable
Less than 2 weeks 2 to 4 weeks 1 to 3 months 4 to 6 months More than 6 months
SHORTESTTIME TO FILL
LONGEST TIME TO FILL

GREATER GREEN BAY CHAMBER
GREATER GREEN BAY STRATEGIC PLAN PAGE | 74
FIGURE 60. HARD TO FILL SKILLS Which skills are difficult to find in your industry? Examples of skills would include the ability to use a particular software program or perform a specific job function.
FIGURE 61. BUSINESS SUCCESS FACTORS: IMPORTANCE Based on your experience, please rate the importance of the following factors to the success of your organization on a scale of 1 to 5.
0% 20% 40% 60% 80% 100%
Cost of real estate
Incentives for new/expanding businesses
Cost of taxes
Cost of utilities
E-ship/small business support system
Presence of suppliers and partners
Regional transportation infrastructure
Cost of labor
Quality of K-12 schools
Quality of local colleges/universities
Skills training/education programs
Access to customers
Quality of life offerings
Ability to attract and retain qualified employees
Not Important Somewhat Important Important Very Important Extremely Important
3.4
2.8
2.9
3.0
3.1
3.1
3.0
3.4
3.9
3.7
3.4
3.3
3.7
3.1
Perception of Green Bay's PERFORMANCE (scale of 1 to 5)

GREATER GREEN BAY CHAMBER
GREATER GREEN BAY STRATEGIC PLAN PAGE | 75
FIGURE 62. BUSINESS SUCCESS FACTORS: GREEN BAY’S PERFORMANCE Please rate Greater Green Bay on each of these items.
0% 20% 40% 60% 80% 100%
Incentives for new/expanding businesses
Cost of taxes
Cost of utilities
Ability to attract and retain qualified employees
E-ship/small business support system
Regional transportation infrastructure
Presence of suppliers and partners
Access to customers
Cost of labor
Skills training/education programs
Cost of real estate
Quality of life offerings
Quality of local colleges/universities
Quality of K-12 schools
Extremely Poor Below Average Average Very Good Excellent
2.4
2.6
2.7
4.4
2.5
3.2
2.7
3.7
3.4
3.8
2.3
3.9
3.7
3.5
Views on IMPORTANCE(scale of 1 to 5)

GREATER GREEN BAY CHAMBER
GREATER GREEN BAY STRATEGIC PLAN PAGE | 76
FIGURE 63. BUSINESS SUCCESS FACTORS: REGIONAL WORKFORCE How would you rate the regional workforce overall on the following characteristics?
FIGURE 64. BUSINESS SUCCESS FACTORS: REGIONAL TRAINING PROGRAMS Are Greater Green Bay's existing training programs lacking in any areas that are critical to your training needs?
0% 20% 40% 60% 80% 100%
Employee attitudes
Productivity
Reliability
Trainability
Teamwork skills
Entry-level skills
Adaptibility
Computer skills
Job readiness
Professionalism
Math skills
Communication skills
Share of firms rating the characteristic
No opinion Poor Fair Good Excellent
HIGHEST RATED
LOWEST RATED
No, we conduct all training in-house or through existing supplier/vendor relationships.
No, the training offered by regional providers is sufficient.
Yes, there are gaps in training available in the region but they do not have a critical impact on operations.
Yes, there are critical gaps in training that negatively impact our operations.
Share of responding firms
10.4%
23.9%
29.9%
35.8%
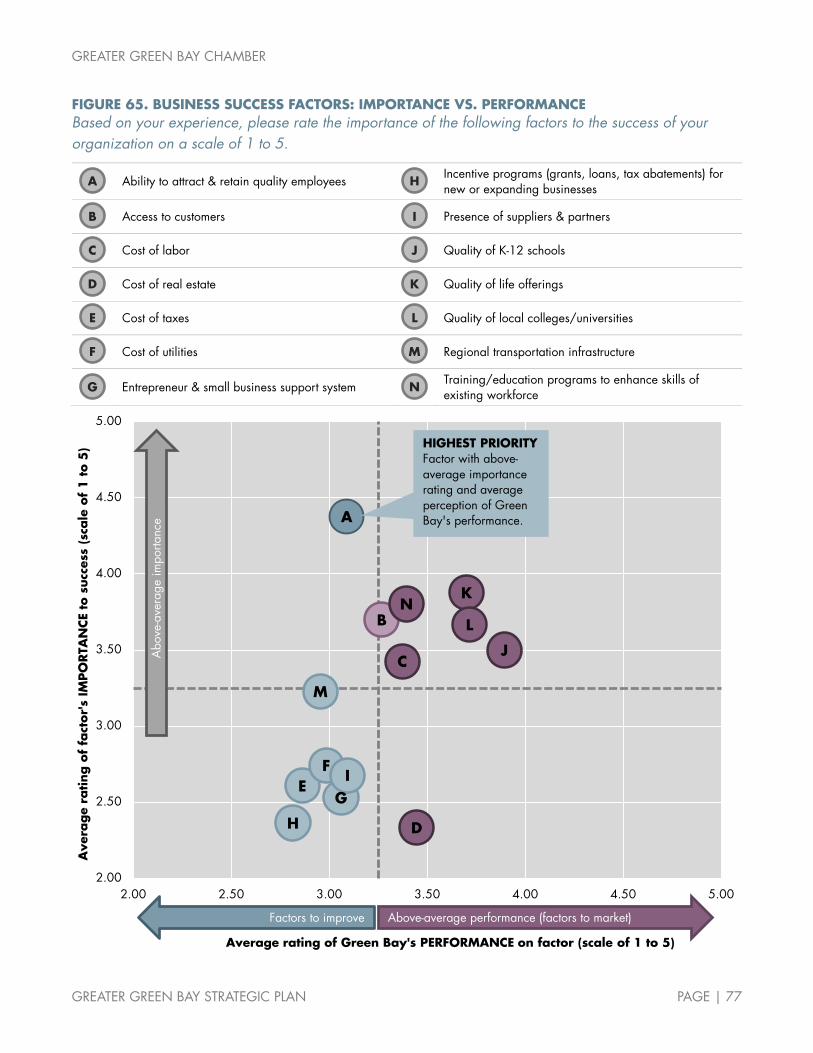
GREATER GREEN BAY CHAMBER
GREATER GREEN BAY STRATEGIC PLAN PAGE | 77
FIGURE 65. BUSINESS SUCCESS FACTORS: IMPORTANCE VS. PERFORMANCE Based on your experience, please rate the importance of the following factors to the success of your organization on a scale of 1 to 5.
Ability to attract & retain quality employees
Incentive programs (grants, loans, tax abatements) for new or expanding businesses
Access to customers
Presence of suppliers & partners
Cost of labor
Quality of K-12 schools
Cost of real estate
Quality of life offerings
Cost of taxes
Quality of local colleges/universities
Cost of utilities
Regional transportation infrastructure
Entrepreneur & small business support system
Training/education programs to enhance skills of existing workforce
A
B
C
D
EF
G
H
I
J
K
L
M
N
2.00
2.50
3.00
3.50
4.00
4.50
5.00
2.00 2.50 3.00 3.50 4.00 4.50 5.00
Ave
rage
rating o
f fa
ctor'
s IM
PO
RTA
NCE
to s
ucc
ess
(sca
le o
f 1 t
o 5
)
Average rating of Green Bay's PERFORMANCE on factor (scale of 1 to 5)
Above-average performance (factors to market)Factors to improve
Abo
ve-a
vera
ge im
porta
nce
HIGHEST PRIORITYFactor with above-average importance rating and average perception of Green Bay's performance.
A H
B I
C J
D K
E L
F M
G N