appendix j socio-economic assessment
TRANSCRIPT

APPENDIX JSOCIO-ECONOMIC
ASSESSMENT
Wilpinjong Coal Mine Modification Socio-Economic Assessment
Prepared for
Wilpinjong Coal Pty Ltd
By
Gillespie Economics Tel: (02) 9804 8562
Email: [email protected]
July 2013
i
TABLE OF CONTENTS
1 INTRODUCTION ........................................................................................................... 1 1.1 EXISTING OPERATION ............................................................................................................. 1 1.2 MODIFICATION DESCRIPTION ................................................................................................ 1 1.3 SOCIO-ECONOMIC ANALYSIS ................................................................................................ 2
2 BENEFIT COST ANALYSIS OF THE MODIFICATION ................................................. 4 2.1 INTRODUCTION ........................................................................................................................ 4 2.2 IDENTIFICATION OF THE “WITH” AND “WITHOUT” MODIFICATION SCENARIOS .............. 4 2.3 IDENTIFICATION OF BENEFITS AND COSTS ........................................................................ 4 2.4 ADDITIONAL MINING COSTS AND BENEFITS ....................................................................... 5 2.5 ADDITIONAL INFRASTRUCTURE COSTS AND BENEFITS ................................................. 10 2.6 CONSOLIDATION OF VALUE ESTIMATES AND THRESHOLD VALUE ANALYSIS ............ 11 2.7 SENSITIVITY TESTING ........................................................................................................... 12 2.8 DISTRIBUTION OF IMPACTS ................................................................................................. 13
3 REGIONAL ECONOMIC IMPACTS ............................................................................. 15 3.1 INTRODUCTION ...................................................................................................................... 15 3.2 ECONOMIES ............................................................................................................................ 15 3.3 METHOD OF ASSESSMENT .................................................................................................. 15 3.4 INPUT-OUTPUT TABLES ........................................................................................................ 16 3.5 REGIONAL IMPACT ASSESSMENT ....................................................................................... 17
4 EMPLOYMENT, POPULATION AND COMMUNITY INFRASTRUCTURE ASSESSMENT ............................................................................................................ 19
4.1 INTRODUCTION ...................................................................................................................... 19 4.2 MODIFICATION WORKFORCE AND POPULATION CHANGE ............................................. 19 4.3 COMMUNITY INFRASTRUCTURE IMPACT ASSESSMENT ................................................. 21 4.4 SOCIAL AMENITY .................................................................................................................... 22 4.5 MITIGATION AND MANAGEMENT MEASURES .................................................................... 22
5 CONCLUSIONS .......................................................................................................... 23
6 REFERENCES ............................................................................................................ 24
List of Tables
Table 2.1 Potential Economic Benefits and Costs of the Modification Table 2.2 Benefit Cost Analysis Results of the Proposed Additional Mining Under the
Modification ($M Present Values at 7% Discount Rate) Table 3.1 Estimated Annual Regional Economic Impacts of the Modification on the
Mid-Western Regional LGA Table 4.1 Occupations in the Mid-Western Regional LGA Table 4.2 Hotels, Motels and Serviced Apartments, December 2012

ii
List of Figures Figure 3.1 Main Employment Sectors in Mid Western LGA List of Attachments Attachment 1 Benefit Cost Analysis Attachment 2 Underlying Assumptions and Interpretations of Input-Output Analysis and
Multipliers Attachment 3 The Grit System for Generating Input-Output Tables
1
1 INTRODUCTION 1.1 Existing Operation The Wilpinjong Coal Mine is an existing open-cut coal mining operation situated approximately 40 kilometres north-east of Mudgee, near the village of Wollar, within the Mid-Western Regional Council Local Government Area (LGA), in central New South Wales (NSW). The Wilpinjong Coal Mine is owned and operated by Wilpinjong Coal Pty Limited (WCPL), a wholly owned subsidiary of Peabody Energy Australia Pty Limited. Mining is undertaken within Mining Lease (ML) 1573 and the approved open cut and contained infrastructure area at the Wilpinjong Coal Mine comprises approximately 1,920 hectares (ha). The Wilpinjong Coal Mine was approved under Part 3A of the NSW Environmental Planning and Assessment Act, 1979 (EP&A Act) by the NSW Minister for Planning in February 2006 (Project Approval 05-0021). The mine has been operating since 2006, and is approved to produce up to 15 million tonnes per annum (Mtpa) of run-of-mine (ROM) coal from six open cut pits. The Wilpinjong Coal Mine produces both washed and unwashed coal products. The coal handling and processing infrastructure has been designed to accommodate the processing of raw coal and the handling of raw (bypass) and washed product coal. The Project Approval currently allows for the beneficiation of up to 8.5 million tonnes (Mt) of ROM coal in the Coal Handling and Preparation Plant (CHPP) per year and up to 12.5 Mtpa of thermal coal products from the Wilpinjong Coal Mine are transported by rail to domestic customers for use in electricity generation and to port for export. Following a review of mine planning, CHPP capacity, waste rock bulking factors, planned building and demolition works and light vehicle servicing requirements, WCPL has determined that a number of minor alterations to the approved Wilpinjong Coal Mine are required. These variations to the Wilpinjong Coal Mine are being sought via a Modification under section 75W of the EP&A Act (the Modification). 1.2 Modification Description The Modifications being sought include: • development of incremental extensions to the existing open cut pits that would extend the open
cuts by approximately 70 ha and would result in the recovery of approximately 3 Mt of additional ROM coal;
• higher rates of annual waste rock production (from 28 million bank cubic metres [Mbcm] up to approximately 33.3 Mbcm) in order to maintain approved ROM coal production;
• minor CHPP upgrades to improve fine coal reject management (installation of a belt press filter) and an increase in the rate of ROM coal beneficiation in the CHPP to approximately 9 Mtpa;
• upgrade of the existing reverse osmosis plant to a water treatment facility with the addition of pre-filtration and flocculation/dosing facilities to improve efficiency;
• amendment of the waste emplacement strategy to include:
- development of an elevated waste rock emplacement landform (up to approximately 450 metres [m] Australian Height Datum) within the footprint of Pit 2;
- disposal of some inert building and demolition waste that is produced from off-site building demolition in the approved mine waste rock emplacements;
2
- co-disposal of fine coal reject material produced by the belt press filter with coarse rejects; and
• operation of a light vehicle servicing workshop at an existing farm shed that is located in the north of the Project area.
Construction of the belt press filter and augmentation of the existing reverse osmosis plant may require a temporary construction workforce of up to 20 people for periods in 2014. It should be noted that no changes are proposed to the approved rates of production of ROM coal (15 Mtpa) or product coal (12.5 Mtpa) and the current owner-operator mobile fleet would not require augmentation. In addition, the Modification would not require any significant alteration to the existing approved Wilpinjong Coal Mine mining operations and general supporting infrastructure, or current operational workforce of approximately 550 staff and contractors. A detailed description of the Modification is provided in Section 3 of the Environmental Assessment (EA). 1.3 Socio-Economic Analysis From a socio-economic perspective, there are three important aspects of the Modification: • the economic efficiency of the Modification (i.e. consideration of economic costs and benefits);
• the regional economic impacts of the Modification (i.e. the economic stimulus that the Modification would provide); and
• the distribution of impacts between stakeholder groups (i.e. the equity or social impact considerations).
The NSW Department of Planning and Infrastructure’s (DP&I) (James and Gillespie, 2002) Draft Guideline for Economic Effects and Evaluation in EIA (the Draft Guideline) identifies economic efficiency as the key consideration of economic analysis. Benefit Cost Analysis (BCA) is the method used to consider the economic efficiency of proposals. The Draft Guideline (James and Gillespie, 2002) identifies BCA as essential to undertaking a proper economic evaluation of proposed developments that are likely to have significant environmental impacts. The NSW Government (2012) Draft Guideline for the use of Cost Benefit Analysis in mining and coal seam gas proposals also endorses BCA as the appropriate methodology for evaluating coal mining proposals. In BCA a project is considered to improve the welfare of society if the aggregate benefits exceed the aggregate costs (Attachment 1). The NSW Government (2012) draft Guideline does not provide guidance on other forms of economic assessment. The Draft Guideline (James and Gillespie, 2002) indicates that a regional economic impact assessment may provide additional information as an adjunct to the economic efficiency analysis. Economic stimulus to the regional economy can potentially be estimated using a range of methods including input-output modelling (regional economic impact assessment). The Draft Guideline (James and Gillespie, 2002) also identifies the need to consider the distribution of benefits and costs in terms of: • intra-generational equity effects – the incidence of benefits and costs within the present
generation; and
• inter-generational equity effects – the distribution of benefits and cost between present and future generations.

3
However, there is no criterion in economics for determining what constitutes a fair and equitable distribution of costs and benefits. Judgements about equity are subjective and are therefore left to decision-makers (Attachment 1). Impacts on employment, population, community infrastructure and services are also of interest to decision-makers. This study relates to the preparation of each of the following types of analyses: • a BCA (threshold value analysis) of the Modification including a discussion of intra and
inter-generation equity (Section 2);
• a regional economic impact assessment of the Modification (Section 3); and
• consideration of employment, population and community infrastructure assessment issues arising from the Modification (Section 4).
4
2 BENEFIT COST ANALYSIS OF THE MODIFICATION
2.1 Introduction BCA of the Modification involves the following key steps: • identification of the “with” and “without” Modification scenarios;
• identification and valuation of the incremental benefits and costs;
• consolidation of value estimates using discounting to account for temporal differences;
• application of decision criteria;
• sensitivity testing; and
• consideration of non-quantified benefits and costs. What follows is a BCA of the Modification based on financial and technical advice provided by Peabody Energy Australia Pty Ltd and its specialist consultants. An explanation of BCA is provided in Attachment 1. 2.2 Identification of the “With” and “Without” Modification Scenarios The Wilpinjong Mine has approval to mine up to 15 Mt of ROM coal over a mine life of approximately 21 years. This is the base case against which the Modification is compared. The Modification can be considered as comprising two components: • additional mining of coal; and
• some minor changes to surface infrastructure and materials handling to improve the efficiency of existing operations.
The main substantive change would be a number of small open cut extensions that would provide access to approximately 3 Mt of additional ROM coal, with development of these extensions commencing in 2014. The impact of the additional coal recovery from these extension areas on the material schedule for the mine would be felt in 2018, when without the Modification production would fall below current approval maximum levels. This component of the Modification would not change the life of the current approval or the maximum annual rate of coal mining. The proposed alterations to the CHPP (belt press filter) to allow the co-disposal of tailings, augmentation of the existing reverse osmosis plant and operation of a light vehicle servicing facility in an existing building are improvements that, subject to feasibility and detailed designs, would be implemented to improve the on-site management of CHPP reject material, excess water at the mine and maintenance of light vehicles. These improvements have limited relevance to the proposed open cut extensions, rather they are related to proposed improvements to the management of the existing approved mine. 2.3 Identification of Benefits and Costs The two components of the Modification have distinct sets of potential incremental costs and benefits relative to the base case or “without” the proposed modification scenario. These are summarised in Table 2.1.

5
Table 2.1 Potential Economic Benefits and Costs of the Modification
Category Costs Benefits
Open Cut Extensions
Net production benefits
• Any opportunity cost of land and capital
• Any additional capital costs
• Additional operating costs, including administration, mining, coal handling and transportation to port
• Value of coal
• Any residual value of capital and land
Potential environmental, social and cultural impacts
• Any incremental increases in environmental impacts that may arise from the Modification
• Any non-market benefits of continued levels of employment
Minor Infrastructure Augmentation
Net production benefits
• Capital costs of the belt press filter and the reverse osmosis plant augmentation
• Operating cost of the belt press filter and any additional operating costs of the reverse osmosis plant
• Any additional site infrastructure decommissioning costs
• Avoided capital and operating costs associated with existing and new tailings dams
• Avoided rehabilitation costs associated with tailings dams
• Residual value of capital equipment
Potential environmental, social and cultural impacts
• Additional frequency of approved water releases due to increased recovery of water from tailings
• Environmental benefits that may arise due to improved tailings and water management
• Reduced pumping from the water supply borefield due to improved water recovery from tailings
It should be noted that the potential environmental, social and cultural impacts, listed in Table 2.1, are only economic costs to the extent that they affect individual and community wellbeing through direct use of resources by individuals or non-use. If the potential impacts are mitigated to the extent where community wellbeing is insignificantly affected, then no economic costs arise. 2.4 Additional Mining Costs and Benefits 2.4.1 Incremental Net Production Costs and Benefits The additional mining under the Modification would utilise capital equipment and land that is required for mining operations under the current approval. Because the Modification would not alter the approved mine life, there would be no incremental consequences for the residual value of capital equipment and land or decommissioning costs.
6
The Modification would result in additional mine operating costs (net of royalties) in 20181 (i.e. due to higher levels of production in that year than would occur without the Modification). There would also be some potential additional mitigation and offset costs in relation to management of noise impacts, visual impacts, Aboriginal heritage management and biodiversity offsets. These operating costs and mitigation/offset costs have been included in the BCA. While royalties are a cost to Peabody Energy Australia, they are part of the overall net production benefit of the mining activity that is redistributed by government. Royalties are therefore not included in the calculation of the resource costs of the Modification. Nevertheless, it should be noted that the Modification would generate total royalties to NSW in the order of $18 million (M) ($12M, present value at 7 percent [%] discount rate). Assuming a thermal coal price of 90 Australian dollars (AUD$) per tonne, the additional coal produced from the Modification would have an economic value of some $216M. There is obviously considerable uncertainty around future values of thermal coal and hence assumed values have been subjected to sensitivity testing (see Section 2.7). 2.4.2 Environmental, Social and Cultural Impacts
The potential residual environmental impacts are identified and discussed in Section 4 of the main report of the EA. The main potential impacts are discussed from an economic efficiency perspective below. Operational Noise As described in the Noise and Blasting Impact Assessment (SLR Consulting Australia Pty Ltd, 2013) (Appendix A of the EA), the Wilpinjong Coal Mine contributes to the existing noise environment at nearby private rural residences. The Modification open cut extensions would not bring mining operations significantly closer to the nearest private receivers. However, noise modelling of the Wilpinjong Coal Mine incorporating the Modification utilising more stringent noise enhancing inversion conditions than were used for the previous noise assessments (due to new data obtained from an on-site temperature inversion tower), identifies that four private residences outside of Wollar (one of them currently unoccupied) as being in the noise management zone where marginal to moderate exceedances of applicable noise criteria are predicted. For the purpose of the BCA an allowance has been included in the operating costs of the Modification for at receiver noise mitigation at the four private residences outside of Wollar where marginal to moderate noise exceedances are predicted to occur. WCPL has committed to continue to implement real-time monitoring and operational controls to achieve relevant Project Approval noise criteria in Wollar. To the extent that these measures successfully mitigate noise impacts, then affected properties are no worse off with the Modification than without it, and there are no other economic costs for inclusion in the BCA. It is recognised that to the extent that any residual noise impacts occur after mitigation, operational noise costs of the Modification included in the BCA will be understated. However, it is unlikely that any residual impacts would be material from an aggregate economic welfare perspective.
1 It is noted that the mine extensions would commence in 2014 however the net effect of the recovery of an additional 3 Mt of ROM coal in the period 2014-2018, would not be reflected as an increment to the base case mining production schedule until 2018.

7
Air Quality The potential air quality impacts that could occur at nearby residences as a result of dust generation at the Wilpinjong Coal Mine incorporating the Modification from activities such as coal and waste rock handling, emissions from stockpiles and haul roads and blasting have been assessed in the Air Quality Impact Assessment (Todoroski Air Sciences, 2013) (Appendix B of the EA). This assessment indicates that no private receivers would be impacted by air quality emissions above relevant criteria and no material economic effects have been identified in the BCA with respect to dust emissions. Spontaneous combustion events have occurred over the life of the Wilpinjong Coal Mine that resulted in off-site odour emissions and associated complaints from private landholders. WCPL has put in place management measures to reduce the risk of spontaneous combustion events occurring in ROM coal stockpiles and waste rock material. WCPL would also minimise the potential for spontaneous combustion in the proposed elevated waste emplacement in the south of Pit 2 by maintaining a 5 m cover of inert material over carbonaceous material. With the implementation of these measures it is not anticipated that the Modification would significantly alter the potential for combustion events to occur at the Wilpinjong Coal Mine and no material economic effects have been identified in the BCA with respect to spontaneous combustion. It is recognised that to the extent that any residual air quality impacts occur after implementation of management and mitigation measures, air quality costs of the Modification included in the BCA will be understated. However, it is unlikely that any residual impacts would be material from an aggregate economic welfare perspective. Road Transport The potential impacts of increased road traffic that would arise due to the Modification on local traffic conditions and road safety have been considered in Appendix H of the EA (GTA Consultants, 2013). It was concluded that no significant impacts on the performance, capacity, efficiency and safety of the local road network are expected as a result of the Modification, and no specific monitoring or mitigation measures are considered warranted (Appendix H of the EA). No economic effects have been identified in the BCA with respect to the predicted road transport movements associated with the Modification. It is recognised that WCPL is already required to make contributions to upgrades to the public road network under the existing Project Approval through the Ulan Road Strategy. Road Transport Noise The potential impact of increased road traffic on noise levels was assessed. It was concluded that the Modification would have minimal impact on traffic noise on Ulan Road in the vicinity of the Wilpinjong Coal Mine (Appendix A of the EA), and therefore no material economic effects for transport noise have been identified for inclusion in the BCA. Blasting Overpressure and Vibration The potential blasting impacts of the Wilpinjong Coal Mine including the Modification such as structural damage or human discomfort at private properties surrounding the mine have been assessed in Appendix A of the EA. The assessment concluded that no private dwellings would be above the building damage and human comfort criteria and blast management measures would be applied for proximal infrastructure. Hence, no material economic effects have been identified for inclusion in the BCA.
8
Groundwater The groundwater model predicts that impacts from the Modification on creek baseflow and alluvial groundwater levels would not be discernable when compared to the approved mine (Appendix C of the EA) (HydroSimulations, 2013). In addition, groundwater drawdown from the Wilpinjong Coal Mine including the Modification would not extend to privately owned land. The Groundwater Assessment (Appendix C of the EA) indicates there would be negligible variation in groundwater licensing requirements arising from the Modification and there is expected to be negligible change in groundwater quality as a result of the Modification. Hence, no material economic effects with respect to groundwater have been identified for inclusion in the BCA. Surface Water Changes to groundwater baseflow contributions to local creeks were identified as an impact of the approved Wilpinjong Coal Mine. The Groundwater Assessment (Appendix C of the EA) concluded that the potential incremental impacts of the Modification on baseflow contributions to Wilpinjong Creek would not be discernable and therefore the downstream potential impacts on Wollar Creek and the Goulburn River would be negligible. Compared to the existing/approved total catchment area excised by the Wilpinjong Coal Mine, the incremental effect of the catchment area changes proposed as part of the Modification would be negligible in terms of change in streamflow in both Wilpinjong and Cumbo Creeks. The Surface Water Assessment (Appendix D of the EA) (Gilbert & Associates, 2013) concluded there is negligible difference in predicted flow loss in Wilpinjong Creek as a result of the Modification.
There would continue to be no impacts on private water users on Wilpinjong and Wollar Creeks from the Wilpinjong Coal Mine, including the Modification. Based on the above and with implementation of existing surface water management strategies and monitoring, no material economic effects have been identified with respect to surface water for inclusion in the BCA. Aboriginal Heritage Some 14 open artefact sites of low archaeological significance, three open artefact sites of low to possibly moderate archaeological significance, one scarred tree and one cultural value/association are located within the open cut extension areas. An additional site of high archaeological significance is also located within the Modification disturbance footprint, however, this site was previously identified as being impacted by infrastructure associated with the approved mine (Appendix G of the EA) (South East Archaeology, 2013). An allowance for the implementation of mitigiation measures for Aboriginal heritage impacts has been included in the costs of the Modification. The potential economic non-use values of the additional sites that would be impacted by the Modification have not been estimated in this analysis, but are assumed to be minor.
9
Biodiversity An assessment of the impacts of the Modification on flora and fauna has been undertaken as part of the EA (Appendices E and F of the EA) (Hunter Eco, 2013; Biodiversity Monitoring Services, 2013). The additional surface disturbance associated with the pit extensions would involve the clearance of approximately 52 ha of additional native vegetation, (including approximately 11 ha of an endangered ecological community in woodland and grassland forms) that is known to provide habitat for some threatened fauna species (Appendices E and F of the EA). A range of measures to avoid, mitigate and offset impacts on biodiversity are proposed (Appendices E and F of the EA). Of particular note, the Modification incorporates progressive rehabilitation of disturbance areas and a biodiversity offset comprising some 211 ha. The conservation of the proposed biodiversity offset areas would be secured in perpetuity. Land opportunity costs and operational expenditure associated with the biodiversity offset areas have been included in the BCA. The impacted vegetation, and associated fauna, is likely to have non-use values to the community that would be lost as a result of the Modification. These values could potentially be estimated using non-market valuation methods. Similarly, the provision of offsets is also likely to have non-use values to the community that would be gained as a result of the Modification. Provided the values held by the community for the offsets are equal or greater than values that would be lost then no additional economic costs warrant inclusion in the BCA. It is recognised that to the extent that any residual biodiversity impacts occur after mitigation, biodiversity costs of the Modification included in the BCA will be understated. However, it is unlikely that any residual impacts would be material from an aggregate economic welfare perspective. Visual Potential views of the Modification landforms would be available from local roads and the railway line (Section 4 of the EA). The lack of private residences with direct views of the open cut extension areas would limit the number of potential sensitive viewpoints. Visual impacts of the Modification would include new and/or increased views of the open cuts and the elevated in pit waste rock emplacement from local viewpoints. Modification of topographic features and additional clearance or disturbance of vegetation within the open cut extension areas may also result in some incremental visual impacts. Given the nature and scale of the existing Wilpinjong Coal Mine, the potential incremental visual impacts of the Modification open cut extensions and elevated waste rock emplacement would be relatively minor (Section 4 of the EA). Visual impacts associated with mine landforms would decrease over time due to progressive rehabilitation (Section 4 of the EA). Based on the above, no material economic effects with respect to visual impacts have been identified for inclusion in the BCA. Greenhouse Gas Emissions The Modification is predicted to generate in the order of 25,490 tonnes of carbon dioxide equivalent (t CO2-e) Scope 1 emissions, 4,330 t CO2-e of Scope 2 emissions and 18,355 t CO2-e of Scope 3 emissions (through the transportation of coal to the Port of Newcastle as a result of the production of approximately 3 Mt of additional ROM coal in 2018). The economic analysis has included these emissions as a potential environmental cost of the Modification. To place an economic value on CO2-e emissions, a shadow price of CO2-e is required that reflects its global social costs. The global social cost of CO2-e is the present value of additional economic damages now and in the future caused by an additional tonne of CO2-e emissions. There is great

10
uncertainty around the global social cost of CO2-e with a wide range of estimated damage costs reported in the literature. An alternative method to trying to estimate the global damage costs of CO2-e is to examine the price of CO2-e credits/taxes. Again, however, there is a wide range of prices. For this analysis, a shadow price of AUD$23/t CO2-e rising at 2.5 per cent per year in real terms for three years and then remaining constant was used. Sensitivity testing assuming a shadow price from AUD$8/t CO2-e to AUD$40/t CO2-e was also undertaken. This represents the global social cost of carbon i.e. the cost of carbon emissions to the population of the whole world. In the absence of any studies that have focused on the social damage cost of carbon emissions to Australians, some means of apportioning global damage costs borne by Australians is required. For the purpose of the economic assessment this has been undertaken using Australia’s share of global gross domestic product (around 1%). An alternative approach would be Australia’s share of world population which is considerably less than 1%. Employment Historically the employment benefits of projects have tended to be omitted from BCA on the implicit assumption that labour resources used in a project would otherwise be employed elsewhere. Where this is not the case, Streeting and Hamilton (1991) and Bennett (1996) outline that otherwise unemployed labour resources utilised in a project should be valued in a BCA at their opportunity cost (wages less social security payments and income tax) rather than the wage rate which has the effect of increasing the net production benefits of the project. In addition, there may be social costs of unemployment that require the estimation of employees’ willingness to pay to avoid the trauma created by unemployment. These are non-market values. It has also been recognised that the broader community may hold non-environmental, non-market values (Portney, 1994) for social outcomes such as employment (Johnson and Desvouges, 1997) and the viability of rural communities (Bennett et al., 2004). The Modification would result in the continued operational employment of 80 people for approximately one year as it would (in the absence of any subsequent approvals) defer a ramp down in production at the Wilpinjong Coal Mine that would reduce on-site employment levels. The community may hold non-use values for the continuation of employment as a result of the Modification. However, to be conservative, no value has been included in this BCA. 2.5 Additional Infrastructure Costs and Benefits While detailed design for the minor infrastructure improvements (e.g. belt press filter and reverse osmosis plant upgrade) is yet to be undertaken, it is estimated that the capital costs of these components would be up to approximately $18M in total ($16M present value). This expenditure would have little relevance to the proposed Modification open cut extensions, rather it relates to proposed improvements to the existing approved mine. The capital costs for these components would be expected to be incurred in 2014. This infrastructure augmentation is expected to result in a number of economic savings including avoided capital and operating costs associated with construction and operation of tailings ponds that would otherwise be required. Because less tailings ponds may be required, there may also be less tailings ponds to rehabilitate at the end of the mine life. These economic benefits remain unquantified in the analysis.
11
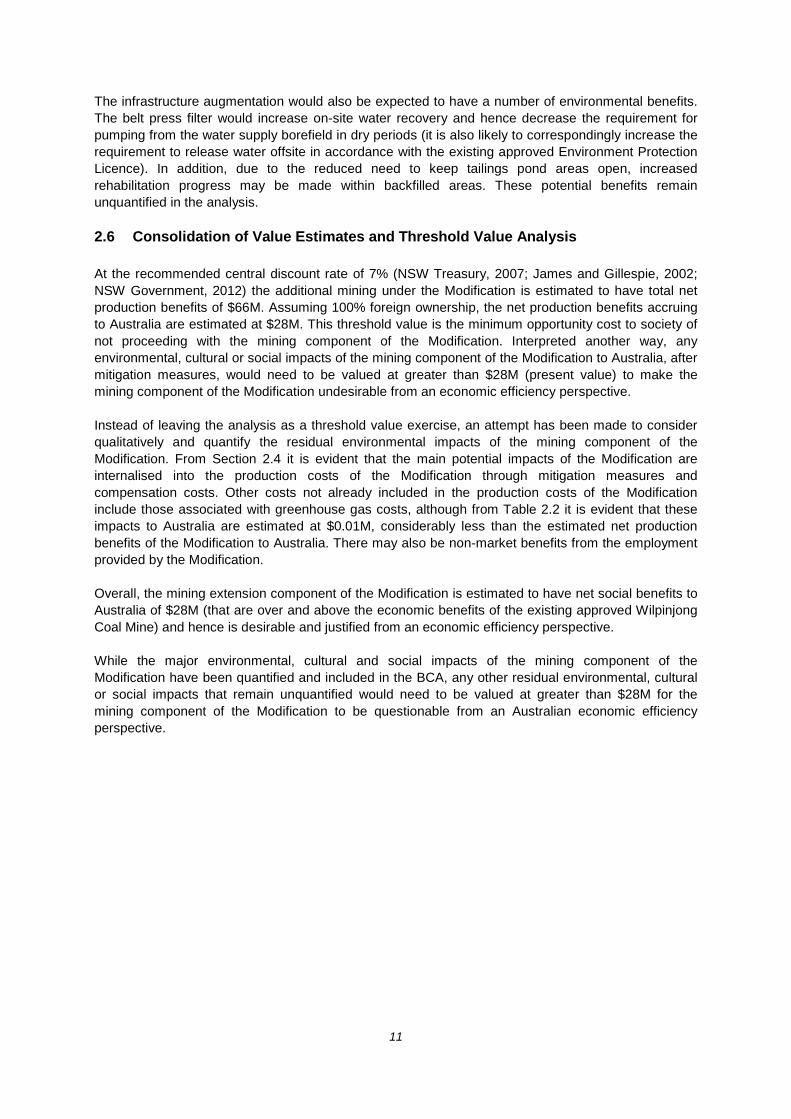
The infrastructure augmentation would also be expected to have a number of environmental benefits. The belt press filter would increase on-site water recovery and hence decrease the requirement for pumping from the water supply borefield in dry periods (it is also likely to correspondingly increase the requirement to release water offsite in accordance with the existing approved Environment Protection Licence). In addition, due to the reduced need to keep tailings pond areas open, increased rehabilitation progress may be made within backfilled areas. These potential benefits remain unquantified in the analysis. 2.6 Consolidation of Value Estimates and Threshold Value Analysis At the recommended central discount rate of 7% (NSW Treasury, 2007; James and Gillespie, 2002; NSW Government, 2012) the additional mining under the Modification is estimated to have total net production benefits of $66M. Assuming 100% foreign ownership, the net production benefits accruing to Australia are estimated at $28M. This threshold value is the minimum opportunity cost to society of not proceeding with the mining component of the Modification. Interpreted another way, any environmental, cultural or social impacts of the mining component of the Modification to Australia, after mitigation measures, would need to be valued at greater than $28M (present value) to make the mining component of the Modification undesirable from an economic efficiency perspective. Instead of leaving the analysis as a threshold value exercise, an attempt has been made to consider qualitatively and quantify the residual environmental impacts of the mining component of the Modification. From Section 2.4 it is evident that the main potential impacts of the Modification are internalised into the production costs of the Modification through mitigation measures and compensation costs. Other costs not already included in the production costs of the Modification include those associated with greenhouse gas costs, although from Table 2.2 it is evident that these impacts to Australia are estimated at $0.01M, considerably less than the estimated net production benefits of the Modification to Australia. There may also be non-market benefits from the employment provided by the Modification. Overall, the mining extension component of the Modification is estimated to have net social benefits to Australia of $28M (that are over and above the economic benefits of the existing approved Wilpinjong Coal Mine) and hence is desirable and justified from an economic efficiency perspective. While the major environmental, cultural and social impacts of the mining component of the Modification have been quantified and included in the BCA, any other residual environmental, cultural or social impacts that remain unquantified would need to be valued at greater than $28M for the mining component of the Modification to be questionable from an Australian economic efficiency perspective.
12
Table 2.2 Benefit Cost Analysis Results of the Proposed Additional Mining Under the Modification
($M Present Values at 7% Discount Rate)
COSTS BENEFITS
Description Value Description Value
Net Production Benefits
Operating costs, including administration, mining, coal handling, transportation to Port and Port charges
$78 Value of coal $144
Net Production Benefits - $66M ($28M)
Environmental, cultural and social impacts
Operational noise Negligible
Non-market benefits of employment Unquantified
Road transport and road transport noise
Negligible - -
Blasting overpressure and vibration
Negligible - -
Air quality Negligible - -
Groundwater Negligible -
Surface water Negligible - -
Aboriginal heritage Minor -
Biodiversity Some loss of values but offset. Cost of biodiversity
offset included in capital and operating costs
- -
Visual Negligible - -
Greenhouse gas emissions $1M($0.01M) - -
Sub-total $1M($0.01M) - Unquantified
NET SOCIAL BENEFITS $65M ($28M) Note: Numbers in brackets relate to impacts accuring to Australia.
Totals may have minor discrepancies due to rounding.
The infrastructure component of the Modification would have a present value of capital costs of $16M. Valuation of the incremental operating costs of the surface infrastructure augmentations and the production and environmental benefits realised from these investments was beyond the scope of the analysis. However, the fact that the proponent is pursuing these investments suggests that the production benefits would at least offset the costs. In addition, there are considered to be some potential environmental benefits associated with the co-disposal of tailings as part of ROM waste rock emplacement operations that would reduce the need for operational tailings storages and facilitate earlier rehabilitation. Consequently, this component of the Modification is also likely to have net social benefits. 2.7 Sensitivity Testing The estimated net social benefit of the additional mining under the Modification is most sensitive to assumptions about the economic value of coal. If this estimated value reduced by 20% for the life of the Modification then the threshold value would reduce to $19M. Alternatively, if the value of coal increased by 20%, the threshold value would increase to $37M. Sensitivity testing on the assumed shadow price for greenhouse gas emissions had no material impact on the analysis. No sensitivity testing has been undertaken for the minor infrastructure augmentation component of the Modification, as the analysis is largely qualitative.
13
2.8 Distribution of Impacts Intrageneration While Peabody Energy Australia would initially bear the production costs and receive the financial production benefits of the mining extension component of the Modification, the net production benefits would be distributed between a number of stakeholders including: • Peabody Energy Australia and its shareholders in the form of after tax profits;
• the Commonwealth Government in the form of any Company tax payable from the Modification (estimated at $16M, present value), which is subsequently used to fund provision of government infrastructure and services across Australia and NSW, including the region;
• the NSW Government via royalties (estimated at $12M, present value) which are subsequently used to fund provision of government infrastructure and services across the State, including the region; and
• the local community in the form of financial sponsorship and in-kind support to a variety of local schools, sporting groups, annual events, charity groups and community groups.
The environmental, cultural and social impacts of the mining extension component of the Modification may potentially accrue to a number of different stakeholder groups at the local, State, National and global level, however, are largely internalised into the production costs of Peabody Energy Australia. Any residual Aboriginal heritage impacts will occur at a local level, but will be at least partially compensated for via mitigation measures. Greenhouse gas costs will occur at the national and global level and will be compensated for via the payment of the Commonwealth Government’s carbon tax. The economic costs associated with the clearing of native vegetation will potentially occur at the State and National level and would be also be compensated for by the provision of biodiversity offsets. Other potential environmental impacts would largely occur at the local level and were found to be negligible. Non-market benefits associated with additional employment provided by the proposed modification would largely accrue at the local or State level. The environmental, social and cultural costs of the mining component of the Modification that are not already included in the calculation of net production benefits and accrue to NSW are estimated at less than $1M. This is considerably less than the net production benefits that directly accrue to NSW through royalties ($12M). NSW will obtain additional benefits through infrastructure and services provided with a share of Commonwealth Government Company tax from the proposed Modification. Consequently, as well as resulting in net social benefits to Australia the proposed Modification would be expected to result in net social benefits to NSW. Peabody Energy Australia would initially bear the production costs and receive the financial production benefits of the infrastructure component of the Modification. To the extent that the infrastructure investment incrementally reduces environmental impacts, benefits may also accrue to households that value improved environmental outcomes.
Intergenerational Some of the environmental, social and cultural impacts of the mining component of the Modification may be felt by future generations. This is particularly the case for non-market environmental impacts. However, BCA is not concerned with distributional issues (Attachment 1). The consideration of intergenerational equity issues is therefore outside the scope of BCA.

14
Nevertheless, it should be noted that the costs and benefits in BCA are defined and valued based on the microeconomic underpinnings of BCA. They are based on the values held by individuals in the society. This reflects current generations as there is no way to measure the value that future generations hold for impacts of current day projects, as they are not here to express it. Nevertheless, as identified by Boardman et al., (2001) this is not considered a serious problem for BCA because: • Few policies involve impacts that only appear in the far future.
• Most people alive today care about the well-being of their children, grandchildren, and great grandchildren, whether or not they have yet been born. They are therefore likely to include the interests of these generations to some extent in their own valuations of impacts. Because people cannot predict with certainty the place that their future offspring will hold in society, they are likely to take a very broad view of future impacts.
• Discounting used in BCA also reduces the influence of costs and benefits that occur a long way into the future.
Furthermore, increased wealth (e.g. royalties and taxes) generated by projects that have a net benefit to the community can be used to improve the services (e.g. health, school and community services) and environment (e.g. protected areas) that are passed on to future generations.
15
3 REGIONAL ECONOMIC IMPACTS 3.1 Introduction The BCA in Section 2 is concerned with whether the incremental benefits of the Modification exceed the incremental costs and therefore whether the community would, in aggregate, be better off ‘with’ the Modification compared to ‘without’ it. In contrast, the focus of the regional economic impact assessment is quantifying the positive effect (impact) of the Modification on the economy in terms of a number of specific indicators of economic activity, such as gross regional output, value-added, income and employment. These indicators are defined as follows: • gross regional output – is the gross value of business turnover;
• value-added – is the difference between the gross value of business turnover and the costs of the inputs of raw materials, components and services brought in to produce the gross regional output;
• income – is the wages paid to employees including imputed wages for self employed and business owners; and
• employment – is the number of people employed (including full-time and part-time). The main impacting agent for the Modification is the expenditure in the regional economy as a result of additional mining activity that would occur in 2018, when otherwise ROM coal production at the site would begin to fall. Expenditure in the regional economy arises mainly from businesses providing the inputs to production required by the Modification and the spending of those employed by the Modification who reside in the region. 3.2 Economies
The economy on which the impact is measured can range from a township to the entire nation (Powell et al., 1985). In selecting the appropriate economy, regard needs to be had to capturing the local expenditure and employment associated with the production scenarios, but not making the economy so large that the impact of the proposal becomes trivial (Powell and Chalmers, 1995). For this study, the economic impacts have been estimated for the Mid-Western Regional LGA.
3.3 Method of Assessment A range of methods can be used to examine the economic impacts of an activity on an economy including economic base theory, Keynesian multipliers, econometric models, mathematical programming models and input-output models (Powell et al., 1985). Economic base theory and Keynesian multipliers are relatively simple approaches that provide impact measurement only in aggregate terms. Mathematical programming models are especially useful in micro-level studies of firms and industries but become complex for whole economies. Mathematical programming models are therefore sometimes used to estimate direct effects on an industry or sector with input-output analysis used to assess economy-wide effects. Econometric models, particularly those of the general equilibrium type, have the potential to measure economic impacts in a similar way to that of input-output models with relaxation of some of the limitations of input-output analysis (Powell et al., 1985).
16
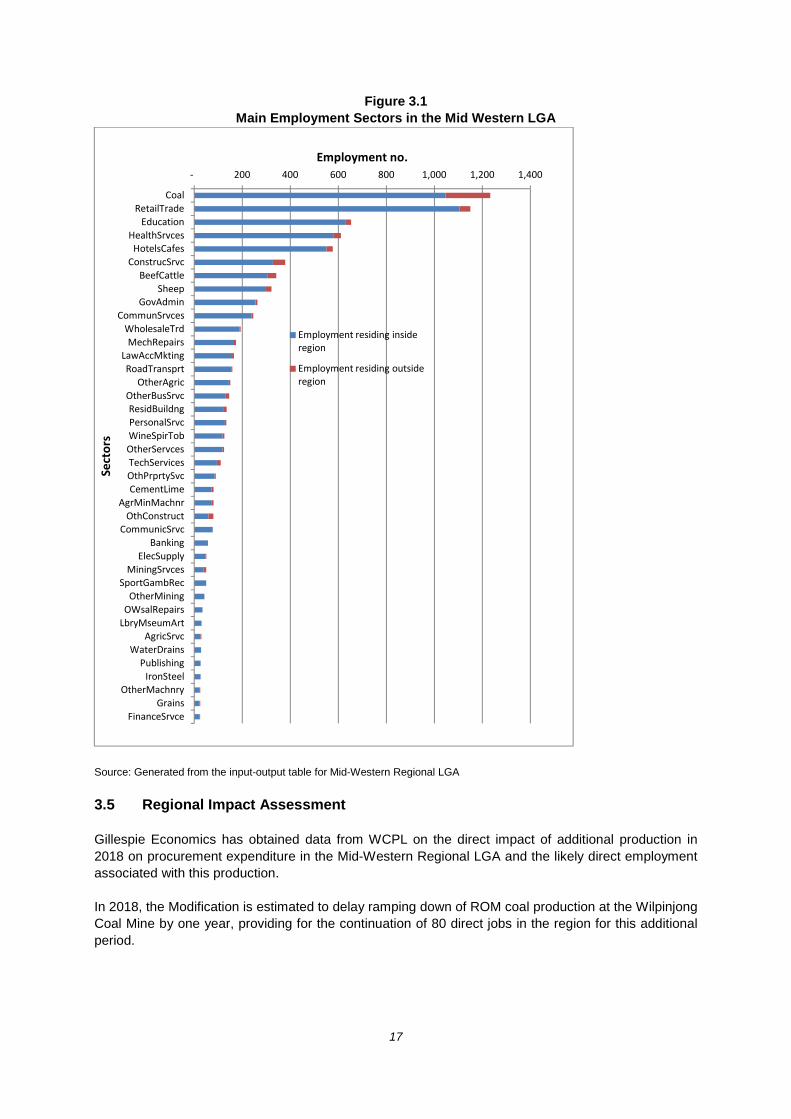
Consistent with the DP&I’s draft guideline (James and Gillespie, 2002), this study uses input-output analysis. The input-output method is based on a number of assumptions that are outlined in Attachment 2 and provides an upper bound impact estimate. One of the key simplifying assumptions of input-output analysis is that there is unlimited labour and capital available to the region at fixed prices and therefore regional economic activity does not face capacity constraints that would result in increases in prices and crowding-out of other economic activity. Crowding out would be most prevalent if the regional economy was at full employment and it was a closed economy with no potential to use labour and other resources that currently reside outside the region. In this situation a new mine requiring labour and other resources would compete for them with existing activities. However, the Mid-Western Regional LGA is not at full employment and is not a closed economy. It has potential access to employed and unemployed labour and capital resources from across the country and overseas. Even where a mining project utilises already employed labour resources from inside the region, there is a filter effect where these jobs are filled by other employed or unemployed labour resources2, which creates vacancies that are then filled by other employed or unemployed labour resource2 etc, with these employed and unemployed labour resources2 coming from both inside or outside the region. The potential labour force to meet demand in a region is therefore considerably greater than just the labour force in the region. Consequently, for small open economies, crowding out of other economic activity is likely to be negligible. While more complex models such as Computable General Equilibrium (CGE) modelling can conceptually deal with the positive economic activity impacts of a project and any partially offsetting negative economic activity impacts, for small regional economies, it is unlikely that these more complex models will surpass the simpler input-output model. Firstly, the small open economy condition minimises the need to address offsetting impacts. Secondly, given the considerable difficulties associated with estimating a large number of coefficients and parameters required for CGE models when there is virtually no local data available, many exogenous assumptions are required to be made by the modeller and so the increased ‘fuzziness’ is likely to more than offset the increase in model sophistication. Consequently, CGE models are mostly used at the State and National level for large scale policy and projects (e.g. quantifying the impact of the introduction of the goods and services tax). 3.4 Input-Output Tables A 2011 input-output table of the regional economy was developed using the Generation of Input-Output Tables (GRIT) procedure (Attachment 3) using an input-output table of the NSW economy (developed by Monash University) as the parent table and Australian Bureau of Statistics (ABS) (2011a) census data on employment by industry in the region. Figure 3.1 shows the top 40 industry sectors by employment number for the Mid Western Regional LGA. The five most significant employment providers in the region are the coal sector, retail trade sector, education sector, health services sector and hotels/cafes/accommodation sector.
2 Including the continual addition to the labour force from school leavers, TAFE and University graduates and potentially those not currently seeking employment.
17
Figure 3.1 Main Employment Sectors in the Mid Western LGA
Source: Generated from the input-output table for Mid-Western Regional LGA
3.5 Regional Impact Assessment Gillespie Economics has obtained data from WCPL on the direct impact of additional production in 2018 on procurement expenditure in the Mid-Western Regional LGA and the likely direct employment associated with this production. In 2018, the Modification is estimated to delay ramping down of ROM coal production at the Wilpinjong Coal Mine by one year, providing for the continuation of 80 direct jobs in the region for this additional period.
- 200 400 600 800 1,000 1,200 1,400
CoalRetailTrade
EducationHealthSrvcesHotelsCafes
ConstrucSrvcBeefCattle
SheepGovAdmin
CommunSrvcesWholesaleTrdMechRepairs
LawAccMktingRoadTransprt
OtherAgricOtherBusSrvcResidBuildngPersonalSrvcWineSpirTobOtherServcesTechServicesOthPrprtySvcCementLime
AgrMinMachnrOthConstruct
CommunicSrvcBanking
ElecSupplyMiningSrvces
SportGambRecOtherMining
OWsalRepairsLbryMseumArt
AgricSrvcWaterDrains
PublishingIronSteel
OtherMachnryGrains
FinanceSrvce
Employment no.
Sect
ors
Employment residing inside region
Employment residing outside region

18
The estimated annual expenditure pattern in Mid-Western Regional LGA and NSW, associated with this additional production in 2018 was used to develop a new sector representing the Modification in the Mid-Western Regional LGA and NSW. These sectors were inserted into the input-output models of the regional and NSW economy, respectively. The computer program IO7 (Input-Output Analysis Version 7.1) was used to estimate the average annual direct and indirect output, value-added, income3 and employment impacts (and multipliers) on the Mid-Western Regional LGA and NSW. The results are reported in Table 3.1.
Table 3.1
Estimated Annual Regional Economic Impacts of the Modification on the Mid-Western Regional LGA
Direct Effect Production
Induced Consumption
Induced Total
Flow-on TOTAL
EFFECT
OUTPUT ($000) 216,000 8,705 8,753 17,458 233,458
Type 11A Ratio 1.00 0.04 0.04 0.08 1.08
VALUE ADDED ($000) 117,042 5,472 4,214 9,686 126,728
Type 11A Ratio 1.00 0.05 0.04 0.08 1.08
INCOME ($000) 13,954 1,927 2,982 4,909 18,863
Type 11A Ratio 1.00 0.14 0.21 0.35 1.35
EMPLOYMENT (No.) 80 25 52 77 157
Type 11A Ratio 1.00 0.32 0.64 0.96 1.96
Note: Income only relates to that income that will accrue to labour living in the region. Employment relates to employees working in the region.
Totals may have minor discrepancies due to rounding.
Contractor employment is included in production-induced flow-ons.
The annual economic impact of the Modification on the Mid-Western Regional LGA is estimated at up to: • $234M in annual direct and indirect regional output or business turnover;
• $127M in annual direct and indirect regional value added;
• $19M in annual direct and indirect household income; and
• 157 direct and indirect jobs. These estimated upper bound impacts would persist for approximately one year.
Where in the absence of the Modification, displaced employees would have remained in the region, then the impacts associated with the additional production in 2018, would approximate the direct plus production-induced effects.
The Mid-Western Regional LGA will obtain greater economic activity from the Modification if it is able to provide the goods and services required for the Modification. The impacts of projects on the NSW economy are likely to be larger than they are on regional economy because larger economies are able to capture more of the incremental expenditure and have greater intersectoral linkages.
3 Income only included the proportion of household income paid to local labour.

19
4 EMPLOYMENT, POPULATION AND COMMUNITY INFRASTRUCTURE ASSESSMENT
4.1 Introduction Changes in the workforce and population of a region may well have implications in relation to access to community infrastructure and human services, which includes for example housing, health and education facilities. This may include the number of services that are available to be used and the accessibility of these services. The objective of this assessment is to examine the potential impacts on the existing community infrastructure as a result of employment and population change associated with the Modification. Potential impacts on social amenity are also considered. The methodology for carrying out the assessment was to: • analyse the likely incremental magnitude of the Modification workforce and associated population
growth including estimated flow-on employment and population effects;
• consider the impacts of estimated employment and population change on community infrastructure based on consideration of the existing socio-economic environment of the region; and
• recommend impact mitigation or management measures for any substantive impacts that are identified.
The region of the assessment was the Mid-Western Regional LGA.
4.2 Modification Workforce and Population Change 4.2.1 Introduction
The main drivers for impacts on community infrastructure are changes in employment and population and the spatial location of these changes in employment and population. Additional employment may be sourced from: • the local region either from:
- the unemployment pool; and/or
- workers from other industries;
• in-migration; or
• commuters. Sourcing labour from the local region has minimal direct impact on local community infrastructure and services since it results in no changes to the regional population and hence demand for services. It may, however, have an indirect impact on some local community infrastructure and services where changes in employment status or income result in changes in demand for some particular services (e.g. health services).

20
Whether local labour is sourced from the unemployment pool or from other industries, it can reduce unemployment levels - directly in the case of employing unemployed people and indirectly via the filter effect4 where labour is sourced from other industries. The impact of commuter workers would depend on the extent to which they integrate into the regional communities, however, it is generally assumed that the impact of commuter workers is likely to be very minor. In-migration resulting in population change is likely to have the greatest potential impact on demand for community services and infrastructure with this impact dependent on the new residential location of the migrating workforce and their families. As well as direct employment and population changes, mining projects may also generate indirect labour demand through expenditure by employees in the local region and mine operation expenditure in the local region on other inputs to production. This induced demand for labour may also have consequences for population change and demand for community infrastructure and services. To facilitate consideration of potential community infrastructure impacts, this section explores the likely direct and indirect employment and population effects of the Modification. 4.2.2 Construction Workforce and Population Change
The Modification is estimated to result in an additional construction workforce of approximately 20 people during 2014.
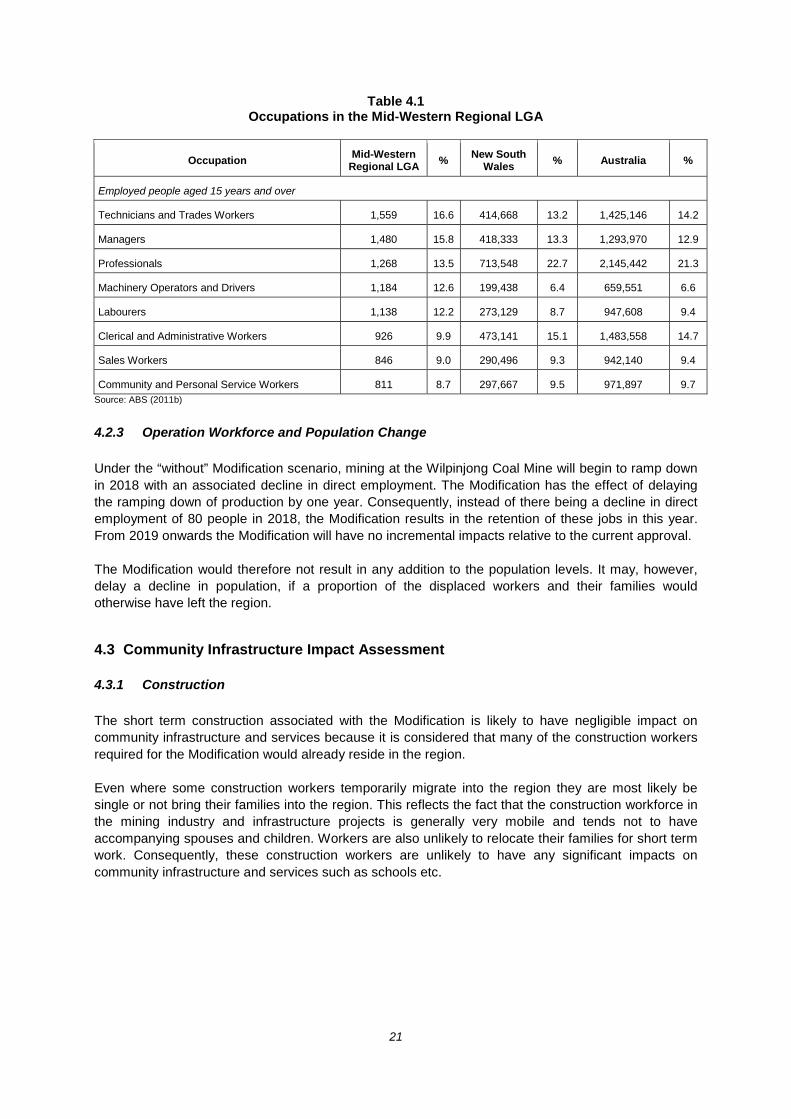
Construction generally requires a labour force with highly specialised skills including specialised welders, fitters, electrical contractors, machinery mechanics and construction engineers (Centre for International Economics, 2001). These types of labour are in the professions of Technicians and Trades Workers, Machinery Operators and Drivers, and Professionals. The Mid-Western Regional LGA has a higher proportion of the workforce in the occupations of Technicians and Trades Workers, Machinery Operators and Drivers and Labourers than NSW (Table 4.1). It therefore likely that most of the small number of construction workers required for the Modification construction activity would already reside in the region and so there would be minimal population change as a result of the Modification.
In addition, with the recent downturn in commodities markets and reduced expenditure by coal mining companies, some underutilisation of contractor firms may be occurring, such that sufficient capacity is available to supply the requirements of the Modification.
4 The filter effect refers to the situation where labour is sourced from other industries in the region making jobs available in
those industries which are subsequently filled by people either from the unemployment pool or other industries with the latter making jobs available in that industry, etc.
21
Table 4.1 Occupations in the Mid-Western Regional LGA
Occupation
Mid-Western Regional LGA % New South
Wales % Australia %
Employed people aged 15 years and over
Technicians and Trades Workers 1,559 16.6 414,668 13.2 1,425,146 14.2
Managers 1,480 15.8 418,333 13.3 1,293,970 12.9
Professionals 1,268 13.5 713,548 22.7 2,145,442 21.3
Machinery Operators and Drivers 1,184 12.6 199,438 6.4 659,551 6.6
Labourers 1,138 12.2 273,129 8.7 947,608 9.4
Clerical and Administrative Workers 926 9.9 473,141 15.1 1,483,558 14.7
Sales Workers 846 9.0 290,496 9.3 942,140 9.4
Community and Personal Service Workers 811 8.7 297,667 9.5 971,897 9.7 Source: ABS (2011b)
4.2.3 Operation Workforce and Population Change
Under the “without” Modification scenario, mining at the Wilpinjong Coal Mine will begin to ramp down in 2018 with an associated decline in direct employment. The Modification has the effect of delaying the ramping down of production by one year. Consequently, instead of there being a decline in direct employment of 80 people in 2018, the Modification results in the retention of these jobs in this year. From 2019 onwards the Modification will have no incremental impacts relative to the current approval. The Modification would therefore not result in any addition to the population levels. It may, however, delay a decline in population, if a proportion of the displaced workers and their families would otherwise have left the region.
4.3 Community Infrastructure Impact Assessment 4.3.1 Construction The short term construction associated with the Modification is likely to have negligible impact on community infrastructure and services because it is considered that many of the construction workers required for the Modification would already reside in the region. Even where some construction workers temporarily migrate into the region they are most likely be single or not bring their families into the region. This reflects the fact that the construction workforce in the mining industry and infrastructure projects is generally very mobile and tends not to have accompanying spouses and children. Workers are also unlikely to relocate their families for short term work. Consequently, these construction workers are unlikely to have any significant impacts on community infrastructure and services such as schools etc.
22
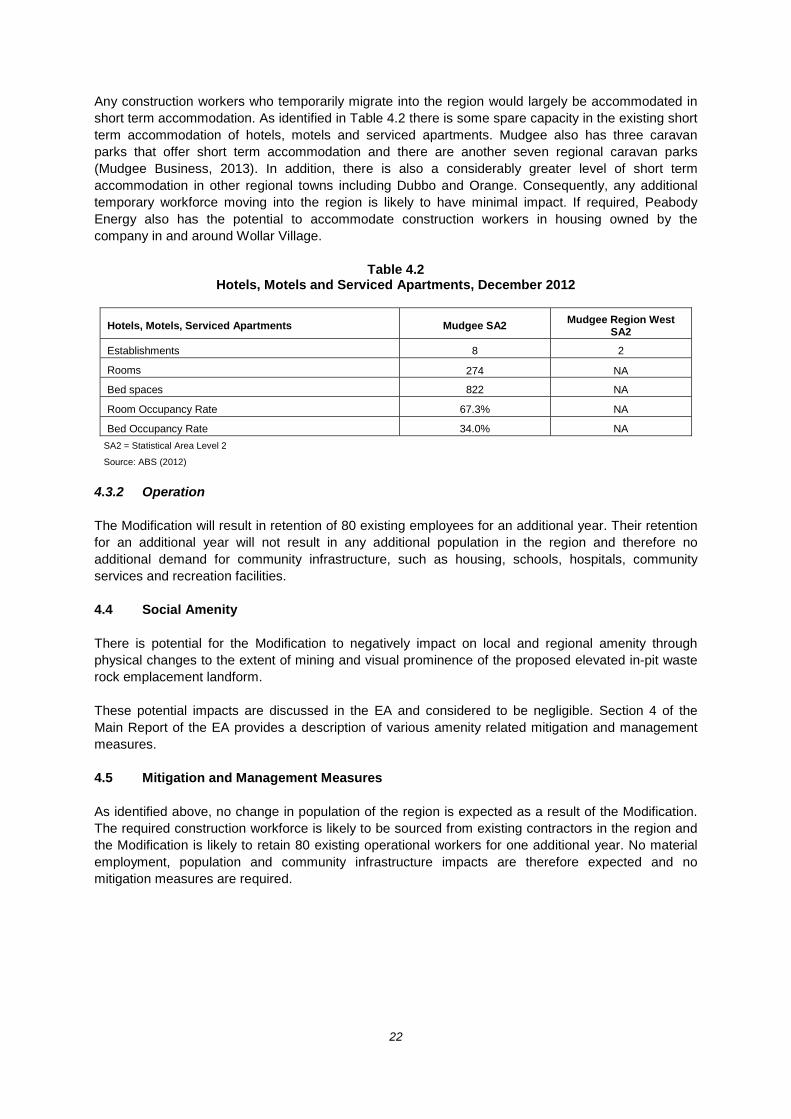
Any construction workers who temporarily migrate into the region would largely be accommodated in short term accommodation. As identified in Table 4.2 there is some spare capacity in the existing short term accommodation of hotels, motels and serviced apartments. Mudgee also has three caravan parks that offer short term accommodation and there are another seven regional caravan parks (Mudgee Business, 2013). In addition, there is also a considerably greater level of short term accommodation in other regional towns including Dubbo and Orange. Consequently, any additional temporary workforce moving into the region is likely to have minimal impact. If required, Peabody Energy also has the potential to accommodate construction workers in housing owned by the company in and around Wollar Village.
Table 4.2 Hotels, Motels and Serviced Apartments, December 2012
Hotels, Motels, Serviced Apartments Mudgee SA2 Mudgee Region West SA2
Establishments 8 2
Rooms 274 NA
Bed spaces 822 NA
Room Occupancy Rate 67.3% NA
Bed Occupancy Rate 34.0% NA
SA2 = Statistical Area Level 2
Source: ABS (2012) 4.3.2 Operation The Modification will result in retention of 80 existing employees for an additional year. Their retention for an additional year will not result in any additional population in the region and therefore no additional demand for community infrastructure, such as housing, schools, hospitals, community services and recreation facilities. 4.4 Social Amenity There is potential for the Modification to negatively impact on local and regional amenity through physical changes to the extent of mining and visual prominence of the proposed elevated in-pit waste rock emplacement landform. These potential impacts are discussed in the EA and considered to be negligible. Section 4 of the Main Report of the EA provides a description of various amenity related mitigation and management measures. 4.5 Mitigation and Management Measures As identified above, no change in population of the region is expected as a result of the Modification. The required construction workforce is likely to be sourced from existing contractors in the region and the Modification is likely to retain 80 existing operational workers for one additional year. No material employment, population and community infrastructure impacts are therefore expected and no mitigation measures are required.
23
5 CONCLUSIONS
This socio-economic assessment includes the following types of analyses: • a BCA (threshold value analysis) of the Modification;
• a regional economic impact assessment of the Modification; and
• an employment, population and community infrastructure assessment. The BCA identified the estimated net production benefits to Australia of the mining component of the Modification (over and above the economic benefits of the existing approved Wilpinjong Coal Mine) at $28M (present value). Any environmental, social or cultural impacts of the mining component of the Modification to Australia, after mitigation, would need to be valued at more than $28M for the Modification to be undesirable from an economic efficiency perspective. Instead of leaving the analysis as a threshold value exercise, an attempt has been made to consider and quantify the residual environmental impacts of the mining component of the Modification. The main potential impacts of the mining component of the Modification are internalised into the production costs of the Modification through mitigation measures and compensation costs. Consequently, the net social benefit of the mining component of the Modification is also estimated at $28M. The infrastructure component of the Modification would have present value capital costs of $16M. While the other costs and benefits of this component of the Modification remained unquantified in the analysis, the fact that the proponent is pursuing these investments suggests that the production benefits would at least offset the costs. In addition, there are considered to be some potential environmental benefits of the proposed infrastructure works. Consequently, this component of the Modification is also likely to have net social benefits. The regional economic impact analysis, using input-output analysis, estimated that the annual regional economic impact of the Modification on the Mid Western Regional LGA is up to: • $234M in annual direct and indirect regional output or business turnover;
• $127M in annual direct and indirect regional value added;
• $19M in annual direct and indirect household income; and
• 157 direct and indirect jobs. These impacts are an upper bound estimate and would persist for approximately one year. The employment, population and community infrastructure assessment found that the short term construction activities associated with the development of minor augmentations to the existing Wilpinjong Coal Mine infrastructure (belt filter press and reverse osmosis plant augmentation) is likely to have negligible impact on community infrastructure and services because only a small number of workers are required and it is considered that most of the small number of construction workers required for the Modification would already reside in the region. The Modification is expected to result in retention of approximately 80 existing employees for an additional year. Retention of this workforce for an additional year will not result in any additional population in the region and therefore no additional demand for community infrastructure, such as housing, schools, hospitals, community services and recreation facilities would arise.
24
6 REFERENCES
Australian Bureau of Statistics (2011a) 4 digit industry by employment working in the region by place of residence, inside and outside the region.
Australian Bureau of Statistics (2011b) 2011 Census Quick Stats
Australian Bureau of Statistics (2012) Tourist Accommodation, Small Area Data, New South Wales, Dec 2012
Bennett J, Van Bueren M and Whitten S (2004) Estimating society's willingness to pay to maintain viable rural communities, Australian Journal of Agricultural and Resource Economics, 48(3): 487-512.
Bennett, J. (1996) The Economic Efficiency of RACAC Resource Allocation Options a Conceptual Framework. A Consultancy prepared for Resource and Conservation Assessment Council.
Biodiversity Monitoring Services (2013) Wilpinjong Coal Mine – Terrestrial Fauna Assessment.
Boardman, A., Greenberg, D., Vining, A. and Weimer, D. (2001) Cost-Benefit Analysis: Concepts and Practice, Prentice Hall, USA.
Centre for International Economics (2001) Community Infrastructure Assessment: For the Ginkgo Mineral Sands Project. Prepared for Bemax Resources Limited.
Gilbert & Associates Pty Ltd (2013) Wilpinjong Coal Mine Modification Surface Water Assessment.
GTA Consultants (2013) Wilpinjong coal Mine Modification NSW Road Transport Assessment.
Hunter Eco (2013) Wilpinjong Coal Open Cut Modification – Flora Assessment.
HydoSimulations (2013) Wilpinjong Coal Mine Modification Groundwater Assessment.
James, D. and Gillespie, R. (2002) Draft Guideline for Economic Effects and Evaluation in EIA. Prepared for Planning NSW.
Johnson, F. and Desvouges, W. (1997) Estimating Stated Preferences with Rated-Pair Data: Environmental, Health and Employment Effects of Energy Programs. Journal of Environmental Economics and Management, 34,. 75-99.
Mudgee Business (2013) Mudgee Business Directory and Tourist Guide – Caravan Parks and Camping Sites. Website: http://www.mudgeebusiness.com/caravan-parks--camping.html. Date Accessed: 7 February 2013.
NSW Government (2012) Draft Guideline for the use of Cost Benefit Analysis in mining and coal seam gas proposals.
NSW Treasury (2007) NSW Government Guidelines for Economic Appraisal. Website: www.treasury.nsw.gov.au. Date Accessed: 7 February 2013.
Portney, P. (1994) The Contingent Valuation Debate: Why Economists Should Care. Journal of Economic Perspectives 8:4, 3-18.
Powell, R. and Chalmers, L. (1995) The Regional Economic Impact of Gibraltar Range and Dorrigo National Park. A Report for the NSW National Parks and Wildlife Service.
Powell, R., Jensen, R. and Gibson, A. (1985) The Economic Impact of Irrigated Agriculture in NSW. A report to the NSW Irrigators’ Council Limited.
SLR Consulting Australia Pty Ltd (2013) Wilpinjong Coal Mine Modification Noise and Blasting Impact Assessment.
South East Archaeology (2013) Wilpinjong Coal Mine, Central Tablelands of New South Wales –Modification: Aboriginal Cultural Heritage Assessment.

25
Streeting, M. and Hamilton, C. (1991) Economic analysis of the forests of south-eastern Australia. Prepared for the Resource Assessment Commission.
Todoroski Air Sciences (2013) Air Quality Impact Assessment Wilpinjong Coal Mine Modification.

ATTACHMENT 1
BENEFIT COST ANALYSIS
A1-1
Introduction to BCA Benefit Cost Analysis (BCA) has its theoretical underpinnings in neoclassical welfare economics. Applications in New South Wales (NSW) are guided by these theoretical foundations as well as the NSW Treasury (2007). BCA applications within the NSW environmental assessment framework are further guided by the NSW Department of Planning and Infrastucture Draft Guidelines for Economic Effects and Evaluation in EIA (James and Gillespie, 2002) and the NSW Government (2012) Draft Guidelines for the use of Cost Benefit Analysis in mining and coal seam gas proposals. BCA is concerned with a single objective of the Environmental Planning and Assessment Act, 1979 (EP&A Act) and governments i.e. economic efficiency. It provides a comparison of the present value of aggregate benefits to society, as a result of a project, policy or program, with the present value of the aggregate costs. These costs and benefits are defined and valued based on the microeconomic underpinnings of BCA. In particular, it is the values held by individuals in the society that are relevant, including both financial and non-financial values. Provided the present value of aggregate benefits to society exceed the present value of aggregate costs (i.e. a net present value of greater than zero), the project is considered to improve the well-being of society and hence is desirable from an economic efficiency perspective.
While BCA can provide qualitative and quantitative information on how costs and benefits are distributed, welfare economics and BCA are explicitly neutral on intra and intergenerational distribution of costs and benefits. There is no welfare criterion in economics for determining what constitutes a fair and equitable distribution of costs and benefits. Judgements about equity are subjective are therefore left to decision-makers. Similarly BCA does not address other objectives of the EP&A Act and governments. Decision-makers therefore need to consider the economic efficiency implications of a project, as indicated by BCA, alongside the performance of a project in meeting other conflicting goals and objectives of the EP&A Act and government. Definition of Society BCA includes the consideration of costs and benefits to all members of society i.e. consumers, producers and the broader society as represented by the government. As a tool of investment appraisal for the public sector, BCA can potentially be applied across different definitions of society such as a local area, state, nation or the world. However, most applications of BCA are performed at the national level. This national focus extends the analysis beyond that which is strictly relevant to a NSW government planning authority. However, the interconnected nature of the Australian economy and society creates significant spill-overs between States. These include transfers between States associated with the tax system and the movement of resources over state boundaries. Nevertheless, “where major impacts spill over national borders, then BCA should be undertaken from the global as well as the national perspective” (Boardman et al., 2001). For mining projects, impacts that spill over national borders include greenhouse gas costs and benefits to foreign owners. BCA at a sub-national perspective is not recommended as it results in a range of costs and benefits from a project being excluded, making BCA a less valuable tool for decision-makers (Boardman et al., 2001). BCAs of mining projects are therefore often undertaken from a global perspective i.e. including all the costs and benefits of a project, no matter who they accrue to, and then truncated to assess whether there are net benefits to Australia. A consideration of the distribution of costs and benefits can then be undertaken to identify the benefits and costs that accrue to NSW and other regions.
A1-2
However, a project is considered to improve the well-being of society if it results in net benefits to the nation, even if it results in net costs to the local area. Definition of the Project Scope The definition of the project for which approval is being sought has important implications for the identification of the costs and benefits of a project. Even when a BCA is undertaken from a global perspective, and includes costs and benefits of a project that accrue outside the national border, only the costs and benefits associated with the defined project are relevant. For coal mining projects, typically only the costs and benefits from mining the coal and delivering it to Port or domestic users, are relevant. Coal is an intermediate good i.e. it is an input to other production processes such as production of electricity and steel making. However, these other production processes themselves require approval and, in BCA, would be assessed as separate projects. Net Production Benefits BCA of mining proposals invariably involves a trade-off between: • the net production benefits of a project; and
• the environmental, social and cultural impacts (most of which are costs of mining but some of which may be benefits).
Net production benefits can be estimated based on market data on the projected financial5 value of coal less the capital and operating costs of projects, including opportunity costs of capital and land already in the ownership of mining companies. This is normally commercial in confidence data provided by the proponent. Production costs and benefits over time are discounted to a present value. Environmental, Social and Cultural Impacts The consideration of non-market impacts in BCA relies on the assessment of other experts contributing information on the biophysical impacts. The environmental impact assessment process results in detailed (non-monetary) consideration of the environmental, social and cultural impacts of a project and the proposed means of mitigating the impacts. At its simplest level, BCA may summarise the consequences of the environmental, social and cultural impacts of a project (based on the assessments in the relevant assessment document), for people’s well-being. These qualitatively described impacts can then be considered alongside the quantified net production benefits, providing important information to the decision-maker about the economic efficiency trade-offs involved with a project. These environmental, social and cultural impacts generally fall into three categories, those which: • can be readily identified, measured in physical terms and valued in monetary terms;
• can be identified and measured in physical terms but cannot easily be valued in money terms; and
• are known to exist but cannot be precisely identified, measured or value (NSW Treasury, 2007).
5 In limited cases the financial value may not reflect the economic value and therefore it is necessary to determine a shadow price for the coal.
A1-3
Impacts in the first and second category can potentially be valued in monetary terms using benefit transfer or, subject to available resources, primary non-market valuation methods. Benefit transfer involves using information on the physical magnitude of impacts and applying per unit value estimates obtained from non-market valuation studies undertaken in other contexts. Primary non-market valuation methods include choice modelling and the contingent valuation method where a sample of the community is surveyed to ascertain their willingness to pay to avoid a unit change in the level of a biophysical attribute. Other methods include the property valuation approach where changes in environmental quality may result in changes in property value. In attempting to value the impacts of a project on the well-being of people there is also the practical principle of materiality. Only those impacts which are likely to have a material bearing on the decision need to be considered in BCA (NSW Government, 2012). Where benefits and costs cannot be quantified these items should be included in the analysis in a qualitative manner (NSW Treasury, 2007). Consideration of Net Social Benefits The consideration of the net social benefits of a project combines the value estimate of net production benefits and the qualitative and quantitative estimates of the environmental, social and cultural impacts. In combining these considerations it should be noted that the estimates of net production benefits of a project generally includes accounting for costs aimed at mitigating, offsetting or compensating for the main environmental, social and cultural impacts. This includes the costs of purchasing properties adversely affected by noise and dust, providing mitigation measures for properties moderately impacted by noise and dust, the costs of providing ecological offsets and the cost of purchasing groundwater and surface water entitlements in the water market etc. Including these costs effectively internalises the respective and otherwise, non-monetary environmental, social and cultural costs. To avoid double counting of impacts, only residual impacts, after mitigation, offset and compensation, require additional consideration. Even when no quantitative valuation is undertaken of the environmental, social and cultural impacts of a project, the threshold value approach can be utilised to inform the decision-maker of the economic efficiency trade-offs. The estimated net production benefits of a project provides the threshold value that the non-quantified environmental, social and cultural impacts of a project (based on the assessments in the relevant assessment document), after mitigation, offset and compensation by the proponent, would need to exceed for them to outweigh the net production benefits. Where the main environmental, social and cultural impacts of a project are valued in monetary terms, stronger conclusions can be drawn about the economic efficiency of a project i.e. the well-being of society. Any other residual environmental, cultural or social costs that remain unquantified in the analysis6 can also be considered using the threshold value approach. The costs of these unquantified environmental, cultural and social impacts would need to be valued by society at greater than the quantified net social benefit of a project to make it questionable from an economic efficiency perspective.
6 Including potential impacts that were unknown at the time of the preparation of the relevant assessment document or arise during the Environmental Impact Assessment process due to differences in technical opinions.

A1-4
REFERENCES Boardman, A., Greenberg, D., Vining, A. and Weimer, D. (2001) Cost-Benefit Analysis: Concepts and Practice, Prentice Hall, USA.
James, D. and Gillespie, R. (2002) Draft Guideline for Economic Effects and Evaluation in EIA. Prepared for Planning NSW.
NSW Government (2012) Draft Guideline for the use of Cost Benefit Analysis in mining and coal seam gas proposals.
NSW Treasury (2007) NSW Government Guidelines for Economic Appraisal. Website: www.treasury.nsw.gov.au. Date Accessed: 7 February 2013.
ATTACHMENT 2
UNDERLYING ASSUMPTIONS AND INTERPRETATION OF INPUT-OUTPUT ANALYSIS AND MULTIPLIERS
A2-1
1. “The basic assumptions in input-output analysis include the following: • there is a fixed input structure in each industry, described by fixed technological
coefficients (evidence from comparisons between input-output tables for the same country over time have indicated that material input requirements tend to be stable and change slowly; however, requirements for primary factors of production, that is labour and capital, are probably less constant);
• all products of an industry are identical or are made in fixed proportions to each other;
• each industry exhibits constant returns to scale in production;
• unlimited labour and capital are available at fixed prices; that is, any change in the demand for productive factors will not induce any change in their cost (in reality, constraints such as limited skilled labour or investment funds lead to competition for resources among industries, which in turn raises the prices of these scarce factors of production and of industry output generally in the face of strong demand); and
• there are no other constraints, such as the balance of payments or the actions of government, on the response of each industry to a stimulus.
2. The multipliers therefore describe average effects, not marginal effects, and thus do not take
account of economies of scale, unused capacity or technological change. Generally, average effects are expected to be higher than the marginal effects.
3. The input-output tables underlying multiplier analysis only take account of one form of
interdependence, namely the sales and purchase links between industries. Other interdependence such as collective competition for factors of production, changes in commodity prices which induce producers and consumers to alter the mix of their purchases and other constraints which operate on the economy as a whole are not generally taken into account.
4. The combination of the assumptions used and the excluded interdependence means that
input-output multipliers are higher than would realistically be the case. In other words, they tend to overstate the potential impact of final demand stimulus. The overstatement is potentially more serious when large changes in demand and production are considered.
5. The multipliers also do not account for some important pre-existing conditions. This is especially
true of Type 2 multipliers in which employment generated and income earned induce further increases in demand. The implicit assumption is that those taken into employment were previously unemployed and were previously consuming nothing. In reality, however, not all 'new' employment would be drawn from the ranks of the unemployed; and to the extent that it was, those previously unemployed would presumably have consumed out of income support measures and personal savings. Employment, output and income responses are therefore overstated by the multipliers for these additional reasons.
6. The most appropriate interpretation of multipliers is that they provide a relative measure (to be
compared with other industries) of the interdependence between one industry and the rest of the economy which arises solely from purchases and sales of industry output based on estimates of transactions occurring over a (recent) historical period. Progressive departure from these conditions would progressively reduce the precision of multipliers as predictive devices” (Australian Bureau of Statistics [ABS], 1995).
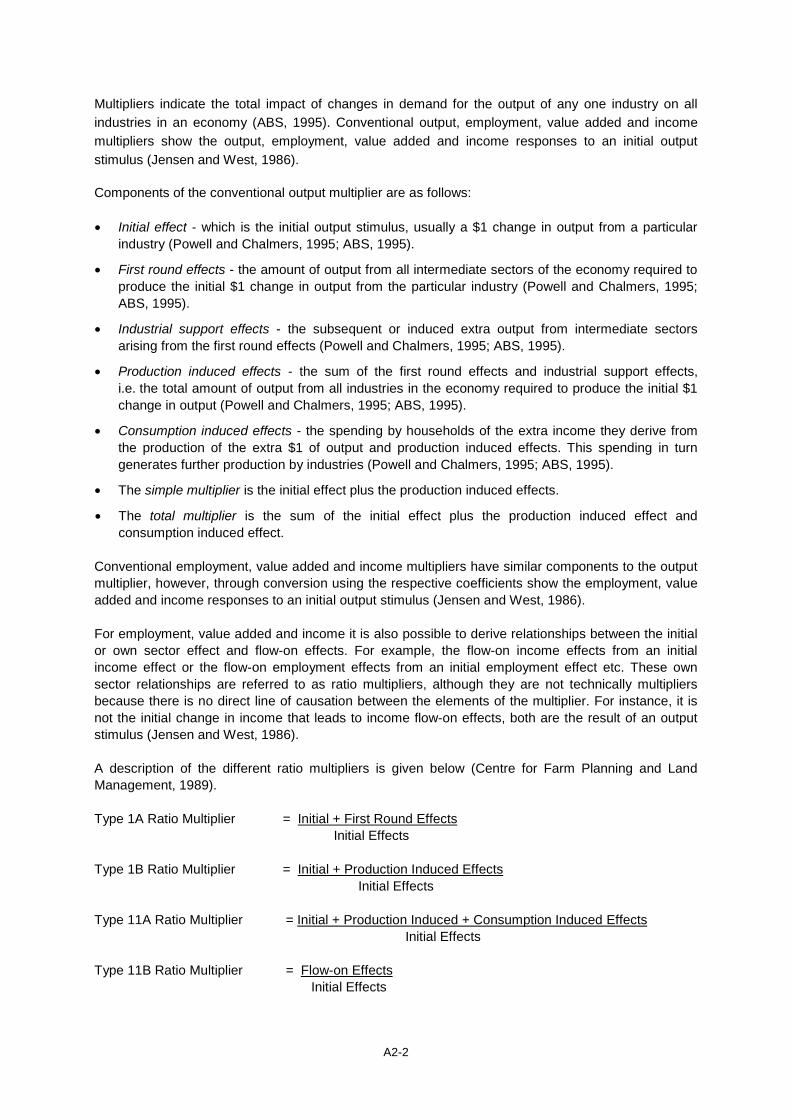
A2-2
Multipliers indicate the total impact of changes in demand for the output of any one industry on all industries in an economy (ABS, 1995). Conventional output, employment, value added and income multipliers show the output, employment, value added and income responses to an initial output stimulus (Jensen and West, 1986). Components of the conventional output multiplier are as follows: • Initial effect - which is the initial output stimulus, usually a $1 change in output from a particular
industry (Powell and Chalmers, 1995; ABS, 1995).
• First round effects - the amount of output from all intermediate sectors of the economy required to produce the initial $1 change in output from the particular industry (Powell and Chalmers, 1995; ABS, 1995).
• Industrial support effects - the subsequent or induced extra output from intermediate sectors arising from the first round effects (Powell and Chalmers, 1995; ABS, 1995).
• Production induced effects - the sum of the first round effects and industrial support effects, i.e. the total amount of output from all industries in the economy required to produce the initial $1 change in output (Powell and Chalmers, 1995; ABS, 1995).
• Consumption induced effects - the spending by households of the extra income they derive from the production of the extra $1 of output and production induced effects. This spending in turn generates further production by industries (Powell and Chalmers, 1995; ABS, 1995).
• The simple multiplier is the initial effect plus the production induced effects.
• The total multiplier is the sum of the initial effect plus the production induced effect and consumption induced effect.
Conventional employment, value added and income multipliers have similar components to the output multiplier, however, through conversion using the respective coefficients show the employment, value added and income responses to an initial output stimulus (Jensen and West, 1986). For employment, value added and income it is also possible to derive relationships between the initial or own sector effect and flow-on effects. For example, the flow-on income effects from an initial income effect or the flow-on employment effects from an initial employment effect etc. These own sector relationships are referred to as ratio multipliers, although they are not technically multipliers because there is no direct line of causation between the elements of the multiplier. For instance, it is not the initial change in income that leads to income flow-on effects, both are the result of an output stimulus (Jensen and West, 1986). A description of the different ratio multipliers is given below (Centre for Farm Planning and Land Management, 1989). Type 1A Ratio Multiplier = Initial + First Round Effects Initial Effects Type 1B Ratio Multiplier = Initial + Production Induced Effects Initial Effects Type 11A Ratio Multiplier = Initial + Production Induced + Consumption Induced Effects Initial Effects Type 11B Ratio Multiplier = Flow-on Effects Initial Effects

A2-3
REFERENCES
Australian Bureau of Statistics (1995) Information Paper Australian National Accounts Introduction to Input-Output Multipliers. Cat. No. 5246.0.
Centre for Farm Planning and Land Management (1989) Consultants report to State plantations impact study. CFPLM, University of Melbourne.
Jensen, R. and West, G. (1986) Input-output for Practitioners: Theory and Applications. Prepared for Department of Local Government and Administrative Services, Local Government and Regional Development Division, Australian Government Publishing Service.
Powell, R. and Chalmers, L. (1995) The Regional Economic Impact of Gibraltar Range and Dorrigo National Park. A Report for the NSW National Parks and Wildlife Service.
ATTACHMENT 3
THE GRIT SYSTEM FOR GENERATING INPUT-OUTPUT TABLES

A3-1
“The Generation of Regional Input-Output Tables (GRIT) system was designed to: • combine the benefits of survey based tables (accuracy and understanding of the economic
structure) with those of non-survey tables (speed and low cost);
• enable the tables to be compiled from other recently compiled tables;
• allow tables to be constructed for any region for which certain minimum amounts of data were available;
• develop regional tables from national tables using available region-specific data;
• produce tables consistent with the national tables in terms of sector classification and accounting conventions;
• proceed in a number of clearly defined stages; and
• provide for the possibility of ready updates of the tables. The resultant GRIT procedure has a number of well-defined steps. Of particular significance are those that involve the analyst incorporating region-specific data and information specific to the objectives of the study. The analyst has to be satisfied about the accuracy of the information used for the important sectors. The method allows the analyst to allocate available research resources to improving the data for those sectors of the economy that are most important for the study. It also means that the method should be used by an analyst who is familiar with the economy being modelled, or at least someone with that familiarity should be consulted. An important characteristic of GRIT-produced tables relates to their accuracy. In the past, survey-based tables involved gathering data for every cell in the table, thereby building up a table with considerable accuracy. A fundamental principle of the GRIT method is that not all cells in the table are equally important. Some are not important because they are of very small value and, therefore, have no possibility of having a significant effect on the estimates of multipliers and economic impacts. Others are not important because of the lack of linkages that relate to the particular sectors that are being studied. Therefore, the GRIT procedure involves determining those sectors and, in some cases, cells that are of particular significance for the analysis. These represent the main targets for the allocation of research resources in data gathering. For the remainder of the table, the aim is for it to be 'holistically' accurate (Jensen, 1980). That means a generally accurate representation of the economy is provided by the table, but does not guarantee the accuracy of any particular cell. A summary of the steps involved in the GRIT process is shown in Table A3.1” (Powell and Chalmers, 1995).
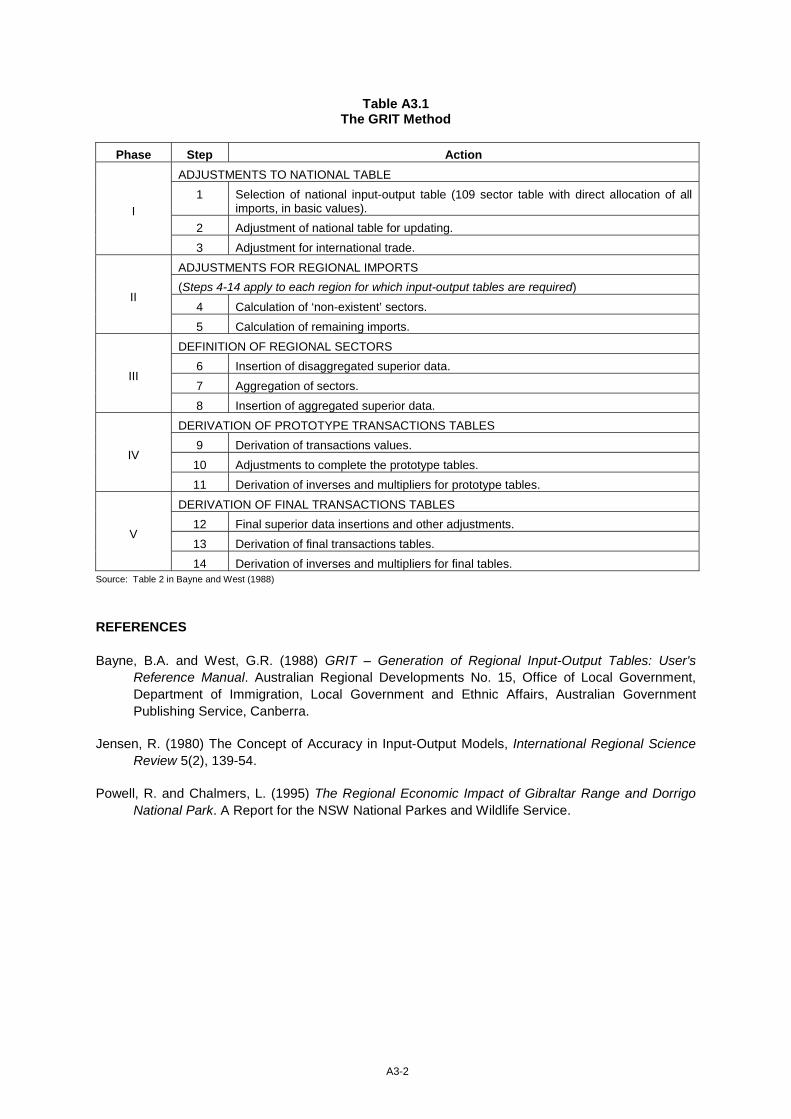
A3-2
Table A3.1 The GRIT Method
Phase Step Action
I
ADJUSTMENTS TO NATIONAL TABLE
1 Selection of national input-output table (109 sector table with direct allocation of all imports, in basic values).
2 Adjustment of national table for updating.
3 Adjustment for international trade.
II
ADJUSTMENTS FOR REGIONAL IMPORTS
(Steps 4-14 apply to each region for which input-output tables are required)
4 Calculation of ‘non-existent’ sectors.
5 Calculation of remaining imports.
III
DEFINITION OF REGIONAL SECTORS
6 Insertion of disaggregated superior data.
7 Aggregation of sectors.
8 Insertion of aggregated superior data.
IV
DERIVATION OF PROTOTYPE TRANSACTIONS TABLES
9 Derivation of transactions values.
10 Adjustments to complete the prototype tables.
11 Derivation of inverses and multipliers for prototype tables.
V
DERIVATION OF FINAL TRANSACTIONS TABLES
12 Final superior data insertions and other adjustments.
13 Derivation of final transactions tables.
14 Derivation of inverses and multipliers for final tables. Source: Table 2 in Bayne and West (1988)
REFERENCES Bayne, B.A. and West, G.R. (1988) GRIT – Generation of Regional Input-Output Tables: User's
Reference Manual. Australian Regional Developments No. 15, Office of Local Government, Department of Immigration, Local Government and Ethnic Affairs, Australian Government Publishing Service, Canberra.
Jensen, R. (1980) The Concept of Accuracy in Input-Output Models, International Regional Science Review 5(2), 139-54.
Powell, R. and Chalmers, L. (1995) The Regional Economic Impact of Gibraltar Range and Dorrigo National Park. A Report for the NSW National Parkes and Wildlife Service.