appendix - american economic association
TRANSCRIPT
Appendix
A note about the appendix: The difference between the main figures and the appendix is that the main figures use national-level cutoffs for the state-level analysis, while the appendix figures use state-level cutoffs for the state-level analysis. Figure 1 in the text uses national-level data and does not break into states, and hence does not have that complication. So the appendix figures begin with Figure A2.
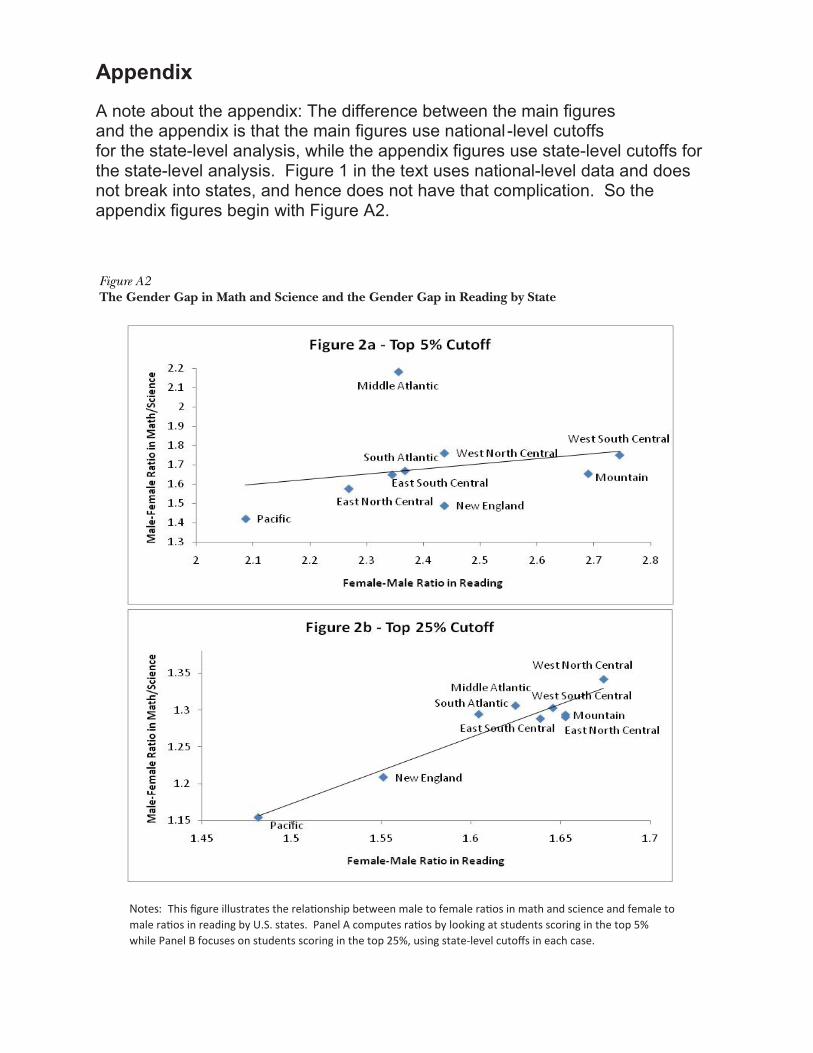
Notes: This figure illustrates the onship between male to fem os in math and science and female to m os in reading by U.S. states. Panel A compute os by looking at students scoring in the top 5% while Panel B focuses on students scoring in the top 25%, using state-level cutoffs in each case.
Figure A2The Gender Gap in Math and Science and the Gender Gap in Reading by State
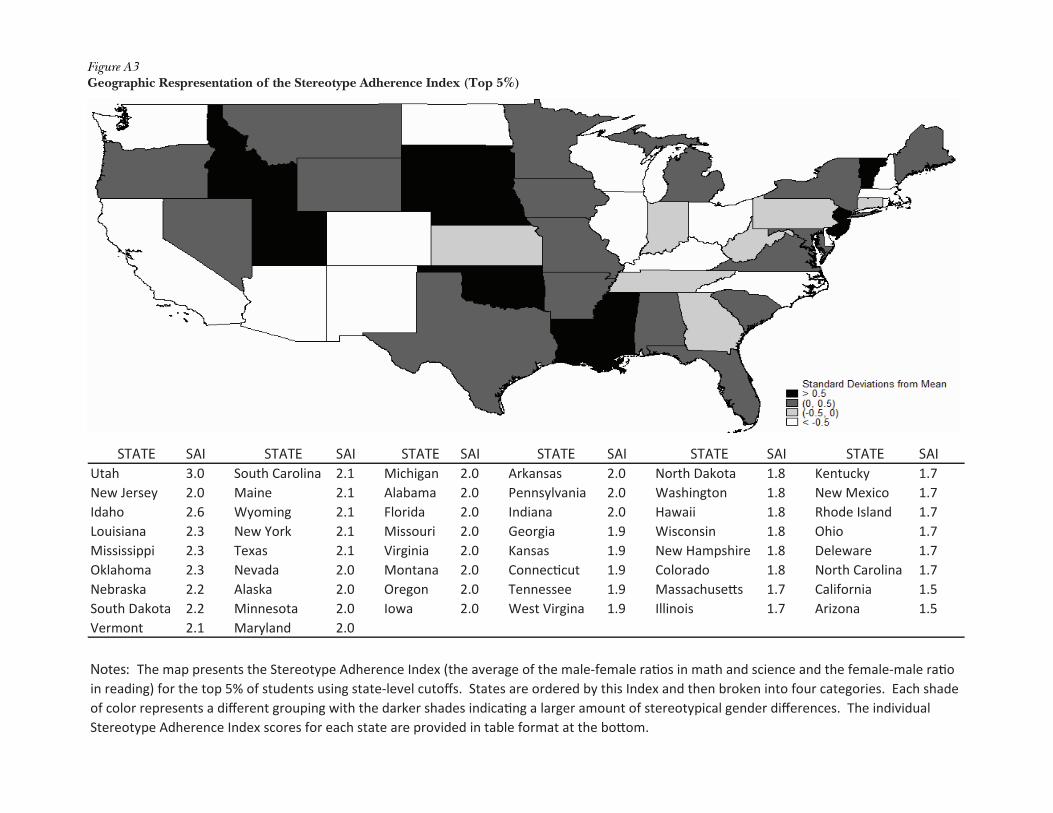
STATE SAI STATE SAI STATE SAI STATE SAI STATE SAI STATE SAIUtah 3.0 South Carolina 2.1 Michigan 2.0 Arkansas 2.0 North Dakota 1.8 Kentucky 1.7New Jersey 2.0 Maine 2.1 Alabama 2.0 Pennsylvania 2.0 Washington 1.8 New Mexico 1.7Idaho 2.6 Wyoming 2.1 Florida 2.0 Indiana 2.0 Hawaii 1.8 Rhode Island 1.7Louisiana 2.3 New York 2.1 Missouri 2.0 Georgia 1.9 Wisconsin 1.8 Ohio 1.7Mississippi 2.3 Texas 2.1 Virginia 2.0 Kansas 1.9 New Hampshire 1.8 Deleware 1.7Oklahoma 2.3 Nevada 2.0 Montana 2.0 Connecticut 1.9 Colorado 1.8 North Carolina 1.7Nebraska 2.2 Alaska 2.0 Oregon 2.0 Tennessee 1.9 Massachusetts 1.7 California 1.5South Dakota 2.2 Minnesota 2.0 Iowa 2.0 West Virgina 1.9 Illinois 1.7 Arizona 1.5Vermont 2.1 Maryland 2.0
Notes: The map presents the Stereotype Adherence Index (the average of the male-female ratios in math and science and the female-male ratio in reading) for the top 5% of students using state-level cutoffs. States are ordered by this Index and then broken into four categories. Each shade of color represents a different grouping with the darker shades indicating a larger amount of stereotypical gender differences. The individual Stereotype Adherence Index scores for each state are provided in table format at the bottom.
Figure A3Geographic Respresentation of the Stereotype Adherence Index (Top 5%)
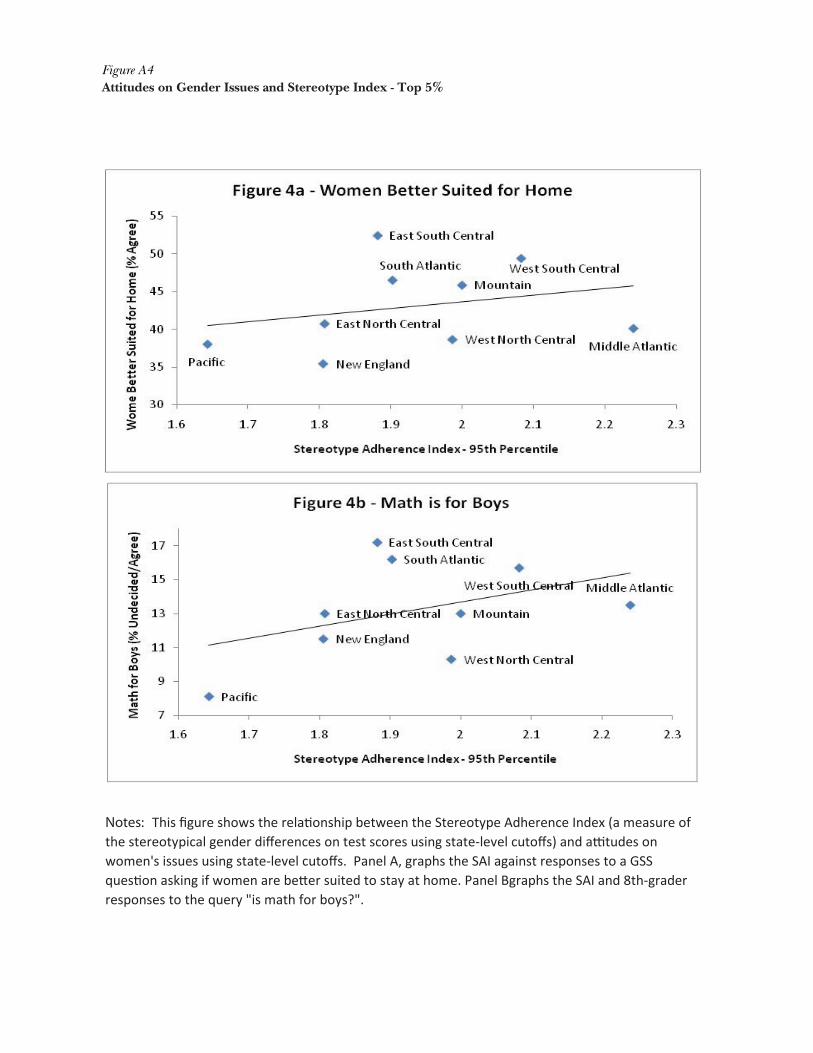
Notes: This figure shows the relationship between the Stereotype Adherence Index (a measure of the stereotypical gender differences on test scores using state-level cutoffs) and attitudes on women's issues using state-level cutoffs. Panel A, graphs the SAI against responses to a GSS question asking if women are better suited to stay at home. Panel Bgraphs the SAI and 8th-grader responses to the query "is math for boys?".
Figure A4Attitudes on Gender Issues and Stereotype Index - Top 5%
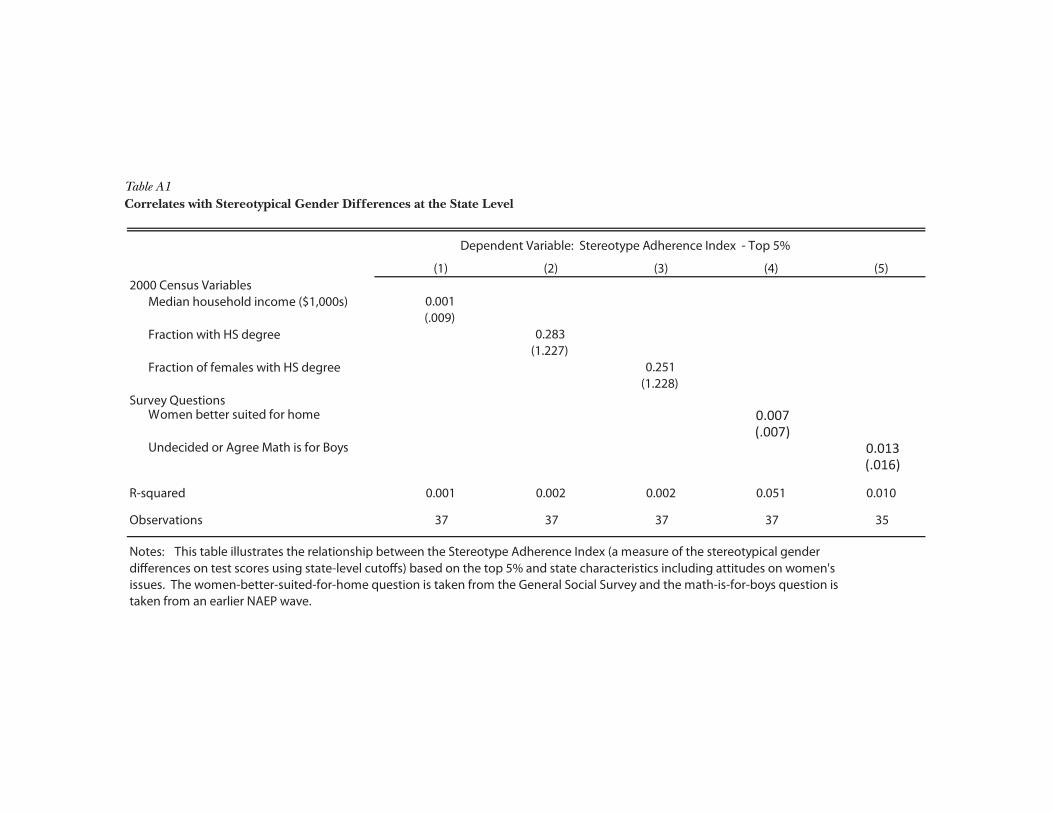
(1) (2) (3) (4) (5)2000 Census Variables
Median household income ($1,000s) 0.001(.009)
Fraction with HS degree 0.283(1.227)
Fraction of females with HS degree 0.251(1.228)
Survey QuestionsWomen better suited for home 0.007
(.007)Undecided or Agree Math is for Boys 0.013
(.016)
R-squared 0.001 0.002 0.002 0.051 0.010
Observations 37 37 37 37 35
Dependent Variable: Stereotype Adherence Index - Top 5%
Notes: This table illustrates the relationship between the Stereotype Adherence Index (a measure of the stereotypical gender di erences on test scores using state-level cuto s) based on the top 5% and state characteristics including attitudes on women's issues. The women-better-suited-for-home question is taken from the General Social Survey and the math-is-for-boys question is taken from an earlier NAEP wave.
Table A1Correlates with Stereotypical Gender Differences at the State Level