ecommerce trends report 2021 - paypalobjects.com
TRANSCRIPT
August 2021
PayPal Australia
eCommerce Trends Report 2021
Trend 1: Buy Now Pay LaterTrend 2: Payments & TrustTrend 3: Online Discounts & Sales
©2021 PayPal Australia
Summary
2
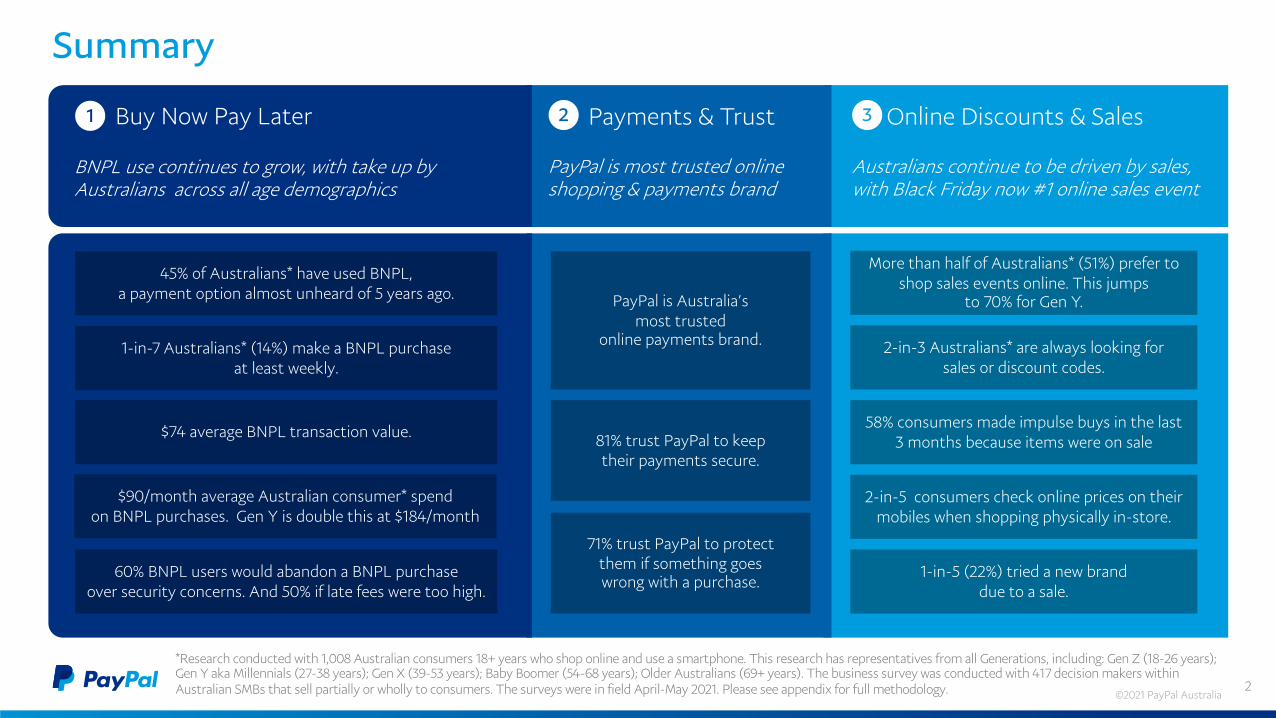
*Research conducted with 1,008 Australian consumers 18+ years who shop online and use a smartphone. This research has representatives from all Generations, including: Gen Z (18-26 years); Gen Y aka Millennials (27-38 years); Gen X (39-53 years); Baby Boomer (54-68 years); Older Australians (69+ years). The business survey was conducted with 417 decision makers within Australian SMBs that sell partially or wholly to consumers. The surveys were in field April-May 2021. Please see appendix for full methodology. ©2021 PayPal Australia
More than half of Australians* (51%) prefer to shop sales events online. This jumps
to 70% for Gen Y.
2-in-3 Australians* are always looking for sales or discount codes.
58% consumers made impulse buys in the last 3 months because items were on sale
2-in-5 consumers check online prices on their mobiles when shopping physically in-store.
1-in-5 (22%) tried a new brand due to a sale.
Buy Now Pay Later1
45% of Australians* have used BNPL,a payment option almost unheard of 5 years ago.
1-in-7 Australians* (14%) make a BNPL purchase at least weekly.
$90/month average Australian consumer* spend on BNPL purchases. Gen Y is double this at $184/month
$74 average BNPL transaction value.
60% BNPL users would abandon a BNPL purchase over security concerns. And 50% if late fees were too high.
Payments & Trust Online Discounts & Sales2 3
BNPL use continues to grow, with take up by Australians across all age demographics
PayPal is most trusted online shopping & payments brand
Australians continue to be driven by sales, with Black Friday now #1 online sales event
PayPal is Australia’s most trusted
online payments brand.
71% trust PayPal to protect them if something goes wrong with a purchase.
81% trust PayPal to keep their payments secure.
3
Trend 1Buy Now Pay Later
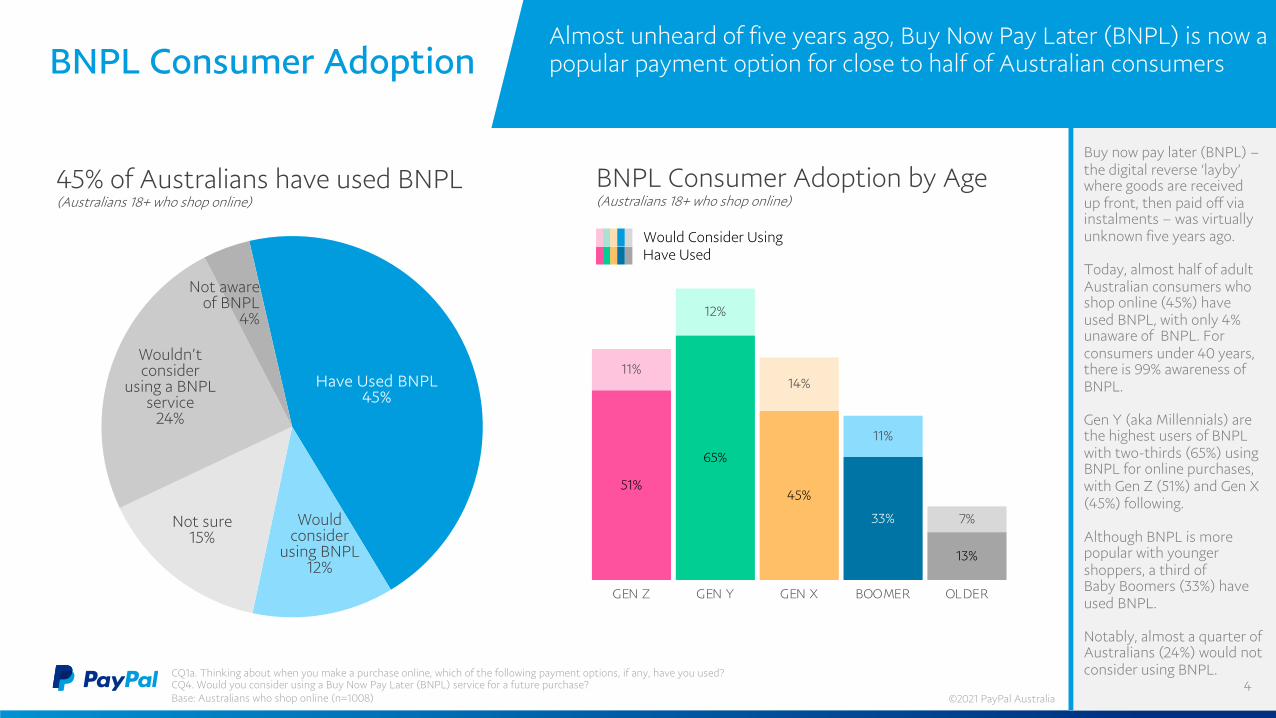
BNPL Consumer Adoption by Age(Australians 18+ who shop online)
45% of Australians have used BNPL(Australians 18+ who shop online)
Have Used BNPL45%
Would consider
using BNPL12%
Not sure15%
Wouldn’t consider
using a BNPL service
24%
Not aware of BNPL
4%
Buy now pay later (BNPL) –the digital reverse ‘layby’ where goods are received up front, then paid off via instalments – was virtually unknown five years ago.
Today, almost half of adult Australian consumers who shop online (45%) have used BNPL, with only 4% unaware of BNPL. For consumers under 40 years, there is 99% awareness of BNPL.
Gen Y (aka Millennials) are the highest users of BNPL with two-thirds (65%) using BNPL for online purchases, with Gen Z (51%) and Gen X (45%) following.
Although BNPL is more popular with younger shoppers, a third of Baby Boomers (33%) have used BNPL.
Notably, almost a quarter of Australians (24%) would not consider using BNPL.
4
Almost unheard of five years ago, Buy Now Pay Later (BNPL) is now a popular payment option for close to half of Australian consumersBNPL Consumer Adoption
CQ1a. Thinking about when you make a purchase online, which of the following payment options, if any, have you used?CQ4. Would you consider using a Buy Now Pay Later (BNPL) service for a future purchase?Base: Australians who shop online (n=1008)
51%
65%
45%
33%
13%
11%
12%
14%
11%
7%
GEN Z GEN Y GEN X BOOMER OLDER
Would Consider UsingHave Used
©2021 PayPal Australia
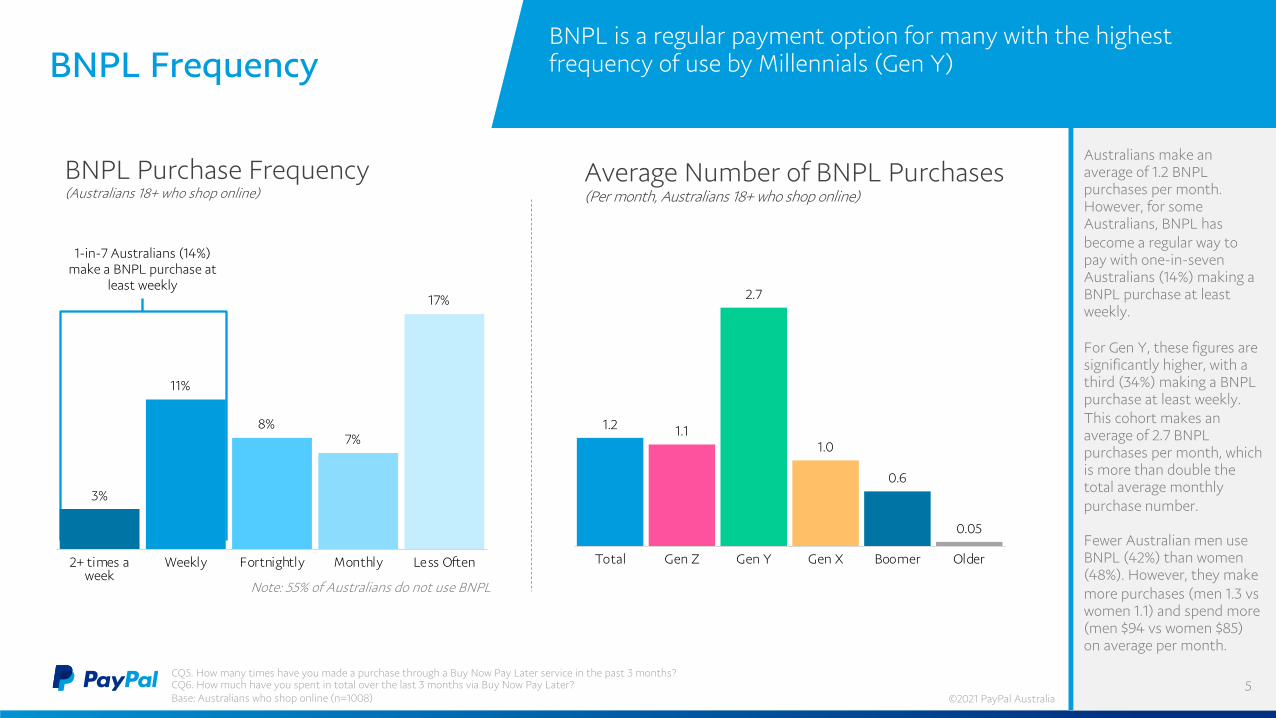
Australians make an average of 1.2 BNPL purchases per month. However, for some Australians, BNPL has become a regular way to pay with one-in-seven Australians (14%) making a BNPL purchase at least weekly.
For Gen Y, these figures are significantly higher, with a third (34%) making a BNPL purchase at least weekly. This cohort makes an average of 2.7 BNPL purchases per month, which is more than double the total average monthly purchase number.
Fewer Australian men use BNPL (42%) than women (48%). However, they make more purchases (men 1.3 vs women 1.1) and spend more (men $94 vs women $85) on average per month.
5
BNPL is a regular payment option for many with the highest frequency of use by Millennials (Gen Y)BNPL Frequency
CQ5. How many times have you made a purchase through a Buy Now Pay Later service in the past 3 months?CQ6. How much have you spent in total over the last 3 months via Buy Now Pay Later?Base: Australians who shop online (n=1008)
Note: 55% of Australians do not use BNPL
BNPL Purchase Frequency(Australians 18+ who shop online)
3%
11%
8% 7%
17%
2+ times aweek
Weekly Fortnightly Monthly Less Often
Average Number of BNPL Purchases(Per month, Australians 18+ who shop online)
1.2 1.1
2.7
1.0
0.6
0.05
Total Gen Z Gen Y Gen X Boomer Older
1-in-7 Australians (14%) make a BNPL purchase at
least weekly
©2021 PayPal Australia
BNPL Purchase Categories(% Have Purchased, Australians 18+ who shop online)
11%
15%
36%39%
50%37%
28%8%Physical Products
15%32%
12%8%
1%Services
12%24%
7%5%
1%Experiences (e.g. events)
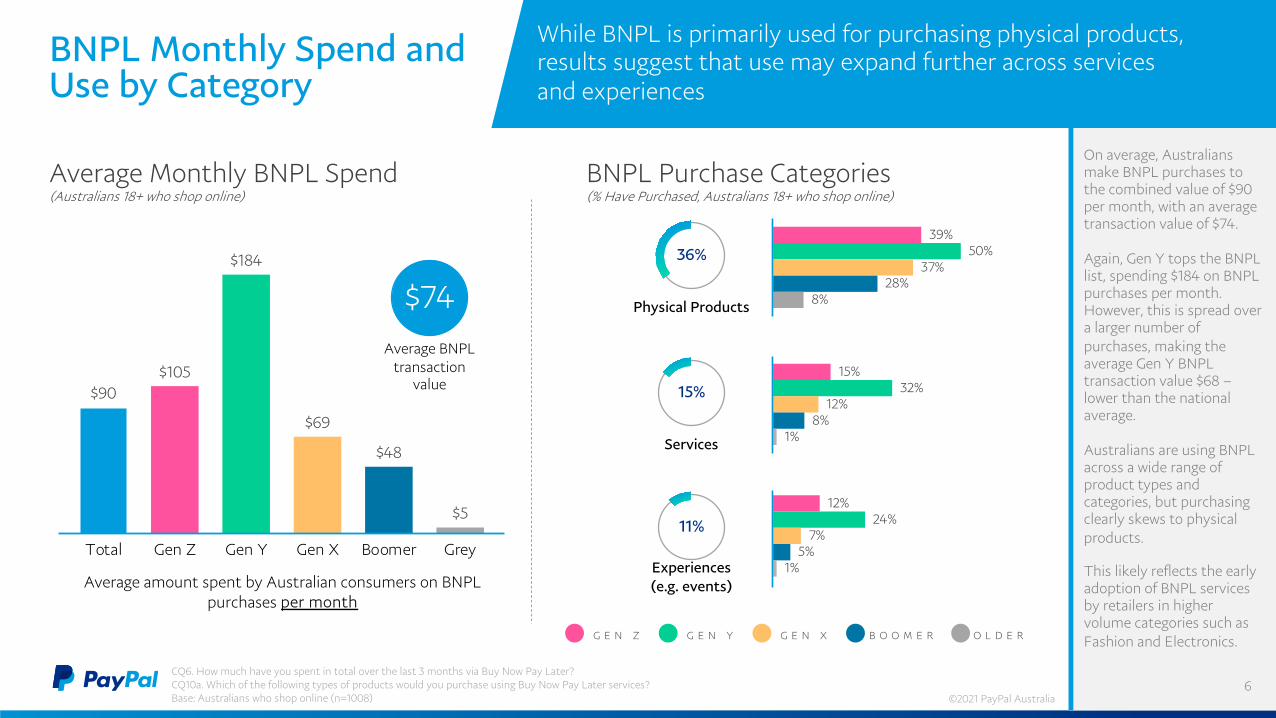
On average, Australians make BNPL purchases to the combined value of $90 per month, with an average transaction value of $74.
Again, Gen Y tops the BNPL list, spending $184 on BNPL purchases per month. However, this is spread over a larger number of purchases, making the average Gen Y BNPL transaction value $68 –lower than the national average.
Australians are using BNPL across a wide range of product types and categories, but purchasing clearly skews to physical products.
This likely reflects the early adoption of BNPL services by retailers in higher volume categories such as Fashion and Electronics.
6
While BNPL is primarily used for purchasing physical products, results suggest that use may expand further across services and experiences
CQ6. How much have you spent in total over the last 3 months via Buy Now Pay Later?CQ10a. Which of the following types of products would you purchase using Buy Now Pay Later services?Base: Australians who shop online (n=1008)
BNPL Monthly Spend and Use by Category
$90 $105
$184
$69
$48
$5
Total Gen Z Gen Y Gen X Boomer Grey
Average amount spent by Australian consumers on BNPL purchases per month
Average Monthly BNPL Spend(Australians 18+ who shop online)
G E N Z G E N Y G E N X B O O M E R O L D E R
Average BNPL transaction
value
$74
©2021 PayPal Australia
28%
43%
27%
37%
30%
34%
37%
23%
27%
44%
23%
32%
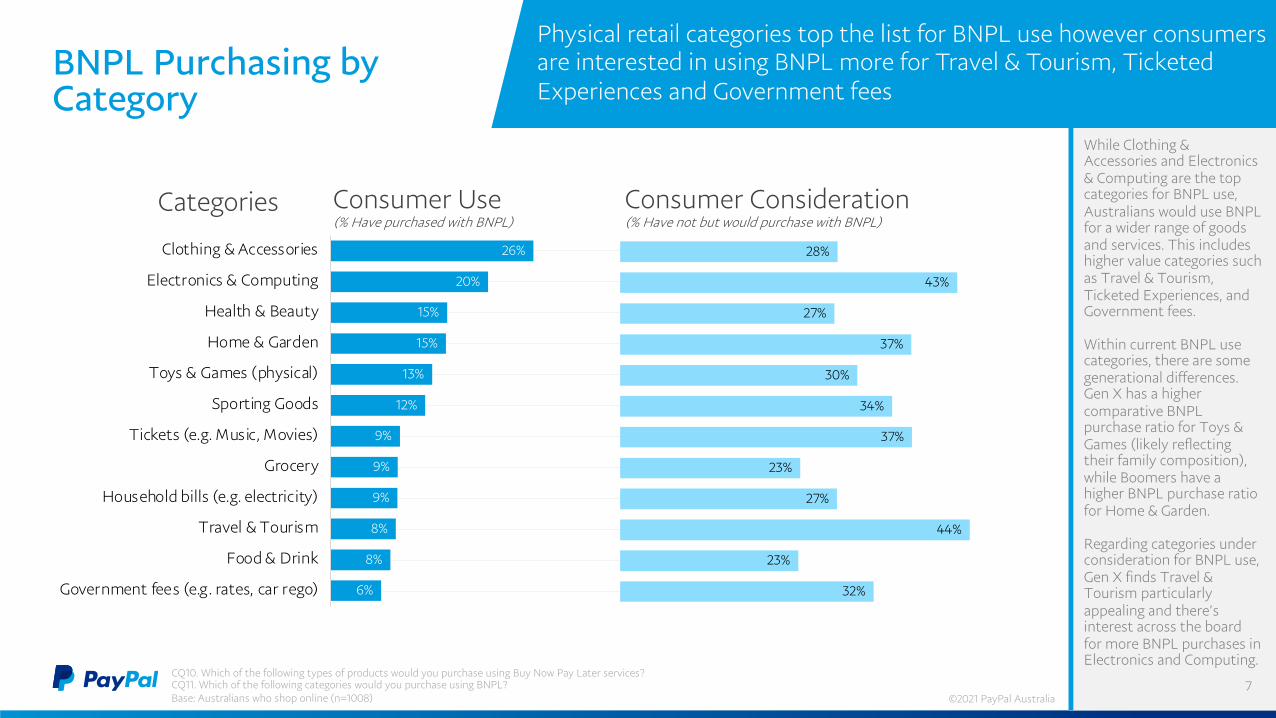
While Clothing & Accessories and Electronics & Computing are the top categories for BNPL use, Australians would use BNPL for a wider range of goods and services. This includes higher value categories such as Travel & Tourism, Ticketed Experiences, and Government fees.
Within current BNPL use categories, there are some generational differences. Gen X has a higher comparative BNPL purchase ratio for Toys & Games (likely reflecting their family composition), while Boomers have a higher BNPL purchase ratio for Home & Garden.
Regarding categories under consideration for BNPL use, Gen X finds Travel & Tourism particularly appealing and there’s interest across the board for more BNPL purchases in Electronics and Computing.
BNPL Purchasing by Category
7
Physical retail categories top the list for BNPL use however consumers are interested in using BNPL more for Travel & Tourism, Ticketed Experiences and Government fees
CQ10. Which of the following types of products would you purchase using Buy Now Pay Later services? CQ11. Which of the following categories would you purchase using BNPL?Base: Australians who shop online (n=1008)
26%
20%
15%
15%
13%
12%
9%
9%
9%
8%
8%
6%
Clothing & Accessories
Electronics & Computing
Health & Beauty
Home & Garden
Toys & Games (physical)
Sporting Goods
Tickets (e.g. Music, Movies)
Grocery
Household bills (e.g. electricity)
Travel & Tourism
Food & Drink
Government fees (e.g. rates, car rego)
Categories Consumer Use (% Have purchased with BNPL)
Consumer Consideration (% Have not but would purchase with BNPL)
©2021 PayPal Australia
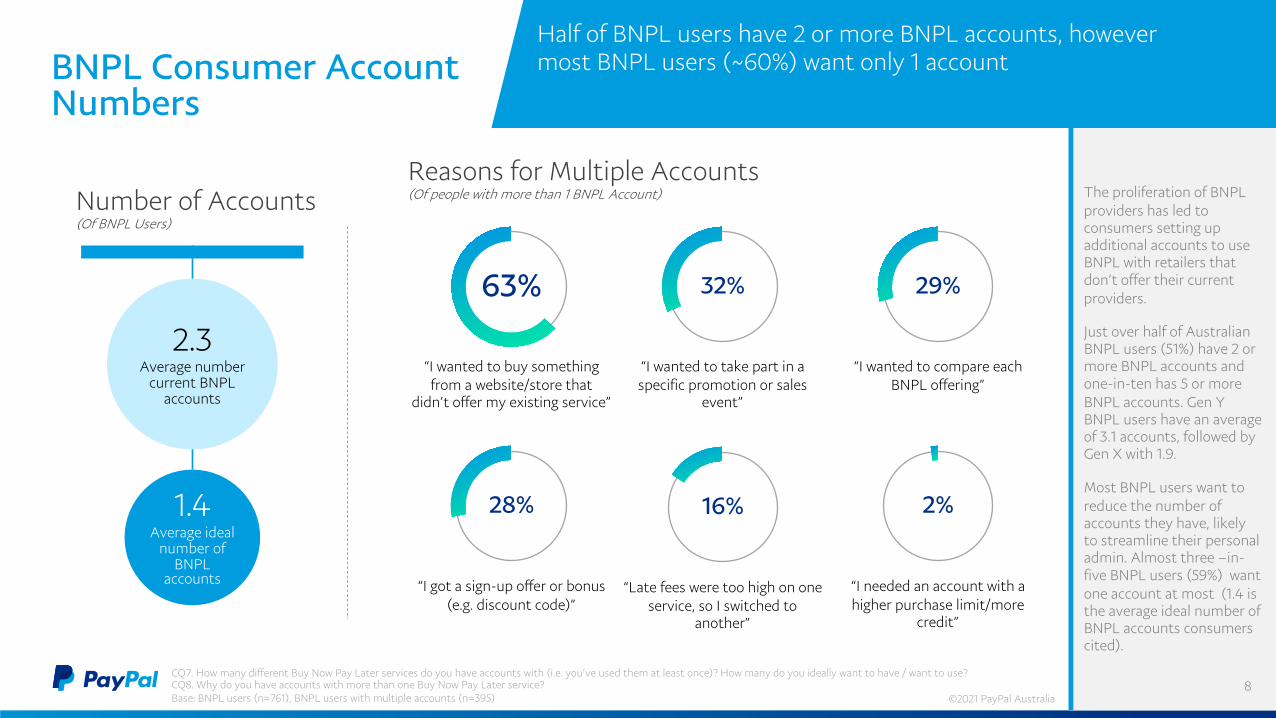
The proliferation of BNPL providers has led to consumers setting up additional accounts to use BNPL with retailers that don’t offer their current providers.
Just over half of Australian BNPL users (51%) have 2 or more BNPL accounts and one-in-ten has 5 or more BNPL accounts. Gen Y BNPL users have an average of 3.1 accounts, followed by Gen X with 1.9.
Most BNPL users want to reduce the number of accounts they have, likely to streamline their personal admin. Almost three –in-five BNPL users (59%) want one account at most (1.4 is the average ideal number of BNPL accounts consumers cited).
8
BNPL Consumer Account Numbers
63%
“I wanted to buy something from a website/store that
didn’t offer my existing service”
32%
“I wanted to take part in a specific promotion or sales
event”
28%
“I got a sign-up offer or bonus (e.g. discount code)”
Reasons for Multiple Accounts(Of people with more than 1 BNPL Account)Number of Accounts
(Of BNPL Users)
CQ7. How many different Buy Now Pay Later services do you have accounts with (i.e. you’ve used them at least once)? How many do you ideally want to have / want to use?CQ8. Why do you have accounts with more than one Buy Now Pay Later service?Base: BNPL users (n=761), BNPL users with multiple accounts (n=395)
Half of BNPL users have 2 or more BNPL accounts, however most BNPL users (~60%) want only 1 account
“I wanted to compare each BNPL offering”
29%
16%
“Late fees were too high on one service, so I switched to
another”
2%
“I needed an account with a higher purchase limit/more
credit”
2.3Average number
current BNPL accounts
©2021 PayPal Australia
1.4Average ideal
number of BNPL
accounts
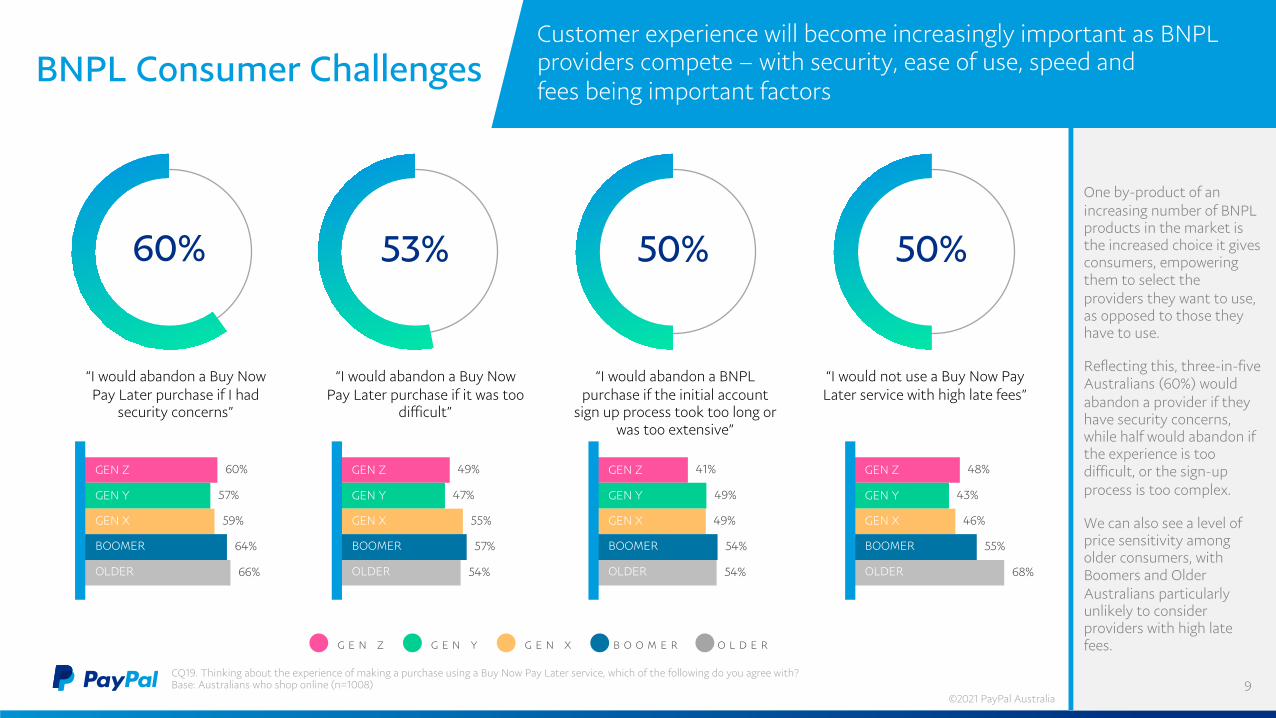
One by-product of an increasing number of BNPL products in the market is the increased choice it gives consumers, empowering them to select the providers they want to use, as opposed to those they have to use.
Reflecting this, three-in-five Australians (60%) would abandon a provider if they have security concerns, while half would abandon if the experience is too difficult, or the sign-up process is too complex.
We can also see a level of price sensitivity among older consumers, with Boomers and Older Australians particularly unlikely to consider providers with high late fees.
9
BNPL Consumer Challenges
G E N Z G E N Y G E N X B O O M E R O L D E R
48%
43%
46%
55%
68%
“I would not use a Buy Now Pay Later service with high late fees”
41%
49%
49%
54%
54%
“I would abandon a BNPL purchase if the initial account
sign up process took too long or was too extensive”
49%
47%
55%
57%
54%
“I would abandon a Buy Now Pay Later purchase if it was too
difficult”
CQ19. Thinking about the experience of making a purchase using a Buy Now Pay Later service, which of the following do you agree with?Base: Australians who shop online (n=1008)
Customer experience will become increasingly important as BNPL providers compete – with security, ease of use, speed andfees being important factors
60%
57%
59%
64%
66%
“I would abandon a Buy Now Pay Later purchase if I had
security concerns”
GEN Z
GEN Y
GEN X
BOOMER
OLDER
GEN Z
GEN Y
GEN X
BOOMER
OLDER
GEN Z
GEN Y
GEN X
BOOMER
OLDER
GEN Z
GEN Y
GEN X
BOOMER
OLDER
50%50%53%60%
©2021 PayPal Australia
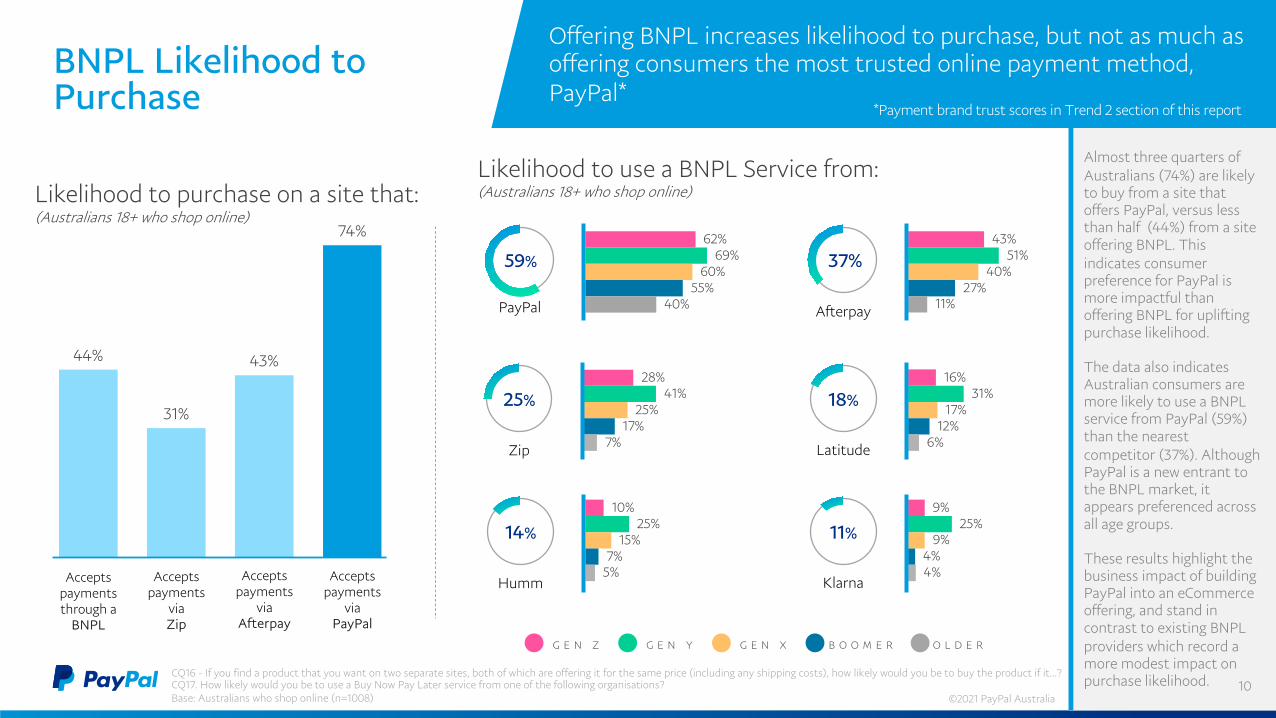
Almost three quarters of Australians (74%) are likely to buy from a site that offers PayPal, versus less than half (44%) from a site offering BNPL. This indicates consumer preference for PayPal is more impactful than offering BNPL for uplifting purchase likelihood.
The data also indicates Australian consumers are more likely to use a BNPL service from PayPal (59%) than the nearest competitor (37%). Although PayPal is a new entrant to the BNPL market, it appears preferenced across all age groups.
These results highlight the business impact of building PayPal into an eCommerce offering, and stand in contrast to existing BNPL providers which record a more modest impact on purchase likelihood. 10
BNPL Likelihood to Purchase
Offering BNPL increases likelihood to purchase, but not as much as offering consumers the most trusted online payment method, PayPal*
74%
43%
31%
44%
Accepts payments
via PayPal
Accepts payments
via Afterpay
Accepts payments
via Zip
Accepts payments through a
BNPL
Likelihood to purchase on a site that:(Australians 18+ who shop online)
25%
28%41%
25%17%
7%Zip
59%62%
69%60%
55%40%PayPal
14%
10%25%
15%7%
5%Humm
37%43%
51%40%
27%11%Afterpay
11%
9%25%
9%4%4%
Klarna
18%
16%31%
17%12%
6%Latitude
Likelihood to use a BNPL Service from:(Australians 18+ who shop online)
G E N Z G E N Y G E N X B O O M E R O L D E R
CQ16 - If you find a product that you want on two separate sites, both of which are offering it for the same price (including any shipping costs), how likely would you be to buy the product if it…? CQ17. How likely would you be to use a Buy Now Pay Later service from one of the following organisations? Base: Australians who shop online (n=1008)
*Payment brand trust scores in Trend 2 section of this report
©2021 PayPal Australia
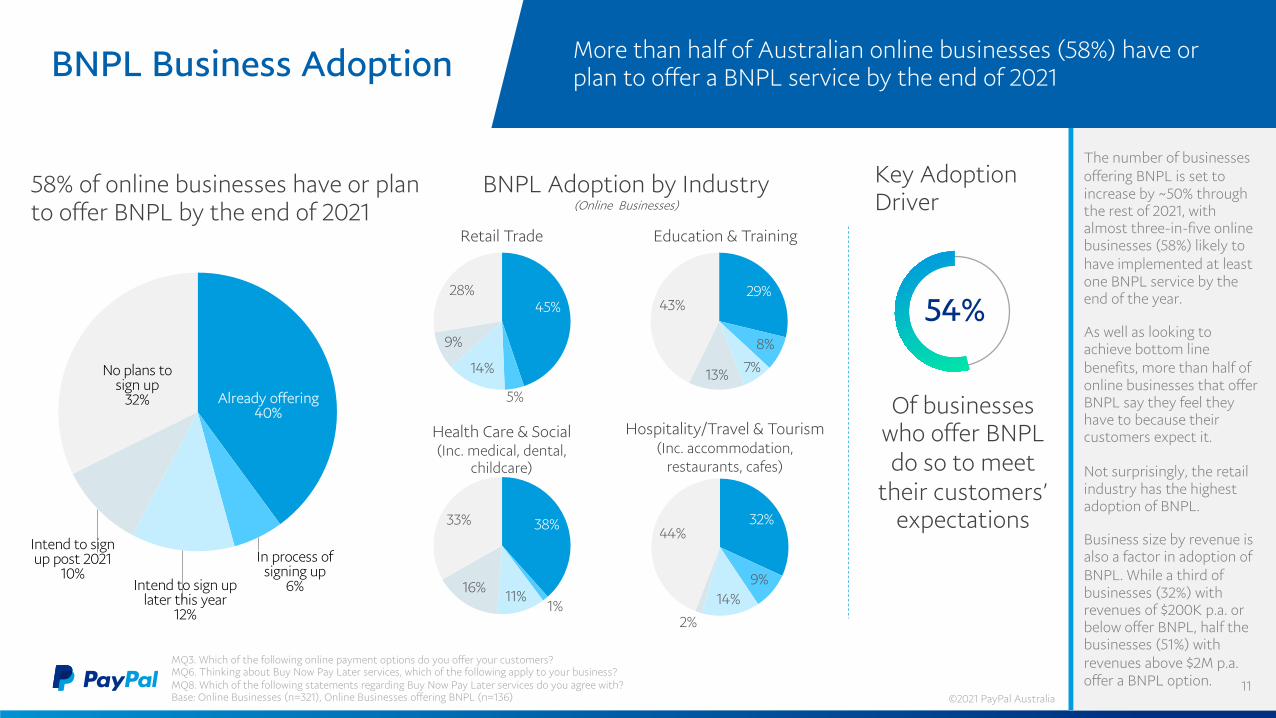
Already offering40%
In process of signing up
6%Intend to sign up later this year
12%
Intend to sign up post 2021
10%
No plans to sign up
32%
38%
1%11%
16%
33%
Health Care & Social (Inc. medical, dental,
childcare)
The number of businesses offering BNPL is set to increase by ~50% through the rest of 2021, withalmost three-in-five online businesses (58%) likely to have implemented at least one BNPL service by the end of the year.
As well as looking to achieve bottom line benefits, more than half of online businesses that offer BNPL say they feel they have to because their customers expect it.
Not surprisingly, the retail industry has the highest adoption of BNPL.
Business size by revenue is also a factor in adoption of BNPL. While a third of businesses (32%) with revenues of $200K p.a. or below offer BNPL, half the businesses (51%) with revenues above $2M p.a. offer a BNPL option. 11
BNPL Business Adoption More than half of Australian online businesses (58%) have or plan to offer a BNPL service by the end of 2021
MQ3. Which of the following online payment options do you offer your customers?MQ6. Thinking about Buy Now Pay Later services, which of the following apply to your business?MQ8. Which of the following statements regarding Buy Now Pay Later services do you agree with?Base: Online Businesses (n=321), Online Businesses offering BNPL (n=136)
58% of online businesses have or plan to offer BNPL by the end of 2021
BNPL Adoption by Industry(Online Businesses)
54%
Key Adoption Driver
©2021 PayPal Australia
45%
5%
14%
9%
28%
Retail Trade
29%
8%
7%13%
43%
Education & Training
32%
9%14%
2%
44%
Hospitality/Travel & Tourism(Inc. accommodation,
restaurants, cafes)
Of businesses who offer BNPL do so to meet
their customers’ expectations
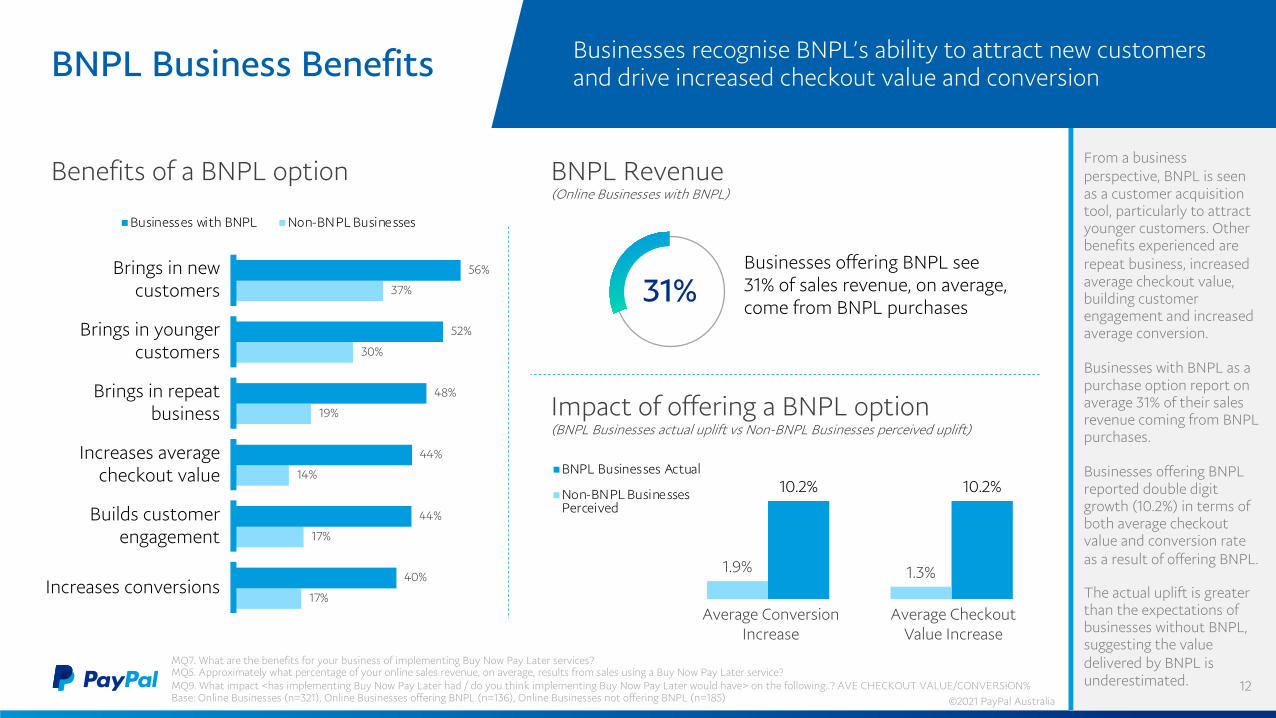
10.2%10.2%
1.3%1.9%
BNPL Businesses Actual
Non-BNPL BusinessesPerceived
From a business perspective, BNPL is seen as a customer acquisition tool, particularly to attract younger customers. Other benefits experienced are repeat business, increased average checkout value, building customer engagement and increased average conversion.
Businesses with BNPL as a purchase option report on average 31% of their sales revenue coming from BNPL purchases.
Businesses offering BNPL reported double digit growth (10.2%) in terms of both average checkout value and conversion rate as a result of offering BNPL.
The actual uplift is greater than the expectations of businesses without BNPL, suggesting the value delivered by BNPL is underestimated. 12
BNPL Business Benefits Businesses recognise BNPL’s ability to attract new customers and drive increased checkout value and conversion
MQ7. What are the benefits for your business of implementing Buy Now Pay Later services?MQ5. Approximately what percentage of your online sales revenue, on average, results from sales using a Buy Now Pay Later service? MQ9. What impact <has implementing Buy Now Pay Later had / do you think implementing Buy Now Pay Later would have> on the following..? AVE CHECKOUT VALUE/CONVERSION%Base: Online Businesses (n=321), Online Businesses offering BNPL (n=136), Online Businesses not offering BNPL (n=185)
31%Businesses offering BNPL see 31% of sales revenue, on average, come from BNPL purchases
BNPL Revenue(Online Businesses with BNPL)
Impact of offering a BNPL option(BNPL Businesses actual uplift vs Non-BNPL Businesses perceived uplift)
Benefits of a BNPL option
Average Conversion Increase
Average Checkout Value Increase
17%
17%
14%
19%
30%
37%
40%
44%
44%
48%
52%
56%
Businesses with BNPL Non-BNPL Businesses
Brings in new customers
Brings in younger customers
Brings in repeat business
Increases average checkout value
Builds customer engagement
Increases conversions
©2021 PayPal Australia
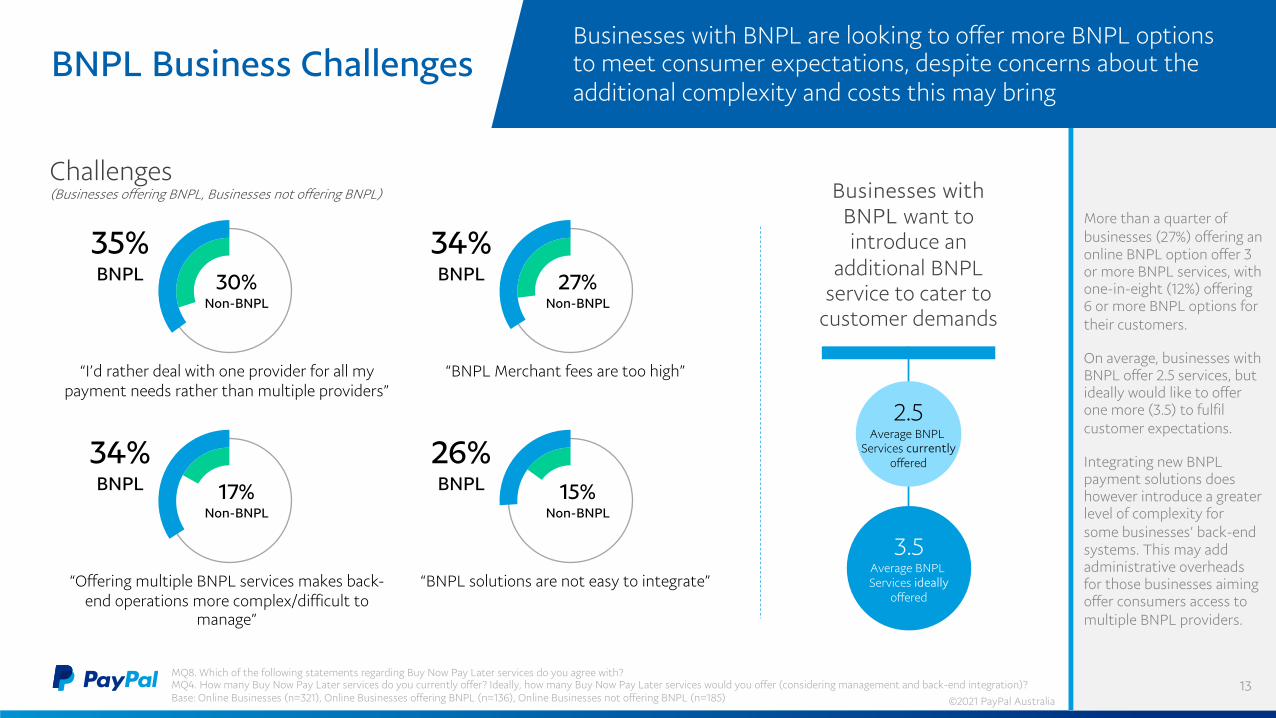
More than a quarter of businesses (27%) offering an online BNPL option offer 3 or more BNPL services, with one-in-eight (12%) offering 6 or more BNPL options for their customers.
On average, businesses with BNPL offer 2.5 services, but ideally would like to offer one more (3.5) to fulfil customer expectations.
Integrating new BNPL payment solutions does however introduce a greater level of complexity for some businesses’ back-end systems. This may add administrative overheads for those businesses aiming offer consumers access to multiple BNPL providers.
13
BNPL Business ChallengesBusinesses with BNPL are looking to offer more BNPL options to meet consumer expectations, despite concerns about the additional complexity and costs this may bring
Challenges(Businesses offering BNPL, Businesses not offering BNPL)
MQ8. Which of the following statements regarding Buy Now Pay Later services do you agree with?MQ4. How many Buy Now Pay Later services do you currently offer? Ideally, how many Buy Now Pay Later services would you offer (considering management and back-end integration)?Base: Online Businesses (n=321), Online Businesses offering BNPL (n=136), Online Businesses not offering BNPL (n=185)
Businesses with BNPL want to introduce an
additional BNPL service to cater to
customer demands
2.5Average BNPL
Services currentlyoffered
3.5Average BNPL Services ideally
offered“BNPL solutions are not easy to integrate”
“I’d rather deal with one provider for all my payment needs rather than multiple providers”
“BNPL Merchant fees are too high”
“Offering multiple BNPL services makes back-end operations more complex/difficult to
manage”
©2021 PayPal Australia
30%Non-BNPL
35%BNPL 27%
Non-BNPL
34%BNPL
17%Non-BNPL
34%BNPL 15%
Non-BNPL
26%BNPL
Trend 2Payments & Trust
14
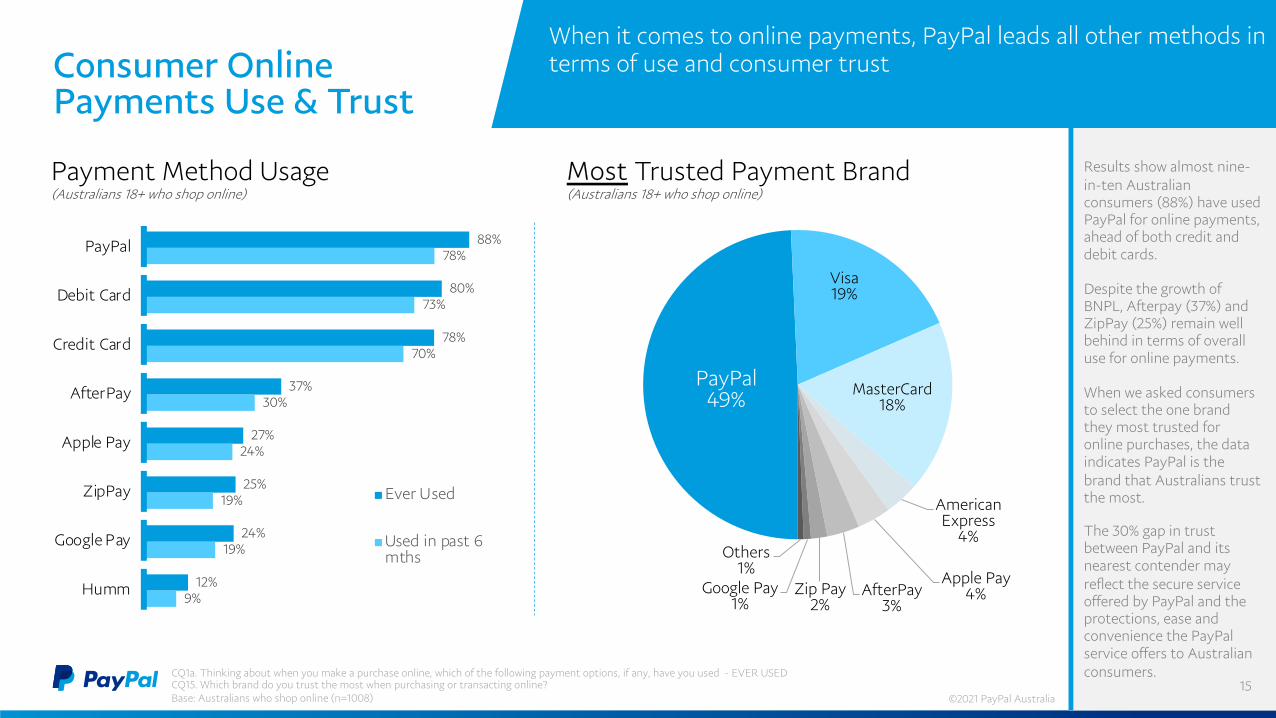
Results show almost nine-in-ten Australian consumers (88%) have used PayPal for online payments, ahead of both credit and debit cards.
Despite the growth of BNPL, Afterpay (37%) and ZipPay (25%) remain well behind in terms of overall use for online payments.
When we asked consumers to select the one brand they most trusted for online purchases, the data indicates PayPal is the brand that Australians trust the most.
The 30% gap in trust between PayPal and its nearest contender may reflect the secure service offered by PayPal and the protections, ease and convenience the PayPal service offers to Australian consumers.
Consumer Online Payments Use & Trust
15
When it comes to online payments, PayPal leads all other methods in terms of use and consumer trust
CQ1a. Thinking about when you make a purchase online, which of the following payment options, if any, have you used - EVER USEDCQ15. Which brand do you trust the most when purchasing or transacting online?Base: Australians who shop online (n=1008)
Most Trusted Payment Brand(Australians 18+ who shop online)
Payment Method Usage(Australians 18+ who shop online)
88%
80%
78%
37%
27%
25%
24%
12%
78%
73%
70%
30%
24%
19%
19%
9%
PayPal
Debit Card
Credit Card
AfterPay
Apple Pay
ZipPay
Google Pay
Humm
Ever Used
Used in past 6mths
PayPal49%
Visa19%
MasterCard18%
American Express
4%
Apple Pay4%AfterPay
3%Zip Pay
2%Google Pay
1%
Others1%
©2021 PayPal Australia
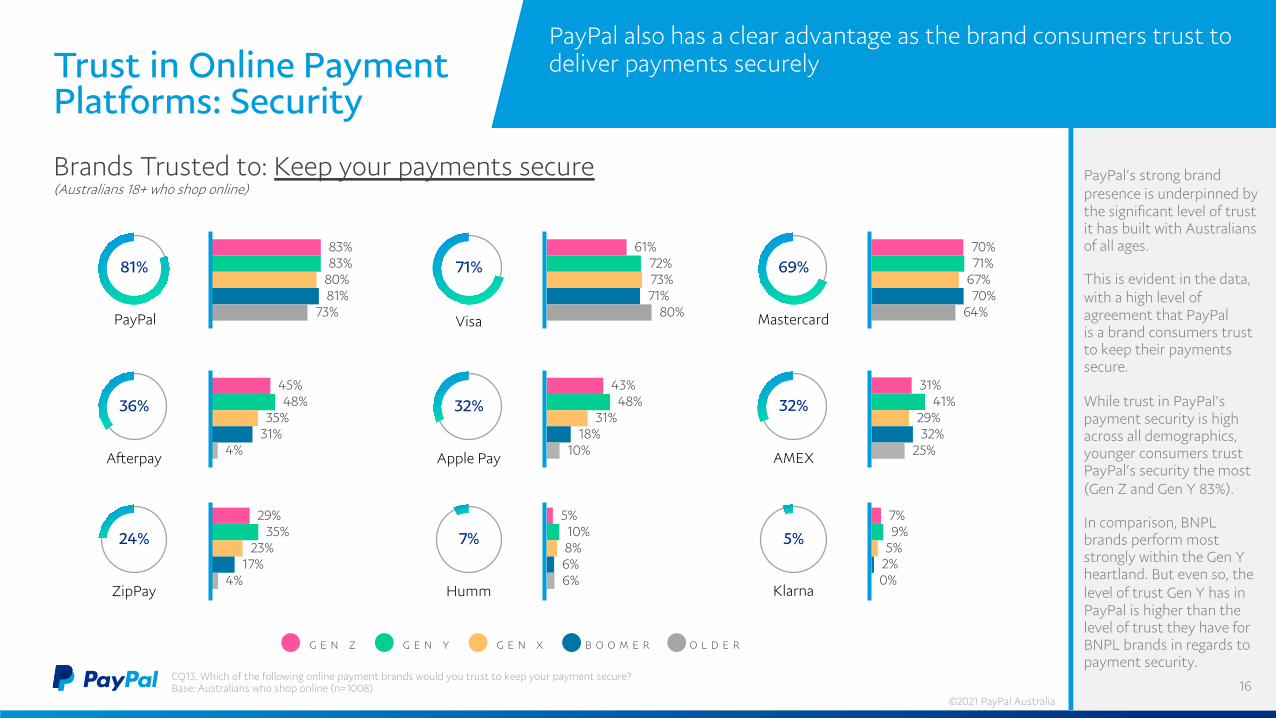
PayPal’s strong brand presence is underpinned by the significant level of trust it has built with Australians of all ages.
This is evident in the data, with a high level of agreement that PayPal is a brand consumers trust to keep their payments secure.
While trust in PayPal’s payment security is high across all demographics, younger consumers trust PayPal’s security the most (Gen Z and Gen Y 83%).
In comparison, BNPL brands perform most strongly within the Gen Y heartland. But even so, the level of trust Gen Y has in PayPal is higher than the level of trust they have for BNPL brands in regards to payment security.
CQ13. Which of the following online payment brands would you trust to keep your payment secure?Base: Australians who shop online (n=1008) 16
Trust in Online Payment Platforms: Security
PayPal also has a clear advantage as the brand consumers trust to deliver payments securely
G E N Z G E N Y G E N X B O O M E R O L D E R
Brands Trusted to: Keep your payments secure(Australians 18+ who shop online)
81%83%83%
80%81%
73%
24%
29%35%
23%17%
4%ZipPay
36%45%48%
35%31%
4%Afterpay
69%70%71%
67%70%
64%Mastercard
5%
7%9%
5%2%0%
Klarna
32%31%
41%29%32%
25%AMEX
PayPal
71%61%
72%73%71%
80%Visa
32%43%
48%31%
18%10%Apple Pay
7%
5%10%8%6%6%
Humm
©2021 PayPal Australia
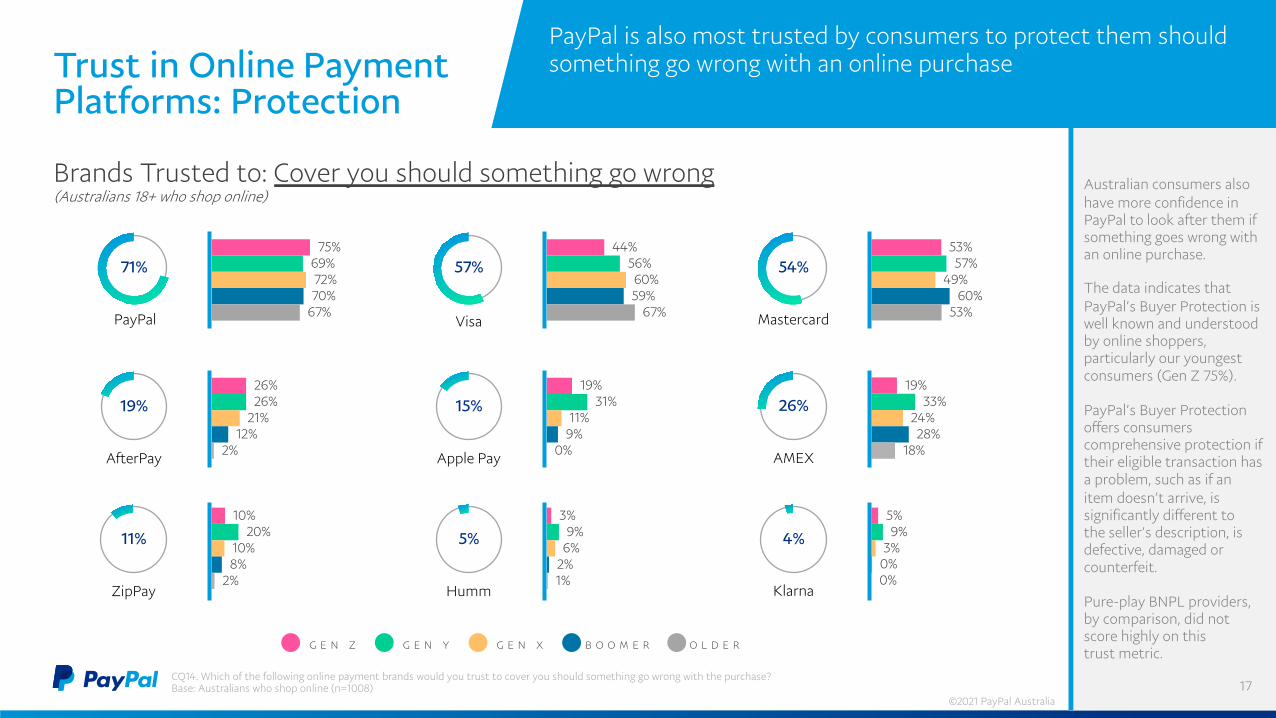
Australian consumers also have more confidence in PayPal to look after them if something goes wrong with an online purchase.
The data indicates that PayPal’s Buyer Protection is well known and understood by online shoppers, particularly our youngest consumers (Gen Z 75%).
PayPal’s Buyer Protection offers consumers comprehensive protection if their eligible transaction has a problem, such as if an item doesn’t arrive, is significantly different to the seller’s description, is defective, damaged or counterfeit.
Pure-play BNPL providers, by comparison, did not score highly on this trust metric.
CQ14. Which of the following online payment brands would you trust to cover you should something go wrong with the purchase?Base: Australians who shop online (n=1008) 17
PayPal is also most trusted by consumers to protect them should something go wrong with an online purchase
G E N Z G E N Y G E N X B O O M E R O L D E R
Brands Trusted to: Cover you should something go wrong(Australians 18+ who shop online)
57%44%
56%60%59%
67%
11%
10%20%
10%8%
2%ZipPay
Visa
15%19%
31%11%
9%0%Apple Pay
PayPal
19%26%26%
21%12%
2%AfterPay
71%75%
69%72%70%
67%
5%
3%9%
6%2%1%
Humm
54%53%57%
49%60%
53%Mastercard
4%
5%9%
3%0%0%
Klarna
26%19%
33%24%28%
18%AMEX
Trust in Online Payment Platforms: Protection
©2021 PayPal Australia
18
Trend 3Online Discounts & Sales Events
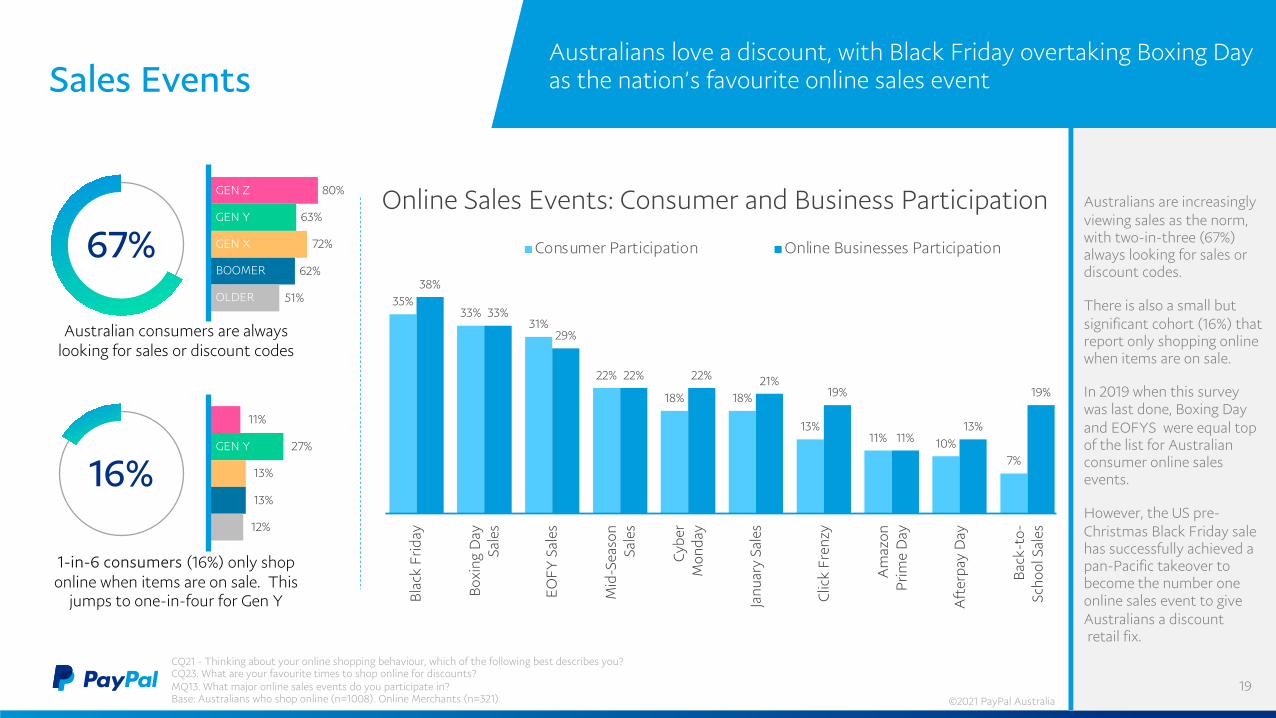
Australians are increasingly viewing sales as the norm, with two-in-three (67%) always looking for sales or discount codes.
There is also a small but significant cohort (16%) that report only shopping online when items are on sale.
In 2019 when this survey was last done, Boxing Day and EOFYS were equal top of the list for Australian consumer online sales events.
However, the US pre-Christmas Black Friday sale has successfully achieved a pan-Pacific takeover to become the number one online sales event to give Australians a discountretail fix.
Sales Events
19
CQ21 - Thinking about your online shopping behaviour, which of the following best describes you?CQ23. What are your favourite times to shop online for discounts?MQ13. What major online sales events do you participate in? Base: Australians who shop online (n=1008). Online Merchants (n=321).
Australians love a discount, with Black Friday overtaking Boxing Day as the nation’s favourite online sales event
Online Sales Events: Consumer and Business Participation
35%33%
31%
22%
18% 18%
13%11% 10%
7%
38%
33%
29%
22% 22% 21%19%
11%13%
19%
Consumer Participation Online Businesses Participation
Bla
ck F
rida
y
Box
ing
Day
Sa
les
EO
FY S
ales
Mid
-Sea
son
Sale
s
Cybe
r M
onda
y
Janu
ary
Sale
s
Clic
k Fr
enzy
Am
azon
Pr
ime
Day
Aft
erpa
y D
ay
Bac
k-to
-Sc
hool
Sal
es
80%
63%
72%
62%
51%
GEN Z
GEN Y
GEN X
BOOMER
OLDER
67%
Australian consumers are always looking for sales or discount codes
©2021 PayPal Australia
1-in-6 consumers (16%) only shop online when items are on sale. This
jumps to one-in-four for Gen Y
11%
27%
13%
13%
12%
GEN Y
16%
49%43%
30%
52%
62% 62%
51%57%
70%
48%
38% 38%
55%
45%
50%55%
62%66%
45%
55%
50%45%
38%34%
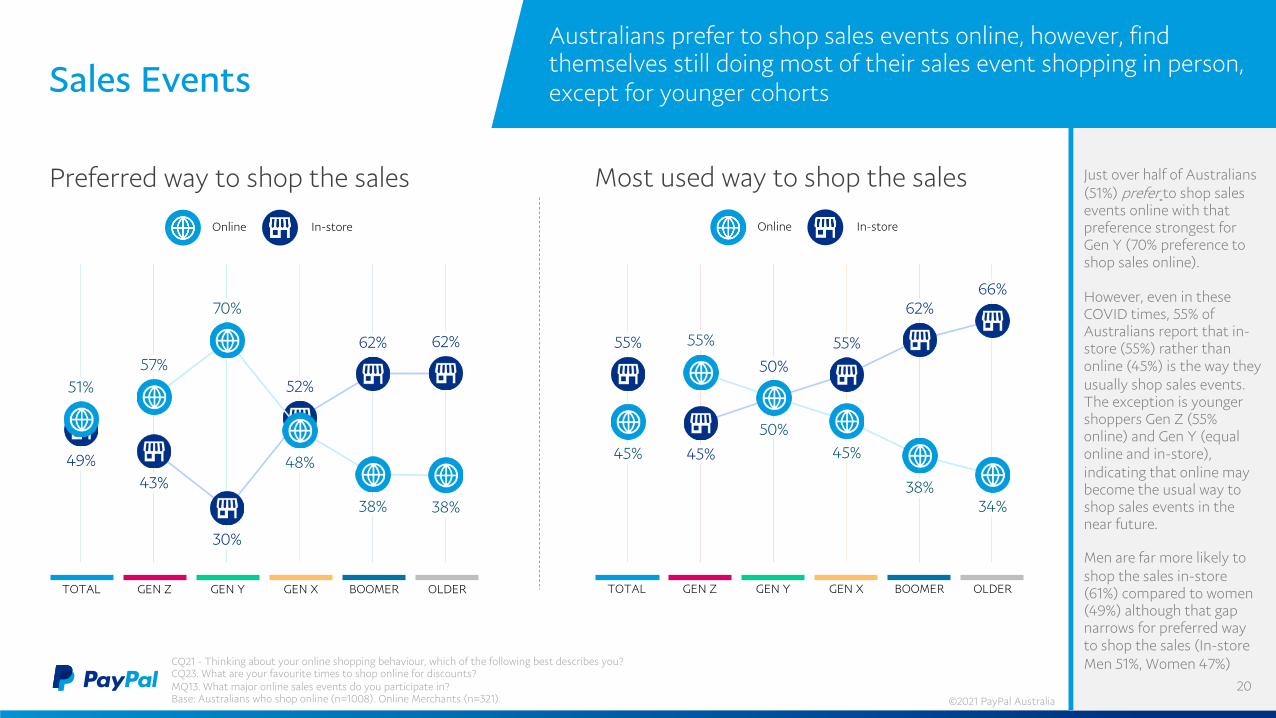
Just over half of Australians (51%) prefer to shop sales events online with that preference strongest for Gen Y (70% preference to shop sales online).
However, even in these COVID times, 55% of Australians report that in-store (55%) rather than online (45%) is the way they usually shop sales events. The exception is younger shoppers Gen Z (55% online) and Gen Y (equal online and in-store), indicating that online may become the usual way to shop sales events in the near future.
Men are far more likely to shop the sales in-store (61%) compared to women (49%) although that gap narrows for preferred way to shop the sales (In-store Men 51%, Women 47%)
GEN Z GEN Y GEN X BOOMER OLDERTOTAL
Sales Events
20
CQ21 - Thinking about your online shopping behaviour, which of the following best describes you?CQ23. What are your favourite times to shop online for discounts?MQ13. What major online sales events do you participate in? Base: Australians who shop online (n=1008). Online Merchants (n=321).
Australians prefer to shop sales events online, however, find themselves still doing most of their sales event shopping in person, except for younger cohorts
Preferred way to shop the sales
Online In-store
GEN Z GEN Y GEN X BOOMER OLDERTOTAL
Most used way to shop the sales
Online In-store
©2021 PayPal Australia
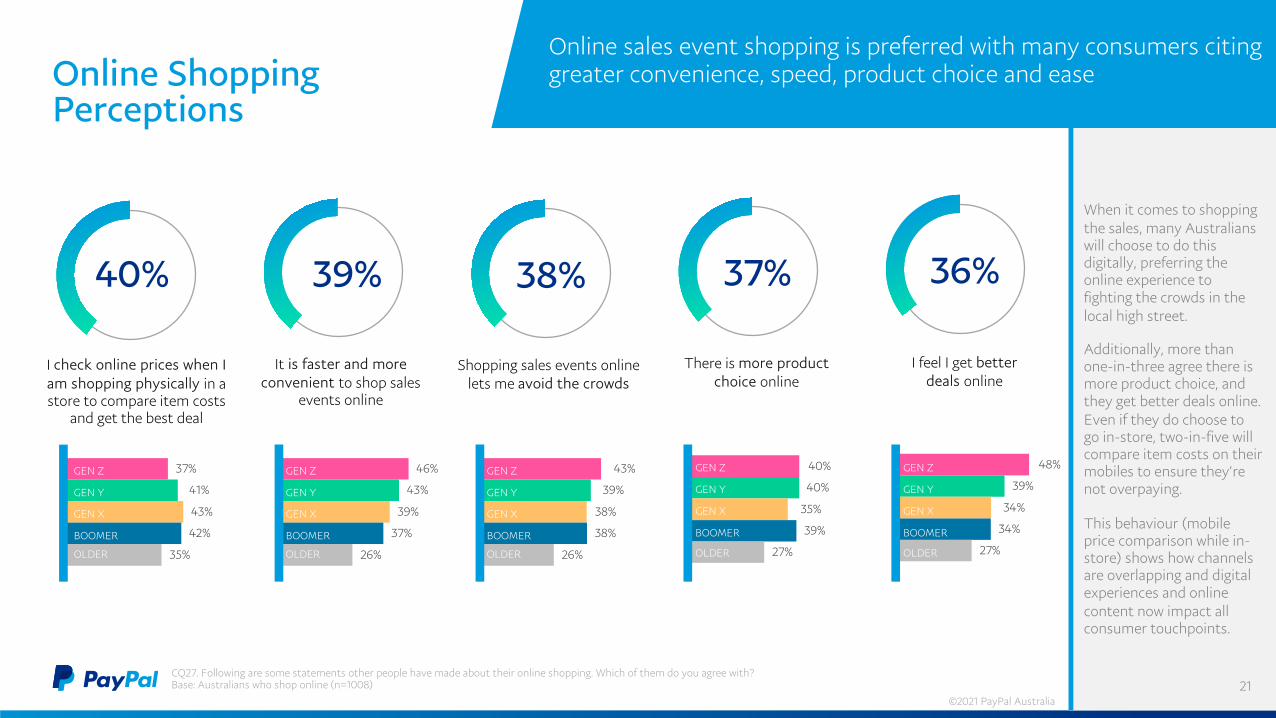
When it comes to shopping the sales, many Australians will choose to do this digitally, preferring the online experience to fighting the crowds in the local high street.
Additionally, more than one-in-three agree there is more product choice, and they get better deals online. Even if they do choose to go in-store, two-in-five will compare item costs on their mobiles to ensure they’re not overpaying.
This behaviour (mobile price comparison while in-store) shows how channels are overlapping and digital experiences and online content now impact all consumer touchpoints.
I check online prices when I am shopping physically in a store to compare item costs
and get the best deal
Shopping sales events online lets me avoid the crowds
There is more product choice online
It is faster and more convenient to shop sales
events online
I feel I get better deals online
Online Shopping Perceptions
21CQ27. Following are some statements other people have made about their online shopping. Which of them do you agree with?Base: Australians who shop online (n=1008)
40%
37%
41%
43%
42%
35%
43%
39%
38%
38%
26%
GEN Z
GEN Y
GEN X
BOOMER
OLDER
38%
40%
40%
35%
39%
27%
GEN Z
GEN Y
GEN X
BOOMER
OLDER
37%39%
48%
39%
34%
34%
27%
GEN Z
GEN Y
GEN X
BOOMER
OLDER
36%
46%
43%
39%
37%
26%
GEN Z
GEN Y
GEN X
BOOMER
OLDER
Online sales event shopping is preferred with many consumers citing greater convenience, speed, product choice and ease
GEN Z
GEN Y
GEN X
BOOMER
OLDER
©2021 PayPal Australia
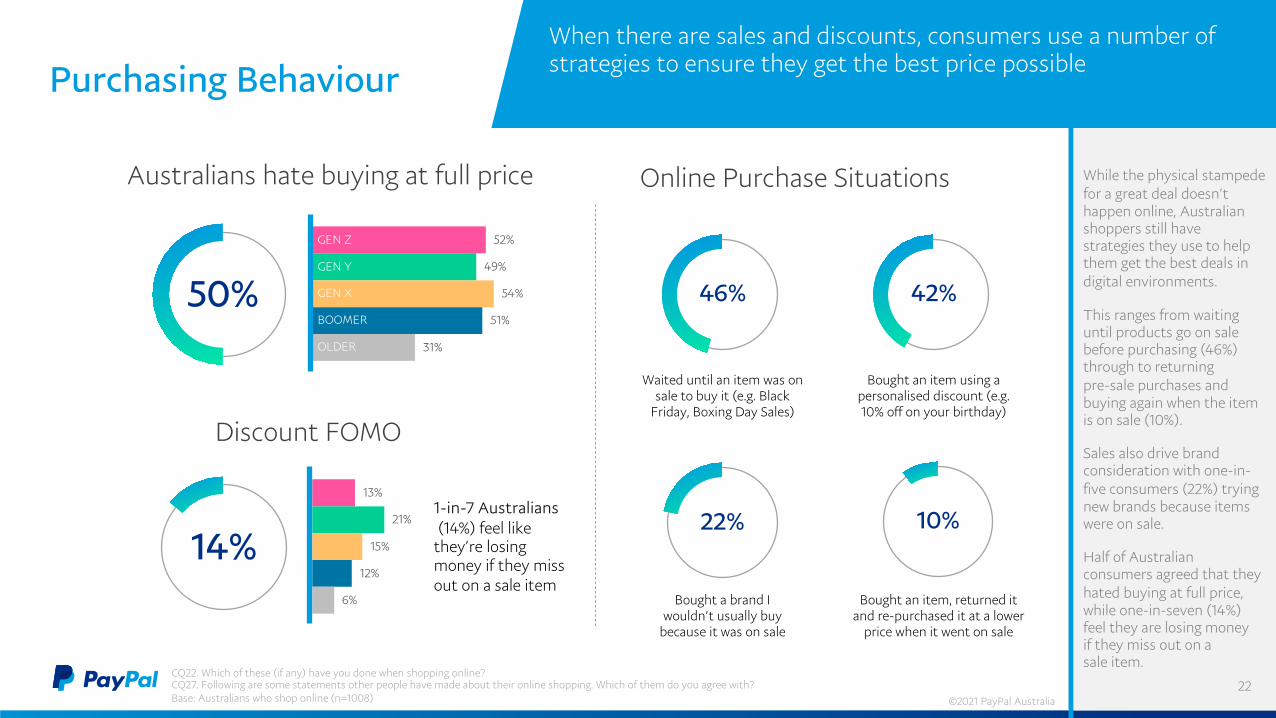
While the physical stampede for a great deal doesn’t happen online, Australian shoppers still have strategies they use to help them get the best deals in digital environments.
This ranges from waiting until products go on sale before purchasing (46%) through to returning pre-sale purchases and buying again when the item is on sale (10%).
Sales also drive brand consideration with one-in-five consumers (22%) trying new brands because items were on sale.
Half of Australian consumers agreed that they hated buying at full price, while one-in-seven (14%) feel they are losing money if they miss out on a sale item.
Purchasing Behaviour
22CQ22. Which of these (if any) have you done when shopping online? CQ27. Following are some statements other people have made about their online shopping. Which of them do you agree with?Base: Australians who shop online (n=1008)
When there are sales and discounts, consumers use a number of strategies to ensure they get the best price possible
22%
Bought a brand I wouldn’t usually buy
because it was on sale
10%
Bought an item, returned it and re-purchased it at a lower
price when it went on sale
46%
Waited until an item was on sale to buy it (e.g. Black
Friday, Boxing Day Sales)
42%
Bought an item using a personalised discount (e.g. 10% off on your birthday)
Online Purchase Situations
52%
49%
54%
51%
31%
GEN Z
GEN Y
GEN X
BOOMER
OLDER
50%
Australians hate buying at full price
1-in-7 Australians(14%) feel like
they’re losing money if they miss out on a sale item
13%
21%
15%
12%
6%
©2021 PayPal Australia
Discount FOMO
14%
Impulse Purchasing
23CQ25. Thinking about your online shopping in the last three months, how many times did you...? - Buy an item you didn’t plan to because it was on sale? CQ26. And over the last three months of online shopping, how much in total did you...? - Spend on items you didn’t plan to buy because they were on sale? Base: Australians who shop online (n=1008)
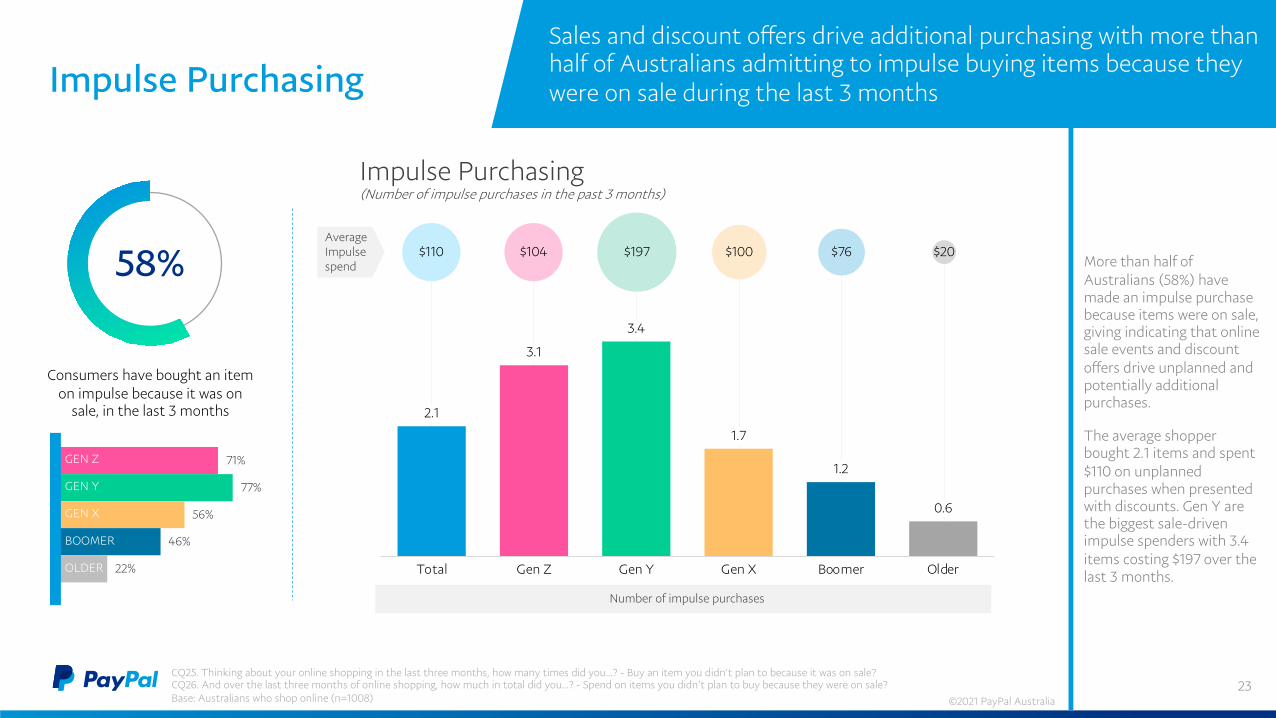
More than half of Australians (58%) have made an impulse purchase because items were on sale, giving indicating that online sale events and discount offers drive unplanned and potentially additional purchases.
The average shopper bought 2.1 items and spent $110 on unplanned purchases when presented with discounts. Gen Y are the biggest sale-driven impulse spenders with 3.4 items costing $197 over the last 3 months.
Sales and discount offers drive additional purchasing with more than half of Australians admitting to impulse buying items because they were on sale during the last 3 months
71%
77%
56%
46%
22%
GEN Z
GEN Y
GEN X
BOOMER
OLDER
58%
Consumers have bought an item on impulse because it was on
sale, in the last 3 months 2.1
3.1
3.4
1.7
1.2
0.6
Total Gen Z Gen Y Gen X Boomer Older
Impulse Purchasing (Number of impulse purchases in the past 3 months)
$110 $104 $197 $100 $76 $20Average Impulse spend
Number of impulse purchases
©2021 PayPal Australia
19%
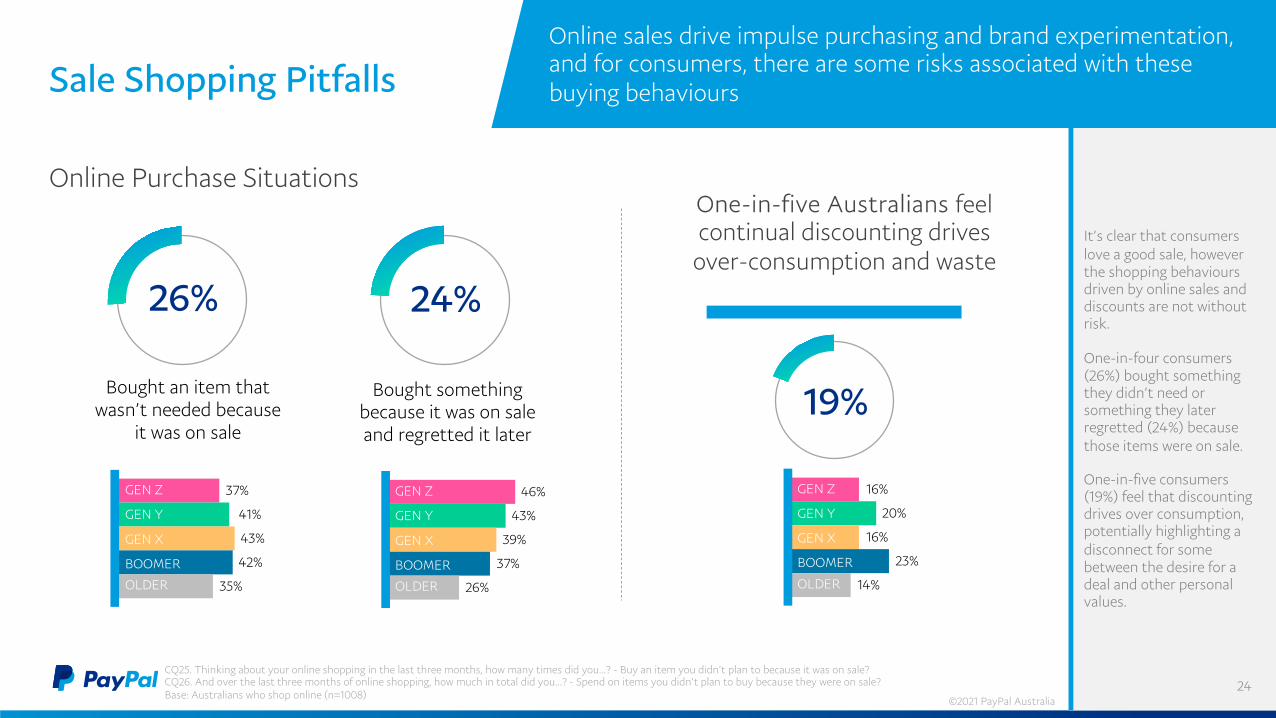
It’s clear that consumers love a good sale, however the shopping behaviours driven by online sales and discounts are not without risk.
One-in-four consumers (26%) bought something they didn’t need or something they later regretted (24%) because those items were on sale.
One-in-five consumers (19%) feel that discounting drives over consumption, potentially highlighting a disconnect for some between the desire for a deal and other personal values.
24
One-in-five Australians feel continual discounting drives over-consumption and waste
Sale Shopping Pitfalls
CQ25. Thinking about your online shopping in the last three months, how many times did you...? - Buy an item you didn’t plan to because it was on sale? CQ26. And over the last three months of online shopping, how much in total did you...? - Spend on items you didn’t plan to buy because they were on sale? Base: Australians who shop online (n=1008)
Online sales drive impulse purchasing and brand experimentation, and for consumers, there are some risks associated with these buying behaviours
37%
41%
43%
42%
35%
Bought an item that wasn’t needed because
it was on sale
26%
GEN Z
GEN Y
GEN X
BOOMER
OLDER
Bought something because it was on sale and regretted it later
24%
46%
43%
39%
37%
26%
GEN Z
GEN Y
GEN X
BOOMER
OLDER
Online Purchase Situations
©2021 PayPal Australia
16%
20%
16%
23%
14%
GEN Z
GEN Y
GEN X
BOOMER
OLDER
Appendix
25
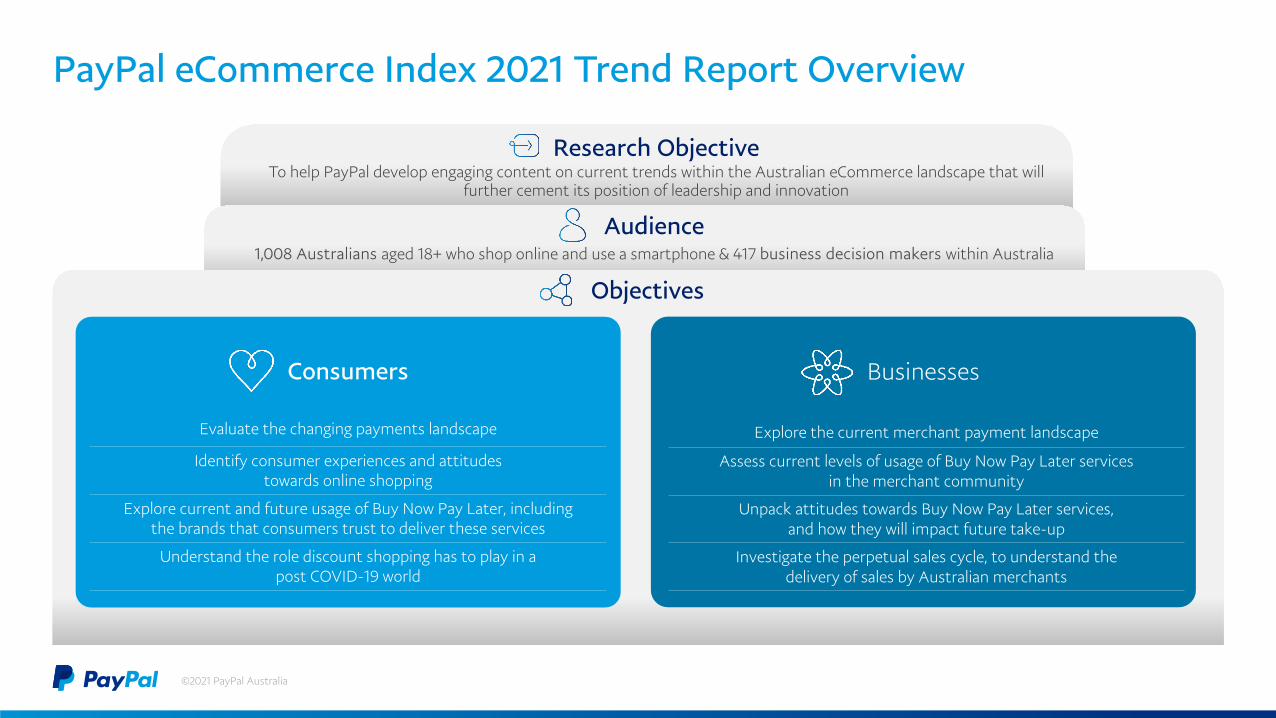
Research ObjectiveTo help PayPal develop engaging content on current trends within the Australian eCommerce landscape that will
further cement its position of leadership and innovation
Audience1,008 Australians aged 18+ who shop online and use a smartphone & 417 business decision makers within Australia
Objectives
Consumers Businesses
Evaluate the changing payments landscape
Identify consumer experiences and attitudes towards online shopping
Explore current and future usage of Buy Now Pay Later, including the brands that consumers trust to deliver these services
Understand the role discount shopping has to play in a post COVID-19 world
PayPal eCommerce Index 2021 Trend Report Overview
Explore the current merchant payment landscape
Assess current levels of usage of Buy Now Pay Later services in the merchant community
Unpack attitudes towards Buy Now Pay Later services, and how they will impact future take-up
Investigate the perpetual sales cycle, to understand the delivery of sales by Australian merchants
©2021 PayPal Australia
27
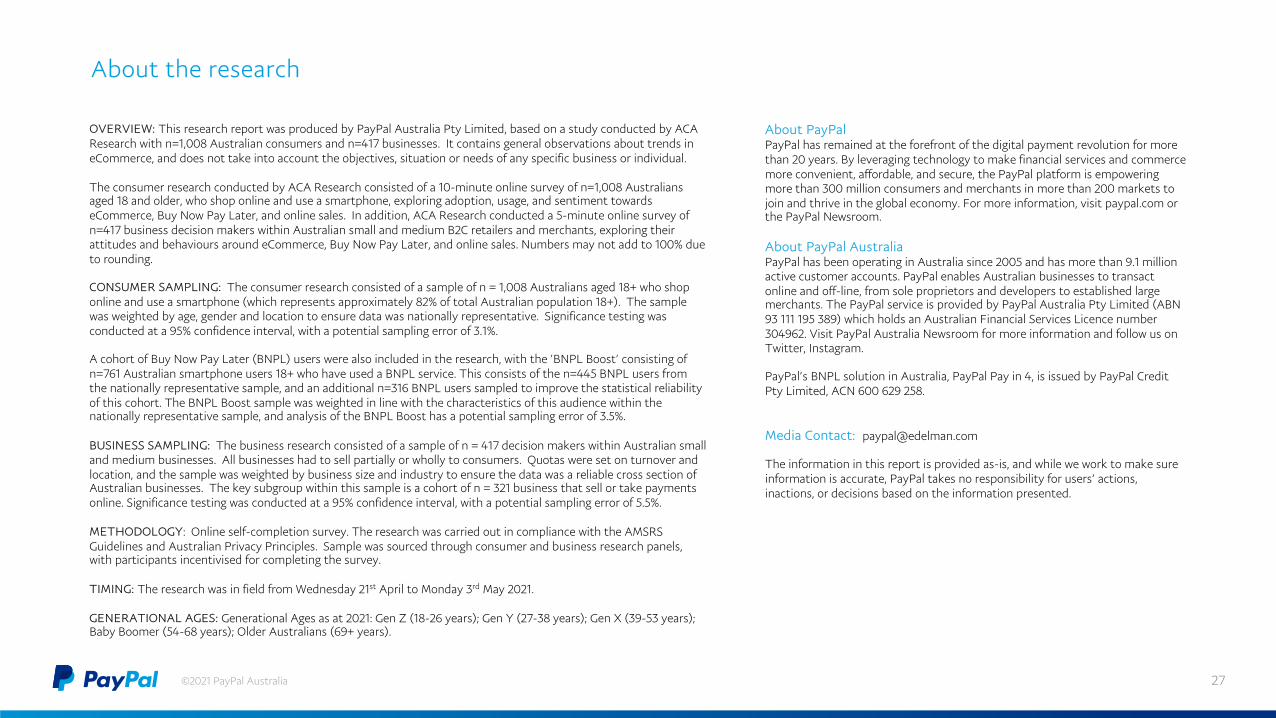
OVERVIEW: This research report was produced by PayPal Australia Pty Limited, based on a study conducted by ACA Research with n=1,008 Australian consumers and n=417 businesses. It contains general observations about trends in eCommerce, and does not take into account the objectives, situation or needs of any specific business or individual.
The consumer research conducted by ACA Research consisted of a 10-minute online survey of n=1,008 Australians aged 18 and older, who shop online and use a smartphone, exploring adoption, usage, and sentiment towards eCommerce, Buy Now Pay Later, and online sales. In addition, ACA Research conducted a 5-minute online survey of n=417 business decision makers within Australian small and medium B2C retailers and merchants, exploring their attitudes and behaviours around eCommerce, Buy Now Pay Later, and online sales. Numbers may not add to 100% due to rounding.
CONSUMER SAMPLING: The consumer research consisted of a sample of n = 1,008 Australians aged 18+ who shop online and use a smartphone (which represents approximately 82% of total Australian population 18+). The sample was weighted by age, gender and location to ensure data was nationally representative. Significance testing was conducted at a 95% confidence interval, with a potential sampling error of 3.1%.
A cohort of Buy Now Pay Later (BNPL) users were also included in the research, with the ’BNPL Boost’ consisting of n=761 Australian smartphone users 18+ who have used a BNPL service. This consists of the n=445 BNPL users from the nationally representative sample, and an additional n=316 BNPL users sampled to improve the statistical reliability of this cohort. The BNPL Boost sample was weighted in line with the characteristics of this audience within the nationally representative sample, and analysis of the BNPL Boost has a potential sampling error of 3.5%.
BUSINESS SAMPLING: The business research consisted of a sample of n = 417 decision makers within Australian small and medium businesses. All businesses had to sell partially or wholly to consumers. Quotas were set on turnover and location, and the sample was weighted by business size and industry to ensure the data was a reliable cross section of Australian businesses. The key subgroup within this sample is a cohort of n = 321 business that sell or take payments online. Significance testing was conducted at a 95% confidence interval, with a potential sampling error of 5.5%.
METHODOLOGY: Online self-completion survey. The research was carried out in compliance with the AMSRS Guidelines and Australian Privacy Principles. Sample was sourced through consumer and business research panels, with participants incentivised for completing the survey.
TIMING: The research was in field from Wednesday 21st April to Monday 3rd May 2021.
GENERATIONAL AGES: Generational Ages as at 2021: Gen Z (18-26 years); Gen Y (27-38 years); Gen X (39-53 years); Baby Boomer (54-68 years); Older Australians (69+ years).
About PayPal PayPal has remained at the forefront of the digital payment revolution for more than 20 years. By leveraging technology to make financial services and commerce more convenient, affordable, and secure, the PayPal platform is empowering more than 300 million consumers and merchants in more than 200 markets to join and thrive in the global economy. For more information, visit paypal.com or the PayPal Newsroom.
About PayPal Australia PayPal has been operating in Australia since 2005 and has more than 9.1 million active customer accounts. PayPal enables Australian businesses to transact online and off-line, from sole proprietors and developers to established large merchants. The PayPal service is provided by PayPal Australia Pty Limited (ABN 93 111 195 389) which holds an Australian Financial Services Licence number 304962. Visit PayPal Australia Newsroom for more information and follow us on Twitter, Instagram.
PayPal’s BNPL solution in Australia, PayPal Pay in 4, is issued by PayPal Credit Pty Limited, ACN 600 629 258.
Media Contact: [email protected]
The information in this report is provided as-is, and while we work to make sure information is accurate, PayPal takes no responsibility for users’ actions, inactions, or decisions based on the information presented.
About the research
©2021 PayPal Australia
©2021 PayPal Australia 28