ecommerce trends during covid-19
TRANSCRIPT
ECOMMERCE TRENDS DURING COVID-19A data view of consumer spending shift during this period
MAY 2020
|2
Table of Contents
SUMMARY
Key Highlights 3
Our Methodology to Data Collection 4
Ecommerce Trends During COVID-19 5
Impact by Product Category 11
Entertainment 12
Stationery & Hobbies 13
Food & Drinks 14
Consumer Electronics 15
Pets 16
Sports & Outdoors 17
Home Goods 18
Toys & Baby Products 19
Beauty & Personal Care 20
Furniture & Décor 21
Home Appliances 22
Fashion 23
Footnotes 24
COVID-19 ECOMMERCE TRENDS
|3
Key Highlights
SUMMARY
COVID-19 ECOMMERCE TRENDS
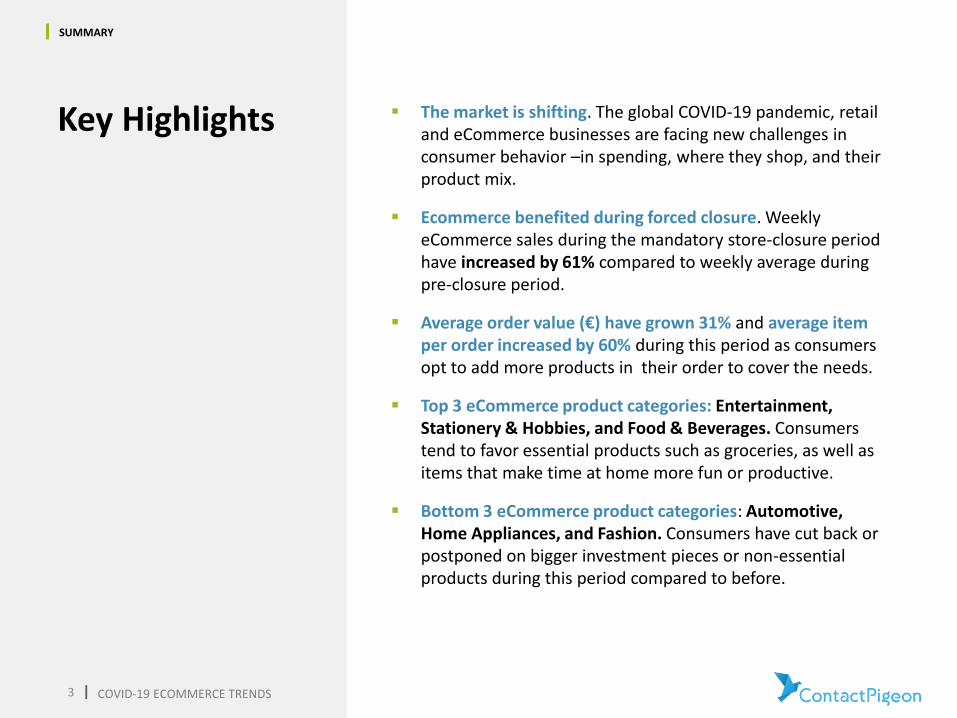
▪ The market is shifting. The global COVID-19 pandemic, retail and eCommerce businesses are facing new challenges in consumer behavior –in spending, where they shop, and their product mix.
▪ Ecommerce benefited during forced closure. Weekly eCommerce sales during the mandatory store-closure period have increased by 61% compared to weekly average during pre-closure period.
▪ Average order value (€) have grown 31% and average item per order increased by 60% during this period as consumers opt to add more products in their order to cover the needs.
▪ Top 3 eCommerce product categories: Entertainment, Stationery & Hobbies, and Food & Beverages. Consumers tend to favor essential products such as groceries, as well as items that make time at home more fun or productive.
▪ Bottom 3 eCommerce product categories: Automotive, Home Appliances, and Fashion. Consumers have cut back or postponed on bigger investment pieces or non-essential products during this period compared to before.
4 |
Our methodology to data collection
SUMMARY
Statistical significance and data sample▪ The data used within this report represents ecommerce transactions (online orders) aggregated across a
large numbers of ContactPigeon supported retailers from the period of January to April 2020. ▪ While ContactPigeon client base covers all key eCommmerce verticals, the data volume may be bias
towards specific categories (fashion, food & beverages) and geographical region (Europe-centric) due to coverage.
▪ However, the volume of transactions (30M+) is statistically significant when used reflect the representative pattern of the population.
Determination of Product Category with Visual Recognition AI▪ In this analyses, we are interested to understand how the quarantine measures and physical store
closures of COVID-19 impacts the online consumption trends by product types. ▪ A major challenge for reporting by product type is the lack of consistent naming and categorizing of the
products across retailers. For example, the same dress may be categorized under “Women Clothing” by one retailer while another may include it under “Spring Collection”. Product names may differ across vendors as well.
▪ To overcome this challenge, we used a visual recognition algorithm to assign a product to its rightful category based “understanding” the product by the product image.
▪ The data team performed manual checks where the AI needs clarity, in order to gradually teach the AI algorithm to better “learn” how to categorize specific product images.
▪ This resulted in a significantly more uniformed and accurate categorization of products across the database of over 100K+ product types that was processed.
COVID-19 ECOMMERCE TRENDS
5 |
Ecommerce Trends During COVID-19
COVID-19 ECOMMERCE TRENDS

6 |
100% 100% 100% 100% 100%
25%
74%93%
59%
Pre-Store Closure Store Closed Lockdown(Week 1)
Lockdown(Week 2)
Lockdown(Week 3+)
Weekly Average (Pre-Measures) Percent Change
Increased eCommerce activities observed with COVID-19 related quarantine measuresWhen compared to the weeks leading up to the government enforced quarantine, the weeks after lockdown (restriction of non-essential travel) have seen a surge in eCommerce activities across categories. The jump in eCommerce sales is most prominent during initial first two weeks of lockdown measures as consumers rush to stock up on daily essentials and necessity otherwise not available via physical stores.
Changes in weekly Sales (€ EUR) between Pre and Post Quarantine measures
100% represents the average of weekly sales in 2020 leading up to store closure
ECOMMERCE TRENDS DURING COVID-19
COVID-19 ECOMMERCE TRENDS
|7
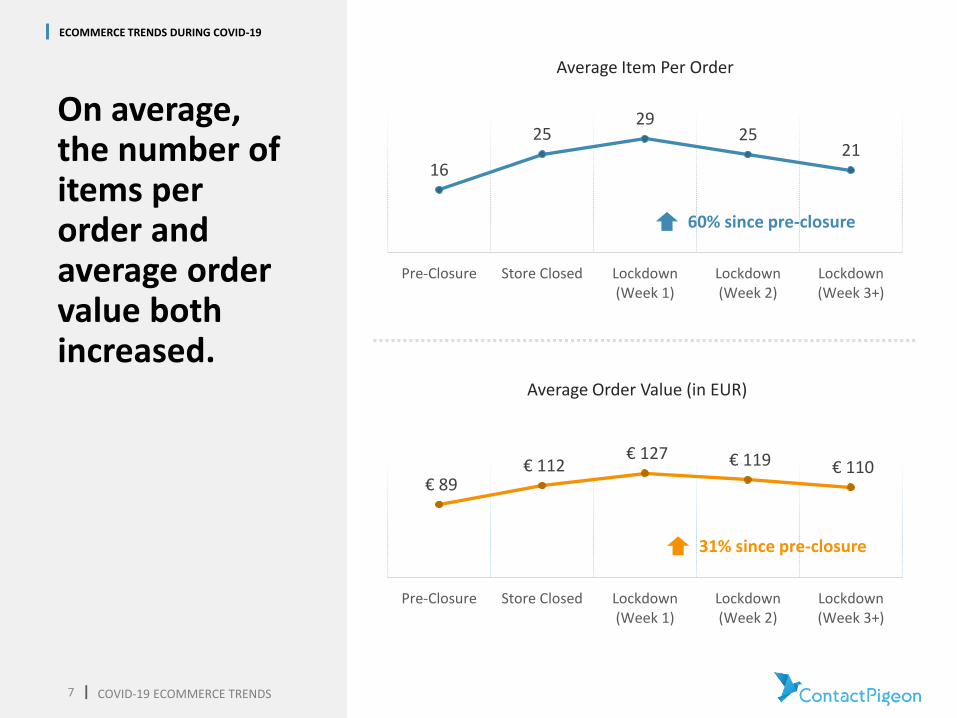
On average, the number of items per order and average order value both increased.
16
2529
2521
Pre-Closure Store Closed Lockdown(Week 1)
Lockdown(Week 2)
Lockdown(Week 3+)
Average Item Per Order
€ 89 € 112
€ 127 € 119 € 110
Pre-Closure Store Closed Lockdown(Week 1)
Lockdown(Week 2)
Lockdown(Week 3+)
Average Order Value (in EUR)
ECOMMERCE TRENDS DURING COVID-19
60% since pre-closure
31% since pre-closure
COVID-19 ECOMMERCE TRENDS
8 |
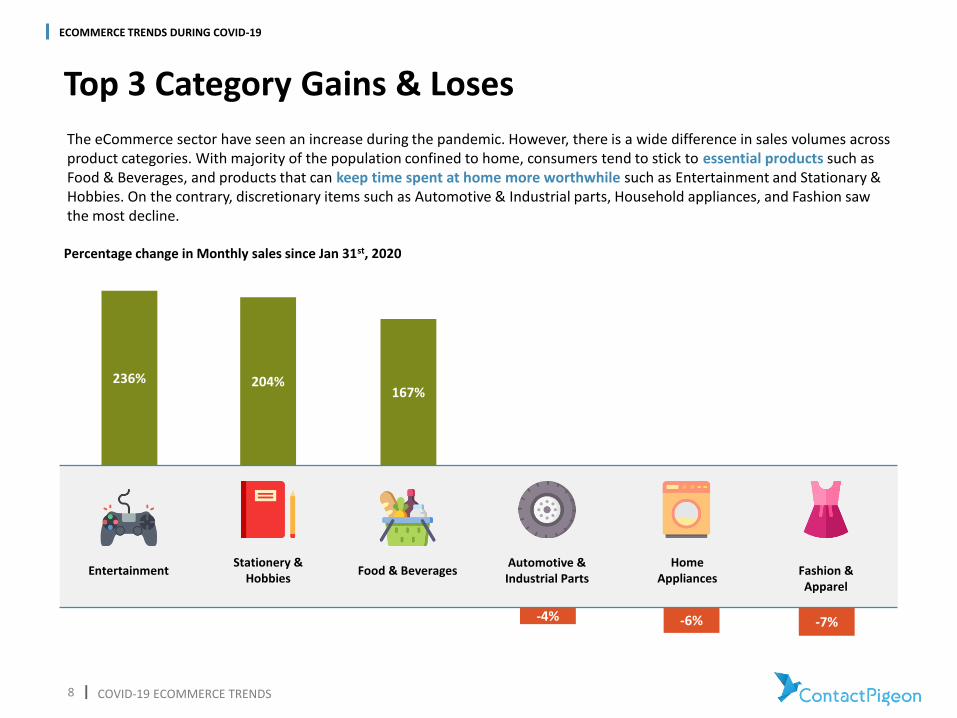
Top 3 Category Gains & Loses
-4% -6% -7%
236% 204%167%
Stationery & Hobbies
Food & BeveragesEntertainmentAutomotive & Industrial Parts
Fashion & Apparel
Home Appliances
Percentage change in Monthly sales since Jan 31st, 2020
The eCommerce sector have seen an increase during the pandemic. However, there is a wide difference in sales volumes across product categories. With majority of the population confined to home, consumers tend to stick to essential products such as Food & Beverages, and products that can keep time spent at home more worthwhile such as Entertainment and Stationary & Hobbies. On the contrary, discretionary items such as Automotive & Industrial parts, Household appliances, and Fashion saw the most decline.
ECOMMERCE TRENDS DURING COVID-19
COVID-19 ECOMMERCE TRENDS
|9
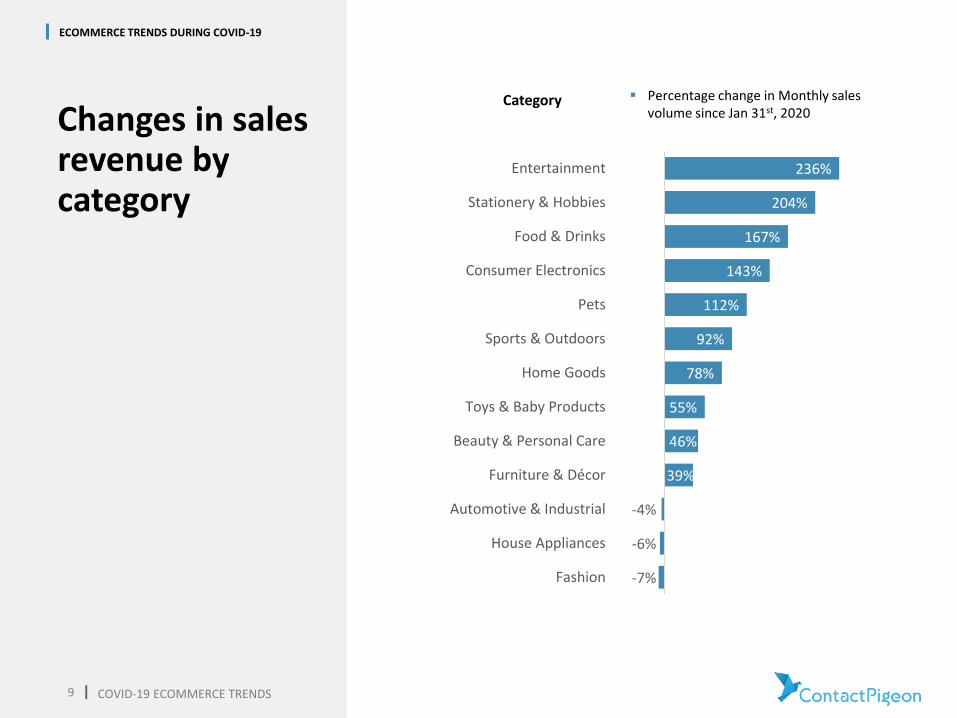
Changes in sales revenue by category
-7%
-6%
-4%
39%
46%
55%
78%
92%
112%
143%
167%
204%
236%
Fashion
House Appliances
Automotive & Industrial
Furniture & Décor
Beauty & Personal Care
Toys & Baby Products
Home Goods
Sports & Outdoors
Pets
Consumer Electronics
Food & Drinks
Stationery & Hobbies
Entertainment
▪ Percentage change in Monthly sales volume since Jan 31st, 2020
Category
ECOMMERCE TRENDS DURING COVID-19
COVID-19 ECOMMERCE TRENDS
10 |
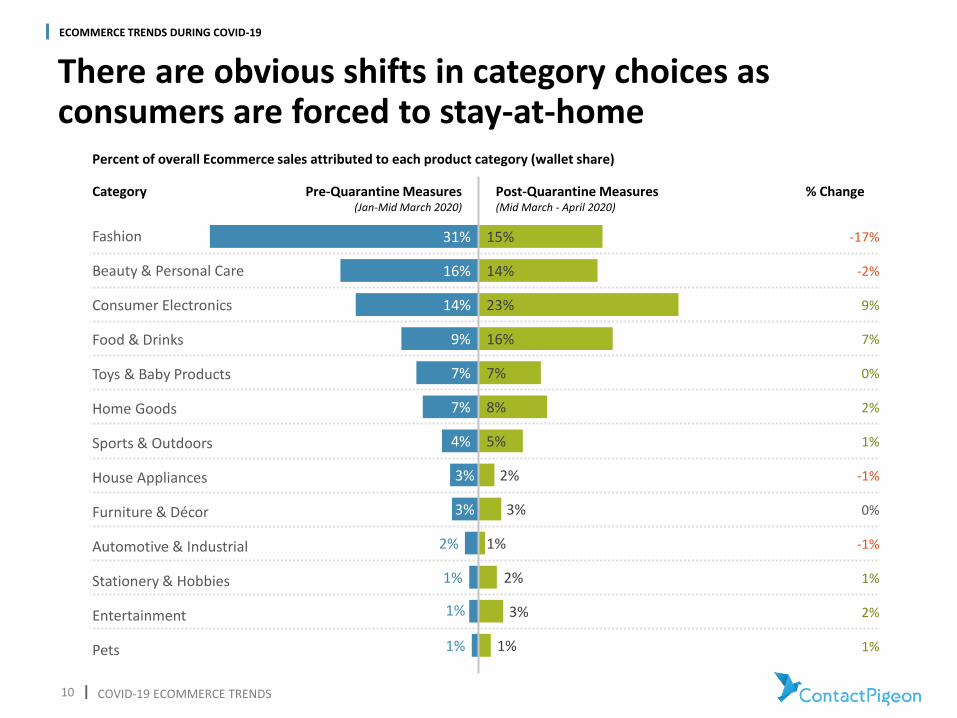
-17%
-2%
9%
7%
0%
2%
1%
-1%
0%
-1%
1%
2%
1%
There are obvious shifts in category choices as consumers are forced to stay-at-home
31%
16%
14%
9%
7%
7%
4%
3%
3%
2%
1%
1%
1%
15%
14%
23%
16%
7%
8%
5%
2%
3%
1%
2%
3%
1%
Fashion
Beauty & Personal Care
Consumer Electronics
Food & Drinks
Toys & Baby Products
Home Goods
Sports & Outdoors
House Appliances
Furniture & Décor
Automotive & Industrial
Stationery & Hobbies
Entertainment
Pets
Category Pre-Quarantine Measures(Jan-Mid March 2020)
Post-Quarantine Measures(Mid March - April 2020)
% Change
Percent of overall Ecommerce sales attributed to each product category (wallet share)
COVID-19 ECOMMERCE TRENDS
ECOMMERCE TRENDS DURING COVID-19
11 |
COVID-19 Impact by ProductCategory
COVID-19 ECOMMERCE TRENDS
|12
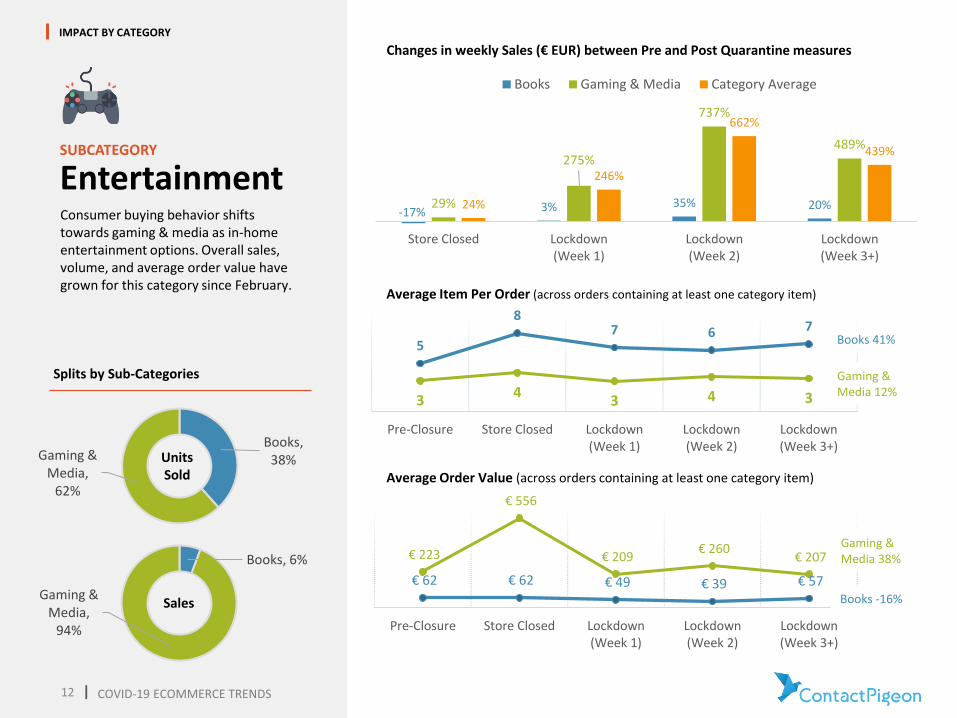
SUBCATEGORY
EntertainmentConsumer buying behavior shifts towards gaming & media as in-home entertainment options. Overall sales, volume, and average order value have grown for this category since February.
IMPACT BY CATEGORY
Books, 38%Gaming &
Media, 62%
Units Sold
Splits by Sub-Categories
Books, 6%
Gaming & Media,
94%
Sales
-17% 3% 35% 20%29%
275%
737%
489%
24%
246%
662%
439%
Store Closed Lockdown(Week 1)
Lockdown(Week 2)
Lockdown(Week 3+)
Books Gaming & Media Category Average
Changes in weekly Sales (€ EUR) between Pre and Post Quarantine measures
5
87 6 7
34
3 4 3
Pre-Closure Store Closed Lockdown(Week 1)
Lockdown(Week 2)
Lockdown(Week 3+)
Average Item Per Order (across orders containing at least one category item)
Books 41%
Gaming &Media 12%
€ 62 € 62 € 49 € 39 € 57
€ 223
€ 556
€ 209 € 260
€ 207
Pre-Closure Store Closed Lockdown(Week 1)
Lockdown(Week 2)
Lockdown(Week 3+)
Average Order Value (across orders containing at least one category item)
Gaming &Media 38%
Books -16%
COVID-19 ECOMMERCE TRENDS
|13
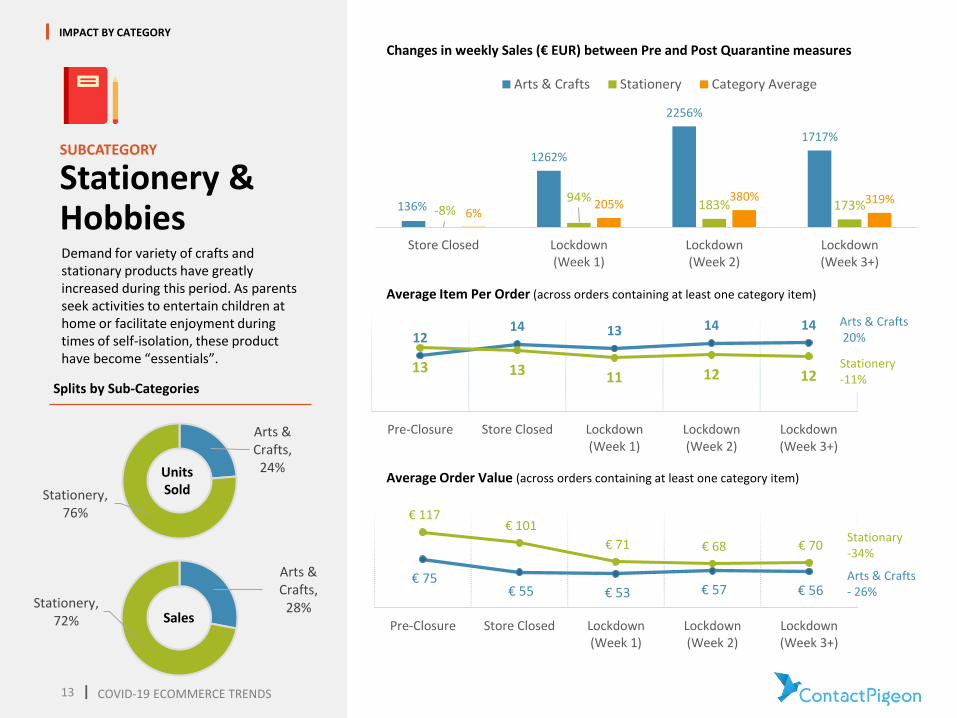
SUBCATEGORY
Stationery & HobbiesDemand for variety of crafts and stationary products have greatly increased during this period. As parents seek activities to entertain children at home or facilitate enjoyment during times of self-isolation, these product have become “essentials”.
IMPACT BY CATEGORY
Arts & Crafts, 24%
Stationery, 76%
Units Sold
Splits by Sub-Categories
Arts & Crafts,
28%Stationery, 72% Sales
136%
1262%
2256%
1717%
-8%94%
183% 173%6%
205%380% 319%
Store Closed Lockdown(Week 1)
Lockdown(Week 2)
Lockdown(Week 3+)
Arts & Crafts Stationery Category Average
Changes in weekly Sales (€ EUR) between Pre and Post Quarantine measures
1214 13 14 14
13 13 11 12 12
Pre-Closure Store Closed Lockdown(Week 1)
Lockdown(Week 2)
Lockdown(Week 3+)
Average Item Per Order (across orders containing at least one category item)
Arts & Crafts20%
Stationery-11%
€ 75 € 55 € 53 € 57 € 56
€ 117 € 101
€ 71 € 68 € 70
Pre-Closure Store Closed Lockdown(Week 1)
Lockdown(Week 2)
Lockdown(Week 3+)
Average Order Value (across orders containing at least one category item)
Stationary-34%
Arts & Crafts- 26%
COVID-19 ECOMMERCE TRENDS
|14
SUBCATEGORY
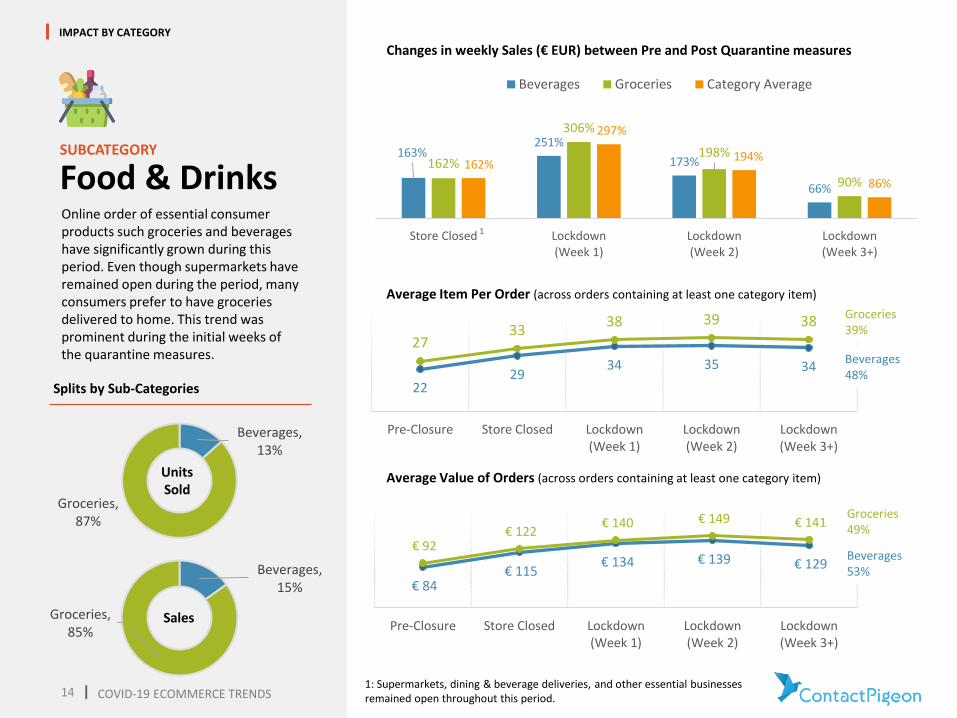
Food & DrinksOnline order of essential consumer products such groceries and beverages have significantly grown during this period. Even though supermarkets have remained open during the period, many consumers prefer to have groceries delivered to home. This trend was prominent during the initial weeks of the quarantine measures.
IMPACT BY CATEGORY
Beverages, 13%
Groceries, 87%
Units Sold
Splits by Sub-Categories
Beverages, 15%
Groceries, 85%
Sales
163%251%
173%
66%
162%
306%
198%
90%
162%
297%
194%
86%
Store Closed Lockdown(Week 1)
Lockdown(Week 2)
Lockdown(Week 3+)
Beverages Groceries Category Average
Changes in weekly Sales (€ EUR) between Pre and Post Quarantine measures
2229
34 35 34
2733
38 39 38
Pre-Closure Store Closed Lockdown(Week 1)
Lockdown(Week 2)
Lockdown(Week 3+)
Average Item Per Order (across orders containing at least one category item)
€ 84 € 115
€ 134 € 139 € 129 € 92
€ 122 € 140 € 149 € 141
Pre-Closure Store Closed Lockdown(Week 1)
Lockdown(Week 2)
Lockdown(Week 3+)
Average Value of Orders (across orders containing at least one category item)
Groceries49%
Beverages53%
1: Supermarkets, dining & beverage deliveries, and other essential businesses remained open throughout this period.
1
Groceries39%
Beverages48%
COVID-19 ECOMMERCE TRENDS
|15
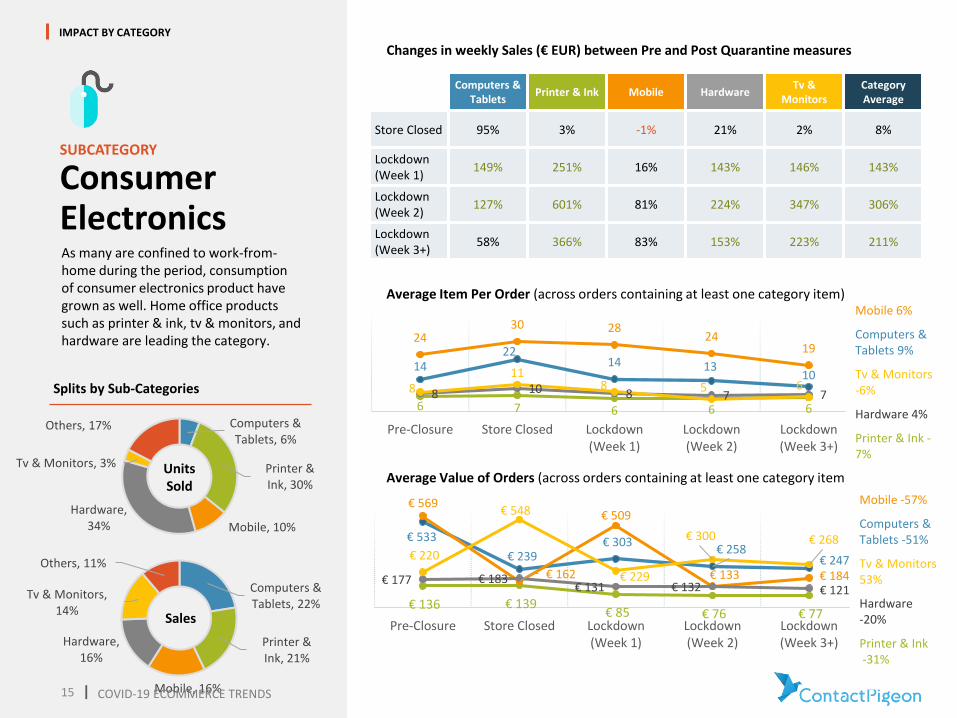
Computers & Tablets, 6%
Printer & Ink, 30%
Mobile, 10%
Hardware, 34%
Tv & Monitors, 3%
Others, 17%
SUBCATEGORY
Consumer ElectronicsAs many are confined to work-from-home during the period, consumption of consumer electronics product have grown as well. Home office products such as printer & ink, tv & monitors, and hardware are leading the category.
IMPACT BY CATEGORY
Units Sold
Splits by Sub-Categories
Computers & Tablets, 22%
Printer & Ink, 21%
Mobile, 16%
Hardware, 16%
Tv & Monitors, 14%
Others, 11%
Sales
Changes in weekly Sales (€ EUR) between Pre and Post Quarantine measures
1422
14 1310
6 7 6 6 6
2430 28
2419
8 10 8 7 7811
8 5 6
Pre-Closure Store Closed Lockdown(Week 1)
Lockdown(Week 2)
Lockdown(Week 3+)
Average Item Per Order (across orders containing at least one category item)
€ 533
€ 239 € 303
€ 258 € 247
€ 136 € 139 € 85 € 76 € 77
€ 569
€ 162
€ 509
€ 133 € 184 € 177 € 183 € 131 € 132 € 121
€ 220
€ 548
€ 229
€ 300 € 268
Pre-Closure Store Closed Lockdown(Week 1)
Lockdown(Week 2)
Lockdown(Week 3+)
Average Value of Orders (across orders containing at least one category item)
Mobile 6%
Computers & Tablets 9%
Tv & Monitors -6%
Hardware 4%
Printer & Ink -7%
Computers & Tablets
Printer & Ink Mobile HardwareTv &
MonitorsCategory Average
Store Closed 95% 3% -1% 21% 2% 8%
Lockdown(Week 1)
149% 251% 16% 143% 146% 143%
Lockdown(Week 2)
127% 601% 81% 224% 347% 306%
Lockdown(Week 3+)
58% 366% 83% 153% 223% 211%
Mobile -57%
Computers & Tablets -51%
Tv & Monitors 53%
Hardware -20%
Printer & Ink-31%
COVID-19 ECOMMERCE TRENDS
|16
SUBCATEGORY
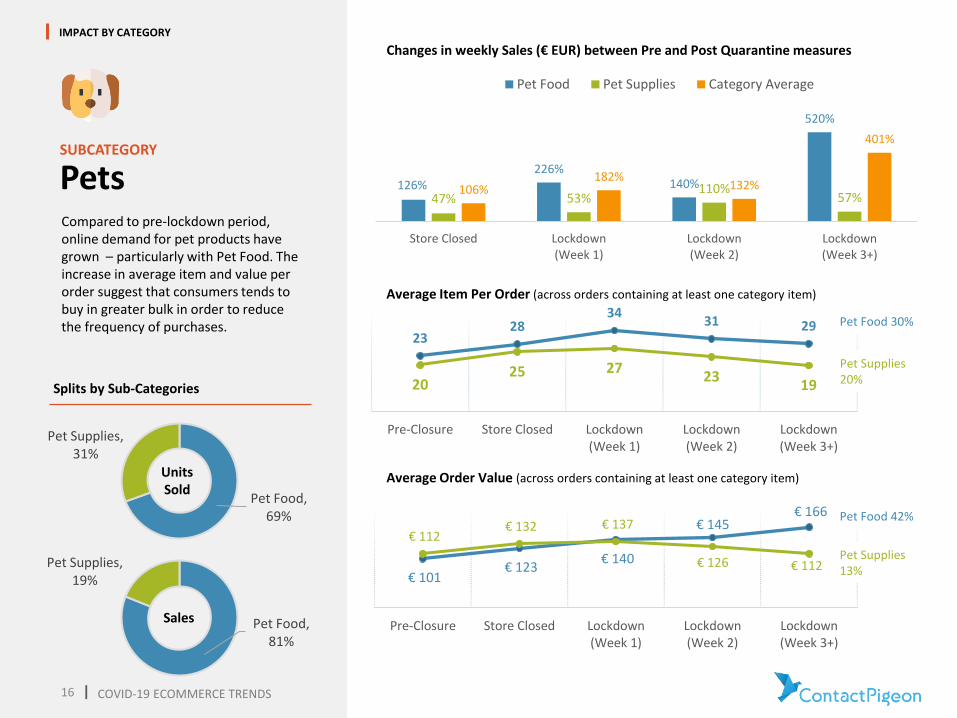
PetsCompared to pre-lockdown period, online demand for pet products have grown – particularly with Pet Food. The increase in average item and value per order suggest that consumers tends to buy in greater bulk in order to reduce the frequency of purchases.
IMPACT BY CATEGORY
Pet Food, 69%
Pet Supplies, 31%
Units Sold
Splits by Sub-Categories
Pet Food, 81%
Pet Supplies, 19%
Sales
126%226%
140%
520%
47% 53%110%
57%106%
182%132%
401%
Store Closed Lockdown(Week 1)
Lockdown(Week 2)
Lockdown(Week 3+)
Pet Food Pet Supplies Category Average
Changes in weekly Sales (€ EUR) between Pre and Post Quarantine measures
2328
3431 29
2025 27
2319
Pre-Closure Store Closed Lockdown(Week 1)
Lockdown(Week 2)
Lockdown(Week 3+)
Average Item Per Order (across orders containing at least one category item)
Pet Food 30%
Pet Supplies20%
€ 101 € 123
€ 140
€ 145 € 166
€ 112 € 132 € 137
€ 126 € 112
Pre-Closure Store Closed Lockdown(Week 1)
Lockdown(Week 2)
Lockdown(Week 3+)
Average Order Value (across orders containing at least one category item)
Pet Food 42%
Pet Supplies13%
COVID-19 ECOMMERCE TRENDS
|17
SUBCATEGORY
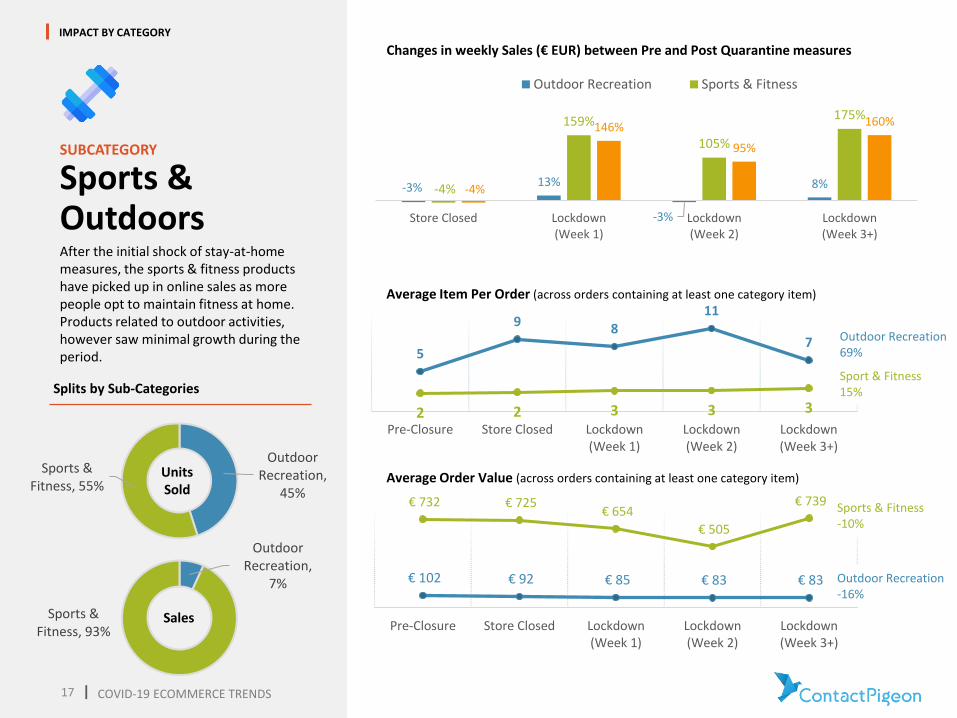
Sports & OutdoorsAfter the initial shock of stay-at-home measures, the sports & fitness products have picked up in online sales as more people opt to maintain fitness at home. Products related to outdoor activities, however saw minimal growth during the period.
IMPACT BY CATEGORY
Outdoor Recreation,
45%
Sports & Fitness, 55%
Units Sold
Splits by Sub-Categories
Outdoor Recreation,
7%
Sports & Fitness, 93%
Sales
-3% 13%
-3%
8%-4%
159%
105%
175%
-4%
146%
95%
160%
Store Closed Lockdown(Week 1)
Lockdown(Week 2)
Lockdown(Week 3+)
Outdoor Recreation Sports & Fitness
Changes in weekly Sales (€ EUR) between Pre and Post Quarantine measures
5
9 811
7
2 2 3 3 3
Pre-Closure Store Closed Lockdown(Week 1)
Lockdown(Week 2)
Lockdown(Week 3+)
Average Item Per Order (across orders containing at least one category item)
Outdoor Recreation69%
Sport & Fitness15%
€ 102 € 92 € 85 € 83 € 83
€ 732 € 725 € 654
€ 505
€ 739
Pre-Closure Store Closed Lockdown(Week 1)
Lockdown(Week 2)
Lockdown(Week 3+)
Average Order Value (across orders containing at least one category item)
Outdoor Recreation-16%
Sports & Fitness-10%
COVID-19 ECOMMERCE TRENDS
|18
SUBCATEGORY
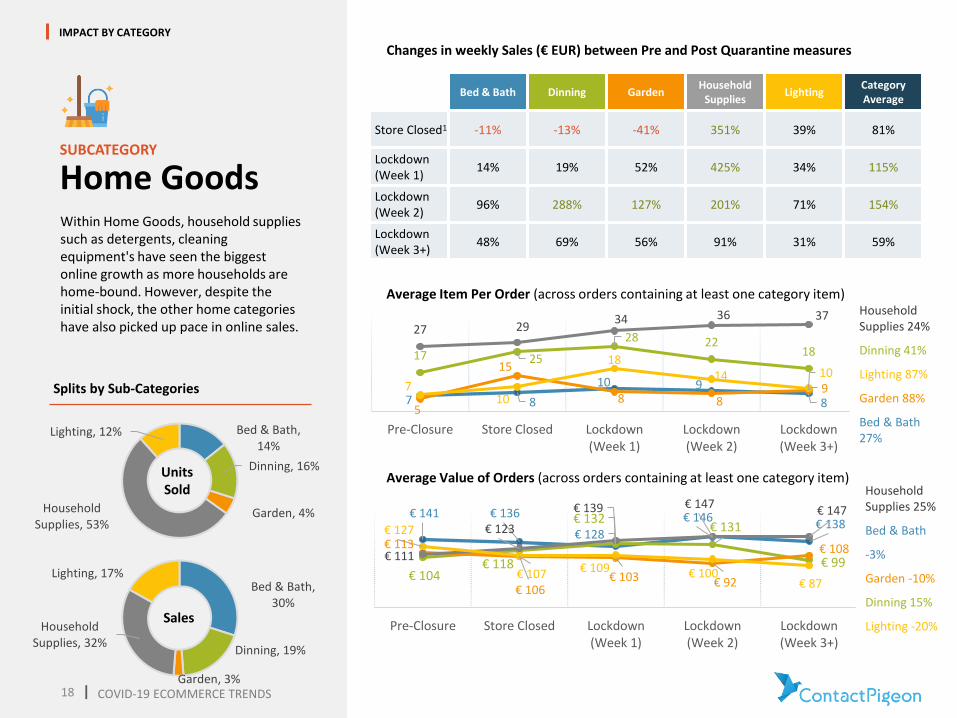
Home GoodsWithin Home Goods, household supplies such as detergents, cleaning equipment's have seen the biggest online growth as more households are home-bound. However, despite the initial shock, the other home categories have also picked up pace in online sales.
IMPACT BY CATEGORY
Bed & Bath, 14%
Dinning, 16%
Garden, 4%Household Supplies, 53%
Lighting, 12%
Units Sold
Splits by Sub-Categories
Bed & Bath, 30%
Dinning, 19%
Garden, 3%
Household Supplies, 32%
Lighting, 17%
Sales
Changes in weekly Sales (€ EUR) between Pre and Post Quarantine measures
Bed & Bath Dinning GardenHousehold
SuppliesLighting
Category Average
Store Closed1 -11% -13% -41% 351% 39% 81%
Lockdown(Week 1)
14% 19% 52% 425% 34% 115%
Lockdown(Week 2)
96% 288% 127% 201% 71% 154%
Lockdown(Week 3+)
48% 69% 56% 91% 31% 59%
7 8
10 9
8
17 25
28 2218
5
15
8 89
27 2934 36 37
710
1814 10
Pre-Closure Store Closed Lockdown(Week 1)
Lockdown(Week 2)
Lockdown(Week 3+)
Average Item Per Order (across orders containing at least one category item)
€ 141 € 136
€ 128
€ 146 € 138
€ 104 € 118
€ 132 € 131
€ 99
€ 113
€ 106 € 103 € 92
€ 108 € 111
€ 123
€ 139 € 147 € 147
€ 127
€ 107 € 109 € 100 € 87
Pre-Closure Store Closed Lockdown(Week 1)
Lockdown(Week 2)
Lockdown(Week 3+)
Average Value of Orders (across orders containing at least one category item)
Household Supplies 24%
Dinning 41%
Lighting 87%
Garden 88%
Bed & Bath 27%
Household Supplies 25%
Bed & Bath
-3%
Garden -10%
Dinning 15%
Lighting -20%
COVID-19 ECOMMERCE TRENDS
|19
SUBCATEGORY
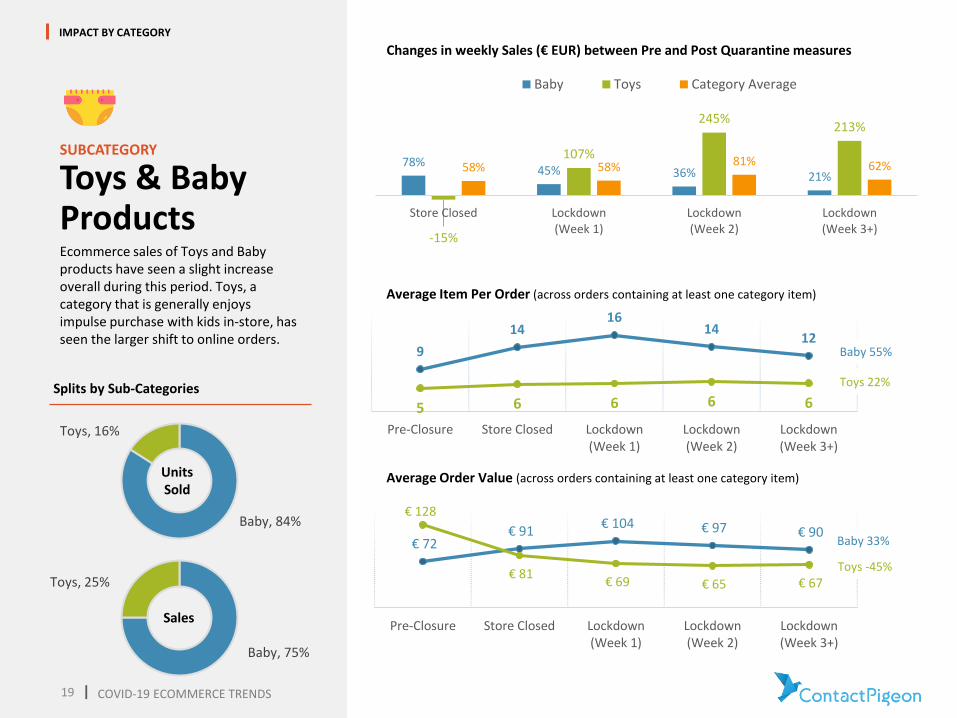
Toys & Baby ProductsEcommerce sales of Toys and Baby products have seen a slight increase overall during this period. Toys, a category that is generally enjoys impulse purchase with kids in-store, has seen the larger shift to online orders.
IMPACT BY CATEGORY
Baby, 84%
Toys, 16%
Units Sold
Splits by Sub-Categories
Baby, 75%
Toys, 25%
Sales
78%45% 36% 21%
-15%
107%
245%213%
58% 58% 81% 62%
Store Closed Lockdown(Week 1)
Lockdown(Week 2)
Lockdown(Week 3+)
Baby Toys Category Average
Changes in weekly Sales (€ EUR) between Pre and Post Quarantine measures
9
1416
1412
5 6 6 6 6
Pre-Closure Store Closed Lockdown(Week 1)
Lockdown(Week 2)
Lockdown(Week 3+)
Average Item Per Order (across orders containing at least one category item)
Baby 55%
Toys 22%
€ 72 € 91
€ 104 € 97 € 90
€ 128
€ 81 € 69 € 65 € 67
Pre-Closure Store Closed Lockdown(Week 1)
Lockdown(Week 2)
Lockdown(Week 3+)
Average Order Value (across orders containing at least one category item)
Toys -45%
Baby 33%
COVID-19 ECOMMERCE TRENDS
|20
SUBCATEGORY
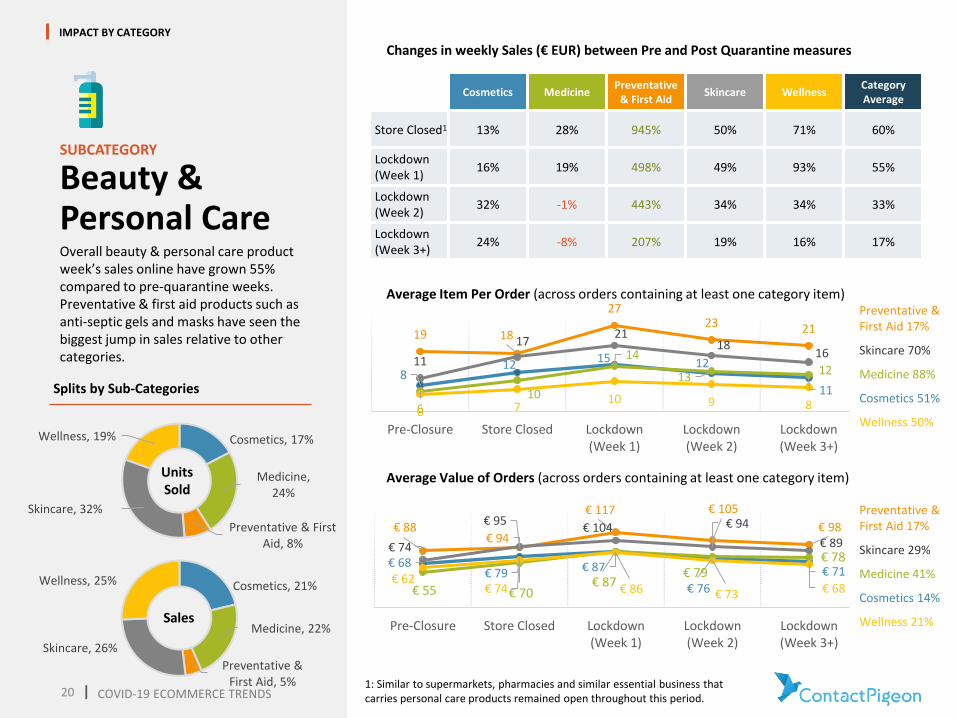
Beauty & Personal CareOverall beauty & personal care product week’s sales online have grown 55% compared to pre-quarantine weeks. Preventative & first aid products such as anti-septic gels and masks have seen the biggest jump in sales relative to other categories.
IMPACT BY CATEGORY
Cosmetics, 17%
Medicine, 24%
Preventative & First Aid, 8%
Skincare, 32%
Wellness, 19%
Units Sold
Splits by Sub-Categories
Cosmetics, 21%
Medicine, 22%
Preventative & First Aid, 5%
Skincare, 26%
Wellness, 25%
Sales
Changes in weekly Sales (€ EUR) between Pre and Post Quarantine measures
Cosmetics MedicinePreventative
& First AidSkincare Wellness
Category Average
Store Closed1 13% 28% 945% 50% 71% 60%
Lockdown(Week 1)
16% 19% 498% 49% 93% 55%
Lockdown(Week 2)
32% -1% 443% 34% 34% 33%
Lockdown(Week 3+)
24% -8% 207% 19% 16% 17%
812 15 12
11
610
14
1312
19 18
2723 21
11
1721
1816
6 710 9 8
Pre-Closure Store Closed Lockdown(Week 1)
Lockdown(Week 2)
Lockdown(Week 3+)
Average Item Per Order (across orders containing at least one category item)
€ 68 € 79 € 87
€ 76
€ 71
€ 55 € 70 € 87
€ 79 € 78
€ 88 € 94
€ 117 € 105
€ 98
€ 74
€ 95 € 104 € 94
€ 89
€ 62 € 74 € 86 € 73 € 68
Pre-Closure Store Closed Lockdown(Week 1)
Lockdown(Week 2)
Lockdown(Week 3+)
Average Value of Orders (across orders containing at least one category item)
Preventative & First Aid 17%
Skincare 70%
Medicine 88%
Cosmetics 51%
Wellness 50%
1: Similar to supermarkets, pharmacies and similar essential business that carries personal care products remained open throughout this period.
Preventative & First Aid 17%
Skincare 29%
Medicine 41%
Cosmetics 14%
Wellness 21%
COVID-19 ECOMMERCE TRENDS
|21
SUBCATEGORY
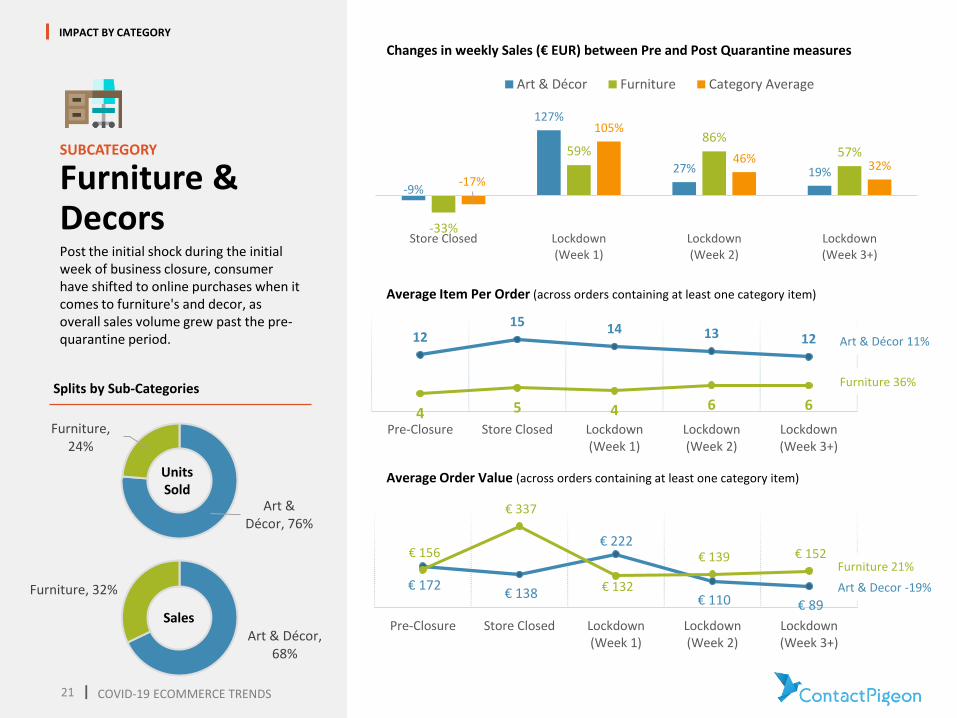
Furniture & DecorsPost the initial shock during the initial week of business closure, consumer have shifted to online purchases when it comes to furniture's and decor, as overall sales volume grew past the pre-quarantine period.
IMPACT BY CATEGORY
Art & Décor, 76%
Furniture, 24%
Units Sold
Splits by Sub-Categories
Art & Décor, 68%
Furniture, 32%
Sales
-9%
127%
27% 19%
-33%
59%86%
57%
-17%
105%
46%32%
Store Closed Lockdown(Week 1)
Lockdown(Week 2)
Lockdown(Week 3+)
Art & Décor Furniture Category Average
Changes in weekly Sales (€ EUR) between Pre and Post Quarantine measures
1215 14 13 12
4 5 4 6 6
Pre-Closure Store Closed Lockdown(Week 1)
Lockdown(Week 2)
Lockdown(Week 3+)
Average Item Per Order (across orders containing at least one category item)
Art & Décor 11%
Furniture 36%
€ 172 € 138
€ 222
€ 110 € 89
€ 156
€ 337
€ 132
€ 139 € 152
Pre-Closure Store Closed Lockdown(Week 1)
Lockdown(Week 2)
Lockdown(Week 3+)
Average Order Value (across orders containing at least one category item)
Furniture 21%
Art & Decor -19%
COVID-19 ECOMMERCE TRENDS
|22
SUBCATEGORY
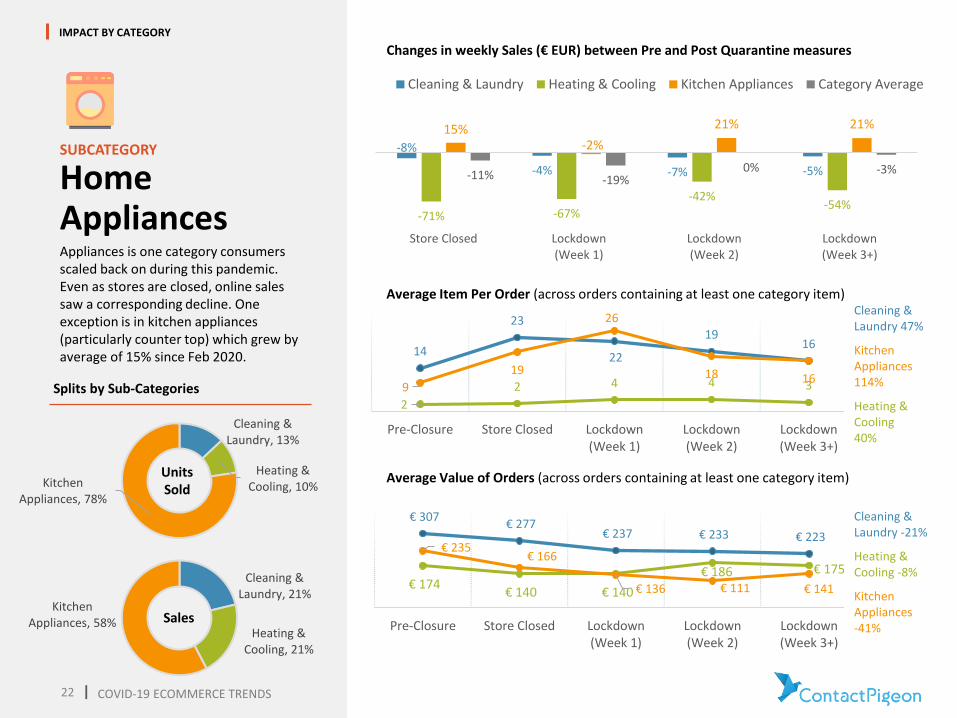
Home AppliancesAppliances is one category consumers scaled back on during this pandemic. Even as stores are closed, online sales saw a corresponding decline. One exception is in kitchen appliances (particularly counter top) which grew by average of 15% since Feb 2020.
IMPACT BY CATEGORY
Cleaning & Laundry, 13%
Heating & Cooling, 10%Kitchen
Appliances, 78%
Units Sold
Splits by Sub-Categories
Cleaning & Laundry, 21%
Heating & Cooling, 21%
Kitchen Appliances, 58% Sales
Changes in weekly Sales (€ EUR) between Pre and Post Quarantine measures
14
23
22
1916
2
2 4 4 39
19
26
18 16
Pre-Closure Store Closed Lockdown(Week 1)
Lockdown(Week 2)
Lockdown(Week 3+)
Average Item Per Order (across orders containing at least one category item)
€ 307 € 277
€ 237 € 233 € 223
€ 174 € 140 € 140
€ 186 € 175
€ 235 € 166
€ 136 € 111 € 141
Pre-Closure Store Closed Lockdown(Week 1)
Lockdown(Week 2)
Lockdown(Week 3+)
Average Value of Orders (across orders containing at least one category item)
Cleaning & Laundry -21%
Heating & Cooling -8%
Kitchen Appliances -41%
-8%
-4% -7% -5%
-71% -67%
-42%-54%
15%-2%
21% 21%
-11% -19%0% -3%
Store Closed Lockdown(Week 1)
Lockdown(Week 2)
Lockdown(Week 3+)
Cleaning & Laundry Heating & Cooling Kitchen Appliances Category Average
Cleaning & Laundry 47%
Kitchen Appliances 114%
Heating & Cooling40%
COVID-19 ECOMMERCE TRENDS
|23
SUBCATEGORY
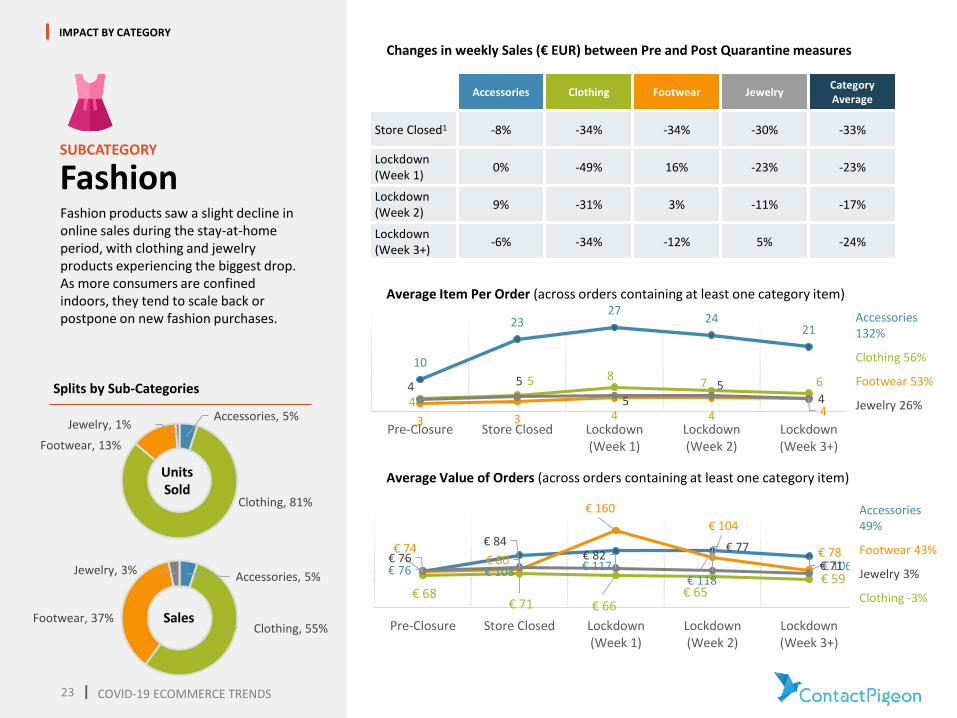
FashionFashion products saw a slight decline in online sales during the stay-at-home period, with clothing and jewelry products experiencing the biggest drop.As more consumers are confined indoors, they tend to scale back or postpone on new fashion purchases.
IMPACT BY CATEGORY
Accessories, 5%
Clothing, 81%
Footwear, 13%
Jewelry, 1%
Units Sold
Splits by Sub-Categories
Accessories, 5%
Clothing, 55%Footwear, 37%
Jewelry, 3%
Sales
Changes in weekly Sales (€ EUR) between Pre and Post Quarantine measures
Accessories Clothing Footwear JewelryCategory Average
Store Closed1 -8% -34% -34% -30% -33%
Lockdown(Week 1)
0% -49% 16% -23% -23%
Lockdown(Week 2)
9% -31% 3% -11% -17%
Lockdown(Week 3+)
-6% -34% -12% 5% -24%
10
2327
2421
4
5 87 6
3 3 4 4 4
4 5
55
4
Pre-Closure Store Closed Lockdown(Week 1)
Lockdown(Week 2)
Lockdown(Week 3+)
Average Item Per Order (across orders containing at least one category item)
€ 76 € 108 € 117 € 118
€ 106
€ 68 € 71 € 66
€ 65 € 59
€ 74 € 80
€ 160
€ 104
€ 78 € 76
€ 84 € 82
€ 77
€ 71
Pre-Closure Store Closed Lockdown(Week 1)
Lockdown(Week 2)
Lockdown(Week 3+)
Average Value of Orders (across orders containing at least one category item)
Accessories 132%
Clothing 56%
Footwear 53%
Jewelry 26%
Accessories 49%
Footwear 43%
Jewelry 3%
Clothing -3%
COVID-19 ECOMMERCE TRENDS
24 |
Additional notes
1. Average item per order: reflects the number of items within completed online order containing at least one of the category item.
2. Average order value: reflects the average EUR value of orders containing at least one item belonging to the category. For example, in a basket for supermarket containing both beverage and grocery products, the order will be counted towards both product category as calculated average.
3. The two metrics (average item per order, average order value) are often correlational. In some major categories, the metrics have shifted to negative correlation (e.g., increased items per order at lower average order value), indicating trends in consumption behavior to opt for lower value items across the entire basket.
4. While Stay-at-home orders are gradually lifted, millions of consumers have been introduced and reinforced new online buying behaviors and habits. In many families, online grocery, food ordering, and entertainment shopping will likely replace visits to stores until the pandemic subsides. Businesses that have invested heavily in online commerce or omnichannel engagement capabilities are better positioned to take advantage of the new normal.
COVID-19 ECOMMERCE TRENDS

About UsContactPigeon is an omnichannel customer engagement platform for building better engagements between businesses and its customers – one that’s effective, timely, and individualistic – across all communication channels.
By bringing together customer insights between online & offline sources, ContactPigeon solves the missing piece of the marketing puzzle.
Hundreds of retail and eCommerce brands, including L’Oreal, Hertz, Fujitsu and Plaisio, trusts ContactPigeon to drive increased revenues with less effort by connecting customers to the brands they love.
US: +1 (800) 4901732
EU: +30 211 8006178
www.contactpigeon.com
Learn more at: