early moments of bleve: from vessel opening to liquid
TRANSCRIPT

HAL Id: hal-02428264https://hal.mines-ales.fr/hal-02428264
Submitted on 28 Jul 2020
HAL is a multi-disciplinary open accessarchive for the deposit and dissemination of sci-entific research documents, whether they are pub-lished or not. The documents may come fromteaching and research institutions in France orabroad, or from public or private research centers.
L’archive ouverte pluridisciplinaire HAL, estdestinée au dépôt et à la diffusion de documentsscientifiques de niveau recherche, publiés ou non,émanant des établissements d’enseignement et derecherche français ou étrangers, des laboratoirespublics ou privés.
Early moments of BLEVE: From vessel opening to liquidflashing release
A.M. Birk, R. Eyssette, F. Heymes
To cite this version:A.M. Birk, R. Eyssette, F. Heymes. Early moments of BLEVE: From vessel opening to liq-uid flashing release. Process Safety and Environmental Protection, Elsevier, 2019, 132, pp.35-46.�10.1016/j.psep.2019.09.028�. �hal-02428264�
Er
Aa
b
KBBEOEHTLE
TsbttB
ttf
qfdffiotsem
1
1
iyqstcm
Q
arly moments of BLEVE: From vessel opening to liquid flashingelease
.M. Birk a, R. Eyssette a,b,∗, F. Heymesb
Department of Mechanical and Materials Engineering, Queen’s University, Kingston, Ontario, Canada LGEI, IMT Mines Alès, Alès, France
eywords:LEVEoiling liquid expanding vapor explosionxplosionverpressurexperimental results
a b s t r a c t
he boiling liquid expanding vapour explosion (BLEVE) is well known but not well understood. Sometill argue about what comes first, the BLEVE or the vessel rupture. Some believe the BLEVE is triggeredy some pressure transient inside the vessel and this causes a superheat limit explosion which causeshe vessel to rupture. Others believe it is the vessel rupture by some weakening process that leads tohe BLEVE. This paper will provide evidence that the latter description that is correct for most, if not allLEVEs observed in practice.This paper describes small scale experiments of aluminum tubes that were weakened by machining a
hinned wall area over a specified length. The tubes were filled to a desired level with liquid propane andhen the propane was uniformly heated electrically until the tubes failed. The failure pressures rangedrom 10 to 33 bar.
The tube was instrumented to capture failure characteristics (pressure, temperature) and conse-uences: blast overpressure and imaging of the propane cloud and shock around the vessel; groundorce under it; transient pressure and imaging of the boiling process inside the vessel. The work wasone to improve our understanding of the fluid – structure interactions during the fire heat inducedailure of a pressure vessel holding a pressure liquefied gas. We were specifically interested in the neareld hazards including blast overpressure and ground force. This paper will focus on the early millisec-nds of the process where the vessel begins to open and a shock wave is formed and moves out intohe surroundings. The imaging reveals presence of a Mach shock at the exit of the vessel at the earlytage of the opening. A chronology of the event also shows that the lead shock is generated early in thexplosion process, and is long gone before the liquid starts boiling, arguing that vapour expansion is theain contributor to the first shock overpressure.
igh speed imagingimeline analysisead shockxplosive phase change
. Introduction
.1. Background and motivation
The Boiling Liquid Expanding Vapor (BLEVE) is a feared accidentn the industry. Many cases have been reported over the past 60ears throughout the world (Hemmatian et al., 2019). Their conse-uences are often deadly and very destructive for the surroundingtructures. There has been a lot of studies on the multiple hazards
his accident generates to understand it better and predicted itsonsequences (Abbasi and Abbasi, 2007; Eckhoff, 2014). However,odels to predict these hazards consequences are based on diverg-∗ Corresponding author at: Department of Mechanical and Materials Engineering,ueen’s University, Kingston, Ontario, Canada.
E-mail address: [email protected] (R. Eyssette).
ing interpretations of the physics of the phenomenon (Laboureuret al., 2014). This work aims at refining our understanding of thedifferent physical phenomena involved in a BLEVE.
The definition of BLEVE has evolved through the years with ourunderstanding of it. In this paper we use the following definitionof a BLEVE (Birk et al., 2007) “the explosive release of expand-ing vapour and flashing liquid when a pressure vessel holding apressure liquefied gas fails catastrophically”
From this definition a BLEVE requires
i) an explosion which suggests a supersonic shock wave is sentinto the surroundings
ii) a pressure liquefied gas must be present to generate a rapidphase change event
iii) the vessel must fail catastrophically and open fully to releaseits contents

Fig. 1. the starting of a lead shock from the transient flow from an opening in a pressurized container (from Radulescu and Law, 2007).
F of jetp
dt
aiff
ridtb
1
tw(
ig. 2. Pressure Distribution along axis of fish mouth opening on vessel with imageressure approximately 20 Barg) (Laboureur et al., 2015).
There is no mention of the atmospheric superheat limit in thisefinition, as mentioned in older definitions. We will come back tohis point later in this paper.
There is a current need to understand the near field hazards fromBLEVE. The most recent BLEVE in the news was one on a bridge
n Bologna Italy in 2018 (Vigilfuoco.tv, 2018).This tanker truck suf-ered a BLEVE and the load on the bridge caused the bridge deck toail.
Over the years the authors have been asked by emergencyesponders what the near field effects are. These near field effectsnclude the blast overpressure, ground loading, overpressure andrag loading from the flashing liquid, projectile effects and of coursehe fireball if the cloud is flammable. This paper will focus on thelast wave, liquid flashing and ground loading.
.2. The vessel opening process
It is known from high speed imaging (Laboureur et al., 2015)hat the vessel failure starts as a pin hole near the top of the vesselall in the severely heated (weakened) area. In a single step BLEVE
Birk et al., 2007) this pin hole grows rapidly and continuously along
showing Mach shock standing beyond opening (vessel D =0.61 m, propane, failure
the vessel top in the axial direction, then it turns circumferentiallyat both ends of the weakened length. The pressure forces on theunsupported edges of the wall bend the vessel wall flaps up to openthe vessel. The power of the expanding vapour and flashing liquidrelease usually opens the vessel completely and flattens the openvessel cylinder wall on the ground.
When the vessel is not fully filled with liquid, the opening ini-tially sends out a high speed jet of vapour that pushes on thesurrounding atmosphere like a piston. As the opening grows thisjet grows in size and speed and the piston effect gets larger andstronger. A series of compression waves are sent out by the expand-ing jet cloud and the following compression waves catch up withthe leading waves to produce a shock wave. This shock wave growsto full strength at some distance from the vessel wall. The distancefrom the wall and the shock strength depend on how quickly thevessel opens and this depends on the failure pressure and the extentof the weakened area of the wall. The maximum overpressure of
this lead shock can be estimated using the 1D shock tube equationas will be shown later.This lead shock travels at supersonic speed out into the sur-rounding atmosphere and it decays with distance. This is the
Fal
mtoCuoaatbtd2mili
otbtsioomgti
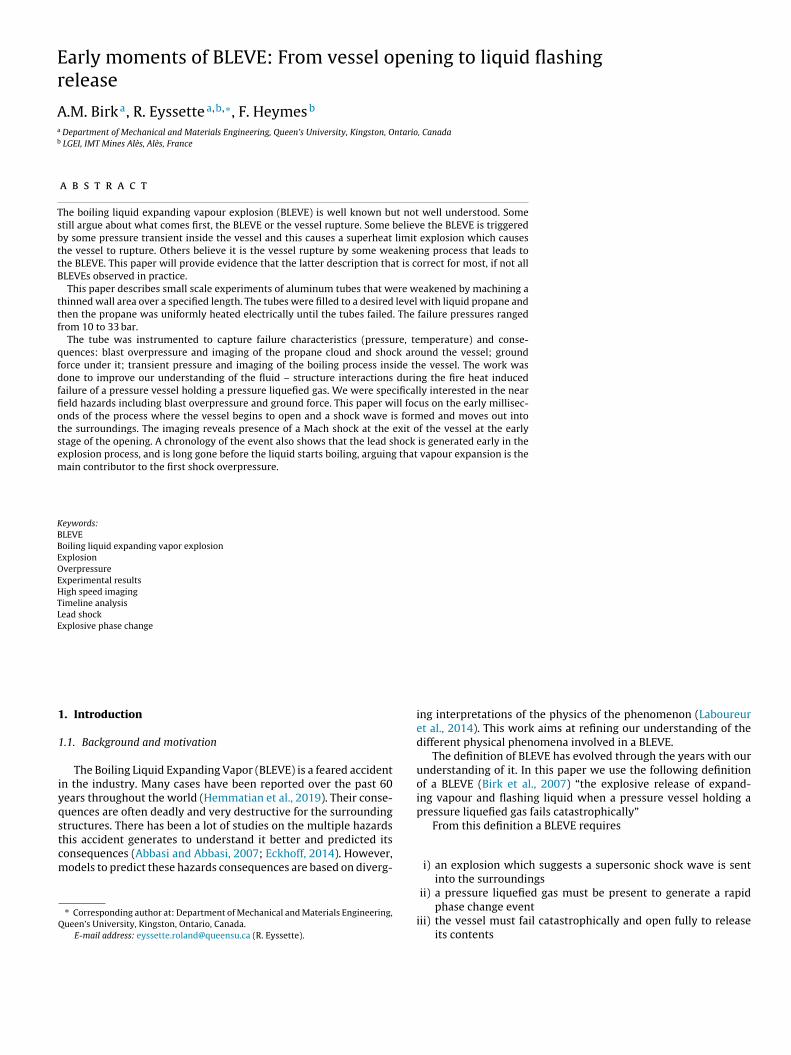
ig. 3. Image of opened tube with flattened part still attached to ends. Failure runslong top of tube and then turns circumferentially at the ends of the weakenedength.
oving lead shock produced by a BLEVE and it can do damage inhe near and far field. There are many correlations available in thepen literature (Casal and Salla, 2006; Genova et al., 2008; Planas-uchi et al., 2004; Prugh, 1991; Sellami et al., 2018) that can besed to predict the overpressure vs distance for the far field. Manyf these correlations are based on the liquid energy in the vesselnd then some factor is applied to adjust for the energy that actu-lly goes into the shock wave. These can be used for the far field buthey should probably not be used for the near field. Other modelsased on numerical simulations use the boiling dynamic of the fluido determine the overpressure generated by the explosion (vanen Berg et al., 2004; Hansen and Kjellander, 2016; Pinhasi et al.,007; Yakush, 2016). Some ideal hypotheses are implemented toake the calculation possible, such as the vessel wall disappearing
nstantaneously, the two-phase fluid being in homogeneous equi-ibrium, and more. In reality it is questionable that the liquid energys the source of the lead shock as will be argued in this paper.
While the lead shock is being generated the jet flow from thepening develops to become a choked sonic flow somewhere nearhe minimum opening area. This sonic jet continues to expandeyond the opening into a supersonic jet. This flow then goeshrough a normal shock (Mach shock) to reduce the flow back toubsonic velocity and a pressure more in line with the surround-ngs. This shock (Mach shock) as shown in Fig. 1 stands near thepening in the vessel wall. The barrel shock spreads from the sidesf the opening to meet up with the Mach shock. The barrel shock
arks the edge of the rapidly accelerating supersonic jet before itoes through the Mach shock to return to subsonic flow. We also seehe edge of the jet interface behind the lead shock. The lead shocks generated by the expanding jet pushing on the surrounding air
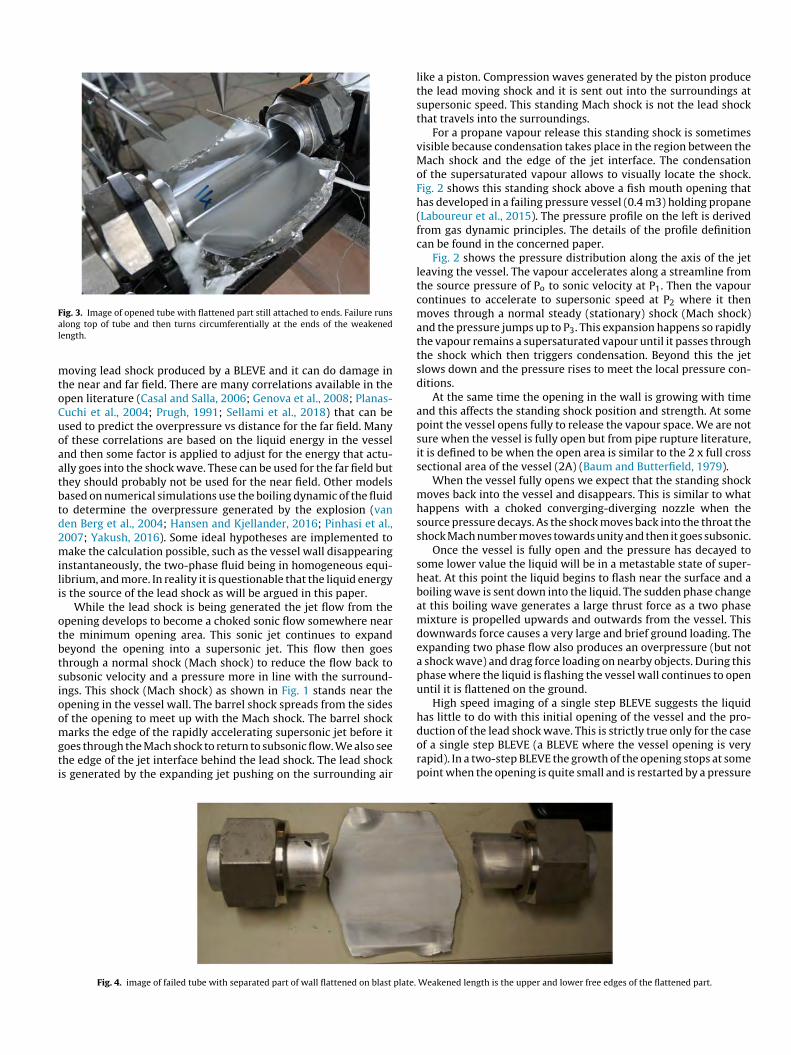
Fig. 4. image of failed tube with separated part of wall flattened on blast plate.
like a piston. Compression waves generated by the piston producethe lead moving shock and it is sent out into the surroundings atsupersonic speed. This standing Mach shock is not the lead shockthat travels into the surroundings.
For a propane vapour release this standing shock is sometimesvisible because condensation takes place in the region between theMach shock and the edge of the jet interface. The condensationof the supersaturated vapour allows to visually locate the shock.Fig. 2 shows this standing shock above a fish mouth opening thathas developed in a failing pressure vessel (0.4 m3) holding propane(Laboureur et al., 2015). The pressure profile on the left is derivedfrom gas dynamic principles. The details of the profile definitioncan be found in the concerned paper.
Fig. 2 shows the pressure distribution along the axis of the jetleaving the vessel. The vapour accelerates along a streamline fromthe source pressure of Po to sonic velocity at P1. Then the vapourcontinues to accelerate to supersonic speed at P2 where it thenmoves through a normal steady (stationary) shock (Mach shock)and the pressure jumps up to P3. This expansion happens so rapidlythe vapour remains a supersaturated vapour until it passes throughthe shock which then triggers condensation. Beyond this the jetslows down and the pressure rises to meet the local pressure con-ditions.
At the same time the opening in the wall is growing with timeand this affects the standing shock position and strength. At somepoint the vessel opens fully to release the vapour space. We are notsure when the vessel is fully open but from pipe rupture literature,it is defined to be when the open area is similar to the 2 x full crosssectional area of the vessel (2A) (Baum and Butterfield, 1979).
When the vessel fully opens we expect that the standing shockmoves back into the vessel and disappears. This is similar to whathappens with a choked converging-diverging nozzle when thesource pressure decays. As the shock moves back into the throat theshock Mach number moves towards unity and then it goes subsonic.
Once the vessel is fully open and the pressure has decayed tosome lower value the liquid will be in a metastable state of super-heat. At this point the liquid begins to flash near the surface and aboiling wave is sent down into the liquid. The sudden phase changeat this boiling wave generates a large thrust force as a two phasemixture is propelled upwards and outwards from the vessel. Thisdownwards force causes a very large and brief ground loading. Theexpanding two phase flow also produces an overpressure (but nota shock wave) and drag force loading on nearby objects. During thisphase where the liquid is flashing the vessel wall continues to openuntil it is flattened on the ground.
High speed imaging of a single step BLEVE suggests the liquidhas little to do with this initial opening of the vessel and the pro-
duction of the lead shock wave. This is strictly true only for the caseof a single step BLEVE (a BLEVE where the vessel opening is veryrapid). In a two-step BLEVE the growth of the opening stops at somepoint when the opening is quite small and is restarted by a pressureWeakened length is the upper and lower free edges of the flattened part.
tflt
1
t
i
i
v
fg
w
a
ga
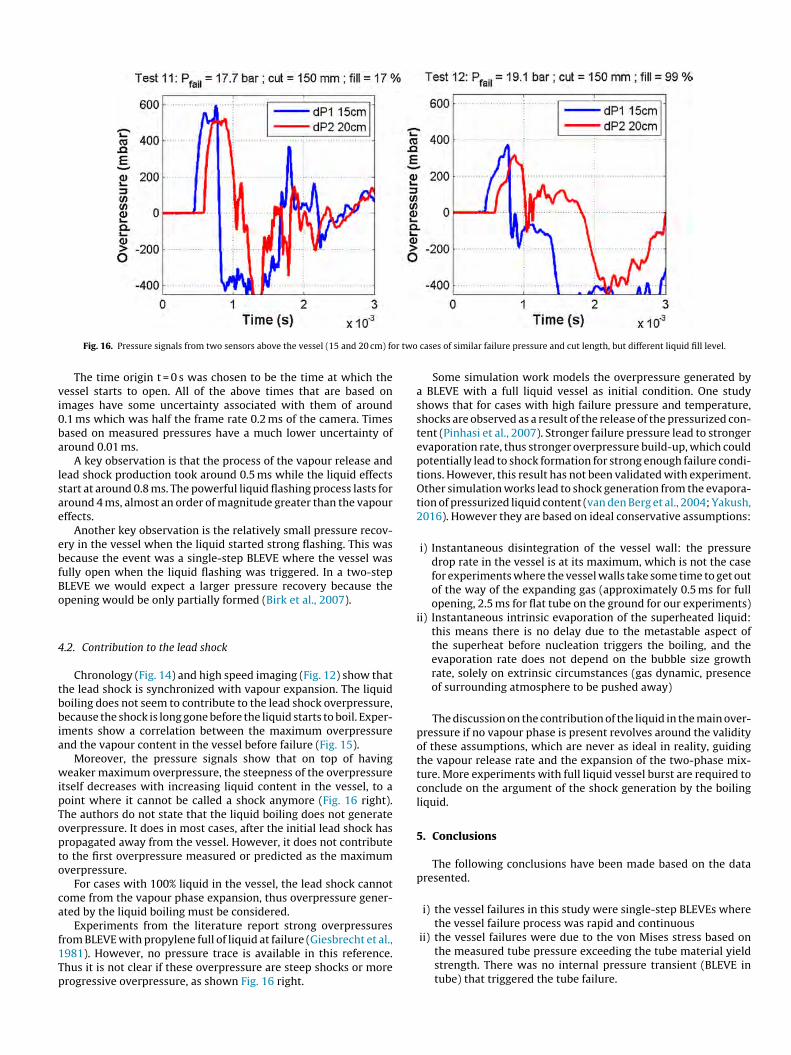
Fig. 5. 0.4 m3 pressure vessel suffering a BLEVE. Failure runs along top of vessel andturns circumferentially at the ends. This vessel eventually flattened on the ground.
ransient in the vessel. This pressure transient is likely due to liquidashing caused by the initial pressure drop as the opening startedo grow.
.3. Dimensional analysis
This dimensional analysis is based on the following assump-ions:
i) fluid viscosity is not an important factor in this analysisii) important fluid properties include the liquid and vapour den-
sity, the surface tension, and the ratio of specific heats k of thevapour.
ii) the lead shock overpressure is a function of how quickly thevessel opens and the volume and pressure-temperature of thevapour space.
v) the speed of this vessel opening is determined by the cut length,the tube wall thickness, and the failure pressure which is deter-mined by the liquid temperature.
v) the ground force depends on how quickly the vessel opens, thefailure pressure, the tube size and the liquid fill level
i) the surface tension is included to acknowledge there may be ascale effect that we are not including with our small scale appa-ratus. However, it should be noted that similar processes andoverpressures have been observed in vessels with diameterstwenty times (volumes 1800/0.6 = 3000 times) greater than inthese experiments (Birk and VanderSteen, 2006)
The dimensional analysis has been conducted and suggests theollowing functional relationship for the blast overpressure andround loading.
Fg
Pf LD= f
[L
D,
Lc
L,
tw
D, fill,
T
Tsl,
T
Tsat,
�dd
Pf D2, k,
�g
�f
](1)
dPs
dPst= f
[L
D,
Lc
L,
tw
D, fill,
T
Tsl,
T
Tsat,
�dd
Pf D2,
R
Ro, k,
�g
�f,
Pf D
2tw�yld
](2)
here,D = tube diameterdd = vapour bubble or liquid droplet diameter� = surface tensionL = tube lengthLc = weakened cut lengthtw = tube wall thicknessfill = liquid fill fractionT = liquid temperatureTsl = atmospheric superheat limit temperatureTsat = saturation temperature for failure pressurePf = failure pressuredPst = overpressure from 1D shock tube equation from Pf and T
nd k = cp/cv
dPs = peak overpressure at RRo = radius of sphere with same volume as vapour space�yld = yield strength of the tube materialIn this series of experiments, a number of these variables and
roups were held constant (D, L, tw, propane, k and dd and T/Tsat = 1)nd the equations simplify to:
Fg = f[
Lc , fill,T
](3)
Pf LD L Tsl
dPs
dPst= f
[Lc
L, fill,
T
Tsl,
R
Ro
](4) i
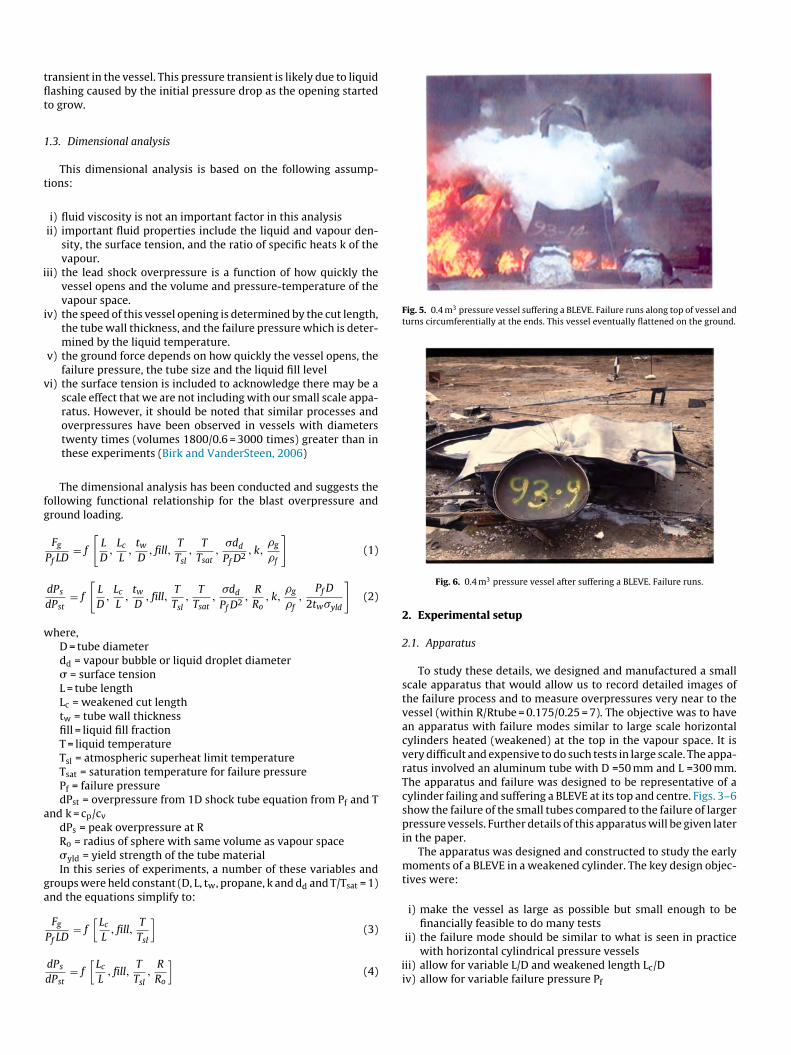
Fig. 6. 0.4 m3 pressure vessel after suffering a BLEVE. Failure runs.
2. Experimental setup
2.1. Apparatus
To study these details, we designed and manufactured a smallscale apparatus that would allow us to record detailed images ofthe failure process and to measure overpressures very near to thevessel (within R/Rtube = 0.175/0.25 = 7). The objective was to havean apparatus with failure modes similar to large scale horizontalcylinders heated (weakened) at the top in the vapour space. It isvery difficult and expensive to do such tests in large scale. The appa-ratus involved an aluminum tube with D =50 mm and L =300 mm.The apparatus and failure was designed to be representative of acylinder failing and suffering a BLEVE at its top and centre. Figs. 3–6show the failure of the small tubes compared to the failure of largerpressure vessels. Further details of this apparatus will be given laterin the paper.
The apparatus was designed and constructed to study the earlymoments of a BLEVE in a weakened cylinder. The key design objec-tives were:
i) make the vessel as large as possible but small enough to befinancially feasible to do many tests
ii) the failure mode should be similar to what is seen in practice
with horizontal cylindrical pressure vesselsii) allow for variable L/D and weakened length Lc/Div) allow for variable failure pressure Pf

i
ii
ivv
v
vivii
ixx
This apparatus consisted of the following parts:
i) aluminum tube (6061 T6 annealed to T0) with D =50 mm and L=300 mm with wall thickness 1.6 mm
i) top of the tube machined to reduce the wall thickness overlength Lc to give desired failure pressure in the range 10–35 bar.
i) Swagelok end caps. One machined to accept fill and vent lines,two thermocouples (type K 1 mm diameter), pressure transduc-ers (TC-Direct 716-072) and a high speed pressure transducer(PCB M101A02). The other end cap machined to have a 30 mmdiameter window
) electric heater machined to cover bottom 30% of tube surface) cradle to hold tube in position
i) blast plate below tube supported on high speed load cells (PCBM202B)
i) pencil type blast gauges (PCB 137A23) at various positionsi) high speed video viewing window end, tube side and top (high
speed cameras available: Phantom V711, V2512, VEO710 andPhotron SA3)
) High speed shadowgraph viewing side and end (same cameras)) electric valves to allow for purging, fill and venting the tube
Fig. 7. Schematic diagram of tube
Fig. 8. Failure Temperatures and Pressures compar
Fig. 7 shows a schematic of the apparatus. Further details of theapparatus can be found in (Eyssette, 2018).
2.2. Test procedure
The tests were conducted indoors in a large high ceiling, wellventilated lab. The test procedure was as follows
i) the tube was assembled with the end caps and mounted in thecradle.
ii) all instruments were connected and checked for operation.iii) the data acquisition systems were turned on and data was
recorded.iv) the tube was purged of air using several fill and vent cycles
with propane liquid.v) the tube was then filled with liquid propane to the desired fill
condition.
vi) the electric heater was then turned on to slowly heat the liquiduntil the tube failed (5–20 minutes heating).vii) the failure process was captured with high speed video and
shadowgraph (Settles, 2001)
apparatus (tube D =50 mm).
ed to saturation pressure curve for propane.

hotro
v
3
ii
v
3
wfssBw
t
Fig. 9. Side view with direct high speed imaging (camera P
iii) all data was saved.
. Results
The following results are shown here:
i) liquid temperature saturation condition at failureii) high speed images of vessel opening and formation of standing
shockii) high speed shadowgraph showing formation of lead shockv) high speed imaging of top of vessel as wall opens showing liquid
surfacev) high speed imaging of window end showing boiling wave after
the vessel is fully open (2 x-sect area)i) peak overpressure vs distance showing location of formation
of lead shock and decay of pressure following spherical shocktheory
.1. Failure pressure and liquid temperature
The tests were conducted over a range of failure pressures. Thisas done by machining the aluminum tubes to give the desired
ailure pressure. During each test the liquid propane was heatedlowly until the tube failed when the von-Mises stress (0.866 hooptress) in the tube wall was near the yield strength of the aluminum.
ecause of machining tolerances this method gave failure pressuresithin 10% of the desired failure pressure.As can be seen from Fig. 8 almost all of the tests took place alonghe saturation curve for propane where the liquid and vapour are in
n SA3, �t = 200�s, Pf = 18.6bar ; fill = 56% ; Lc = 75mm).
saturated equilibrium. This was desirable in this test to eliminatethe one variable T/Tsat. This is not always the case is real worldBLEVEs where there can be significant temperature stratificationin the liquid and vapour space (Birk and Cunningham, 1996).
It is also important to note that the failure temperatures werebelow, at and above the atmospheric superheat limit for propane(52 ◦C). There were no extraordinary events when the Tsl wasreached or exceeded. Of course the small scale may have had someeffect on this. However similar results have been seen in muchlarger scales (volumes 3000 times larger) (Birk et al., 2006; Johnsonand Pritchard, 1991).
3.2. High speed imaging and shadowgraph
The following figures show the early moments of the tube failureand the release of the vapour and liquid. Not all of the images arefrom the same test because we did not have enough equipment todo all views at the same time.
3.2.1. High speed imaging – side viewThe example of high speed imaging of the tube side is from a
test with the following conditions:
Pf = 18.6bar ; fill = 56% ; Lc = 75mm ; frame time step �t = 0.2ms
One example of high speed imaging from a test is shown in
Fig. 5. This example was chosen because it shows the creation of thestanding shock and vapour condensation above the failure open-ing very clearly. Although it is not visible in these images, the leadshock was above the initial white cloud and quickly left the field of
Fig. 10. Top view with direct high speed imaging (Camera Phantom VEO710, �t = 52�s, Pf = 19.3bar ; fill = 84% ; Lc = 150mm).
(Came
vb
stctI
Fig. 11. Axial end view with direct high speed imaging
iew because it was moving much faster than the cloud. This wille shown in subsequent images.
In frame a) we see nothing because the failure opening has nottarted. By frame b) 0.2 ms later the opening has already grownhe full length of the weakened length of 75 mm. In frames b),
) d) and e) the fish mouth opening is growing to fully openhe vessel (open area greater than 2 x tube cross sectional area).n frames b) and c) you can clearly see the curved Mach shockra Phantom V711, Pf = 28bar ; fill = 56% ; Lc = 75mm).
on the top with condensation of vapour trailing after the shock.You can also see the barrel shock on the sides leading fromthe ends of the fish mouth opening. By frame e) something hashappened to both the Mach shock and barrel shock. The threedimensional aspect of the condensation cloud hides the top of the
dome. However we think that the Mach shock is potentially col-lapsing and falling back into the throat as the pressure decays inthe tube.
Fig. 12. Radial view with shadowgraph high speed imaging (Camera Phantom V2512, �t = 120�s, Pfail = 19.3 bar, ˚liq = 84%, Lw = 150mm).
F sphea
tvtfg
t
f s
In Fig. 10: frame a) we see the pin hole forming on themachined flat area. The crack reaches the end of the machined part(Lc = 150 mm) by frame g) or about 0.31 ms. At this point the tube
ig. 13. Measured Peak Overpressure vs scaled distance R/Ro where Ro = radius oflong R/Ro; right: zoom on the first 4 sensors).
The images also show the contribution of the vapour space andhe liquid space. The first small ball of white cloud (image e) is theapour space. Then behind this you see a second cloud which ishe liquid flashing. This you can see starting somewhere betweenrame e) and f) and continuing into frame j). The lead shock is longone by this time.
It is the propane interface (the first white cloud from the vapour)hat acts as the piston to start the lead shock.
re based on vapour space volume along the tube weakened length (left: full scale
3.2.2. High speed imaging – top viewThe next sequence of images shows the top view. The test details
for this case were
P = 19.3bar ; fill = 84% ; Lc = 150mm ; frame time step �t = 0.052m

ts and
ittgsfibnl
Fig. 14. Chronology of a BLEVE through physical measuremen
s almost fully open (i.e. the open area is greater than 2 x cross sec-ional area of the vessel). The lead shock has been sent out intohe surroundings by this time. The tube is not flattened on theround at this time. In frames d) and f) you can see some conden-ation on either side of the lips of the fish mouth opening. In thenal frames we see the liquid surface in the vessel. There seems to
e some convective patterns on the surface but bulk flashing hasot begun. This suggests that the liquid has little to do with theead shock.
high speed imaging (Pfail = 18.6bar, ˚liq = 56%, Lw = 75mm).
3.2.3. High speed imaging – window end viewIn this case the high speed video is viewing the window end of
the vessel. The test details for this case are:
Pf = 28bar ; fill = 56% ; Lc
= 75mm ; frame time step variable, shown on figure
From Fig. 11 we can see from the end view that there seems tobe little or no boiling activity up to around 0.28 ms. Then we see

sTlardi
3
f
P s
sissaa
vafssctsfs
3
P
dra
Rtssiatt
tF
ctwtmb
ome boiling takes please near the centre of the vessel at 0.52 ms.he tube is well opened by 0.28 ms suggesting the lead shock haseft the cylinder. The boiling wave becomes a sharp boiling linet the window location by 0.96 ms. This suggests the boiling haseached the window location. Then we see the boiling wave growownwards at the window in the final two frames. The boiling wave
s moving down at a speed of around 25–30 m/s.
.2.4. High speed shadowgraph –side viewThe high speed shadowgraph is from a different test with the
ollowing test conditions:
f = 19.3bar ; fill = 84% ; Lc = 150mm ; frame time step �t = 0.052m
The high speed shadowgraph is shown in Fig. 8 and it clearlyhows the creation of the lead shock above the cloud of expand-ng vapour propane. The cloud shows the interface between theurrounding air and the released vapour propane. The image alsohows the position of the first two blast gages mounted directlybove the tube at 15 and 20 cm from the tube upper surface (17.5nd 22.5 cm from tube centre).
In frame a) the tube is just beginning to fail and no release isisible. In frame b) we can clearly see the vapour coming out andcting as a piston to push the surrounding air out of the way. Still inrame b) we see a hint of a shock forming above the cloud. The leadhock continues to build in strength until it reaches full strengthomewhere around frame e) and f). We know this because in someases the overpressure is greater for the second blast gage (at 20 cm)han the first blast gage (at 15 cm). This suggests the overpres-ure has increased as the shock fully forms. Once the shock is fullyormed it begins to decay as it travels at supersonic speed into theurroundings.
.3. Measured peak overpressure vs distance
The data shown here is from a test with the following details:
f = 29.4bar ; fill = 18% ; Lc = 150mm
Fig. 9a) shows the measured peak overpressure vs the scaledistance from the test. The distance is scaled by Ro which is theadius of a sphere with a volume equal to the vapour space volumelong the cut (weakened) length of the tube.
As can be seen the overpressure is larger for the position at/Ro = 6 than it is at R/Ro = 4.5. This suggests the shock continuedo build strength until R/Ro = 6. The solid line is the predicted shocktrength based on the Friedman-Whitham theory for a sphericalhock (Kornegay, 1965). The starting overpressure for this models based on the 1D shock tube equation using the failure pressurend temperature and k = cp/cv = 1.1 for the propane. As can be seenhe measured overpressure does not agree with F-W theory untilhe shock is fully formed at around R/Ro = 6.
Fig. 13 (right) shows the scale expanded to R/Ro = 80. We see thathe measured pressure decays slightly faster than that predicted by-W.
This model for the lead shock does not include any kind of energyalculation. It is based on the failure pressure and temperature andhe volume of the vapour space under the weakened part of the
all. We did not apply any factors to reduce the fraction of energyhat went into the formation of the shock. The full set of experi-ental data is currently being analyzed using this method and will
e published when available.
Fig. 15. Maximum overpressure measured above the vessel at 4 different distances,against liquid fill level, for cases of similar failure pressure (17 bar < Pfail < 19 bar)and cut length (150 mm).
4. Discussion
4.1. Chronology of a BLEVE: sample case
This sample case is presented to identify specific milestones inthe opening of the vessel. All the data is from the same test withthe following details
Pf = 18.6bar ; fill = 56% ; Lc = 75mm
The exact timing of these milestones varied from test to test anddepended on the tube fill level, the length of the weakened zone andon the liquid temperature at failure (i.e. failure pressure).
These milestones are described with the aid of Fig. 14 whichshows the time plots of the overpressures measured near the topof the tube and by the ground loading. Fig. 14 also shows imagesthat illustrate these key events.
The milestones are:
i) start of the opening process (t = 0 s) with uncertainty of around0.1 ms.
ii) failure crack grows to the ends of the machined length (oneor two frames or 0.3 ms ± 0.1 ms, speed = 94 −188 m/s)
iii) failure fully opened (open fish mouth area ≥2 x tube crosssection area) (0.5 ms)
iv) lead shock reaches first blast sensor above tube (0.5 ms atdistance of 0.15 m from tube surface R/Rtube = 7)
v) ground loading begins due to vapour release (0.5 ms)vi) lead shock reaches second blast sensor above tube (0.7 ms at
0.2 m)vii) pressure begins to drop at transducer location in tube end
(0.68 ms) (time for depressurization wave to traverse halftube length)
viii) second white cloud from liquid begins (0.8 – 0.9 ms)ix) liquid boiling wave observed to start (after 0.8 – 0.9 ms)x) sudden change in slope of ground loading curve (1.3 ms)
xi) first pressure minimum in tube (1.5 ms)xii) pressure recovery (from liquid flashing) in tube begins
(1.5 ms)xiii) peak of pressure recovery in tube (2.3 ms)
xiv) tube flattened on ground (2.4 ms)xv) peak ground loading (2.4 ms)xvi) ground loading ends (4.5 ms)xvii) pressure in tube returns to ambient level (> 5 ms)
r two
vi0ba
lsae
ebfBo
4
tbbia
wipTopto
ca
f1Tp
Fig. 16. Pressure signals from two sensors above the vessel (15 and 20 cm) fo
The time origin t = 0 s was chosen to be the time at which theessel starts to open. All of the above times that are based onmages have some uncertainty associated with them of around.1 ms which was half the frame rate 0.2 ms of the camera. Timesased on measured pressures have a much lower uncertainty ofround 0.01 ms.
A key observation is that the process of the vapour release andead shock production took around 0.5 ms while the liquid effectstart at around 0.8 ms. The powerful liquid flashing process lasts forround 4 ms, almost an order of magnitude greater than the vapourffects.
Another key observation is the relatively small pressure recov-ry in the vessel when the liquid started strong flashing. This wasecause the event was a single-step BLEVE where the vessel wasully open when the liquid flashing was triggered. In a two-stepLEVE we would expect a larger pressure recovery because thepening would be only partially formed (Birk et al., 2007).
.2. Contribution to the lead shock
Chronology (Fig. 14) and high speed imaging (Fig. 12) show thathe lead shock is synchronized with vapour expansion. The liquidoiling does not seem to contribute to the lead shock overpressure,ecause the shock is long gone before the liquid starts to boil. Exper-
ments show a correlation between the maximum overpressurend the vapour content in the vessel before failure (Fig. 15).
Moreover, the pressure signals show that on top of havingeaker maximum overpressure, the steepness of the overpressure
tself decreases with increasing liquid content in the vessel, to aoint where it cannot be called a shock anymore (Fig. 16 right).he authors do not state that the liquid boiling does not generateverpressure. It does in most cases, after the initial lead shock hasropagated away from the vessel. However, it does not contributeo the first overpressure measured or predicted as the maximumverpressure.
For cases with 100% liquid in the vessel, the lead shock cannotome from the vapour phase expansion, thus overpressure gener-ted by the liquid boiling must be considered.
Experiments from the literature report strong overpressures
rom BLEVE with propylene full of liquid at failure (Giesbrecht et al.,981). However, no pressure trace is available in this reference.hus it is not clear if these overpressure are steep shocks or morerogressive overpressure, as shown Fig. 16 right.cases of similar failure pressure and cut length, but different liquid fill level.
Some simulation work models the overpressure generated bya BLEVE with a full liquid vessel as initial condition. One studyshows that for cases with high failure pressure and temperature,shocks are observed as a result of the release of the pressurized con-tent (Pinhasi et al., 2007). Stronger failure pressure lead to strongerevaporation rate, thus stronger overpressure build-up, which couldpotentially lead to shock formation for strong enough failure condi-tions. However, this result has not been validated with experiment.Other simulation works lead to shock generation from the evapora-tion of pressurized liquid content (van den Berg et al., 2004; Yakush,2016). However they are based on ideal conservative assumptions:
i) Instantaneous disintegration of the vessel wall: the pressuredrop rate in the vessel is at its maximum, which is not the casefor experiments where the vessel walls take some time to get outof the way of the expanding gas (approximately 0.5 ms for fullopening, 2.5 ms for flat tube on the ground for our experiments)
ii) Instantaneous intrinsic evaporation of the superheated liquid:this means there is no delay due to the metastable aspect ofthe superheat before nucleation triggers the boiling, and theevaporation rate does not depend on the bubble size growthrate, solely on extrinsic circumstances (gas dynamic, presenceof surrounding atmosphere to be pushed away)
The discussion on the contribution of the liquid in the main over-pressure if no vapour phase is present revolves around the validityof these assumptions, which are never as ideal in reality, guidingthe vapour release rate and the expansion of the two-phase mix-ture. More experiments with full liquid vessel burst are required toconclude on the argument of the shock generation by the boilingliquid.
5. Conclusions
The following conclusions have been made based on the datapresented.
i) the vessel failures in this study were single-step BLEVEs wherethe vessel failure process was rapid and continuous
ii) the vessel failures were due to the von Mises stress based onthe measured tube pressure exceeding the tube material yieldstrength. There was no internal pressure transient (BLEVE intube) that triggered the tube failure.

i
i
v
v
vi
i
D
A
MaiC
R
A
in Transparent Media. Springer-Verlag, Berlin.Vigilfuoco.tv, [WWW Document]. URL 2018. BOLOGNA (BO) Loc. Borgo Panigale
ii) no extraordinary events were observed when the liquid was ator above the atmospheric superheat limit.
v) The results suggest the lead shock is due to the vapour space andthat the liquid does not contribute significantly to this process.
v) the lead shock is fully formed somewhere betweenR/Rtube = 7–9 for the case of the 18.6 Barg failure withliquid fill = 56% and weakened length of 75 mm
i) The liquid flashing does not appear to produce its own shockbecause of the slower release process.
ii) the pressure recovery in the vessel was small because this BLEVEwas a single step and the vessel was fully open when the liquidflashing began.
ii) the liquid flashing process is one order of magnitude slowerthan the vapour release.
x) The ground loading is dominated by the liquid flashing process.
eclaration of Competing Interest
None.
cknowledgments
This work was a collaboration between the Mechanical andaterial Engineering of Queen’s University in Canada and the LGEI
t IMT Mines Alès in France. It was possible thanks to the fund-ng from the Natural Sciences and Engineering Research Council ofanada with a discovery grant.
eferences
bbasi, T., Abbasi, S.A., 2007. J. Hazard. Mater. 141, 489–519.
Baum, M.R., Butterfield, J.M., 1979. J. Mech. Eng. Sci. 21, 253–261.van den Berg, A.C., van der Voort, M.M., Weerheijm, J., Versloot, N.H.A., 2004. J. Loss
Prev. Process Ind. 17, 397–405.Birk, A.M., Cunningham, M.H., 1996. J. Hazard. Mater. 48, 219–237.Birk, A.M., Davison, C., Cunningham, M., 2007. J. Loss Prev. Process Ind. 20, 194–
206.Birk, A.M., Poirier, D., Davison, C., 2006. J. Loss Prev. Process Ind. 19, 582–597.Birk, A.M., VanderSteen, J.D.J., 2006. Trans. ASME 128, 648–655.Casal, J., Salla, J.M., 2006. J. Hazard. Mater. 137, 1321–1327.Eckhoff, R.K., 2014. J. Loss Prev. Process Ind. 32, 30–43.Eyssette, R., 2018. Characterization and Modeling of Near-field BLEVE Overpres-
sure and Ground Loading Hazards. Queen’s University(Canada) / IMT Mines Ales,France.
Genova, B., Silvestrini, M., Leon-Trujillo, F.J., 2008. J. Loss Prev. Process Ind. 21,110–117.
Giesbrecht, H., Hess, K., Leuckel, W., Maurer, B., 1981. Ger. Chem. Eng. 4, 315–325.Hansen, O.R., Kjellander, M.T., 2016. 48, 199–204.Hemmatian, B., Casal, J., Planas, E., Rashtchian, D., 2019. J. Loss Prev. Process Ind.Johnson, D.M., Pritchard, M.J., 1991. A Large Scale Experimental Study of BLEVEs.
British Gas Report No I536, United Kingdom.Kornegay, W.M., Distribution 1965. Production and Propagation of Spherical Shock
Waves at Low Ambient Pressures.Laboureur, D., Birk, A.M., Buchlin, J.M., Rambaud, P., Aprin, L., Heymes, F., Osmont,
A., 2015. Process Saf. Environ. Prot. 95, 159–171.Laboureur, D., Heymes, F., Lapebie, E., Buchlin, J.M., Rambaud, P., 2014. Process Saf.
Prog. 33, 274–284.Pinhasi, G.A., Ullmann, A., Dayan, A., 2007. Int. J. Heat Mass Transf. 50, 4780–4795.Planas-Cuchi, E., Salla, J.M., Casal, J., 2004. J. Loss Prev. Process Ind. 17, 431–436.Prugh, R.W., 1991. J. Fire Prot. Eng. 3, 9–24.Radulescu, M.I., Law, C.K., 2007. J. Fluid Mech. 578, 331–369.Sellami, I., Nait-Said, R., de Izarra, C., Chetehouna, K., Zidani, F., 2018. Process Saf.
Environ. Prot.Settles, G.S., 2001. Schlieren and Shadowgraph Techniques: Visualizing Phenomena
- Esplosione autocisterna. http://www.vigilfuoco.tv/emilia-romagna/bologna/bologna/esplosione-autocisterna.
Yakush, S.E., 2016. Int. J. Heat Mass Transf. 103, 173–185.