bleve: the case of water and a historical survey
TRANSCRIPT

1
BLEVE: THE CASE OF WATER AND A HISTORICAL SURVEY
Behrouz Hemmatian1, Joaquim Casal2, Eulàlia Planas2, Davood Rashtchian1,
1Center for Process Design, Safety and Loss Prevention (CPSL), Chemical and Petroleum Engineering
Department, Sharif University of Technology, Tehran, Iran
2Centre for Technological Risk Studies (CERTEC), Barcelona East School of Engineering (EEBE),
Universitat Politècnica de Catalunya, BarcelonaTech (UPC), Eduard Maristany 10-14, 08019-
Barcelona, Catalonia, Spain
Abstract
After a short update of the current more accepted definition of BLEVE, the special features of
water BLEVEs are analyzed. The stronger overpressure wave generated in the case of water as
compared to that of other substances is justified in terms of volume change. Through a
comparison with liquefied pressurized propane, three possibilities are analyzed: the
simultaneous contribution of both the liquid and the preexisting vapor, the contribution of the
liquid flash vaporization, and the contribution of the pre-existing vapor. Also a historical survey
on a set of 202 BLEVE accidents –the largest sample of BLEVE accidents surveyed until now–
is presented. LPG was the most common substances in this set of accidents. However, water
and LNG (11% of water and 4% of LNG in the studied cases) have also been involved. Impact
failure (44.8%) and human factor (30.3%) were the most common causes of BLEVEs.
Transport, storage, process plants, and transfer were the activities in which more accidents
occurred.
Keywords
BLEVE; overpressure; steam boilers; historical analysis
Corresponding author:
E-mail address: [email protected] (D. Rashtchian)

2
1. Introduction
Among the different possible major accidents, Boiling Liquid Expanding Vapor Explosions
(BLEVEs) keep occurring from time to time. A number of equipment and activities can
originate them: steam boilers, liquefied gas storage tanks, road and rail tankers, etc. Even
though their frequency seems to have decreased in the last decades, their effects keep being
potentially very strong and the consequences on people can be very severe.
Quite recently (August 8, 2018) a BLEVE followed by a fireball occurred in a highway near
Bologna (Italy), after a tanker transporting LPG and a lorry collided. Two persons were killed
and about 60 injured by the effects of the explosion and the fire.
Two different physical effects are associated to a BLEVE: overpressure wave and ejected
fragments; furthermore, serious thermal effects can occur if a flammable substance is involved,
or, in some cases, toxic effects depending on the substance (for example, ammonia) (Abbasi
and Abbasi, 2007).
Both mechanical and thermal effects have been studied by a number of authors. Concerning
the thermal effects, in many cases their consequences on people are more severe than those
associated with blast wave and ejected fragments (Birk et al., 2013); as the thermal
phenomenon (fireball) lasts a certain time, this has allowed the registration of an important
number of photos and films, i.e., experimental data at large scale that have been used for its
mathematical modeling. The blast wave has also been studied, both experimentally and by
using data from accidental large-scale explosions (see, for example, Bubbico and Marchini,
2008, and Birk et al., 2018).
Due to the fact that, in the case of a flammable substance, the thermal effects are quite important
and visible and often graphically recorded, the acronym BLEVE has often been used as a
synonymous of the fireball. This is why many of these explosions occurred with non-
flammable substances have not been registered in the diverse accident data bases as BLEVEs,
but with the general name of “explosion”. This is, for example, the case of steam boilers, even
if most steam boiler explosions are really a BLEVE.
In this communication, these concepts are revised, with special emphasis on the case of water,
and a historical survey on a set of 202 BLEVE accidents (the largest set analyzed up to now)
is performed to analyze the main causes and features of the occurrence of this accident.
2. When is an explosion a BLEVE?
After the BLEVE (Boiling Liquid Expanding Vapor Explosion) was described for the first time
by Smith, Marsh, and Walls (Abbasi and Abbasi, 2007), a number of researchers have
contributed to increase the knowledge on this accident. There has been some evolution
concerning the exact definition of a BLEVE and which explosions should be considered as
such.
Reid (1979), through an accurate analysis of the phenomenon, considered the superheat limit
temperature (Tsl) as a required condition for an explosion to be a BLEVE, defining this
phenomenon as "the sudden loss of containment of a liquid that is at or above its superheating
temperature limit". At this condition, due to the sudden depressurization, there is homogeneous
nucleation in the whole mass of liquid and a sudden and important increase of volume. This

3
practically instantaneous flashing of liquid produces a strong blast wave. At this situation, the
explosion should be classified as a BLEVE. And according to this theory, if the temperature of
the liquid at the moment of the vessel failure is not equal or higher than its superheat limit
temperature, the explosion will not be a BLEVE, and its severity will be lower.
However, none of the different thermodynamic models proposed can justify an abrupt change
in the overpressure at Tsl. Salla et al. (2006) arrived at the conclusion that Tsl corresponds to
the situation in which the energy transferred between the cooling liquid and the vaporizing
liquid fractions is at its maximum, leading the remaining liquid to a minimum content of
energy.
Some authors, as for example Birk et al. (1993, 2007), performed BLEVE experiments and
concluded that BLEVE explosions occurred at temperatures lower than Tsl. Thus, Reid’s theory
is not applied nowadays, even though it can be useful for a better understanding of the BLEVE
mechanism, and should be restricted to ideal, low scale laboratory conditions. In fact, this
theory does not imply that the overall energy released in the explosion increases due to the fact
that a different phenomenon occurs if the explosion takes place at a temperature equal or higher
than the superheat limit one. What it would imply really is that, due to the fact that the boiling
dynamics is much faster, practically instantaneous, the same energy would give rise to a higher
overpressure and, therefore, to a much more severe explosion. Finally, another phenomenon
that can have an important influence in many real cases and which would imply again a
behavior different from that assumed in Reid’s theory is the probable temperature stratification
in the liquid phase (Scarponi et al., 2018). When this occurs, there can be a strong temperature
gradient in the liquid, the hottest layers being at the liquid surface, thus originating a much
faster pressure built-up in the vapor zone (i.e., in the vessel).
Another point which has also originated some controversy is related to the substance involved
in the explosion. For example, some authors (Napier and Roopchand, 1986; Bernatik et al.,
2011; Pitblado et al., 2011) considered that a BLEVE could not occur with liquefied natural
gas (LNG), even though BLEVEs have occurred really with this material. Finally, as
commented before, there is also some confusion between the phenomena of BLEVE and
fireball.
The definition of this type of explosion commonly accepted nowadays is “a BLEVE is an
explosion resulting from the failure of a vessel containing a liquid at a temperature significantly
above its boiling point at atmospheric pressure” (CCPS, 1994).
3. BLEVE overpressure
One of the most common accidental scenarios leading to a BLEVE is the fire engulfment of a
pressurized vessel. As the vessel heating proceeds the pressure inside it increases and,
simultaneously, its wall weakens due to the increase of temperature; this effect is especially
important in the upper section of the vessel, where the wall is not in contact with the liquid
(Birk et al., 2006). And, after a certain time, the vessel fails and there is a violent phenomenon
consisting in the expansion of the pre-existing vapor and the partial flash vaporization of the
liquid; the practically instantaneous increase in volume originates the explosion with an
overpressure wave and, often, ejection of vessel fragments. The overpressure wave can be very
high in the near field (Laboureur et al., 2015).

4
There is now some discussion concerning the respective contributions to the overpressure wave
of these two phenomena, the expansion of the pre-existing vapor and the expansion of the vapor
originated by the explosive boiling of the liquid. Among the existing mathematical models for
predicting the peak overpressure of the explosion, some authors (Prugh, 1991; Planas et al.,
2004) have taken both phenomena into consideration; others (Casal and Salla, 2006) have
considered only the contribution of the liquid boiling; and finally, some others (Birk et al.,
2007, 2018) consider that the expansion of the pre-existing vapor is the sole contribution to the
maximum peak overpressure due to the faster phenomenon of vapor expansion as compared to
the vaporization-and-expansion of the liquid. Of course, the respective contributions to
overpressure wave of liquid vaporization and pre-existing vapor will depend on the masses of
each phase present in the vessel.
In order to give an approximate idea of the differences that these assumptions can imply in the
estimation of the peak overpressure, this overpressure has been calculated in the next section
by assuming a) only the contribution of liquid flash vaporization (Casal and Salla, 2006), b)
the contribution of the liquid vaporization plus that due to the pre-existing vapor (Prugh, 1991;
Planas et al., 2004), and c) contribution of preexisting vapor (Birk et al., 2007, 2018; Johnson
et al., 1990). The calculation has been performed for the same amount of two substances, water
and propane
4. The case of water
A quite interesting case is that of vessels containing water at a relatively high temperature and
pressure, which certainly can undergo a BLEVE if the vessel collapses and fails for any reason.
Steam boilers are a good example. Although safety measures (liquid level controls, pressure
relief valves, etc.) are provided, it is a fact that steam boiler explosions occur from time to time,
due to the very high number of this equipment existing in many industries around the world.
Two types of explosions can occur in a boiler: a) a fuel-air explosion in the furnace, and b) a
BLEVE. This second case is much more frequent than the first one, but in most cases these
explosions are not registered as BLEVEs, due essentially to the fact that water is not flammable
and, therefore, no fireball follows the explosion. This is undoubtedly the reason why the
number of water BLEVEs in most surveys and in the historical analysis included in the next
section is rather low.
However, the effects of these explosions are very severe, the overpressure being usually
significantly stronger than that generated in the explosion of vessels containing the same mass
of other materials. This different behavior can be explained in terms of the physical change
underwent by the liquid and vapor in the explosion, which will depend on the involved material.
Here it has been analyzed for water and propane. Three options have been assumed, as
previously mentioned: a) simultaneous contribution of both the liquid and the preexisting
vapor, b) contribution of the liquid flash vaporization and c) contribution of the pre-existing
vapor.
a) Simultaneous contribution of the liquid and the preexisting vapor
Fig. 1 shows the comparison of the energy released (kJ/m3 of vessel) by the explosion of a
vessel containing water and another one containing propane. The calculation has been
5
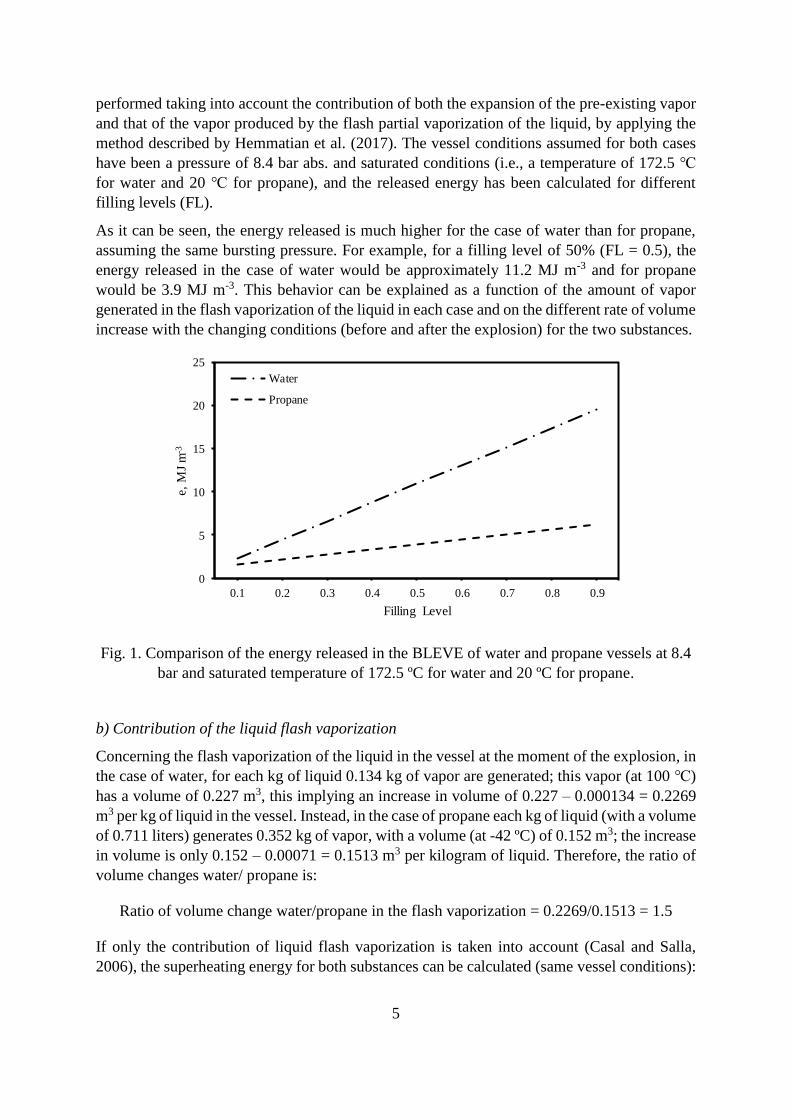
performed taking into account the contribution of both the expansion of the pre-existing vapor
and that of the vapor produced by the flash partial vaporization of the liquid, by applying the
method described by Hemmatian et al. (2017). The vessel conditions assumed for both cases
have been a pressure of 8.4 bar abs. and saturated conditions (i.e., a temperature of 172.5 ℃
for water and 20 ℃ for propane), and the released energy has been calculated for different
filling levels (FL).
As it can be seen, the energy released is much higher for the case of water than for propane,
assuming the same bursting pressure. For example, for a filling level of 50% (FL = 0.5), the
energy released in the case of water would be approximately 11.2 MJ m-3 and for propane
would be 3.9 MJ m-3. This behavior can be explained as a function of the amount of vapor
generated in the flash vaporization of the liquid in each case and on the different rate of volume
increase with the changing conditions (before and after the explosion) for the two substances.
Fig. 1. Comparison of the energy released in the BLEVE of water and propane vessels at 8.4
bar and saturated temperature of 172.5 ºC for water and 20 ºC for propane.
b) Contribution of the liquid flash vaporization
Concerning the flash vaporization of the liquid in the vessel at the moment of the explosion, in
the case of water, for each kg of liquid 0.134 kg of vapor are generated; this vapor (at 100 ℃)
has a volume of 0.227 m3, this implying an increase in volume of 0.227 – 0.000134 = 0.2269
m3 per kg of liquid in the vessel. Instead, in the case of propane each kg of liquid (with a volume
of 0.711 liters) generates 0.352 kg of vapor, with a volume (at -42 ºC) of 0.152 m3; the increase
in volume is only 0.152 – 0.00071 = 0.1513 m3 per kilogram of liquid. Therefore, the ratio of
volume changes water/ propane is:
Ratio of volume change water/propane in the flash vaporization = 0.2269/0.1513 = 1.5
If only the contribution of liquid flash vaporization is taken into account (Casal and Salla,
2006), the superheating energy for both substances can be calculated (same vessel conditions):
0
5
10
15
20
25
0.1 0.2 0.3 0.4 0.5 0.6 0.7 0.8 0.9
e,
MJ
m-3
Filling Level
Water
Propane

6
water: SE = 721-418.9 = 302 kJ kg-1
overpressure energy (irreversible process): 0.05 · 302 = 15.1 kJ kg-1
propane: SE = 250-100.2 = 149.8 kJ kg-1
overpressure energy (irreversible process): 0.05 · 149.8 = 7.49 kJ kg-1
Ratio of superheating energy water/propane = 15.1/7.49 = 2
Even though these two ratios will change according to the vessel condition at the moment of
the explosion, they are the explanation of why the steam boiler BLEVEs are so severe as
compared to the explosions involving other materials.
c) Contribution of the pre-existing vapor
If, as some authors have proposed, only the first peak of the BLEVE (associated to the
expansion of the pre-existing vapor just before the explosion) is the responsible of the peak
overpressure (Birk et al., 2007, 2018; Johnson et al., 1990), then the increase in volume for
water and propane, respectively, would be:
water: volume of 1 kg of vapor at 8.4 bar abs and 172.5 ºC: 0.225 m3
volume at 1 atm and 100 ºC = 1.694 m3
volume increase: 1.694-0.225 = 1.469 m3 kg-1
propane: volume of 1 kg of vapor at 8.4 bar abs. and 20 ºC: 0.055 m3
volume at 1 atm and -42 ºC: 0.4319 m3
volume increase: 0.432- 0.055 = 0.377 m3 kg-1
Ratio of vapor volume change water/propane = 1.469/0.377 = 3.9
Again, the different increase in volume due to the explosion justifies the higher peak
overpressures usually reached with water BLEVEs.
5. Occurrence of BLEVEs: a historical survey
The historical analysis of BLEVE accidents is an interesting way to understand them better, as
it can give a good overview of this phenomenon and which important factors play a role in it.
A first historical analysis restricted to fire domino effect had been done with 127 cases
(Hemmatian et al., 2015); this set has now been enlarged to 202, including other initiating
events. MHIDAS (Major Hazard Incident Data Service) database (2007) was used to obtain
some data. Other databases were also consulted: Analysis, Research and Information on
Accidents (ARIA) (2012), Major Accident Reporting System (MARS) (2012), and Failure and
ACcidents Technical information System (FACTS) (2010). The lack of information in some
accidents was fulfilled by getting the assistance of other available resources such as the U.S.
Chemical Safety Board (2012), the U. S. National Transport Safety Board (2013) and the
National Fire Protection Association (2012). Microsoft Access® was used in order to manage
and classify the data and to avoid recording more than once a given accident.
Only accidents occurred after 1st January 1960 have been taken into account, in order to obtain
results useful and representative of the nowadays industry and transport main features
(Hemmatian et al., 2014). This survey considers accidents occurred in process plants, in storage

7
areas and in the transportation of hazardous materials (road, rail, and ship); it also includes
accidents that have occurred because of natural events such as earthquakes or floods.
5.1 Distribution of accidents according to the time and location
The frequencies of the BLEVE accidents as a function of time have been plotted in Fig 2. The
highest frequency belongs to the 70’s (24.8%). The occurrence of this type of accidents seems
to decrease afterward, although a clear trend cannot be really observed. A fact that could have
some influence is the much better access to information on major accidents (BLEVE included)
in the last decades; this could contribute to increase the frequency of registered cases.
Fig. 2. Distribution of BLEVEs over the time.
The selected accidents have also been classified by their region. This type of classification was
done by considering different factors such as political and development-based criteria.
Countries in the world were classified into three groups:
- European Union (19.8%),
- other developed countries: Australia, Canada, Japan, New Zealand, Switzerland, Norway and
the United States (51%),
- rest of the world (29.2%).
In fact, we assume that this criterion can imply some bias in the statistical analysis, as both the
geopolitical and economic circumstances of some countries have considerably evolved since
the 1960s; however, as other previous analyses have also used it (Darbra et al., 2010;
Abdolhamidzadeh et al., 2011), it seems reasonably to keep it.
According to this classification, the highest percentage (70.8%) is found in the developed
countries. This should be attributed to the presence of an important number of plants and to the
associated transportation and storage infrastructures in these countries. Moreover, in developed
countries, due to the existing policies and institutions in the fields of safety and environment,
more information about the occurred accidents is available.
0%
5%
10%
15%
20%
25%
30%
1960-1969 1970-1979 1980-1989 1990-1999 2000-2009 2010-2018
Accid
en
t fr
eq
uen
cy
perc
en
tag
e
Decades

8
Fig. 3 shows the frequencies of BLEVEs as a function of time in the three different groups of
countries; even though there is an important dispersion of data, the general trend of the
frequency is clear: the contribution of developing countries has increased in recent years, while
it has decreased in developed ones and keeps essentially constant in the EU.

9
Fig. 3. Trend of BLEVEs occurrence in different parts of the world.
0
2
4
6
8
10
12
1960
1962
1964
1966
1968
1970
1972
1974
1976
1978
1980
1982
1984
1986
1988
1990
1992
1994
1996
1998
2000
2002
2004
2006
2008
2010
2012
2014
2016
2018
No
. o
f accid
en
ts
Year
BLEVEs in European Union
0
2
4
6
8
10
12
19
60
19
62
19
64
19
66
19
68
19
70
19
72
19
74
19
76
19
78
19
80
19
82
19
84
19
86
19
88
19
90
19
92
19
94
19
96
19
98
20
00
20
02
20
04
20
06
20
08
20
10
20
12
20
14
20
16
20
18
No
. o
f accid
en
ts
Year
BLEVEs in other develped countries
0
2
4
6
8
10
12
1960
1962
1964
1966
1968
1970
1972
1974
1976
1978
1980
1982
1984
1986
1988
1990
1992
1994
1996
1998
2000
2002
2004
2006
2008
2010
2012
2014
2016
2018
No
. o
f accid
en
ts
Year
BLEVEs in rest of the world

10
5.2 Substances involved
According to the previous definition (Section 2), it can be expected that substances with boiling
temperature lower than ambient temperature –such as light hydrocarbons– are prone to
BLEVE. Table 1 shows the substances involved in the 202 BLEVE accidents here analyzed.
282 substances have been identified, as in some of the accidents more than one substance were
simultaneously involved (this is why percentages add up to more than 100). As it can be seen
in this table, LPG was by large the most frequent material, being found in 59% of BLEVEs,
followed by water (11%); LNG took part in 4% of the BLEVE accidents. The high number of
accidents involving LPG is due to the (relative) frequency with which road and rail tankers
transporting this material have accidents (derailment, collision) that lead to a BLEVE-fireball.
As for the 30% of the category “other chemical substances”, it includes but is not limited to:
naphtha, isopropyl alcohol, methanol, and ethyl alcohol.
Table 1. Substances involved in BLEVEs
Substance Number of accidents Percentage
LPG 120 59
Water 22 11
Oil 12 6
Vinyl chloride 11 5
Gasoline/Petrol/Diesel/Kerosene 9 5
LNG 8 4
Ethylene oxide 7 4
Carbon dioxide 6 3
Propylene 5 3
Ethylene 4 2
Ammonia 3 2
Chlorine 3 2
Butadiene 3 2
Toluene diisocyanate 3 2
Sodium hydroxide 3 2
Sulfuric acid 3 2
Other chemical substances 60 30
Total 282 144
Concerning water, the following consideration must be done: probably the number of BLEVEs
involving it has been much larger than those registered in databases, as the number of steam
boilers and hot water tanks is very high in most countries; however, as water is not flammable
and therefore it does not originate any subsequent fireball, probably many of such cases had

11
not been registered as BLEVEs. Nevertheless, not all steam boiler explosions could be
systematically included in the survey, as probably some of them were not a BLEVE; therefore,
only those cases registered as such have been included in this survey.
5.3 General/specific causes
Understanding the main causes of accidents can be a good mean to prevent further similar
accidents. In Table 2, MHIDAS database categories for generic causes were used to identify
the causes of BLEVE accidents. The total number of causes were larger than the number of
BLEVE accidents because in some accidents there were more than one cause. General causes
of accidents were not specified in 37 (18.3%) out of 202 cases; the results in Table 2 correspond
thus to 165 accidents. Impact failure (44.8%) followed by human factor (30.3%) and
mechanical failure (29.1%) were the main causes.
Table 2. General causes of BLEVEs
General cause Number of
accidents
Overall
percentage EU%
Other
developed
countries%
Rest of
the
world%
Impact failure 74 44.8 17.6 67.4 19
Human factor 50 30.3 41.2 19.1 42.9
Mechanical failure 48 29.1 41.2 24.7 26.2
External events 42 25.5 17.6 30.3 21.4
Instrument failure 8 4.8 8.8 4.5 2.4
Violent (runaway)
reaction 5 3 - 4.5 2.4
Service failure 2 1.2 - 1.1 2.4
Upset process
conditions 1 0.6 2.9 - -
Total 230 139.3 129.3 151.6 116.7
A detailed analysis was also performed by referring to each region. In European countries,
mechanical failure (41.2%) and human factor (41.2%) were the most probable causes of
BLEVEs, while in other developed countries it was impact failure (67.4%). However, human
factor (42.9%) and mechanical failure (26.2%) were the main causes of the accidents in the rest
of the world. The high incidence of human factor (30.3% of all accidents) would indicate the
convenience of a higher effort in training operators and improving the safety culture.
Each general cause was subdivided into specific causes in Table 3. Rail accidents (53%) and
road accidents (26%) were the most frequent specific ones in impact failure. Regarding human
factor, bad maintenance (33%) followed by general operation (14%) were the main frequent
ones. Finally, overheating (33%) and overpressure (20%) were was the main specific cause in
mechanical failure category.

12
Table 3. Specific causes of BLEVEs
General cause Specific cause No. of
accidents %
Impact failure (44.8%) Rail accident 43 53
Road accident 21 26
Other vehicle 11 14
Heavy object 4 5
Excavating equipment 1 1
Ship to ship collision also barges 1 1
Human factor (30.3%) Bad maintenance 12 33
General operation 5 14
Overfilling 4 11
Management 4 11
Procedures 4 11
Failure to connect or disconnect 2 6
Design error 2 6
Draining accident 2 6
Failure to isolate or drain before
uncoupling 1 2
Mechanical failure (29.1%) Overheating 21 33
Overpressure 13 20
Corrosion 5 8
Brittle failure 4 6
Leaking coupling or flange 4 6
Hose 4 6
Relief valve failure 3 5
Weld failure 3 5
Leaking or passing valve 3 5
Metallurgical failure 2 3
Fatigue 2 3
External events (25.5%) Fire 33 70
Explosion 8 17
Temperature extremes 4 9
Earthquake 2 4
Instrument failure (4.8%) Indicator 2 33
Trip 2 33
13
Controller 2 33
Violent reaction (3%) Runaway reaction 4 100
Service failure (1.2%) Electricity 2 100
Upset process conditions
(0.6%)1 - - -
1For this case MHIDAS does not have any categories
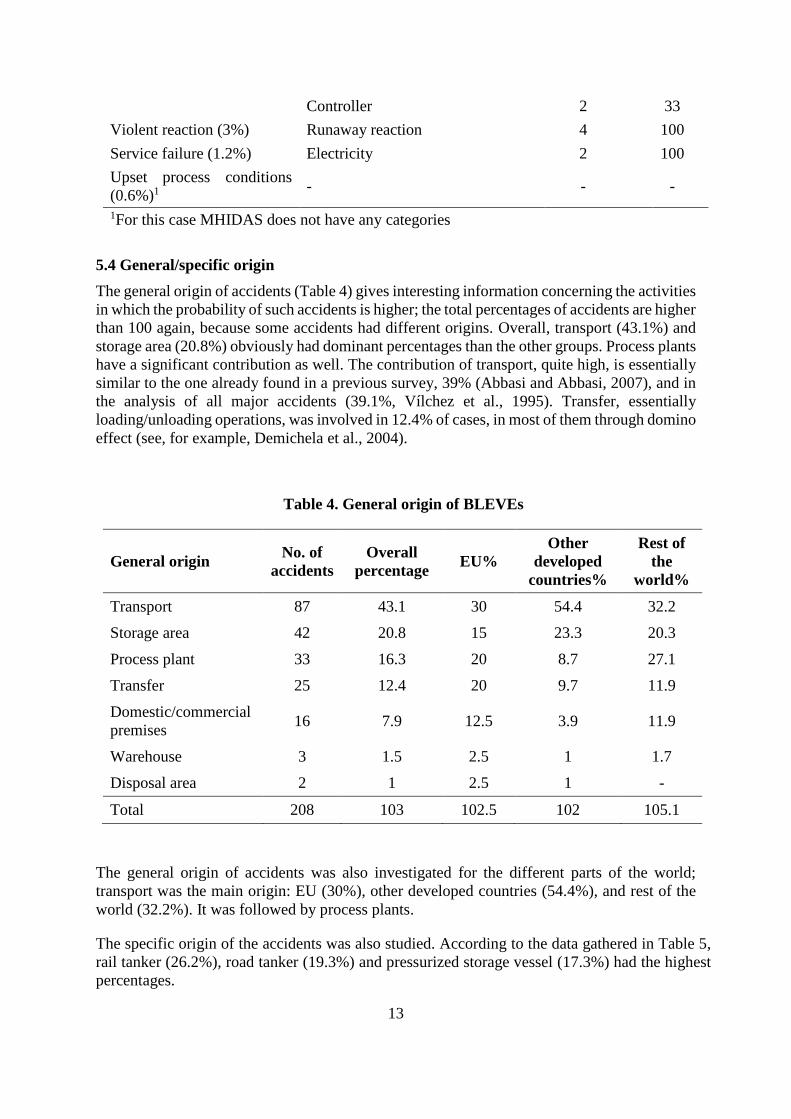
5.4 General/specific origin
The general origin of accidents (Table 4) gives interesting information concerning the activities
in which the probability of such accidents is higher; the total percentages of accidents are higher
than 100 again, because some accidents had different origins. Overall, transport (43.1%) and
storage area (20.8%) obviously had dominant percentages than the other groups. Process plants
have a significant contribution as well. The contribution of transport, quite high, is essentially
similar to the one already found in a previous survey, 39% (Abbasi and Abbasi, 2007), and in
the analysis of all major accidents (39.1%, Vílchez et al., 1995). Transfer, essentially
loading/unloading operations, was involved in 12.4% of cases, in most of them through domino
effect (see, for example, Demichela et al., 2004).
Table 4. General origin of BLEVEs
General origin No. of
accidents
Overall
percentage EU%
Other
developed
countries%
Rest of
the
world%
Transport 87 43.1 30 54.4 32.2
Storage area 42 20.8 15 23.3 20.3
Process plant 33 16.3 20 8.7 27.1
Transfer 25 12.4 20 9.7 11.9
Domestic/commercial
premises 16 7.9 12.5 3.9 11.9
Warehouse 3 1.5 2.5 1 1.7
Disposal area 2 1 2.5 1 -
Total 208 103 102.5 102 105.1
The general origin of accidents was also investigated for the different parts of the world;
transport was the main origin: EU (30%), other developed countries (54.4%), and rest of the
world (32.2%). It was followed by process plants.
The specific origin of the accidents was also studied. According to the data gathered in Table 5,
rail tanker (26.2%), road tanker (19.3%) and pressurized storage vessel (17.3%) had the highest
percentages.

14
Table 5. Specific origin of BLEVEs
Specific origin No. of accidents Percentage
Rail tanker 53 26.2
Road tanker 39 19.3
Pressurized storage vessel 35 17.3
Portable transport container 18 8.9
Steam boiler 16 7.9
Fired process equipment 8 4
On-plant pipes and associated
valves 6 3
Atmospheric pressure storage
tank 6 3
Heat exchanger 5 2.5
Ship 5 2.5
Tank container 4 2
Pipeline 4 2
Process vessels 3 1.5
Reactor 3 1.5
Other 5 2.5
Total 210 104.1
5.5 Affected population
The affected population is one of the important aspects in safety and risk analysis, and reducing
the number of people affected by the BLEVE consequences is the aim of many scientific
studies in the field of safety and loss prevention. The affected population can be classified in
three groups: fatalities, injuries, and evacuees. The results presented here are just for those
cases where information was available (in 76% of cases for fatalities, for injuries in 78% and
for evacuees in 40.1%).
In 154 BLEVEs occurred since 1960, about 1568 people were killed; a detailed study was
performed on them. The 𝑝 − 𝑁 curve is usually used to represent the lethality of accidents (Fig.
4). In this plot, the number of fatalities (𝑁) is shown on the abscissae and the probability of a
BLEVE accident with fatalities equal or greater than 𝑁 (for 𝑁 = 1, 𝑝 = 1) is illustrated on its
ordinate axis. In fact, the accumulated probability of BLEVE accidents can be represented by
this illustrative curve as a function of its severity. The accumulated probability was calculated
by the least square method. The resulting function was 𝑝 = 𝑁𝑏, with the b value equal to -0.74.
This means that the accumulated probability of BLEVE accidents that causes 10 or more deaths

15
is 5.5 times greater than the accumulated probability of BLEVE accidents with 100 or more
fatalities.
Fig. 4. Accumulated probability as a function of number of deaths for the 104 BLEVEs
involving fatalities.
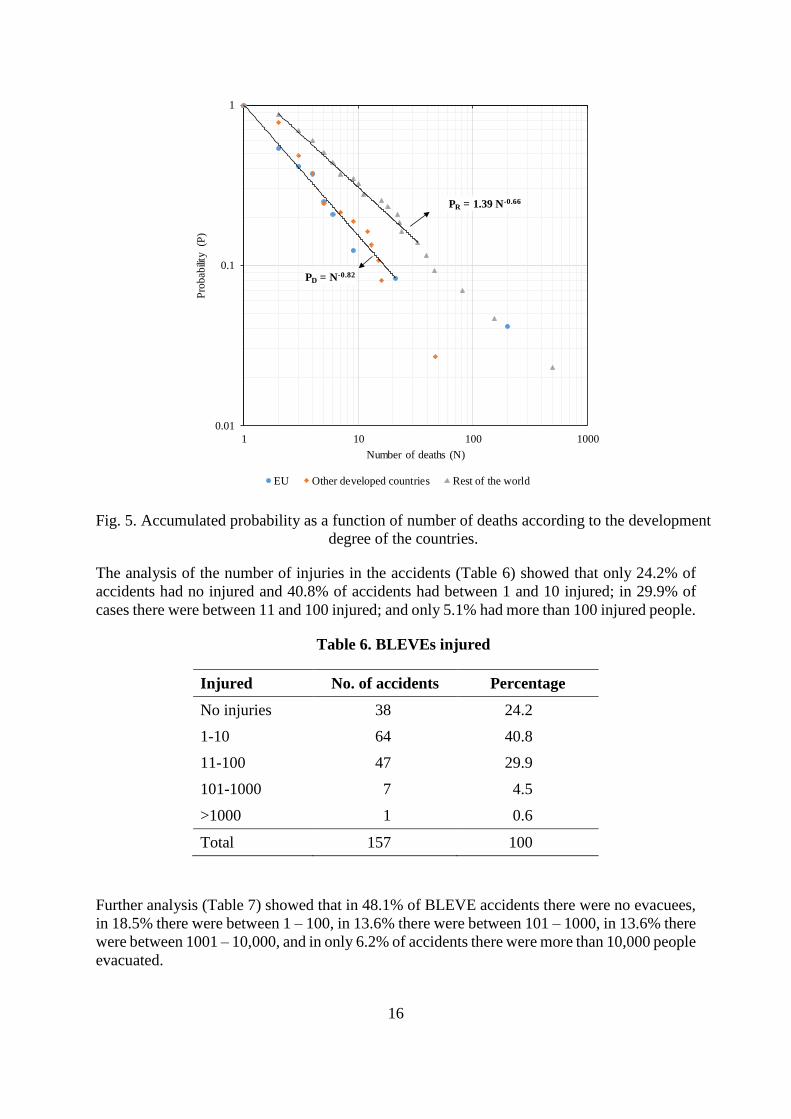
The accumulated probability of fatalities versus the number of deaths was also calculated for
different parts of the world (Fig. 5). The accumulated probability of number of deaths is clearly
higher for the “rest of the world” (in which case there is a light deviation from the general rule,
as often happens, at P values near 1) as compared to that of the EU and the developed countries.
It is clear from this plot that the consequences of a severe accident, in terms of lethality, are
more important in the developing countries; for example, the probability of having an accident
with at least 15 fatalities in a developing country (PR) is 2.1 times larger than in the developed
ones (PD).
P = N-0.74
0.001
0.01
0.1
1
1 10 100 1000
Pro
bab
ility
(P
)
Number of deaths (N)
16
Fig. 5. Accumulated probability as a function of number of deaths according to the development
degree of the countries.
The analysis of the number of injuries in the accidents (Table 6) showed that only 24.2% of
accidents had no injured and 40.8% of accidents had between 1 and 10 injured; in 29.9% of
cases there were between 11 and 100 injured; and only 5.1% had more than 100 injured people.
Table 6. BLEVEs injured
Injured No. of accidents Percentage
No injuries 38 24.2
1-10 64 40.8
11-100 47 29.9
101-1000 7 4.5
>1000 1 0.6
Total 157 100
Further analysis (Table 7) showed that in 48.1% of BLEVE accidents there were no evacuees,
in 18.5% there were between 1 – 100, in 13.6% there were between 101 – 1000, in 13.6% there
were between 1001 – 10,000, and in only 6.2% of accidents there were more than 10,000 people
evacuated.
PR = 1.39 N-0.66
PD = N-0.82
0.01
0.1
1
1 10 100 1000
Pro
bab
ility
(P
)
Number of deaths (N)
EU Other developed countries Rest of the world

17
Table 7. BLEVEs evacuees
Evacuees No. of accidents Percentage
No evacuees 39 48.1
1-10 11 13.6
11-100 4 4.9
101-1000 11 13.6
1001-10,000 11 13.6
>10,000 5 6.2
Total 74 100
As a final comment to the consequences on people, the following should be taken into account:
in the event of a BLEVE followed –as often happens– by a fireball, most of the consequences
–fatalities, injured people– are associated to the thermal radiation from the fireball. As an
example, the following case can be mentioned (Birk et al., 2013): the explosion-fireball of a
spherical tank with a volume of 2000 m3 containing propane, at different filling degrees. These
authors calculated the distance at which a peak overpressure of 0.3 bar (often accepted in
quantitative risk analysis as the overpressure implying a 100% lethality for both direct and
indirect effects) would be reached, as well as the corresponding fireball diameter and duration;
the values for two filling degrees can be seen in Table 8.
Table 8. 100% lethality distances
Filling degree Distance to 0.3
bar* (m)
Fireball
diameter*
(m)
Time* (s) Distance – 100%
lethality** (m)
0.2 82 377 28 360
0.8 107 531 40 650
*Birk et al., 2013 **This work
For a filling degree of 20% the distance at which ∆P = 0.3 bar was 82 m and the fireball
diameter was 377 m; and for a filling degree of 80%, the distance was 107 m and the diameter
531 m. If, for these two fireballs we calculate the distance at which the lethality due to the
thermal radiation would be 100% we obtain 360 m and 650 m, respectively. It is clear,
therefore, that in most cases (except for the linear ejection of fragments) the consequences on
people due to the fireball will be much more severe than those due to overpressure wave.
6. Conclusions
Two aspects concerning BLEVEs have been analyzed: first, the main features of those
explosions involving water –which have received relatively low attention in the literature– and,
secondly, the main features of the BLEVE occurrence as a function of the materials involved,
causes, origin and consequences on people.
The case of water is especially interesting: although many steam boiler explosions are probably
BLEVEs (but not all: some of them are associated to combustion chamber explosions), they
18
are not registered as such due to the fact that they are not followed by a fireball; this is why
they are underrepresented in this type of surveys. Nevertheless, the energy released from a
water BLEVE will be significantly stronger than that originated by the same amount of other
substances such as, for example, LPG; and, therefore, the corresponding overpressure wave
and the peak overpressure will also be higher. This is essentially due to the higher volume
change associated both to the vapor expansion and to the liquid vaporization for the case of
water; a comparison with propane values clearly demonstrates this.
The historical analysis of 202 cases has shown that the most common substance associated
with BLEVE is LPG. As for the general origin of these events, transport is the most common
activity, followed by storage and process plants; transfer (loading/unloading) keeps having an
overall value of approximately 12%, as already found in other surveys on major accidents.
According to this information, a further effort should be made to reduce the risk in the
transportation of LPG and LNG by road and rail; in this regard, the increasing use in certain
countries of double wall tanks would be quite positive. The prediction of the BLEVE frequency
(necessary for a quantitative risk analysis) could probably be estimated for both road and rail
transport by performing an accurate analysis of all accidents occurred in these transportation
modes in diverse countries (traffic accident and derailment frequency, frequency of BLEVE in
the event of such accidents). This could be studied in future research, as well as its relationship
with the existing regulations and procedures and their possible improvement.
Some attention should also be devoted to loading/unloading operations: even if it is well known
that they are dangerous and the responsible of approximately 10% of all major accidents,
BLEVEs keep occurring during them. So, an effort should be applied to analyze and improve
the procedures and safeguards in these operations.
Finally, the analysis of the frequency of BLEVEs in the different world regions could be
associated with the positive influence of the regulations existing in the developed countries.
Concerning the developing ones, besides a possible improvement of these regulations in certain
cases, the influence of the increase in their population and of the “Industrialization Intensity
Index” have probably an important influence on the higher incidence of the accidents.
Acknowledgments
This research was partially funded by the Spanish Ministry of Economy and Competitiveness
(projects CTM2014-57448-R and CTQ2017-85990-R, co-financed with FEDER funds), by the
Institut d’Estudis Catalans (Project PRO2018-S03) and by National Elites Foundation (Iran).
References
Abbasi, T., Abbasi, S. A., 2007. The boiling liquid expanding vapour explosion (BLEVE):
Mechanism, consequence assessment, management. J. Hazard. Mater., 141(3), 489-
519. https://doi.org/10.1016/j.jhazmat.2006.09.056
Abdolhamidzadeh, B., Abbasi, T., Rashtchian, D., Abbasi, S. A., 2011. Domino effect in
process-industry accidents. An inventory of past events and identification of some
patterns. J. Loss Prev. Process Ind., 24 (5) 575-593.
ARIA., 2012. Analysis, Research and Information on Accidents, Retrieved 10/04/2013, from
www.aria.developpement-durable.gouv.fr.
19
Bernatík, A., Senovsky, P., Pitt, M., 2011. LNG as a potential alternative fuel–safety and
security of storage facilities. J. Loss Prev. Process Ind., 24(1), 19-24. https://doi.org/10.1016/j.jlp.2010.08.003
Birk, A. M., Poirier, D., Davison, C., 2006. On the response of 500 gal propane tanks to a 25%
engulfing fire. J. Loss Prev. Process Ind., 19, 527-541.
Birk, A. M., Ye, Z., Maillette, J., Cunningham, M., 1993. Hot and cold BLEVEs: observation
and discussion of two different kinds of BLEVEs. In AIChE Symposium Series (pp.
119-119). AMERICAN INSTITUTE OF CHEMICAL ENGINEERS.
Birk, A. M., Davison, C., Cunningham, M., 2007. Blast overpressures from medium scale
BLEVE tests. J. Loss Prev. Process Ind., 20(3), 194-206. https://doi.org/10.1016/j.jlp.2007.03.001
Birk, A. M., Dusserre, G., Heymes, F., 2013. Analysis of a propane sphere BLEVE. Chem.
Eng. Trans., 31, 481-486. https://doi.org/10.3303/CET1331081
Birk, A. M., Heymes, F., Eyssette, R., Lauret, P., Aprin, L., Slangen, P., 2018. Near-field
BLEVE overpressure effects: The shock start model. Process Saf. Environ. Prot., 116,
727-736. https://doi.org/10.1016/j.psep.2018.04.003
Bubbico, R., Marchini, M., 2008. Assessment of an explosive LPG release accident: a case
study. J. Hazard. Mater., 155(3), 558-565.
https://doi.org/10.1016/j.jhazmat.2007.11.097
Casal, J., Salla, J. M., 2006. Using liquid superheating energy for a quick estimation of
overpressure in BLEVEs and similar explosions. J. Hazard. Mater., 137 (3) 1321-1327. https://doi.org/10.1016/j.jhazmat.2006.05.001
CCPS, Center for Chemical Process Safety, ed., 1994. Guidelines for evaluating the
characteristics of vapor cloud explosions, flash fires and BLEVEs. AIChE
CSB. U.S. Chemical Safety Board, 2012. Retrieved 10/04/2013, from www.csb.gov.
Darbra, R. M., Palacios, A., Casal, J., 2010. Domino effect in chemical accidents: main features
and accident sequences. . J. Hazard. Mater., 183 (1-3) 565-573.
Demichela, M., Piccinini, N., Ooggio, A., 2004. Analysis of an LPG accidental release. Process
saf. Environ. Prot., 82 (B2), 128-131.
FACTS. Failure and ACidents Technical information System (FACTS), 2010. Retrieved
10/04/2013, from www.factsonline.nl.
Hemmatian, B., Casal, J., Planas, E., 2017. A new procedure to estimate BLEVE
overpressure. Process Saf. Environ. Prot., 111, 320-325. https://doi.org/10.1016/j.psep.2017.07.016
Hemmatian, B., Planas, E., Casal, J., 2015. Fire as a primary event of accident domino
sequences: the case of BLEVE. RELIAB. ENG. SYST. SAFE., 139, 141-148. https://doi.org/10.1016/j.ress.2015.03.021
Hemmatian, B., Abdolhamidzadeh, B., Darbra, R. M., Casal, J., 2014. The significance of
domino effect in chemical accidents. J. Loss Prev. Process Ind., 29, 30-38. https://doi.org/10.1016/j.jlp.2014.01.003
Johnson, D. M., Pritchard, M. J., Wickens, M. J., 1990. Large scale catastrophic releases of
flammable liquids. Brish Gas Report to the CEC, Contract EV4T, 14.

20
Laboureur, D., Birk, A. M., Buchlin, J. M., Rambaud, P., Aprin, L., Heymes, F., Osmont, A. ,
2015. A closer look at BLEVE overpressure. Process Saf. Environ. Prot., 95, 159-171.
https://doi.org/10.1016/j.psep.2015.03.004.
MARS. Accident Reporting System (MARS), 2012. Retrieved 10/04/2013, from
emars.jrc.ec.europa.eu.
MHIDAS. Major Hazardous Incident Data Service, 2007. In AEA techhnology. London. HSE-
Health and Safety Executive, UK.
Napier, D. H., Roopchand, D. R., 1986. An approach to hazard analysis of LNG spills. J.
Occup. Accid., 7(4), 251-272. https://doi.org/10.1016/0376-6349(86)90017-9
NFPA. National Fire Protection Association (NFPA), 2012. Retrieved 10/04/2013, from
www.nfpa.org.
NTSB. U. S. National Transport Safety Board, 2013. Retrieved 10/04/2013, from
www.ntsb.gov.
Pitblado, R. M., Woodward, J. L., 2011. Highlights of LNG risk technology. J. Loss Prev.
Process Ind., 24(6), 827-836. https://doi.org/10.1016/j.jlp.2011.06.009
Planas-Cuchi, E., Salla, J. M., Casal, J., 2004. Calculating overpressure from BLEVE
explosions. J. Loss Prev. Process Ind., 17(6), 431-436. https://doi.org/10.1016/j.jlp.2004.08.002
Prugh, R. W., 1991. Quantitative Evaluation of" Bleve" Hazards. J. Fire Prot. Eng., 3(1), 9-
24. https://doi.org/10.1177/104239159100300102
Reid, R. C., 1979. Possible mechanism for pressurized-liquid tank explosions or
BLEVE's. Science, 203(4386),1263-1265. https://doi.org/10.1126/science.203.4386.1263
Salla, J. M., Demichela, M., Casal, J., 2006. BLEVE: a new approach to the superheat limit
temperature. J. Loss Prev. Process Ind., 19(6), 690-700. https://doi.org/10.1016/j.jlp.2006.04.004
Scarponi, G. E., Landucci, G., Birk, A. M., Cozzani, M., 2018. LPG vessels exposed to fire:
scale effects on pressure build-up. J. Loss Prev. Process Ind., 56, 342-358.
https://doi.org/10.1016/j.jlp.2018.09.0015
Vílchez, J. A., Sevilla, S., Montiel, H., Casal, J., 1995. Historical analysis of accidents in chemical
plants and in the transportation of hazardous materials. J. Loss Prev. Process Ind., 8(2), 87-
96.