near-field bleve overpressure effects: the shock start model
TRANSCRIPT

HAL Id: hal-02011899https://hal.archives-ouvertes.fr/hal-02011899
Submitted on 21 Nov 2019
HAL is a multi-disciplinary open accessarchive for the deposit and dissemination of sci-entific research documents, whether they are pub-lished or not. The documents may come fromteaching and research institutions in France orabroad, or from public or private research centers.
L’archive ouverte pluridisciplinaire HAL, estdestinée au dépôt et à la diffusion de documentsscientifiques de niveau recherche, publiés ou non,émanant des établissements d’enseignement et derecherche français ou étrangers, des laboratoirespublics ou privés.
Near-field BLEVE overpressure effects: The shock startmodel
A.M. Birk, F. Heymes, R. Eyssette, Pierre Lauret, L. Aprin, P. Slangen
To cite this version:A.M. Birk, F. Heymes, R. Eyssette, Pierre Lauret, L. Aprin, et al.. Near-field BLEVE overpressureeffects: The shock start model. Process Safety and Environmental Protection, Elsevier, 2018, 116,pp.727-736. �10.1016/j.psep.2018.04.003�. �hal-02011899�

Near-
A.M. Bia Departmenb LGEI, IMT
Keywords:BLEVEExplosionBlast overpShock initiaRisk assessm
1. Introd
A Boilihazard inLiquefiedous typessometimeor exposument of aprevalentAbbasi, 2the vessehigher ththe wall operatureAn importhe vessespheric bweak struthe vesse
∗ CorrespE-mail a
field BLEVE overpressure effects: The shock start model
rk a, F. Heymesb,∗, R. Eyssette a,b, P. Lauret b, L. Aprin b, P. Slangen bt of Mechanical and Materials Engineering, Queen’s University, Kingston, K7L 3N6, Ontario, Canada
Mines Ales, Univ Montpellier, Ales, France
ressuretion
ent
a b s t r a c t
This paper presents the results of a small scale experimental study of BLEVE overpressure effects. Testingconsisted of a sealed aluminum tube (0.6 L) filled with either water or propane, being heated by a flameuntil the internal pressure led to catastrophic failure and explosion. Three parameters were controlledduring the experiments: the failing pressure, the weakened length on the tube and the fill level. BLEVEswere obtained with tests involving water and propane. Blast gages and optical techniques were used tocharacterize the shock wave escaping from the failing tube. The results obtained suggest that the leadshock was primarily generated by the vapor space. Overpressure results obtained were compared withthe predictions of existing models and found to be in reasonable agreement except for overpressuresmeasured vertically above the cylinder where the overpressures were highest. A prediction model basedon only vapor space characteristics was developed. Images show that the shock was fully formed at somedistance away from the vessel opening and this was due to the non-ideal opening of the vessel. The modeldeveloped was based on the characteristics of the shock when fully formed away from the tube. Thesecharacteristics were defined using a combination of imaging, pressure measurements, and predictionsfrom shock tube theory.
expael why. Inentshe coon ords dt a nEVEstudomeverpct. Ts tots anull eositi
uction
ng Liquid Expanding Vapor Explosion, or BLEVE, is a majorthe industrial landscape where storage tanks of PressureGas are common. Pressure vessels are subject to vari-of aggressive conditions that can weaken them and cans lead to failure, e.g. corrosion, the impact of a projectile,re to fire (Heymes et al., 2013).The case of fire engulf-vessel is investigated in this study because it is the mostsource of BLEVEs according to the literature (Abbasi and
007; Hemmatian, 2016). In such a case the liquefied gas inl is heated, increasing the pressure significantly. Pressuresan the normal functioning pressure may be the result andf the vessel is severely weakened at the top by the tem-
increase due to the poor cooling properties of the vapor.tant characteristic of BLEVE accidents is that the fluid inl is usually at a temperature much higher than its atmo-
firstvesssivelcont
Tjectihazais noa BLThisphen
Oimpaneedeffecthe fthe p
oiling temperature. The combination of high pressure andcture leads to a crack that propagates along the length ofl allowing the pressurized fluid to be released. The vapor
onding author.ddress: [email protected] (F. Heymes).
due to theof predicthe maxithe far fie
Variouapproachequivalen
nds violently, leading to a fast drop in pressure within theere the liquid is in a superheated state and boils explo-some scenarios, the vessel opens fully, releasing all of itsand leading to a BLEVE.nsequences of such an event are blast overpressure, pro-
f vessel fragments, as well as possible fire and/or toxicepending on the stored gas properties. A fireball, though,ecessary consequence of a BLEVE. It should be noted thatis the mechanical explosion due to liquefied gas release.y is focused on the overpressure consequences of such anon.ressure prediction is a major factor in predicting BLEVEhe impact on the surroundings of a BLEVE generated blastbe understood in order to better prevent chain reactiond casualties. Various parameters are required to describe
ffects of overpressure: the peak overpressure of the blast,ve overpressure impulse and its duration, the drag loadingdynamic pressure exerted on a structure. The wide range
tion models currently available in the literature focus onmum first peak overpressure. These models also focus onld effects.
s overpressure prediction models with differentes to the BLEVE phenomenon are available. The TNT-t method (Baker et al., 1977; Van den Berg and Lannoy,
1993) isinvolvesreleasedeither thversible esuperheaTNT-approverpress
Howecontributdicting apBerg et alDynamicof liquid.den expathe constclose to tvessel, insolve a feculationsliquid boinstantanof this vareasonabCFD modassumingconditionates a shliquid respredictiothe non-iestimatedolated itposition osel diamepredictiosimulatio
The isthe contrconsidersion enerliquid insome autvapor conover, addinto accotors addipressureChemicalso far.
This pexperimeimaging.els for vaphenomerequire e
2. Mater
Exper(Birk et aminum tuof 1.65 mand somea specific
kenesea
failurem
ane,pres
ll burese tube.ailurted oles mmon23 pus h
t gagube adecalts (Lrimeeas
therhorizenceing figh sfor rgathe th
ctedPhanon 1
windoad cthe l
xper
Sum
wents of 3failursureranglve ten tens of ppressd ranressasesre coratioe is vturee vap
Press
easu
widely used for far-field overpressure prediction. Itthe calculation of the energy contained in the vessel andin the blast. Several models are available that considere isentropic expansion energy (Prugh, 1991), or irre-xpansion energy (Planas-Cuchi et al., 2004), or the excesst energy (Casal and Salla, 2006; Genova et al., 2008). Thisoach is easy to implement and well validated for far-fieldure prediction.
ver, the complex opening mechanism and phase changeions cause the TNT-equivalent model to be an overpre-proach to near-field BLEVE blasts. Van den Berg (van den., 2004) proposed a model based on Computational Fluids (CFD) by calculating the evaporation rate of a vessel fullThis model predicts the overpressure caused by the sud-nsion of the vessel contents. It is in better agreement withraints of the physical evaporation phenomenon, especiallyhe vessel. Some conservative hypotheses (no vapor in thestantaneous vessel disintegration and evaporation) do notw key problems of the near-field BLEVE overpressure cal-such as the contribution of the vapor expansion and the
iling. Van den Berg assumes that the flash evaporation iseous and that the shock is produced by the expansionpor. A more recent approach (Yakush, 2016) provides ale physical description of the BLEVE phenomenon withelling of the expansion wave propagation in the liquid,instant equilibrium boiling when the thermodynamic
s are reached. This model shows that the vapor gener-ock while the velocity of the boiling wave through thetricts shock formation due to liquid expansion. Finally, then model of Laboureur (Laboureur et al., 2015) introduceddeal opening of a vessel into the prediction. This modelthe starting shock position and overpressure and extrap-
through distance with hemispherical decay. The startingf the shock was assumed to be some factor times the ves-ter which determines the overall scale of the release. Thens were empirical, experiment based, and validated withns (van den Berg et al., 2004).sue raised by these prediction models is the definition ofibution of each phase. Most of the energy based modelsexpansion energy from the vapor space added to expan-gy from the vapor generated by the flashing fraction oforder to calculate the maximum overpressure. However,hors (Baker, 1985; Birk et al., 2007) state that only thetributes to the maximum first peak overpressure. More-
itional phenomena such as directionality need to be takenunt in the overpressure prediction models. Empirical fac-ng the effect of this phenomenon are used, based onvessel bursts experiments (CCPS − American Institute ofEngineers, 1994). But none have been validated for BLEVE
aper first presents results of tests involving a small scalental apparatus with overpressure data and high speedThese results are compared to existing prediction mod-lidation. Finally, a physical approach to the shock startnon is presented with a modelling method that does notvaluation of the expansion energy.
ial and methods
iments involving small scale BLEVEs were undertakenl., 2016). The apparatus used consisted of 6061T6 alu-
weawerewasfilledpropthensmaof ththe t
FlocacoupThe137Avarioblastal ttheresuexpebut m
Oandinfluvary
Hand(Harinsidstrutwoa Nikend
Lsure
3. E
3.1.
TmastialprestionTweing imasureliquithe pthe cfailusatucurvperaof th
3.2.
M
bes, 5 cm in diameter, 30 cm long, with a wall thicknessm and an inner volume of 0.6L. The tubes were annealedaluminum was removed through machining, to produce
weakened length and reduced burst pressure (Fig. 1).This
Table 1,sensor of
The inoverpres
d length is referred to as a slot. The ends of the tubesled with Swagelok fittings. The BLEVE case studied herere through exposure to fire. During testing, the tube wasotely with water or commercial propane (roughly 80%
20% other hydrocarbons), up to a known quantity. It wassurized to failure through a slow heating process using aner placed below the tube (Fig. 2). The controlled variablesests were the burst pressure, and the weakened length on
e conditions were monitored with pressure sensorsn the filling and venting pipes, and two type K thermo-ounted inside the tube (one in liquid and one in vapor).
itoring sensors are sampled at 10 Hz. Blast gages (PCBiezoelectric with a sample rate of 200 kHz) were set at
eights and angles to the slot in the tube. Three pencil typees were mounted on a vertical axis above the experimen-t distances of 0.3m, 0.4 m and 0.9 min order to observe
y above the tube. Except in the case of the small scaleaboureur, 2012), previous mid-scale and large scale BLEVEnts did not measure the overpressure above the vessel,ured it only from the sides.gages were located at 45◦ (down from tube top on side)ontal (tube side) to the tube to observe the directionalof the opening process on the overpressure at distances
rom 0.25 m to 0.4 m.peed imaging was used to capture the rupture mechanismetroreflective shadowgraphy of the shock propagation
er and Settles, 2009).Observation of the phenomenone tube was done through a 38 mm quartz window con-at one end of the tube. The imaging was carried out usingtom V711 high speed video cameras. The lenses used were05 mm (f/8) for PILS and a Tamron 300 mm (f/5.6) for theow imaging.ells were mounted under the experimental tube to mea-oad on the ground generated by the BLEVE.
imental results
mary of experiments
y tests were performed with tubes filled with an average00 g of water resulting in eleven BLEVEs and nine par-es. Over all the tests performed with water, the failureranges from 9 to 50 bar, thus the liquid volume frac-es from 62 to 70%, assuming equilibrium before rupture.sts were performed on tubes filled with propane result-BLEVEs. Over all the tests performed with propane, the
ropane used per test ranges from 140 g to 156 g, the fail-ure ranges from 8 to 40 bar, thus the volume fraction ofges from 50 to 66%. The failure conditions, evaluated fromure sensor and thermocouple in the liquid phase for all of, are summarized in the P-T diagrams shown in Fig. 3. Thenditions for most of the tests were near equilibrium at
n conditions. A slight offset with respect to the saturationisible. It is due to fast heating and the presence of tem-
stratification in the tube leading to a faster pressurizationor space but a weaker explosive boiling.
ure peaks data
rements from all of the blast gages are summarized in
where R is the distance from the top of the tube to thethe blast gage.fluence of the direction of measurement on the maximumsure is clearly shown by these results. The ratio between
Fig. 1. Small scale BLEVE apparatus (a) global view, (b) machined slot on the tube for controlled failure.
Fig. 2. Experimental tube (a) front view, (b) end view.

Fig. 3. Summary of test results (a) Water tests, (b) Propane tests.
Table 1Experimental data from small scale BLEVE with propane: measurements from blast gages above and to the sides of the vessel.
# Failure conditions Vertical overpressure 45◦ overpressure Horizontaloverpressure
Mass (g) % liqa Pfail (bar) Tfail (K) R (m) �P (kPa) R (m) �P (kPa) R (m) �P (kPa)
1 150 66% 40 367 0.29/0.39 65.4/53.6 0.41 29.25 0.29 40.72 150 66% 40 375 0.26/0.36 88/59.1 0.39 29.87 0.29 41.163 140 51% 30 351 0.28/0.38 71.8/38.8 0.34 29.99 0.29 30.534 150 56% 28 347 0.28/0.38/0.92 48.76/25.90/7.58 0.28/0.30 /0.31 18.59/29.05/26.39 0.29 20.255 156 50% 8 297 0.28/0.38/0.92 28.30/11.60/3.84 0.25/0.26 /0.31 3.27/9.12 /6.08 0.295 2.216 150 61% 37 374 0.28/0.38/0.92 60.00/49.00/16.95 0.25/0.26 /0.32 42.26/37.43/39.25 0.3 40.367 155 60% 31 349 0.28/0.38/0.92 76.80/47.50/13.79 0.25/0.26 /0.32 33.11/26.36/31.36 0.295 26.078 153 58% 29 357 0.28/0.38 44.2/34.5 0.26/0.32 23.79/27.55 0.29 23.539 152 53% 17 350 0.28/0.38 24.5/17.9 0.26/0.32 17.83/15.92 0.29 7.0610 1
a Volume
side overgages plaover all sof measuhorizontaclear depmaximum
An excharacternegativeteristic pincrease ipresentsthird peaing contrin the resever, thea potenti
3.3. Phas
Whencloud escof this clothe vapordensing wcloud is o
Then,radial dirdow visuused to in
e firsrved6 anagate clofacehe pe tubaporin t
be seh ocot co
verp
thipareen pr
Mod
xperlateded
e (Bahe m
54 52% 14 324 0.28/0.38 20.13/13.13
fraction of liquid at failure conditions (in %).
pressures and top overpressures is calculated betweenced at similar distances (0.3m) for each case and averageduccessful BLEVE experiments. Between the 45◦ directionrement and the vertical, the ratio is 0.45. Between thel and vertical measurements, the ratio is 0.35. There is a
endence on the opening dynamics of the vessel on how thefirst peak overpressure is distributed around the tube.
ample of pressure measurement is given in Fig. 4*a. Aistic strong first overpressure is observed, followed by aphase and a second peak. These are known to be charac-ressure peaks for a vapor explosion(Baker, 1985). A thirdn pressure then follows. A study by Birk(Birk et al., 2007)similar results from a larger scale BLEVE. The origin of thek is yet unknown but it is hypothesized that the liquid boil-ibutes to this overpressure. The pressure signal observedults of the present work satisfies this hypothesis. How-oscillating behavior following the third rise may suggestal measurement aberration.
e change dynamics
the tube opens, the first thing visible to bare eye is a whiteaping through the opening (Fig. 5). Due to the white aspectud, it is assumed to be a 2-phase mixture, representingspace expanding from the high-pressure tube and con-hen exposed to ambient pressure, thus a condensation
bserved.
to thobse(Fig.propof thintering tof ththe vdropcanwhiccann
4. O
Incomis th
4.1.
Ecalcuthencurv
T
coupling the imaging from both sides of the tube (theection of the shadowgraph, see Fig. 6, and the axial win-alization, see Fig. 7), the following sequence of events isvestigate the hypothesis that vapor is the sole contributorCuchi etenergy asabatic prpresents
0.26/0.32 12.47/11.48 0.29 3.81
t shock. A shock is formed ahead of the condensation cloudbefore (see arrow in Fig. 6b). While the tube opens mored Fig. 7c), the condensation cloud grows, and the shockes. It is important to note that the shock is always aheadud observed. At 0.88 ms after the opening of the vessel, thebetween the liquid and the vapor starts thickening show-oint at which the boiling wave reaches the window ende (see Fig. 7d). This suggests that the boiling occurs afterspace expanded out of the tube, allowing the pressure to
he tube and the liquid to enter the superheated state. Iten that the shock occurs ahead of the condensation cloud,curs ahead of the boiling wave. Thus, the boiling liquidntribute to the first shock.
ressure prediction models
s section, available overpressure prediction models ared with the present new blast data. The shock start modelesented and discussed.
els based on global expansion energy
imental results are compared to prediction models thatthe expansion energy converted into overpressure, to
uce the overpressure from literature data such as the TNT-ker et al., 1977).odels of Prugh (Prugh, 1991) and Planas-Cuchi (Planas-
al., 2004) are based on the calculation of the expansionsuming respectively an isentropic and an irreversible adi-ocess. Another model by Casal (Casal and Salla, 2006)a model based on estimation of superheat energy, defined
Fig. 4. Overpressure measurement: a) Case 4, top R = 0.28 m; b) Birk 2007, side R = 10 m (Laboureur et al., 2015).
Fig. 5. Direct High Speed imaging of the tube opening (4000 fps) (case 4, a) 0.25 ms b) 0.5 ms c) 0.75 ms after start of the opening).
se 4,
as the difenthalpypressure,model baing the divapor spa
nd re., 201
Fig. 6. Retroreflective shadowgraph of the early stage of a BLEVE (20000 fps) (ca
ference of enthalpy of the liquid before rupture, and itsat saturation temperature corresponding to atmospheric
els aet al
after expansion. Lastly, Birk (Birk et al., 2007) presents ased on the sole evaluation of vapor expansion, calculat-fference of internal energy before and after failure in thece of the vessel. Details on the previously exposed mod-
Experfollow: fofrom a choverpres
a) 0.2 ms b) 0.45 ms, c) 0.55 ms after start of the opening).
ference curves are summarized by Laboureur (Laboureur4).
imental data points are compared to the TNT-curve asr each case and probe, the scaled distance is calculatedosen model. Then the couple (scaled distance; measured
sure) is placed on the TNT-curve plot. By comparing the
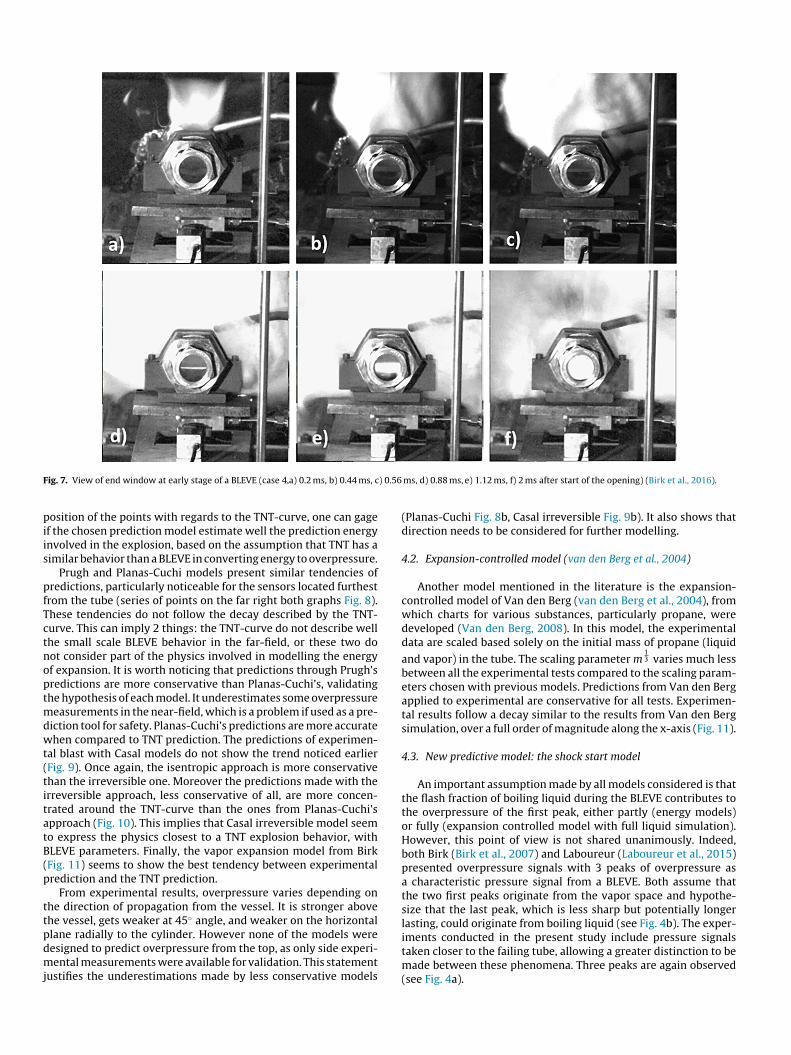
Fig. 7. View ) 0.88
position oif the choinvolvedsimilar be
Prughpredictiofrom theThese tencurve. Ththe smalnot consiof expanspredictiothe hypotmeasuremdiction towhen comtal blast w(Fig. 9). Othan theirreversibtrated arapproachto expresBLEVE pa(Fig. 11)predictio
Fromthe directhe vesseplane raddesignedmental mjustifies t
as-Cction
Expa
nothrolleh chlopeare
vapoeen
s choied tesultlatio
New
n imash
overplly (everBirk
entearacttwothatng, c
of end window at early stage of a BLEVE (case 4,a) 0.2 ms, b) 0.44 ms, c) 0.56 ms, d
f the points with regards to the TNT-curve, one can gagesen prediction model estimate well the prediction energyin the explosion, based on the assumption that TNT has ahavior than a BLEVE in converting energy to overpressure.and Planas-Cuchi models present similar tendencies of
ns, particularly noticeable for the sensors located furthesttube (series of points on the far right both graphs Fig. 8).dencies do not follow the decay described by the TNT-
is can imply 2 things: the TNT-curve do not describe welll scale BLEVE behavior in the far-field, or these two doder part of the physics involved in modelling the energyion. It is worth noticing that predictions through Prugh’sns are more conservative than Planas-Cuchi’s, validatinghesis of each model. It underestimates some overpressureents in the near-field, which is a problem if used as a pre-
ol for safety. Planas-Cuchi’s predictions are more accuratepared to TNT prediction. The predictions of experimen-ith Casal models do not show the trend noticed earlier
nce again, the isentropic approach is more conservativeirreversible one. Moreover the predictions made with thele approach, less conservative of all, are more concen-
ound the TNT-curve than the ones from Planas-Cuchi’s(Fig. 10). This implies that Casal irreversible model seems the physics closest to a TNT explosion behavior, withrameters. Finally, the vapor expansion model from Birkseems to show the best tendency between experimentaln and the TNT prediction.experimental results, overpressure varies depending ontion of propagation from the vessel. It is stronger abovel, gets weaker at 45◦ angle, and weaker on the horizontal
(Plandire
4.2.
Acontwhicdevedata
andbetweterappltal rsimu
4.3.
Athe fltheor fuHowbothpresa chthesizelasti
ially to the cylinder. However none of the models wereto predict overpressure from the top, as only side experi-easurements were available for validation. This statementhe underestimations made by less conservative models
iments ctaken clomade bet(see Fig. 4
ms, e) 1.12 ms, f) 2 ms after start of the opening) (Birk et al., 2016).
uchi Fig. 8b, Casal irreversible Fig. 9b). It also shows thatneeds to be considered for further modelling.
nsion-controlled model (van den Berg et al., 2004)
er model mentioned in the literature is the expansion-d model of Van den Berg (van den Berg et al., 2004), fromarts for various substances, particularly propane, wered (Van den Berg, 2008). In this model, the experimentalscaled based solely on the initial mass of propane (liquid
r) in the tube. The scaling parameter m13 varies much less
all the experimental tests compared to the scaling param-sen with previous models. Predictions from Van den Bergo experimental are conservative for all tests. Experimen-s follow a decay similar to the results from Van den Bergn, over a full order of magnitude along the x-axis (Fig. 11).
predictive model: the shock start model
portant assumption made by all models considered is thatfraction of boiling liquid during the BLEVE contributes toressure of the first peak, either partly (energy models)
expansion controlled model with full liquid simulation)., this point of view is not shared unanimously. Indeed,(Birk et al., 2007) and Laboureur (Laboureur et al., 2015)
d overpressure signals with 3 peaks of overpressure aseristic pressure signal from a BLEVE. Both assume that
first peaks originate from the vapor space and hypothe-the last peak, which is less sharp but potentially longer
ould originate from boiling liquid (see Fig. 4b). The exper-
onducted in the present study include pressure signalsser to the failing tube, allowing a greater distinction to beween these phenomena. Three peaks are again observeda).
Fig. 8. Comexperiment
4.3.1. TheThe p
(Baker, 1Berg et alels in thebetweenatmospheconfigurahigh andbuild-upthe overp
Expertaining cmechanisahead ofstrongerof this phpushing tconvergemation iscritical flments islarge eno3D aspecdistance
. Comparison of Casal Isentropic (a) and Irreversible (b) prediction of experi-al results on TNT-curve.
parison of Prugh model (a) and Planas-Cuchi model (b) prediction ofal results on TNT-curve.
ory of shock startrediction of shock overpressure from a gas expansion985) or hemispherical source of flashing liquid (van den., 2004) has been studied previously. However, the mod-se studies assume that the shock forms at the interfacethe high pressure initial condition and the low pressureric condition. This phenomenon is validated in the idealtion of a sudden release, assuming the interface betweenlow pressure chamber disappears instantaneously. But theof this shock must be considered in order to understandressure in the near field with a slower opening process.
imental imaging results of a bursting glass sphere con-ompressed air clearly illustrate this shock build-upm. In these images a shock appears at a given distancethe sphere fragments, and can be seen to be getting
in the successive images. (Glass, 1974). An explanationenomenon is that the compressed air acts as a piston byhe atmosphere with successive compression waves thatto form a shock. The progressive aspect of this shock for-due to the non-ideal high-pressure chamber rupture. Theow through the enlarging opening between glass frag-
Fig. 9ment
like a piston increasing in strength until the opening isugh for all of the energy to escape. Then, because of thet of the experiment, the shock will expand and decay. Theat which the shock is fully-formed is the shock start dis-
Fig. 10. Comparison of Birk isentropic vapor expansion prediction of experimentalresults on TNT-curve.

Fig. 11. Cosimulation
tance. Thfor full opest at therelated to(Rothkop
OncedecayingEq. (1) is mis the oveformed sfully-form
dP = dPs0
A corrmation reoverpress
4.3.2. ExpShock
measurempredictioof the tubexplainedcloud at tof a shocis determappear stment for
The orbetweenThese ordmated by
Onceexperimeevaluatedmeasurem
dPs0 = dP
4.3.3. Thenear-field
In ordmeasurem
with shocof the tub
Pfail/Pa =(
where PS
Fromneeds toan n expo
dPST = dP
Fig. 13For eachexperimemeasurem
(2), drimens, tlate
inallyto ad one deE pr
s expentins0 copresespohe shctedig. 13equ
shockosesawequs a tthis
s, thaxi
ual t. Tha
imit
his ssure.meteear fithe
d bot addt winnd.sour
of Rsviewinin
shockn choosing the appropriate criterion for visually detecting a
mparison of experimental data from vertical gages with Van den Bergresults.
is distance is related to the speed of the shock and the timeening of the vessel. The shock overpressure will be high-shock start position. This overpressure is expected to bethe overpressure predicted by the shock tube equation
f and Low, 1976).the shock reaches the fully-formed state, it will beginwith distance. The assumption of far-field decay based on
ade here, considering n = 1.12 (Laboureur et al., 2015). dPrpressure prediction, dPs0 the overpressure at the fully-
tate, Rs0 the distance from the tube at which the shock ised and R is the vertical distance from tube wall upward.
∗(
Rs0/R)n
(1)
ect estimation of the overpressure dP, after the shock for-quires knowledge of the shock start position RS0 and theure dPs0.
erimental determination of the shock start positionrelease details captured by the imaging instruments allow
ent of the parameter Rs0 which can be compared with thens of the model. Three successive shadowgraph framese opening illustrate the failure process of the vessel. Aspreviously, these images show a growing condensation
he crack opening followed by the progressive formationk wave ahead of the cloud. In these images, shock startined to have occurred when the shock is considered torongest (see the example in Fig. 12d), and the measure-shock start position is taken from that particular image.der of magnitude of the Rs0 found with this apparatus is61 mm and 88 mm. It corresponds to 1.2Dvessel to 1.8Dvessel.ers of magnitude are smaller than the Rs0 = 2.5Dvessel esti-Laboureur (Laboureur et al., 2015).
Rs0 is determined, the evaluation of dPs0 and dP is donentally from blast data obtained above the tube. dPs0 isusing the decay equation and the closest experimentalents from the tube (Rexp, dPexp) using:
exp ∗(
Rexp/Rs0)n
(2)
oretical evaluation of dP : shock tube theory and
andexpeditiocalcu
Ftionbaseof thBLEVplotpresof Rovercorr
Texpe
FtubetheIn thteststubeshowFromopenthe mis eqdPST
5. L
Tpresparathe nfromliquibut iblasgrou
Ationfieldexamtheity i
s0decayer to predict overpressure in tests for which overpressure
ents are not available, the evaluation of overpressure
clear sho50 �s betdRs0 = 0.4
k tube equations is computed and evaluated at the surfacee based on the initial conditions (TNO, 1997) using:
PST − 1)[
1 −
(�fail − 1
)(aexp/afail
)PST[
2�exp
{2�exp + (�exp + 1)
}PST
] 12
]−2�fail/(�fail−1)
(3)
T = dPSTPa
. The subscript ST stands for Shock Tube.this shock tube initial overpressure, a near-field decaybe fitted to match the experimental prediction of Rs0, withnent different from that for the far field decay:
∗(
R/Rtube
)n(4)
presents the model predictions of several propane tests.test, Rs0 is evaluated with high speed imaging. The
ntal data points “above 28 cm” (Fig. 13) are the closestents obtained in these experiments. Based on Eqs. (1)
Ps0 was calculated thus allowing the scaling of the otherntal measurements to this data. Based on the initial con-he shock tube overpressure dPST, at the tube surface isd and plotted (RT = 2.5 cm)., to fit the theoretical shock tube overpressure estima-function of length scale of the type 1
R˛ with � constantexperimental far-field behavior, the near-field exponentcay must be estimated. This estimation is run for allopane tests where Rs0 evaluation was possible. Fig. 13erimental data points for all of these cases, with x-axisg the distance from vessel to sensor scaled by the valuerresponding to its test, and the y-axis presenting the
sure measured by 3 sensors scaled by the value of dPs0nding to its test.ock is fully formed at R/Rs0 = 1. The overpressure dPs0 isto be the highest overpressure at this location.shows the predicted overpressure dPSTfrom the shock
ation. As can be seen the dPST/dPs0 ratio calculated fromtube equation is between 1 and 2 for all but two tests.
two tests dPST/dPs0 was 3. This suggests that those twolower shock overpressures than expected from the shock
ation. This may be due to the way the tube opened. Fig. 14rend between the dPST/dPs0 ratio and the failure pressure.trend, the stronger the failure pressure, the faster the tubee closer to 1 the ratio dPST/dPs0. It is suggested here thatmum likely overpressure is where the shock forms and ito the overpressure predicted by the shock tube equationt is dPs0 = dPST at R/Rs0 = 1.
s and openings
tudy has focused mainly on the maximum peak over-However, as mentioned in the discussion of Fig. 4, otherrs need attention in order to understand the full physics ofeld BLEVE. The hypothesis of a second overpressure peak
vapor space requires validation. The impact of explosiveiling may not be so strong on the maximum overpressure,s a significant amount of energy to other hazards, such asd, projection of vessel fragments, and load impact on the
ce of error in this study is the accuracy of the determina-0. The retroreflective shadowgraph gives interesting larges of the shock propagation but is limited when it comes tog the shock formation near the vessel opening. Principally,start is not a sudden phenomenon. There is subjectiv-
ck. This uncertainty can range from 1 to 2 frames. Withween each frame, this induces an error of 20 mm for Rs0:Dvessel.

Fig. 12. Shadowgraph of the vessel opening used for shock start detection (20 000fps, resolution 752 × 400). The shock is starting to be visible from c) and grows strongeron d) and e).
Fig. 13. Ovemodelling.
To redevaluatioleast sign
– Set ansubjectthe sho
– Get ridheatingthe tubdetecti
– Increaserationshadow
– Increasstrongeview ca
The shshock tub
theoel hafferehock
th mer deired.inallyDeried w). Ho
transe tim
er ope veincluRs0/
rpressure results from top gages scaled according to the shock build-up
uce this error and improve the accuracy of the shock startn, one need to improve the following steps from most toificant:
objective criterion on the shadowgraph will remove theive error. Such a criterion can be maximum grey level ofck or its thickness on the images.of the fire bellow the tube and find another source of. Fire generates strong heat convection in the air abovee visible through shadowgraph, which makes the shockon less distinctive.e the spatial resolution of the imaging near the shock gen-allows seeing the shock clearer. This is possible if thegraph is made on a smaller area around the tube opening.
e the video acquisition speed, with faster camera, but alsor lighting and proper adjustment of the relevant field ofptured.
thismodto dithe slenga finrequ
Fsels.agre2015andon thlongof ththatscale
ock start approach is based on existing theories of thee, relating the pressure ratios to the shock strength. Using
6. Concl
This sundersta
Fig. 14. dPST/dPs0 ratio behavior with failure pressure.
ry for BLEVE near-field overpressure is interesting as thiss been proven to work for many applications. It is appliednt phases of decay of the shock. However, the physics ofbuild-up taking place over a long-time span and longer
ay not be modeled well with the shock tube theory, andscription of the build-up followed by the decay may be
, the present tests were performed with small scale ves-ved ratios of Rs0over the tube diameter were obtained andell with other small scale experiments (Laboureur et al.,wever, the application of these results to full scale storageport vessels is not clear. Since the shock build-up dependse to full opening of the vessel, a larger vessel will have a
ening time. The propagation of the crack along the lengthssel depends on the length of the vessel. An extra factordes the vessel length needs to be considered in order toD up to a life-size vessel.
usion
tudy introduces a new set of experimental data to helpnd the overpressure hazard of a BLEVE in the near-field.

The coupdetectionphy suppthe overping. Whilpredictioprovide stor to theunlike thdiaphragspan of tbuild-upnear-field
A modto prediccompresstional powstrength.from theexperienctheory. Tstrength,thermody
A bettfor futurecases whsize anduid fill leundersta
Acknowl
This wing Resea
Referenc
Abbasi, T., Amechan489–51
Baker, W.E.G.A., 19Explodi
Baker, W.E.http://d
A.M.,ale B
016/j.A.M., Hlast ef303/C– Ameharact, J., Saon of321–1va, B.,verpreal corrrocess, I.I., 1ther,r larg
0.1364atian
xplosies, F.,
n expall firp.2013reur,
ressur74–28reur,
., 20159–17reur,
nd Boiersites-Cucxplosip.2004, R.W
ttp://dopf, Ebe. Ph
1997.ue toen Be
xpansrocessen Beodell
894(9en Be
quids. Am. Inst. Chem. Eng. Process Saf. Prog. 27, 219–224, http://dx.doi.org/
ling of overpressure measurement and optical shockthrough the use of high speed retroreflective shadowgra-
lements existing experimental data on BLEVEs as data onressures measured from above the vessel is currently lack-e there is fairly good agreement with the thermodynamicn models currently available in the literature, the resultsome evidence that vapor expansion is the sole contribu-first shock and maximum peak overpressure. Moreover,
e ideal conservative case of instant opening of a vessel (orm in the case of shock tube), a vessel opens over a finiteime. This leads to the phenomenon of progressive shocknear a vessel, leading to a new approach in estimating the
overpressure of a BLEVE.el based on this phenomenon is presented and attempts
t the near-field overpressure with an approach based onible flow theories without the use of the heavy computa-er of CFD in order to give a quick estimation of the shock
It uses two physical parameters: the shock start distanceopening, measured experimentally or estimated frome; and the shock overpressure equivalent from shock tube
hese parameters are used as indicators of the explosionreplacing the calculation of the expansion energy used innamic models in the literature.
er understanding of the dynamic of shock start is neededtesting in order to predict the starting distance and for
ere imaging is not available. Some parameters such as thevelocity of the opening of the vessel, as well as the liq-vel before rupture, and the failure pressure will help innding the formation of the shock.
edgment
ork was supported by the Natural Sciences and Engineer-rch Council of Canada.
es
bbasi, S.A., 2007. The boiling liquid expanding vapour explosion (BLEVE):ism, consequence assessment, management. J. Hazard. Mater. 141,9, http://dx.doi.org/10.1016/j.jhazmat.2006.09.056.
Birk,sc1
Birk,b3
CCPSC
Casalti1
GenoocP
GlassHarga
fo1
HemmE
HeymAwjl
Laboup2
LabouA1
Labouav
Planaejl
Prughh
Rothktu
TNO,D
van dEP
Van dm3
Van dli
, Kulesz, J.J., Ricker, R.E., Bessey, R.L., Westine, P.S., Parr, V.B., Oldham,77. Workbook for Predicting Pressure Wave and Fragment Effects ofng Propellant Tanks and Gas Storage Vessels., 1985. Explosion Hazards and Evaluation. Elsevier Scientific Pub. Co.,x.doi.org/10.1016/0010-2180(85)90099-9.
10.1002Yakush, S.E
explosij.ijheatm
Davison, C., Cunningham, M., 2007. Blast overpressures from mediumLEVE tests. J. Loss Prev. Process Ind. 20, 194–206, http://dx.doi.org/10.jlp.2007.03.001.
eymes, F., Aprin, L., Slangen, P., Eyssette, R., Lauret, P., 2016. Near fieldfects from BLEVE. Chem. Eng. Trans. 48, 283–288, http://dx.doi.org/10.ET1648048.rican Institute of Chemical Engineers, 1994. Guidelines for Evaluating theeristics of Vapor Cloud Explosions, Flash Fires and BLEVEs. Wiley-AIChE.lla, J.M., 2006. Using liquid superheating energy for a quick estima-overpressure in BLEVEs and similar explosions. J. Hazard. Mater. 137,327.Silvestrini, M., Leon-Trujillo, F.J., 2008. Evaluation of the blast-wavessure and fragments initial velocity for a {BLEVE} event via empiri-elations derived by a simplified model of released energy. J. Loss Prev.Ind. 21, 110–117.
974. Shock Waves and Man. University of Toronto Press Toronto.M.J.M.J., Settles, G.S.G.S., 2009. Retroreflective shadowgraph techniquee-scale flow visualization. Appl. Opt. 48, 4449–4457, http://dx.doi.org//AO.48.004449., B., 2016. Contribution to the Study of Boiling Liquid Expanding Vapor
ons and Their Mechanical Effects. Universitat Politecnica de Catalunya.Aprin, L., Birk, A.M., Slangen, P., Jarry, J.B., Francois, H., Dusserre, G., 2013.erimental study of an LPG tank at low filling level heated by a remotee. J. Loss Prev. Process Ind. 26, 1484–1491, http://dx.doi.org/10.1016/j..09.015.
D., Heymes, F., Lapebie, E., Buchlin, J.M., Rambaud, P., 2014. BLEVE over-e: multiscale comparison of blast wave modeling. Process Saf. Prog. 33,4, http://dx.doi.org/10.1002/prs.11626.D., Birk, A.M., Buchlin, J.M., Rambaud, P., Aprin, L., Heymes, F., Osmont,5. A closer look at BLEVE overpressure. Process Saf. Environ. Prot. 95,1, http://dx.doi.org/10.1016/j.psep.2015.03.004.D., 2012. Experimental Characterization and Modeling of Hazards: BLEVElover (PhD Dissertation). Von Karman Institute for Fluid Dynamics; Uni-Libre de Bruxelles.hi, E., Salla, J.M., Casal, J., 2004. Calculating overpressure from BLEVEons. J. Loss Prev. Process Ind. 17, 431–436, http://dx.doi.org/10.1016/j..08.002.
., 1991. Quantitative evaluation of bleve hazards. J. Fire Prot. Eng. 3, 9–24,x.doi.org/10.1177/104239159100300102..M., Low, W., 1976. Shock formation distance in a pressure driven shockys. Fluids 19, 1885, http://dx.doi.org/10.1063/1.861423.CPR 14E (Yellow Book) Methods for the Calculation of Physical Effects –Releases of Hazardous Materials (liquids and Gases).rg, A.C., van der Voort, M.M., Weerheijm, J., Versloot, N.H.A., 2004.
ion-controlled evaporation: a safe approach to BLEVE blast. J. Loss Prev.Ind. 17, 397–405.rg, A.C., Lannoy, A., 1993. Methods for vapour cloud explosion blast
ing. J. Hazard. Mater. 34, 151–171, http://dx.doi.org/10.1016/0304-3)85003-W.rg, A.C.C., 2008. Blast charts for explosive evaporation of superheated
/prs.., 2016. Model for blast waves of boiling liquid expanding vapor
ons. Int. J. Heat Mass Transf. 103, 173–185, http://dx.doi.org/10.1016/asstransfer.2016.07.048.