drop size distribution from wxt weather transmitter? heikki pohjola, application specialist thanks...
TRANSCRIPT

Drop size distribution from WXT weather transmitter?
Heikki Pohjola,
Application specialist
Thanks to Elena

©Vaisala | date | Ref. code | Page 2
Weather Transmitter
CPU board
PTU module
screw terminal
Ultrasonic wind sensor
acoustic rain sensor
©Vaisala | date | Ref. code | Page 3
Output of radar systems is expressed in Z or dBZ.
Z is reflectivity factor, Z = NiDi6
Ni number of particles with diameter Di per unit volume of the atmosphere.Z varies from 0.0000001 to 10000000 so we use instead logarithmic dBZ
In Hydrology, this rainfall intensity is then estimated from
Z = aRb where a and b are empirical parameters
e.g. Z = 200R1.6
where R = rainfall rate in mm/h
The Equations.
©Vaisala | date | Ref. code | Page 4
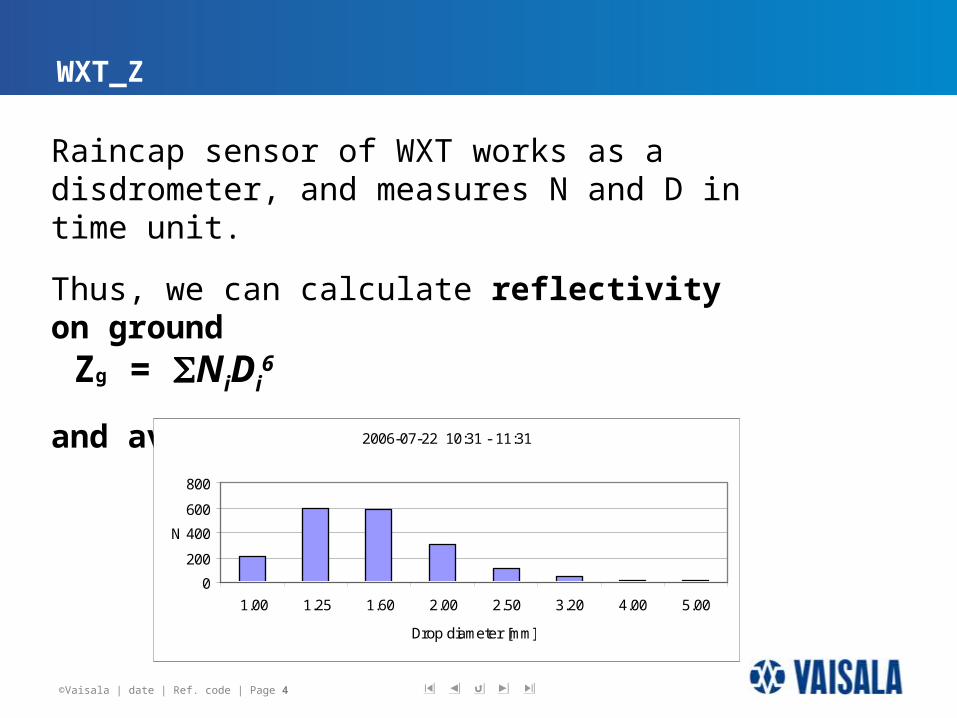
Raincap sensor of WXT works as a disdrometer, and measures N and D in time unit.
Thus, we can calculate reflectivity on ground Zg = NiDi
6
and avoid all fuzzy Z/R conversions
WXT_Z
2006-07-22 10:31 - 11:31
0
200
400
600
800
1.00 1.25 1.60 2.00 2.50 3.20 4.00 5.00
Drop diameter [mm]
N

©Vaisala | date | Ref. code | Page 5
DSD field test measurements in Vantaa, July 2006
2006-07-22 10:31 - 11:31
0
200
400
600
800
1.00 1.25 1.60 2.00 2.50 3.20 4.00 5.00
Drop diameter [mm]
N
2006-07-22 13:31 - 14:31
0
50
100
150
1.00 1.25 1.60 2.00 2.50 3.20 4.00 5.00
Drop diameter [mm]
N
Drop size distribution varies in time and placetwo sets during the same day, same site
©Vaisala | date | Ref. code | Page 6
The Danger
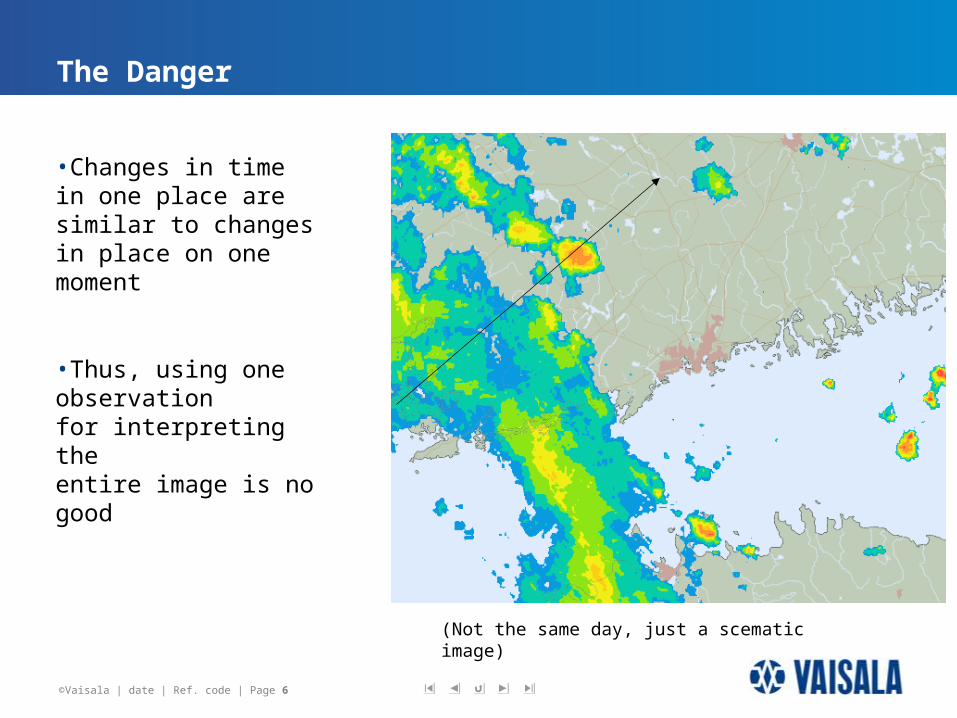
•Changes in timein one place are similar to changes in place on one moment
•Thus, using one observation for interpreting theentire image is no good
(Not the same day, just a scematic image)

©Vaisala | date | Ref. code | Page 7
Application
Set one or more WXTs to blocked sectors of radar
Combine dBZ valuesfor each image (every2, 5, 6, 10 or 15 minutes)
Metman3 and IRIS have tools for thisusing Barnes method for radar+gauge combination
(see IRIS hydromet option)
(Barnes, S.L., 1964: A technique for maximising details in numerical weather map analysis. Jour_. AppI_Meteor., _3,396-409)
A very bad case of beam blocking in mountaineus environment

©Vaisala | date | Ref. code | Page 8
Other applications
•Gapfilling between radars
•Ground reference for vertical profile of reflectivity

©Vaisala | date | Ref. code | Page 9
Data
•Drop size distribution data from WXT, disdrometer (RD-69) and POSS from Järvenpää
•WXT: 21.8. ->
•RD-69: All Testbed campaings
•POSS: All Testbed campaings

©Vaisala | date | Ref. code | Page 10
Is WXT´s DSD data accurate enough?
•Comparison between disdrometer, WXT and POSS data. (In WXT specs accumation accuracy 5 %.)
In future:
•If results are promising:• Weather radar applications like WXT-beam blockage correction, -cap
filling, -adjustment, ...

©Vaisala | date | Ref. code | Page 11
Back up slides

©Vaisala | date | Ref. code | Page 12
Prr2
LC|K|2= Z
Where
Pr is the power in watts – this is what radar technically measure
L is attenuation and other losses
C is radar constant (set in calibration)
|K|2 is the dielectric factor (roughly, ice or water)
r is distance from radar
FYI: Radar equation

©Vaisala | date | Ref. code | Page 13
The Opportunity
Global distribution of DSD is badly known (as disdrometers are expensive and thus rare)
Climatological research, especially global precipitation projects such as GPM could benefit of a bunch of reasonably priced identical disdrometers at each ground validation site.
The Global Precipitation Measurement (GPM) Program
Objectives:
• obtain increased understanding of clouds and rainfall processes
• make frequent rainfall measurements on a global basis.
Continuation of the partnership of Tropical Rainfall Measuring Mission (TRMM).
Partners: NASA, ESA, Japanese Aviation Exploration Agency

©Vaisala | date | Ref. code | Page 14
Attenuation
When there is precipitation between the radar and the target, some microwave power is lost.
This is called attenuation, and it is a problem in C-band and X-band.
Dual polarization has solutions.
On single polarization radars, the attenuation correction is in form of
where C and E are empirical parameters, which depend on drop size distribution. Research of this could be interesting (in one of the Tekes projects ?) as in Kumpula we have the independent measure of real attenuation (from dual pol).

©Vaisala | date | Ref. code | Page 15
Attenuation is a problem in C-band; dual polarization shows maginitude and promises a fix correction scheme
Not correctedCorrected

©Vaisala | date | Ref. code | Page 16
Validation with gauges (1h accumulation)

©Vaisala | date | Ref. code | Page 17
Note on dBZ-based dBZ attenuation correction
This is notorious, as any errors cumulate and the correction can explode with range. However, in single pol radar it is the best we can get. Sigmet colution against exploding correction has been set of two thresholds as below.
I do admit dual pol solutions are better. But, we have even single pol radars in the product family.