shenzhen demo mr. heikki pentikäinen
TRANSCRIPT

MMEA Shenzhen demoHangzhou 15th of May 2015
Heikki Pentikäinen/VTT
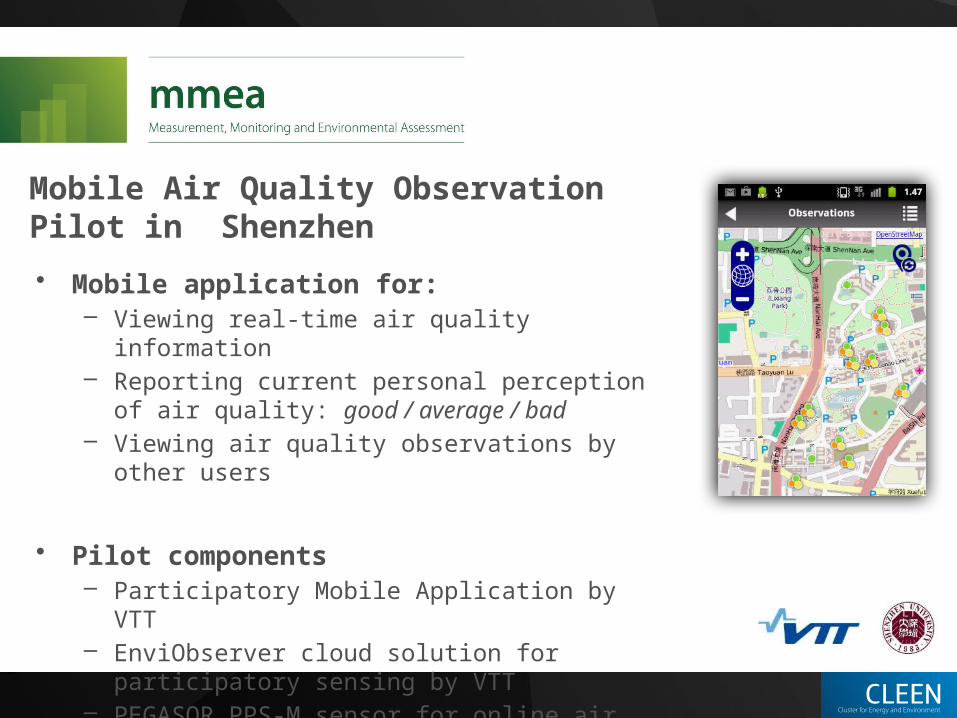
Mobile Air Quality Observation Pilot in Shenzhen
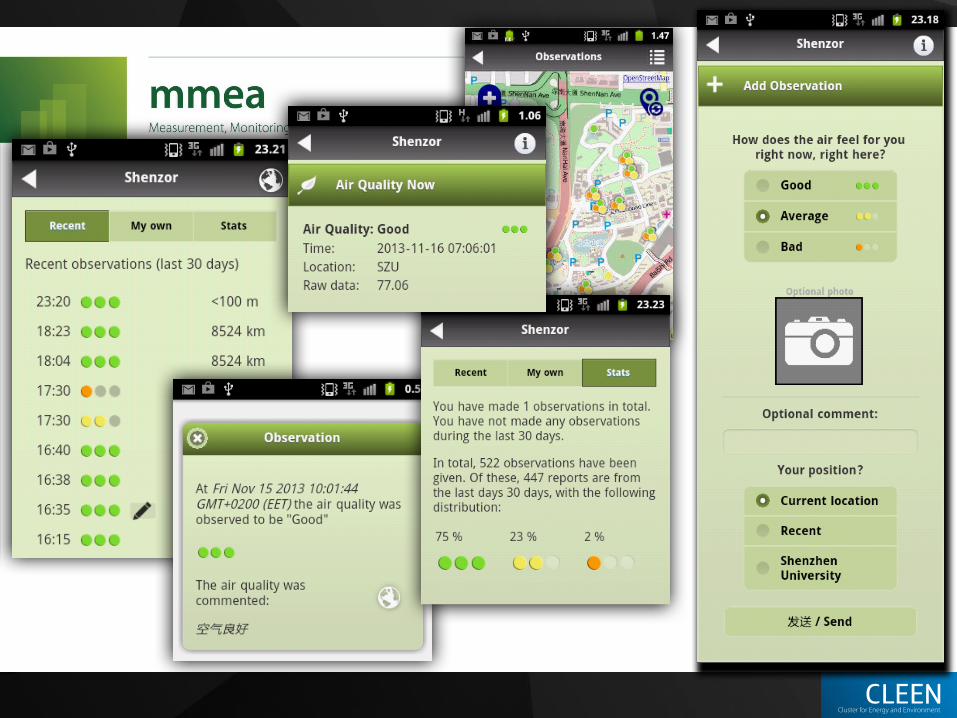
• Mobile application for:– Viewing real-time air quality information– Reporting current personal perception of air
quality: good / average / bad– Viewing air quality observations by other users
• Pilot components– Participatory Mobile Application by VTT– EnviObserver cloud solution for participatory
sensing by VTT – PEGASOR PPS-M sensor for online air quality
measurements
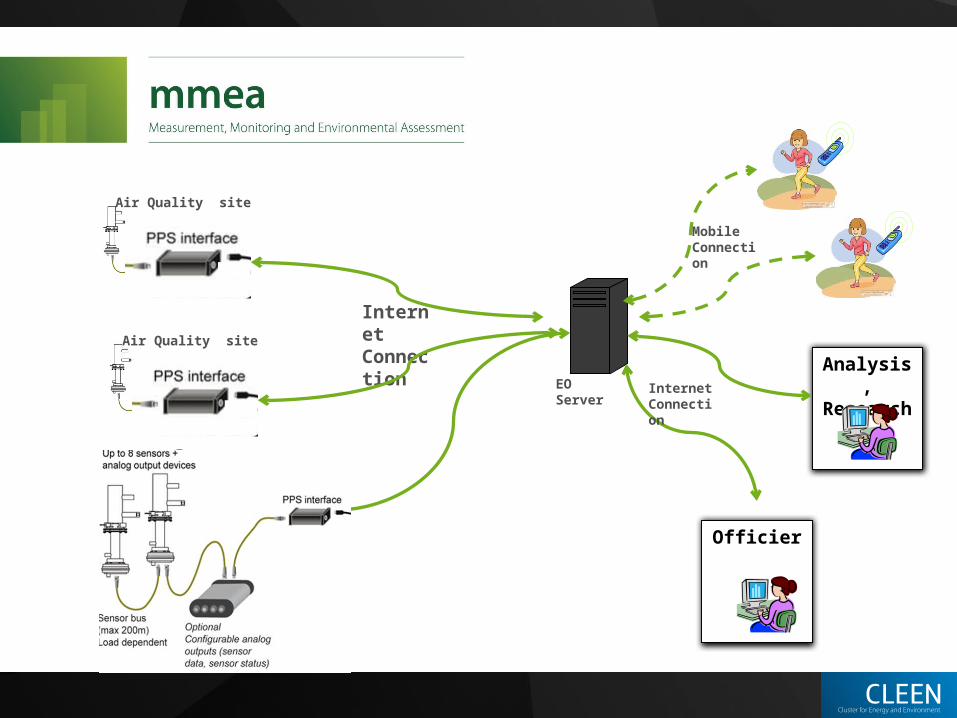
Internet Connection
EO Server
Air Quality site
Air Quality site
Air Quality site
Analysis,Research
Officier
Internet Connection
MobileConnection

Observation activity during the pilot period
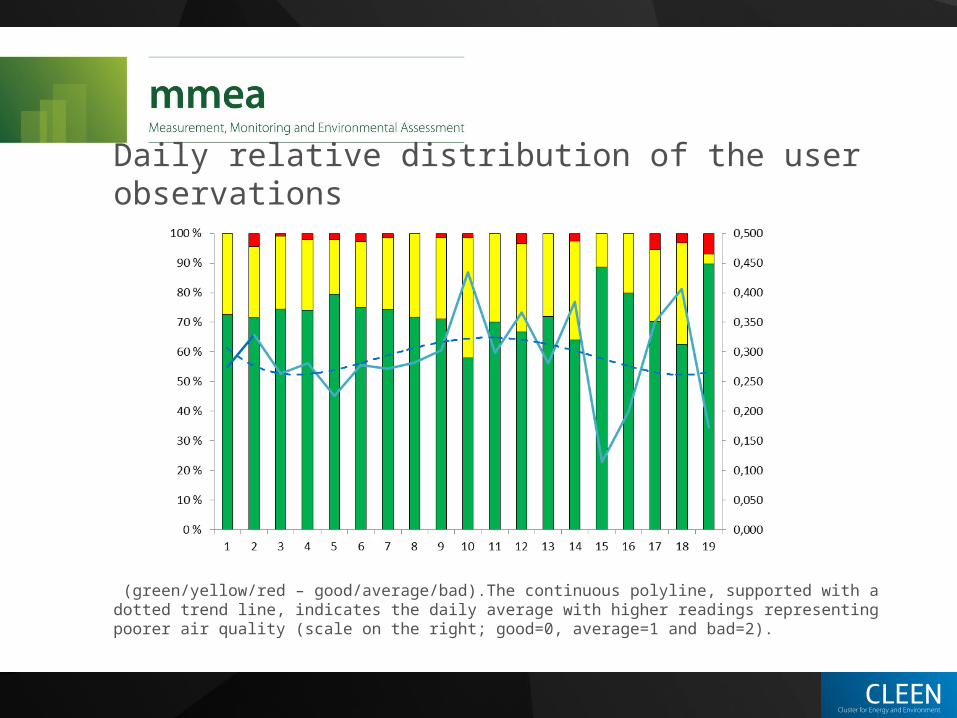
Daily relative distribution of the user observations
(green/yellow/red – good/average/bad).The continuous polyline, supported with a dotted trend line, indicates the daily average with higher readings representing poorer air quality (scale on the right; good=0, average=1 and bad=2).
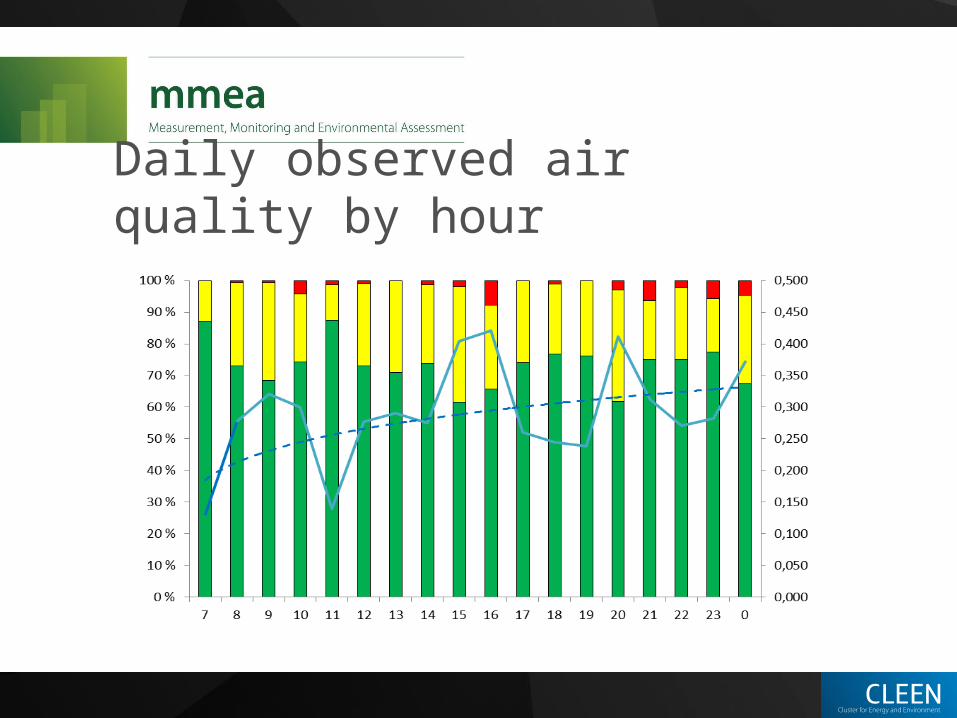
Daily observed air quality by hour
1.7.20...1.7.2...2.7.20...3.7.20...3.7.2...4.7.20...5.7.20...5.7.2...6.7.20...7.7.20...7.7.2...8.7.20...9.7.20...9.7.2...10.7....11.7....11.7....12.7....13.7....13.7....14.7....15.7....15.7....16.7....17.7....17.7....18.7....19.7....19.7....20.7....21.7....21.7....22.7....23.7....23.7....24.7....25.7....25.7....26.7....27.7....27.7....28.7....29.7....29.7....30.7....31.7....31.7....
0
10
20
30
40
50
60
70
80
90
100
110
0
20
40
60
80
100
120
140
160
180
200
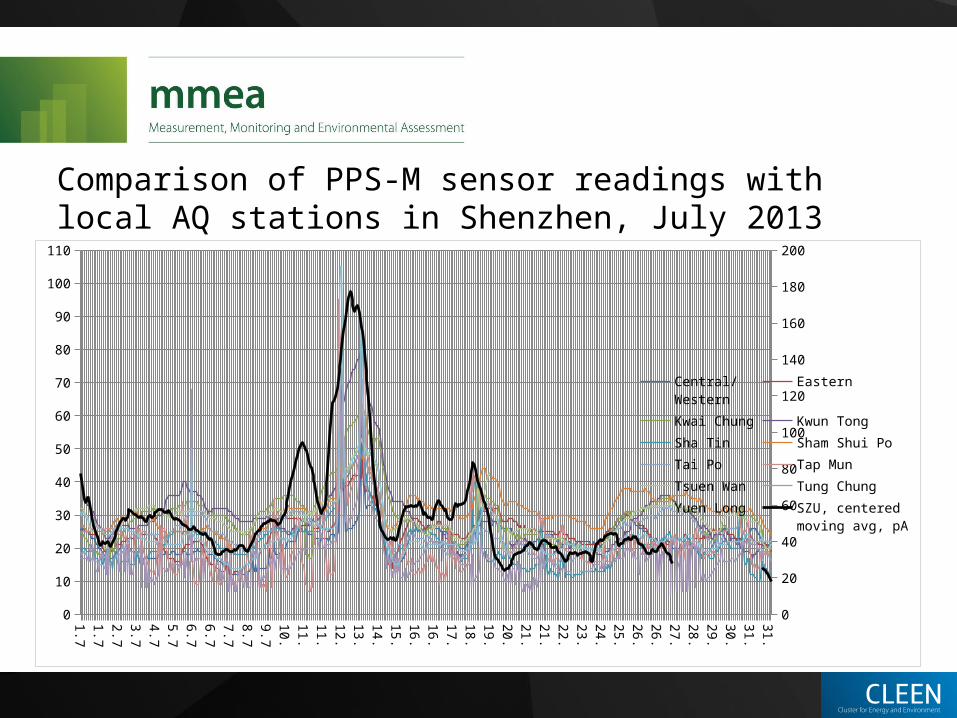
Central/WesternEasternKwai ChungKwun TongSha TinSham Shui PoTai PoTap MunTsuen WanTung ChungYuen LongSZU, centeredmoving avg, pA
Comparison of PPS-M sensor readings with local AQ stations in Shenzhen, July 2013
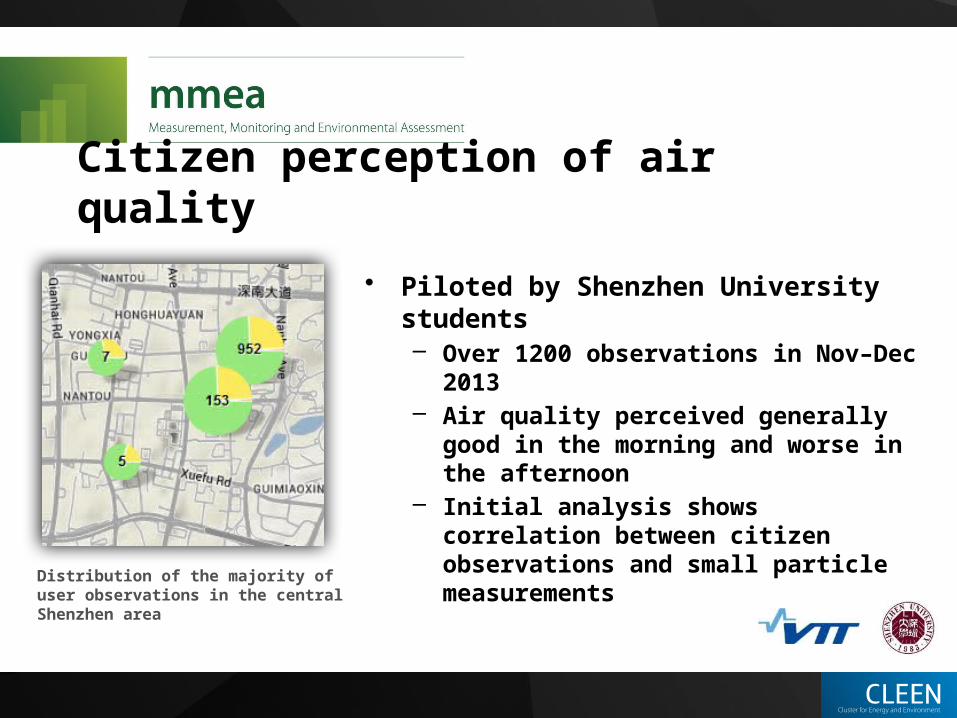
Citizen perception of air quality
• Piloted by Shenzhen University students– Over 1200 observations in Nov–Dec 2013– Air quality perceived generally good in the
morning and worse in the afternoon– Initial analysis shows correlation between
citizen observations and small particle measurements
Distribution of the majority of user observations in the central Shenzhen area
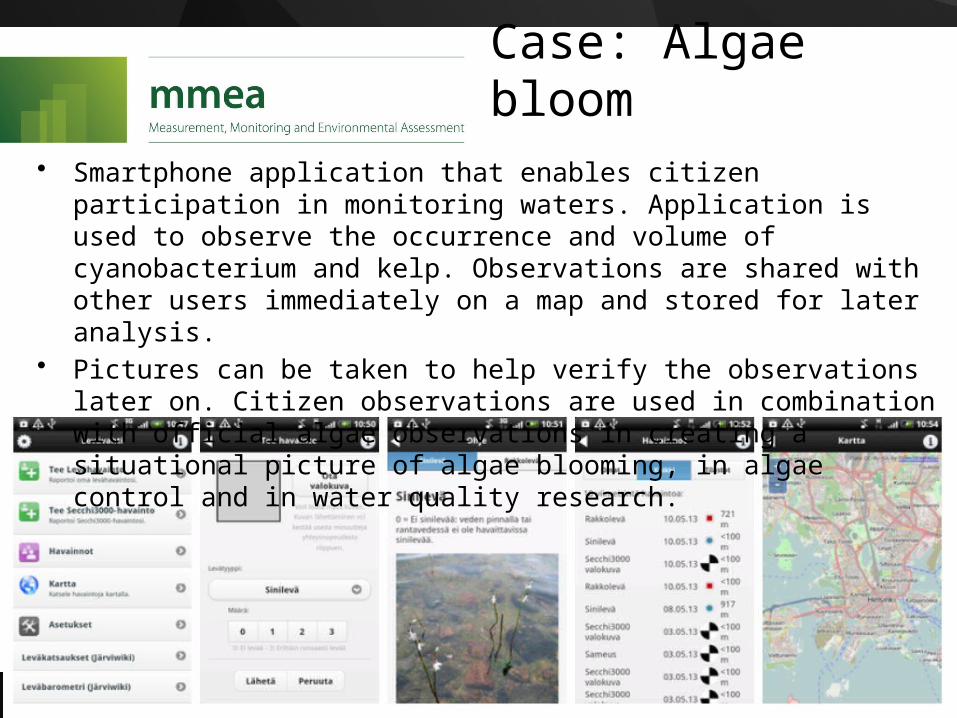
Case: Algae bloom• Smartphone application that enables citizen participation in monitoring
waters. Application is used to observe the occurrence and volume of cyanobacterium and kelp. Observations are shared with other users immediately on a map and stored for later analysis.
• Pictures can be taken to help verify the observations later on. Citizen observations are used in combination with official algae observations in creating a situational picture of algae blooming, in algae control and in water quality research.