driving workforce change · driving workforce change. regional impact and implications of auto...
TRANSCRIPT
Regional impact and implications of auto industRy tRansfoRmation to a gReen economy
Driving Workforce Change
This report was produced by a research consortium of the Indiana, Michigan and Ohio Labor Market Information offices and their strategic partners with funding from the U.S. Department of Labor.
Driving Workforce ChangeRegional Impact and Implications of Auto Industry
Transformation to a Green Economy
This project was supported by a grant from the
U.S. Employment and Training Administration
For more information on the Driving Change Project,visit www.drivingworkforcechange.org
Indiana• IndianaDepartmentofWorkforceDevelopment—Research&Analysis• IndianaUniversity,KelleySchoolofBusiness,IndianaBusinessResearchCenter
Michigan• MichiganDepartmentofTechnology,Management,andBudget—BureauofLaborMarketInformationandStrategicInitiatives
• CenterforAutomotiveResearch
Ohio• OhioDepartmentofJobs&FamilyServices—LaborMarketInformationBureau• CaseWesternReserveUniversity
May 2011
ThisworkforcesolutionwasfundedbyagrantawardedbytheU.S.DepartmentofLabor’sEmploymentandTrainingAdministration.ThesolutionwascreatedbythegranteeanddoesnotnecessarilyreflecttheofficialpositionoftheU.S.DepartmentofLabor.TheDepartmentofLabormakesnoguarantees,warranties,orassurancesofanykind,expressorimplied,withrespecttosuchinformation,includinganyinformationonlinkedsitesandincluding,butnotlimitedto,accuracyoftheinformationoritscompleteness,timeliness,usefulness,adequacy,continuedavailability,orownership.Thissolutioniscopyrightedbytheinstitutionthatcreatedit.Internalusebyanorganizationand/orpersonalusebyanindividualfornon-commercialpurposesispermissible.Allotherusesrequirethepriorauthorizationofthecopyrightowner.
i
AcknowledgmentsThe consortium would like to acknowledge
the numerous people that have contributed
to this study and this report. Many experts
in industry, government and universities
provided valuable data and insights that not
only guided the formation of conclusions, but
also, at a more fundamental level, inspired the
asking of the right questions. Additionally, in
spite of the perennial demands of the business
of manufacturing, firms took considerable
time to share their experiences. Many opened
their doors to us, let us talk to workers,
and allowed us to concretely experience the
challenges and triumphs of their world
firsthand. To all of these people we are
deeply indebted. Through their participation,
this report is more than a collection of the
thoughts of its authors. It is an expression of a
community—bound by its shared values and
concerns and enhanced by its variety
of perspectives.
The Consortium
AND ITS CENTERSSM

ii Driving Workforce Change: Regional Impact and Implications of Auto Industry Transformation to a Green Economy
Table of ContentsAcknowledgments .......................................................................................................... i
The Consortium ............................................................................................................. i
Executive Summary ....................................................................................................... 1
1. Introduction .............................................................................................................51.1 This Study: Rationale and Objectives .............................................................................................................................................6
2. The Auto Industry Transformation: Dimensions of Change .....................................72.1 Powertrain and Fuels ..........................................................................................................................................................................72.2 Materials and Forming .........................................................................................................................................................................92.3 Electronics, Software and Controls ..............................................................................................................................................10
3. Employer Responses to Auto Industry Changes ..................................................... 133.1 Automakers and Tier 1 Suppliers ...................................................................................................................................................143.2 Supply Chain Transformation among Small Firms ..................................................................................................................... 203.3 Implications on Supply and Demand for Skills ............................................................................................................................243.4 Educational Programs ........................................................................................................................................................................263.5 High-Road Production Strategies .................................................................................................................................................. 28
4. Who Are the Displaced Workers? .......................................................................... 304.1 Job Change by Occupation .............................................................................................................................................................. 304.2 Demographics and Education for Affected Workers ................................................................................................................314.3 Finding Work .......................................................................................................................................................................................32
5. Are Green Jobs the Future? ....................................................................................335.1 Green Jobs Survey Results ...............................................................................................................................................................335.2 Recent Trends in Green-Related Industries ............................................................................................................................... 365.3 Occupational Prospects for the Future ........................................................................................................................................37
6. Career Pathway Clusters ........................................................................................436.1 What Are Career Pathway Clusters? ............................................................................................................................................436.2 The Seven Pathway Clusters .......................................................................................................................................................... 446.3 Finding and Closing the Skills Gap .................................................................................................................................................47
7. Closing the Skills Gap ............................................................................................ 497.1 Measuring Skills Gaps .........................................................................................................................................................................497.2 Results of the Trip-Time Method....................................................................................................................................................517.3 Trip Times for Automotive Occupations .....................................................................................................................................527.4 Closing the Skills Gap ........................................................................................................................................................................53
iii
Index of TablesTable 1: Projected U.S. Market Share of Alternative and Advanced Powertrain Types, 2011 and 2015 ................................................................................. 8
Table 2: Increase in Material Content from 2009 to 2020 ................................................................................................................................................................ 10
Table 3: Green Automaker Investment in Indiana, Michigan and Ohio, By Company and By State, 2010-2011 Announcements ................................. 13
Table 4: American Recovery and Reinvestment Act (ARRA) Awards for Electric Drive Vehicle, Battery and Component Manufacturing .............. 14
Table 5: Projected Major Automaker Employment in Indiana, Michigan, Ohio and the United States in 2010, 2015 and 2020 .................................... 15
Table 6: HR Manager Perspective on Skill Shortage by Type of Worker ...................................................................................................................................... 24
Table 7: Tri-State Auto-Related Educational Programs by Major Program Categories ............................................................................................................. 26
8. Conclusion: Workforce Implications ......................................................................558.1 Employer Challenges ..........................................................................................................................................................................558.2 Workforce Challenges ......................................................................................................................................................................55
Appendix A: Auto-Related Degree Programs in the Tri-State Region ......................... A-1
Appendix B: Green Automaker Investments in the Tri-State Region, 2010-2011 Announcements ........................................................................................................ A-3
Appendix C: Supplier Survey Methodology ................................................................ A-4
Appendix D: Assessing the Green Jobs Survey Results ............................................... A-5
Appendix E: Occupational Prospects by O*NET Green Categories .............................. A-7
Appendix F: Project Team and Contacts ................................................................... A-10
Index of FiguresFigure 1: Michigan, Indiana and Ohio Engine Production as a Percent of Total U.S. Engine Production, 1995-2010 and 2011-2017 Forecast ............. 9
Figure 2: U.S. Motor Vehicle Electronics Employment, 2002-2009 ................................................................................................................................................11
Figure 3: Long-Term Claimants by Broad Occupational Category .................................................................................................................................................. 31
Figure 4: Long-Term Claimants by Educational Attainment .............................................................................................................................................................. 31
Figure 5: Long-Term Claimants by Age Group ...................................................................................................................................................................................... 32
Figure 6: Selected Occupations in the Production, Construction and Engineering Cluster .................................................................................................... 48
Figure 7: Selected Occupations in the Same Cluster as an Industrial Machinery Mechanic ..................................................................................................... 49
Figure 8: Trip Times to Transition from an Industrial Machinery Mechanic to Selected Occupations ................................................................................. 50
Figure 9: Percentage of Occupations in Each Job Zone, Selected Clusters .................................................................................................................................. 51
Figure 10: Average Trip Time from Production, Construction and Engineering Clusters to All Clusters ........................................................................... 52
Figure A-1: Total Programs .......................................................................................................................................................................................................................A-1
Figure A-2: Automotive Programs by Type of Program ...................................................................................................................................................................A-1
Figure A-3: Types of Degrees ..................................................................................................................................................................................................................A-2
Figure A-4: Automotive Programs by State .........................................................................................................................................................................................A-2
iv Driving Workforce Change: Regional Impact and Implications of Auto Industry Transformation to a Green Economy
The Driving Change study has been a collaborative effort of three states’ workforce development agencies and their strategic partners. The following table indicates those partners primarily responsible for the various chapters and an email contact for further information.
2 The Auto Industry Transformation: Dimensions of Change Center for Automotive Research: [email protected]
3Auto Industry Supply Chain Transformation Weatherhead School of Management, Case Western Reserve University: [email protected]
4 Who Are the Displaced Workers? Indiana Department of Workforce Development: [email protected]
5 Are Green Jobs the Future? Indiana Business Research Center: [email protected]
6 Career Pathway Clusters Indiana Business Research Center: [email protected]
7 Closing the Skills Gap Indiana Business Research Center: [email protected]
Table 8: Tri-State Occupational Employment Loss in Transportation Equipment Manufacturing, 2006 to 2009 .............................................................. 30
Table 9: Auto Sector§ Employment Change by Sex and Selected Age Brackets for the Tri-State Region, 2006 to 2009 ............................................... 32
Table 10: Share of Direct Green Jobs by Core Area ........................................................................................................................................................................... 34
Table 11: Select Industries§ Generating Direct Green Jobs: Direct Green Jobs by Industry and Green Jobs as a Percent of Industry Employment 35
Table 12: Prominent Green Occupations§ in Indiana and Michigan, Occupations as a Percent of Total Direct Green Jobs ........................................... 36
Table 13: Tri-State Top 15 Green Auto Occupation§ Postings and Expected Job Change to 2018 ......................................................................................... 39
Table 14: Tri-State Top 15 Green and Growing Non-Automotive Occupation Postings and Expected Job Change to 2018 ........................................ 40
Table 15: Tri-State Top 15 Non-Green Occupation Postings and Expected Growth to 2018 ................................................................................................ 41
Table 16: Summary of Career Pathway Clusters .................................................................................................................................................................................. 45
Table 17: Engineering and Applied Technology Sub-Cluster: Key Occupation Factors ............................................................................................................. 46
Table 18: Construction and Extraction, Equipment Operation and Repair Sub-Cluster: Key Occupation Factors ......................................................... 46
Table 19: Design and Production Sub-Cluster: Key Occupation Factors ...................................................................................................................................... 47
Table 20: Sample Career Transitions from Automotive Occupations to Green, High-Wage/High-Demand Occupations ............................................ 53
Table 21: Sample Career Transitions from Automotive Occupations to Non-Green, High-Wage/High-Demand Occupations ................................. 54
Table A-1: Tri-State Top Five Green Increased Demand Automotive Occupations by Job Postings and Expected Job Change to 2018 .................A-7
Table A-2: Tri-State Top Five Green Enhanced Skills Automotive Occupations by Job Postings and Expected Job Change to 2018 ........................A-8
Table A-3: Tri-State Top Five Green New and Emerging Occupations by Job Postings and Expected Job Change to 2018 .........................................A-8
Table A-4: Tri-State Top Five Green Enhanced Skills Occupations by Job Postings and Expected Job Change to 2018 ...............................................A-9
Table A-5: Tri-State Top Five Green Increased Demand Occupations by Job Postings and Expected Job Change to 2018 .........................................A-9
1
Executive SummaryBefore the Great Recession, the auto industry in Indiana, Michigan and Ohio was in the throes of restructuring—applying new technologies and production efficiencies, reducing costs, and modifying product lines to equal or beat global competitors—accompanied by an extended period of downsizing. Overlaying the recession on the restructuring compounded the challenges the industry was already facing.
This report is a reality check, accepting that the regional economy is at a fundamentally different place and cannot return from where it came. However, as the auto sector works toward its revival, there are workforce issues to be addressed, particularly in the context of the growing evolution and demands of a green economy.
At the outset of this study, there was limited understanding of the specific nature of the transformation in skills relevant to efficient and renewable vehicle technologies and other career opportunities in the green economy. To more effectively serve the large numbers of dislocated auto industry workers, Indiana, Michigan and Ohio formed the Driving Change consortium to address this subject and in doing so developed four overarching goals:
1. Chronicle the transformation from the old auto industry to a new, more efficient auto industry, especially focusing on the new skill and training requirements of the auto workforce.
2. Identify the effects of this structural transformation on the auto parts supply chain workforce.
3. Examine green job opportunities now and in the future as alternative career pathways for displaced workers.
4. Identify the skills gap and the required educational and technical training
needed for dislocated workers to transition into new occupations.
Technology Drives ChangeThe pace of vehicle technology change is accelerating, particularly in response to changes in consumer taste and expectations, higher safety standards, and the drive toward a low-carbon future embodied in more aggressive government fuel economy standards and more stringent greenhouse gas emissions rules. When considering changes in automotive technology that support the “greening” of automotive transportation, most people think first about advanced powertrains, materials and electronics.
These three technology sectors play a significant role in the transformation of the new auto industry:
• The most noteworthy change occurring in the powertrain and fuels sector of the industry is the re-emergence of the electric vehicle. The development of alternative forms of energy storage (primarily batteries) is rapidly progressing, but the internal combustion engine could remain the dominant technology for the next decade and beyond. As powertrain technologies advance, the locations of powertrain production and employment may shift. The tri-state region of Indiana, Michigan and Ohio represented 62.2 percent of total U.S. traditional engine production in 2010. It is possible that new vehicle propulsion systems will be produced outside the region and/or that advanced technologies may require fewer workers to produce the same number of propulsion systems. In either event, a large-scale displacement of traditional engine production by alternative technologies puts the tri-state region’s powertrain employment at risk.
• The need to make vehicles lighter for improved fuel economy is a major driver in the development of automotive materials and forming. Vehicle lightweighting focuses on
2 Driving Workforce Change: Regional Impact and Implications of Auto Industry Transformation to a Green Economy
finding the optimal combination of materials to achieve the desired vehicle weight reduction. Currently, the adoption of new materials is impeded by risks of performance issues and the lack of reliable simulation models to predict potential problems. The ability to develop a regionalized supply base is also a major role in the adoption of new materials for vehicle lightweighting. The U.S. workforce’s strength is in steel use, but less so in alternative materials. While there are only a few domestic metallurgy programs focused on lightweight materials, Europe and Asia have much more experience in this field.
• Electronics, software and controls in vehicles will continue to increase at a rapid rate. Today electronics account for about 25 percent of a vehicle’s value. In the next five to 10 years, that figure will climb to 40 percent or more. Although the tri-state region is poised to benefit from the research and development, design, engineering, and systems integration side of the electronics used in vehicles, the area will face stiff competition from other automotive regions that are stronger in electronics manufacturing, particularly those in Europe and Asia.
Workforce ImplicationsToday’s auto industry needs engineering and technical employees who consider the interactions among vehicle systems in order to optimize solutions more broadly. This need for systems thinking means that individuals who work in research, development and engineering must also possess the soft skills that enable cross-cultural communication, collaboration and teamwork. Production and skilled trades workers must adapt to an increasingly fast cadence of new product, process and technology introductions. These workers, too, require communication and teamwork skills that enable problem solving and continuous improvement in process and quality systems.
Fortunately, the tri-state region has the educational infrastructure to meet these challenges and prepare the workforce for the occupations and careers of the future. Out of nearly 900 accredited postsecondary
institutions in the region, more than one-third offer programs relevant to the engineering, design, production and maintenance of automobiles.
Investing in the Future Despite the recession, financial constraints, market and regulatory uncertainty, automakers and suppliers are investing in the technologies discussed above to produce greener products and processes. Automaker announcements in 2010 and thus far in 2011 total $4.3 billion in “green” investment in the tri-state region alone.
Auto production rebounded significantly in 2010 and many firms have seen profit margins return. Nonetheless, management appears to be concerned about the rebound’s permanence and hesitates to expand hiring or production at the rate of previous economic recoveries. Management, it appears, continues to operate in a cost-cutting mode. Unfortunately, simple cost-cutting models of survival alone are not viable in the long run. Firms also need to build on their strengths and the strengths of the knowledge and skills of their workers.
This study concluded that the U.S. auto supply chain could prosper by adopting a “high-road” production approach in which firms, their employees and suppliers work together to optimize investment, labor, quality and technology development.
Adopting high-road policies requires that everyone in the value chain be willing and able to share knowledge. Production will also gravitate toward decentralization and greater reliance upon all workers. Our fieldwork found examples of firms that are thriving because they adopted an agile production model—a variety of products for a variety of industries delivered quickly. They use advanced equipment enhanced with cutting-edge information technology; but in addition to changing their product and operations strategies, they have also transformed their human resource policies.
Green OpportunitiesEven if labor and management work together to advance the productivity of the value-chain,
3
many workers who have lost jobs due to industry restructuring or the Great Recession still need work, and many will never be hired back into the auto industry. Team assemblers and assemblers/fabricators were the two auto manufacturing occupations experiencing the largest job losses, accounting for more than 57,000 dislocated workers in the three states. More than 60 percent of these workers have only a high school education—a troubling statistic.
Where will these displaced workers find jobs in tomorrow’s economy? How will they increase their training and skills in order to secure the jobs of the future? What are their alternatives? Is the green economy a viable alternative?
The project partners conducted surveys to benchmark the number of green jobs in each state and the industries they are concentrated in. While the percentage of jobs considered green differs among states, survey results show that green jobs span a wide range of industries and occupations from engineering jobs to production jobs.
The surveys found that green jobs were concentrated in manufacturing and construction, the industries most affected by the recent economic downturn. Demand for these jobs varied across the region, based on the industry mix and employers’ perceptions of green.
Employers reported that most green jobs require only on-the-job training. Considering that a large number of green jobs are in production, this finding also supports the findings of the automaker interview and survey responses. Automakers also stated that green products and production techniques will have a more profound effect on engineering and technical staff requirements than on the production and trades worker skill sets.
The green engineering and technology occupations with the greatest demand now and projected for the future tend to require expanded skill sets and more education and training. This trend in “up-skilling” of occupational requirements is true of green jobs as well as most other in-demand occupations.
Alternative Career PathwaysGiven restructuring in the auto industry, many displaced workers need help to find suitable alternative jobs. The two-step pathway cluster and skills gap analyses developed in this study offer valuable guidance to displaced workers charting pathways to new career opportunities.
The technique used to group occupations into pathway clusters is groundbreaking. Pathway clusters are organized based not upon industries or functions, but upon the similarities and differences of worker and job characteristics. Not only are occupations in a given pathway cluster considered similar to one another in terms of their knowledge and skill requirements; the pathway cluster analysis also measures the degree to which worker traits such as “highly social” or “attentive to detail” make occupations more or less similar. Job transitions within a given cluster, therefore, would be easier than moving from one cluster to another.
There are seven pathway clusters. Auto industry occupations are concentrated in the production, construction and engineering cluster, but there are dozens of green or high-wage, high-demand jobs in the same cluster that make good target occupations for each displaced worker. Except for the health, social and personal services cluster, green occupations are well distributed throughout the seven pathway clusters.
Knowing the alternative occupations that are most similar to one’s current occupation—those in the same pathway cluster—is a good first step. A worker still needs to know the relative difficulty or ease in closing the skills gap between two occupations. The uniform measure, or common denominator, to gauge the difficulty or ease of making the transition from one occupation to another is the amount of time required to prepare for a new occupation.
The skills gap is the education, training or apprenticeship time required to transition from one occupation to another. The skills gap analysis then measures the time (“trip time”) required to change from one occupation to another based on the extent
4 Driving Workforce Change: Regional Impact and Implications of Auto Industry Transformation to a Green Economy
of preparation required for the new job. While the trip time measure is not perfect, it is a great advance over many previous career pathway tools because it provides users an easily understandable measure of a worker’s skills gap.
Finally, this study produced a tri-state training program database for green and growing occupations as a resource to complement the trip time results. After a displaced worker generates a set of suitable alternative occupations, he or she can match those occupations with postsecondary educational, technical and vocational programs in the region. The skills gap and training program databases, together with all the Driving Change analysis and research results, are available on the web free of charge at www.drivingworkforcechange.org.
Workforce ImplicationsSeveral practical responses emerged from this research:
• The need for ongoing access to capital for the supplier network is critical to the stabilization of this sector.
• Emerging green and cross-functional systems approaches to design, manufacturing, equipment maintenance and building construction will demand corresponding changes in the training of workers from the design center to the shop floor.
• Strategic training for managers that emphasizes long-term planning, worker training benefits and the need to integrate complex investments could improve acceptance of the associated investment costs.
• Current differences among definitions of green jobs and inconsistent use of occupational coding systems frustrate and complicate research efforts aimed at identifying and quantifying these jobs and identifying training opportunities.
• Many of the workers displaced from the auto sector who will need to transition to alternate occupations are starting with limited education (high school or less). These workers will be especially challenged in finding acceptable replacements for their old jobs and will need support throughout that process.

5
1. Introduction
The recent national recession has altered the economic and workforce landscape for years to come. The manufacturing sector is near the
bottom of a long-term decline, displacing generations of middle class jobs, and the auto industry is one of the hardest hit.
In 2009, automotive sales were only 10.4 million units—the worst year for the market in almost 30 years. Correspondingly, U.S. production levels fell to just 5.7 million units, the lowest level since 1982. The economies of Indiana, Michigan and Ohio depend heavily on automotive and parts production, accounting for 44 percent of all U.S. production in 2009 and nearly 47 percent in 2010. As a result, the automotive crisis and broader economic recession hit these three states particularly hard.
While the U.S. transportation equipment manufacturing (TEM) industry, as measured by automotive and parts employment, declined 50.4 percent between 2000 (the most recent peak) and 2010, automotive and parts employment in Indiana, Michigan and Ohio fell by 57.8 percent. In Michigan alone, auto industry employment contracted 64.1 percent. Also, the Detroit Three (Chrysler, Ford and General Motors) have lost significant U.S. market share in the past half century. Whereas the Detroit Three’s share of the U.S. market was 65.6 percent in 2000, it had declined to 45.1 percent by 2011.1
It is highly unlikely that the losses in motor vehicle and parts employment attributable to structural changes will be mitigated in the near future. However, some employment recovery is evident
1 Automotive News Data Center, www.autonews.com. Data reflect year totals of core Detroit Three brands.
since the employment losses due to the cyclical downturn. Since the low point in June 2009, motor vehicle and parts manufacturing has added almost 50,000 jobs, reaching 577,100 in January 2011.2
It is important to remember that the automotive industry’s restructuring was well underway when the financial crisis hit in the fall of 2008. Already, many automotive manufacturing and supplier plants had been shuttered, and communities were dealing with the impact of thousands of workers who had been bought out, retired or laid off. It is fortunate that the industry’s underlying demographics meant that a large portion of the workers were able to retire rather than be laid off, as would have been the case in previous recessions. However, the crisis and the subsequent government-orchestrated bankruptcies of both General Motors and Chrysler accelerated the workforce transition, leaving the industry forever changed. For many workers, their jobs were gone, and they weren’t coming back. For talented younger workers who might have considered an automotive career, the instability of the industry has led them to look elsewhere.
The automotive industry is also facing pressures to produce greener vehicles that meet higher fuel economy and greenhouse gas emission mandates, stricter safety regulations, and consumer demand for greater safety, connectivity and entertainment. Developing, engineering and manufacturing these advanced vehicle technologies drives the transformation of the workforce and skill needs as well.
2 Bureau of Labor Statistics, “Current Employment Statistics.” Data reflect NAICS 3361 and 3363, March 2011.
Between 2000 (the most recent peak) and 2010, automotive and parts employment in Indiana, Michigan and Ohio fell by 57.8 percent.

6 Driving Workforce Change: Regional Impact and Implications of Auto Industry Transformation to a Green Economy
In some cases, it means the industry is seeking new employees with a brand new set of skills; in others, it means adding more of certain types of workers already employed by the industry; and finally, it means upgrading the skills of the incumbent workforce to handle the increased complexity of the products and processes. Educating and training the automotive workforce was made all the more difficult because many internal corporate training programs were cut back or suspended, partnerships with outside organizations and educational institutions were put on hold, and many workforce development efforts were shelved during the crisis.
The federal government has invested heavily in the resurgence of the automotive industry, and a large portion of the recent public and private automotive investments have been made in the three states of Indiana, Michigan and Ohio. The tri-state region has attracted new investments from existing employers, as well as new automotive-related industries (such as energy storage) and other new entrants to the automotive market.
New opportunities are arising in other sectors of the green economy. Investment drives innovation and ultimately results in more jobs. While the automotive industry may never return to previous employment levels, there is a future for substantial automotive and green employment in the tri-state region. Preparing a skilled green workforce for automotive and related green industries should remain a priority in this region for years to come.
1.1 This Study: Rationale and Objectives At the outset of this study, there was limited understanding of the specific nature of the transformation and skills relevant to efficient and renewable vehicle technologies and other career opportunities in the green economy. In the last two years, job losses in the TEM industry, as well as the national recession and its aftermath, have impacted Indiana, Michigan and Ohio particularly hard. This has led to an overwhelming number of mass layoffs, forcing states to seek emergency assistance from the federal government to serve dislocated workers. Approximately 70 percent of employees in
manufacturing have a high school diploma or less3 and are finding it difficult to compete for current job opportunities in high-growth and high-demand industries.
In order to more effectively serve the large numbers of dislocated auto industry workers and those at risk of losing their jobs, Michigan, Ohio and Indiana formed the Driving Change consortium to investigate this matter and provide analysis to:
• Characterize the structural transformation from the “old” auto industry to the “new” auto industry and identify new skill and training requirements
• Identify the auto parts supply chain impact of auto industry structural transformation
• Find alternative career path opportunities for dislocated auto and auto parts workers for jobs in demand, including those in the green economy
• Determine current and projected skills gaps of the auto and auto parts workforce and the required training needed to compete for jobs in demand and green job opportunities
The consortium offers its findings to those in the workforce, industry and education arenas with the anticipation of fostering ongoing collaborative efforts between these fields for the benefit of all and the economic well-being of the region.
3 American Community Survey, U.S. Census Bureau
7
2. The Auto Industry Transformation: Dimensions of Change
In the past 30 years, the motor vehicle has undergone a remarkable evolution. The personal passenger vehicle is now the most high-tech
purchase most households will ever make: today’s cars contain more computer chips and lines of software code than the first vehicles launched into space.
These days, the pace of vehicle technology change is accelerating, particularly in response to changes in consumer taste and expectations, higher safety standards, and the drive toward a low-carbon future embodied in more aggressive government fuel economy standards and more stringent greenhouse gas emissions rules. When considering changes in automotive technology that support the “greening” of automotive transportation, most people think first about advanced powertrains—including hybrids, plug-in hybrids, battery electrics, advanced internal combustion engines and advanced diesels—and secondly about alternative fuels, including renewables such as biofuels, solar and hydrogen.
Changes in materials and forming aimed at producing lighter weight and safer vehicles also contribute to a greener vehicle fleet requiring less fuel to propel. Increasing electronics, software and controls, and technology content enables many fuel-saving technologies as well, including navigation assistance to reduce idle time and traffic congestion and the many sensors, actuators and controls that are used to optimize vehicle performance for fuel economy. This section will review the advances in motor vehicle technology, provide possible timelines for implementation of the technologies, and examine the implications for the workforce needed to research, develop, engineer and manufacture these products.
While specific skill4 sets are in demand in each of the three technology areas covered in this chapter, vehicle
4 This report uses the term “skill” in several different and significant ways. Skills or skill sets can refer to a broad range of requirements for an occupation, from interpersonal competencies to hours of experience in an apprenticeship
producers and suppliers across the board have told us they want more out of their engineering workforce than technical skill and competency. The industry needs engineering and technical employees who can consider the interaction of vehicle systems and can work to optimize solutions more broadly.
This need for systems thinking, as well as the truly global nature of this industry, means that individuals who work in research, development and engineering must also possess the “soft skills” that enable cross-cultural communication, collaboration and teamwork. On the hourly side, production and skilled trades workers must adapt to an increasingly fast cadence of new product, process and technology introductions. These workers, too, must possess communication and teamwork skills that enable problem solving and continuous improvement in process and quality systems.
2.1 Powertrain and Fuels Perhaps the most noteworthy change occurring within the automotive industry is the reemergence of the electric vehicle (EV). The development of alternative forms of energy storage (primarily batteries) is rapidly progressing, but the internal combustion engine (ICE) may remain the dominant technology for the next decade and beyond. Significant technological innovations are necessary for the cost of electric vehicles to fall dramatically. Absent these innovations, the business case for EVs remains challenging. In addition, the ICE is a moving target. Respondents to a recent Center for Automotive Research (CAR) survey agreed that, even at $2.50 per gallon, half of gasoline
to advanced academic training. In this sense, the term “skills” is something of shorthand for all occupational requirements. Skill can also be used in a stricter sense as the capacity to do a particular activity, e.g., the capacity to un-jam the photocopier, irrespective of whether one is support staff or company CEO. A skill set can describe a collection of capacities that are similar and related to a particular job. An occupation may require several skill sets, in addition to educational attainment or experience, to be performed well. Unless otherwise stated, skills or skill set refers to the broad understanding of the requirements for an occupation.
8 Driving Workforce Change: Regional Impact and Implications of Auto Industry Transformation to a Green Economy
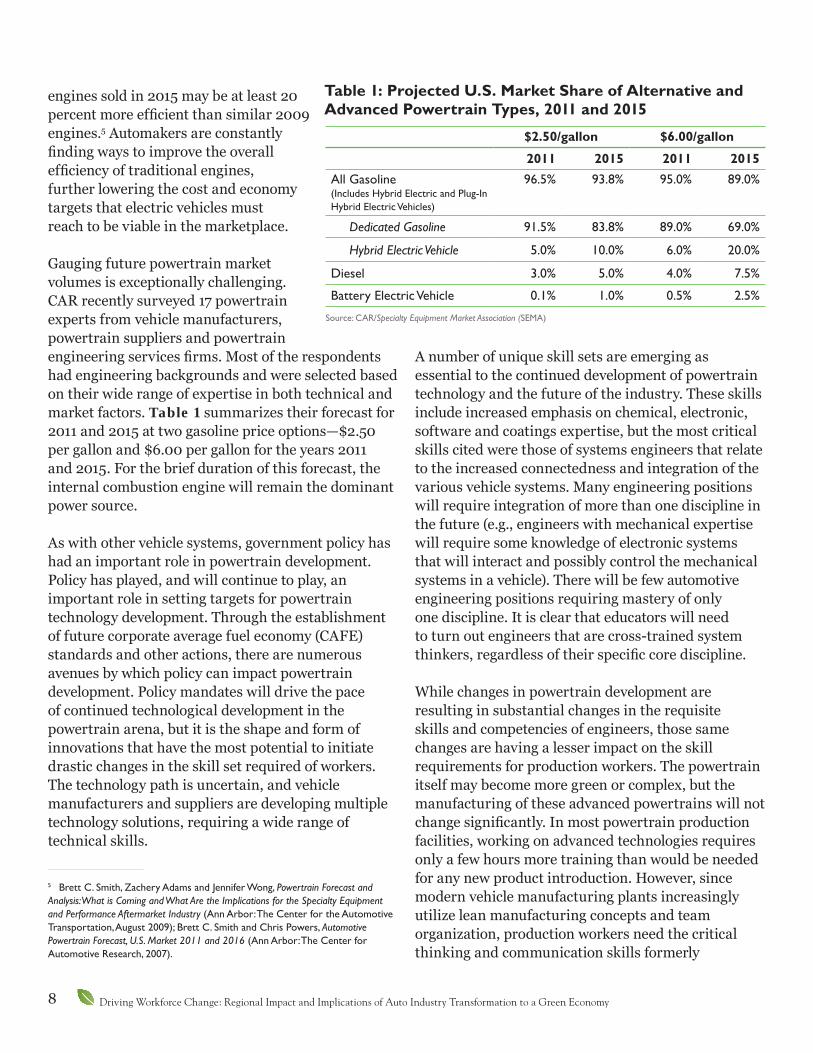
engines sold in 2015 may be at least 20 percent more efficient than similar 2009 engines.5 Automakers are constantly finding ways to improve the overall efficiency of traditional engines, further lowering the cost and economy targets that electric vehicles must reach to be viable in the marketplace.
Gauging future powertrain market volumes is exceptionally challenging. CAR recently surveyed 17 powertrain experts from vehicle manufacturers, powertrain suppliers and powertrain engineering services firms. Most of the respondents had engineering backgrounds and were selected based on their wide range of expertise in both technical and market factors. Table 1 summarizes their forecast for 2011 and 2015 at two gasoline price options—$2.50 per gallon and $6.00 per gallon for the years 2011 and 2015. For the brief duration of this forecast, the internal combustion engine will remain the dominant power source.
As with other vehicle systems, government policy has had an important role in powertrain development. Policy has played, and will continue to play, an important role in setting targets for powertrain technology development. Through the establishment of future corporate average fuel economy (CAFE) standards and other actions, there are numerous avenues by which policy can impact powertrain development. Policy mandates will drive the pace of continued technological development in the powertrain arena, but it is the shape and form of innovations that have the most potential to initiate drastic changes in the skill set required of workers. The technology path is uncertain, and vehicle manufacturers and suppliers are developing multiple technology solutions, requiring a wide range of technical skills.
5 Brett C. Smith, Zachery Adams and Jennifer Wong, Powertrain Forecast and Analysis: What is Coming and What Are the Implications for the Specialty Equipment and Performance Aftermarket Industry (Ann Arbor: The Center for the Automotive Transportation, August 2009); Brett C. Smith and Chris Powers, Automotive Powertrain Forecast, U.S. Market 2011 and 2016 (Ann Arbor: The Center for Automotive Research, 2007).
A number of unique skill sets are emerging as essential to the continued development of powertrain technology and the future of the industry. These skills include increased emphasis on chemical, electronic, software and coatings expertise, but the most critical skills cited were those of systems engineers that relate to the increased connectedness and integration of the various vehicle systems. Many engineering positions will require integration of more than one discipline in the future (e.g., engineers with mechanical expertise will require some knowledge of electronic systems that will interact and possibly control the mechanical systems in a vehicle). There will be few automotive engineering positions requiring mastery of only one discipline. It is clear that educators will need to turn out engineers that are cross-trained system thinkers, regardless of their specific core discipline.
While changes in powertrain development are resulting in substantial changes in the requisite skills and competencies of engineers, those same changes are having a lesser impact on the skill requirements for production workers. The powertrain itself may become more green or complex, but the manufacturing of these advanced powertrains will not change significantly. In most powertrain production facilities, working on advanced technologies requires only a few hours more training than would be needed for any new product introduction. However, since modern vehicle manufacturing plants increasingly utilize lean manufacturing concepts and team organization, production workers need the critical thinking and communication skills formerly
$2.50/gallon $6.00/gallon
2011 2015 2011 2015All Gasoline (Includes Hybrid Electric and Plug-In Hybrid Electric Vehicles)
96.5% 93.8% 95.0% 89.0%
Dedicated Gasoline 91.5% 83.8% 89.0% 69.0%
Hybrid Electric Vehicle 5.0% 10.0% 6.0% 20.0%
Diesel 3.0% 5.0% 4.0% 7.5%
Battery Electric Vehicle 0.1% 1.0% 0.5% 2.5%
Source: CAR/Specialty Equipment Market Association (SEMA)
Table 1: Projected U.S. Market Share of Alternative and Advanced Powertrain Types, 2011 and 2015
9
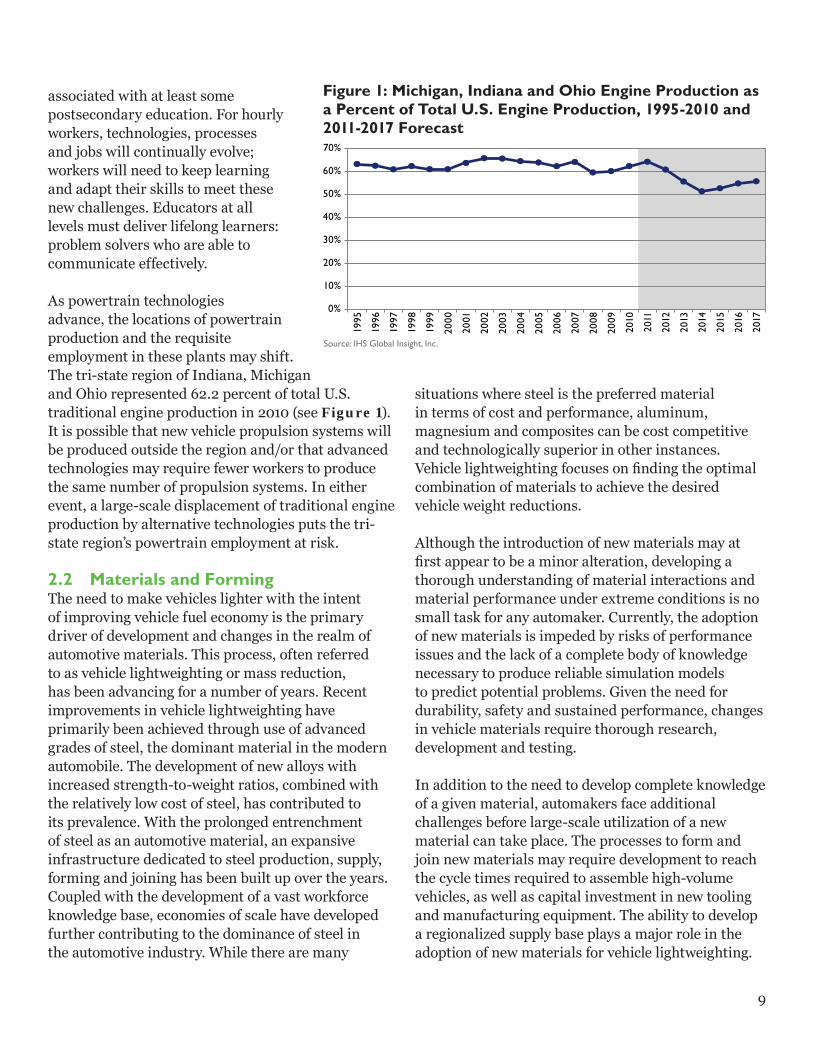
associated with at least some postsecondary education. For hourly workers, technologies, processes and jobs will continually evolve; workers will need to keep learning and adapt their skills to meet these new challenges. Educators at all levels must deliver lifelong learners: problem solvers who are able to communicate effectively.
As powertrain technologies advance, the locations of powertrain production and the requisite employment in these plants may shift. The tri-state region of Indiana, Michigan and Ohio represented 62.2 percent of total U.S. traditional engine production in 2010 (see Figure 1). It is possible that new vehicle propulsion systems will be produced outside the region and/or that advanced technologies may require fewer workers to produce the same number of propulsion systems. In either event, a large-scale displacement of traditional engine production by alternative technologies puts the tri-state region’s powertrain employment at risk.
2.2 Materials and FormingThe need to make vehicles lighter with the intent of improving vehicle fuel economy is the primary driver of development and changes in the realm of automotive materials. This process, often referred to as vehicle lightweighting or mass reduction, has been advancing for a number of years. Recent improvements in vehicle lightweighting have primarily been achieved through use of advanced grades of steel, the dominant material in the modern automobile. The development of new alloys with increased strength-to-weight ratios, combined with the relatively low cost of steel, has contributed to its prevalence. With the prolonged entrenchment of steel as an automotive material, an expansive infrastructure dedicated to steel production, supply, forming and joining has been built up over the years. Coupled with the development of a vast workforce knowledge base, economies of scale have developed further contributing to the dominance of steel in the automotive industry. While there are many
situations where steel is the preferred material in terms of cost and performance, aluminum, magnesium and composites can be cost competitive and technologically superior in other instances. Vehicle lightweighting focuses on finding the optimal combination of materials to achieve the desired vehicle weight reductions.
Although the introduction of new materials may at first appear to be a minor alteration, developing a thorough understanding of material interactions and material performance under extreme conditions is no small task for any automaker. Currently, the adoption of new materials is impeded by risks of performance issues and the lack of a complete body of knowledge necessary to produce reliable simulation models to predict potential problems. Given the need for durability, safety and sustained performance, changes in vehicle materials require thorough research, development and testing.
In addition to the need to develop complete knowledge of a given material, automakers face additional challenges before large-scale utilization of a new material can take place. The processes to form and join new materials may require development to reach the cycle times required to assemble high-volume vehicles, as well as capital investment in new tooling and manufacturing equipment. The ability to develop a regionalized supply base plays a major role in the adoption of new materials for vehicle lightweighting.
0%
10%
20%
30%
40%
50%
60%
70%
1995
1996
1997
1998
1999
2000
2001
2002
2003
2004
2005
2006
2007
2008
2009
2010
2011
2012
2013
2014
2015
2016
2017
Figure 1: Michigan, Indiana and Ohio Engine Production as a Percent of Total U.S. Engine Production, 1995-2010 and 2011-2017 Forecast
Source: IHS Global Insight, Inc.
10 Driving Workforce Change: Regional Impact and Implications of Auto Industry Transformation to a Green Economy
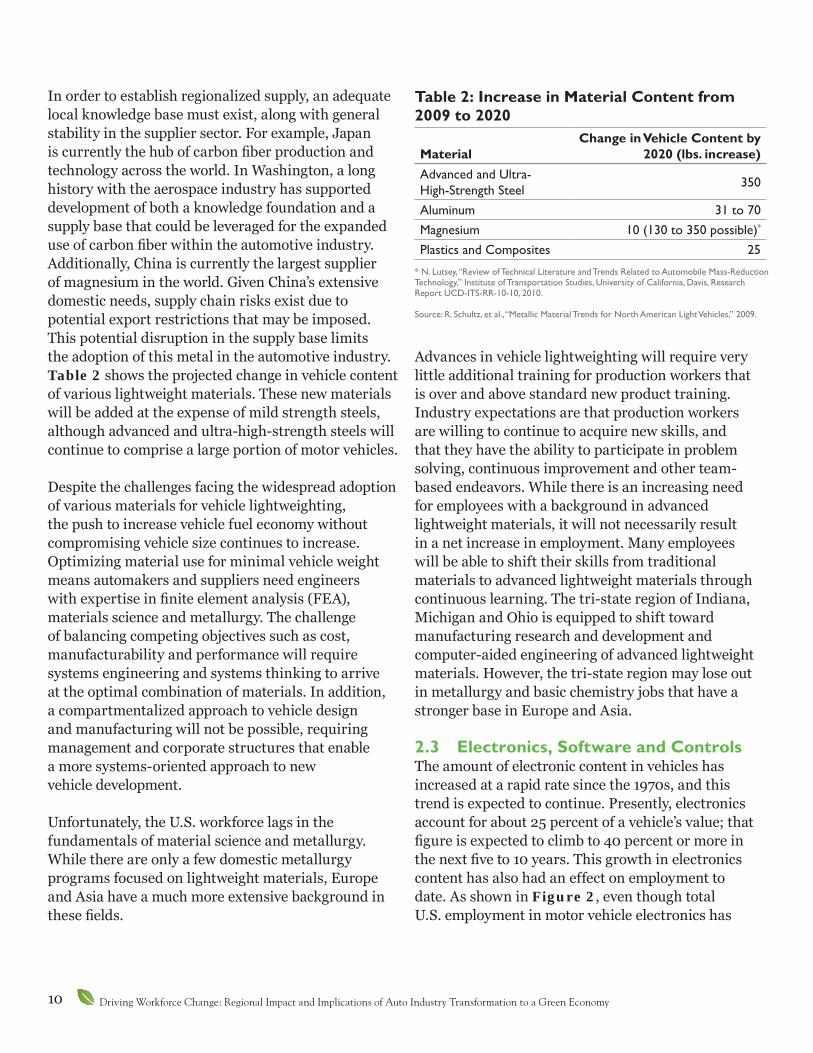
In order to establish regionalized supply, an adequate local knowledge base must exist, along with general stability in the supplier sector. For example, Japan is currently the hub of carbon fiber production and technology across the world. In Washington, a long history with the aerospace industry has supported development of both a knowledge foundation and a supply base that could be leveraged for the expanded use of carbon fiber within the automotive industry. Additionally, China is currently the largest supplier of magnesium in the world. Given China’s extensive domestic needs, supply chain risks exist due to potential export restrictions that may be imposed. This potential disruption in the supply base limits the adoption of this metal in the automotive industry. Table 2 shows the projected change in vehicle content of various lightweight materials. These new materials will be added at the expense of mild strength steels, although advanced and ultra-high-strength steels will continue to comprise a large portion of motor vehicles.
Despite the challenges facing the widespread adoption of various materials for vehicle lightweighting, the push to increase vehicle fuel economy without compromising vehicle size continues to increase. Optimizing material use for minimal vehicle weight means automakers and suppliers need engineers with expertise in finite element analysis (FEA), materials science and metallurgy. The challenge of balancing competing objectives such as cost, manufacturability and performance will require systems engineering and systems thinking to arrive at the optimal combination of materials. In addition, a compartmentalized approach to vehicle design and manufacturing will not be possible, requiring management and corporate structures that enable a more systems-oriented approach to new vehicle development.
Unfortunately, the U.S. workforce lags in the fundamentals of material science and metallurgy. While there are only a few domestic metallurgy programs focused on lightweight materials, Europe and Asia have a much more extensive background in these fields.
Advances in vehicle lightweighting will require very little additional training for production workers that is over and above standard new product training. Industry expectations are that production workers are willing to continue to acquire new skills, and that they have the ability to participate in problem solving, continuous improvement and other team-based endeavors. While there is an increasing need for employees with a background in advanced lightweight materials, it will not necessarily result in a net increase in employment. Many employees will be able to shift their skills from traditional materials to advanced lightweight materials through continuous learning. The tri-state region of Indiana, Michigan and Ohio is equipped to shift toward manufacturing research and development and computer-aided engineering of advanced lightweight materials. However, the tri-state region may lose out in metallurgy and basic chemistry jobs that have a stronger base in Europe and Asia.
2.3 Electronics, Software and ControlsThe amount of electronic content in vehicles has increased at a rapid rate since the 1970s, and this trend is expected to continue. Presently, electronics account for about 25 percent of a vehicle’s value; that figure is expected to climb to 40 percent or more in the next five to 10 years. This growth in electronics content has also had an effect on employment to date. As shown in Figure 2, even though total U.S. employment in motor vehicle electronics has
MaterialChange in Vehicle Content by
2020 (lbs. increase)Advanced and Ultra- High-Strength Steel 350
Aluminum 31 to 70Magnesium 10 (130 to 350 possible)*
Plastics and Composites 25
* N. Lutsey, “Review of Technical Literature and Trends Related to Automobile Mass-Reduction Technology,” Institute of Transportation Studies, University of California, Davis, Research Report UCD-ITS-RR-10-10, 2010. Source: R. Schultz, et al., “Metallic Material Trends for North American Light Vehicles,” 2009.
Table 2: Increase in Material Content from 2009 to 2020

11
declined since 2005, U.S. motor vehicle electronics employment as a percentage of total U.S. motor vehicle employment has shown a net upward trend since 2002.
Electronics are a part of nearly every major vehicle system, including those that are mechanical in nature; electronic content is particularly critical for sensors and actuators, powertrain and transmission controls (especially as electric drive systems become more prevalent), vehicle safety systems, infotainment systems and vehicle communications, as well as the overall vehicle electrical architecture. Through power electronics, smart sensors, electronic control units (ECUs) and other components, vehicle electronics contribute significantly to a vehicle’s improved fuel economy and reduced emissions. In addition, emerging electronic systems, such as those associated with connected vehicle systems (vehicle-to-vehicle and/or vehicle-to-infrastructure wireless communication), enable drivers to navigate more efficiently and avoid traffic congestion. They also take advantage of enhanced situational awareness to provide drivers with feedback on how to optimize
green driving or directly control operation of the powertrain to achieve a similar outcome. All these developments can contribute significantly to the improved environmental performance of motor vehicle transportation.
Electronic content is increasing in response to the technical demands of increasingly complex vehicle systems, as well as consumer demand for a more personalized driving experience and the ability to access information and entertainment options instantaneously. The integration of electronic systems will be required to support more on-board applications, and the vehicle’s electronic architecture must be consolidated due to increasing electronic content and faster data transmission. Because ECUs are expensive, vehicle manufacturers will integrate them across functional systems and incorporate more powerful, dual-core processors into the vehicle’s electronic architecture. The industry will face increasing demands for ensuring the cyber-physical security of the vehicle. Needs will increase for electronic system validation and certification, as well as analysis of interactions between systems.
Figure 2: U.S. Motor Vehicle Electronics Employment, 2002-2009
Source: Bureau of Labor Statistics
0%
1%
2%
3%
4%
5%
6%
7%
8%
0
10,000
20,000
30,000
40,000
50,000
60,000
70,000
80,000
2002 2003 2004 2005 2006 2007 2008 2009
Total U.S. Electronic Motor Vehicle Jobs (left axis)
Percent of U.S. Motor Vehicle Jobs in Electronics (right axis)
12 Driving Workforce Change: Regional Impact and Implications of Auto Industry Transformation to a Green Economy
Components such as the CAN bus (and FlexRay) will facilitate this interaction and communication between vehicle systems.6 The “head unit” of a vehicle, which houses the radio, music, temperature controls, navigation and other systems, will be increasingly significant as more technological functionality is added (e.g., the ability to interface with third-party consumer electronics, such as smart phones). The vehicle aftermarket will play an important role in making communications available on existing vehicles and expanding the range and capability of electronic technologies available to consumers.
To support growth in vehicle electronics, software and controls, the industry will demand more electrical and electronic engineers, as well as those with expertise in radio frequency technology, computer science, software engineering and cyber security. As electronic technologies become more integrated, employers will also require candidates trained in a systems approach to the integration of these electronics throughout the vehicle. The workforce will need to understand the whole system, not just individual, autonomous pieces of the system. Although increased demand for employees with these skills may require a major transformation of automotive industry skill sets, the end result may not be a net increase in motor
6 CAN bus stands for Controller Area Network. This network consists of multiple micro-controllers that communicate with each other to direct electronic actions within the vehicle. The “bus” refers to the wire or cable platform through which the micro-controllers transfer information. FlexRay is a newer and more robust version of CAN.
vehicle employment. The tri-state region of Indiana, Michigan and Ohio is poised to benefit from the research and development, design, engineering and systems integration side of the business, but will face stiff competition from other regions of the global automotive industry that are stronger in electronics manufacturing (particularly producers in Europe and Asia).
Driven by the opportunity to create a more environmentally friendly product, the automotive industry is undergoing a far-reaching change. While the pace and completeness of the change is uncertain, it is clear the change will impact job skill requirements. It is also apparent the tri-state region has an opportunity to take advantage of this changing vehicle landscape. Whether it can reap the benefits of the change in many ways depends upon creating a well-trained and effective green workforce. This report has identified technologies, skills and the associated opportunities to help the region’s workforce trainers proactively prepare.
To support growth in vehicle electronics, software and controls, the industry will demand more electrical and electronic engineers, as well as those with expertise in radio frequency technology, computer science, software engineering and cyber security.

13
3. Employer Responses to Auto Industry Changes
As discussed in the previous chapter, the automotive industry has been impacted by the introduction of green technology in its
vehicles, production equipment and facilities. The recent economic crisis has also had a significant financial impact on the industry—driving two major domestic automakers and a large number of automotive suppliers into bankruptcy. Many suppliers did not survive the crisis, and all remaining automakers and suppliers are facing critical financial and capacity constraints. In addition, the automotive industry faces an uncertain future with regard to government fuel economy, emissions and safety standards, and the level of consumer demand for green vehicles.
Despite the financial constraints and market and regulatory uncertainty, automakers and suppliers are investing in greener products, processes and equipment. Automaker announcements made in 2010, and thus far in 2011, total $4.3 billion in green investments in Indiana, Michigan and Ohio alone (see Table 3). Suppliers are investing in green research, technologies and products, as well.
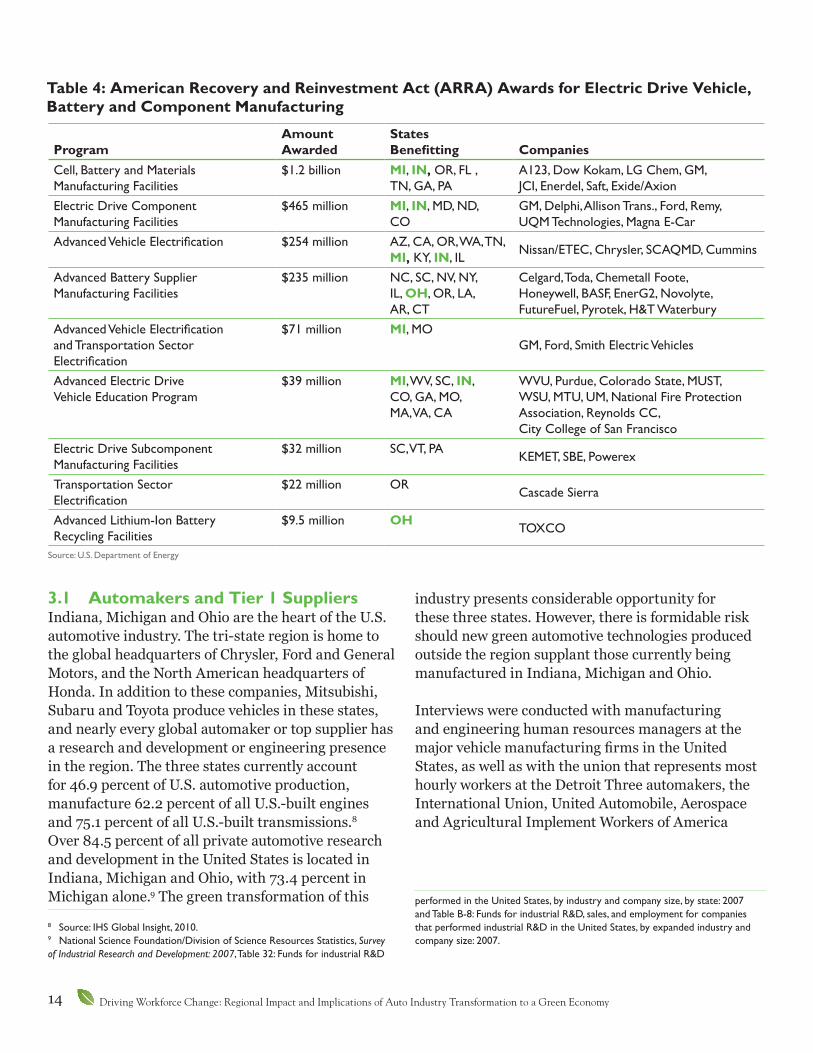
The federal government is backing green investments in the tri-state region’s automotive industry. Over $8.4 billion of the $25 billion available to automakers through the Department of Energy’s Advanced Technology Vehicles Manufacturing Loan Program (Section 136) has been awarded (see Table 4). Ford will invest a share of its $5.9 billion in funds from this program in Michigan, Ohio and three other states, to produce more fuel efficient vehicles. Of the more than $2.3 billion in American Recovery and Reinvestment Act (ARRA) awards to automakers and suppliers for electric drive vehicle, battery, and component manufacturing, approximately $1.4 billion went to companies and facilities in Indiana, Michigan and Ohio.7
Investment is an important leading indicator for hiring. Spending on research and development and new products drives increased engineering and technical employment; investment in plants and equipment leads to hiring additional hourly and skilled trades workers throughout the region.
7 U.S. Department of Energy, http://www.energy.gov/recovery/data.htm.
CompanyIndiana
(in millions)Michigan (in millions)
Ohio (in millions)
Tri-State Total (in millions)
Bright $11.0 $11.0Chrysler $1,271.3 $302.0 $1,573.3Ford $1,183.5 $420.0 $1,603.5General Motors $111.0 $613.2 $186.2 $910.4Honda $70.0 $70.0Subaru (SIA Toyota) $81.0 $81.0Think $43.5 $43.5Total $1,506.8 $2,109.7 $676.2 $4,292.7
Table 3: Green Automaker Investment in Indiana, Michigan and Ohio, By Company and By State, 2010-2011 Announcements
Note: More detail is available in Appendix B. Source: Center for Automotive Research
14 Driving Workforce Change: Regional Impact and Implications of Auto Industry Transformation to a Green Economy
3.1 Automakers and Tier 1 SuppliersIndiana, Michigan and Ohio are the heart of the U.S. automotive industry. The tri-state region is home to the global headquarters of Chrysler, Ford and General Motors, and the North American headquarters of Honda. In addition to these companies, Mitsubishi, Subaru and Toyota produce vehicles in these states, and nearly every global automaker or top supplier has a research and development or engineering presence in the region. The three states currently account for 46.9 percent of U.S. automotive production, manufacture 62.2 percent of all U.S.-built engines and 75.1 percent of all U.S.-built transmissions.8 Over 84.5 percent of all private automotive research and development in the United States is located in Indiana, Michigan and Ohio, with 73.4 percent in Michigan alone.9 The green transformation of this
8 Source: IHS Global Insight, 2010.9 National Science Foundation/Division of Science Resources Statistics, Survey of Industrial Research and Development: 2007, Table 32: Funds for industrial R&D
industry presents considerable opportunity for these three states. However, there is formidable risk should new green automotive technologies produced outside the region supplant those currently being manufactured in Indiana, Michigan and Ohio.
Interviews were conducted with manufacturing and engineering human resources managers at the major vehicle manufacturing firms in the United States, as well as with the union that represents most hourly workers at the Detroit Three automakers, the International Union, United Automobile, Aerospace and Agricultural Implement Workers of America
performed in the United States, by industry and company size, by state: 2007 and Table B-8: Funds for industrial R&D, sales, and employment for companies that performed industrial R&D in the United States, by expanded industry and company size: 2007.
ProgramAmount Awarded
States Benefitting Companies
Cell, Battery and Materials Manufacturing Facilities
$1.2 billion MI, IN, OR, FL , TN, GA, PA
A123, Dow Kokam, LG Chem, GM, JCI, Enerdel, Saft, Exide/Axion
Electric Drive Component Manufacturing Facilities
$465 million MI, IN, MD, ND, CO
GM, Delphi, Allison Trans., Ford, Remy, UQM Technologies, Magna E-Car
Advanced Vehicle Electrification $254 million AZ, CA, OR, WA, TN, MI, KY, IN, IL Nissan/ETEC, Chrysler, SCAQMD, Cummins
Advanced Battery Supplier Manufacturing Facilities
$235 million NC, SC, NV, NY, IL, OH, OR, LA, AR, CT
Celgard, Toda, Chemetall Foote, Honeywell, BASF, EnerG2, Novolyte, FutureFuel, Pyrotek, H&T Waterbury
Advanced Vehicle Electrification and Transportation Sector Electrification
$71 million MI, MOGM, Ford, Smith Electric Vehicles
Advanced Electric Drive Vehicle Education Program
$39 million MI, WV, SC, IN, CO, GA, MO, MA, VA, CA
WVU, Purdue, Colorado State, MUST, WSU, MTU, UM, National Fire Protection Association, Reynolds CC, City College of San Francisco
Electric Drive Subcomponent Manufacturing Facilities
$32 million SC, VT, PA KEMET, SBE, Powerex
Transportation Sector Electrification
$22 million OR Cascade Sierra
Advanced Lithium-Ion Battery Recycling Facilities
$9.5 million OH TOXCO
Table 4: American Recovery and Reinvestment Act (ARRA) Awards for Electric Drive Vehicle, Battery and Component Manufacturing
Source: U.S. Department of Energy
15
(UAW). The UAW considers the issue of green jobs critical and is working to make sure any new content related to greening the vehicle takes place in the United States.
While the drive to improve fuel economy is not new, government standards that must be met and the speed of change have changed significantly in recent years. For the production workforce, green jobs are those that are tied to making green products. Automakers indicate that trends in greening the products and processes of producing parts and components are having a much more profound impact on engineering
and technical staff than on production and trades workers.
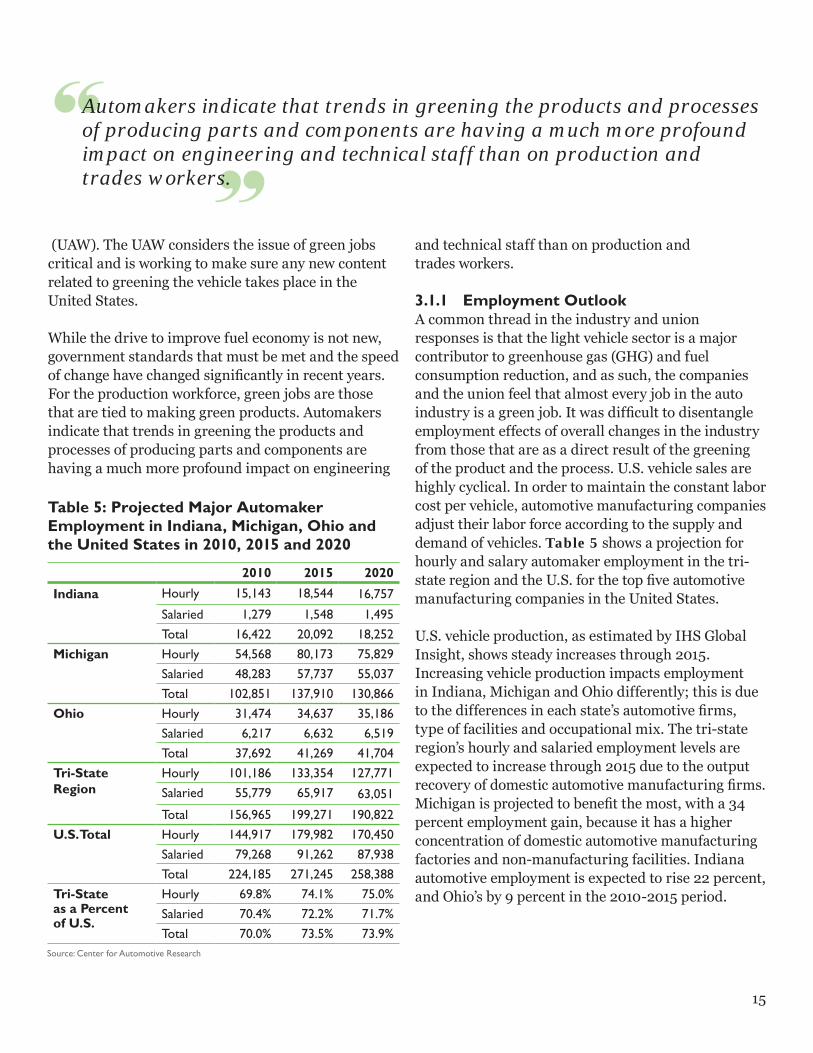
3.1.1 Employment OutlookA common thread in the industry and union responses is that the light vehicle sector is a major contributor to greenhouse gas (GHG) and fuel consumption reduction, and as such, the companies and the union feel that almost every job in the auto industry is a green job. It was difficult to disentangle employment effects of overall changes in the industry from those that are as a direct result of the greening of the product and the process. U.S. vehicle sales are highly cyclical. In order to maintain the constant labor cost per vehicle, automotive manufacturing companies adjust their labor force according to the supply and demand of vehicles. Table 5 shows a projection for hourly and salary automaker employment in the tri-state region and the U.S. for the top five automotive manufacturing companies in the United States.
U.S. vehicle production, as estimated by IHS Global Insight, shows steady increases through 2015. Increasing vehicle production impacts employment in Indiana, Michigan and Ohio differently; this is due to the differences in each state’s automotive firms, type of facilities and occupational mix. The tri-state region’s hourly and salaried employment levels are expected to increase through 2015 due to the output recovery of domestic automotive manufacturing firms. Michigan is projected to benefit the most, with a 34 percent employment gain, because it has a higher concentration of domestic automotive manufacturing factories and non-manufacturing facilities. Indiana automotive employment is expected to rise 22 percent, and Ohio’s by 9 percent in the 2010-2015 period.
Table 5: Projected Major Automaker Employment in Indiana, Michigan, Ohio and the United States in 2010, 2015 and 2020
Source: Center for Automotive Research
2010 2015 2020
Indiana Hourly 15,143 18,544 16,757
Salaried 1,279 1,548 1,495 Total 16,422 20,092 18,252
Michigan Hourly 54,568 80,173 75,829Salaried 48,283 57,737 55,037Total 102,851 137,910 130,866
Ohio Hourly 31,474 34,637 35,186 Salaried 6,217 6,632 6,519 Total 37,692 41,269 41,704
Tri-State Region
Hourly 101,186 133,354 127,771 Salaried 55,779 65,917 63,051
Total 156,965 199,271 190,822 U.S. Total Hourly 144,917 179,982 170,450
Salaried 79,268 91,262 87,938Total 224,185 271,245 258,388
Tri-State as a Percent of U.S.
Hourly 69.8% 74.1% 75.0%Salaried 70.4% 72.2% 71.7%Total 70.0% 73.5% 73.9%
Automakers indicate that trends in greening the products and processes of producing parts and components are having a much more profound impact on engineering and technical staff than on production and trades workers.
16 Driving Workforce Change: Regional Impact and Implications of Auto Industry Transformation to a Green Economy
Between 2015 and 2020, overall U.S. automotive employment is expected to decrease by about 5 percent. Indiana and Michigan are expected to mirror the national trend with employment declines in this period. Indiana’s 10 percent employment decline is related to expected production cutbacks at two of the state’s automakers; while Michigan’s 5 percent employment reduction is closely tied to cuts in the domestic manufacturers’ overall output levels. During this same period, Ohio employment is expected to increase slightly (by 1 percent) due to firm mix and the forecast for products that are expected to be allocated to Ohio’s automotive manufacturing facilities.
3.1.2 The Greening of the Automotive and Tier 1 Supplier Production and Trades WorkforceRespondents reported that while there is a perception of green impact on workforce skills, the changes for individual production employees are not revolutionary. For skilled trades workers, the changes are greater; these changes may require different skills to maintain LEED-certified manufacturing facilities, as well as more complex manufacturing equipment. No automaker or supplier tracks production or skilled trades training by any green category.
Respondents indicated most training for production workers that could be considered green is actually part of new product training. They report that a change under the hood impacts only a few processes on the assembly line. In some areas, such as machining fuel injection parts for diesel engines or building hybrid transmissions, the tolerances may be tighter or there might be more content, but the work itself is essentially the same. The most common green training for production workers involves recycling and proper use of products (primarily those required
for cleaning or lubricating). Green practices, such as recycling scrap, are prevalent throughout the industry. Automakers and suppliers seek production workers who can contribute to the company’s overall continuous improvement efforts. Many times, these efforts produce greener outcomes; for example, a company might see lower energy usage from turning off equipment when not in use. Respondents reported that workers involved in hybrid or electric vehicle production do undergo additional safety training having to do with working in a high-voltage environment; this training, on average, takes less than a day.
There are two exceptions that may require new production and skilled trades worker skills and training: the introduction of new lightweight materials and battery manufacturing. Lightweight materials require new ways of forming and joining parts; lightweighting is a developing area, and the training impact for the workforce has not yet been fully realized.
Battery manufacturing, while it is new to the auto industry, is not a new industry. Workers in these plants must have a basic knowledge of how to work in a process environment, versus a discrete parts production environment. The training for workers in these plants is more geared toward operating equipment than manual assembly. Production and skilled trades workers in these firms generally undergo a longer period of initial training, including more intensive health and safety curriculum, an understanding of basic chemistry concepts, and instruction in clean room procedures required in these environments.
There are two exceptions that may require new production and skilled trades worker skills and training: the introduction of new lightweight materials and battery manufacturing.

17
For the skilled trades workforce, the changes are greater. Maintaining LEED-certified buildings, green plant and equipment—such as rainwater collection or solar panels—and more complex manufacturing equipment does require additional skills and training. Newer manufacturing plants are being built with environmental design, energy and water conservation in mind. Environmental and sustainability goals impact the skilled trades workforce; most automakers offer training in hazardous materials and waste, waste water, and power plant maintenance. Increasingly, new equipment purchases are moving toward electrical and electronic machines (rather than hydraulic) and that is changing the mix of skilled trades workers required.
3.1.3 Up-Skilling of Incumbent WorkersAs discussed in the previous section, respondents report that much of the green training curriculum for hourly workers is centered on technology changes in the product and is categorized as product training rather than up-skilling.10 Respondents reported that hourly worker training consists of the mandatory subjects—such as health and safety, equal employment opportunity, or quality—as well as problem solving, continuous improvement and teamwork. For skilled trades and maintenance personnel, incumbent worker training focuses on cross-training for higher trades utilization (percent of time spent working). At the Detroit Three automakers, the primary driver of cross-skilling and additional training for skilled trades workers is the reduction in the number of skilled trades classifications. Respondents related that
10 As stated earlier, this report uses the term skill and skills in several different and significant ways. Skills or skill sets can refer to a broad range of requirements for an occupation, from interpersonal competencies to hours of experience in an apprenticeship to advanced academic training. “Up-skilling” uses the term skills in this broad sense. Up-skilling is a term that employers were comfortable with and used frequently in interviews to describe any type of skill set enhancement or improvement, from on-the-job training to academic certification, for all classes of occupations.
the most effective training results in workers putting their new skills to work on the job immediately.
Several automaker respondents commented on the lack of available funding for incumbent worker training. For companies, the majority of the cost of training is the wages paid to workers while they are in training. There are few government programs that pay a wage subsidy for incumbent worker training.
3.1.4 Job Classification Impact of Green InitiativesNo automaker reported any changes in occupations or job classifications of production or skilled trades workers related to greening the product or process. The mix of skilled trades classifications may change as more electrical and electronic equipment is employed and as more focus is placed on the environmental aspects of managing water and waste streams.
3.1.5 The Greening of the Automotive Engineering and Technical WorkforceThe automakers reported that engineering and technical workforce skills will change the most as a result of the greening of the product and manufacturing processes. There are wholly new green areas, such as hybrid powertrain engineering, requiring both new skills and more workers. There are other areas (e.g., controlling tailpipe emissions) where the automakers indicated that although the standard has changed, more people or a different set of skills are not necessarily required. Some areas of vehicle engineering and design, such as noise, vibration and harshness (NVH), have a different focus when a large V-6 or V-8 engine is replaced by an electric motor, but the fundamental skill base and demand for workers in this area will remain the same. Respondents reported the following categories where engineering and technical workers are in demand as a result of greening the product and process:
Maintaining LEED-certified buildings, green plant and equipment—such as rainwater collection or solar panels—and more complex manufacturing equipment does require additional skills.
18 Driving Workforce Change: Regional Impact and Implications of Auto Industry Transformation to a Green Economy
• Increasing electrification of the vehicle drives the industry’s need to hire more electrical engineers.
• Since electric and hybrid variants use electric motors to power the vehicle, powertrain engineers with related experience are in great demand.
• The expanded use of batteries in alternative powertrain vehicles and resins in vehicle body, parts and components has greatly increased the need for chemical and electrochemical engineers.
• Lightweighting the vehicle and the design of raw materials that are robust and meet required vehicle specifications—as well as the development of new forming and joining processes to implement a wider variety of vehicle materials—drives the need for materials engineers.
• Advanced powertrains—whether internal combustion, hybrid or electric—all rely heavily on computer controls and software. Electronics and software also enable green transportation through optimum route scheduling and congestion avoidance. Respondents indicated strong demand for software and electronics engineers, as well as those with experience integrating a vehicle’s electronics with its mechanical components.
• Mechanical engineers will continue to be needed, but the mix will shift as the vehicle becomes less mechanical. Respondents reported a need for workers with cross-functional skills, such as mechatronic engineers.
• Increasing vehicle complexity has meant that the various systems of the vehicle (such as steering, braking, powertrain, etc.) must not only function within each system, but also when systems interact; this complexity is driving the rising need for systems engineers.
• Greener products, processes and manufacturing plants increase the need for environmental engineers to design, implement, and maintain energy conservation, water systems, waste systems, paint systems, cleaning systems, heating/cooling systems and alternative building power systems.
Despite the industry’s move toward greener products and processes, respondents don’t foresee hiring sustainability engineers. Rather, they would prefer to hire engineers who have integrated sustainability practices into a core engineering discipline. The automakers and upper-tier suppliers also expect that all engineering and technical new hires will have some form of practical experience, either through work at another employer, a co-op or an internship. The automakers and upper-tier suppliers prefer to hire candidates with five to 10 years of industry experience for most positions and seek seasoned candidates for leadership or specific technical jobs.
3.1.6 Up-Skilling of Incumbent WorkersIncumbent worker training related to green ranges from 10 to 30 percent of the automakers’ annual training offerings to engineering and technical workers. Most automotive supplier respondents offer a curriculum of internal corporate training and tuition reimbursement to incumbent engineering and technical workers. Few offer specific up-skilling opportunities in green skills, however.
Respondents stated that they seek to hire engineering and technical employees who are open to lifelong learning. All of the automakers and Tier 1 suppliers have a formal review process for salaried employees’ skill assessment.
Several automakers indicated that they continued investing in skill upgrades throughout the downturn in the industry (but this was not reflected in interviews with the auto suppliers). While some companies froze their tuition assistance programs in 2008-2009, all are now back in operation; education and training partnerships with outside institutions are also being restarted.
19
Respondents noted that many of the skills necessary for building green vehicles using green processes should not require a full-blown degree program. In a technically mature workforce, most incumbent engineering and technical workers have a degree; many have graduate degrees. Companies are looking toward certificate programs to help these engineering and technical workers gain the skills they need.
All of the automakers have some form of connection or partnership with one or more of the recipients of the Department of Energy grants for electric drive vehicle, battery and component manufacturing education.
3.1.7 Job Classification Impact of Green Initiatives The automakers and Tier 1 suppliers indicated that job classifications are not changing much. The duties associated with existing job classifications are changing, as is the mix of job classifications as different areas of engineering become more dominant.
3.1.8 Up-Skilling of Other Automotive-Related WorkersIn the course of the automaker interviews, nearly every automotive respondent mentioned how the changes in vehicle technology impact the skills of workers outside the auto manufacturing industry. Advances in green vehicle technology is expected to impact:
• Dealer service personnel, who must learn how to maintain, diagnose and service the new vehicles and technologies.
• Dealer sales staff, who must learn how to sell based on the return-on-investment and
field customer questions on charging stations, range anxiety and other issues related to electric vehicles.
• Public safety, medical and first responders, who must know how to safely interact with these vehicles and their passengers in emergency situations.
• Electricians, home inspectors and construction workers, who must install and certify installations of home charging units for plug-in electric vehicles.
Respondents also noted that their companies all have partnerships with municipalities, utility companies and others to plan for infrastructure investments and other aspects of the future of green transportation.
3.1.9 Analysis of Lower-Tier Supplier ViabilityThis analysis provides an assessment of the automotive supplier sector’s current state, highlights viability risks in the near future and suggests changes that can avert a possible crisis among lower-tier suppliers.
The Challenge to Ramp Up ProductionAutomotive sales and production have not recovered from the recent economic crisis as quickly as many analysts had forecast. While this was a concern throughout the industry, it appears in retrospect that it may have been a blessing in disguise for lower-tier suppliers. The gradual recovery has allowed these firms to resume production and add capacity at a pace that did not overwhelm their reduced resources—particularly the availability of financial capital.
Since lower-tier suppliers struggled to serve the 11.6 million unit market of 2010, there is significant concern about their ability to add capacity fast enough to meet market demands (that may reach 15 million units) in 2011.
20 Driving Workforce Change: Regional Impact and Implications of Auto Industry Transformation to a Green Economy
Automotive sales and production have recently experienced significant growth, and many observers have begun sharply increasing their forecasts. Initially around 13 million units, forecasts for 2011 U.S. light vehicle sales have been revised to levels as high as 15 million units. Since lower-tier suppliers struggled to serve the 11.6 million unit market of 2010, there is significant concern about their ability to add capacity fast enough to meet market demands (that may reach 15 million units) in 2011.
Evidence of Stress among Lower-Tier SuppliersAutomakers have suffered a rash of production interruptions due to a lack of supply from lower-tier suppliers. Fears of further production disruptions have been widespread; automakers and Tier 1 suppliers have announced initiatives to prevent these shortages, including financial support for troubled lower-tier suppliers.
Another critical indicator that lower-tier suppliers are straining to meet current production volume demands is a reported gradual increase in quality problems. Given the demanding service environment of automotive components and the potential for increased recall and warranty costs, this development may be cause for concern.
Interviewees are also worried that with this strain, their capacity to perform product development, employ more sophisticated production techniques, and achieve the continuous quality and productivity improvements called for in the industry may be compromised.
Risk to Automotive Suppliers That Are “On the Bubble”Interviewees indicated that the healthiest of lower-tier suppliers are overwhelmingly likely to survive and be successful in the future. They are expected to continue to receive both orders from customers and the credit necessary to add capacity for new orders. There is concern, however, that firms considered to be “on the bubble” financially—those who are close to financial health, but considered less desirable as suppliers or as loan opportunities for lending institutions—may be at significant risk. These firms have more trouble accessing credit and face the risk that their clients
may move work away from them toward healthier firms. If many Tier 1 suppliers make similar sourcing decisions, their actions (ironically meant to stabilize their supply chains by purchasing from more viable suppliers) could collectively threaten a large portion of the supply chain and risk significant supply chain disruptions.
3.1.10 Responses to Supply Chain VulnerabilityInterviewees indicated that their firms are aware of the issues described above, and they are taking steps to minimize supply chain disruptions and to assist lower-tier suppliers.
One major change involves addressing the complete set of factors affecting cost and profit margin (including quality, logistics costs, warranty expenses, as well as the initial cost of components) instead of focusing only on piece price considerations. While such sentiments have been heard throughout the industry in the past, interviewees stated that, due to new urgency from the recent economic crisis, this change is being taken much more seriously today. Interviewees in some (but not all) firms said, for example, that purchasing staffs are increasingly evaluated and compensated based on total landed cost and warranty implications.
They also indicated that, in order to ensure decisions are made based on a broad set of considerations, purchasing teams often include more engineering and quality assurance staff than in the past.
3.2 Supply Chain Transformation among Small FirmsLike the rest of the automotive industry, the supply chain had already undergone significant transformation before the onset of the recent crisis. The crisis both accelerated the transformation and
The healthiest of lower-tier suppliers are overwhelmingly likely to survive and be successful in the future.

21
gave it new dimensions. Below, we describe how the crisis has affected employment, investment and supplier-customer relations. We then explain three distinct clusters of firm practices that have emerged in the wake of the crisis.
The goal of our analysis is to examine overall firm strategy in a way that generates useful workforce development recommendations. Our findings indicate that workforce development is only highly effective as part of a comprehensive firm strategy that includes complementary strategies for product and process. Our study encountered some firms that made investments in either skills or technology, but were not able to maximize the profitability of such investments for lack of a comprehensive strategy. Other firms did not invest much in any of these areas, keeping their costs down in the short run, but perhaps jeopardizing their viability (and the jobs and compensation of their employees) in the long run.
To produce the findings below, our team first interviewed dozens of first-, second- and third-tier suppliers in the tri-state area and the Southeast. Using a survey crafted from these interviews, we then collected data from hundreds more firms nationwide.11 Below, we discuss our findings regarding small suppliers (those whose firms employ less than 500). Such firms account for almost one-third of total
11 See Appendix C for more information about the survey methodology.
employment in the auto supply chain; almost without exception, these firms are second- and third-tier suppliers.
3.2.1 EmploymentA large majority of these small supplier firms temporarily suspended or reduced production and laid off workers (91 percent either laid off employees or cut working hours). Eighteen percent of our sample reported shutting down at least some production. Firms used a variety of strategies in implementing layoffs: 76 percent of plants laid off production workers, while only 33 percent laid off managers; 31 percent laid off their newest hires first, while 52 percent based layoffs on performance, laying off the worst performers first; 41 percent minimized layoffs by reducing hours.
Even as sales and profit margins have continued to rebound since 2010, employers have been hesitant to reinstate many of the recently eliminated positions. Eighty-three percent of our survey respondents expect a sales increase of 5 percent or more in the next 12 months, but only 55 percent expect to increase employment by 5 percent or more.
Interviews suggest that many managers are still concerned about the rebound’s permanence. Some firms plan to permanently scale back employment.
Nevertheless, we find evidence of a slight decline in reliance on temporary workers. Of survey respondents, 41 percent reduced employment of temporary workers by more than 5 percent between 2007 and 2010, while only 2 percent increased temporary employment by more than 5 percent during those years.
3.2.2 Investment: During and After the CrisisThe economic crisis has altered criteria for investment, in most cases by shortening required
A large majority of these small supplier firms temporarily suspended or reduced production and laid off workers.
Firms are now more likely to invest in quick, cost-saving measures and more likely to defer investment in workforce skills.
22 Driving Workforce Change: Regional Impact and Implications of Auto Industry Transformation to a Green Economy
payback periods or altering investment priorities. Firms are now more likely to invest in quick, cost-saving measures and more likely to defer investment in workforce skills. Some firms invested in marketing efforts, such as new websites or new sales programs, to diversify out of automotive work. Others took advantage of competitor bankruptcies by buying used equipment or taking on work previously done by these former competitors. Our survey found that 33 percent postponed investments in R&D/product development and 74 percent postponed investment in equipment. Also, 35 percent postponed training while only 9 percent increased training. The crisis could have been a time for further transformation of the workforce (e.g., training workers in new methods described elsewhere in this report), but firms laid them off instead, largely due to lack of capital.
In terms of information technology investment, almost half (45 percent) already had an enterprise information system in place by 2007. Three percent of firms implemented such a system since 2007. However, many firms we interviewed appeared to lack consistent and proactive systems for maximizing the effect of IT systems. Similarly, only 5 percent of survey respondents with an Enterprise Resource Planning (ERP) system felt their systems were highly integrated with those of their key customers, while 44 percent felt they were partially integrated, 31 percent felt they were minimally integrated, and 21 percent felt they were not integrated at all.
3.2.3 Investment Before the CrisisInvestments made before the onset of the manufacturing crisis are very likely to have exerted powerful impacts on the fate of a firm. Our interviews found evidence of different pre-crisis investments having helped some firms survive and causing others to fail. For instance, pre-crisis investments in IT appear to have contributed to many firms’ abilities to survive the crisis. This technology includes ERP
and computer-aided design (CAD) systems, as well as other types of sensors and IT. While only 17 percent of respondents said their firms used such systems to fully integrate project management, finances and employee skills, the vast majority of firms had systems that helped them manage their businesses. Only 14 percent of firms reported having IT systems that were inaccurate or too difficult to use. Firms that benefit from IT generally fit into one of two groups: those who see technology as a replacement for skilled labor, and those that see such technology as complementary to new workforce skill sets. Firms in both groups managed to survive the crisis.
Similarly, investing time and money into diversification before the crisis appears to have been important to survival. While such a strategy does not always require large investment, diversifying into new industries often does involve investing in new equipment and workforce skills, or enduring some initial period of lower profitability. It is clear that after the crisis, auto suppliers are more likely to have diverse product lines and a wider range of customers. Of our survey respondents, only 35 percent indicated that at least 80 percent of their business comes from the automotive sector, compared to 55 percent in 1993. Thus, despite the considerable barriers to diversification about two-thirds of our respondents are actively trying to expand business outside of automobiles.
Conversely, some firms made very untimely investments just before the onset of the crisis. While these may have been sage investments in a normal year, our interviews suggest that poorly timed investments also played a large part in bankrupting some firms that may have otherwise survived the crisis. In contrast (as we discuss below), other firms that did not invest managed to survive the crisis because they had very low fixed costs.
Pre-crisis investments in IT appear to have contributed to many firms’ abilities to survive the crisis.
23
3.2.4 Customer RelationsChanges are also visible in the relationship between suppliers and customers. For some supplier firms, relations with customers have improved as excess capacity was reduced. Many automakers and first-tier suppliers began investing more time vetting suppliers, taking a stronger interest in suppliers’ internal structure, perhaps because the costs of doing business with the wrong firms—and having to change suppliers—are seen as especially dangerous now.
Other firms, however, described stretched-out payment terms and demands to hold more inventory. These diverging experiences are reflected in our survey data. For example, 24 percent of survey respondents think that their customers are amenable to suggestions for design modifications. On the other hand, two-thirds expect their customers to want some or most of the savings from these suggestions.
3.2.5 Characteristics of Surviving FirmsCluster analysis of our survey data indicates that although the above trends and commonalities are visible on the industry-wide scale, three distinct firm types are nonetheless visible. These groups were not born in the wake of the crisis, but we believe the crisis drove many firms to pursue a strategy more similar to one of the three described below.
• Cost-Cutting: These firms survive by seeking basic cuts wherever possible, such as reducing employment or forgoing equipment investment, without transforming operations. Many firms making these cuts have remained profitable in the post-crisis marketplace, but an unintended consequence of this model may be limited future investment and growth. One firm engaged in “clever cost-cutting” by reducing fixed costs, finding ways to substitute stamped, bent parts with cast parts and reducing automation and taking advantage of low cost labor. However, this model could make the firm vulnerable to competition from low-wage countries. An “agile production” model in which they introduced new products frequently and delivered them quickly to firms in a variety of industries could allow this firm to compete in the long run. However,
to implement this model would require near-simultaneous investments in marketing, IT, training and equipment—investments that the firm is not contemplating. Our survey results suggest that about 40 percent of small, lower-tier firms in the auto supply chain are in this category.
• Unsystematic Reliance on Craft Skill: A second set of firms includes those which go beyond simple cost-cutting by seeking to add value through reliance upon craft skill and some more advanced efficiency techniques. They pursue these strategies as options unrelated to one another, as opposed to regarding them as interdependent components of a long-term improvement process. They do not seek to empower their skilled labor by further integrating them in firm-wide decision-making processes. One such firm is a tooling company with broad capacity but facing intense competition from China. This firm’s customer bidding process does not allow rational scheduling and specialization. This firm is unsure whether to deepen its U.S. capacity and focus on just-in-time delivery and facility with lightweight materials or focus on product design and increase its manufacturing in China. About 40 percent of our sample falls into this category.
• Continuous Improvement Culture: A third, smaller subset of firms pursues practices popularized by Japanese firms that involve all employees in continuous improvement efforts. Decisions are characterized as long-term rather than immediate-term, and firms enjoy such positive outcomes as flexibility from diverse supply chains, agility to benefit from changes in the marketplace without disruption, high productivity and value-added per worker, and agency over the firm’s future direction. Workers benefit through access to more robust skill sets, better wages and improved job security. Among our survey respondents, 34 percent had programs for production workers, such as quality circles or autonomous teams, 10 percent of which adopted these programs during the downturn.
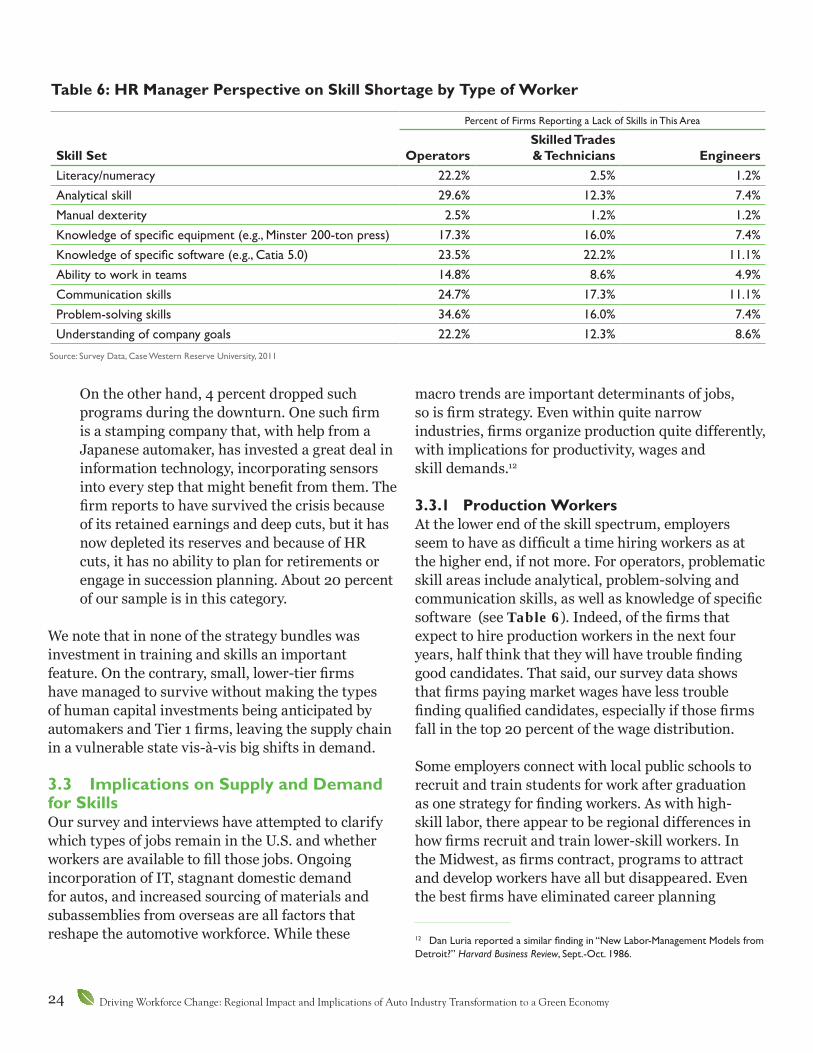
24 Driving Workforce Change: Regional Impact and Implications of Auto Industry Transformation to a Green Economy
On the other hand, 4 percent dropped such programs during the downturn. One such firm is a stamping company that, with help from a Japanese automaker, has invested a great deal in information technology, incorporating sensors into every step that might benefit from them. The firm reports to have survived the crisis because of its retained earnings and deep cuts, but it has now depleted its reserves and because of HR cuts, it has no ability to plan for retirements or engage in succession planning. About 20 percent of our sample is in this category.
We note that in none of the strategy bundles was investment in training and skills an important feature. On the contrary, small, lower-tier firms have managed to survive without making the types of human capital investments being anticipated by automakers and Tier 1 firms, leaving the supply chain in a vulnerable state vis-à-vis big shifts in demand.
3.3 Implications on Supply and Demand for SkillsOur survey and interviews have attempted to clarify which types of jobs remain in the U.S. and whether workers are available to fill those jobs. Ongoing incorporation of IT, stagnant domestic demand for autos, and increased sourcing of materials and subassemblies from overseas are all factors that reshape the automotive workforce. While these
macro trends are important determinants of jobs, so is firm strategy. Even within quite narrow industries, firms organize production quite differently, with implications for productivity, wages and skill demands.12
3.3.1 Production WorkersAt the lower end of the skill spectrum, employers seem to have as difficult a time hiring workers as at the higher end, if not more. For operators, problematic skill areas include analytical, problem-solving and communication skills, as well as knowledge of specific software (see Table 6). Indeed, of the firms that expect to hire production workers in the next four years, half think that they will have trouble finding good candidates. That said, our survey data shows that firms paying market wages have less trouble finding qualified candidates, especially if those firms fall in the top 20 percent of the wage distribution.
Some employers connect with local public schools to recruit and train students for work after graduation as one strategy for finding workers. As with high-skill labor, there appear to be regional differences in how firms recruit and train lower-skill workers. In the Midwest, as firms contract, programs to attract and develop workers have all but disappeared. Even the best firms have eliminated career planning
12 Dan Luria reported a similar finding in “New Labor-Management Models from Detroit?” Harvard Business Review, Sept.-Oct. 1986.
Percent of Firms Reporting a Lack of Skills in This Area
Skill Set OperatorsSkilled Trades & Technicians Engineers
Literacy/numeracy 22.2% 2.5% 1.2%Analytical skill 29.6% 12.3% 7.4%Manual dexterity 2.5% 1.2% 1.2%Knowledge of specific equipment (e.g., Minster 200-ton press) 17.3% 16.0% 7.4%Knowledge of specific software (e.g., Catia 5.0) 23.5% 22.2% 11.1%Ability to work in teams 14.8% 8.6% 4.9%Communication skills 24.7% 17.3% 11.1%Problem-solving skills 34.6% 16.0% 7.4%Understanding of company goals 22.2% 12.3% 8.6%
Table 6: HR Manager Perspective on Skill Shortage by Type of Worker
Source: Survey Data, Case Western Reserve University, 2011
25
for production workers. By contrast, in the Southeast, we see state government taking over much of the traditional in-house human resources function for firms. One firm described state-run manufacturing programs in Alabama and Georgia as offering a litany of free services. This firm was attracted to these states’ willingness to tour potential plant sites by helicopter; provide training videos and other training materials tailored to the relevant type of work; run job advertisements in newspapers; conduct initial hiring of production workers; and conduct basic introductory training for the resultant hires.
Thus, it seems that Midwestern firms paying market wages have sufficient access to production workers, whereas Southeastern states have adapted by increasing the role of government to take over previously private-sector activity. In neither region do many firms prioritize investment in low-skill workforce training.
3.3.2 Skilled LaborThis section addresses two types of skilled workers: 1) workers in the “skilled trades” who undergo a four-year, accredited training program plus on-the-job training, and whose certification is regulated by states and 2) technicians, who have some training but less than the skilled trades workers and none of the formal certification of the skilled trades.
Some work requiring skilled trades, such as tool and die-making, has been off-shored to lower-wage countries like China and Mexico. However, since these jobs are complex, off-shoring can be more difficult, time-consuming and costly than firms initially expect. Thus, even as quality increases at off-shore locations, some high-skill work remains on-shore, and some initially off-shored work eventually returns to the United States. In our survey, 4 percent of respondents reported that they brought operations back from abroad.
While firms rely on skilled trades, many firms assume that shortages are unlikely to surface in the short or medium term because overall demand for skills remains weak. Thus, a third of our respondents do
no active succession planning, including some small firms that depend upon long-serving employees. Our survey finds that 64 percent of firms prefer to hire employees who plan to stay until retirement, but only 40 percent of these firms conduct active succession planning. This is true even for firms that were productive and profitable in the past.
Some high-skill jobs are moving from the tri-state region to the Southeast. While tri-state factories were closing during the recent crisis, foreign automakers had recently opened new factories in the Southeast. Our research indicates that many of these new plants drew skilled labor from the Midwest. In reference to the high-skill labor at his firm’s new Alabama plant, one supplier stated, “Typically the people with the highest mechanical competency without being degreed, like in the trades, they would come from the Midwest. Ohio, Michigan, Indiana, Iowa.”13
Access to high-skill labor was a larger problem for Southeastern plants before the most recent economic downturn. When foreign automakers began opening factories in South Carolina earlier in the decade, for example, the available skills did not match what was required for automobile work. Trained to serve the needs of naval shipyards, the available workers required training specific to electronics or other automobile-related work. As a result, firms launched both in-house training programs and training programs in cooperation with community and technical colleges. Such initiatives have not only closed or filled the initial skills gap in South Carolina, but have produced enough high-skill workers to make the state attractive to new aerospace manufacturing.14
13 Pre-survey interview transcript: Firm 1 (149), 8-24-2010.14 One example is Boeing in the Charleston area where Firm 3 is already located.
A third of our respondents do no active succession planning, including some small firms that depend upon long-serving employees.
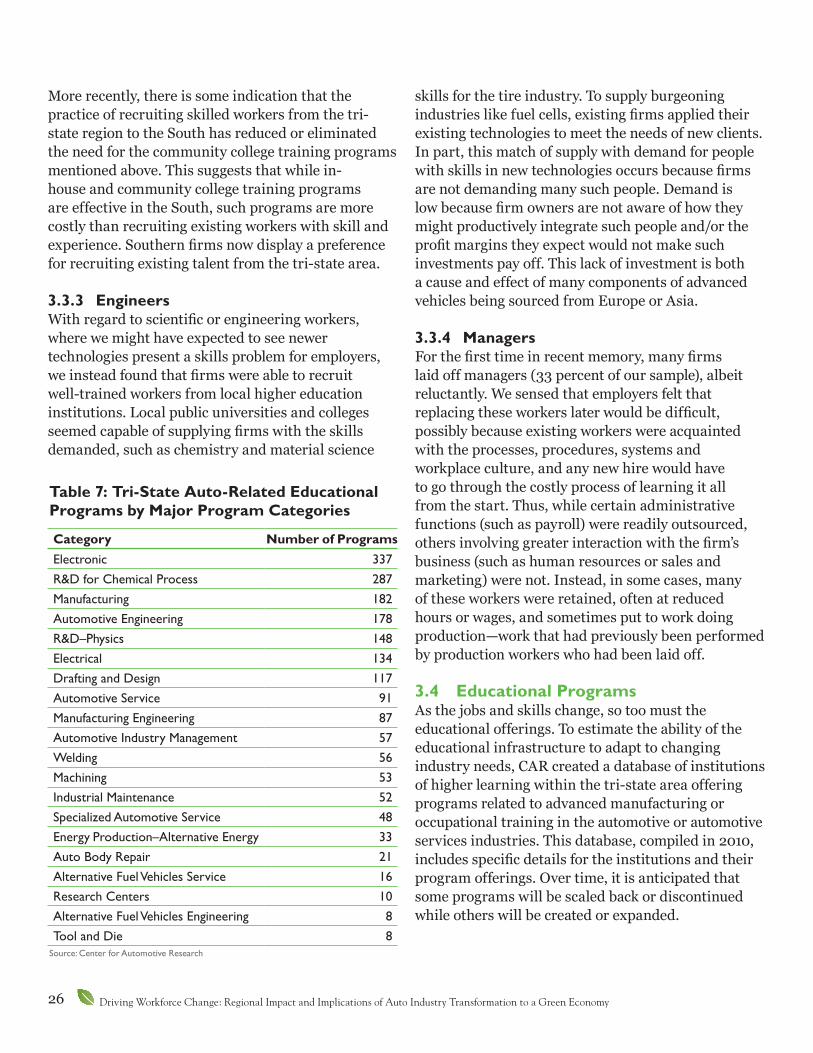
26 Driving Workforce Change: Regional Impact and Implications of Auto Industry Transformation to a Green Economy
More recently, there is some indication that the practice of recruiting skilled workers from the tri-state region to the South has reduced or eliminated the need for the community college training programs mentioned above. This suggests that while in-house and community college training programs are effective in the South, such programs are more costly than recruiting existing workers with skill and experience. Southern firms now display a preference for recruiting existing talent from the tri-state area.
3.3.3 EngineersWith regard to scientific or engineering workers, where we might have expected to see newer technologies present a skills problem for employers, we instead found that firms were able to recruit well-trained workers from local higher education institutions. Local public universities and colleges seemed capable of supplying firms with the skills demanded, such as chemistry and material science
skills for the tire industry. To supply burgeoning industries like fuel cells, existing firms applied their existing technologies to meet the needs of new clients. In part, this match of supply with demand for people with skills in new technologies occurs because firms are not demanding many such people. Demand is low because firm owners are not aware of how they might productively integrate such people and/or the profit margins they expect would not make such investments pay off. This lack of investment is both a cause and effect of many components of advanced vehicles being sourced from Europe or Asia.
3.3.4 ManagersFor the first time in recent memory, many firms laid off managers (33 percent of our sample), albeit reluctantly. We sensed that employers felt that replacing these workers later would be difficult, possibly because existing workers were acquainted with the processes, procedures, systems and workplace culture, and any new hire would have to go through the costly process of learning it all from the start. Thus, while certain administrative functions (such as payroll) were readily outsourced, others involving greater interaction with the firm’s business (such as human resources or sales and marketing) were not. Instead, in some cases, many of these workers were retained, often at reduced hours or wages, and sometimes put to work doing production—work that had previously been performed by production workers who had been laid off.
3.4 Educational ProgramsAs the jobs and skills change, so too must the educational offerings. To estimate the ability of the educational infrastructure to adapt to changing industry needs, CAR created a database of institutions of higher learning within the tri-state area offering programs related to advanced manufacturing or occupational training in the automotive or automotive services industries. This database, compiled in 2010, includes specific details for the institutions and their program offerings. Over time, it is anticipated that some programs will be scaled back or discontinued while others will be created or expanded.
Category Number of ProgramsElectronic 337R&D for Chemical Process 287Manufacturing 182Automotive Engineering 178R&D–Physics 148Electrical 134Drafting and Design 117Automotive Service 91Manufacturing Engineering 87Automotive Industry Management 57Welding 56Machining 53Industrial Maintenance 52Specialized Automotive Service 48Energy Production–Alternative Energy 33Auto Body Repair 21Alternative Fuel Vehicles Service 16Research Centers 10Alternative Fuel Vehicles Engineering 8Tool and Die 8
Table 7: Tri-State Auto-Related Educational Programs by Major Program Categories
Source: Center for Automotive Research

27
The intent of assessing the region’s automotive educational programs was to:
• Determine the current automotive education and training infrastructure
• Assess how schools and programs respond to industry and employer needs
To assess auto-related program offerings in the tri-state region, CAR examined the offerings of nearly 900 accredited postsecondary institutions. More than one-third of these institutions offer programs related to the engineering, design, production and maintenance of automobiles. For each institution, researchers analyzed program descriptions and placed each auto-related major into one of 20 primary categories (see Table 7).
In total, there are more than 1,900 programs offering degrees and certificates relevant to the automotive industry. These degrees include certificates, associate of science, bachelor of science, master of science, and doctor of philosophy (Ph.D.) degrees (see Appendix A for more information).
Using the database constructed for this project, educators at schools with programs of interest were identified, contacted and interviewed. A number of recurring themes emerged from these interviews, as discussed below.
Industry-Education Interaction• Automotive programs all have industrial
advisory boards comprised of local businessmen and leaders bringing real-world expertise.
• Local companies present real-world problems and provide learning environments for courses such as senior design.
• Some schools offer programs commissioned by companies, such as Michigan Tech’s distance learning program for displaced automotive engineers and Purdue’s hybrid vehicles course for Delphi workers.
• Company demand for student interns is so high that virtually every student who seeks an internship is able to find one.
• Faculty efforts at networking with industry colleagues and community leaders are common, but take place on an individual ad hoc basis.
Community-Education Interaction• Schools interact with the community providing
resources or hosting events for the general public (e.g., the “Electric Vehicle Hub” being developed by Indiana schools, car shows, public seminars and competitions).
• Outreach to high schools occurs fairly often, with faculty in universities producing course modules or facilitating workshops for high school teachers.
• Recruiting events offer additional opportunities for connecting with the public.
• Start-up companies using technologies developed at universities also create connections between the school and the community.
Funding• Grants for expanding green vehicle education
programs are available.
° Michigan Tech was able to leverage its experience educating displaced workers and, with money from the Michigan Academy of Green Mobility and the U.S. Department of Education (DOE), it offered additional hybrid engineering classes for unemployed and employed engineers as well as college students.
° Several schools came together to form the Indiana Advanced Electric Vehicle Training and Education Consortium (I-AEVtec), receiving $8.1 million from DOE for various projects related to energy-efficient vehicle education.
28 Driving Workforce Change: Regional Impact and Implications of Auto Industry Transformation to a Green Economy
The tri-state region has a strong automotive-focused educational infrastructure. Schools, colleges, universities, departments and faculty in this region work closely, albeit rather informally, with industry to ensure the programs and curricula remain current with industry needs. The building blocks of the future skilled automotive workforce are in place, and could be improved by formalizing connections to industry and facilitating communication between education, workforce development and industry partners.
3.5 High-Road Production StrategiesU.S. firms cannot compete in the long term by cutting wages and benefits alone. Instead, they should build on their strengths by drawing on the knowledge and skills of all workers. The U.S. auto supply chain could prosper by adopting a high-road production recipe in which firms, their employees and suppliers work together to generate high productivity. Specifically, a successful high-road production strategy usually seeks to achieve a high-value-added business model through investment in smart and flexible workers, efficient process, product innovation, and advanced equipment. Successful adoption of these policies requires that everyone in the value chain be willing and able to share knowledge. Involving workers and suppliers and using information technology are key ways of doing this.
Workers, particularly low-level workers, have much to contribute because they are close to the process: They interact with a machine all day, or they observe directly what frustrates consumers. For example, a study of steel-finishing lines found that firms with high-road practices had 6.7 percent more uptime (generating $2 million annually in net profits for a small plant) than did lines without them.15 The increase in uptime is due to communication and
15 Casey Ichniowski, Kathryn Shaw, and Giovanna Prennushi, “The Effects of Human Resource Management Practices on Productivity: A Study of Steel Finishing Lines,” American Economic Review 87 (3): 291-313.
knowledge overlap. In a firm that does not use high-road practices, all communication may go through one person. In contrast, workers in high-road facilities, such as the one run by members of the United Steelworkers at Mittal Steel in Cleveland, solve problems more quickly because they communicate with each other directly in a structured way.
The continuing use of IT will be critical in improving manufacturing practice, but it will not necessarily boost productivity unless it is accompanied by a decentralization of production, a key element of high-road production. Our fieldwork found examples of firms who are thriving due to their adoption of an agile production model in which they produce for quick delivery a variety of products for a variety of industries. They adopted advanced IT-enhanced equipment while also changing their product strategy (to produce more customized products), their operations strategy (using their new IT capability to reduce setup times, run times and inspection times), and human resource policies (employing workers with more problem-solving skills and using more teamwork). The success of the changes in one area depended on success in other areas. For example, customizing products would not have been profitable without the reduced time required to change over to making a new product—a reduction made possible both by the improved information from the IT and the improved use of the information by the empowered workers. Conversely, the investments in IT and training were less likely to pay off in firms that did not adopt the more complex product.
Markets alone fail to provide the proper incentives for firms to adopt high-road policies for two main reasons. First, the high road works only if a company adopts several practices at the same time. It must improve communication skills at all levels, create mechanisms for communicating new ideas across
Some firms are not demanding skills in areas where they should.
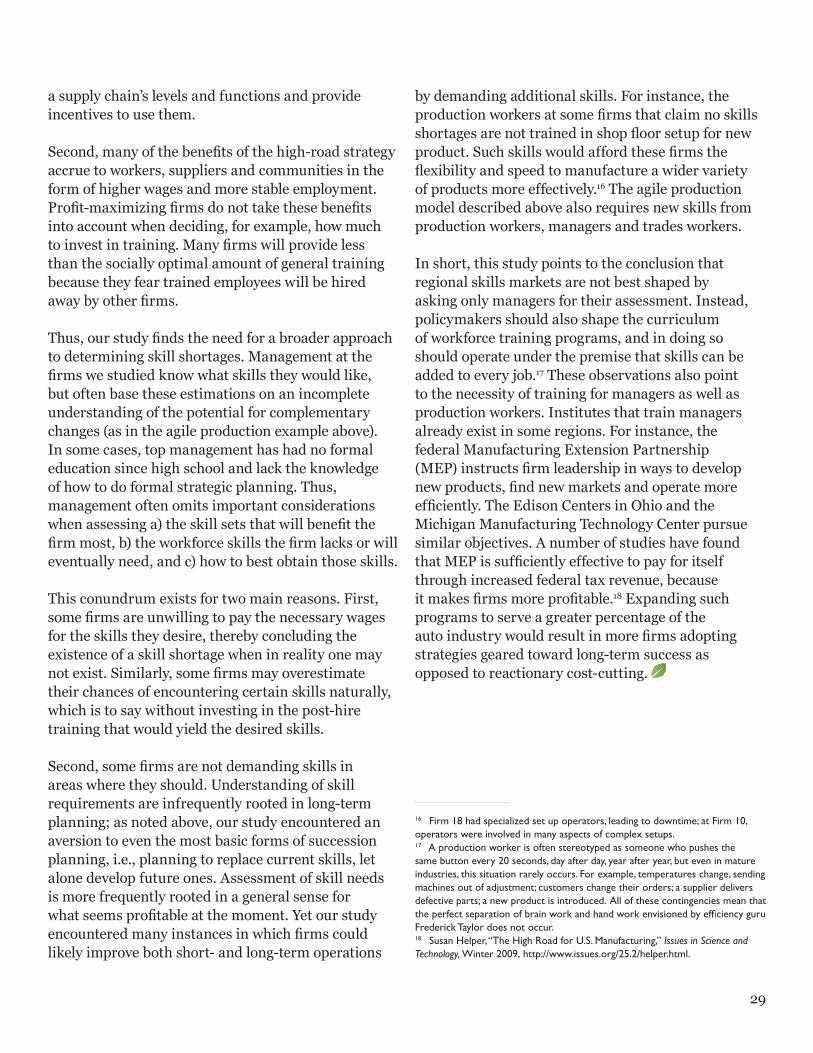
29
a supply chain’s levels and functions and provide incentives to use them.
Second, many of the benefits of the high-road strategy accrue to workers, suppliers and communities in the form of higher wages and more stable employment. Profit-maximizing firms do not take these benefits into account when deciding, for example, how much to invest in training. Many firms will provide less than the socially optimal amount of general training because they fear trained employees will be hired away by other firms.
Thus, our study finds the need for a broader approach to determining skill shortages. Management at the firms we studied know what skills they would like, but often base these estimations on an incomplete understanding of the potential for complementary changes (as in the agile production example above). In some cases, top management has had no formal education since high school and lack the knowledge of how to do formal strategic planning. Thus, management often omits important considerations when assessing a) the skill sets that will benefit the firm most, b) the workforce skills the firm lacks or will eventually need, and c) how to best obtain those skills.
This conundrum exists for two main reasons. First, some firms are unwilling to pay the necessary wages for the skills they desire, thereby concluding the existence of a skill shortage when in reality one may not exist. Similarly, some firms may overestimate their chances of encountering certain skills naturally, which is to say without investing in the post-hire training that would yield the desired skills.
Second, some firms are not demanding skills in areas where they should. Understanding of skill requirements are infrequently rooted in long-term planning; as noted above, our study encountered an aversion to even the most basic forms of succession planning, i.e., planning to replace current skills, let alone develop future ones. Assessment of skill needs is more frequently rooted in a general sense for what seems profitable at the moment. Yet our study encountered many instances in which firms could likely improve both short- and long-term operations
by demanding additional skills. For instance, the production workers at some firms that claim no skills shortages are not trained in shop floor setup for new product. Such skills would afford these firms the flexibility and speed to manufacture a wider variety of products more effectively.16 The agile production model described above also requires new skills from production workers, managers and trades workers.
In short, this study points to the conclusion that regional skills markets are not best shaped by asking only managers for their assessment. Instead, policymakers should also shape the curriculum of workforce training programs, and in doing so should operate under the premise that skills can be added to every job.17 These observations also point to the necessity of training for managers as well as production workers. Institutes that train managers already exist in some regions. For instance, the federal Manufacturing Extension Partnership (MEP) instructs firm leadership in ways to develop new products, find new markets and operate more efficiently. The Edison Centers in Ohio and the Michigan Manufacturing Technology Center pursue similar objectives. A number of studies have found that MEP is sufficiently effective to pay for itself through increased federal tax revenue, because it makes firms more profitable.18 Expanding such programs to serve a greater percentage of the auto industry would result in more firms adopting strategies geared toward long-term success as opposed to reactionary cost-cutting.
16 Firm 18 had specialized set up operators, leading to downtime; at Firm 10, operators were involved in many aspects of complex setups. 17 A production worker is often stereotyped as someone who pushes the same button every 20 seconds, day after day, year after year, but even in mature industries, this situation rarely occurs. For example, temperatures change, sending machines out of adjustment; customers change their orders; a supplier delivers defective parts; a new product is introduced. All of these contingencies mean that the perfect separation of brain work and hand work envisioned by efficiency guru Frederick Taylor does not occur.18 Susan Helper, “The High Road for U.S. Manufacturing,” Issues in Science and Technology, Winter 2009, http://www.issues.org/25.2/helper.html.

30 Driving Workforce Change: Regional Impact and Implications of Auto Industry Transformation to a Green Economy
4. Who Are the Displaced Workers?
The auto industry has been under tremendous pressure in recent years, in terms of both structural and cyclical change. The tri-state
region of Indiana, Michigan and Ohio lost more than 46 percent of its total auto industry employment between June 2006 and June 2009. This chapter aims to identify the workers most affected by these changes.
The primary “take-away” from this chapter is that the auto workforce has become slightly older and more male. Policymakers and workforce development
officials should also be concerned that a large majority of the workforce that have been out of work for a long time have only a high school diploma. This will likely present a significant challenge for implementing education and retraining programs targeted to help displaced workers transition to new jobs.
4.1 Job Change by OccupationTable 8 presents the top 20 occupations that lost auto sector jobs in the tri-state region from 2006 to 2009. The top two occupations with the greatest job reductions were team assemblers and assemblers
Occupation Code Title Loss
Industry Loss Rank
Percent of Auto-Related
Loss00-0000 Total, All Occupations -232,335 100%51-2092 Team Assemblers -32,876 1 14%51-2099 Assemblers and Fabricators, All Other -24,527 2 11%51-9199 Production Workers, All Other -9,676 3 4%
51-4031 Cutting, Punching, and Press Machine Setters, Operators, and Tenders, Metal and Plastic
-8,146 4 4%
51-9061 Inspectors, Testers, Sorters, Samplers, and Weighers -7,432 5 3%51-1011 First-Line Supervisors/Managers of Production and Operating Workers -6,940 6 3%51-4041 Machinists -6,823 7 3%51-4111 Tool and Die Makers -6,728 8 3%17-2199 Engineers, All Other -6,585 9 3%17-2112 Industrial Engineers -5,224 10 2%53-7051 Industrial Truck and Tractor Operators -5,019 11 2%49-9042 Maintenance and Repair Workers, General -3,531 12 2%49-9041 Industrial Machinery Mechanics -3,401 13 1%17-2141 Mechanical Engineers -3,362 14 1%51-4121 Welders, Cutters, Solderers, and Brazers -3,277 15 1%53-7062 Laborers and Freight, Stock, and Material Movers, Hand -3,150 16 1%
51-4072 Molding, Coremaking, and Casting Machine Setters, Operators, and Tenders, Metal and Plastic
-3,106 17 1%
13-1199 Business Operations Specialists, All Other -3,097 18 1%51-4081 Multiple Machine Tool Setters, Operators, and Tenders, Metal and Plastic -2,830 19 1%47-2111 Electricians -2,792 20 1%
Table 8: Tri-State Occupational Employment Loss in Transportation Equipment Manufacturing, 2006 to 2009
Note: Shaded rows indicate occupations where workers have experienced extended unemployment. Source: Indiana Department of Workforce Development, using QCEW and OES data
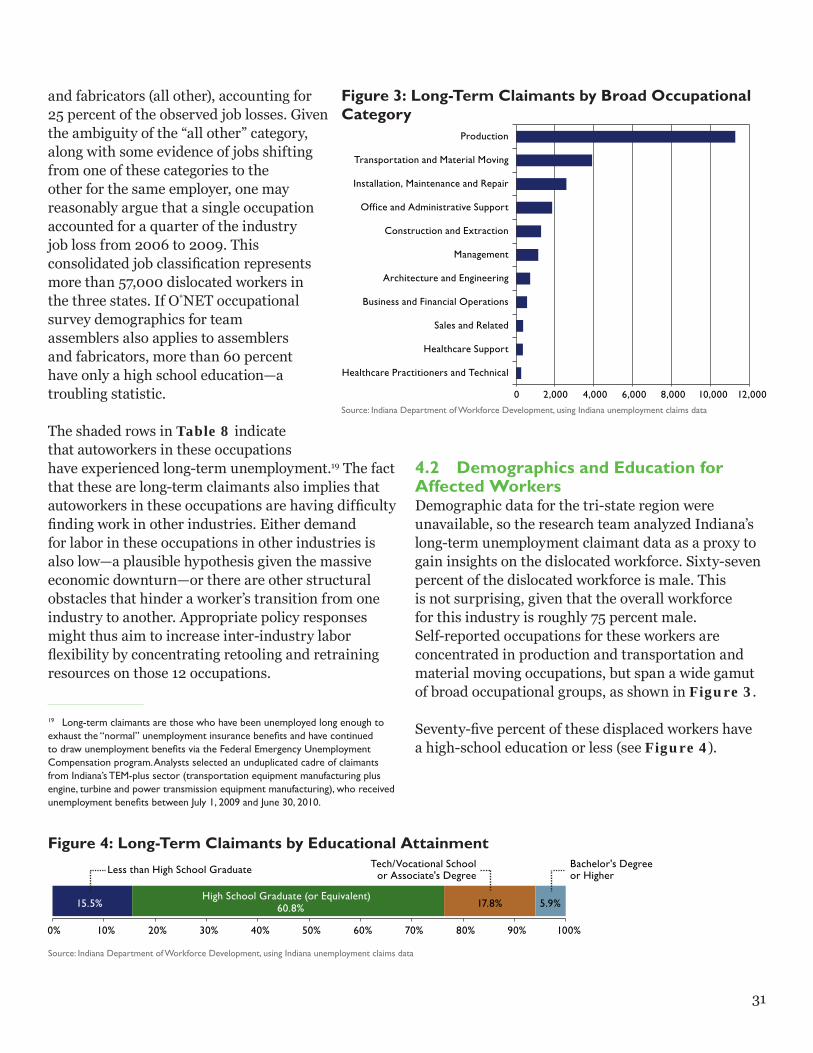
31
and fabricators (all other), accounting for 25 percent of the observed job losses. Given the ambiguity of the “all other” category, along with some evidence of jobs shifting from one of these categories to the other for the same employer, one may reasonably argue that a single occupation accounted for a quarter of the industry job loss from 2006 to 2009. This consolidated job classification represents more than 57,000 dislocated workers in the three states. If O*NET occupational survey demographics for team assemblers also applies to assemblers and fabricators, more than 60 percent have only a high school education—a troubling statistic.
The shaded rows in Table 8 indicate that autoworkers in these occupations have experienced long-term unemployment.19 The fact that these are long-term claimants also implies that autoworkers in these occupations are having difficulty finding work in other industries. Either demand for labor in these occupations in other industries is also low—a plausible hypothesis given the massive economic downturn—or there are other structural obstacles that hinder a worker’s transition from one industry to another. Appropriate policy responses might thus aim to increase inter-industry labor flexibility by concentrating retooling and retraining resources on those 12 occupations.
19 Long-term claimants are those who have been unemployed long enough to exhaust the “normal” unemployment insurance benefits and have continued to draw unemployment benefits via the Federal Emergency Unemployment Compensation program. Analysts selected an unduplicated cadre of claimants from Indiana’s TEM-plus sector (transportation equipment manufacturing plus engine, turbine and power transmission equipment manufacturing), who received unemployment benefits between July 1, 2009 and June 30, 2010.
4.2 Demographics and Education for Affected WorkersDemographic data for the tri-state region were unavailable, so the research team analyzed Indiana’s long-term unemployment claimant data as a proxy to gain insights on the dislocated workforce. Sixty-seven percent of the dislocated workforce is male. This is not surprising, given that the overall workforce for this industry is roughly 75 percent male. Self-reported occupations for these workers are concentrated in production and transportation and material moving occupations, but span a wide gamut of broad occupational groups, as shown in Figure 3.
Seventy-five percent of these displaced workers have a high-school education or less (see Figure 4).
Figure 3: Long-Term Claimants by Broad Occupational Category
0 2,000 4,000 6,000 8,000 10,000 12,000
Production
Transportation and Material Moving
Installation, Maintenance and Repair
Office and Administrative Support
Construction and Extraction
Management
Architecture and Engineering
Business and Financial Operations
Sales and Related
Healthcare Support
Healthcare Practitioners and Technical
Source: Indiana Department of Workforce Development, using Indiana unemployment claims data
15.5% 60.8% 17.8% 5.9%
0% 10% 20% 30% 40% 50% 60% 70% 80% 90% 100%
Less than High School Graduate
High School Graduate (or Equivalent)
Tech/Vocational Schoolor Associate's Degree
Bachelor's Degree or Higher
Figure 4: Long-Term Claimants by Educational Attainment
Source: Indiana Department of Workforce Development, using Indiana unemployment claims data
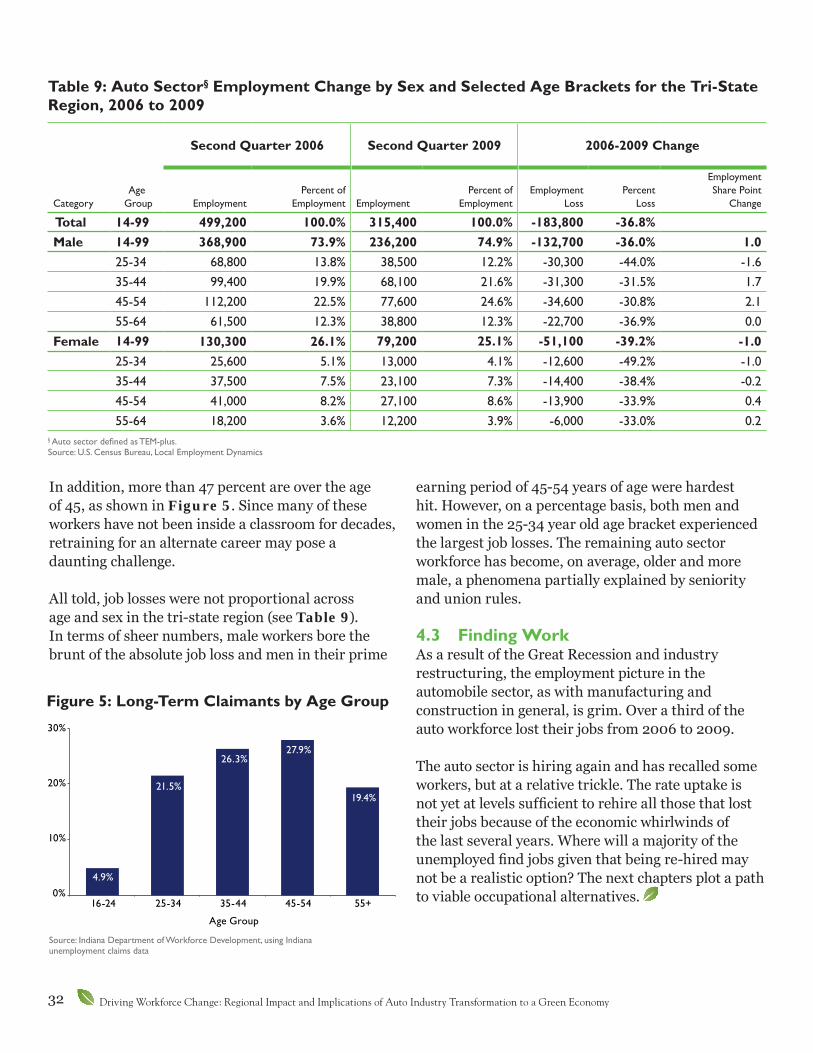
32 Driving Workforce Change: Regional Impact and Implications of Auto Industry Transformation to a Green Economy
In addition, more than 47 percent are over the age of 45, as shown in Figure 5. Since many of these workers have not been inside a classroom for decades, retraining for an alternate career may pose a daunting challenge.
All told, job losses were not proportional across age and sex in the tri-state region (see Table 9). In terms of sheer numbers, male workers bore the brunt of the absolute job loss and men in their prime
earning period of 45-54 years of age were hardest hit. However, on a percentage basis, both men and women in the 25-34 year old age bracket experienced the largest job losses. The remaining auto sector workforce has become, on average, older and more male, a phenomena partially explained by seniority and union rules.
4.3 Finding WorkAs a result of the Great Recession and industry restructuring, the employment picture in the automobile sector, as with manufacturing and construction in general, is grim. Over a third of the auto workforce lost their jobs from 2006 to 2009.
The auto sector is hiring again and has recalled some workers, but at a relative trickle. The rate uptake is not yet at levels sufficient to rehire all those that lost their jobs because of the economic whirlwinds of the last several years. Where will a majority of the unemployed find jobs given that being re-hired may not be a realistic option? The next chapters plot a path to viable occupational alternatives.
Table 9: Auto Sector§ Employment Change by Sex and Selected Age Brackets for the Tri-State Region, 2006 to 2009
§ Auto sector defined as TEM-plus. Source: U.S. Census Bureau, Local Employment Dynamics
Second Quarter 2006 Second Quarter 2009 2006-2009 Change
CategoryAge
Group EmploymentPercent of
Employment EmploymentPercent of
EmploymentEmployment
Loss Percent
Loss
Employment Share Point
Change
Total 14-99 499,200 100.0% 315,400 100.0% -183,800 -36.8% Male 14-99 368,900 73.9% 236,200 74.9% -132,700 -36.0% 1.0
25-34 68,800 13.8% 38,500 12.2% -30,300 -44.0% -1.635-44 99,400 19.9% 68,100 21.6% -31,300 -31.5% 1.745-54 112,200 22.5% 77,600 24.6% -34,600 -30.8% 2.155-64 61,500 12.3% 38,800 12.3% -22,700 -36.9% 0.0
Female 14-99 130,300 26.1% 79,200 25.1% -51,100 -39.2% -1.025-34 25,600 5.1% 13,000 4.1% -12,600 -49.2% -1.035-44 37,500 7.5% 23,100 7.3% -14,400 -38.4% -0.245-54 41,000 8.2% 27,100 8.6% -13,900 -33.9% 0.455-64 18,200 3.6% 12,200 3.9% -6,000 -33.0% 0.2
4.9%
21.5%
26.3%27.9%
19.4%
0%
10%
20%
30%
16-24 25-34 35-44 45-54 55+
Age Group
Source: Indiana Department of Workforce Development, using Indiana unemployment claims data
Figure 5: Long-Term Claimants by Age Group
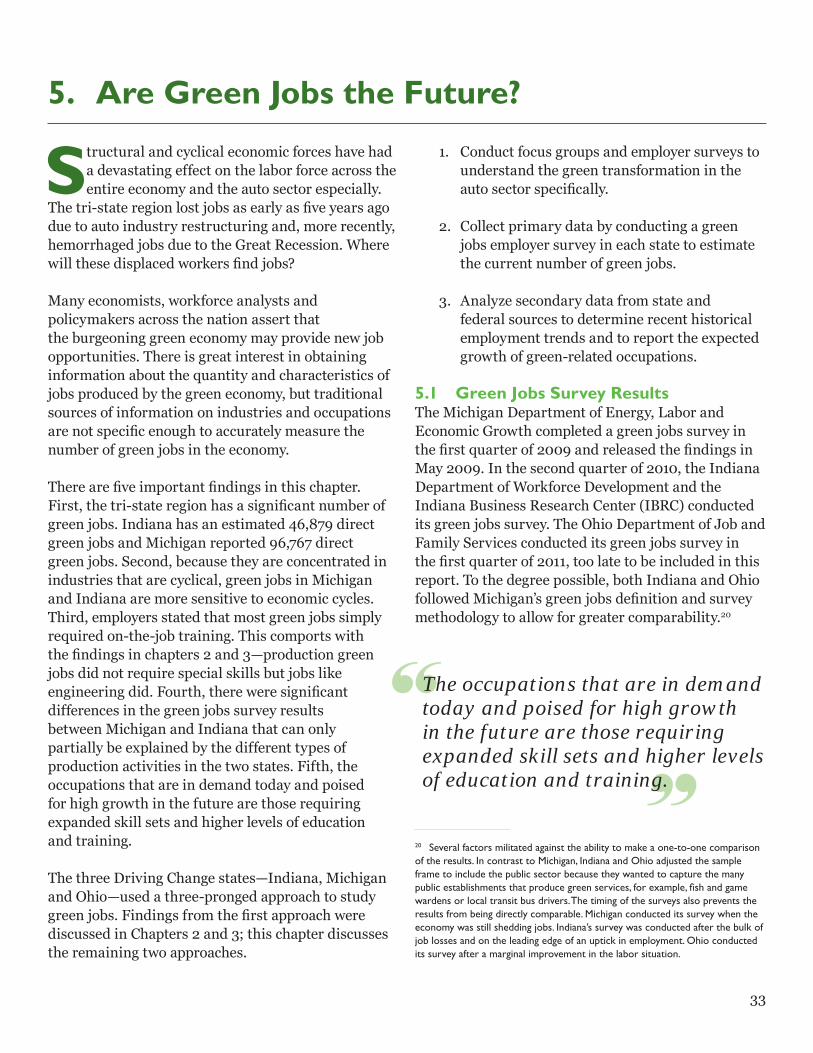
33
5. Are Green Jobs the Future?
Structural and cyclical economic forces have had a devastating effect on the labor force across the entire economy and the auto sector especially.
The tri-state region lost jobs as early as five years ago due to auto industry restructuring and, more recently, hemorrhaged jobs due to the Great Recession. Where will these displaced workers find jobs?
Many economists, workforce analysts and policymakers across the nation assert that the burgeoning green economy may provide new job opportunities. There is great interest in obtaining information about the quantity and characteristics of jobs produced by the green economy, but traditional sources of information on industries and occupations are not specific enough to accurately measure the number of green jobs in the economy.
There are five important findings in this chapter. First, the tri-state region has a significant number of green jobs. Indiana has an estimated 46,879 direct green jobs and Michigan reported 96,767 direct green jobs. Second, because they are concentrated in industries that are cyclical, green jobs in Michigan and Indiana are more sensitive to economic cycles. Third, employers stated that most green jobs simply required on-the-job training. This comports with the findings in chapters 2 and 3—production green jobs did not require special skills but jobs like engineering did. Fourth, there were significant differences in the green jobs survey results between Michigan and Indiana that can only partially be explained by the different types of production activities in the two states. Fifth, the occupations that are in demand today and poised for high growth in the future are those requiring expanded skill sets and higher levels of education and training.
The three Driving Change states—Indiana, Michigan and Ohio—used a three-pronged approach to study green jobs. Findings from the first approach were discussed in Chapters 2 and 3; this chapter discusses the remaining two approaches.
1. Conduct focus groups and employer surveys to understand the green transformation in the auto sector specifically.
2. Collect primary data by conducting a green jobs employer survey in each state to estimate the current number of green jobs.
3. Analyze secondary data from state and federal sources to determine recent historical employment trends and to report the expected growth of green-related occupations.
5.1 Green Jobs Survey ResultsThe Michigan Department of Energy, Labor and Economic Growth completed a green jobs survey in the first quarter of 2009 and released the findings in May 2009. In the second quarter of 2010, the Indiana Department of Workforce Development and the Indiana Business Research Center (IBRC) conducted its green jobs survey. The Ohio Department of Job and Family Services conducted its green jobs survey in the first quarter of 2011, too late to be included in this report. To the degree possible, both Indiana and Ohio followed Michigan’s green jobs definition and survey methodology to allow for greater comparability.20
20 Several factors militated against the ability to make a one-to-one comparison of the results. In contrast to Michigan, Indiana and Ohio adjusted the sample frame to include the public sector because they wanted to capture the many public establishments that produce green services, for example, fish and game wardens or local transit bus drivers. The timing of the surveys also prevents the results from being directly comparable. Michigan conducted its survey when the economy was still shedding jobs. Indiana’s survey was conducted after the bulk of job losses and on the leading edge of an uptick in employment. Ohio conducted its survey after a marginal improvement in the labor situation.
The occupations that are in demand today and poised for high growth in the future are those requiring expanded skill sets and higher levels of education and training.
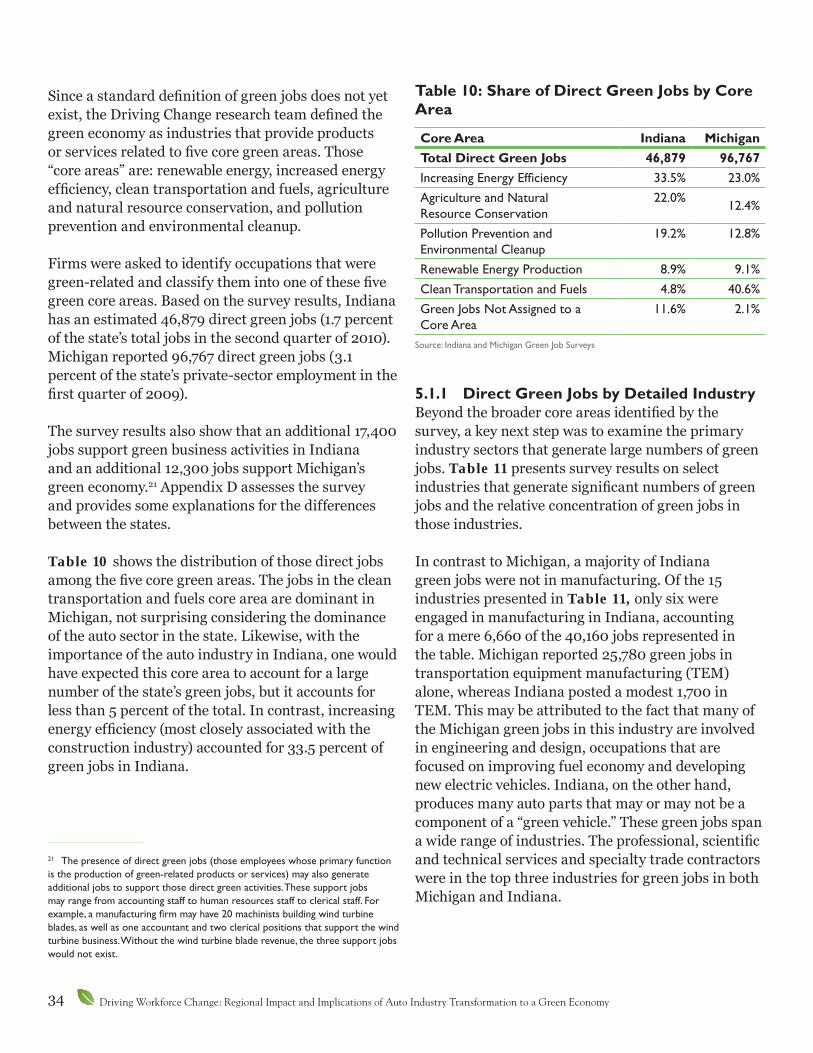
34 Driving Workforce Change: Regional Impact and Implications of Auto Industry Transformation to a Green Economy
Since a standard definition of green jobs does not yet exist, the Driving Change research team defined the green economy as industries that provide products or services related to five core green areas. Those “core areas” are: renewable energy, increased energy efficiency, clean transportation and fuels, agriculture and natural resource conservation, and pollution prevention and environmental cleanup.
Firms were asked to identify occupations that were green-related and classify them into one of these five green core areas. Based on the survey results, Indiana has an estimated 46,879 direct green jobs (1.7 percent of the state’s total jobs in the second quarter of 2010). Michigan reported 96,767 direct green jobs (3.1 percent of the state’s private-sector employment in the first quarter of 2009).
The survey results also show that an additional 17,400 jobs support green business activities in Indiana and an additional 12,300 jobs support Michigan’s green economy.21 Appendix D assesses the survey and provides some explanations for the differences between the states.
Table 10 shows the distribution of those direct jobs among the five core green areas. The jobs in the clean transportation and fuels core area are dominant in Michigan, not surprising considering the dominance of the auto sector in the state. Likewise, with the importance of the auto industry in Indiana, one would have expected this core area to account for a large number of the state’s green jobs, but it accounts for less than 5 percent of the total. In contrast, increasing energy efficiency (most closely associated with the construction industry) accounted for 33.5 percent of green jobs in Indiana.
21 The presence of direct green jobs (those employees whose primary function is the production of green-related products or services) may also generate additional jobs to support those direct green activities. These support jobs may range from accounting staff to human resources staff to clerical staff. For example, a manufacturing firm may have 20 machinists building wind turbine blades, as well as one accountant and two clerical positions that support the wind turbine business. Without the wind turbine blade revenue, the three support jobs would not exist.
5.1.1 Direct Green Jobs by Detailed IndustryBeyond the broader core areas identified by the survey, a key next step was to examine the primary industry sectors that generate large numbers of green jobs. Table 11 presents survey results on select industries that generate significant numbers of green jobs and the relative concentration of green jobs in those industries.
In contrast to Michigan, a majority of Indiana green jobs were not in manufacturing. Of the 15 industries presented in Table 11, only six were engaged in manufacturing in Indiana, accounting for a mere 6,660 of the 40,160 jobs represented in the table. Michigan reported 25,780 green jobs in transportation equipment manufacturing (TEM) alone, whereas Indiana posted a modest 1,700 in TEM. This may be attributed to the fact that many of the Michigan green jobs in this industry are involved in engineering and design, occupations that are focused on improving fuel economy and developing new electric vehicles. Indiana, on the other hand, produces many auto parts that may or may not be a component of a “green vehicle.” These green jobs span a wide range of industries. The professional, scientific and technical services and specialty trade contractors were in the top three industries for green jobs in both Michigan and Indiana.
Core Area Indiana Michigan Total Direct Green Jobs 46,879 96,767Increasing Energy Efficiency 33.5% 23.0%Agriculture and Natural Resource Conservation
22.0% 12.4%
Pollution Prevention and Environmental Cleanup
19.2% 12.8%
Renewable Energy Production 8.9% 9.1%Clean Transportation and Fuels 4.8% 40.6%Green Jobs Not Assigned to a Core Area
11.6% 2.1%
Table 10: Share of Direct Green Jobs by Core Area
Source: Indiana and Michigan Green Job Surveys
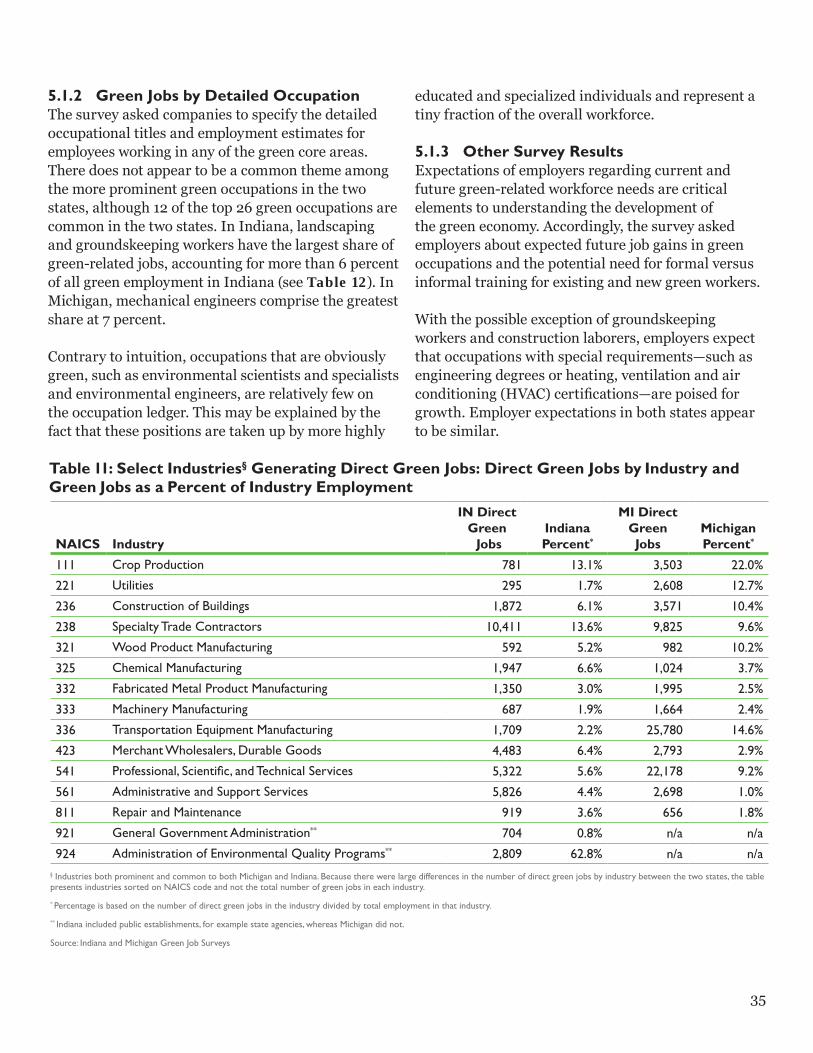
35
5.1.2 Green Jobs by Detailed OccupationThe survey asked companies to specify the detailed occupational titles and employment estimates for employees working in any of the green core areas. There does not appear to be a common theme among the more prominent green occupations in the two states, although 12 of the top 26 green occupations are common in the two states. In Indiana, landscaping and groundskeeping workers have the largest share of green-related jobs, accounting for more than 6 percent of all green employment in Indiana (see Table 12). In Michigan, mechanical engineers comprise the greatest share at 7 percent.
Contrary to intuition, occupations that are obviously green, such as environmental scientists and specialists and environmental engineers, are relatively few on the occupation ledger. This may be explained by the fact that these positions are taken up by more highly
educated and specialized individuals and represent a tiny fraction of the overall workforce.
5.1.3 Other Survey ResultsExpectations of employers regarding current and future green-related workforce needs are critical elements to understanding the development of the green economy. Accordingly, the survey asked employers about expected future job gains in green occupations and the potential need for formal versus informal training for existing and new green workers.
With the possible exception of groundskeeping workers and construction laborers, employers expect that occupations with special requirements—such as engineering degrees or heating, ventilation and air conditioning (HVAC) certifications—are poised for growth. Employer expectations in both states appear to be similar.
NAICS Industry
IN Direct Green Jobs
Indiana Percent*
MI Direct Green Jobs
Michigan Percent*
111 Crop Production 781 13.1% 3,503 22.0%
221 Utilities 295 1.7% 2,608 12.7%
236 Construction of Buildings 1,872 6.1% 3,571 10.4%
238 Specialty Trade Contractors 10,411 13.6% 9,825 9.6%
321 Wood Product Manufacturing 592 5.2% 982 10.2%
325 Chemical Manufacturing 1,947 6.6% 1,024 3.7%
332 Fabricated Metal Product Manufacturing 1,350 3.0% 1,995 2.5%
333 Machinery Manufacturing 687 1.9% 1,664 2.4%
336 Transportation Equipment Manufacturing 1,709 2.2% 25,780 14.6%
423 Merchant Wholesalers, Durable Goods 4,483 6.4% 2,793 2.9%
541 Professional, Scientific, and Technical Services 5,322 5.6% 22,178 9.2%
561 Administrative and Support Services 5,826 4.4% 2,698 1.0%
811 Repair and Maintenance 919 3.6% 656 1.8%
921 General Government Administration** 704 0.8% n/a n/a
924 Administration of Environmental Quality Programs** 2,809 62.8% n/a n/a§ Industries both prominent and common to both Michigan and Indiana. Because there were large differences in the number of direct green jobs by industry between the two states, the table presents industries sorted on NAICS code and not the total number of green jobs in each industry.
* Percentage is based on the number of direct green jobs in the industry divided by total employment in that industry.
** Indiana included public establishments, for example state agencies, whereas Michigan did not.
Source: Indiana and Michigan Green Job Surveys
Table 11: Select Industries§ Generating Direct Green Jobs: Direct Green Jobs by Industry and Green Jobs as a Percent of Industry Employment
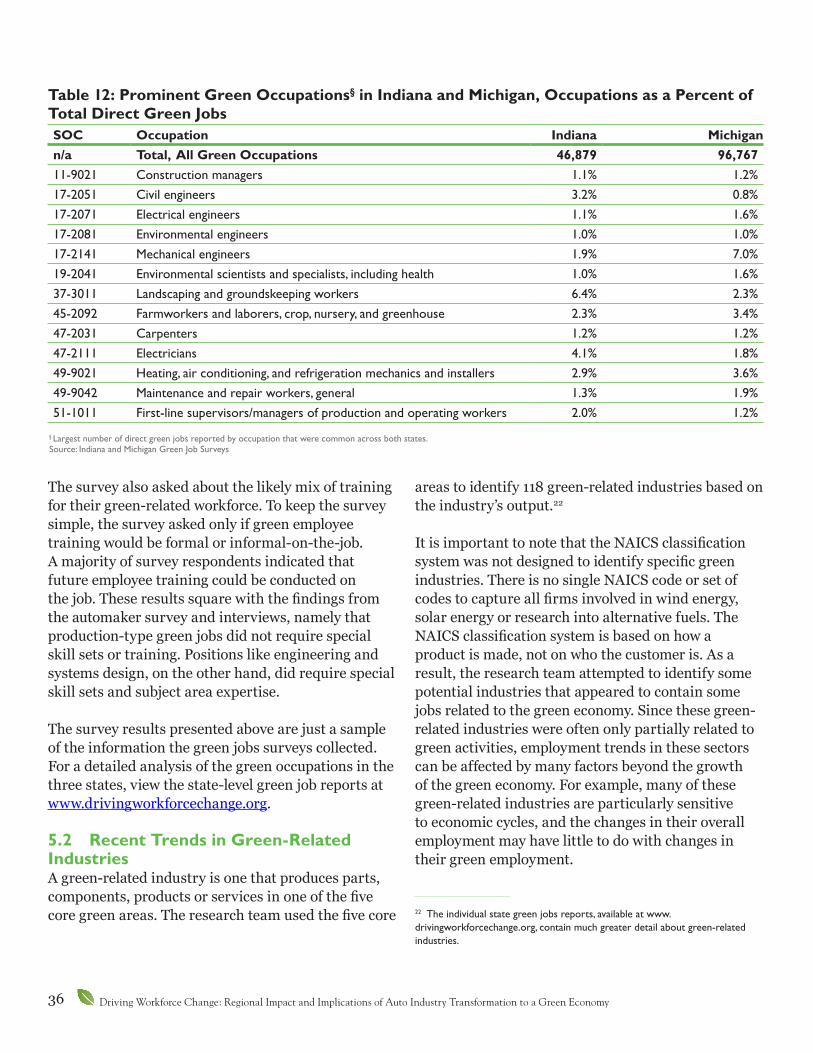
36 Driving Workforce Change: Regional Impact and Implications of Auto Industry Transformation to a Green Economy
The survey also asked about the likely mix of training for their green-related workforce. To keep the survey simple, the survey asked only if green employee training would be formal or informal-on-the-job. A majority of survey respondents indicated that future employee training could be conducted on the job. These results square with the findings from the automaker survey and interviews, namely that production-type green jobs did not require special skill sets or training. Positions like engineering and systems design, on the other hand, did require special skill sets and subject area expertise.
The survey results presented above are just a sample of the information the green jobs surveys collected. For a detailed analysis of the green occupations in the three states, view the state-level green job reports at www.drivingworkforcechange.org.
5.2 Recent Trends in Green-Related IndustriesA green-related industry is one that produces parts, components, products or services in one of the five core green areas. The research team used the five core
areas to identify 118 green-related industries based on the industry’s output.22
It is important to note that the NAICS classification system was not designed to identify specific green industries. There is no single NAICS code or set of codes to capture all firms involved in wind energy, solar energy or research into alternative fuels. The NAICS classification system is based on how a product is made, not on who the customer is. As a result, the research team attempted to identify some potential industries that appeared to contain some jobs related to the green economy. Since these green-related industries were often only partially related to green activities, employment trends in these sectors can be affected by many factors beyond the growth of the green economy. For example, many of these green-related industries are particularly sensitive to economic cycles, and the changes in their overall employment may have little to do with changes in their green employment.
22 The individual state green jobs reports, available at www.drivingworkforcechange.org, contain much greater detail about green-related industries.
SOC Occupation Indiana Michigan n/a Total, All Green Occupations 46,879 96,767 11-9021 Construction managers 1.1% 1.2%17-2051 Civil engineers 3.2% 0.8%17-2071 Electrical engineers 1.1% 1.6%17-2081 Environmental engineers 1.0% 1.0%17-2141 Mechanical engineers 1.9% 7.0%19-2041 Environmental scientists and specialists, including health 1.0% 1.6%37-3011 Landscaping and groundskeeping workers 6.4% 2.3%45-2092 Farmworkers and laborers, crop, nursery, and greenhouse 2.3% 3.4%47-2031 Carpenters 1.2% 1.2%47-2111 Electricians 4.1% 1.8%49-9021 Heating, air conditioning, and refrigeration mechanics and installers 2.9% 3.6%49-9042 Maintenance and repair workers, general 1.3% 1.9%51-1011 First-line supervisors/managers of production and operating workers 2.0% 1.2%
Table 12: Prominent Green Occupations§ in Indiana and Michigan, Occupations as a Percent of Total Direct Green Jobs
§ Largest number of direct green jobs reported by occupation that were common across both states. Source: Indiana and Michigan Green Job Surveys
37
5.2.1 Job Change in Green-Related IndustriesOver the last few years, the tri-state region has hemorrhaged jobs in manufacturing, and many green-related manufacturing industries were not immune to these job cuts. That said, in Michigan, employment in agriculture and natural resource and the miscellaneous green manufacturing segments declined more slowly than total jobs. Michigan’s bright spot was renewable energy production, recording a growth rate of 7.1 percent from 2004 to 2008, while total jobs fell by 5.4 percent in the state.
In Indiana, by way of contrast, overall employment fell 5.9 percent from 2005 to 2009, but green employment losses registered 17.3 percent over the same period. These losses, however, merely reflect that many green-related jobs are in the manufacturing and construction sectors, where the Great Recession hit hardest. In both Indiana and Michigan, a majority of green job losses stemmed from the two core areas of clean transportation and fuels and increasing energy efficiency. Given that there is a high concentration of manufacturing and construction industries in these two green areas, one can conclude that green-related industry jobs in Indiana and Michigan appear to be more sensitive to economic cycles.
5.2.2 Wages in Green-Related IndustriesGreen-related industries can be measured not only in terms of their direct employment, but also in terms of the compensation these jobs garner. Assuming a competitive labor market and wage structure, industry wages can provide insight into future demand for workers. In terms of worker disposable income and spending, industry wages also gauge the size of the economic footprint an industry has on its regional economy.
Here the news about green jobs is more upbeat. In Michigan, the average payroll per worker for the 10 largest detailed green-related industries greatly exceeds the state average. All but one of Indiana’s top 10 green-related industries exceeded the state average for payroll per worker. This is an important indicator. These dominant industries, which have greater than average union representation, tend to pay well-above average wages.
5.3 Occupational Prospects for the FutureWhile the green jobs surveys asked employers about their green jobs hiring expectations in the next two years, the research team needed a richer and more complete data set to assess the future of green and growing jobs. To analyze current job opportunities in the green economy, the research team used the Help Wanted Online (HWOL) database from The Conference Board to get a snapshot of current hiring activity in the tri-state region. In the fourth quarter of 2010, HWOL recorded 620,102 postings in the tri-state region. These postings represented a wide range of occupations in the three states and provided researchers with a sense of what occupations were currently in demand. The research team used BLS and O*NET data to assess long-term occupational prospects in the tri-state region.
The definition of green jobs used in the surveys was developed for the audience who were completing the survey, namely human resource or operations managers. In contrast, the classification of green jobs in this section and subsequent chapters relies upon the “official” slate of green occupations from O*NET. O*NET identified 202 green occupations and categorized them based on the extent of the greening:23
• Green New and Emerging: The output of the green economy and green technologies is sufficient to create the need for unique work and worker requirements. These are entirely novel occupations arising from the green economy, but could be an outgrowth of an existing occupation.
• Green Enhanced Skills: The requirements of green economic output and technologies change an existing occupation. This effect may or may not result in an increase in employment demand for the occupation. For example, architecture now requires increased knowledge about energy
23 Out of 1,110 occupations in the 2010 vintage of the standard occupational code, 202 are defined as green by O*NET. See Erich C. Dierdorff, Jennifer J. Norton, Donald W. Drewes, Christina M. Kroustalis, David Rivkin, and Phil Lewis, “Greening of the World of Work: Implications for O*NET-SOC and New and Emerging Occupations,” February 2009, www.onetcenter.org/reports/Green.html.
38 Driving Workforce Change: Regional Impact and Implications of Auto Industry Transformation to a Green Economy
efficient materials and construction, as well as the capability to integrate green technology into the aesthetic design of buildings. The essential purpose of the occupation remains the same, but tasks, skills,24 knowledge and external elements (such as credentials) have expanded.
• Green Increased Demand: Expanding green economic output simply increases the employment demand for an existing occupation. It does not entail significant changes in the work and worker requirements. The work context may change, but the tasks themselves do not. An example is the increased demand for heating and ventilation installers that replace the energy efficient furnaces and air conditioning units more frequently because these units are not as durable as the older furnaces.
While O*NET categorizes green economic activities into 12 industry sectors, the research team boiled this down to five sectors. In order to maintain the focus on the automotive sector, the research team divided the O*NET manufacturing sector into two parts: automotive and non-automotive manufacturing. Most of the remaining 11 O*NET green sectors fit well into two industry groupings: energy-related and environmental services.25 The miscellaneous industry group is a hodgepodge of O*NET industries that did not fit elsewhere, including green construction and transportation.
The tables in the following sections present the current number of postings (using the HWOL), the projected occupation growth from 2008 to 2018, the relative strength of current demand for the occupation, the occupation’s 2009 mean wage, as well as the industry groups that will be hiring these occupations. Additional tables that explore the three
24 In contrast to the common vernacular, O*NET uses the term skills in a more narrow and technical sense. O*NET skills are more akin to the capacity to perform a type of task, in contrast to knowledge in a subject area or a credential that may also be required for an occupation.25 Energy-related includes: renewable energy generation, energy efficiency, energy trading, and energy and carbon capture and storage. Environmental services include: research, design, and consulting services, environment protection, agriculture and forestry, recycling and waste reduction, and governmental and regulatory administration.
O*NET green categories individually are available in Appendix E.
5.3.1 Green Automotive OccupationsWhile several definitions of the auto sector exist, this section uses the list of 43 occupations directly related to the automotive industry from the Center for Automotive Research (CAR) because CAR has direct contact and experience with the industry and is attuned to many of the finer details associated with hiring practices.
Table 13 presents the top 15 green occupation employment opportunities in the tri-state region’s auto industry as of the fourth quarter of 2010. To understand the strength of the number of postings for each occupation, the research team calculated the ratio of postings to the average 2009 employment.26 For example, in the fourth quarter of 2010, there was one posting for every four electrical engineering jobs. This indicates relatively high demand for the occupation.
Industrial engineers rank first among all green auto jobs in the tri-state region and command over two-fifths (44.4 percent) of the postings in the green increased demand category. According to the BLS projections, the industrial engineer position will grow 14 percent between 2008 and 2018. However, according to CAR’s research, automakers and their suppliers rarely, if ever, mention this occupation as having growth potential. The reason is that automakers expect all their engineers to have industrial engineering skills as a foundation for the other specialized skill sets required by the industry—much like how all engineers are expected to have a high school diploma. Moreover, the BLS projections reflect demand for occupations across all industries, not just auto. It may well be that automaker demand for industrial engineers will be flat, while job demand for this occupation will occur in other industries.
26 For example, if HWOL reports an occupation in Indiana had 25 postings and the total number of workers in that occupation is 100, the postings to employment ratio is 1:4. Thus, the number of postings for electrical engineers is a large proportion of all electrical engineers working in the state in 2009, in contrast to the postings for machinists which represent a small proportion of those working in this occupation.

39
Green auto occupations can be categorized using the O*NET method, and the top five occupations in green enhanced skills and green increased demand are presented in Appendix E. Of the green enhanced skills occupations that will require expanded knowledge, skills, expertise and/or credentials of their workers, mechanical engineers dominate, accounting for 32.2 percent of all job postings in this category. One might note that for the O*NET category of green new and emerging, there are no auto sector occupations (as currently defined by CAR) that register. This reflects, primarily, that data collection, processing and demand projections for these types of occupations is lagging.27
27 O*NET classifies all green new and emerging occupations using an eight-digit SOC code for which occupational projections are not yet available.
The distribution of demand by occupation differed across the three states, according to HWOL postings. Ohio had the most green auto postings (20,004), followed by Michigan (17,210) and Indiana (8,018). In all three states, industrial engineers is the most sought-after occupation. After that, however, the state demand patterns diverge. In Michigan, mechanical engineers occupy the number two spot. In both Indiana and Ohio, first-line supervisors of production workers were in greater relative demand than mechanical engineers. The differences in the occupational opportunities in the states—for example, more than twice the percentage of postings for electronics engineers in Indiana relative to Ohio—highlight the need to break down the demand for skill sets and training by state, and even sub-state,
Rank Description
HWOL Green
Postings1
10-Year Expected Growth2
Postings-to-Employment
Ratio3Mean
Wage4
1 Industrial Engineers 10,960 14.2% 1 : 3 $75,476
2 Mechanical Engineers 6,626 6.0% 1 : 7 $78,759
3 First-Line Supervisors/Managers of Production and Operating Workers 6,525 -5.2% 1 : 12 $55,964
4 Maintenance and Repair Workers, General 5,004 10.9% 1 : 25 $36,712
5 Electrical Engineers 2,901 1.7% 1 : 4 $76,464
6 First-Line Supervisors/Managers of Mechanics, Installers, and Repairers 2,677 4.3% 1 : 15 $59,704
7 Machinists 2,307 -4.6% 1 : 28 $38,823
8 Computer-Controlled Machine Tool Operators, Metal and Plastic 1,713 6.6% 1 : 16 $35,287
9 Electronics Engineers, Except Computer 1,444 0.3% 1 : 6 $81,587
10 Inspectors, Testers, Sorters, Samplers, and Weighers 1,368 -3.6% 1 : 43 $35,354
11 Industrial Machinery Mechanics 878 7.3% 1 : 37 $48,450
12 Electrical and Electronic Equipment Assemblers 856 -14.7% 1 : 16 $28,369
13 Industrial Engineering Technicians 801 6.6% 1 : 14 $48,006
14 Cutting, Punching, and Press Machine Setters, Operators, and Tenders, Metal and Plastic 534 -14.1% 1 : 80 $32,306
15 Team Assemblers 330 0.0% 1 : 467 $31,731
Table 13: Tri-State Top 15 Green Auto Occupation§ Postings and Expected Job Change to 2018
§ Auto occupations as defined by CAR. 1 Source: HWOL, Quarter 4, 2010, N= 620,102; All green jobs, N=131,248; Green auto, N=45,232. 2 Source: BLS; Projections from 2008 to 2018 are for the parent, six-digit SOC. HWOL and O*NET now report occupations at the eight-digit SOC level. As a result, those occupations listed in this table are at the more detailed, eight-digit SOC while the projection figures are for the parent six-digit SOC. Hence the projection is for a group of similar occupations and not the specific occupation listed in the table. 3 Source: IBRC using HWOL and BLS/OES data 4 Source: 2009 data from BLS. Mean wage calculated for tri-state using a weighted average.
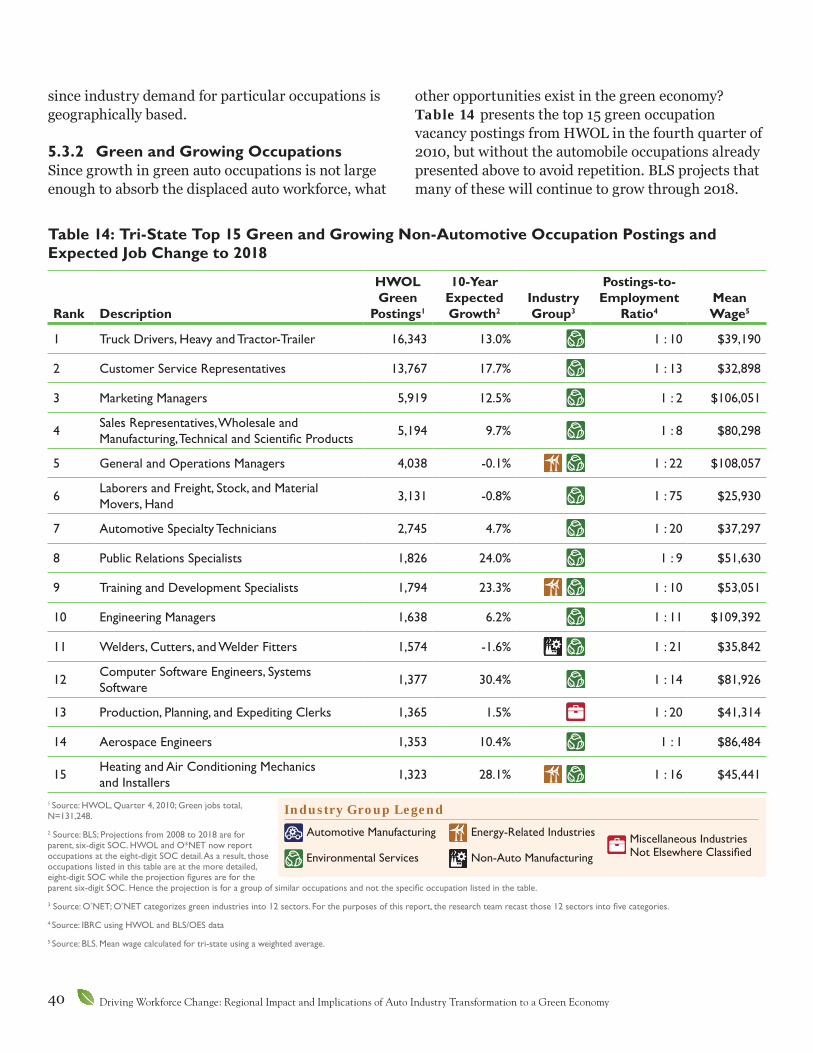
40 Driving Workforce Change: Regional Impact and Implications of Auto Industry Transformation to a Green Economy
since industry demand for particular occupations is geographically based.
5.3.2 Green and Growing OccupationsSince growth in green auto occupations is not large enough to absorb the displaced auto workforce, what
other opportunities exist in the green economy? Table 14 presents the top 15 green occupation vacancy postings from HWOL in the fourth quarter of 2010, but without the automobile occupations already presented above to avoid repetition. BLS projects that many of these will continue to grow through 2018.
Table 14: Tri-State Top 15 Green and Growing Non-Automotive Occupation Postings and Expected Job Change to 2018
Rank Description
HWOL Green
Postings1
10-Year Expected Growth2
Industry Group3
Postings-to-Employment
Ratio4Mean Wage5
1 Truck Drivers, Heavy and Tractor-Trailer 16,343 13.0% 1 : 10 $39,190
2 Customer Service Representatives 13,767 17.7% 1 : 13 $32,898
3 Marketing Managers 5,919 12.5% 1 : 2 $106,051
4 Sales Representatives, Wholesale and Manufacturing, Technical and Scientific Products 5,194 9.7% 1 : 8 $80,298
5 General and Operations Managers 4,038 -0.1% 1 : 22 $108,057
6 Laborers and Freight, Stock, and Material Movers, Hand 3,131 -0.8% 1 : 75 $25,930
7 Automotive Specialty Technicians 2,745 4.7% 1 : 20 $37,297
8 Public Relations Specialists 1,826 24.0% 1 : 9 $51,630
9 Training and Development Specialists 1,794 23.3% 1 : 10 $53,051
10 Engineering Managers 1,638 6.2% 1 : 11 $109,392
11 Welders, Cutters, and Welder Fitters 1,574 -1.6% 1 : 21 $35,842
12 Computer Software Engineers, Systems Software 1,377 30.4% 1 : 14 $81,926
13 Production, Planning, and Expediting Clerks 1,365 1.5% 1 : 20 $41,314
14 Aerospace Engineers 1,353 10.4% 1 : 1 $86,484
15 Heating and Air Conditioning Mechanics and Installers 1,323 28.1% 1 : 16 $45,441
1 Source: HWOL, Quarter 4, 2010; Green jobs total, N=131,248.
2 Source: BLS; Projections from 2008 to 2018 are for parent, six-digit SOC. HWOL and O*NET now report occupations at the eight-digit SOC detail. As a result, those occupations listed in this table are at the more detailed, eight-digit SOC while the projection figures are for the parent six-digit SOC. Hence the projection is for a group of similar occupations and not the specific occupation listed in the table.
3 Source: O*NET; O*NET categorizes green industries into 12 sectors. For the purposes of this report, the research team recast those 12 sectors into five categories.
4 Source: IBRC using HWOL and BLS/OES data
5 Source: BLS. Mean wage calculated for tri-state using a weighted average.
Industry Group Legend
Automotive Manufacturing
Environmental Services
Energy-Related Industries
Non-Auto Manufacturing
Miscellaneous Industries Not Elsewhere Classified
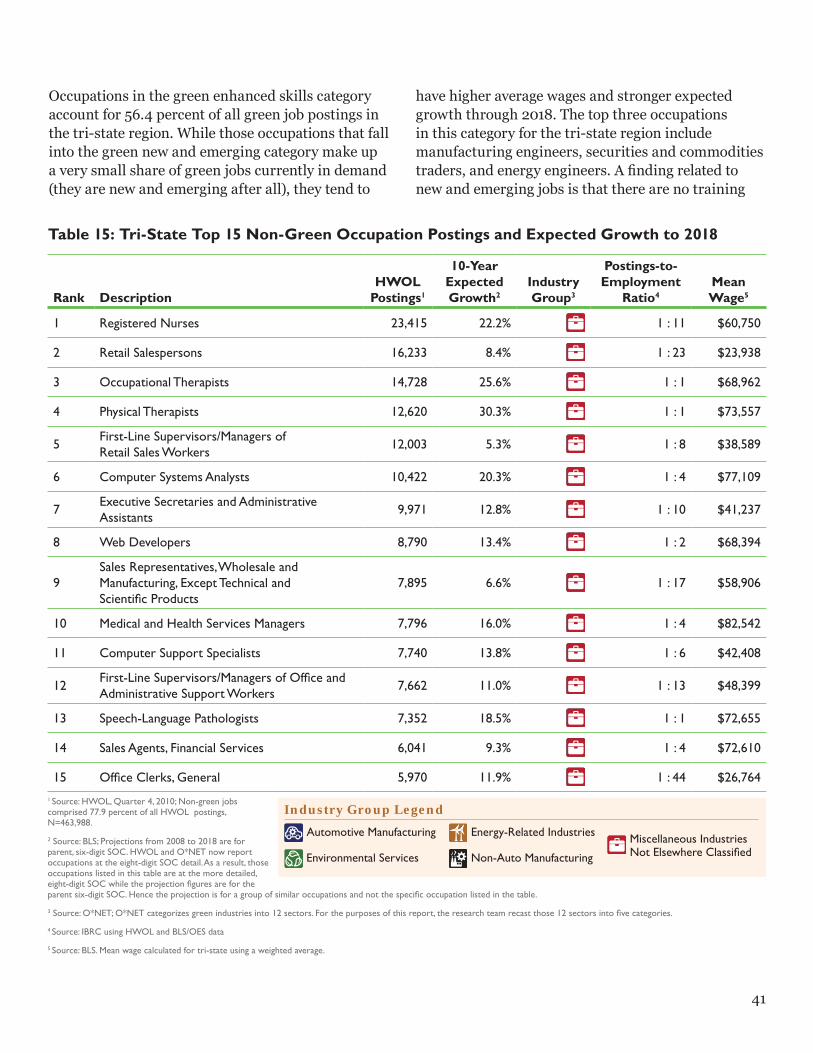
41
Occupations in the green enhanced skills category account for 56.4 percent of all green job postings in the tri-state region. While those occupations that fall into the green new and emerging category make up a very small share of green jobs currently in demand (they are new and emerging after all), they tend to
have higher average wages and stronger expected growth through 2018. The top three occupations in this category for the tri-state region include manufacturing engineers, securities and commodities traders, and energy engineers. A finding related to new and emerging jobs is that there are no training
Table 15: Tri-State Top 15 Non-Green Occupation Postings and Expected Growth to 2018
Rank DescriptionHWOL
Postings1
10-Year Expected Growth2
Industry Group3
Postings-to-Employment
Ratio4Mean Wage5
1 Registered Nurses 23,415 22.2% 1 : 11 $60,750
2 Retail Salespersons 16,233 8.4% 1 : 23 $23,938
3 Occupational Therapists 14,728 25.6% 1 : 1 $68,962
4 Physical Therapists 12,620 30.3% 1 : 1 $73,557
5 First-Line Supervisors/Managers of Retail Sales Workers 12,003 5.3% 1 : 8 $38,589
6 Computer Systems Analysts 10,422 20.3% 1 : 4 $77,109
7 Executive Secretaries and Administrative Assistants 9,971 12.8% 1 : 10 $41,237
8 Web Developers 8,790 13.4% 1 : 2 $68,394
9Sales Representatives, Wholesale and Manufacturing, Except Technical and Scientific Products
7,895 6.6% 1 : 17 $58,906
10 Medical and Health Services Managers 7,796 16.0% 1 : 4 $82,542
11 Computer Support Specialists 7,740 13.8% 1 : 6 $42,408
12 First-Line Supervisors/Managers of Office and Administrative Support Workers 7,662 11.0% 1 : 13 $48,399
13 Speech-Language Pathologists 7,352 18.5% 1 : 1 $72,655
14 Sales Agents, Financial Services 6,041 9.3% 1 : 4 $72,610
15 Office Clerks, General 5,970 11.9% 1 : 44 $26,764
Industry Group Legend
Automotive Manufacturing
Environmental Services
Energy-Related Industries
Non-Auto Manufacturing
Miscellaneous Industries Not Elsewhere Classified
1 Source: HWOL, Quarter 4, 2010; Non-green jobs comprised 77.9 percent of all HWOL postings, N=463,988.
2 Source: BLS; Projections from 2008 to 2018 are for parent, six-digit SOC. HWOL and O*NET now report occupations at the eight-digit SOC detail. As a result, those occupations listed in this table are at the more detailed, eight-digit SOC while the projection figures are for the parent six-digit SOC. Hence the projection is for a group of similar occupations and not the specific occupation listed in the table.
3 Source: O*NET; O*NET categorizes green industries into 12 sectors. For the purposes of this report, the research team recast those 12 sectors into five categories.
4 Source: IBRC using HWOL and BLS/OES data
5 Source: BLS. Mean wage calculated for tri-state using a weighted average.

42 Driving Workforce Change: Regional Impact and Implications of Auto Industry Transformation to a Green Economy
programs in the tri-state region associated with these opportunities (see Chapter 7).
5.3.3 Other Growing OccupationsEven though many career opportunities exist in the green economy, the demand for non-green jobs (as evidenced by the more favorable postings-to-employment ratios in this section) indicate that non-green jobs should also be explored as career alternatives for the displaced auto workforce.
Table 15 presents the region’s top 15 non-green occupation job vacancy postings from HWOL in the fourth quarter of 2010. The top 15 occupations
account for more than 25 percent of all non-green postings. Medical and health-related occupations dominate the list. None of the non-green occupations that top the list are in manufacturing.
Whether one is a new entrant to the labor force or a worker affected by the Great Recession and wishing to transition to another occupation, the process of winnowing down the hundreds of occupations into a manageable and realistic set of target occupations can be daunting. The next two chapters present new resources for workers in transition to find those target occupations.

43
6. Career Pathway Clusters
The previous chapters presented the employment situation in the tri-state region, as well as the occupations that are in demand
today and those with the brightest prospects for the future. The question then becomes, how does one transition to the occupations with the brightest prospects? How can a dislocated worker plot a path to a new job that uses the skill set he or she has developed other the years?28 The career pathway cluster tool presented in this chapter is the first step in addressing these questions.
There are three key elements in this chapter. First, the technique used to group occupations into pathway clusters is groundbreaking. Pathway clusters are “a first” because they are not organized based upon industries (such as health care) or functions (like business administration). Second, while auto occupations are concentrated in the production, construction and engineering cluster, there are dozens of occupations in other industries that may make good target occupations for a displaced worker. Third, green occupations are well distributed throughout the clusters, except for the health, social and personal services cluster.
6.1 What Are Career Pathway Clusters?The operating principle for the pathway cluster concept is that workers will seek, and be most productive in, occupations that are most similar to their current or former jobs. Based on O*NET’s occupation description categories,29 occupations are grouped into a pathway cluster based on similarities in worker requirements, worker traits
28 Except for references to O*NET skills, “skill set” is defined in the broad sense. It is shorthand for all the requirements for an occupation. 29 Data for this analysis come from the Occupational Information Network—O*NET—which is supported by the U.S. Department of Labor’s Employment and Training Administration. More information is available at http://www.onetcenter.org/overview.html. This analysis does not use the new 2010 SOC system because, at the time of the analysis, O*NET data were still based on the 2000 SOC system.
and occupational requirements.30 Because pathway clusters are constructed based on occupational and worker similarities, transitions from one pathway cluster to a different cluster would be relatively more difficult.
Advantages of pathway clusters over other career transition resources is that the user is provided a set of many possible target occupations, rather than one at a time. Combined with the skill-gap analysis (in the next chapter), a worker in transition can judge the relative ease and training required to move from one occupation to another. Also, the pathway cluster approach uses all occupation description categories of O*NET and not just a subset.
In order to create pathway clusters, the research team analyzed around 500 dimensions and characteristics for each occupation as published by O*NET. The research team compressed these into three O*NET-type31 categories to develop pathway clusters:
30 This operating principle is similar to the TORQ system, which is a powerful tool that provides a compatibility score for comparing one occupation with another (http://www.torqworks.com/products). The TORQ system pulls in every detailed aspect that define the knowledge, skills and abilities (KSAs) of an occupation to determine whether two occupations are a good match. However, the pathway cluster approach uses all occupation description categories of O*NET (of which KSAs are a subset).31 Not all terms are directly taken from O*NET; many O*NET terms have been translated to appeal to a general audience. Occupational interests, for example, are based on the system developed by John L. Holland for matching vocational roles with personality types. For complete information, see John. L. Holland, Making Vocational Choices: A Theory of Vocational Personalities and Work Environments (Odessa, FL: Psychological Assessment Resources, 1997). For more information about this and other aspects of the methodology, please see http://www.drivingworkforcechange.org/reports/careerpathways.pdf.
Workers will seek, and be most productive in, occupations that are most similar to their current or former jobs.
44 Driving Workforce Change: Regional Impact and Implications of Auto Industry Transformation to a Green Economy
1. Requirements of the worker (R): Worker requirements that can be gained by the worker through study or training
• Knowledge: Sets of principles and facts in a subject area (aka knowledge requirement)
• Cross-Functional Skills: The capacity to perform the activities across different jobs
2. Traits of the worker (T): The internal or personal traits of workers who are drawn to— or perform well in—the occupation
• Interests: Preferences for the type of work and work environment based on personality types
• Work Values: Work duties, outcomes and environment that are personally satisfying
• Work Styles: Personal characteristics that influence performance
3. Occupational requirements (O): The requirements for the job, such as work activities (e.g., lifting heavy objects or gathering data)
• Generalized Work Activities: Type and intensity of personal interactions and mental processes like problem solving and information gathering
• Work Context: Physical activities and social factors that influence the nature of work
The research team analyzed three aspects of O*NET variables—correlation, spread and skew—to simplify and compress the O*NET occupation characteristics into a small number of intuitive and meaningful occupation pathway clusters that can best differentiate occupations. Compressing the O*NET data—removing characteristics that overlap and realigning the remaining occupation characteristics—means that pathway cluster definitions will not be
one-to-one with O*NET, but the general thrust of the O*NET method remains intact.
The research team grouped the 2009 vintage of O*NET occupations into clusters by comparing the level of similarity (or dissimilarity) across occupations to form patterns. Cluster formation, which depends heavily on statistics and mathematical analysis, should create intuitive patterns, for example, placing engineering and physics in close proximity. If the clusters were not intuitive, the iterative process of forming and evaluating multiple sets of clusters started over again until all occupations were grouped into clusters that account for their similarities in worker requirements, worker traits and occupational requirements.
6.2 The Seven Pathway ClustersTable 16 shows how the 731 occupations were grouped among seven pathway clusters. Occupations were fairly evenly divided among these seven clusters, except for the particularly large production, construction and engineering “super cluster.” This cluster was further subdivided into 1) engineering and applied technology, 2) construction and extraction, equipment operation, and repair, and 3) design and production.
It is not surprising that the concentration of auto occupations in the production, construction and engineering cluster is high. For autoworkers looking for work within their cluster, it should be encouraging to know that they have options outside auto; 80 percent of the occupations in that super cluster are not distinctively in auto manufacturing.
As Table 16 shows, green occupations are fairly well distributed across clusters, with the exception of the health, social and personal services cluster. Any worker, auto or otherwise, interested in making a transition to a green occupation would likely have several green target occupations within their cluster for which they have a relatively similar skill set and worker traits.
Below is a brief summary of each of the pathway clusters that highlights some of the key worker

45
requirements, (R) worker traits (T) and occupational requirements (O) that define each cluster. Discussion of the production, construction and engineering cluster highlights several key characteristics that form the cluster and provides some example occupations since that cluster includes the preponderance of automotive occupations. While at first glance the similarities among many of these occupations may not be obvious, the pattern of high scores among the key characteristics defining each particular cluster explains their fit within each group.
The discussions for the other six clusters are shorter in the interest of brevity, not because they are any less important. The detailed report, available at www.drivingworkforcechange.org/reports/careerpathways.pdf, describes all the clusters in greater detail.
6.2.1 Information and InvestigationDespite cutting across several worker or occupation requirements and many different types of professions, the occupations in this cluster share strong similarities. Across a range of subject areas, these occupations involve collecting and analyzing data. These occupations also share many subject areas, including knowledge in computers, electronics and mathematics. Workers also need elevated capabilities in systems and programming, and they share personal characteristics such as working independently and having a great attention to detail. Workers drawn to these occupations are also personally interested in working with ideas, searching for facts and solving problems.
6.2.2 Health, Social and Personal ServicesThis might be called the “helping cluster.” Two key occupational requirements define this cluster: assisting and caring for others and dealing with unpleasant, angry or physically aggressive people. Workers need knowledge in fields such as medicine and dentistry, psychology, and therapy and counseling. Workers are also characterized by higher levels of social interaction at work and having concern for others and self control. Workers also value building relationships and tend to be drawn to vocations in teaching, networking and communicating. Occupations such as medical doctors, therapists and nursing instructors fit this cluster.
6.2.3 Production, Construction and EngineeringThis super cluster covers a wide range of worker and job characteristics. It is also the cluster with the most manufacturing and auto sector occupations. Similarity of the occupations within this cluster is relatively high compared to the other pathway clusters. This super cluster is dominated by occupations with high scores in six knowledge groups: mechanical; engineering and technology; design; physics; building and
Cluster Name§Number of
OccupationsNumber of
Auto*Number of
Green¤
Information and Investigation 62 0 12Health, Social and Personal Services 90 0 0Production, Construction and Engineering 217 44 55
Engineering and Applied Technology 75 20 26Construction and Extraction, Equipment Operation, and Repair
69 2 15
Design and Production 73 20 14Liberal Arts, Education and Human Relations 86 0 7Business, Sales and Administration 105 2 15Transportation and Public Services 97 0 20Environmental Sciences and Food Service 74 1 15
Table 16: Summary of Career Pathway Clusters
§ Clusters are ordered based on their relative strength, or how “tight” the clusters are. Information and investigation was the strongest cluster. The environmental sciences and food service cluster, in contrast, had the weakest similarity scores. The number of occupations in a cluster does not speak to the cluster’s relative strength or importance.
* Based on the CAR definition of auto-related occupations. It does not include two residual occupation categories “all other” for which there are no job specific data.
¤ Based on the six-digit SOC definitions of the 2009 vintage of O*NET. The 2010 eight-digit O*NET/SOC definitions have considerably more jobs classified as green.
Source: Indiana Department of Workforce Development (IDWD) and the Indiana Business Research Center (IBRC)
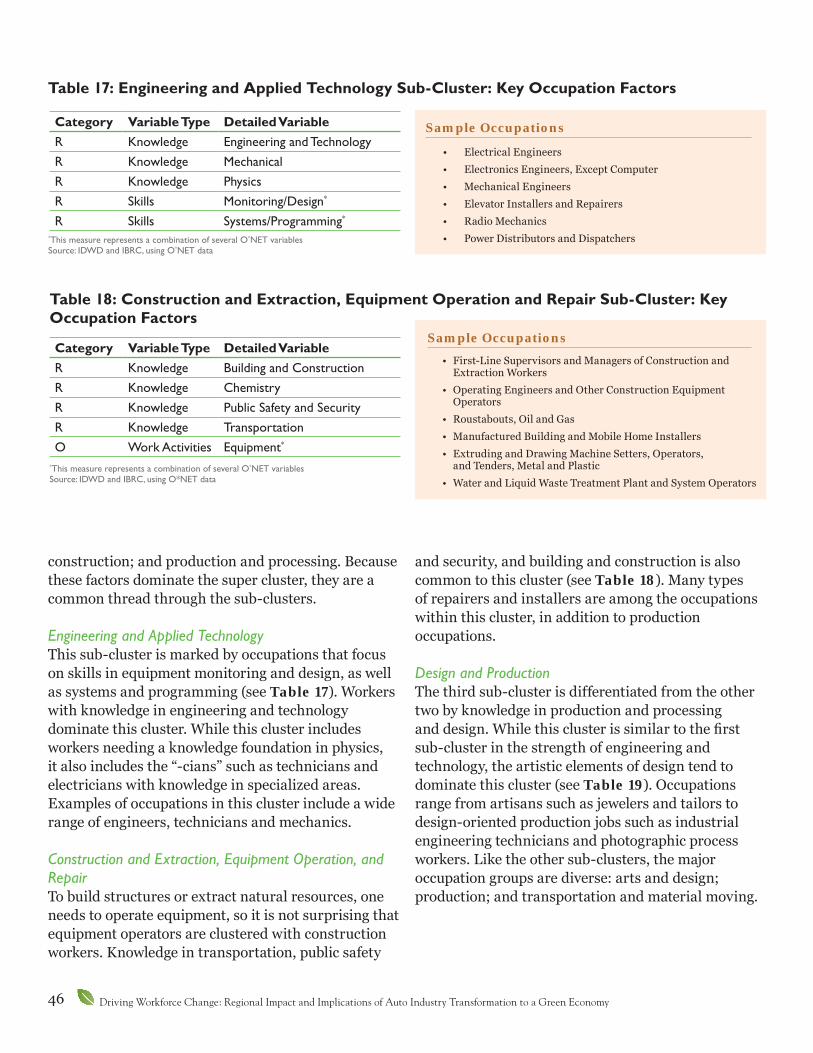
46 Driving Workforce Change: Regional Impact and Implications of Auto Industry Transformation to a Green Economy
construction; and production and processing. Because these factors dominate the super cluster, they are a common thread through the sub-clusters.
Engineering and Applied TechnologyThis sub-cluster is marked by occupations that focus on skills in equipment monitoring and design, as well as systems and programming (see Table 17). Workers with knowledge in engineering and technology dominate this cluster. While this cluster includes workers needing a knowledge foundation in physics, it also includes the “-cians” such as technicians and electricians with knowledge in specialized areas. Examples of occupations in this cluster include a wide range of engineers, technicians and mechanics.
Construction and Extraction, Equipment Operation, and RepairTo build structures or extract natural resources, one needs to operate equipment, so it is not surprising that equipment operators are clustered with construction workers. Knowledge in transportation, public safety
and security, and building and construction is also common to this cluster (see Table 18). Many types of repairers and installers are among the occupations within this cluster, in addition to production occupations.
Design and ProductionThe third sub-cluster is differentiated from the other two by knowledge in production and processing and design. While this cluster is similar to the first sub-cluster in the strength of engineering and technology, the artistic elements of design tend to dominate this cluster (see Table 19). Occupations range from artisans such as jewelers and tailors to design-oriented production jobs such as industrial engineering technicians and photographic process workers. Like the other sub-clusters, the major occupation groups are diverse: arts and design; production; and transportation and material moving.
Category Variable Type Detailed VariableR Knowledge Engineering and TechnologyR Knowledge MechanicalR Knowledge PhysicsR Skills Monitoring/Design*
R Skills Systems/Programming*
Category Variable Type Detailed VariableR Knowledge Building and ConstructionR Knowledge ChemistryR Knowledge Public Safety and SecurityR Knowledge TransportationO Work Activities Equipment*
Table 17: Engineering and Applied Technology Sub-Cluster: Key Occupation Factors
*This measure represents a combination of several O*NET variables Source: IDWD and IBRC, using O*NET data
Table 18: Construction and Extraction, Equipment Operation and Repair Sub-Cluster: Key Occupation Factors
*This measure represents a combination of several O*NET variables Source: IDWD and IBRC, using O*NET data
Sample Occupations
Sample Occupations
• Electrical Engineers
• Electronics Engineers, Except Computer
• Mechanical Engineers
• Elevator Installers and Repairers
• Radio Mechanics
• Power Distributors and Dispatchers
• First-Line Supervisors and Managers of Construction and Extraction Workers
• Operating Engineers and Other Construction Equipment Operators
• Roustabouts, Oil and Gas
• Manufactured Building and Mobile Home Installers
• Extruding and Drawing Machine Setters, Operators, and Tenders, Metal and Plastic
• Water and Liquid Waste Treatment Plant and System Operators
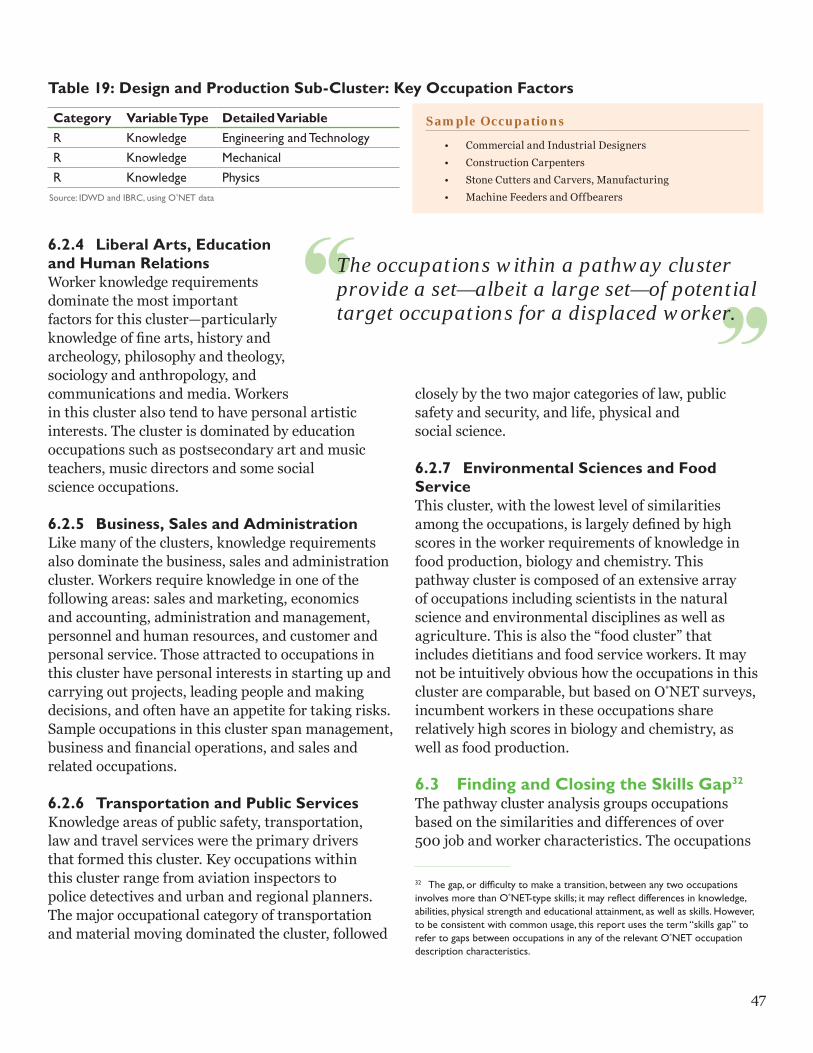
47
6.2.4 Liberal Arts, Education and Human RelationsWorker knowledge requirements dominate the most important factors for this cluster—particularly knowledge of fine arts, history and archeology, philosophy and theology, sociology and anthropology, and communications and media. Workers in this cluster also tend to have personal artistic interests. The cluster is dominated by education occupations such as postsecondary art and music teachers, music directors and some social science occupations.
6.2.5 Business, Sales and AdministrationLike many of the clusters, knowledge requirements also dominate the business, sales and administration cluster. Workers require knowledge in one of the following areas: sales and marketing, economics and accounting, administration and management, personnel and human resources, and customer and personal service. Those attracted to occupations in this cluster have personal interests in starting up and carrying out projects, leading people and making decisions, and often have an appetite for taking risks. Sample occupations in this cluster span management, business and financial operations, and sales and related occupations.
6.2.6 Transportation and Public ServicesKnowledge areas of public safety, transportation, law and travel services were the primary drivers that formed this cluster. Key occupations within this cluster range from aviation inspectors to police detectives and urban and regional planners. The major occupational category of transportation and material moving dominated the cluster, followed
closely by the two major categories of law, public safety and security, and life, physical and social science.
6.2.7 Environmental Sciences and Food ServiceThis cluster, with the lowest level of similarities among the occupations, is largely defined by high scores in the worker requirements of knowledge in food production, biology and chemistry. This pathway cluster is composed of an extensive array of occupations including scientists in the natural science and environmental disciplines as well as agriculture. This is also the “food cluster” that includes dietitians and food service workers. It may not be intuitively obvious how the occupations in this cluster are comparable, but based on O*NET surveys, incumbent workers in these occupations share relatively high scores in biology and chemistry, as well as food production.
6.3 Finding and Closing the Skills Gap32
The pathway cluster analysis groups occupations based on the similarities and differences of over 500 job and worker characteristics. The occupations
32 The gap, or difficulty to make a transition, between any two occupations involves more than O*NET-type skills; it may reflect differences in knowledge, abilities, physical strength and educational attainment, as well as skills. However, to be consistent with common usage, this report uses the term “skills gap” to refer to gaps between occupations in any of the relevant O*NET occupation description characteristics.
Category Variable Type Detailed VariableR Knowledge Engineering and TechnologyR Knowledge MechanicalR Knowledge Physics
Table 19: Design and Production Sub-Cluster: Key Occupation Factors
Source: IDWD and IBRC, using O*NET data
Sample Occupations
• Commercial and Industrial Designers
• Construction Carpenters
• Stone Cutters and Carvers, Manufacturing
• Machine Feeders and Offbearers
The occupations within a pathway cluster provide a set—albeit a large set—of potential target occupations for a displaced worker.

48 Driving Workforce Change: Regional Impact and Implications of Auto Industry Transformation to a Green Economy
Source: Indiana Business Research Center
within a pathway cluster provide a set—albeit a large set—of potential target occupations for a displaced worker. Figure 6 is a picture of this first step, namely, organizing occupations into groups based on their similarities across a wide range of job and worker requirements. Thus, the Driving Change project has not only identified the displaced workers and the green and growing occupations of promise, but the research team has developed a resource that can identify occupations that are relatively similar to the original occupation of the displaced worker. The next step for the pathway cluster work then, is to provide meaningful, user-friendly instruments to measure the skills gap between occupations and to assess the relative ease or difficulty of moving from one occupation to another.
Figure 6: Selected Occupations in the Production, Construction and Engineering Cluster
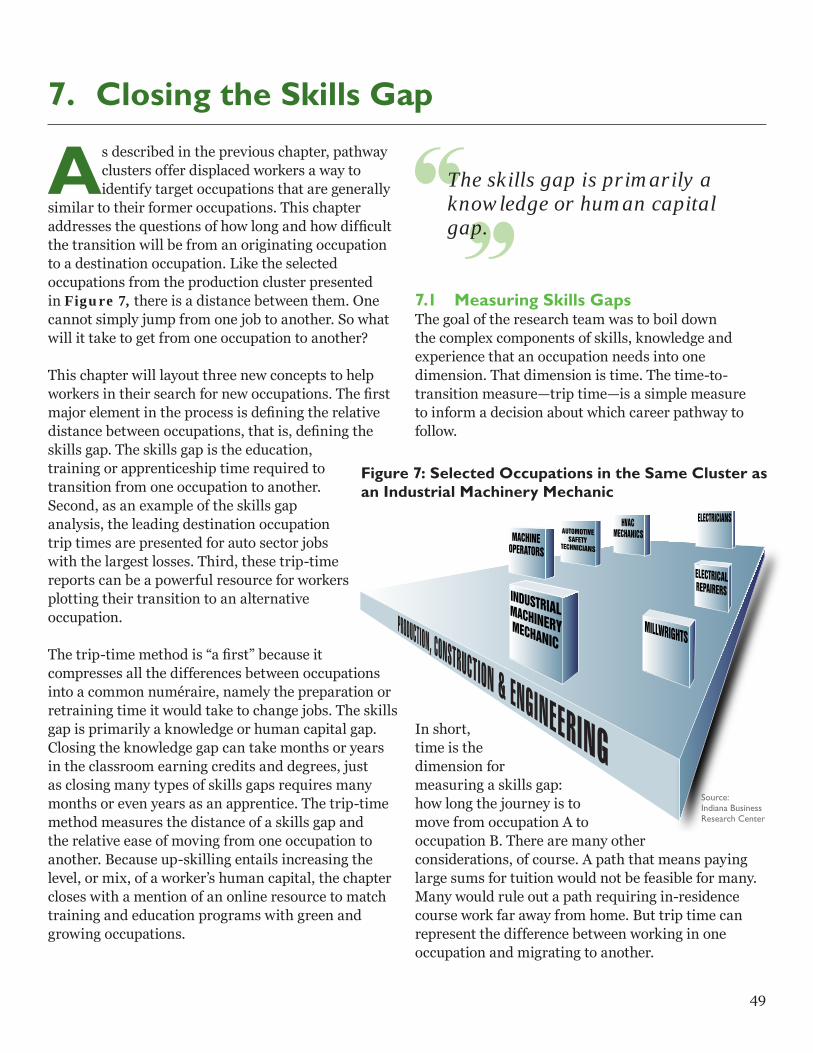
49
7. Closing the Skills Gap
As described in the previous chapter, pathway clusters offer displaced workers a way to identify target occupations that are generally
similar to their former occupations. This chapter addresses the questions of how long and how difficult the transition will be from an originating occupation to a destination occupation. Like the selected occupations from the production cluster presented in Figure 7, there is a distance between them. One cannot simply jump from one job to another. So what will it take to get from one occupation to another?
This chapter will layout three new concepts to help workers in their search for new occupations. The first major element in the process is defining the relative distance between occupations, that is, defining the skills gap. The skills gap is the education, training or apprenticeship time required to transition from one occupation to another. Second, as an example of the skills gap analysis, the leading destination occupation trip times are presented for auto sector jobs with the largest losses. Third, these trip-time reports can be a powerful resource for workers plotting their transition to an alternative occupation.
The trip-time method is “a first” because it compresses all the differences between occupations into a common numéraire, namely the preparation or retraining time it would take to change jobs. The skills gap is primarily a knowledge or human capital gap. Closing the knowledge gap can take months or years in the classroom earning credits and degrees, just as closing many types of skills gaps requires many months or even years as an apprentice. The trip-time method measures the distance of a skills gap and the relative ease of moving from one occupation to another. Because up-skilling entails increasing the level, or mix, of a worker’s human capital, the chapter closes with a mention of an online resource to match training and education programs with green and growing occupations.
7.1 Measuring Skills GapsThe goal of the research team was to boil down the complex components of skills, knowledge and experience that an occupation needs into one dimension. That dimension is time. The time-to-transition measure—trip time—is a simple measure to inform a decision about which career pathway to follow.
In short, time is the dimension for measuring a skills gap: how long the journey is to move from occupation A to occupation B. There are many other considerations, of course. A path that means paying large sums for tuition would not be feasible for many. Many would rule out a path requiring in-residence course work far away from home. But trip time can represent the difference between working in one occupation and migrating to another.
Figure 7: Selected Occupations in the Same Cluster as an Industrial Machinery Mechanic
The skills gap is primarily a knowledge or human capital gap.
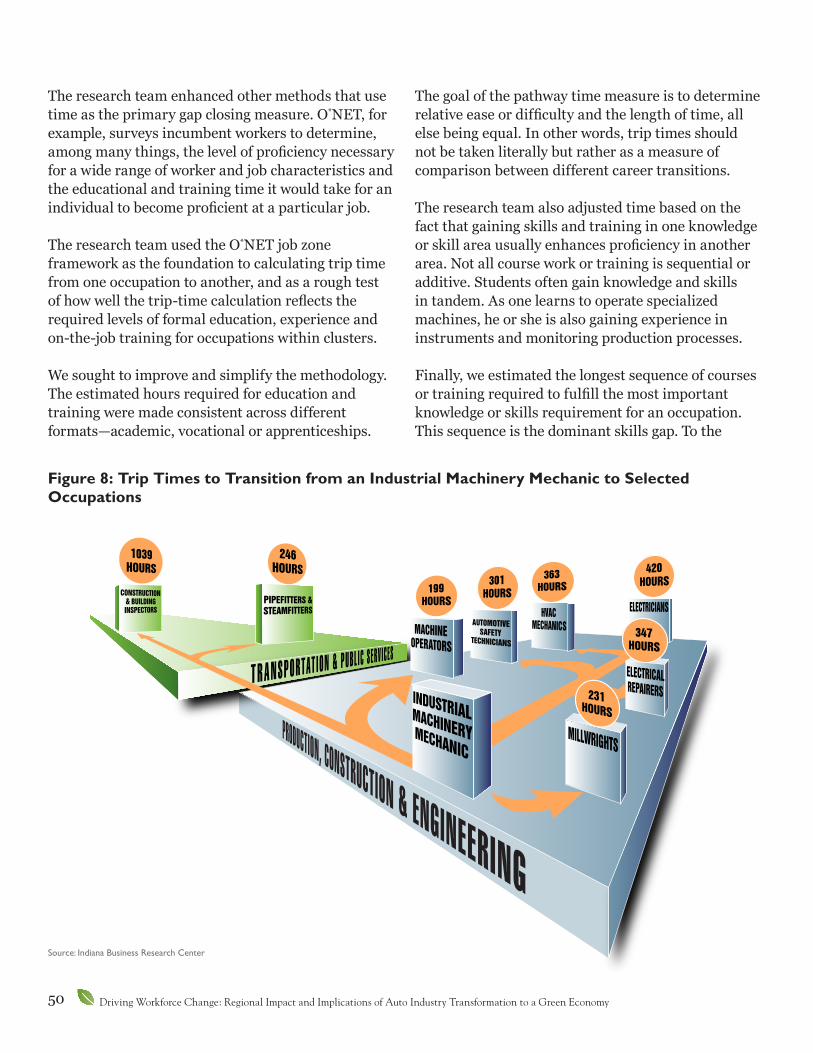
50 Driving Workforce Change: Regional Impact and Implications of Auto Industry Transformation to a Green Economy
The research team enhanced other methods that use time as the primary gap closing measure. O*NET, for example, surveys incumbent workers to determine, among many things, the level of proficiency necessary for a wide range of worker and job characteristics and the educational and training time it would take for an individual to become proficient at a particular job.
The research team used the O*NET job zone framework as the foundation to calculating trip time from one occupation to another, and as a rough test of how well the trip-time calculation reflects the required levels of formal education, experience and on-the-job training for occupations within clusters.
We sought to improve and simplify the methodology. The estimated hours required for education and training were made consistent across different formats—academic, vocational or apprenticeships.
The goal of the pathway time measure is to determine relative ease or difficulty and the length of time, all else being equal. In other words, trip times should not be taken literally but rather as a measure of comparison between different career transitions.
The research team also adjusted time based on the fact that gaining skills and training in one knowledge or skill area usually enhances proficiency in another area. Not all course work or training is sequential or additive. Students often gain knowledge and skills in tandem. As one learns to operate specialized machines, he or she is also gaining experience in instruments and monitoring production processes.
Finally, we estimated the longest sequence of courses or training required to fulfill the most important knowledge or skills requirement for an occupation. This sequence is the dominant skills gap. To the
Figure 8: Trip Times to Transition from an Industrial Machinery Mechanic to Selected Occupations
Source: Indiana Business Research Center
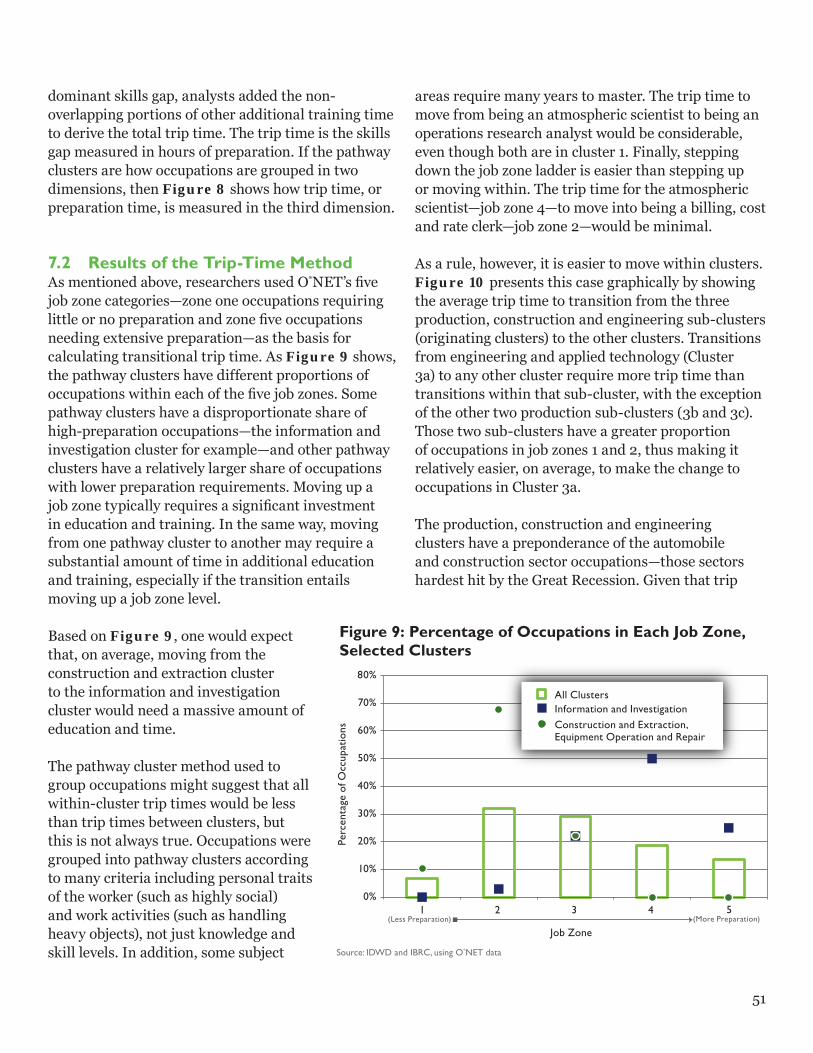
51
dominant skills gap, analysts added the non-overlapping portions of other additional training time to derive the total trip time. The trip time is the skills gap measured in hours of preparation. If the pathway clusters are how occupations are grouped in two dimensions, then Figure 8 shows how trip time, or preparation time, is measured in the third dimension.
7.2 Results of the Trip-Time MethodAs mentioned above, researchers used O*NET’s five job zone categories—zone one occupations requiring little or no preparation and zone five occupations needing extensive preparation—as the basis for calculating transitional trip time. As Figure 9 shows, the pathway clusters have different proportions of occupations within each of the five job zones. Some pathway clusters have a disproportionate share of high-preparation occupations—the information and investigation cluster for example—and other pathway clusters have a relatively larger share of occupations with lower preparation requirements. Moving up a job zone typically requires a significant investment in education and training. In the same way, moving from one pathway cluster to another may require a substantial amount of time in additional education and training, especially if the transition entails moving up a job zone level.
Based on Figure 9, one would expect that, on average, moving from the construction and extraction cluster to the information and investigation cluster would need a massive amount of education and time.
The pathway cluster method used to group occupations might suggest that all within-cluster trip times would be less than trip times between clusters, but this is not always true. Occupations were grouped into pathway clusters according to many criteria including personal traits of the worker (such as highly social) and work activities (such as handling heavy objects), not just knowledge and skill levels. In addition, some subject
areas require many years to master. The trip time to move from being an atmospheric scientist to being an operations research analyst would be considerable, even though both are in cluster 1. Finally, stepping down the job zone ladder is easier than stepping up or moving within. The trip time for the atmospheric scientist—job zone 4—to move into being a billing, cost and rate clerk—job zone 2—would be minimal.
As a rule, however, it is easier to move within clusters. Figure 10 presents this case graphically by showing the average trip time to transition from the three production, construction and engineering sub-clusters (originating clusters) to the other clusters. Transitions from engineering and applied technology (Cluster 3a) to any other cluster require more trip time than transitions within that sub-cluster, with the exception of the other two production sub-clusters (3b and 3c). Those two sub-clusters have a greater proportion of occupations in job zones 1 and 2, thus making it relatively easier, on average, to make the change to occupations in Cluster 3a.
The production, construction and engineering clusters have a preponderance of the automobile and construction sector occupations—those sectors hardest hit by the Great Recession. Given that trip
Source: IDWD and IBRC, using O*NET data
Figure 9: Percentage of Occupations in Each Job Zone, Selected Clusters
0%
10%
20%
30%
40%
50%
60%
70%
80%
1(Less Preparation)
2 3 4 5(More Preparation)
Perc
enta
ge o
f Occ
upat
ions
Job Zone
All ClustersInformation and InvestigationConstruction and Extraction, Equipment Operation and Repair
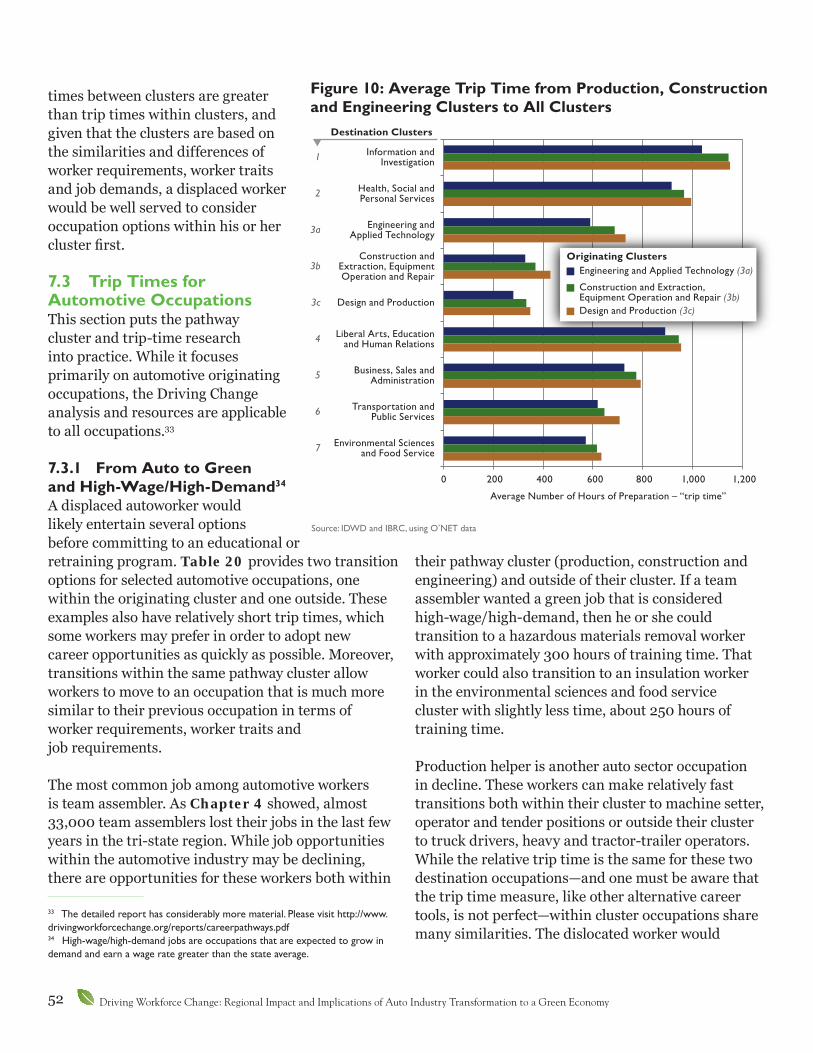
52 Driving Workforce Change: Regional Impact and Implications of Auto Industry Transformation to a Green Economy
times between clusters are greater than trip times within clusters, and given that the clusters are based on the similarities and differences of worker requirements, worker traits and job demands, a displaced worker would be well served to consider occupation options within his or her cluster first.
7.3 Trip Times for Automotive OccupationsThis section puts the pathway cluster and trip-time research into practice. While it focuses primarily on automotive originating occupations, the Driving Change analysis and resources are applicable to all occupations.33
7.3.1 From Auto to Green and High-Wage/High-Demand34
A displaced autoworker would likely entertain several options before committing to an educational or retraining program. Table 20 provides two transition options for selected automotive occupations, one within the originating cluster and one outside. These examples also have relatively short trip times, which some workers may prefer in order to adopt new career opportunities as quickly as possible. Moreover, transitions within the same pathway cluster allow workers to move to an occupation that is much more similar to their previous occupation in terms of worker requirements, worker traits and job requirements.
The most common job among automotive workers is team assembler. As Chapter 4 showed, almost 33,000 team assemblers lost their jobs in the last few years in the tri-state region. While job opportunities within the automotive industry may be declining, there are opportunities for these workers both within
33 The detailed report has considerably more material. Please visit http://www.drivingworkforcechange.org/reports/careerpathways.pdf34 High-wage/high-demand jobs are occupations that are expected to grow in demand and earn a wage rate greater than the state average.
their pathway cluster (production, construction and engineering) and outside of their cluster. If a team assembler wanted a green job that is considered high-wage/high-demand, then he or she could transition to a hazardous materials removal worker with approximately 300 hours of training time. That worker could also transition to an insulation worker in the environmental sciences and food service cluster with slightly less time, about 250 hours of training time.
Production helper is another auto sector occupation in decline. These workers can make relatively fast transitions both within their cluster to machine setter, operator and tender positions or outside their cluster to truck drivers, heavy and tractor-trailer operators. While the relative trip time is the same for these two destination occupations—and one must be aware that the trip time measure, like other alternative career tools, is not perfect—within cluster occupations share many similarities. The dislocated worker would
Figure 10: Average Trip Time from Production, Construction and Engineering Clusters to All Clusters
Source: IDWD and IBRC, using O*NET data
0 200 400 600 800 1,000 1,200
Average Number of Hours of Preparation – “trip time”
Destination Clusters
Engineering and Applied Technology (3a)
Construction and Extraction, Equipment Operation and Repair (3b)Design and Production (3c)
Originating Clusters
Information andInvestigation1
Health, Social andPersonal Services2
Engineering andApplied Technology3a
Construction andExtraction, EquipmentOperation and Repair
3b
Design and Production3c
Liberal Arts, Educationand Human Relations4
Business, Sales andAdministration5
Transportation andPublic Services6
Environmental Sciencesand Food Service7
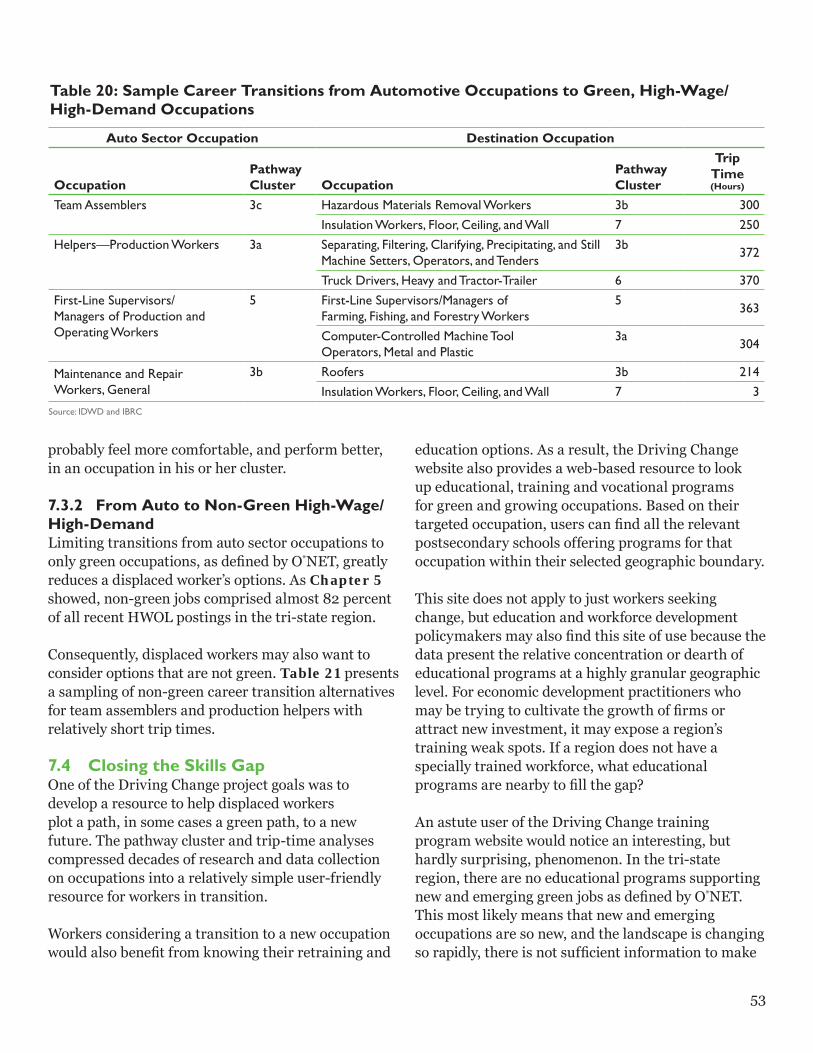
53
probably feel more comfortable, and perform better, in an occupation in his or her cluster.
7.3.2 From Auto to Non-Green High-Wage/High-DemandLimiting transitions from auto sector occupations to only green occupations, as defined by O*NET, greatly reduces a displaced worker’s options. As Chapter 5 showed, non-green jobs comprised almost 82 percent of all recent HWOL postings in the tri-state region.
Consequently, displaced workers may also want to consider options that are not green. Table 21 presents a sampling of non-green career transition alternatives for team assemblers and production helpers with relatively short trip times.
7.4 Closing the Skills GapOne of the Driving Change project goals was to develop a resource to help displaced workers plot a path, in some cases a green path, to a new future. The pathway cluster and trip-time analyses compressed decades of research and data collection on occupations into a relatively simple user-friendly resource for workers in transition.
Workers considering a transition to a new occupation would also benefit from knowing their retraining and
education options. As a result, the Driving Change website also provides a web-based resource to look up educational, training and vocational programs for green and growing occupations. Based on their targeted occupation, users can find all the relevant postsecondary schools offering programs for that occupation within their selected geographic boundary.
This site does not apply to just workers seeking change, but education and workforce development policymakers may also find this site of use because the data present the relative concentration or dearth of educational programs at a highly granular geographic level. For economic development practitioners who may be trying to cultivate the growth of firms or attract new investment, it may expose a region’s training weak spots. If a region does not have a specially trained workforce, what educational programs are nearby to fill the gap?
An astute user of the Driving Change training program website would notice an interesting, but hardly surprising, phenomenon. In the tri-state region, there are no educational programs supporting new and emerging green jobs as defined by O*NET. This most likely means that new and emerging occupations are so new, and the landscape is changing so rapidly, there is not sufficient information to make
Auto Sector Occupation Destination Occupation
OccupationPathway Cluster Occupation
Pathway Cluster
Trip Time (Hours)
Team Assemblers 3c Hazardous Materials Removal Workers 3b 300Insulation Workers, Floor, Ceiling, and Wall 7 250
Helpers—Production Workers 3a Separating, Filtering, Clarifying, Precipitating, and Still Machine Setters, Operators, and Tenders
3b 372
Truck Drivers, Heavy and Tractor-Trailer 6 370First-Line Supervisors/ Managers of Production and Operating Workers
5 First-Line Supervisors/Managers of Farming, Fishing, and Forestry Workers
5 363
Computer-Controlled Machine Tool Operators, Metal and Plastic
3a 304
Maintenance and Repair Workers, General
3b Roofers 3b 214Insulation Workers, Floor, Ceiling, and Wall 7 3
Table 20: Sample Career Transitions from Automotive Occupations to Green, High-Wage/High-Demand Occupations
Source: IDWD and IBRC
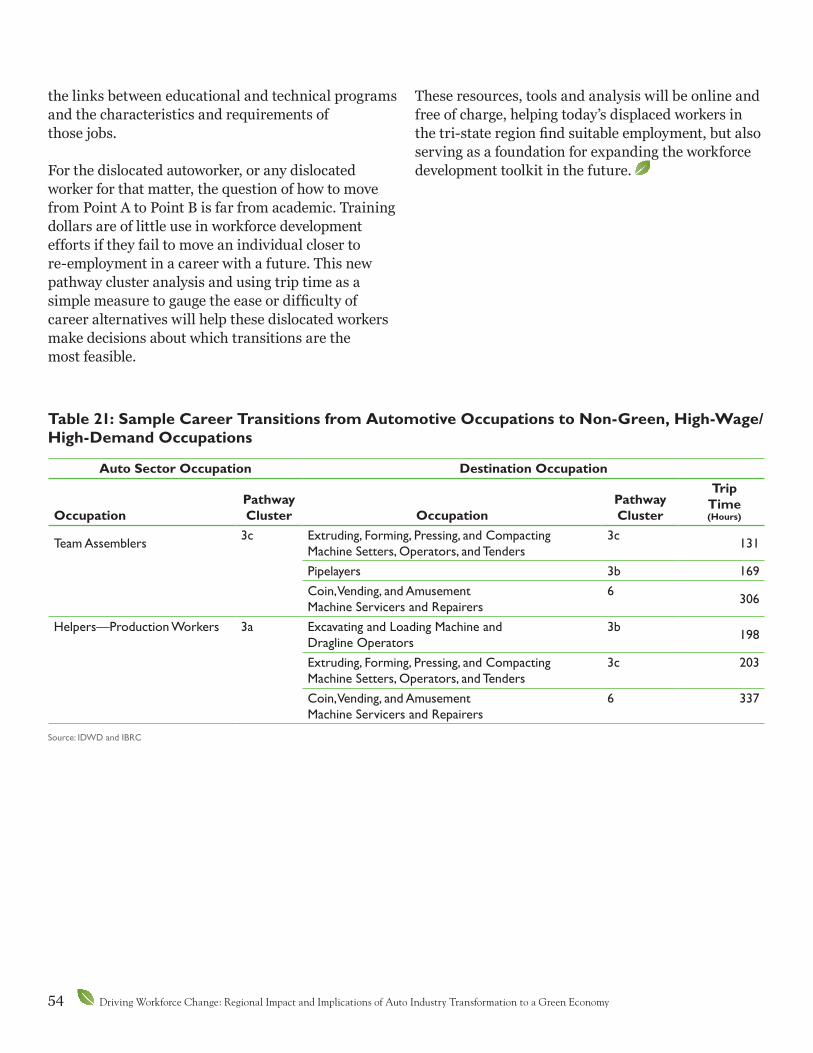
54 Driving Workforce Change: Regional Impact and Implications of Auto Industry Transformation to a Green Economy
the links between educational and technical programs and the characteristics and requirements of those jobs.
For the dislocated autoworker, or any dislocated worker for that matter, the question of how to move from Point A to Point B is far from academic. Training dollars are of little use in workforce development efforts if they fail to move an individual closer to re-employment in a career with a future. This new pathway cluster analysis and using trip time as a simple measure to gauge the ease or difficulty of career alternatives will help these dislocated workers make decisions about which transitions are the most feasible.
These resources, tools and analysis will be online and free of charge, helping today’s displaced workers in the tri-state region find suitable employment, but also serving as a foundation for expanding the workforce development toolkit in the future.
Auto Sector Occupation Destination Occupation
OccupationPathway Cluster Occupation
Pathway Cluster
Trip Time (Hours)
Team Assemblers 3c Extruding, Forming, Pressing, and Compacting Machine Setters, Operators, and Tenders
3c 131
Pipelayers 3b 169Coin, Vending, and Amusement Machine Servicers and Repairers
6 306
Helpers—Production Workers 3a Excavating and Loading Machine and Dragline Operators
3b 198
Extruding, Forming, Pressing, and Compacting Machine Setters, Operators, and Tenders
3c 203
Coin, Vending, and Amusement Machine Servicers and Repairers
6 337
Table 21: Sample Career Transitions from Automotive Occupations to Non-Green, High-Wage/High-Demand Occupations
Source: IDWD and IBRC

55
8. Conclusion: Workforce Implications
Automakers face a variety of challenges imposed by global competition, government mandates and consumer demands. Finding
the best balance of materials and technologies to meet these sometimes-conflicting demands will require agility and new approaches to design and manufacture going forward. To help meet this challenge, automakers increasingly emphasize integrative systems approaches, critical thinking, problem-solving and communication skills, together with a commitment to lifelong learning at all levels of the workforce.
While engineers, technicians and skilled-trades workers are expected to expand their knowledge base and embrace cross-disciplinary training, more gradual changes are anticipated for production workers’ job requirements. The tri-state region appears able to attract and retain research and design, engineering, and systems integration jobs going forward based on its extensive talent pools and knowledge base, but faces stiffer competition from Asian players for other niches such as electronics manufacturing where the region’s infrastructure and knowledge are not as advanced.
8.1 Employer ChallengesAutomakers and their supply chain partners were sorely stressed by the economic downturn, and many suppliers succumbed to the crisis. Among firms that survived, layoffs and temporary shutdowns were widespread, and now the reduced capacity to meet the demands of automakers’ increasing production is straining suppliers.
This stress is evidenced by a gradual increase in quality problems and by production interruptions due to inadequate supplies of components from lower-tier suppliers. Interviewed firms expressed concerns that suppliers struggling to meet production orders may be unable to engage in product development, explore new production techniques and achieve expected continuous improvement goals for quality and productivity.
Longer-term planning is also at risk, including succession planning for key employees and a willingness to invest in endeavors offering delayed returns. Some consolidation among lower-tier suppliers has occurred with the demise of competitors, and many surviving firms are challenged by capital access obstacles and the lack of a diverse customer base. Efforts to stabilize supply chains by moving orders to suppliers perceived as “healthier” may have the unintended effect of pushing reasonably stable firms into insolvency, reducing the pool of available suppliers.
Automakers and Tier 1 suppliers have begun to implement steps to shore up key lower-tier suppliers to prevent further disruptions. Ongoing access to credit by suppliers “on the bubble,” who present some weakness or vulnerability, will be an issue of importance for the maintenance of a robust field of competitors to supply the auto manufacturing sector.
8.2 Workforce ChallengesSeveral trends will challenge the ongoing competency of engineering and technical employees. These include the increased need for holistic systems approaches to design and testing, addressing safety issues in the introduction of new materials, and green technologies for powertrains. While these employees are the most affected by changes rippling through the industry, they are also the focus of employers’ most energetic training efforts, including in-house training courses and tuition reimbursement. Although industry interviewees anticipate more cross-disciplinary and systems training for engineers and engineering technicians going forward, they are generally satisfied with the graduates of current programs and they believe certificate programs will be adequate to fill in the gaps.
Training for production workers is seen as being on a level with that involved in new product introduction, as existing skill sets will readily transfer to new materials and processes. However, increased demand for critical thinking and communication skills

56 Driving Workforce Change: Regional Impact and Implications of Auto Industry Transformation to a Green Economy
formerly associated with postsecondary training may pose challenges for some workers.
Maintenance and repair workers (skilled trades) and those involved in the construction of new plants will likely face higher training demands in order to deal with increasingly complex equipment and systems designed with energy and water conservation in mind. A press for workers with skills in more than one area of expertise will also increase the need for cross-discipline preparation for this workforce segment as they deal with an increasingly green work environment.
As the green economy continues to expand within and across industries, jobs within it will increasingly require specialized training and credentials. “Green” training programs leading to certificates and degrees are being developed at postsecondary institutions at a steady rate and will continue to expand as employers demand these skills from their workers. A database including regional training programs preparing students for green and growing occupations has been created and may be accessed from the Driving Change website.
But the dislocated automotive workforce continues to face challenges. Employers have remained hesitant to reinstate positions eliminated during the downturn and have instead increased reliance on temporary workers. While many older auto workers will likely “age out” of the workforce, a significant number of displaced workers will not. For these individuals seeking alternatives to their former jobs, we developed new career pathway tools, which provide a set of target occupations that leverage their existing skill sets and take preferred work styles into consideration.
As we concluded the many months of interviewing, benchmarking, researching, modeling and analysis, five primary workforce implications emerged:
1. Many smaller firms across a wide range of industries have had difficulty getting credit. Programs such as the State Small Business Credit Initiative can be instrumental in helping small companies expand and hire new workers.
Michigan will be the first state to receive nearly $80 million in federal funds through this program to back small business loans.
2. Automakers will increasingly need cross-functional employees that can work in several knowledge areas and that can think in terms of how different systems interact. As a result, postsecondary educational institutions may need to retool their offerings and expand their capacity.
3. Investing in worker training can reap large gains in productivity; however, many managers appear reluctant to commit the needed resources, possibly due to an overemphasis on short-term return on investment. Courses in strategic planning have proven useful for managers of small firms in regions such as Ontario and Catalonia. This type of educational extension should be considered in the tri-state region.
A related challenge for managers is that many investments are complementary. As is the case of “agile production,” several complex investments must occur together before achieving any benefits. Increased state and federal investment in technical assistance agencies such as the federal Manufacturing Extension Program and state programs such as the Edison Centers in Ohio could reduce these barriers. These agencies can provide advice about timing and integrating investments, as well as helping to bridge any management skills gap (such as product design).
4. While automakers report that current educational programs are adequate for the workforce needs of today, some green occupations are so new and qualitatively different from current jobs that those designing curriculum will need to work in concert with the industry to develop training programs. Regional differences in defining green jobs and difficulties in measuring emerging occupations present ongoing challenges to arriving at reliable estimates of these jobs. Uniform use of the eight-digit SOC categories, which facilitate breakouts of emerging occupations, would aid researchers in measuring the growth of the green economy;

57
however, adoption has been slow for a variety of practical reasons.
5. The new career pathway resources developed by the Driving Change research complements the financial support available through such channels as Trade Adjustment Assistance, Rapid Response Services for workers or employers, and the National Emergency Grant On-the-Job Training Program. The Driving Change resources can make these efforts more effective. They can help job seekers and workforce development staff identify feasible career and training alternatives. Transitions to alternative occupations can entail a
significant amount of preparation time. Displaced workers need support to make that transition, especially given that the majority have only a high school education or less.
This report highlighted and summarized the key findings of this project. The Driving Change website (www.drivingworkforcechange.org) provides access to separate reports covering each of the project’s goals in more depth. In addition, the site provides access to multiple tools stemming from this project, including the training database that matches green and growing occupations to training programs available in the tri-state region.
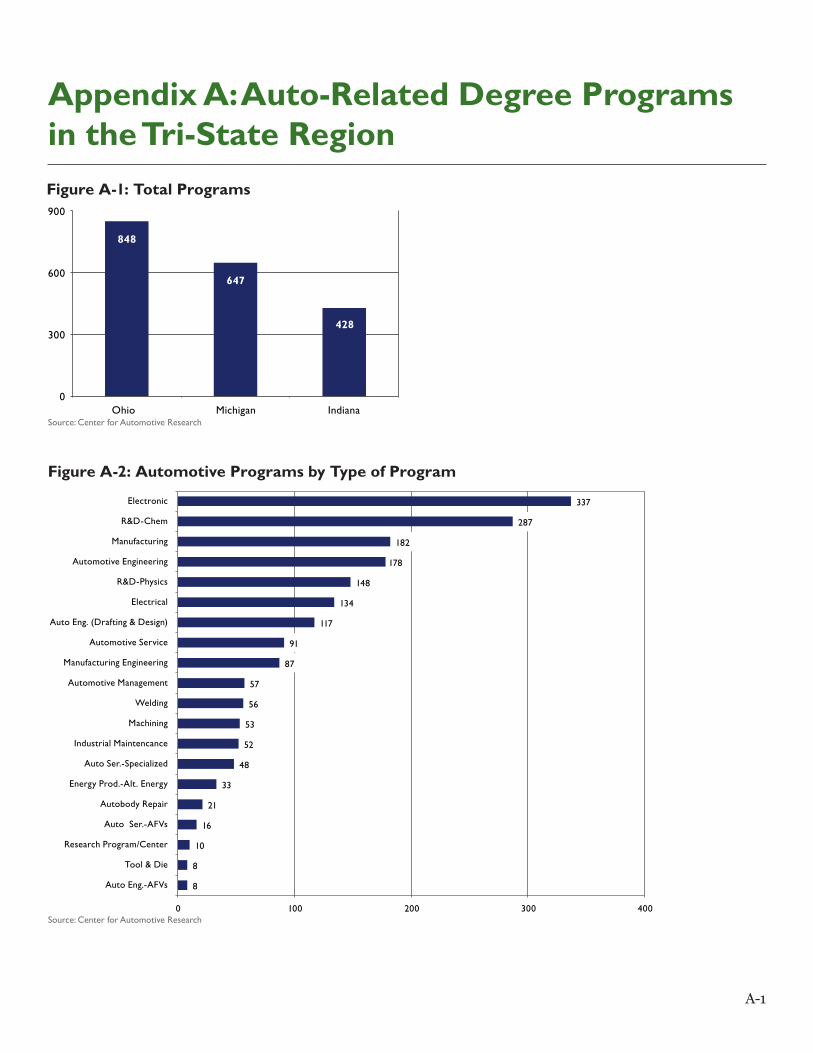
A-1
Appendix A: Auto-Related Degree Programs in the Tri-State Region Figure A-1: Total Programs
Figure A-2: Automotive Programs by Type of Program
337
287
182
178
148
134
117
91
87
57
56
53
52
48
33
21
16
10
8
8
0 100 200 300 400
Electronic
R&D-Chem
Manufacturing
Automotive Engineering
R&D-Physics
Electrical
Auto Eng. (Drafting & Design)
Automotive Service
Manufacturing Engineering
Automotive Management
Welding
Machining
Industrial Maintencance
Auto Ser.-Specialized
Energy Prod.-Alt. Energy
Autobody Repair
Auto Ser.-AFVs
Research Program/Center
Tool & Die
Auto Eng.-AFVs
848
647
428
0
300
600
900
Ohio Michigan IndianaSource: Center for Automotive Research
Source: Center for Automotive Research

A-2 Driving Workforce Change: Regional Impact and Implications of Auto Industry Transformation to a Green Economy
Figure A-3: Types of Degrees
Figure A-4: Automotive Programs by State
343
577
595
259
139
10
0 100 200 300 400 500 600 700
Certificates
Associate Degrees
Bachelor’s Degrees
Master’s Degrees
Doctoral Degrees
Research Program/Center
0 20 40 60 80 100 120 140 160
Autobody Repair
Automotive Engineering
Auto Eng.-AFVs
Auto Eng. (Drafting & Design)
Automotive Management
Automotive Service
Auto Ser.-AFVs
Auto Ser.-Specialized
Electrical
Electronic
Energy Prod.-Alt. Energy
Industrial Maintenance
Machining
Manufacturing
Manufacturing Engineering
R&D-Chem
R&D-Physics
Research Program/Center
Tool & Die
Welding
Michigan
Indiana
Ohio
Source: Center for Automotive Research
Source: Center for Automotive Research
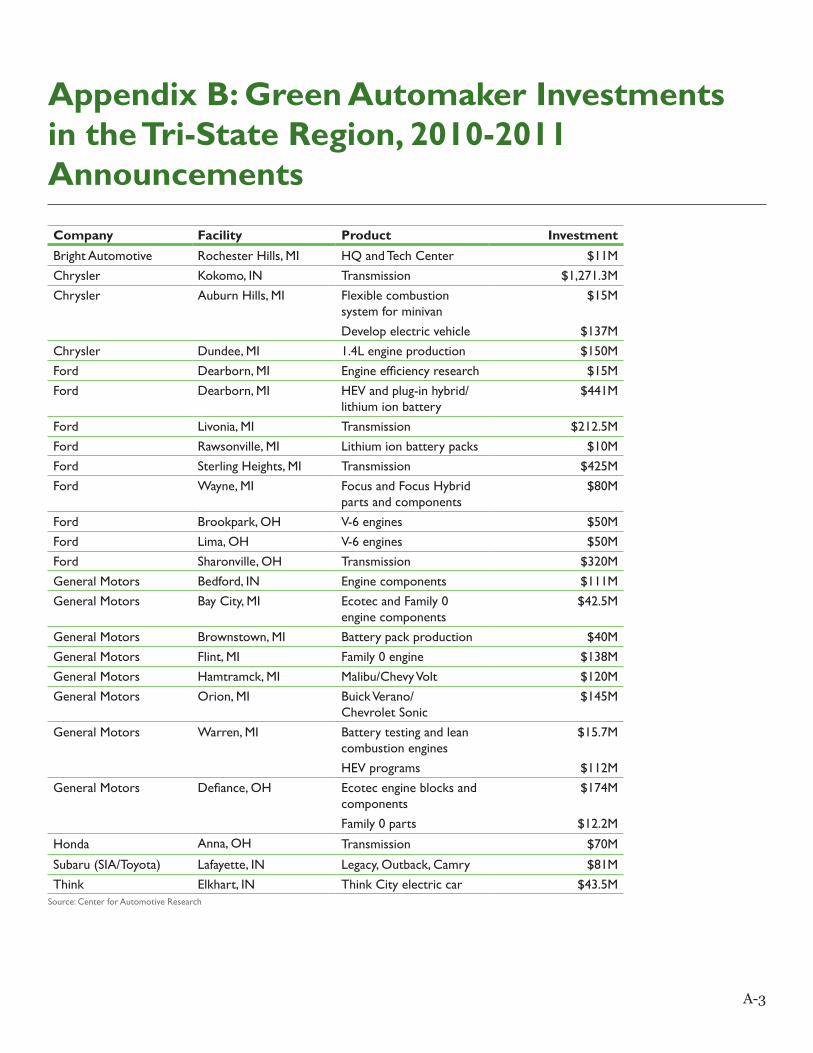
A-3
Appendix B: Green Automaker Investments in the Tri-State Region, 2010-2011 Announcements
Company Facility Product InvestmentBright Automotive Rochester Hills, MI HQ and Tech Center $11MChrysler Kokomo, IN Transmission $1,271.3MChrysler Auburn Hills, MI Flexible combustion
system for minivan$15M
Develop electric vehicle $137MChrysler Dundee, MI 1.4L engine production $150MFord Dearborn, MI Engine efficiency research $15MFord Dearborn, MI HEV and plug-in hybrid/
lithium ion battery$441M
Ford Livonia, MI Transmission $212.5MFord Rawsonville, MI Lithium ion battery packs $10MFord Sterling Heights, MI Transmission $425MFord Wayne, MI Focus and Focus Hybrid
parts and components$80M
Ford Brookpark, OH V-6 engines $50MFord Lima, OH V-6 engines $50MFord Sharonville, OH Transmission $320MGeneral Motors Bedford, IN Engine components $111MGeneral Motors Bay City, MI Ecotec and Family 0
engine components$42.5M
General Motors Brownstown, MI Battery pack production $40MGeneral Motors Flint, MI Family 0 engine $138MGeneral Motors Hamtramck, MI Malibu/Chevy Volt $120MGeneral Motors Orion, MI Buick Verano/
Chevrolet Sonic$145M
General Motors Warren, MI Battery testing and lean combustion engines
$15.7M
HEV programs $112MGeneral Motors Defiance, OH Ecotec engine blocks and
components$174M
Family 0 parts $12.2M
Honda Anna, OH Transmission $70M
Subaru (SIA/Toyota) Lafayette, IN Legacy, Outback, Camry $81MThink Elkhart, IN Think City electric car $43.5M
Source: Center for Automotive Research

A-4 Driving Workforce Change: Regional Impact and Implications of Auto Industry Transformation to a Green Economy
Appendix C: Supplier Survey Methodology
The research team first conducted interviews at firms predominantly in the second and third tiers of the auto supply chain, during
July and August of 2010. Because the goal of the interviews was to inform the survey design, we did not aim for a representative sample. Instead, we aimed for a convenience sample with a focus on firms in Northeast Ohio, plus a few examples of southern firms for comparison to the tri-state region. Our interviews were largely with sales managers and company presidents, and except in one case, included an extensive plant tour. To the extent that there is a bias (beyond geography), we believe most (though not all) of the firms we interviewed were above average.
The study’s second phase was a nationwide survey of automotive suppliers. This phase involved designing three surveys, building our database of eligible firms and finding survey participants at those firms.
The three surveys we designed for each firm were a human resources survey, a sales survey and a plant management survey. Initial survey design was based on important topics that came up in pre-survey interviews. We requested multiple rounds of feedback from economists at a number of universities and altered the surveys accordingly over time. We then conducted 11 trial runs of these surveys at Northeast Ohio firms to solicit further feedback and altered the survey accordingly. Finally, we wrote an abridged version of the surveys after two months of soliciting responses in order to allow participation from firms with greater time constraints.
We obtained our initial databases of automotive suppliers from a number of sources, including ELM
International, Analyst Resource Center (ARC), and trade associations such as the Precision Metalforming Association and the Industrial Fasteners Institute. We then used NAICS codes to generate lists of firms that are automotive suppliers. We organized the resulting data such that each plant location and division headquarters within the United States was an individual observation on our list, taking the necessary steps to eliminate duplicates. The resulting database included one address and phone number for each observation.
Finally, we worked with a survey research firm in Michigan to contact eligible survey participants. We first sent out postcards and emails to inform firms they would be eligible to participate in our survey. The survey research firm then called each observation on our list of firms to obtain the name and email address of a sales representative. Survey researchers then generated unique URLs for each of the three surveys for a given firm and emailed those links to the sales representatives. Sales representatives were asked to complete the sales survey and forward the HR and plant management surveys on to the appropriate individuals at that firm or plant. Later, we mailed hard copies of abridged surveys to firms that had not yet completed the web surveys.
Finally, the third phase of the study consisted of 30 post-survey interviews. The main differences between these interviews and those conducted before the survey were that for the second round of interviews we visited some firms in different Southeastern states, and in some instances we placed extra focus on the issues of outsourcing and re-shoring production.
A-5
Appendix D: Assessing the Green Jobs Survey Results
As stated in Chapter 5, the green jobs survey that Michigan conducted in 2009 was incorporated into the larger Driving Change
project that included Indiana (and Ohio) to gauge the presence and potential of the green economy to absorb many of the workers affected by the economic downturn and the auto sector restructuring. What do the survey results say?
The percentage of all jobs that are green in Indiana is about half that in Michigan. A couple of methodological reasons for this difference come to mind immediately: data collection timing was different, and Indiana surveyed both public and private establishments.
There are other considerations, however. The structure of the economy is different in the two states. While both are heavily dependent on the auto industry, their auto production activities differ. For example, Michigan is home to corporate headquarters, and there is considerably more automobile and component design, engineering and testing in Michigan than in Indiana. This is reflected in the rankings of the five core areas, as Table 10 showed. In Michigan, clean transportation and fuels account for over 40 percent of the green jobs in the state, while in Indiana, this core area accounts for less than 5 percent of all green jobs.
In Michigan, engineers accounted for a significant share of the jobs in clean transportation and fuels. One can surmise that these Michigan engineers are working in advanced lightweight materials to improve vehicular fuel efficiency or to transform the powertrain to electric. In contrast, the workers in clean transportation and fuels in Indiana tend to be in production and specialized trades, with engineers representing only 10 percent of the jobs in this core area.
The greatest proportion of green jobs in Indiana is in the core area of increasing energy efficiency. In this core area, however, Indiana and Michigan tend to resemble each other. Many of the businesses hiring these green workers are in the construction trades and the occupations involve installing or servicing heating and air conditioning or construction workers insulating floors, ceilings and walls.
Other differences between the states may be more of a puzzle. One would expect that the percentage of green jobs in a particular industry would not diverge so greatly between states. Staffing patterns—the mix of occupations reported at a particular type of establishment, for example, a headquarters, call center or a stamping plant—can differ however. Moreover, and potentially more importantly, the survey responses of what constitutes a green job can differ from one employer to another. The consistency of the results is predicated on the consistency of those respondents—staff in human resources or in operations management—who complete the survey to have a common understanding of a green job.
Contrasting the results based on core area may provide some clues. When dominant green job industries are classified based on core area, the differences between the states do not appear to be significant. Of the top five industries for each core area, the states share three. Three core areas share professional, scientific and technical services, and the fact that this industry in Michigan, unlike in Indiana, is in the clean transportation and fuels core area makes sense.
When dominant green job occupations are classified based on core area, the differences between the states appear substantial. There is no overlap among the top five occupations in the core area of renewable energy production. Three core areas share only one top five

A-6 Driving Workforce Change: Regional Impact and Implications of Auto Industry Transformation to a Green Economy
occupation. Only the core area of agriculture and natural resource conservation shares two occupations. However, it is likely that the occupational distribution of green jobs may show more similarities in the two states when the data is aggregated to broader occupational groups.
A full explanation of the observed differences in the occupational make-up for the same type of production
activity across state lines remains an open question. Additional research to answer that question is warranted to ensure that future green jobs surveys reliably and robustly measure the number and growth of green jobs and the green economy.
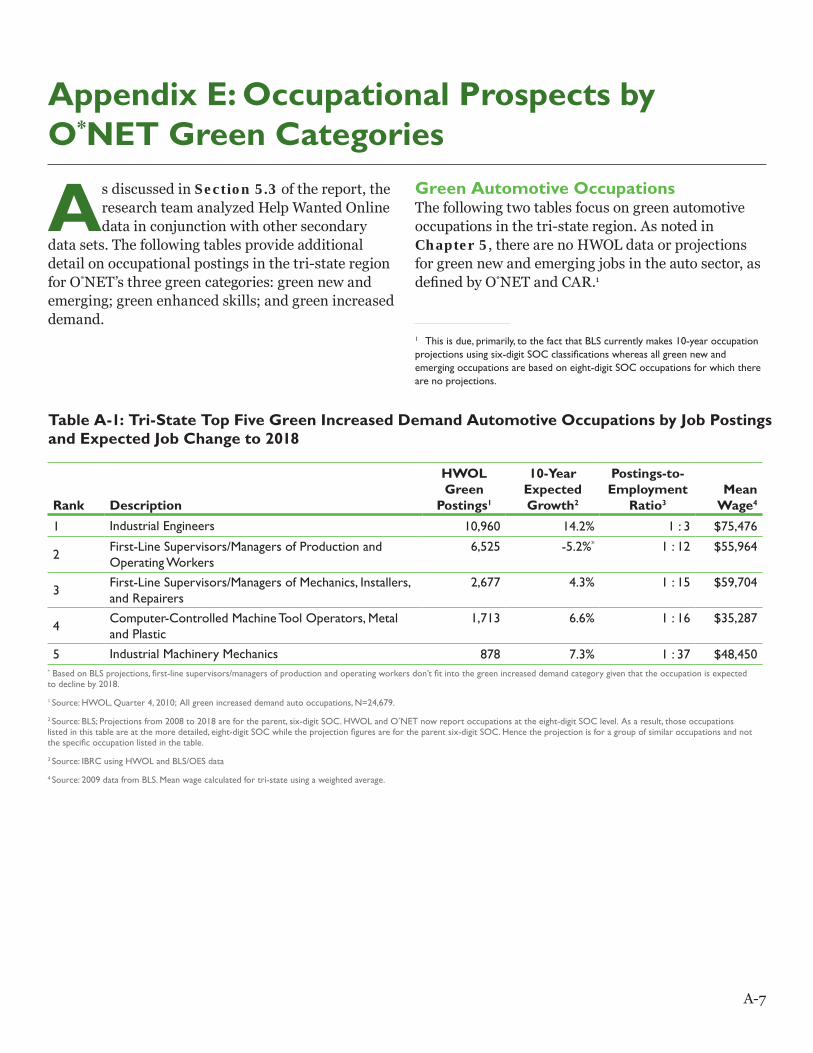
A-7
Appendix E: Occupational Prospects by O*NET Green Categories
As discussed in Section 5.3 of the report, the research team analyzed Help Wanted Online data in conjunction with other secondary
data sets. The following tables provide additional detail on occupational postings in the tri-state region for O*NET’s three green categories: green new and emerging; green enhanced skills; and green increased demand.
Green Automotive Occupations The following two tables focus on green automotive occupations in the tri-state region. As noted in Chapter 5, there are no HWOL data or projections for green new and emerging jobs in the auto sector, as defined by O*NET and CAR.1
1 This is due, primarily, to the fact that BLS currently makes 10-year occupation projections using six-digit SOC classifications whereas all green new and emerging occupations are based on eight-digit SOC occupations for which there are no projections.
Table A-1: Tri-State Top Five Green Increased Demand Automotive Occupations by Job Postings and Expected Job Change to 2018
* Based on BLS projections, first-line supervisors/managers of production and operating workers don’t fit into the green increased demand category given that the occupation is expected to decline by 2018.
1 Source: HWOL, Quarter 4, 2010; All green increased demand auto occupations, N=24,679.
2 Source: BLS; Projections from 2008 to 2018 are for the parent, six-digit SOC. HWOL and O*NET now report occupations at the eight-digit SOC level. As a result, those occupations listed in this table are at the more detailed, eight-digit SOC while the projection figures are for the parent six-digit SOC. Hence the projection is for a group of similar occupations and not the specific occupation listed in the table.
3 Source: IBRC using HWOL and BLS/OES data
4 Source: 2009 data from BLS. Mean wage calculated for tri-state using a weighted average.
Rank Description
HWOL Green
Postings1
10-Year Expected Growth2
Postings-to-Employment
Ratio3Mean
Wage4
1 Industrial Engineers 10,960 14.2% 1 : 3 $75,476
2 First-Line Supervisors/Managers of Production and Operating Workers
6,525 -5.2%* 1 : 12 $55,964
3 First-Line Supervisors/Managers of Mechanics, Installers, and Repairers
2,677 4.3% 1 : 15 $59,704
4 Computer-Controlled Machine Tool Operators, Metal and Plastic
1,713 6.6% 1 : 16 $35,287
5 Industrial Machinery Mechanics 878 7.3% 1 : 37 $48,450
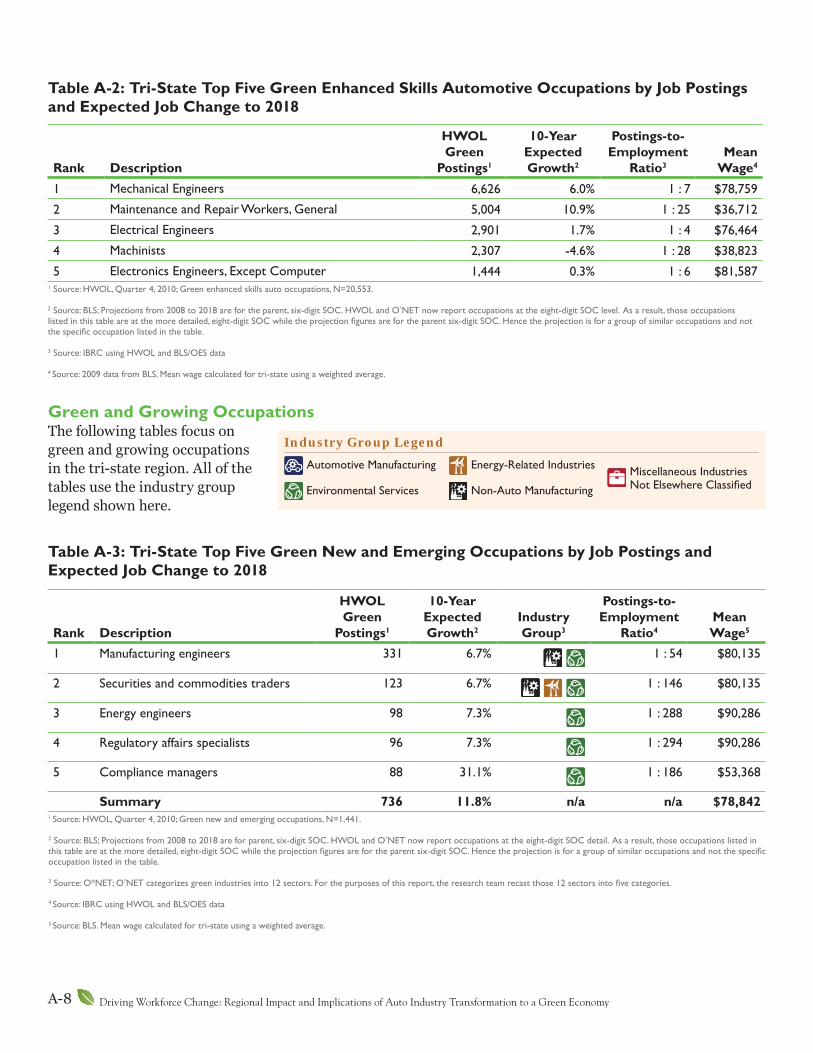
A-8 Driving Workforce Change: Regional Impact and Implications of Auto Industry Transformation to a Green Economy
Green and Growing Occupations The following tables focus on green and growing occupations in the tri-state region. All of the tables use the industry group legend shown here.
Table A-2: Tri-State Top Five Green Enhanced Skills Automotive Occupations by Job Postings and Expected Job Change to 2018
1 Source: HWOL, Quarter 4, 2010; Green enhanced skills auto occupations, N=20,553. 2 Source: BLS; Projections from 2008 to 2018 are for the parent, six-digit SOC. HWOL and O*NET now report occupations at the eight-digit SOC level. As a result, those occupations listed in this table are at the more detailed, eight-digit SOC while the projection figures are for the parent six-digit SOC. Hence the projection is for a group of similar occupations and not the specific occupation listed in the table. 3 Source: IBRC using HWOL and BLS/OES data 4 Source: 2009 data from BLS. Mean wage calculated for tri-state using a weighted average.
Table A-3: Tri-State Top Five Green New and Emerging Occupations by Job Postings and Expected Job Change to 2018
1 Source: HWOL, Quarter 4, 2010; Green new and emerging occupations, N=1,441. 2 Source: BLS; Projections from 2008 to 2018 are for parent, six-digit SOC. HWOL and O*NET now report occupations at the eight-digit SOC detail. As a result, those occupations listed in this table are at the more detailed, eight-digit SOC while the projection figures are for the parent six-digit SOC. Hence the projection is for a group of similar occupations and not the specific occupation listed in the table. 3 Source: O*NET; O*NET categorizes green industries into 12 sectors. For the purposes of this report, the research team recast those 12 sectors into five categories. 4 Source: IBRC using HWOL and BLS/OES data 5 Source: BLS. Mean wage calculated for tri-state using a weighted average.
Rank Description
HWOL Green
Postings1
10-Year Expected Growth2
Postings-to-Employment
Ratio3Mean
Wage4
1 Mechanical Engineers 6,626 6.0% 1 : 7 $78,759
2 Maintenance and Repair Workers, General 5,004 10.9% 1 : 25 $36,712
3 Electrical Engineers 2,901 1.7% 1 : 4 $76,464
4 Machinists 2,307 -4.6% 1 : 28 $38,823
5 Electronics Engineers, Except Computer 1,444 0.3% 1 : 6 $81,587
Rank Description
HWOL Green
Postings1
10-Year Expected Growth2
Industry Group3
Postings-to-Employment
Ratio4Mean Wage5
1 Manufacturing engineers 331 6.7%
1 : 54 $80,135
2 Securities and commodities traders 123 6.7%
1 : 146 $80,135
3 Energy engineers 98 7.3% 1 : 288 $90,286
4 Regulatory affairs specialists 96 7.3% 1 : 294 $90,286
5 Compliance managers 88 31.1%
1 : 186 $53,368
Summary 736 11.8% n/a n/a $78,842
Industry Group Legend
Automotive Manufacturing
Environmental Services
Energy-Related Industries
Non-Auto Manufacturing
Miscellaneous Industries Not Elsewhere Classified
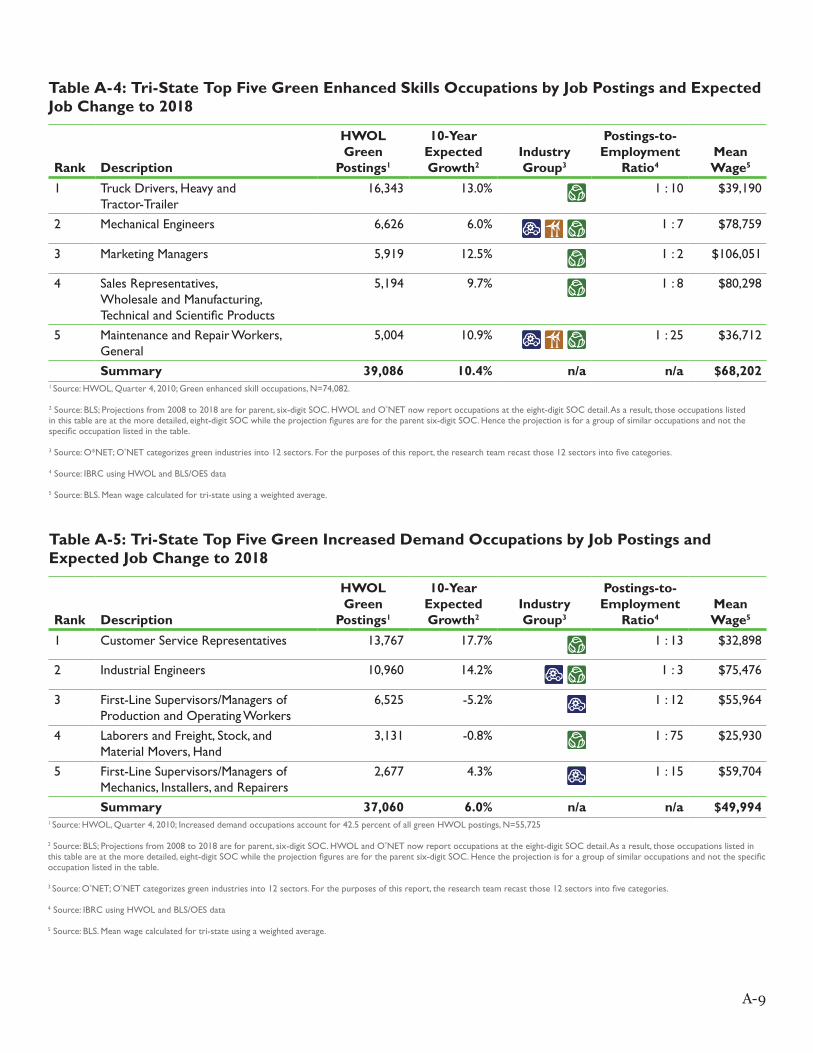
A-9
Table A-5: Tri-State Top Five Green Increased Demand Occupations by Job Postings and Expected Job Change to 2018
1 Source: HWOL, Quarter 4, 2010; Increased demand occupations account for 42.5 percent of all green HWOL postings, N=55,725 2 Source: BLS; Projections from 2008 to 2018 are for parent, six-digit SOC. HWOL and O*NET now report occupations at the eight-digit SOC detail. As a result, those occupations listed in this table are at the more detailed, eight-digit SOC while the projection figures are for the parent six-digit SOC. Hence the projection is for a group of similar occupations and not the specific occupation listed in the table. 3 Source: O*NET; O*NET categorizes green industries into 12 sectors. For the purposes of this report, the research team recast those 12 sectors into five categories. 4 Source: IBRC using HWOL and BLS/OES data 5 Source: BLS. Mean wage calculated for tri-state using a weighted average.
Table A-4: Tri-State Top Five Green Enhanced Skills Occupations by Job Postings and Expected Job Change to 2018
1 Source: HWOL, Quarter 4, 2010; Green enhanced skill occupations, N=74,082. 2 Source: BLS; Projections from 2008 to 2018 are for parent, six-digit SOC. HWOL and O*NET now report occupations at the eight-digit SOC detail. As a result, those occupations listed in this table are at the more detailed, eight-digit SOC while the projection figures are for the parent six-digit SOC. Hence the projection is for a group of similar occupations and not the specific occupation listed in the table. 3 Source: O*NET; O*NET categorizes green industries into 12 sectors. For the purposes of this report, the research team recast those 12 sectors into five categories. 4 Source: IBRC using HWOL and BLS/OES data 5 Source: BLS. Mean wage calculated for tri-state using a weighted average.
Rank Description
HWOL Green
Postings1
10-Year Expected Growth2
Industry Group3
Postings-to-Employment
Ratio4Mean Wage5
1 Truck Drivers, Heavy and Tractor-Trailer
16,343 13.0%
1 : 10 $39,190
2 Mechanical Engineers 6,626 6.0%
1 : 7 $78,759
3 Marketing Managers 5,919 12.5% 1 : 2 $106,051
4 Sales Representatives, Wholesale and Manufacturing, Technical and Scientific Products
5,194 9.7% 1 : 8 $80,298
5 Maintenance and Repair Workers, General
5,004 10.9%
1 : 25 $36,712
Summary 39,086 10.4% n/a n/a $68,202
Rank Description
HWOL Green
Postings1
10-Year Expected Growth2
Industry Group3
Postings-to-Employment
Ratio4Mean Wage5
1 Customer Service Representatives 13,767 17.7%
1 : 13 $32,898
2 Industrial Engineers 10,960 14.2%
1 : 3 $75,476
3 First-Line Supervisors/Managers of Production and Operating Workers
6,525 -5.2% 1 : 12 $55,964
4 Laborers and Freight, Stock, and Material Movers, Hand
3,131 -0.8% 1 : 75 $25,930
5 First-Line Supervisors/Managers of Mechanics, Installers, and Repairers
2,677 4.3%
1 : 15 $59,704
Summary 37,060 6.0% n/a n/a $49,994
A-10 Driving Workforce Change: Regional Impact and Implications of Auto Industry Transformation to a Green Economy
Appendix F: Project Team and ContactsIndiana Department of Workforce Development—Research and Analysis
• Vicki Seegert, Manager – Business & Workforce Studies
• Charles Baer, Manager – Economic & Market Analysis
• Terry Brown, Economic Analyst – Economic & Market Analysis
• Hope Clark, Former Director –Research & Analysis
• Bob Ferguson, Economic Analyst – Economic & Market Analysis
• Sam Forrest, Economic Analyst – Economic & Market Analysis
• Julia Wang, Application Systems Analyst – Business & Workforce Studies
• Kimberley Linville, Project Manager
• Roschell McCormack, Applications Systems Analyst – Business & Workforce Studies
• Craig Volle, Team Lead – Occupational Employment Statistics
• Lori Wasson, Database Analyst – Business & Workforce Studies
• Jon Wright, Manager (Retired) – Economic & Market Analysis
Michigan Department of Technology, Management, and Budget—Bureau of Labor Market Information and Strategic Initiatives
• Richard Waclawek, Director
• Jacob Bisel, Economic Analyst
• Bruce Weaver, Economic Manager – Labor Market Analysis
• Stephen Woods, Economic Specialist
Ohio Department of Jobs and Family Services—Labor Market Information Bureau
• Keith Ewald, Bureau Chief – Labor Market Information
• Brian Baker, Bureau Chief
• Jonathan Calig, Labor Analyst
• Peggy Hay, Researcher
• Lewis Horner, Assistant Bureau Chief
• Mary Miller, Project Manager
• Sandy Newman, Researcher
Case Western Reserve University, Weatherhead School of Management
• Susan Helper, AT&T Professor of Economics
• Natalia Cabrera, Research Assistant
• Jonathan Evans, Research Assistant
• Timothy H. Krueger, Policy Analyst – Policy Matters Ohio
• Jennifer Kuan, Post-Doctoral Fellow
• Wenjing Li, Research Assistant
• Yugarshi Mondal, Research Assistant
• Brian Peshek, Project Manager – Lean Six Sigma Black Belt
• Di Tang, Research Assistant
• Alex Warofka, Research Assistant
• Kyoung Won Park, Post-Doctoral Fellow
• Joy Zhu, Research Assistant
Center for Automotive Research• Kristin Dziczek, Director – Labor & Industry Group
• Jay Baron, President, Chairman and CEO
• Mark Birmingham, Industry Analyst
• Valerie Sathe Brugeman, Project Manager
• Yen Chen, Automotive Business Statistical Analyst
• Josh Cregger, Industry Analyst
• Melvin Gaines, Research Assistant
• Kim Hill, Director – Sustainability & Economic Development Strategies
• Sean McAlinden, Executive Vice President of Research and Chief Economist
• Deborah Maranger Menk, Project Manager
• Greg Schroeder, Research Analyst
• Brett Smith, Co-Director – Manufacturing, Engineering & Technology Group
• Bernard Swiecki, Senior Project Manager
• Richard Wallace, Director – Transportation Systems Analysis Group
Indiana Business Research Center, Kelley School of Business, Indiana University
• Jerry Conover, Director
• Tanya Hall, Economic Research Analyst
• Rachel Justis, Managing Editor
• Matt Kinghorn, Demographer
• Molly Manns, Associate Editor
• Diane Probst, Graphic Designer
• Carol O. Rogers, Deputy Director and Chief Information Officer
• Timothy F. Slaper, Director of Economic Analysis
• Michael F. Thompson, Economic Research Analyst
Contact InformationFor further information on one of the aspects of this report, please direct your inquiries to the following organizations.
Indiana Green Jobs Survey, Career Pathways and Skills Gap AnalysisIndiana Business Research Center 100 S. College Ave., Suite 240 Bloomington, IN 47404 812-855-5507 [email protected]

A-11
Michigan Green Jobs SurveyMichigan Department of Technology, Management and Budget 3032 West Grand Boulevard, Suite 9-100 Detroit, MI 48202 313-456-3090 [email protected]
Ohio Green Jobs SurveyOhio Department of Job & Family Services, Office of Workforce Development, Bureau of Labor Market Information P. O. Box 1618 Columbus, OH 43216-1618 614-466-9820 [email protected]
Auto Industry TransformationThe Center for Automotive Research 1000 Victors Way, Suite 200 Ann Arbor, MI 48108 734-662-1287 [email protected]
Auto Supply Chain StudyWeatherhead School of Management Case Western Reserve University 10900 Euclid Avenue Cleveland, OH 44106 216-368-2030 [email protected]