dr. biodiversity eye test. what did you see? scientific method method of problem solving...
TRANSCRIPT

Dr. Biodiversity Eye Test


What did you see?

Scientific Method
Method of problem solving
Observations Questions Hypotheses
OR
Questions Observations Hypotheses
OR
Questions Hypotheses Observations
Basic Steps to the Scientific Method
• 1. Make Observation or State a Problem/Question
• 2. Formulate a Hypothesis-
testable explanation for an observation
predict what will occur and why
• 3. Testing the hypothesis
- only further observations required
- experimentation is required
Controlled Experiment
• Isolates and tests the effects of a single factor or experimental variable
• Two identical groups:
1. Control group
2. Experimental group
• Has the scientific method changed over time?
PRE-LAB:Interpreting a Controlled
Experiment
• What is a seed?
• What do seeds need to germinate?
• Which factor is being investigated in this lab?
• Are there any other variables involved in the lab that could affect the outcome?
What kind of data is going to be collected from the Mustard Seed
Lab?
• Quantitative Data
• Descriptive Data
• How can quantitative data be illustrated?
4. Recording and Analyzing Data
• Display data in:
a. data table
b. line graph
c. bar graph
d. pie chart
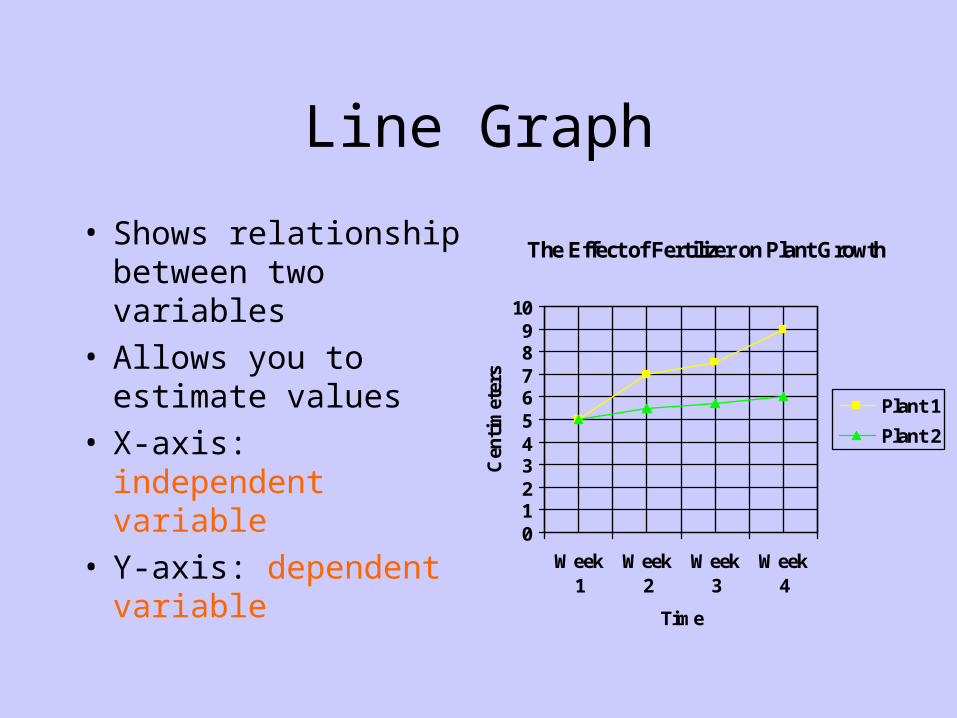
Line Graph
• Shows relationship between two variables
• Allows you to estimate values
• X-axis: independent variable
• Y-axis: dependent variable
The Effect of Fertilizer on Plant Growth
0123456789
10
Week1
Week2
Week3
Week4
Time
Cen
tim
eter
s
Plant 1
Plant 2

Bar Graph
• Used to show comparisons
• X-axis either:
1. Scale
2. Labels
0123456789
10
Inches
Jan Feb March April
Month
Comparision of Rainfall Over Four Month Period
Rainfall
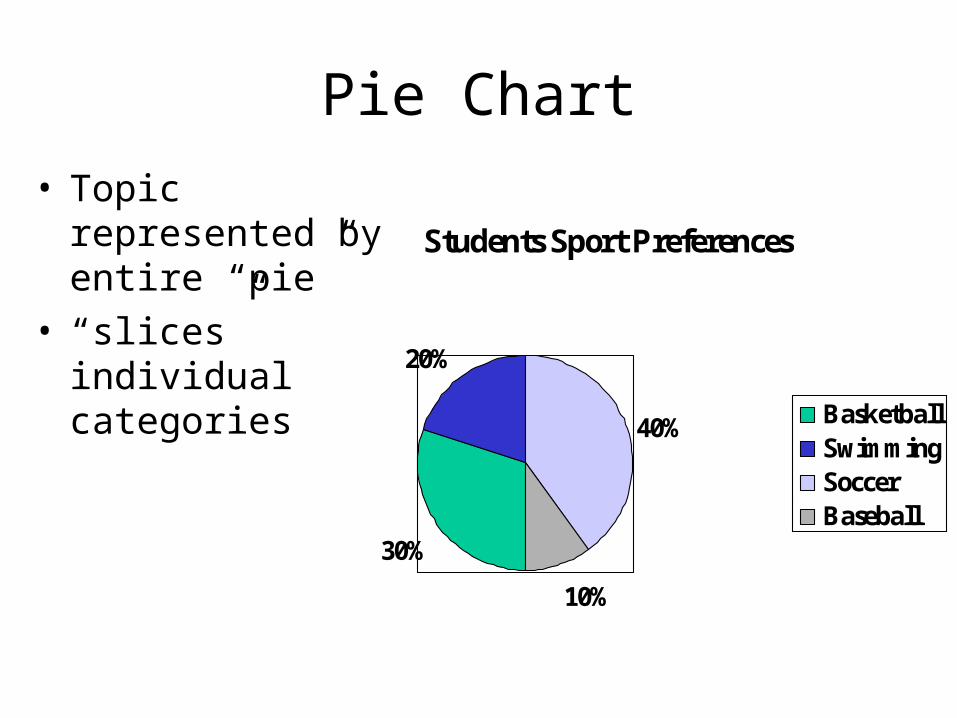
Pie Chart
• Topic represented by entire “pie”
• “slices” individual categories
Students Sport Preferences
30%
20%
40%
10%
BasketballSwimmingSoccerBaseball
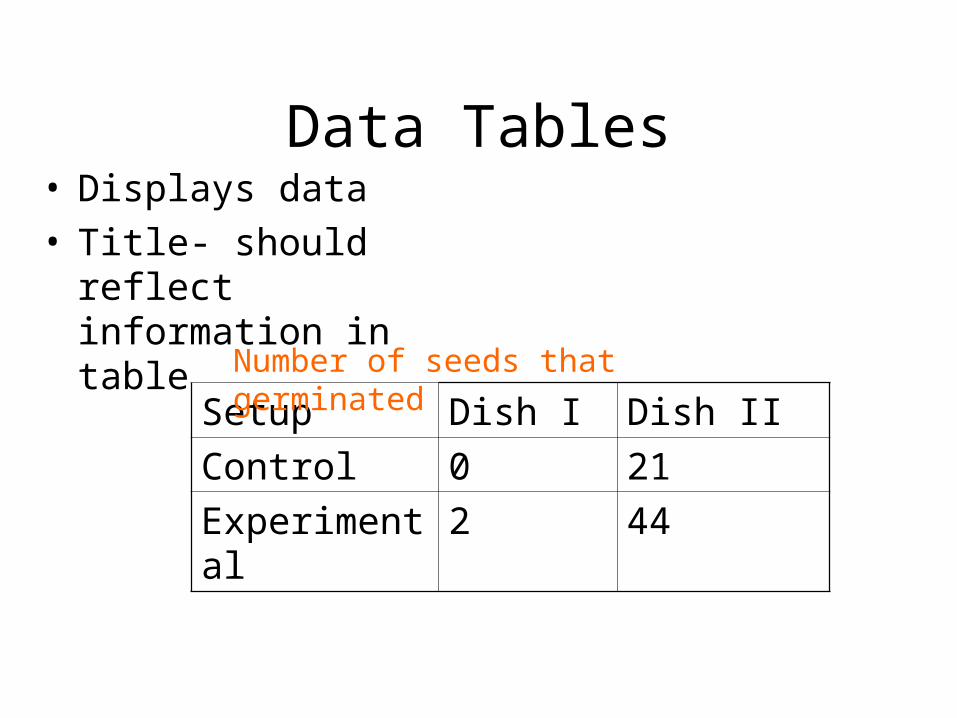
Data Tables• Displays data• Title- should reflect
information in table
Setup Dish I Dish II
Control 0 21
Experimental 2 44
Number of seeds that germinated

General Graphing Procedures
• ALWAYS PENCIL
• Title and Key, if needed
• Correct scale
• Equal spacing between units
• Neat
Forming A Conclusion
• Either accept or refute hypothesis
• Inconclusive results
• Rise of new hypotheses
• Reproducibility- verification
• Theory- tested and reconfirmed countless times; unlikely to be disproved