download (pdf, 2.33mb) - the international council for clean
TRANSCRIPT

International Alignment of Fuel Efficiency Standards for Heavy-Duty Vehicles
Therese Langer and Siddiq Khan
April 2013
Report Number T131
© American Council for an Energy-Efficient Economy
529 14th Street NW, Suite 600, Washington, DC 20045
Phone: (202) 507-4000 Twitter: @ACEEEDC
Facebook.com/myACEEE www.aceee.org
© International Council on Clean Transportation
1225 I Street NW Suite 900, Washington, DC 20005
Phone: (202) 534-1600 www.theicct.org


i
Contents Executive Summary ........................................................................................................................................... iii
Acknowledgments ............................................................................................................................................. iv
I. Introduction ......................................................................................................................................................5
Motivation for Alignment .............................................................................................................................5
Meaning of Alignment ...................................................................................................................................7
II. Heavy-Duty Fuel Efficiency and Greenhouse Gas Regulatory Programs in Place or Under
Development ........................................................................................................................................................8
Vehicle Certification Process ..................................................................................................................... 10
III. Heavy-Duty Program Elements ............................................................................................................... 14
Metrics ........................................................................................................................................................... 14
Segmentation of Vehicles ............................................................................................................................ 15
Test Cycles .................................................................................................................................................... 17
Testing and Modeling Methods ................................................................................................................. 21
Stringency ..................................................................................................................................................... 26
IV. Alignment Considerations ........................................................................................................................ 28
Approaches to Alignment ........................................................................................................................... 31
V. Data and Research Needs ........................................................................................................................... 32
VI. Conclusions and Recommendations ....................................................................................................... 33
References .......................................................................................................................................................... 37
Appendix A: Survey of Heavy-Duty Cycles .................................................................................................. 41
Urban Cycles ................................................................................................................................................ 41
Highway Cycles ............................................................................................................................................ 44
Combined Cycles ......................................................................................................................................... 46
Appendix B: Component Testing ................................................................................................................... 49

ii
Engine Testing .............................................................................................................................................. 49
Aerodynamics and Rolling Resistance ...................................................................................................... 50
Aerodynamic Drag Testing ........................................................................................................................ 51
Appendix C: EU Segmentation ....................................................................................................................... 55
iii
Executive Summary Several regions with large vehicle markets are developing regulatory programs to reduce the fuel
consumption and greenhouse gas (GHG) emissions of heavy-duty vehicles. At the same time,
manufacturers increasingly are developing global product platforms for the heavy-duty market. This
offers an opportunity to accelerate the development and adoption of fuel efficiency technologies.
Regulators can facilitate this outcome by coordinating the design of fuel efficiency and GHG
emissions reduction programs across regions.
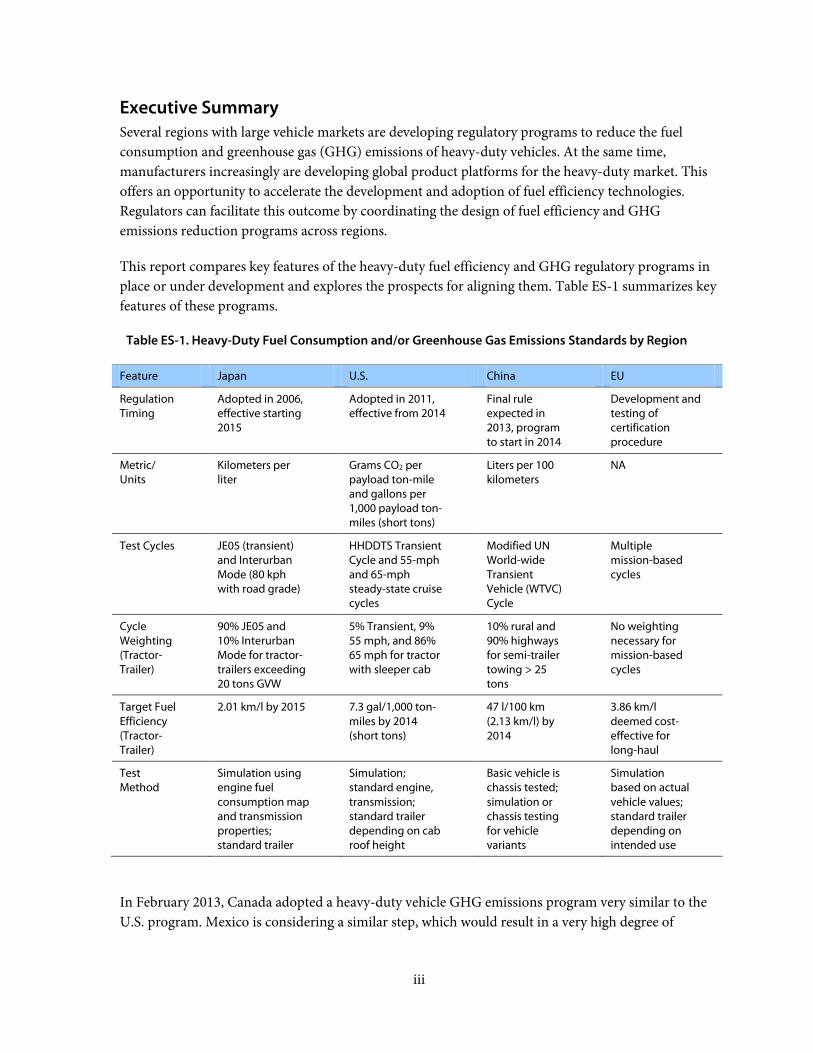
This report compares key features of the heavy-duty fuel efficiency and GHG regulatory programs in
place or under development and explores the prospects for aligning them. Table ES-1 summarizes key
features of these programs.
Table ES-1. Heavy-Duty Fuel Consumption and/or Greenhouse Gas Emissions Standards by Region
Feature Japan U.S. China EU
Regulation Timing
Adopted in 2006, effective starting 2015
Adopted in 2011, effective from 2014
Final rule expected in 2013, program to start in 2014
Development and testing of certification procedure
Metric/ Units
Kilometers per liter
Grams CO2 per payload ton-mile and gallons per 1,000 payload ton-miles (short tons)
Liters per 100 kilometers
NA
Test Cycles JE05 (transient) and Interurban Mode (80 kph with road grade)
HHDDTS Transient Cycle and 55-mph and 65-mph steady-state cruise cycles
Modified UN World-wide Transient Vehicle (WTVC) Cycle
Multiple mission-based cycles
Cycle Weighting (Tractor-Trailer)
90% JE05 and 10% Interurban Mode for tractor-trailers exceeding 20 tons GVW
5% Transient, 9% 55 mph, and 86% 65 mph for tractor with sleeper cab
10% rural and 90% highways for semi-trailer towing > 25 tons
No weighting necessary for mission-based cycles
Target Fuel Efficiency (Tractor-Trailer)
2.01 km/l by 2015 7.3 gal/1,000 ton-miles by 2014 (short tons)
47 l/100 km (2.13 km/l) by 2014
3.86 km/l deemed cost-effective for long-haul
Test Method
Simulation using engine fuel consumption map and transmission properties; standard trailer
Simulation; standard engine, transmission; standard trailer depending on cab roof height
Basic vehicle is chassis tested; simulation or chassis testing for vehicle variants
Simulation based on actual vehicle values; standard trailer depending on intended use
In February 2013, Canada adopted a heavy-duty vehicle GHG emissions program very similar to the
U.S. program. Mexico is considering a similar step, which would result in a very high degree of
iv
program alignment across North America. Aside from these examples, however, regulatory programs
across the U.S., the EU, and Asia are widely divergent, as shown in Table ES-1 above.
One consequence of the differences among the regulatory programs is that they may drive different
fuel efficiency technologies. For example, the basic test protocol for the U.S. does not capture
transmission performance, while Japan’s program does not capture tire performance. As a result, the
programs do little to promote optimal specification or fuel efficiency improvements in those
components. In some cases, such features reflect the differing benefits of the various fuel efficiency
technologies across countries. Often, however, the fuel efficiency technologies in question would yield
benefits in all regions. In such cases, better alignment of regulatory programs could help to spread
those technologies.
Aligning programs across regions has potential benefits in terms of both fuel savings and the cost of
complying with fuel efficiency regulations. Expanding the market for efficiency technologies spreads
development costs over a larger sales base and helps to achieve economies of scale, expediting the
adoption of these technologies. Increased alignment could also reduce manufacturer costs by allowing
coordinated technological approaches to fuel efficiency improvement and by providing consistent
testing protocols across regions.
Based on our assessment, we conclude that foundational steps toward alignment of heavy-duty
fuel efficiency and GHG emissions programs would include a common set of test cycles and test
payload weights. These elements would serve to define universal measures of vehicle
performance, which would permit a standardized calculation of cost-effectiveness of technology
improvements as a function of regional conditions. They would also allow comparison of vehicles
in a range of driving conditions, and in particular would allow buyers to estimate performance
over their own duty cycles. Aligning test methods as well would reduce manufacturer compliance
costs, and thus strengthen support for the program. These basic steps regarding testing protocols
should precede consideration of alignment of other regulatory elements.
Acknowledgments The preparation of this report was funded by the International Council on Clean Transportation
(ICCT). The authors would like to thank Nigel Clark (West Virginia University) and Tony Greszler
(Volvo) for their helpful comments on the draft report. Drew Kodjak, Fanta Kamakate, Nic Lutsey,
Rachel Muncrief, and Ben Sharpe of the ICCT also provided valuable input at various stages in the
development of this work, which we greatly appreciate. Thanks also to Renee Nida of ACEEE for
editing.
All remaining errors in the report are the sole responsibility of the authors.

5
I. Introduction Japan, the United States, and Canada have adopted standards to reduce GHG emissions and/or raise
the fuel efficiency of heavy-duty vehicles,1 and other countries and regions are on their way to doing
the same. These regulatory programs have similar aims and share a number of features. There is also
overlap in the vehicle models regulated, and the overlap is likely to grow rapidly in the coming years
with increasing globalization of vehicle platforms and components. Yet the differences in the
programs are fundamental. This report explores whether and how heavy-duty standards programs
could be better aligned across regions.
MOTIVATION FOR ALIGNMENT
The motivation for aligning vehicle standards is two-fold: (1) to expedite and maximize total fuel
savings and emissions reductions; and (2) to reduce manufacturers’ cost of compliance with the
standards. The means by which these goals could be advanced through alignment include:
Expediting and maximizing fuel efficiency improvements
o Accelerates development and increases sales of advanced technologies
o Ensures all promising efficiency technologies and designs are considered for inclusion in
increasingly global platforms
o Facilitates adoption of standards by additional regions
o Improves vehicle efficiency in regions without standards
o Promotes technology tailored to users’ duty cycles
o Allows greater stringency of standards
Minimizing costs
o Reduces cost of technology development and facilitates globalization of vehicle platforms
o Minimizes amount and cost of testing needed
o Permits consolidation of compliance efforts across regions
o Reduces cost to new regulators relative to developing a program from scratch
Research and development resources for heavy-duty vehicles are limited, and manufacturers seek to
expand the sales base over which they can spread such investment. The dynamics of increasing sales
base are changing due to dramatic changes in the international vehicle market. Recent commercial
vehicle production by region is shown in Figure 1. With China and other rapidly developing countries
leading sales growth, global platforms can no longer be designed to the requisites of the historically
largest markets (Fleet Owner 2012).
It is worth noting that alignment does not aim to limit the range of available vehicles. Alignment of
programs generally will not expand the population of vehicles for which a given technology improves
1 This report is about improving the fuel efficiency of heavy-duty vehicles. Because improving fuel efficiency is at present the
primary GHG emissions reduction strategy for vehicles, we treat fuel efficiency and GHG reduction programs largely
interchangeably. GHG programs include important non-efficiency considerations, however, including use of alternative fuels and
reduction of non-combustion GHG emissions. These are not discussed in this report.

International Alignment of Fuel Efficiency Standards for Heavy-Duty Vehicles © ACEEE
6
fuel efficiency; that population is determined by the vehicle application. Alignment can, however, help
to identify the entire population of vehicles for which the technology provides a benefit.
Figure 1. Heavy Heavy-Duty Vehicle Production, 2010-2012 (Estimated)
Data Source: Baird (2012)
Example: Increased Emissions Reductions
As a concrete (though hypothetical) example of how alignment of programs could allow greater
stringency of standards, we consider the treatment of advanced tractor aerodynamics in the U.S.
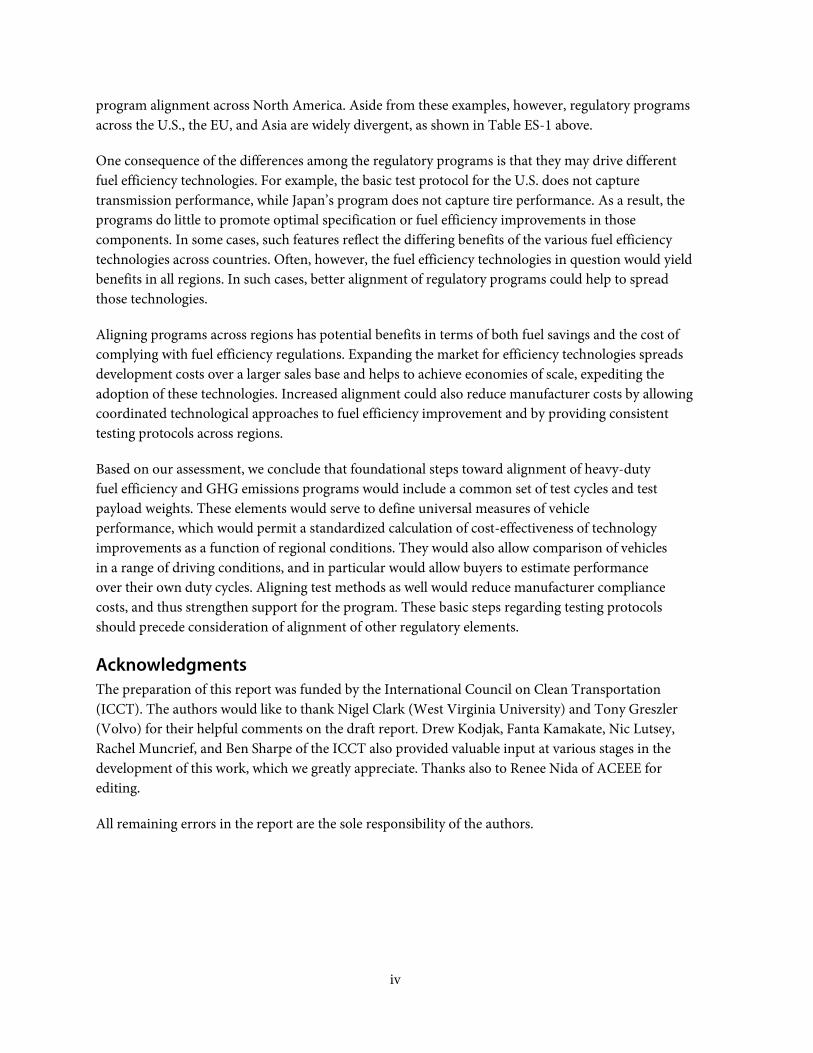
heavy-duty fuel efficiency and greenhouse gas rule (EPA and NHTSA 2011a). The agencies define five
increasingly aerodynamic “bins” for tractor trucks, with coefficients of drag (Cd) as shown in Table 1
for the case of high roof sleeper cabs. Also shown is the agencies’ assessment of the achievable
application rate of the five bins in 2014, leading to an average Cd of 0.59 for such trucks. This is part of
the agencies’ technological basis for the stringency of the standards for tractors with high roof sleeper
cabs in 2014. The rule anticipates no further improvements to aerodynamics through 2017.
At the same time, the rule predicts that technology costs generally will decline with the manufacturer
“learning” associated with increasing sales volumes. In particular, the agencies assume that costs of
emerging technologies, including advanced tractor aerodynamics, will decline by 20% with each
doubling of sales, or every two years (EPA & NHTSA 2011b). If heavy-duty standards programs were
aligned across regions so that EPA’s and NHTSA’s estimates of fuel efficiency gains due to
aerodynamic improvements over certain test cycles were considered relevant in some of the other
vehicle markets shown in Figure 1, then it is plausible that sales could double twice by 2017, bringing
costs down by 36%. Such cost reductions would bring the cost of Bin V aerodynamic improvements
below the current cost of Bin IV, while Bin IV would drop to only 10% more than today’s Bin III,
7
shifting the distribution of aerodynamic improvements purchased toward the higher bins.2 As shown
in Table 1, the likely result would be a drop in average Cd to 0.53, sufficient to justify an additional 5%
reduction in the tractor-trailer GHG emissions standard for 2017, according to the relationship
between Cd and CO2 shown in the rule (EPA & NHTSA 2011b). Other emerging technologies such as
hybridization could also be factored into the level of fuel efficiency standards if the relevant vehicle
and battery markets were expanded, which program alignment could help to accomplish.
Table 1. Reduction in Coefficient of Drag with Increase in Sales Volume
Bin Cd Application rate 2014
Cost 2014
Cost after two doubling cycles
Application rate (hypothetical)
I 0.75 0% $0 $0 0%
II 0.68 10% $0 $0 10%
III 0.6 70% $1,560 $998 0%
IV 0.52 20% $2,675 $1,712 70%
V 0.47 0% $3,769 $2,261 20%
Average Cd w/ 2014
application rates: 0.59
Average Cd w/hypothetical
application rates: 0.53
MEANING OF ALIGNMENT
For purposes of this report, alignment of programs is the adoption of similar program features in
multiple regions. The nature and extent of any such alignment is yet to be determined. Both European
programs for vehicle emissions and U.S. light-duty fuel economy rules have been adopted largely
intact by other countries. Given how greatly the heavy-duty vehicle population differs from region to
region, in both specification and application, such close alignment of heavy-duty GHG programs may
not be feasible in general. Nonetheless, alignment of a more limited scope could provide substantial
benefits.
In any case, this is the time to consider alignment opportunities because heavy-duty standards are in
the fairly early stages globally and are still subject to structural change. This would contrast with the
experience of light-duty vehicles, where fuel economy and greenhouse gas standards regimes have
grown in several regions independently. As a result, light-duty standards structure, test cycles,
stringencies, and flexibilities are all quite different from region to region.
2 This example has the advantage of drawing directly from the U.S. heavy-duty rule. It does, however, have the drawback that the
particular improvement considered comes not from a freestanding new technology but rather from a suite of design
improvements associated with the redesign of a tractor cab. Such changes may be governed more by market acceptance than by
cost. Moreover, cab redesign at present typically occurs only once every 15 to 20 years.
International Alignment of Fuel Efficiency Standards for Heavy-Duty Vehicles © ACEEE
8
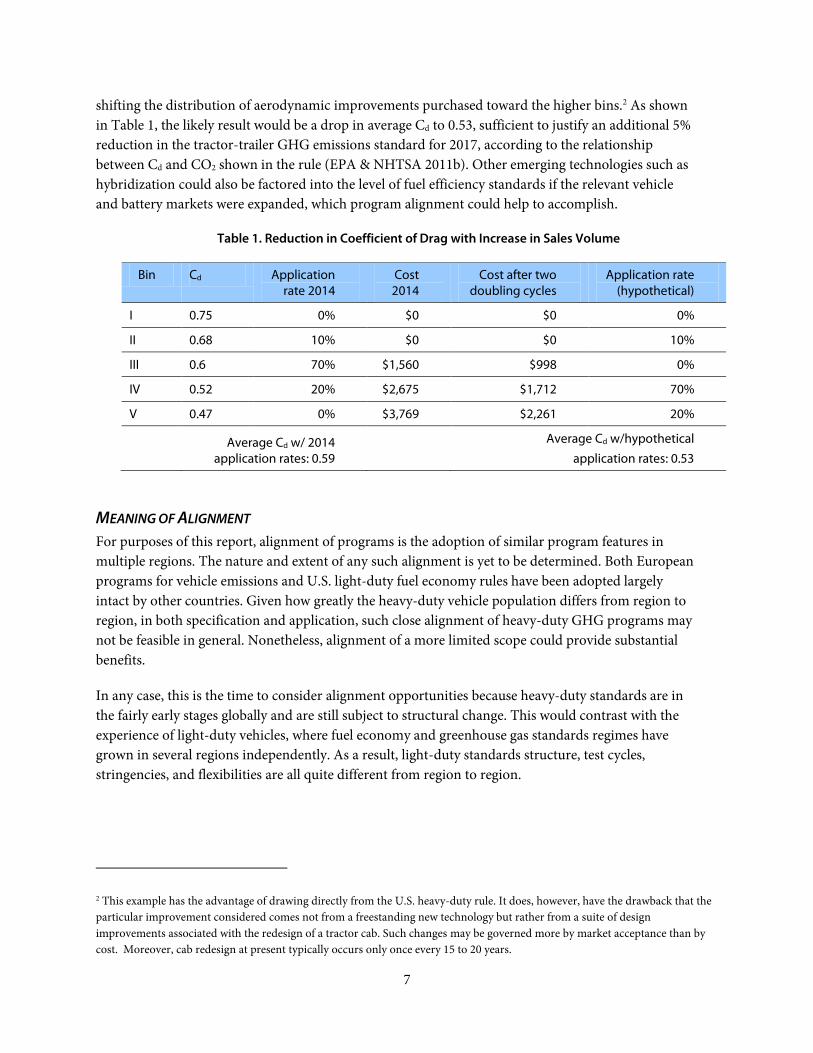
II. Heavy-Duty Fuel Efficiency and Greenhouse Gas Regulatory Programs in Place or Under Development Throughout this report, we will cite the experiences of four regions: Japan, the U.S., China and the
European Union (EU). Japan and the U.S. have adopted standards, and China proposed a program in
2012. In the EU, a preliminary certification procedure has been developed, and some parties
anticipate an effort to have a regulatory program in place by 2020 (TU Graz 2011; Schuckert 2011).
Salient features of the four programs, focusing on their application to heavy tractor trucks, are shown
in Table 2.
Table 2. Heavy-Duty Fuel Consumption and/or Greenhouse Gas Emissions Standards by Region
Feature Japan U.S. China EU
Regulation Timing Adopted in 2006, effective starting 2015 (Daisho 2007)
Adopted in 2011, effective from 2014, early compliance allowed in 2013 (EPA and NHTSA 2011a)
Proposed in 2012. Program to start in 2014 (AQSIQ 2012)
Development and testing of certification procedure underway
Metric/Units Kilometers per liter
Grams CO2 per payload ton-mile and gallons per 1,000 payload ton-miles (short tons)
Liters per 100 kilometers
NA
Reference Fuel Efficiency Level (Tractor-Trailer)
Average for 2002 tractor-trailer with GVW > 20 tons3 was 1.8 km/l (Daisho 2007)
Average for Class 8 sleeper cab high roof tractor-trailer in 2010 was 9.3 gal/1000 ton-miles (short tons) (2.4 km/l) (EPA and NHTSA 2011a)
1.2, 1.6, and 2.4 km/l for a 49 ton GCW tractor-trailer tested on City, Rural, and Motorway segments (CATARC 2010a)
Average of 3.27 km/l for all long-haul trucks in 2010 (TU Graz 2011)
Target Fuel Efficiency (Tractor-Trailer)
2.01 km/l by 2015 (Daisho 2007) for GVW>20 tons
7.3 gal/1,000 ton-miles (3.06 km/l) by 2014 (short tons) for Class 8 w/ sleeper cab and high roof
42 l/100 km (2.38 km/l) by 2014 for 40-43 tons GCW (AQSIQ 2012)
3.86 km/l found to be cost-effective for long-haul (AEA 2011)
3 Unless otherwise indicated, “ton” refers to metric ton throughout.
9
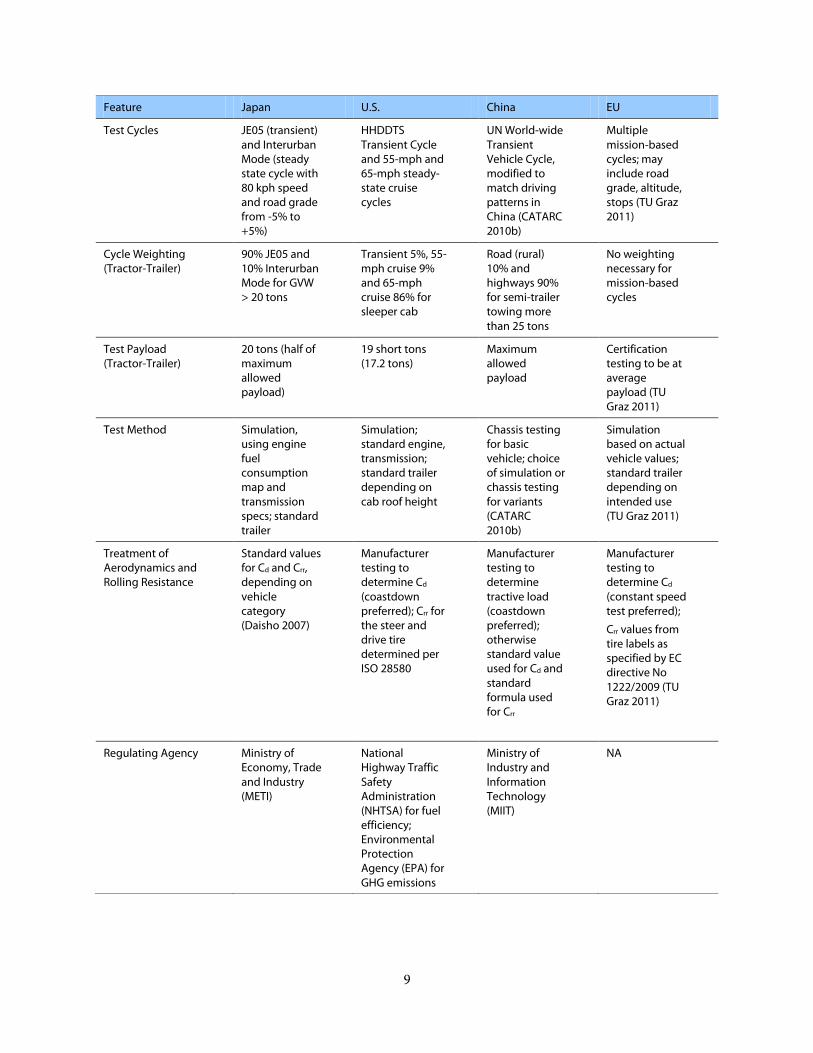
Feature Japan U.S. China EU
Test Cycles JE05 (transient) and Interurban Mode (steady state cycle with 80 kph speed and road grade from -5% to +5%)
HHDDTS Transient Cycle and 55-mph and 65-mph steady-state cruise cycles
UN World-wide Transient Vehicle Cycle, modified to match driving patterns in China (CATARC 2010b)
Multiple mission-based cycles; may include road grade, altitude, stops (TU Graz 2011)
Cycle Weighting (Tractor-Trailer)
90% JE05 and 10% Interurban Mode for GVW > 20 tons
Transient 5%, 55-mph cruise 9% and 65-mph cruise 86% for sleeper cab
Road (rural) 10% and highways 90% for semi-trailer towing more than 25 tons
No weighting necessary for mission-based cycles
Test Payload (Tractor-Trailer)
20 tons (half of maximum allowed payload)
19 short tons (17.2 tons)
Maximum allowed payload
Certification testing to be at average payload (TU Graz 2011)
Test Method Simulation, using engine fuel consumption map and transmission specs; standard trailer
Simulation; standard engine, transmission; standard trailer depending on cab roof height
Chassis testing for basic vehicle; choice of simulation or chassis testing for variants (CATARC 2010b)
Simulation based on actual vehicle values; standard trailer depending on intended use (TU Graz 2011)
Treatment of Aerodynamics and Rolling Resistance
Standard values for Cd and Crr, depending on vehicle category (Daisho 2007)
Manufacturer testing to determine Cd (coastdown preferred); Crr for the steer and drive tire determined per ISO 28580
Manufacturer testing to determine tractive load (coastdown preferred); otherwise standard value used for Cd and standard formula used for Crr
Manufacturer testing to determine Cd (constant speed test preferred);
Crr values from tire labels as specified by EC directive No 1222/2009 (TU Graz 2011)
Regulating Agency Ministry of Economy, Trade and Industry (METI)
National Highway Traffic Safety Administration (NHTSA) for fuel efficiency; Environmental Protection Agency (EPA) for GHG emissions
Ministry of Industry and Information Technology (MIIT)
NA

International Alignment of Fuel Efficiency Standards for Heavy-Duty Vehicles © ACEEE
10
In February 2013, Canada adopted heavy-duty GHG emissions standards essentially the same as the U.S.
heavy-duty GHG standards (Canada Gazette 2012). The point of regulation in Canada will typically be the
importer, rather than the manufacturer, however, since most heavy-duty vehicles purchased there are
imported. This may lead to compliance strategies that differ from those that will be used in the U.S.
Mexico is developing heavy-duty fuel efficiency standards as well. Ultra-low sulfur diesel and advanced
emissions technologies would need to be readily available for Mexico to adopt the same standards as those
adopted in the U.S. and Canada, since engine efficiency improvements rely on these technologies. In
addition, data on highway driving speeds will be required to determine whether a similar levels of
investment in aerodynamic equipment is warranted in Mexico as in the U.S. and Canada. On the whole,
however, the long distances covered by over-the-road trucks in the three countries suggest important
similarities in driving patterns. This, together with the fact that the same manufacturers produce the
vehicles for all three markets, indicate that North America presents an opportunity for a high degree of
program alignment.
VEHICLE CERTIFICATION PROCESS
In order to introduce key elements of heavy-duty standards that need to be considered in exploring
alignment options, we compare here the steps required to test and certify a tractor truck in various
regions, with emphasis on Japan and the U.S. For this purpose we consider a Class 8 (GVW>33,000
lbs., or 14,969 kg) tractor truck with a high roof and a day cab. Under the U.S. program, this is
assumed to be a regional-haul truck that will pull a van trailer. In Japan, this vehicle is simply a tractor
truck over 20 tons GVWR.
The fuel efficiency test protocols for heavy-duty vehicles in Japan and the U.S. are based on vehicle
simulation; neither requires physical testing of the vehicle. The U.S. program will use the EPA’s
Greenhouse Gas Emissions Model (GEM) (EPA 2011). While in theory GEM accepts a large number
of vehicle-specific inputs, including engine fuel consumption map, mechanical attributes, control
algorithms, and driver inputs, the majority of the inputs to GEM for purposes of vehicle certification
in the current program are default values provided by the regulating agencies (EPA and NHTSA
2011a). The manufacturer will provide only vehicle type and model year, coefficients of drag and
rolling resistance, and existence or non-existence of specific weight-reducing components, idle
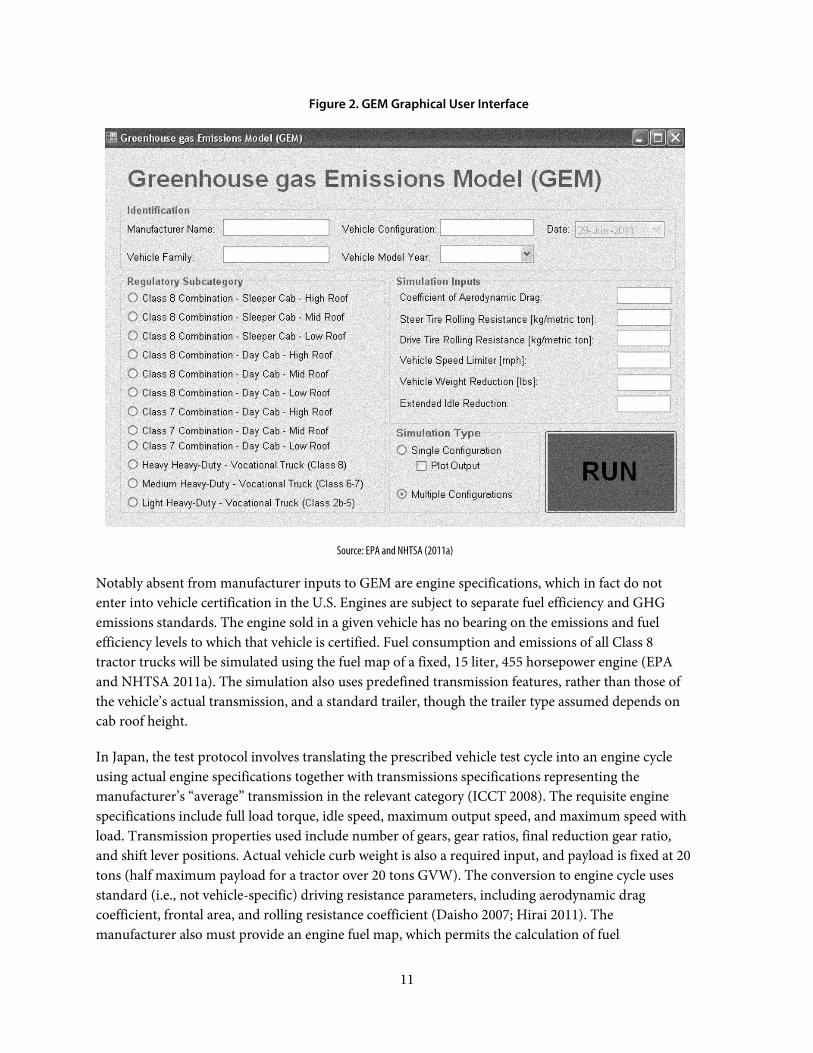
reduction system, and vehicle speed-limiting system, as shown in Figure 2. GEM will calculate CO2
emissions and fuel consumption over three test cycles: the Heavy Heavy-Duty Diesel Truck Schedule
(HHDDTS) Transient Cycle (see Figure ), and 55-mph and 65-mph steady-state cruise cycles. To
determine overall CO2 emissions and fuel efficiency, the model applies weightings of 19%, 17%, and
64% (in the case of a tractor truck with day cab) to the results for the three cycles (EPA and NHTSA
2011a, 2011b).
11
Figure 2. GEM Graphical User Interface
Source: EPA and NHTSA (2011a)
Notably absent from manufacturer inputs to GEM are engine specifications, which in fact do not
enter into vehicle certification in the U.S. Engines are subject to separate fuel efficiency and GHG
emissions standards. The engine sold in a given vehicle has no bearing on the emissions and fuel
efficiency levels to which that vehicle is certified. Fuel consumption and emissions of all Class 8
tractor trucks will be simulated using the fuel map of a fixed, 15 liter, 455 horsepower engine (EPA
and NHTSA 2011a). The simulation also uses predefined transmission features, rather than those of
the vehicle’s actual transmission, and a standard trailer, though the trailer type assumed depends on
cab roof height.
In Japan, the test protocol involves translating the prescribed vehicle test cycle into an engine cycle
using actual engine specifications together with transmissions specifications representing the
manufacturer’s “average” transmission in the relevant category (ICCT 2008). The requisite engine
specifications include full load torque, idle speed, maximum output speed, and maximum speed with
load. Transmission properties used include number of gears, gear ratios, final reduction gear ratio,
and shift lever positions. Actual vehicle curb weight is also a required input, and payload is fixed at 20
tons (half maximum payload for a tractor over 20 tons GVW). The conversion to engine cycle uses
standard (i.e., not vehicle-specific) driving resistance parameters, including aerodynamic drag
coefficient, frontal area, and rolling resistance coefficient (Daisho 2007; Hirai 2011). The
manufacturer also must provide an engine fuel map, which permits the calculation of fuel
International Alignment of Fuel Efficiency Standards for Heavy-Duty Vehicles © ACEEE
12
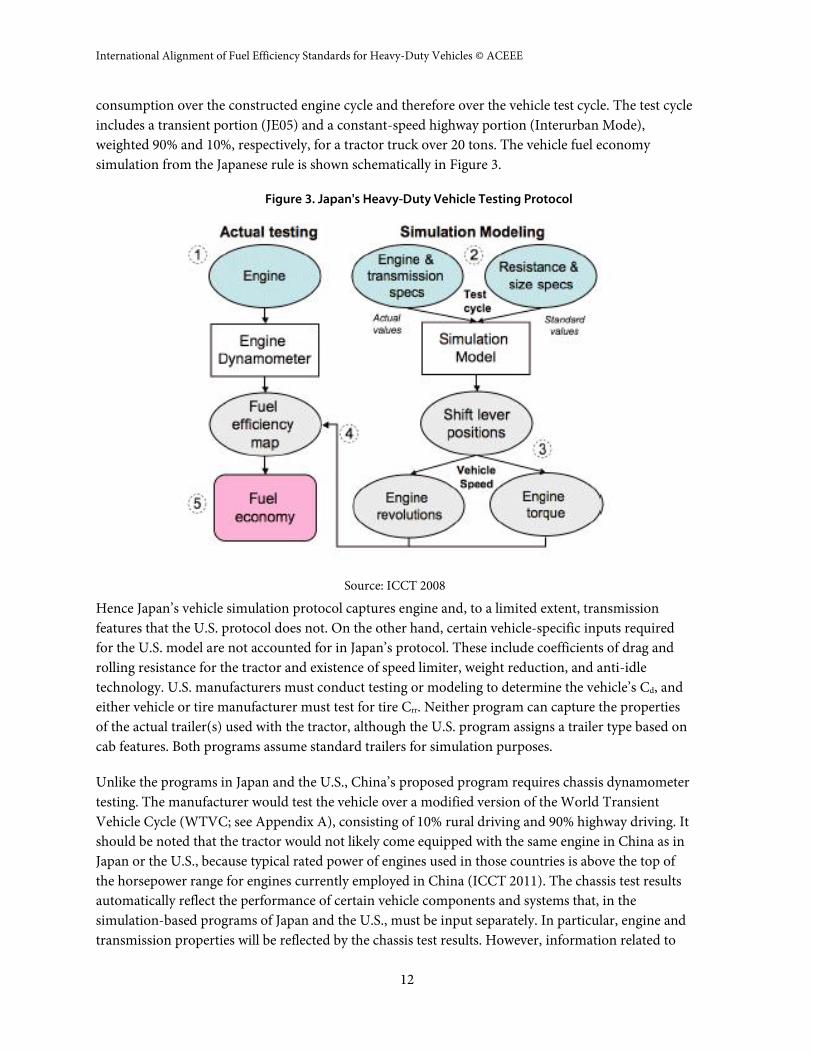
consumption over the constructed engine cycle and therefore over the vehicle test cycle. The test cycle
includes a transient portion (JE05) and a constant-speed highway portion (Interurban Mode),
weighted 90% and 10%, respectively, for a tractor truck over 20 tons. The vehicle fuel economy
simulation from the Japanese rule is shown schematically in Figure 3.
Figure 3. Japan's Heavy-Duty Vehicle Testing Protocol
Source: ICCT 2008
Hence Japan’s vehicle simulation protocol captures engine and, to a limited extent, transmission
features that the U.S. protocol does not. On the other hand, certain vehicle-specific inputs required
for the U.S. model are not accounted for in Japan’s protocol. These include coefficients of drag and
rolling resistance for the tractor and existence of speed limiter, weight reduction, and anti-idle
technology. U.S. manufacturers must conduct testing or modeling to determine the vehicle’s Cd, and
either vehicle or tire manufacturer must test for tire Crr. Neither program can capture the properties
of the actual trailer(s) used with the tractor, although the U.S. program assigns a trailer type based on
cab features. Both programs assume standard trailers for simulation purposes.
Unlike the programs in Japan and the U.S., China’s proposed program requires chassis dynamometer
testing. The manufacturer would test the vehicle over a modified version of the World Transient
Vehicle Cycle (WTVC; see Appendix A), consisting of 10% rural driving and 90% highway driving. It
should be noted that the tractor would not likely come equipped with the same engine in China as in
Japan or the U.S., because typical rated power of engines used in those countries is above the top of
the horsepower range for engines currently employed in China (ICCT 2011). The chassis test results
automatically reflect the performance of certain vehicle components and systems that, in the
simulation-based programs of Japan and the U.S., must be input separately. In particular, engine and
transmission properties will be reflected by the chassis test results. However, information related to

13
tractive load, such as drag and rolling resistance coefficients, will still be needed as inputs to the
chassis test in order to arrive at an estimate of on-road fuel efficiency. Furthermore, manufacturers
will still need to supply the full array of engine, transmission and other simulation inputs in China’s
program, because the fuel consumption of variants of the basic models that will be tested on the
chassis dynamometer will still be determined through vehicle simulation.
The certification procedure in the EU also is expected to be based on simulation modeling, so
manufacturers would need to provide full vehicle and component specifications, including an engine
map. The EU protocol under development appears to maximize the use of actual vehicle
specifications. Vehicles pulling trailers will be simulated with a standard trailer of the appropriate
type, according to an extensive segmentation of trailers (TU Graz 2011). A schematic of the EU
protocol is shown in Figure 4. Many vehicles, including certain tractor-trailers, would be simulated
over more than one drive cycle, because test cycles for purposes of certification will be defined not
only by vehicle specifications, but also by intended use (TU Graz 2011).
Figure 4. Schematic Diagram of Proposed HDV Simulation for the EU
Source: TU Graz 2011
A comparison of protocols in Japan, the U.S., China, and the EU reveals how structural elements can
influence the types of fuel efficiency improvements likely to result from the programs. Table 3 shows
which elements are reflected in each program.

International Alignment of Fuel Efficiency Standards for Heavy-Duty Vehicles © ACEEE
14
Table 3. Technology Efficiencies Captured in Heavy-Duty Programs
Technology Japan U.S., Canada China EU4
Engine Yes Through separate engine standards
Yes Yes
Transmission Manufacturer’s average manual transmissions simulated; automatics assigned a fixed percent efficiency loss
Optional; by demonstration outside of standard protocol
Yes Yes
Hybridization Unclear to what extent hybrid benefits will be captured
By demonstration outside of standard protocol
Yes Yes
Aerodynamic drag and tire rolling resistance (tractor)
No Yes Yes Yes
Trailers No No No No
III. Heavy-Duty Program Elements This section reviews five structural elements of a heavy-duty vehicle rule for fuel efficiency or GHG
emissions standards: metrics for the standards, vehicle segmentation, test cycles, test methods, and
stringency of standards. Similar treatment of some if not all of these elements would presumably be
required to align programs across regions.
METRICS
To achieve its intended outcomes without distorting the vehicle market, any program of heavy-duty
fuel efficiency or GHG standards must measure fuel consumption or GHG emissions in a way that
reflects the work that vehicles do. Heavy-duty standards to date have been defined in terms of fuel
consumption or GHG emissions per unit distance (in the cases of Japan and China proposed) or per
unit payload weight-distance (for U.S. vocational vehicles and tractor trucks). If test payload for each
vehicle class is fixed, then the difference between these two metrics is essentially a conversion factor.
Payload is a key determinant of a vehicle’s fuel consumption, but it is not obvious how payload should
be specified for purposes of testing. Maximum rated payload will overstate typical loads, because
vehicles often drive part-empty or with loads of low density. While the U.S. and Japan require that
tractor-trailers be tested at loads well below the maximum weight, China is proposing full-load testing
(CATARC 2010a). Maximum load also varies considerably across regions. A metric could be
constructed to factor in performance at various loads, though this adds complexity to the standard.
4 No regulatory program; based on certification procedure under development.
15
An alternative approach would be to fix gross vehicle weight for testing purposes. In that case, a
metric of fuel use per payload ton-kilometer would give greater credit for vehicle weight reduction
than would a fuel-consumption-per-kilometer metric, because reducing vehicle weight would allow
increased payload and therefore improved performance under this metric. This approach would be
appropriate for vehicles that are constrained by limits on gross vehicle weight. It should be noted,
however, that most freight truck miles in the U.S. are driven by “cubed out” vehicles (MJ Bradley
2009; EPA and NHTSA 2011a) for which reductions in tare weight do not permit increased loadings.
SEGMENTATION OF VEHICLES
Central to a program of heavy-duty standards is the way the vehicle market is segmented. A segment
is a set of vehicles that, due to similarities in design and/or usage are treated in the same way under
the program. More stringent standards will typically call for a higher degree of segmentation so that
the standards can be more closely tailored to the vehicles to which they apply. Otherwise, the standard
may incentivize suboptimal vehicle specification for some applications. Alternatively, increased
stringency can be accommodated through expanded flexibility mechanisms, such as allowing
manufacturers to average emissions over groups of vehicles. Allowing averaging often raises questions
of fairness with respect to limited-line manufacturers, however.
Regional Comparison
The U.S. heavy-duty rule defines nine types of tractor trucks, each defined by one of three roof
heights, and day vs. sleeper cab, with day cab further divided into two weight classes (above and below
15 tons GVW) (EPA and NHTSA 2011a). Vocational vehicles, though a more diverse group, have
only three classes: light (below 8.9 tons), medium (8.9 to 15 tons) and heavy (above 15 tons). Buses are
included in these classes. The heavy-duty pickups and vans covered by the U.S. rule are treated in a
fundamentally different way, and this discussion does not apply to those vehicles.
Japan has only two tractor truck segments, based on GVW. Segmentation of straight trucks is far
more extensive and also weight-based. Japan has separate bus segments, defined by weight and type.
China has extensive, weight-based segmentation of tractor trucks, as well as straight trucks, dumpers,
and buses.
The segmentation under discussion in the EU involves two distinct dimensions, one based on vehicle
use patterns and the other on physical characteristics of the vehicle. Vehicles are assigned to one of
five drive cycles: long haul, regional delivery, urban delivery, municipal utility, and construction. The
second dimension overlays on this a preexisting classification comprising 18 classes based on vehicle
weight and axle/chassis configuration. The result is 25 segments in total (TU Graz 2011; see Appendix
C).
Segmentation schemes as adopted or envisioned for the four regions are compared in Figure 5.
International Alignment of Fuel Efficiency Standards for Heavy-Duty Vehicles © ACEEE
16
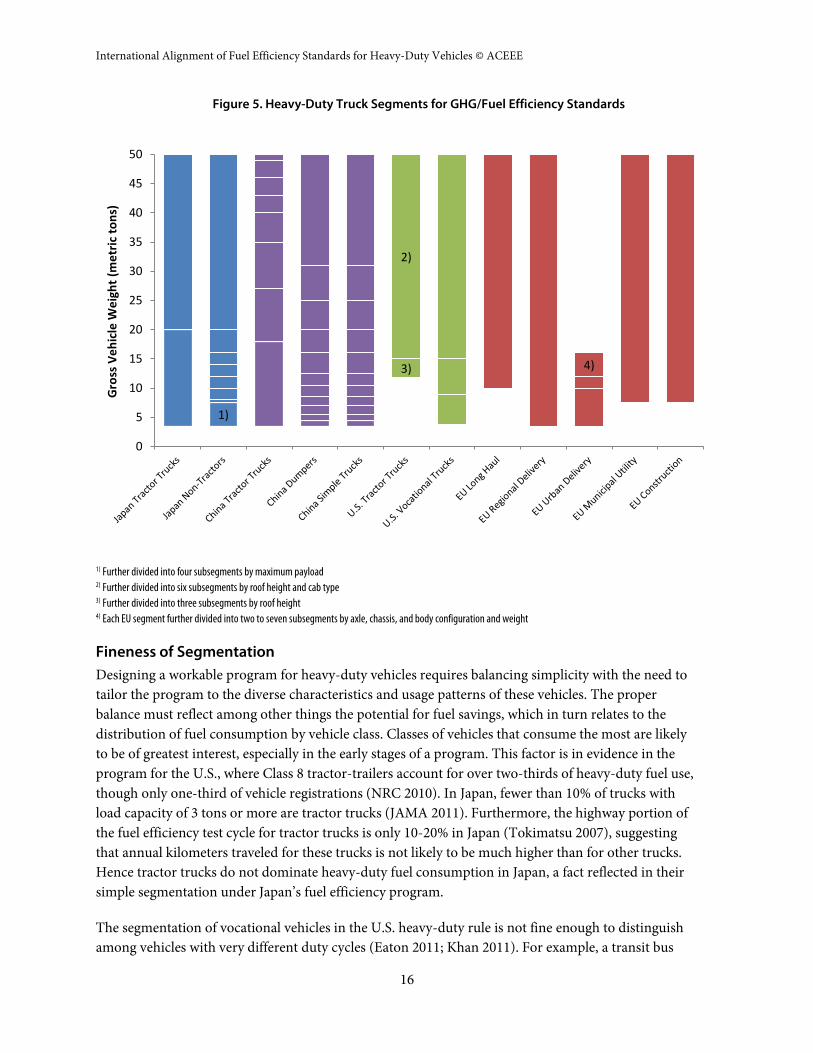
Figure 5. Heavy-Duty Truck Segments for GHG/Fuel Efficiency Standards
1) Further divided into four subsegments by maximum payload 2) Further divided into six subsegments by roof height and cab type 3) Further divided into three subsegments by roof height 4) Each EU segment further divided into two to seven subsegments by axle, chassis, and body configuration and weight
Fineness of Segmentation
Designing a workable program for heavy-duty vehicles requires balancing simplicity with the need to
tailor the program to the diverse characteristics and usage patterns of these vehicles. The proper
balance must reflect among other things the potential for fuel savings, which in turn relates to the
distribution of fuel consumption by vehicle class. Classes of vehicles that consume the most are likely
to be of greatest interest, especially in the early stages of a program. This factor is in evidence in the
program for the U.S., where Class 8 tractor-trailers account for over two-thirds of heavy-duty fuel use,
though only one-third of vehicle registrations (NRC 2010). In Japan, fewer than 10% of trucks with
load capacity of 3 tons or more are tractor trucks (JAMA 2011). Furthermore, the highway portion of
the fuel efficiency test cycle for tractor trucks is only 10-20% in Japan (Tokimatsu 2007), suggesting
that annual kilometers traveled for these trucks is not likely to be much higher than for other trucks.
Hence tractor trucks do not dominate heavy-duty fuel consumption in Japan, a fact reflected in their
simple segmentation under Japan’s fuel efficiency program.
The segmentation of vocational vehicles in the U.S. heavy-duty rule is not fine enough to distinguish
among vehicles with very different duty cycles (Eaton 2011; Khan 2011). For example, a transit bus
1)
3)
2)
4)
0
5
10
15
20
25
30
35
40
45
50
Gro
ss V
eh
icle
We
igh
t (m
etr
ic t
on
s)
17
and a utility vehicle of the same GVWR would be tested for certification over the same cycles and be
subject to the same standard. In the EU, by contrast, segmentation would take duty cycles into
account. In fact, in some cases vehicles there might be differentiated based only on intended duty
cycle, so that two virtually identical vehicles could be placed into different segments. Tractor trucks
can fall into both regional delivery and long haul segments, for example (TU Graz 2011). While this
feature helps to address the problem of setting standards for vehicles that are used in different ways, it
raises implementation issues as well.
TEST CYCLES
A vehicle drive cycle, or operating cycle, is a specification of the conditions of the vehicle at each point
along a trajectory. We use the terms “duty cycle” and “test cycle” to mean, respectively, a typical drive
cycle for a vehicle in service and a drive cycle over which a vehicle is tested to measure its
performance. Vehicles’ rate of fuel consumption, as well as the effectiveness of technologies to reduce
fuel consumption, varies greatly with drive cycle. Hence choice of test cycles is a crucial component of
vehicle standards design.
Light-duty vehicle testing in the U.S. involves a city cycle, with relatively low speeds and extensive
stop-and-start driving, and a highway cycle, involving higher speeds and relatively steady-state
driving. For heavy-duty vehicles, a more refined drive cycle taxonomy may be called for, given the
wide variation in duty cycles, the dedicated operation of many vehicles in specific duty cycles, the high
sensitivity of fuel efficiency to duty cycle, and the very large per-vehicle fuel expenditures at stake.
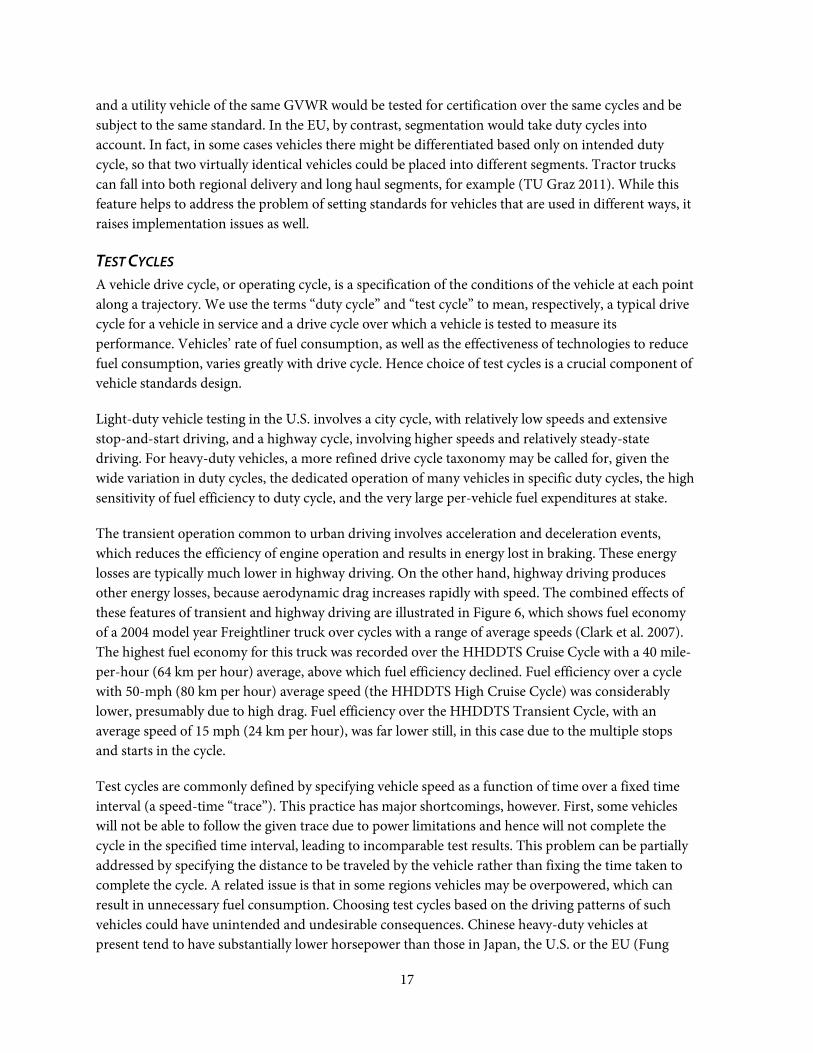
The transient operation common to urban driving involves acceleration and deceleration events,
which reduces the efficiency of engine operation and results in energy lost in braking. These energy
losses are typically much lower in highway driving. On the other hand, highway driving produces
other energy losses, because aerodynamic drag increases rapidly with speed. The combined effects of
these features of transient and highway driving are illustrated in Figure 6, which shows fuel economy
of a 2004 model year Freightliner truck over cycles with a range of average speeds (Clark et al. 2007).
The highest fuel economy for this truck was recorded over the HHDDTS Cruise Cycle with a 40 mile-
per-hour (64 km per hour) average, above which fuel efficiency declined. Fuel efficiency over a cycle
with 50-mph (80 km per hour) average speed (the HHDDTS High Cruise Cycle) was considerably
lower, presumably due to high drag. Fuel efficiency over the HHDDTS Transient Cycle, with an
average speed of 15 mph (24 km per hour), was far lower still, in this case due to the multiple stops
and starts in the cycle.
Test cycles are commonly defined by specifying vehicle speed as a function of time over a fixed time
interval (a speed-time “trace”). This practice has major shortcomings, however. First, some vehicles
will not be able to follow the given trace due to power limitations and hence will not complete the
cycle in the specified time interval, leading to incomparable test results. This problem can be partially
addressed by specifying the distance to be traveled by the vehicle rather than fixing the time taken to
complete the cycle. A related issue is that in some regions vehicles may be overpowered, which can
result in unnecessary fuel consumption. Choosing test cycles based on the driving patterns of such
vehicles could have unintended and undesirable consequences. Chinese heavy-duty vehicles at
present tend to have substantially lower horsepower than those in Japan, the U.S. or the EU (Fung
International Alignment of Fuel Efficiency Standards for Heavy-Duty Vehicles © ACEEE
18
2011). Furthermore, China plans to test vehicles at full load. Consequently, their vehicle generally
cannot accelerate as quickly as is required by certain segments of the WTVC, leading the government
to use a modified version of the cycle for testing.
Figure 6. Average Fuel Economy of 2004 MY Freightliner Truck
over Cycles of Various Average Speeds
Source: ACEEE, from data in Clark et al. (2007)
A second shortcoming of specifying test cycles by speed-time trace is that this omits key drive cycle
features, including grade. Grade is included in Japan’s Interurban Mode (Figure A-6), for instance. It
strongly influences fuel consumption and is a major consideration in vehicle specification, as for
example in the case of a vehicle to be used on mountainous routes. While grade effects can be
captured in chassis testing or simulation, their inclusion adds substantial complexity to the project of
identifying a full set of test cycles.
Choice of Test Cycles
The objective of test cycle design is to capture the salient features of actual duty cycles. What those
features are warrants careful consideration. While a single test cycle cannot approximate the duty
cycles of an entire class of vehicles, too large an array of test cycles yields an unwieldy test protocol.
Ideally, test cycle properties would include:
1. Emissions performance of vehicles in the aggregate over the prescribed test cycles will allow a
good estimate of real-world aggregate emissions.
2. Results of vehicle testing over the prescribed cycles will allow buyers to compare and optimize
vehicles’ fuel consumption over their actual duty cycles.
y = -0.0022x2 + 0.2017x + 1.7993R² = 0.894
0
1
2
3
4
5
6
7
8
0 10 20 30 40 50 60
Fue
l Eco
no
my
(mp
g)
Average Speed (mph)

19
The first property is required to estimate the savings a heavy-duty program will provide, and the
second is necessary to ensure that the standard will drive effective technologies in the vehicle market.
Achieving the second property poses a big challenge, given the variations in users’ duty cycles, but is
necessary if the program is to incentivize and facilitate the purchase of appropriate fuel efficiency
technologies.
The heavy-duty regulatory programs discussed in this report use one of two approaches to vehicle test
cycles. Both involve picking a set of cycles that adequately describes the range of typical driving
behaviors and assigning each vehicle segment to a subset of those cycles. The approaches can be
described as follows:
Approach 1: Test cycles represent typical, complete duty cycles, e.g., long-haul truck cycle or
refuse truck cycle. Each vehicle is tested over all cycles it might plausibly be used for, and the
certified performance of that vehicle then depends upon the vehicle’s intended use.
Approach 2: Test cycles represent common driving “modes,” e.g., urban or high-speed highway,
and each vehicle is tested over all cycles likely to be part of its duty cycle. In this case, the certified
performance of the vehicle is typically defined as a weighted sum of the results over the modal
cycles.
The first approach is under consideration for the EU program (TU Graz 2011). Japan and the U.S.
will use the second approach, with weights adjusted to best represent driving patterns for each vehicle
segment. China’s approach is a variation on the second approach, in which a single existing vehicle
cycle, the WTVC, is adapted to driving patterns in China. The WTVC is essentially a composite of
three cycle segments (urban, road and highway); China creates test cycles by applying weightings that
vary by vehicle type to the three segments.5
While the individual test cycles in Approach 1 will be realistic drive cycles for many vehicles, it is
Approach 2 that has the flexibility to represent the full range of duty cycles across applications and
regions. Research on U.S. vehicle cycles supports the idea that all real-world driving behaviors, at least
insofar as they affect fuel consumption, can be represented as linear combinations of a few basic cycles
(Clark et al. 2009).
On the other hand, common modes of driving, such as transient and highway driving, may have
important differences across regions. This is evident from research to develop a Worldwide Light-
Duty Test Cycle (ACEA 2011). This work demonstrates that speed on a given roadway type (urban,
rural, motorway) varies substantially from region to region and concludes that roadway type is
therefore not a good basis for defining driving modes. ACEA collected traffic data for each roadway
type in several regions and assigned all driving to one of four speed bins (low, medium, high, and
extra-high). It then used these bins, characterized by threshold maximum speeds, rather than roadway
2 It is not entirely clear how this will be done, given that vehicle speed in the WTVC does not reach zero between the road and
highway cycle segments, so the two cannot be separated, strictly speaking.

International Alignment of Fuel Efficiency Standards for Heavy-Duty Vehicles © ACEEE
20
types, as the basis for defining driving modes. The ACEA work suggests that further consideration of
driving modes and further data collection are both prerequisites for developing heavy-duty test cycles
that could be used across regions. Nonetheless, the idea that a small number of cycles can adequately
represent the full range of driving behaviors is borne out to some extent by comparisons of other
parameters such as average speed and idle duration, which have been shown to be predictive of
maximum speed (ACEA 2011).
The U.N. has worked toward an international test cycle in developing the WTVC (see Appendix A),
which is based upon driving data from several regions. This process sought to facilitate the
development of compliant vehicles for a global market. While perhaps appropriate for criteria
pollutants, however, this approach is less promising for GHG emissions testing, for which regions will
require test cycles that actually represent regional driving. Also, the National Renewable Energy
Laboratory has created a tool that, given data collected from in-use vehicles, will create a
representative drive cycle for those vehicles, or alternatively will identify an existing industry-accepted
drive cycle that provides the best fit for the supplied data (NREL 2011).
Existing Test Cycles
Appendix A discusses several of the principal heavy-duty test cycles in use in the world today. While most
cycles included there are vehicle cycles, several have been used to generate companion engine cycles,
which are used in criteria pollutant regulatory programs.
Table 4 lists test cycles used for criteria pollutant emissions and for fuel efficiency and GHG emissions by
region. Where engine and vehicle cycle names coincide, the engine cycle has been derived from the
vehicle cycle of the same name.
Table 4. Test Cycles for Criteria Pollutant Emissions and GHG Emissions/Fuel Efficiency by Region6
Criteria GHG/Fuel Efficiency
Japan Engine: JE05 Engine: 30 speed-torque points
Vehicle: JE05 and Interurban Mode
U.S. Engine: FTP and SET Engine: FTP and SET
Vehicle: HHDDTS Transient, 55 and 65 mph steady-state cruise
China Engine: ETC, ESC, and ELR Engine: 81 speed-torque points
Vehicle: Modified WTVC
EU Engine: ETC, ESC, and ELR through Euro V; WHTC and WHSC beginning in 2013
Vehicle: Complete, vocation-specific cycles (under consideration)
6 Several of these cycles are discussed in Appendix A. For additional details, see http://transportpolicy.net.
21
Table 4 shows some overlap between the cycles used for criteria and fuel efficiency testing. Creating a
test cycle is a laborious process involving extensive data collection and analysis. Furthermore, if fuel
efficiency and criteria pollutant testing are done on different cycles, it is difficult to verify
simultaneous improvement on both. This is a concern particularly because some criteria pollutant
reduction strategies adversely affect fuel efficiency, and vice versa. For these reasons, regulators may
prefer that existing criteria pollutant testing cycles be used for fuel efficiency testing whenever
possible. Manufacturers may take the same view, because they have “fine-tuned” their products to
existing criteria emissions cycles. However, existing test cycles for criteria pollutant emissions will not
generally be adequate for fuel efficiency testing.
A key difference between GHG emissions or fuel efficiency standards and criteria pollutant emissions
standards is that, while criteria pollutant standards to date have sought to dramatically reduce
emissions, fuel efficiency and GHG standards aim to reduce fuel consumption and emissions
incrementally and by a much smaller percentage. A test cycle that serves to place an upper bound on
emissions thus may be adequate for criteria pollutants, while a test cycle for measuring fuel
consumption will need to better represent actual operation. In addition, in the case of fuel efficiency
testing, the buyer and therefore the manufacturer will be interested in having test results that can be
used to predict on-road fuel consumption for individual vehicles with a reasonable degree of
accuracy.
TESTING AND MODELING METHODS
There are multiple technical approaches to evaluating vehicle fuel consumption. They generally
require physical testing of vehicles and/or vehicle component and systems, together with calculation
or modeling to translate the test results into the desired measure of performance. Roughly speaking,
the type of testing used can be placed on a spectrum defined by the complexity of the components or
systems that are physically tested. At one end of the spectrum is road testing of complete vehicles,
which delivers an accurate measure of vehicle performance under the given test conditions, with no
need for further calculation. The results are completely specific to the vehicle and conditions,
however.
At the other end of the spectrum, individual vehicle components including engine and transmissions
parts could be fully specified to generate inputs to a highly detailed model that simulates the vehicle’s
fuel consumption given driving conditions and practices. This approach is very flexible, in that, given
a perfect model and complete component specifications, one can predict the performance of any
vehicle under any conditions simply by running the model. The challenge in this case is building,
validating, and updating such a complex model and providing the very detailed inputs required.
Simulation modeling in practice can deliver a very rough or very accurate estimate of vehicle
performance, depending on the detail of the component information provided and the sophistication
of the model. For example, a simulation model typically requires detailed information on engine fuel
consumption as an input. While this is often taken to be a set of fuel consumption rates for an array of
engine speed/torque points, full representation of the engine for simulation purposes would also
require information such as particulate filter back pressure, engine cooling loads, and the dynamic
response of engine controls. The model cannot detect the efficiency gain due to a technology not

International Alignment of Fuel Efficiency Standards for Heavy-Duty Vehicles © ACEEE
22
anticipated in the structure of the model, or applied to a component not fully represented in the
model.
In between road testing and pure simulation lies chassis testing, which directly measures the
performance of the entire drive train. This approach requires knowledge of the vehicle’s tractive load,
which is used to generate the appropriate chassis dynamometer settings. Tractive load is in turn
calculated from coefficients of drag and rolling resistance (or combined coastdown test results)
obtained through additional testing. Due to the huge number of heavy-duty vehicle configurations
sold and the varying conditions in which they are driven, chassis testing of every vehicle configuration
would also be prohibitively expensive, however. The U.S. rule notes:
The agencies evaluated the options available for one tractor model (provided as
confidential business information from a truck manufacturer) and found that the
company offered three cab configurations, six axle configurations, five front
axles, 12 rear axles, 19 axle ratios, eight engines, 17 transmissions, and six tire
sizes—where each of these options could impact the fuel consumption and CO2
emissions of the tractor. Even using representative grouping of tractors for
purposes of certification, this presents the potential for many different
combinations that would need to be tested if a standard were adopted based on a
chassis test procedure (EPA and NHTSA 2011a).
The program under development in China is based on chassis testing, but would require testing for
only a representative set of vehicles; results for similar vehicles would be generated through
simulation.
An approach that plays a role in all of the programs described here is to test the engine on an engine
dynamometer and simulate the performance of the entire vehicle based on the engine test results,
together with information on aerodynamic drag, rolling resistance, and other vehicle loads. In this
approach, the large number of powertrain configurations associated with a single engine or family of
engines is handled by the model. This is not adequate to handle a hybrid vehicle, however, and in fact
it is not clear that models in use today can properly represent the subtleties of the interplay between
engine, transmission, and controls that will be crucial to heavy-duty vehicle fuel efficiency in the
coming years. For that reason, some have suggested the use of “power pack” testing, in which the
engine and transmission are testing as a unit.
Researchers developing a certification procedure for greenhouse gas emissions and fuel consumption
of HDV in the EU noted that a test method should:
Be repeatable and reproducible;
Incentivize efficiency technologies and optimize the vehicle as a whole;
Be highly sensitive to fuel savings;
Have reasonable cost; and
Be simple and robust
23
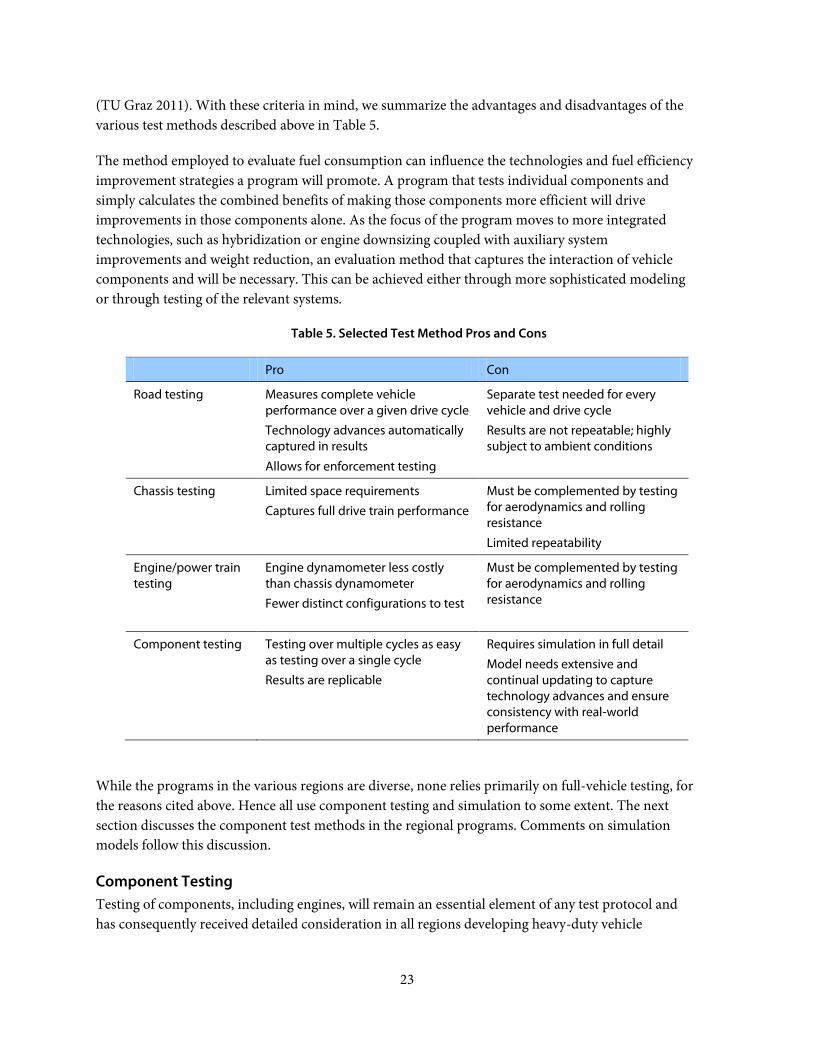
(TU Graz 2011). With these criteria in mind, we summarize the advantages and disadvantages of the
various test methods described above in Table 5.
The method employed to evaluate fuel consumption can influence the technologies and fuel efficiency
improvement strategies a program will promote. A program that tests individual components and
simply calculates the combined benefits of making those components more efficient will drive
improvements in those components alone. As the focus of the program moves to more integrated
technologies, such as hybridization or engine downsizing coupled with auxiliary system
improvements and weight reduction, an evaluation method that captures the interaction of vehicle
components and will be necessary. This can be achieved either through more sophisticated modeling
or through testing of the relevant systems.
Table 5. Selected Test Method Pros and Cons
Pro Con
Road testing Measures complete vehicle performance over a given drive cycle
Technology advances automatically captured in results
Allows for enforcement testing
Separate test needed for every vehicle and drive cycle
Results are not repeatable; highly subject to ambient conditions
Chassis testing Limited space requirements
Captures full drive train performance
Must be complemented by testing for aerodynamics and rolling resistance
Limited repeatability
Engine/power train testing
Engine dynamometer less costly than chassis dynamometer
Fewer distinct configurations to test
Must be complemented by testing for aerodynamics and rolling resistance
Component testing Testing over multiple cycles as easy as testing over a single cycle
Results are replicable
Requires simulation in full detail
Model needs extensive and continual updating to capture technology advances and ensure consistency with real-world performance
While the programs in the various regions are diverse, none relies primarily on full-vehicle testing, for
the reasons cited above. Hence all use component testing and simulation to some extent. The next
section discusses the component test methods in the regional programs. Comments on simulation
models follow this discussion.
Component Testing
Testing of components, including engines, will remain an essential element of any test protocol and
has consequently received detailed consideration in all regions developing heavy-duty vehicle

International Alignment of Fuel Efficiency Standards for Heavy-Duty Vehicles © ACEEE
24
programs. Component tests have both commonalities and differences across regions, which we
summarize below. More detail on component testing is provided in Appendix B.
Engines The U.S. program, which is unique in setting separate engine standards, directly regulates engine
manufacturers as well as vehicle manufacturers. This feature is perhaps more important in the U.S. than
in other regions such as Europe and Japan, where the heavy-duty industry is more integrated vertically
and vehicle manufacturers typically produce their own engines. In the U.S., setting engine standards has
the benefit of ensuring a consistent, long-term effort on advanced engine technologies, regardless of the
trajectory of fuel consumption reduction on complete vehicles.
While only the U.S. program includes a separate engine standard, engine testing will be needed in all
regions. Japan, China and the EU will use fuel consumption maps for individual engines as a crucial
input to vehicle simulation. All regions call for steady-state engine emissions data, requiring values at
anywhere from 18 (U.S.) to 81 (China) speed-torque points. The U.S. will use a weighted average of
emissions at these test points to certify engines (for tractor trucks; vocational engines will be certified
based on performance over a transient test cycle), while the remaining regions will use these steady-
state data points to generate the full engine GHG emissions map.
A major consideration in establishing engine test protocols in some regions has been that they should
match criteria pollutant protocols to the extent possible. The purpose of this is to (i) minimize the
testing burden on manufacturers and (ii) ensure that reductions in criteria pollutant emissions and
fuel consumption will occur simultaneously, rather than allowing one to be traded off against the
other, as has happened in the past (CNRE 2005). In view of the priority placed on maintaining
consistency between criteria pollutant and fuel consumption test protocols, we describe briefly the
European Union’s engine test cycles for criteria pollutants in Appendix A. As noted above, however,
programs to improve fuel consumption and reduce GHG emissions can be expected to require more
precision in the measurement of performance than criteria pollutant emissions programs have needed
to date, so maintaining such consistency in test protocols could in fact prove counterproductive.
Aerodynamic drag and rolling resistance Most programs require or permit the use of certain tests to
determine aerodynamic drag and rolling resistance, or tractive load as a whole. The U.S. and China both
recommend coastdown testing for this purpose, while the EU has indicated a preference for constant
speed testing (TU Graz 2011).
Japan’s program uses predefined values for aerodynamic drag and rolling resistance in simulating
vehicle performance and therefore will not drive aerodynamic and tire improvements. Tire-specific
values for rolling resistance are required in the U.S.; values from tire manufacturers based on
established tire test protocols are permitted. China permits the use of default “worst case” values for
both drag and rolling resistance coefficients for manufacturers electing not to do physical testing.
Further detail is provided in Appendix B.
Transmissions Japan’s simulation approach reflects transmission performance, in that the specifications of
the manufacturers’ average manual transmission are used to translate the prescribed vehicle test cycle into
an engine cycle. (CRNE 2005; see Figure 3.) The performance of automatic and automated manual

25
transmissions is represented by substituting in the simulation a manual transmission having the same
number of gears and gear ratios. Fuel efficiency is then assumed to be the same for the vehicle with the
automated manual as for the manual, while a vehicle with an automatic transmission is assumed to have
efficiencies 91% and 96% of the manual transmission efficiencies in the transient and interurban modes,
respectively.
The U.S. approach does not capture transmission improvements in the basic protocol. Advanced
transmissions can gain credit as an “advanced technology” if manufacturers demonstrate and quantify
their efficiency benefits to the satisfaction of the EPA and NHTSA. This may be done through A-to-B
chassis testing, for example (EPA and NHTSA 2011a). One transmission manufacturer has raised a
question of whether the performance of automatic and automated manual transmissions over a fixed
speed-time trace is the appropriate comparison, because real-world drive cycles may vary in duration
with the transmission type (Allison 2011).
Transmission performance presumably will be captured in the EU’s simulation model approach,
although details of the method have not yet been specified (TU Graz 2011). China’s protocol based on
chassis testing will necessarily capture transmission performance.
Other components Auxiliary loads such as AC, pumps, fans and PTO are often “off-cycle” loads, i.e., not
reflected in the test cycles used for certification. Hence if potential fuel savings from improvements in
these components are to be captured through the program, testing protocols may need to be improved or
supplemented, as has been done, for example, in the light-duty vehicle fuel economy label program in the
U.S. Also, U.S. light-duty GHG standards for model years 2012-2016 include credits for certain off-cycle
technologies, and such credits will be awarded under both the GHG and fuel economy rules for model
years 2017-2025.
Simulation
EU researchers’ investigation of the merits of the various test procedures with respect to these criteria
led to the conclusion that a simulation-based approach was clearly preferable to other options (TU
Graz 2011). The quality of the simulation remains a significant issue, however. Extensive validation of
model results against real world performance will be required to gain and maintain the confidence of
manufacturers and users, and continual model updates and validation will be essential. Among the
critical questions will be how well models can represent advanced technologies; this will vary
according to the nature of the technology and the properties of the model. Uncertainty about whether
a new technology will receive proper credit in the certification process could discourage development
of that technology.
In 2009, Ricardo conducted a review of commercially available software that could be used for heavy-
duty vehicle simulation (Fulem 2009). The study identified twenty-three tools, finally considering
nineteen of them for evaluation. The majority of these tools were constructed on programming
language such as C/C++ or FORTRAN, while eight tools were constructed with MATLAB-Simulink.
Ricardo evaluated these tools using multiple criteria, including: complexity, ease of use,cost and
customer support. DYMOLA, PSAT, AMESim, and AVL-Cruise were the top four tools according to
the Ricardo study. These tools were found to be capable of simulating dynamic behavior and
International Alignment of Fuel Efficiency Standards for Heavy-Duty Vehicles © ACEEE
26
interactions between systems; DYMOLA and AVL-Cruise were able to model the performance of new
and alternative designs and technologies. However, the study did not compare model outputs with
real-world data.
While having a common simulation model across regions would be convenient, it could be hard to
achieve, given historical, competitive, and technical considerations facing participating governments.
This becomes an issue to the extent that the models deliver different results from the same inputs,
especially if the results vary in unpredictable ways. At the same time, comparing results across models
can provide important evidence of the robustness of the simulation model approach (or lack thereof).
STRINGENCY
Typical rates of fuel consumption for a given vehicle may vary greatly across regions due to
differences in driving patterns. These differences, as well as differences in fuel prices, mean that the
fuel efficiency technologies that are cost-effective for that vehicle vary from region to region as well.
The levels of standards set for tractor-trailers in Japan and the U.S. illustrate these considerations.
Example: Stringency of Japan and U.S. Tractor Truck Standards
Consider once again a high-roof day cab tractor truck with GVW over 15 tons. Under the U.S.
standards, the fuel consumption target for this truck in 2014-2016 will be 9.0 gal per 1,000 ton-miles,
or 2.49 km/l using the specified test payload of 19 short tons. In Japan, the same vehicle will be
required to achieve a fuel efficiency of 2.01 km/l at half maximum payload (20 tons) (CNRE 2005,
Daisho 2007). While the level of the U.S. standard is nominally 24% higher than Japan’s, this is an
apples-to-oranges comparison, because the cycle weightings are very different in the two programs. In
Japan, fuel consumption over the JE05 Transient Cycle is weighted 90%, while the Interurban Mode, a
constant speed highway cycle, is weighted 10%. In addition, the Interurban Mode includes road grade
ranging from -5% to +5% (CNRE 2005). In the U.S. standard, the weightings of transient and highway
cycles are essentially reversed, with 19% weighting of the HHDDTS Transient Cycle and 81%
combined weighting of the two steady-state cruise cycles (EPA and NHTSA 2011a). The U.S. test
cycle does not include the effect of road grade.
We use EPA’s GEM to see how the differences in cycle weightings affect the estimated fuel
consumption of the given vehicle. Using appropriate inputs to the model, we find that the truck
achieves fuel efficiencies of 1.51 km/l, 2.95 km/l, and 2.41 km/l on the HHDDTS Transient Cycle, the
55-mile-per-hour (88.5 km-per-hour) steady-state cruise cycle, and the 65-mile-per-hour (104.5 km-
per-hour) steady-state cruise cycle, respectively. This yields an overall average fuel efficiency of 2.23
km/l using the U.S. cycle weights of 19%, 17%, and 64%, just above the fuel efficiency of 10.1 gallons
per 1,000 ton-miles (2.21 km/l) the agencies found for an average truck of this type in the rule.
In order to estimate how this truck would perform in Japan’s test, we assume that fuel efficiency over
the HHDDTS Transient Cycle is the same as fuel efficiency over the JE05 Cycle, and similarly for fuel
efficiencies over the 55-mph (88.5-kmph) U.S. and Japan’s 80.5-kmph Interurban Cycle. This truck
would achieve only 1.59 km/l using Japan’s cycle weightings, even ignoring the effect of grade in the
Interurban Mode and the 16% heavier test payload (20 metric tons vs. 19 short tons) required for the

27
Japanese test. In fact, the result is well below the average fuel efficiency of 1.80 km/l found in Japan in
2002 for similar trucks (CNRE 2005, Daisho 2007).
Adding now a U.S. 2015 model year engine and idle reduction technology, improved aerodynamic
drag and rolling resistance coefficients, and modest weight reduction, this truck will easily meet the
2015 U.S. standard. According to GEM, it will achieve fuel efficiencies of 1.58 km/l, 3.32 km/l, and
2.78 km/l on the Transient Cycle, the 55 mph steady-state cycle, and the 65 mph steady-state cycle,
respectively, giving a combined fuel economy of 2.49 km/l with U.S. cycle weighting. The truck’s
overall fuel efficiency increases by 12%, primarily due to efficiency improvements on the highway
cycles. However, using Japan’s cycle weightings, this more efficient truck will achieve a fuel efficiency
of only 1.66 km/l, an improvement of 5%, reflecting its modest improvement on the JE05 Transient
Cycle. It will fall far short of Japan’s 2015 standard of 2.01 km/l.
Similarly, a truck designed to meet Japan’s 2015 standard would be unlikely to meet the U.S. standard
for 2015. Presumably, manufacturers for Japan’s market will focus on improving fuel efficiency in
urban driving to order to meet Japan’s 2015 targets; they are unlikely to invest heavily in the
aerodynamic improvements that would be needed to meet the U.S. standard. By contrast, the 2015
improvements assumed above for the U.S. truck are aimed largely at reducing highway fuel
consumption.
Figure 7 shows the fuel efficiencies of the given truck before and after the U.S. package of technology
improvements, with individual cycle fuel efficiencies shown by color blocks. The solid horizontal lines
show the original truck’s weighted average fuel efficiency under the two-cycle weighting, while the
dotted lines show 2015 fuel efficiency standards for the U.S. and Japan.
The U.S. program sets the 2015 standard 12% above the 2010 baseline, while the Japanese standard
requires a 12% increase from the 2002 average to the 2015 target.
One clear implication of this example is that having a single numerical standard across regions for a
given truck would not be feasible. The enormous difference between cycle weights for the U.S. and
Japan, which reflects fundamental differences in real-world driving patterns, results in a far lower
nominal fuel efficiency target for Japan. This discrepancy cannot be addressed simply by adjusting the
cycle weights to match, because that could drive efficiency technologies inappropriate for one region
or the other. For example, increasing the weight of the interurban mode in Japan would incentivize
aerodynamic improvements to tractor-trailers. While these are highly cost-effective in the U.S., such
improvements would not necessarily make sense for tractor-trailers in Japan. Any viable program of
standards will necessarily reflect these region-specific conditions.

International Alignment of Fuel Efficiency Standards for Heavy-Duty Vehicles © ACEEE
28
Figure 7. Fuel Efficiency of Tractor-Trailer, GVW>20 tons, with U.S. and Japan Cycle Weightings
Flexibility Mechanisms
The stringency of a standard is determined not only by the numerical performance levels assigned to each
vehicle, but also by flexibilities that may be put in place to facilitate compliance with the standard. For
example, the programs in Japan and the U.S. permit manufacturers to comply with the standard on
average within in each vehicle class, rather than requiring that vehicles must achieve the standard
individually. Inclusion of such mechanisms in principle can reduce manufacturers’ compliance costs
without reducing the fuel savings and emissions reduction benefits of the program. On the other hand,
averaging raises issues of fairness, especially when the classes over which performance can be averaged are
large. In that case, manufacturers whose products do not cover the full range of vehicles in the class may
be unable to take advantage of the flexibility of averaging.
Alignment Considerations Aligning heavy-duty fuel efficiency standards in different regions presents fundamental challenges. In
particular, a fuel efficiency level that is achievable for a given vehicle in one region may not be
achievable for the same vehicle in a different region, given differences in driving patterns and other
regional conditions. There are less restrictive ways in which regulatory programs could be aligned,
however, that would contribute to achieving the objectives of maximizing fuel savings and
minimizing manufacturer compliance costs associated with meeting the standards. This section
considers which of the program elements discussed above might be amenable to alignment.
0
0.5
1
1.5
2
2.5
3
3.5Fu
el E
ffic
ien
cy (
km p
er
lite
r)
U.S. Weightings (19%, 17%, 64%) Japan Weightings (90%, 10%)
Transient 2010
Cruise 2010
High Cruise 2010
Transient 2015
Cruise 2015
High Cruise 2015
U.S. 2014 standard (2.49 km/l)
2010 truck, U.S. cycle weightings (2.23 km/l)
Japan 2015 standard (2.01 km/l)
2010 truck, Japan cycle weightings (1.59 km/l)

29
Segmentation The vehicle segmentation schemes in use have important features in common; but there
are also major disparities, as shown in Figure 5. Even for tractor trucks, the programs have adopted
diverse segmentation schemes, as shown in Figure 8. On top of the variations in number of segments,
weight class boundaries, and application that arise for all vehicle types, the U.S. and EU tractor
segmentation schemes add roof height and axle configuration, respectively. These factors present a
major barrier to a common system of segmentation.
Figure 8. Tractor Truck Segments
Test cycles As discussed above, all programs to date follow one of two approaches to vehicle test cycles:
Approach 1, which defines an array of complete duty cycles, or Approach 2, which defines a set of
modal cycles. Both approaches could assign multiple cycles to a single vehicle, which is exactly the
feature that allows the possibility of using the same set of cycles in all regions. Under Approach 1, the
fuel efficiency of a vehicle in a given region would be evaluated over the cycle or cycles relevant to that
region. In Approach 2, the vehicle would be evaluated over all modal cycles, and its fuel efficiency
would be defined as a weighted sum of the results, where the weights would be region-specific.
Advantages and disadvantages of the two approaches are shown in Table 6. Assuming typical duty
cycles in all regions can in fact be represented adequately for fuel consumption purposes as linear
URBAN DELIVERY LONG HAULREGIONAL DELIVERY
low, medium or high roof
4x2 or 6x2
low, medium or high roof 4x2 or 6x2
low, medium or high roof
0
5
10
15
20
25
30
35
40
45
50
Japan U.S. Day Cab EU RegionalDelivery
U.S. SleeperCab
China EU Long Haul
Gro
ss V
eh
icle
We
igh
t (t
on
s)

International Alignment of Fuel Efficiency Standards for Heavy-Duty Vehicles © ACEEE
30
combinations of a few modal cycles, Approach 2 would likely require a much smaller number of
cycles than would Approach 1. Approach 2 is also more flexible, because it can represent a continuum
of duty cycles through variation in the weightings of the modal cycles. On the other hand, in
Approach 1, a vehicle would have a well-defined fuel efficiency for a given use, regardless of the
region.
Table 6. Pros and Cons of Two Approaches to Test Cycles
Pro Con
Approach 1 (Typical duty cycles)
For each intended use, tested fuel efficiency is a single number, same in all regions
Large number of cycles
Fuel efficiency depends on intended use, not just vehicle properties
Approach 2 (Modal cycles)
Relatively few cycles
Set of fuel efficiency values the same in all regions
Allows customized fuel efficiency estimates
Fuel efficiency not represented by a single number
Under either approach, each vehicle is assigned fuel efficiencies over a fixed set of test cycles. These
values would be the same for all regions involved, resulting in universal, well-defined measures of
vehicle performance. This information would permit a standardized calculation of cost-effectiveness
of technology improvements as a function of regional conditions. This in turn would help to establish
a global market for efficiency technologies. It would also allow comparisons of vehicles in a range of
driving conditions, and in particular would allow buyers to estimate performance over their own duty
cycles.
In the U.S. program, the compliance model GEM reports out the vehicle’s compliance fuel efficiency
and CO2 emissions, but does not provide results for the three test cycles individually. This prevents
vehicle buyers from customizing the calculation of fuel efficiency. In Japan, by contrast,
manufacturers will be required to display test results for each cycle separately, in addition to the
combined value, for all vehicles (CNRE 2005).
Testing and modeling methods Establishing common testing and modeling methods would entail
agreement on the roles and protocols for vehicle, system, and/or component testing, and on the role
of simulation. It would also be important to have agreement on how to define test families of similar
vehicles, engines, or components so that not every variation of the tested item requires a separate test.
In addition to any technical obstacles that may arise to adopting a common test method across
regions, institutional obstacles could be significant. For physical testing, resources are an issue,
especially the availability of test facilities and personnel. While the impediment to common test
weights and cycles is the variation in the way vehicles are used across regions, impediments to

31
common test methods are more likely to be differences among implementing agencies. Such
institutional issues may be amenable to resolution through cooperative agreement, for example by
formation of an international testing oversight body.
Similarly, while having a common simulation model across regions would be convenient, it could be
hard to achieve given historical, competitive, and technical considerations facing participating
governments. This becomes an issue to the extent that the models deliver different results from the
same inputs, especially if the outputs vary in unpredictable ways. Furthermore, models will need to
evolve over time, as when a new technology emerges or problems arise, and agencies likely will want
to make changes to their models unilaterally. On the other hand, a common model is not essential if
the models used in the various regions are sound. In fact, comparing results across models can help to
evaluate the robustness of the simulation model approach.
Stringency Diversity of driving conditions and other regional differences will preclude adoption of
standards of the same stringency globally, although common stringencies may be possible across
some regions, as in the case of North America. Moreover, the approaches to test cycles described
above would permit the definition of fuel efficiency and GHG emissions performance levels that
would be meaningful in all regions.
APPROACHES TO ALIGNMENT
The above considerations suggest that a common set of vehicle test cycles and test weights is
fundamental to alignment. These elements can be used to define a measure of a vehicle’s fuel
efficiency that would be meaningful in all regions. This in turn would facilitate the sale of efficiency
technologies globally and thereby accelerate the rate of fuel efficiency increases.
A uniform test method, by virtue of its ability to reduce compliance costs, would be useful to increase
alignment’s appeal to manufacturers. In particular, common component test methods would be
relatively straightforward to develop, since component testing typically provides information about
performance that is applicable over a wide range of operating conditions and thus does not require
test cycles that reflect specific real-world duty cycles.7
Given the importance of gaining the support of all stakeholders, an approach to alignment might
therefore best be characterized as a choice of a set of test cycles and weights, together with a choice of
test method.
While uniform stringency might appear at first glance to be the defining feature of program
alignment, this will not generally be feasible, as observed through the comparison of tractor truck
standards in Japan and the U.S. Supporting evidence for this conclusion is the fact that international
appliance standard alignment to date has focused on the areas of test protocols and methods (Waide
2011).
7 An important exception is an engine cycle for transient operation.
International Alignment of Fuel Efficiency Standards for Heavy-Duty Vehicles © ACEEE
32
Data and Research Needs Data limitations have proven to be a challenge in establishing sound heavy-duty vehicle fuel efficiency
or GHG emissions regulations. In the U.S., for example, the primary source of national data on the
heavy-duty vehicle stock, the Vehicle Inventory and Use Survey (VIUS), was last conducted in 2002. It
was discontinued due to federal budget constraints in 2006 and has not been reinstated. As a result,
much of the analysis done for the U.S. is based on data now a decade old. For the EU, researchers have
done extensive data collection and analysis for member countries, but they also highlight data gaps as
an obstacle to program development (AEA 2011).
Developing an aligned program will require not only solid data for all participating countries but also
extensive cross-regional analysis, including:
Comparative market assessment. A comparative assessment should be undertaken of regional
heavy-duty vehicle markets, including aspects such as dominant manufacturers and degree of
vertical integration in the industry, customer vehicle specification practices, vehicle financing
options, and fuel availability. Manufacturers marketing internationally would be well positioned
to provide much of the necessary information.
Duty cycle analysis. A comparison of duty cycles for each major heavy-duty vehicle application,
including not only speed but also grade and payload, will be needed to determine whether global
driving behavior can be captured by a manageable set of cycles. Work similar to that done to
develop the WTVC and other international cycles oriented toward criteria pollutant emissions
testing could be used to develop candidate drive cycles for an aligned program. As is evident from
ongoing work toward an international light-duty vehicle cycle for fuel consumption and GHG
emissions (ACEA 2011), development of heavy-duty cycles will require extensive new data
collection and analysis relating to in-use behavior. Fleet participation will be valuable in this
effort.
Simulation model review. A follow-up to the Ricardo survey of simulation tools (Fulem 2009),
focused specifically on the suitability of models for purposes of fuel efficiency and GHG
standards, would be useful at this stage. The study should review such questions as: whether the
accuracy of the models is sufficient to measure all significant fuel efficiency improvements;
whether the models can easily use and supplement data generated through chassis and
component testing; the extent of validation using real-world data; and which types of
technological advances the models are well-suited to represent. Models adopted or contemplated
for the four regional programs should be reviewed and compared.
Manufacturer participation will be essential to the entire process of developing test protocols. As EU
researchers note in particular, “several data necessary as input to the test procedure cannot be gained
by independent consultants in a cost efficient way (e.g., engine map, gear box efficiency maps, data on
auxiliary efficiencies etc.)” (TU Graz 2011).
33
Conclusions and Recommendations Regulation of fuel efficiency and greenhouse gas emissions of heavy-duty vehicles is new but bound to
develop rapidly now that the biggest heavy-duty vehicle markets have adopted their first programs or
are well along in designing them. There are important benefits of aligning these programs going
forward, in terms of maximizing the cost-effective fuel savings and emissions reductions such
programs bring and minimizing manufacturers’ costs to meet the new standards. Alignment must be
approached with flexibility, however, because certain aspects of these programs do not lend
themselves well to a uniform treatment. The idea of a standards program that is essentially identical in
all regions is not realistic.
From the perspective of a manufacturer participating in more than one market, each element of the
program that is aligned across sales regions implies reduced costs. From both manufacturing and
regulatory perspectives, it may be tempting to seek standards that apply the same stringency across
regions so as to be able to minimize the variations in vehicles across markets and to ensure the largest
market for efficiency technologies. However, uniform stringency appears not in fact to be a feasible or
even desirable objective, given the differences in operating conditions across regions. A prime
example is the reversal of urban and highway driving shares for large tractor-trailers in Japan and the
U.S., a fact reflected in the very different fuel efficiency targets set for the two countries. This suggests
the need for a broader notion of alignment, which aims to increase the effectiveness of the individual
programs by demonstrating the benefits of fuel efficiency technologies for the entire population of
vehicles to which these technologies will bring real-world savings.
The basic structural elements of heavy-duty fuel efficiency and GHG standards programs raise a
variety of issues with respect to the feasibility and value of alignment. The following conclusions and
recommendations regarding those elements arise from the discussion in previous sections.
METRIC
Program alignment will require the use of fuel efficiency or GHG emissions metrics that are
readily convertible across programs. Liters (or grams CO2) per payload ton-kilometer or an
equivalent appears to be the best choice.
Test payloads must be specified for the metric to be meaningful as well as to define equivalence
with a liters-per-kilometer metric. Typical payloads vary from region to region, however. Hence
testing should be done with multiple payloads, e.g., empty, full, and regionally appropriate
payload.
VEHICLE SEGMENTATION
Due to differences in existing class definitions, distribution of fuel use, and ways in which
certain vehicles are used, uniform segmentation across regions would be difficult.
Nonetheless, for vehicle categories such as line-haul tractor-trailers that are important in
many regions, it would be useful to develop global characterizations and weight thresholds to
facilitate discussion and comparison of programs.
International Alignment of Fuel Efficiency Standards for Heavy-Duty Vehicles © ACEEE
34
TEST CYCLES
While various engine test cycles exist for criteria pollutant testing, and several have vehicle
versions, fuel efficiency and GHG emissions programs will require additional data points and
cycles. At a minimum, a complete engine fuel map will be needed. Additional information
relating to engine cooling, transient operation, and response to ambient conditions may be
required as well.
Two approaches to accommodating the variety of duty cycles for heavy-duty vehicles are: (1)
developing a wide array of test cycles representing typical complete duty cycles, e.g., long-haul
truck cycle or refuse truck cycle; and (2) choosing cycles to represent common driving modes,
e.g., urban or highway, and defining vehicle performance as a weighted sum of the results over the
modal cycles. Either of these approaches could be used in an aligned program. This would involve
either use-dependent certification of vehicles (first approach) or weightings that vary from region
to region (second approach).
TESTING AND MODELING METHODS
Component testing will be a necessary part of any test protocol. Alignment of test protocols for
components, including engines, across regions would be relatively easy and could contribute
substantially to both expanding the market for efficiency technologies and reducing manufacturer
testing costs. Component testing is not, however, sufficient basis for a program of standards that
seeks to recognize the full range of potential efficiency improvements. Full-vehicle evaluation will
be required to capture the benefits of advanced technologies and the interactions of vehicle
systems.
Simulation modeling will also be an important element of any heavy-duty test protocol. Any
model adopted for this purpose should be fully documented and use open source software to
allow for evaluation and improvement.
In addition, some amount of physical testing will be needed to validate the results of simulation
modeling and to capture the benefits of technologies not anticipated in the model.
Differing test methods do not preclude program alignment but may reduce the validity of cross-
region comparisons. Uniform test methods also reduce manufacturer costs and hence will
increase the appeal of standards to manufacturers.
STRINGENCY
Due to cross-regional differences in driving patterns, fuel prices, typical payloads, and other
conditions, it will not generally be feasible to set a given vehicle’s fuel efficiency or GHG
emissions standard at the same level in all regions.
DATA AND RESEARCH
Region-specific and cross-region analysis will both be needed; early efforts to coordinate could
greatly reduce duplication of effort.
35
Development of modeling tools sufficient for evaluating heavy-duty vehicles’ fuel efficiency and
GHG emissions will require detailed information on engines and other components and systems
from manufacturers. A survey should be conducted of simulation models in use, with a focus on
suitability for fuel efficiency and GHG emissions prediction.
For heavy-duty vehicle duty cycles and other information about driving patterns, participation of
fleets will be essential. Data collection similar to that done by participants in EPA’s SmartWay
program would be useful in all regions.
In view of these conclusions, we recommend approaching alignment of heavy-duty fuel efficiency and
GHG emissions programs by establishing a common set of test payload weights and test cycles
satisfying the requirements of one of the two approaches described above. This would result in
universal, well-defined measures of vehicle performance. This information would permit a
standardized calculation of cost-effectiveness of technology improvements as a function of regional
conditions, which would help to establish a global market for efficiency technologies and thereby
accelerate the rate of fuel efficiency increases. It would also allow comparison of vehicles in a range of
driving conditions and in particular would allow buyers to estimate performance over their own duty
cycles. Aligning test methods as well would reduce manufacturer compliance costs and thus
strengthen support for the program.

International Alignment of Fuel Efficiency Standards for Heavy-Duty Vehicles © ACEEE
36
37
References Ahlvik (2008), Ahlvik, P., Well to Wheel Efficiency for Heavy-Duty Vehicles,
http://www.ecotraffic.se/media/5447/3.__2009__wtw.pdf. Ecotraffic ERD3 AB: Stockholm, Sweden.
Allison (2011), “Comments of Eric C. Scroggins, Allison Transmission, on the Proposed Rulemakings
for Greenhouse Gas Emissions Standards and Fuel Efficiency Standards for Medium- and Heavy-
Duty Engines and Vehicles,” 75 Fed. Reg. 74, 152.
ACEA (2011), Development of World-Wide Light-duty Test Cycle. DHC group under GRPE/WLTP
informal group. 16 May. Brussels, Belgium.
AEA (2011), Reduction and Testing of GHG Emissions from Heavy Duty Vehicles – Lot 1: Strategy.
Final Report to the European Commission – DG Climate Action. February 22.
AQSIQ (2012), General Administration of Quality Supervision, Inspection and Quarantine of the
People’s Republic of China. Fuel Consumption Limits for Heavy-Duty Commercial Vehicles. Disclosure
Draft. ICS 43.020.
Baird (2012). “Global Auto & Truck Markets.” Marketing Book. June 5.
Bedick (2009), Bedick, C.R., N.N. Clark, F. Zhen, R. Atkinson, and D.L. McKain, “Testing of a Heavy
Heavy-Duty Diesel Engine Schedule for Representative Measurement of Emissions,” J. of Air & Waste
Manage. Assoc. 59, 960-971.
CARB (2011), “Heavy-Duty Engines and Vehicles, including Urban Buses, and Engines Used in
Diesel or Incomplete Medium-Duty Vehicles of 8501-14000 Pound GVWR Executive Orders – 2011.”
http://www.arb.ca.gov/msprog/onroad/cert/mdehdehdv/2011/2011.php. Sacramento, CA: Air
Resources Board.
Canada Gazette (2012), “Heavy-duty Vehicle and Engine Greenhouse Gas Emission Regulations.”
Canada Gazette Part 1, 146 (15).
CATARC (2010a). “Development of National Standard “Fuel Consumption Test Methods for MD
and Heavy-Duty Vehicles” in China.” Presentation for USEPA. December.
CATARC (2010b), “Recommended National Standards Fuel Consumption Test Method for Medium-
and Heavy-Duty Commercial Vehicles. Explanation of Preparation for the Exposure Draft.” Tianjin,
China. May.
Clark (2007), Clark, N.N., M. Gautam, W.S. Wayne, D.W. Lyons, and G. Thompson, Heavy-Duty
Vehicle Chassis Dynamometer Testing for Emissions Inventory, Air Quality Modeling, Source
Apportionment, and Air Toxics Emissions Inventory. CRC Report No. E-55/59: Final Report submitted
by West Virginia University to Coordinating Research Council.

International Alignment of Fuel Efficiency Standards for Heavy-Duty Vehicles © ACEEE
38
Clark (2009) Clark, N., G. Thompson and O. Delgado, Modeling Heavy-Duty Vehicle Fuel Economy
Based on Cycle Properties. Report prepared for the ICCT. Morgantown, WV: West Virginia
University, Center for Alternative Fuels, Engines and Emissions.
CNRE (2005), Committee for Natural Resources and Energy, Final Report by Heavy Vehicle Fuel
Efficiency Standard Evaluation Group, Heavy Vehicle Standards Evaluation Subcommittee, Energy
Efficiency Standards Subcommittee of the Advisory Committee for Natural Resources and Energy,
http://www.eccj.or.jp/top_runner/pdf/heavy_vehicles_nov2005.pdf. Japan.
Daisho (2007). Daisho, Y., “Japan's HD Vehicle Fuel Economy Standards to be in Effect in FY 2015,”
Presented at the 5th ICCT Meeting, Hong Kong, November 10.
DieselNet.com, “Emission Test Cycles,” http://www.dieselnet.com/standards/cycles.
DTNA (2011), Daimler Trucks North America, A Study of Reynolds Number Effects Production Class
8 Tractor-Trailer Combinations, Chicago, IL: Daimler Trucks North America.
Eaton (2011), Eaton Corporation Vehicle Group. Comments submitted to EPA and NHTSA
Greenhouse Gas Emissions Standards and Fuel Efficiency Standards for Medium- and Heavy-Duty
Engine and Vehicles; Proposed Rule, Docket ID Nos. EPA-HQ-OAR-2010-0162 and NHTSA-2010-
0079. January.
EC (2009), REGULATION No 595/2009 OF THE EUROPEAN PARLIAMENT AND OF THE
COUNCIL of 18 June 2009 on type-approval of motor vehicles and engines with respect to emissions
from heavy duty vehicles (Euro VI) and on access to vehicle repair and maintenance information and
amending Regulation (EC) No 715/2007 and Directive 2007/46/EC and repealing Directives
80/1269/EEC, 2005/55/EC and 2005/78/EC.
EPA (2009), “Control of Air Pollution From New Motor Vehicles and New Motor Vehicle Engines;
Regulations Requiring Onboard Diagnostic Systems on 2010 and Later Heavy-Duty Engines Used in
Highway Applications Over 14,000 Pounds; Revisions to Onboard Diagnostic Requirements for
Diesel Highway Heavy-Duty Vehicles Under 14,000 Pounds; Final Rule,” Federal Register, 74 (35).
EPA (2011), U.S. Environmental Protection Agency, Greenhouse Gas Emissions Model (GEM) User
Guide, EPA- 420-B-11-019, August.
EPA and NHTSA (2011a), Greenhouse Gas Emissions Standards and Fuel Efficiency Standards for
Medium- and Heavy-Duty Engines and Vehicles, Final Rule, August.
EPA and NHTSA (2011b), Greenhouse Gas Emissions Standards and Fuel Efficiency Standards for
Medium- and Heavy-Duty Engines and Vehicles, Final Regulatory Impact Analysis (RIA), August.
Fleet Owner (2012), “Growth of Global Platforms to Reshape Spec’ing Strategies,” Fleet Owner. July
27. http://fleetowner.com/equipment/growth-global-platforms-reshape-spec-ing-strategies. Viewed
October 24, 2012.

39
France (1978), France, C.J. Transient Cycle Arrangement for Heavy-Duty Engine and Chassis
Emissions Testing, HDV 78-04, Washington DC: U.S. Environment Protection Agency.
Fulem (2009), Fulem, J. ICCT Evaluation of Vehicle Simulation Tools. Summary Report.
Fung (2011), Fung, F. “China HDV Market Analysis.” Memo to D. Kodjak and F. Kamakate.
Washington, DC: International Council on Clean Transportation.
Gautam (2002), Gautam, M., N.N. Clark, W. Riddle, R. Nine, W.S. Wayne, H. Maldonado, A.
Agrawal, and M. Carlock. Development and Initial Use of a Heavy-Duty Diesel Truck Test Schedule for
Emissions Characterization, SAE paper 2002-01-1753, Warrendale, PA: Society of Automotive
Engineers.
Heinz (2001), Heinz, S., Development of a World-wide Harmonised Heavy-duty Engine Emissions Test
Cycle (Draft) Executive Summary Report. ECE-GRPE WHDC Working Group, United Nations.
Hirai (2011), Hirai, H., “Test Method of Heavy-Duty Vehicles Fuel Consumption in Japan,” IEA
Freight Truck Fuel Economy Workshop, Berlin, May.
ICCT (2008), Fact Sheet: Japan’s “Top Runner” Fuel Economy Standards for Heavy-Duty Vehicles, The
International Council on Clean Transportation, February.
ICCT (2011), “Summary of Heavy-Duty Vehicle Registration for China” (PowerPoint presentation),
March 25.
JAMA (2011), Japan Automobile Manufacturers Association, Inc. “Motor Vehicle Statistics of Japan,”
http://www.jama-english.jp/publications/index.html.
Khan (2011), Khan A.S. and T. Langer, Heavy-Duty Vehicle Fuel Efficiency and Greenhouse Gas
Emissions: The 2014–2019 Standards and a Pathway to the Next Phase. Report Number T113.
American Council for an Energy-Efficient Economy.
MJ Bradley (2009), MJ Bradley & Associates, Setting the Stage for Regulation of Heavy-Duty Vehicle
Fuel Economy & GHG Emissions: Issues and Opportunities, Report submitted to ICCT, February.
NREL (2011), National Renewable Energy Laboratory, “Analysis Tool Generates Custom Vehicle
Drive Cycles Based on Real-World Data” September 26.
http://www.nrel.gov/vehiclesandfuels/news/2011/1593.html.
NRC (2010), National Research Council, Technologies and Approaches to Reducing the Fuel
Consumption of Medium- and Heavy-Duty Vehicles. Washington DC: National Academies Press.
O’Keefe and Kelly (2006), O’Keefe, M.P. and K.J. Kelley, “Introduction to Duty Cycle
Characterization for Heavy Vehicles: a Presentation to the EPA Heavy Vehicle Drive Cycle Working
Group.” National Renewable Energy Laboratory.
International Alignment of Fuel Efficiency Standards for Heavy-Duty Vehicles © ACEEE
40
Rakopoulos and Gaikoumis (2009), Rakopoulos, C.D. and E.G. Gaikoumis, Diesel Engine Transient
Operation: Principles of Operation and Simulation Analysis, Springer Verlag London Limited.
SAE (1981), Society for Automotive Engineers, SAE Wind Tunnel Test Procedure for Trucks and
Buses, SAE J1252, July, Warrendale, PA: Society for Automotive Engineers.
SAE (2010), Society of Automotive Engineers, Road Load Measurement and Dynamometer Simulation
using Coastdown Techniques, SAE J1263, March, Warrendale, PA: Society for Automotive Engineers.
Schuckert (2011), Schuckert, M., “Towards concepts for a world-wide harmonization of GHG
reduction strategies for HDV – think globally but incorporate regional aspects,” Presented at the
Diesel Emissions Conference & Diesel Exhaust Fluid Forum 2011, Atlanta, October 18.
Tokimatsu (2007), Tokimatsu, K., “Latest HDV Fuel Efficiency Technologies in Japan.” Presentation
to conference, Fuel Efficiency Policies for HDV including Standards, International Energy Agency,
Paris, June.
TU Graz (2011), Graz University of Technology, Reduction and Testing of GHG Emissions from
Heavy-Duty Vehicles – Lot 2, Final Report, 1st Version, Nov 21. Prepared for the European
Commission.
UNECE (2005), Worldwide Harmonised Heavy Duty Emissions Certification Procedure, Draft Global
Technical Regulation prepared by UNECE-WP.29 -GRPE, WHDC Working Group, Draft version, June.
Waide (2011), Waide, P. Opportunities for Success and CO2 Savings from Appliance Energy Efficiency
Harmonisation. Navigant Consulting, in partnership with CLASP.
Zhen (2009), Zhen, F., N.N. Clark, C.R. Bedick, M. Gautam, W.S., Wayne, G.J. Thompson, and D.W.
Lyons, “Development of a Heavy Heavy-Duty Diesel Engine Schedule for Representative
Measurement of Emissions,” J. of Air & Waste Manage. Assoc., 59, 950-959, August.
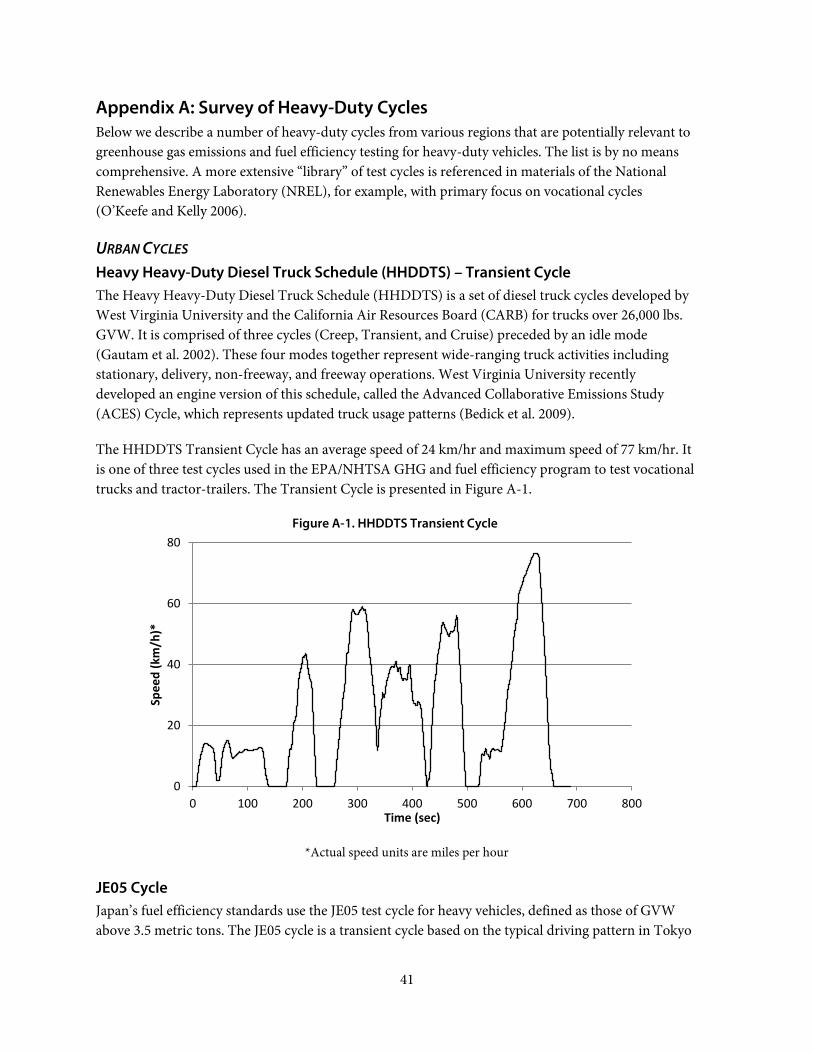
41
Appendix A: Survey of Heavy-Duty Cycles Below we describe a number of heavy-duty cycles from various regions that are potentially relevant to
greenhouse gas emissions and fuel efficiency testing for heavy-duty vehicles. The list is by no means
comprehensive. A more extensive “library” of test cycles is referenced in materials of the National
Renewables Energy Laboratory (NREL), for example, with primary focus on vocational cycles
(O’Keefe and Kelly 2006).
URBAN CYCLES
Heavy Heavy-Duty Diesel Truck Schedule (HHDDTS) – Transient Cycle
The Heavy Heavy-Duty Diesel Truck Schedule (HHDDTS) is a set of diesel truck cycles developed by
West Virginia University and the California Air Resources Board (CARB) for trucks over 26,000 lbs.
GVW. It is comprised of three cycles (Creep, Transient, and Cruise) preceded by an idle mode
(Gautam et al. 2002). These four modes together represent wide-ranging truck activities including
stationary, delivery, non-freeway, and freeway operations. West Virginia University recently
developed an engine version of this schedule, called the Advanced Collaborative Emissions Study
(ACES) Cycle, which represents updated truck usage patterns (Bedick et al. 2009).
The HHDDTS Transient Cycle has an average speed of 24 km/hr and maximum speed of 77 km/hr. It
is one of three test cycles used in the EPA/NHTSA GHG and fuel efficiency program to test vocational
trucks and tractor-trailers. The Transient Cycle is presented in Figure A-1.
Figure A-1. HHDDTS Transient Cycle
*Actual speed units are miles per hour
JE05 Cycle
Japan’s fuel efficiency standards use the JE05 test cycle for heavy vehicles, defined as those of GVW
above 3.5 metric tons. The JE05 cycle is a transient cycle based on the typical driving pattern in Tokyo
0
20
40
60
80
0 100 200 300 400 500 600 700 800
Spe
ed
(km
/h)*
Time (sec)
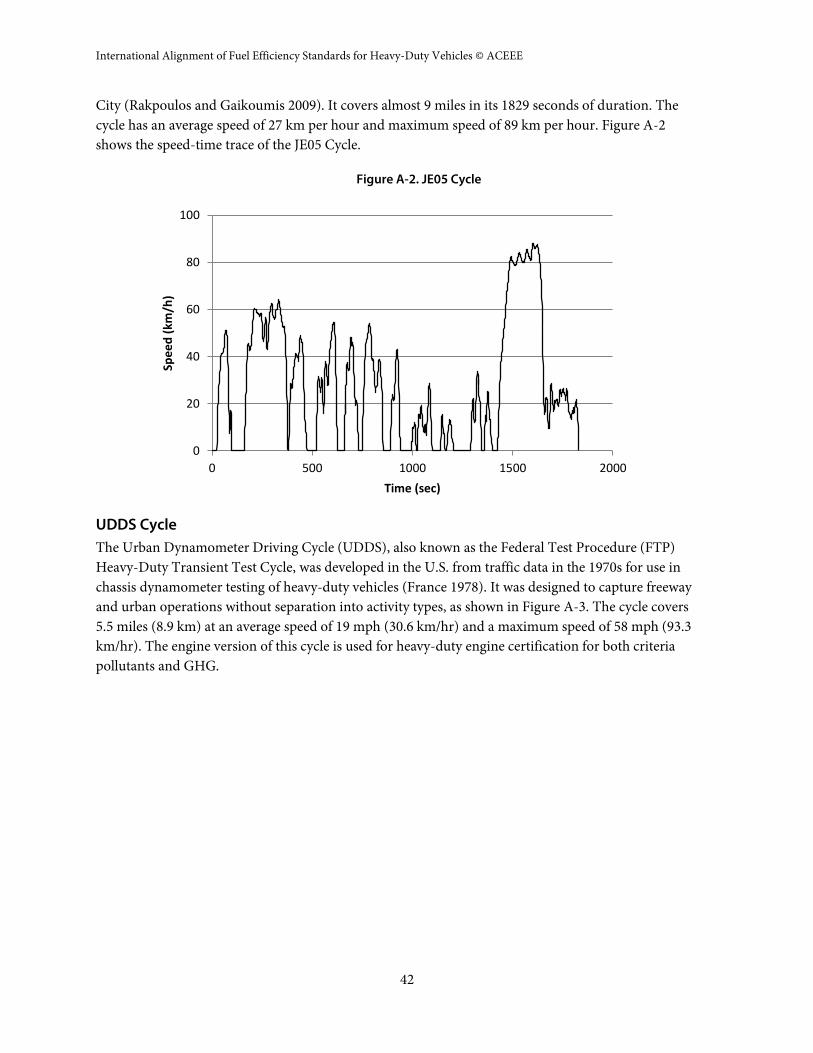
International Alignment of Fuel Efficiency Standards for Heavy-Duty Vehicles © ACEEE
42
City (Rakpoulos and Gaikoumis 2009). It covers almost 9 miles in its 1829 seconds of duration. The
cycle has an average speed of 27 km per hour and maximum speed of 89 km per hour. Figure A-2
shows the speed-time trace of the JE05 Cycle.
Figure A-2. JE05 Cycle
UDDS Cycle
The Urban Dynamometer Driving Cycle (UDDS), also known as the Federal Test Procedure (FTP)
Heavy-Duty Transient Test Cycle, was developed in the U.S. from traffic data in the 1970s for use in
chassis dynamometer testing of heavy-duty vehicles (France 1978). It was designed to capture freeway
and urban operations without separation into activity types, as shown in Figure A-3. The cycle covers
5.5 miles (8.9 km) at an average speed of 19 mph (30.6 km/hr) and a maximum speed of 58 mph (93.3
km/hr). The engine version of this cycle is used for heavy-duty engine certification for both criteria
pollutants and GHG.
0
20
40
60
80
100
0 500 1000 1500 2000
Spe
ed
(km
/h)
Time (sec)

43
Figure A-3. The UDDS Cycle
*Actual speed units are miles per hour
Mexico City Cycle
The Mexico City Cycle (MCS) was developed by West Virginia University for bus emissions testing in
Mexico City. Like the ETC, the MCS has three segments. The segments, MX1, MX2, and MX3, have
average speeds of 11, 21, and 23 kilometers per hour, respectively. The MX1 has a maximum speed of
51 km per hour, while the MX2 and MX3 have maximum speeds of 68 and 71 km per hour,
respectively. The cycle covers approximately 14.9 kilometers. The cycle is presented in Figure A-4.
Mexico has no program in place for heavy-duty fuel efficiency or GHG emissions at this time but is
considering aligning with the U.S. program.
0
20
40
60
80
100
0 200 400 600 800 1000 1200
Spe
ed
(km
/hr)
*
Time (sec)
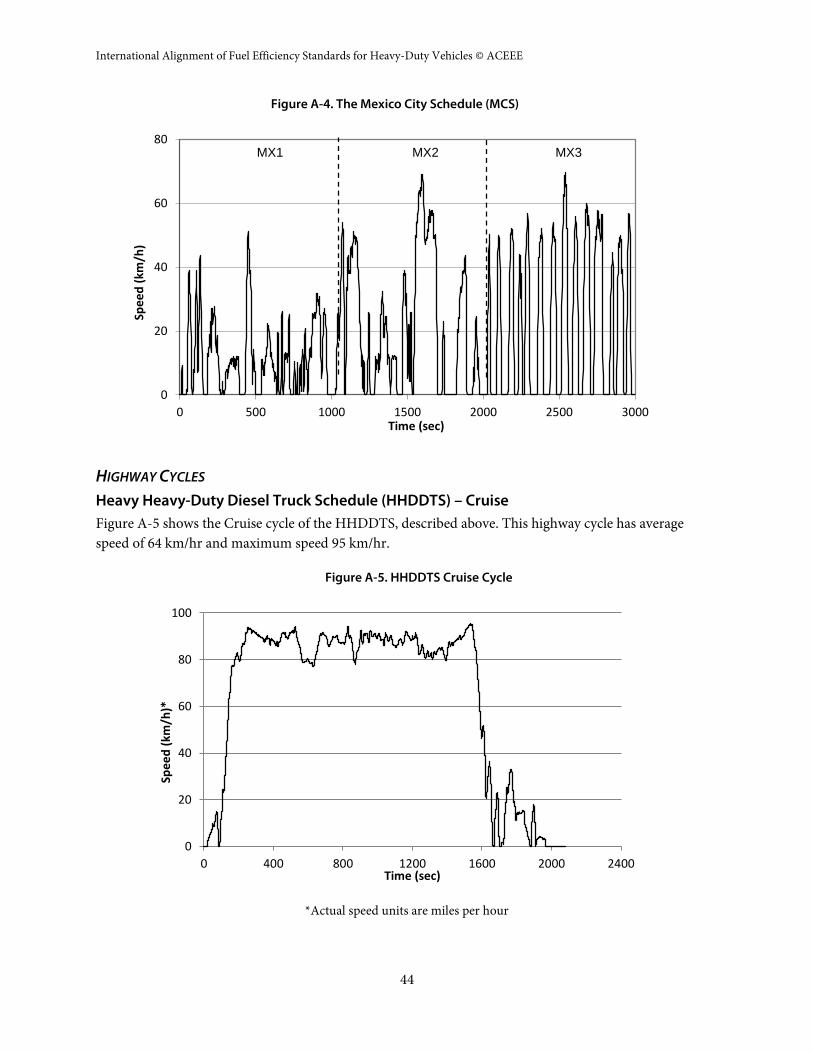
International Alignment of Fuel Efficiency Standards for Heavy-Duty Vehicles © ACEEE
44
Figure A-4. The Mexico City Schedule (MCS)
HIGHWAY CYCLES
Heavy Heavy-Duty Diesel Truck Schedule (HHDDTS) – Cruise
Figure A-5 shows the Cruise cycle of the HHDDTS, described above. This highway cycle has average
speed of 64 km/hr and maximum speed 95 km/hr.
Figure A-5. HHDDTS Cruise Cycle
*Actual speed units are miles per hour
0
20
40
60
80
0 500 1000 1500 2000 2500 3000
Spe
ed
(km
/h)
Time (sec)
MX1 MX2 MX3
0
20
40
60
80
100
0 400 800 1200 1600 2000 2400
Spe
ed
(km
/h)*
Time (sec)

45
Interurban Mode
Japan’s heavy-duty fuel consumption test includes an Interurban Mode, in addition to the transient
JE05 shown above. The Interurban Mode has a constant vehicle speed of 80 km per hour but varying
grade. The grade profile of the Interurban Mode is shown in Figure A-6.
Figure A-6. Japan Interurban Mode (constant vehicle speed of 80 km/h)
Source: Daisho (2007)
Supplemental Emissions Test (SET)
The SET (Figure A-7) is an engine test used for criteria pollutant testing to supplement the FTP.
Figure A-7. Supplementary Emissions Test for Heavy-Duty Engines
Source: DieselNet.com

International Alignment of Fuel Efficiency Standards for Heavy-Duty Vehicles © ACEEE
46
COMBINED CYCLES
European Transient Cycle (ETC)
The FIGE Institute of Germany developed the European Transient Cycle (ETC) from real-world data
on heavy-duty vehicles (Ahlvik 2008). The cycle, shown in Figure A-8, has three segments,
representing urban, rural, and motorway driving, each running for 600 seconds. The vehicle does not
come to a stop between the rural and motorway segments, so these cannot be used independently
without modification. The cycle covers 29 kilometers. The maximum speeds for the urban, the rural,
and the motorway segments are 23 km/hr, 72 km/hr, and 89 km/hr, respectively.
The FIGE Institute also developed an engine dynamometer version of this cycle, which has been used
for the certification of diesel engines since 2000 (Ahlvik 2008, Zhen et al. 2009). The EU heavy-duty
diesel engine program regulates gaseous pollutants, including carbon monoxide (CO), hydrocarbons
(HC), methane (CH4), and oxides of nitrogen (NOx) as well as particulate matter (PM) and smoke
opacity. The Euro VI regulation specifies that carbon dioxide (CO2) emissions and fuel consumption
must be measured during the emissions tests, although no limits are specified (EC 2009). Emissions of
CO, HC, NOx, and PM will be measured on the European Steady State Cycle (ESC) as well as the
engine ETC for Euro V, while smoke opacity will be measured on the European Load Response (ELR)
test. However, beginning with Euro VI standards, emissions and fuel consumption will also be
evaluated on the World-wide Harmonized Steady State Cycle (WHSC) and the World-wide
Harmonized Transient Cycle (WHTC) (cf. Figure A-9 for corresponding vehicle cycle) (EC 2009).
However, emission standards are expressed on the basis of the ESC and the ETC engine cycles. The
European Commission is working to establish correlation factors between the European and
Worldwide harmonized drive cycles and to specify their equivalent values. The U.S. SET coincides
with the European Stationary Cycle (ESC) (DieselNet.com).
Figure A-8. ETC Cycle
0
20
40
60
80
100
0 500 1000 1500 2000
Spe
ed
(km
/h)
Time (sec)

47
World-Wide Transient Vehicle Cycle (WTVC)
The World-wide Transient Vehicle Cycle (WTVC) was developed by the Working Committee of
Pollution and Energy of the United Nations Economic Commission for Europe (UNECE 2005). The
cycle was based on heavy-duty vehicle data collected from Australia, the European Union (EU),
Japan, and USA (Heinz 2001). The total duration of this cycle is 1800 seconds, and it is divided into
three segments: Urban, Rural, and the Motorway, similar to the ETC and the MCS. However, the
Urban Segment is long compared to the Rural and the Motorway segments. The Urban, the Rural,
and the Motorway segments run for 900 seconds, 500 seconds, and 400 seconds, respectively, as
shown in Figure A-9. Although the Urban segment can be treated as an independent cycle, the Rural
and the Motorway segments are connected similar to the ETC Cycle. The average speeds for the
Urban, the Rural, and the Motorway segments are 13.3 mph, 27.3 mph, and 47.9 mph, respectively,
while their maximum speeds are 41 mph, 47 mph, and 55 mph, respectively. The cycle also was used
to create an engine cycle for criteria pollutant emissions testing, which is expected eventually to
replace the ETC Cycle for certification of diesel engines in the EU for Euro VI (Ahlvik 2008).
Figure A-9. World-Wide Transient Vehicle Cycle
China proposes to use a slightly modified version of this cycle for its heavy-duty vehicle fuel
consumption program (CATARC 2010a). The modifications entail a small reduction in peak power
demand at some points in the cycle, reflecting the lower horsepower of trucks in China (ICCT 2011).
In addition, China would weight the three cycle segments to better reflect commercial driving
patterns there (CATARC 2010b). The weightings would vary with vehicle class.
Selected properties for the cycles in our survey are shown in A-1. While the cycles have significant
differences, all have maximum speed in the range of 88-95 km per hour with the exception of the
Mexico City Cycle, which was developed from transit bus operating data rather than truck operating
data. Average speed and maximum speed for transient and cruise operations are fairly consistent
across the HHDDTS, the ETC, and the WTVC, while the two single-mode cycles UDDS and JE05
have similar average speeds and maximum speeds. That raises the prospect that vehicle behavior
across these regions could be sufficiently similar to permit the creation of common test cycles.
0
20
40
60
80
100
0 400 800 1200 1600 2000
Spe
ed
(km
/h)
Time (s)
Urban RuralMotorway
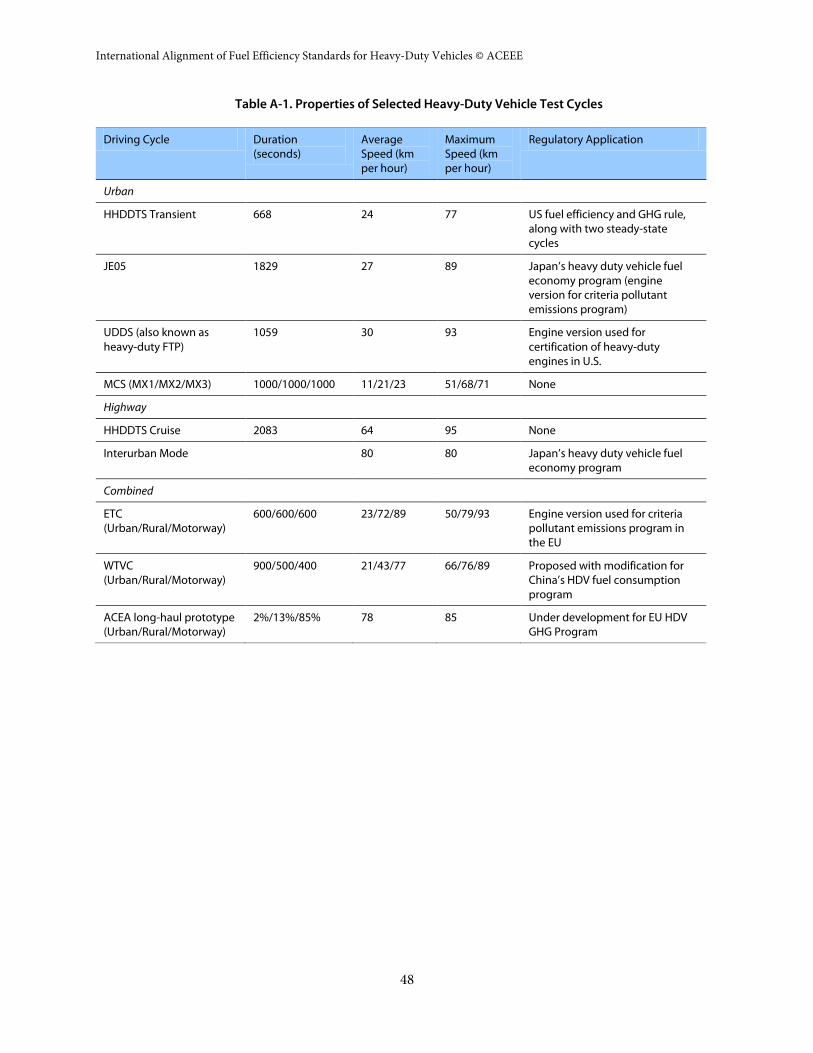
International Alignment of Fuel Efficiency Standards for Heavy-Duty Vehicles © ACEEE
48
Table A-1. Properties of Selected Heavy-Duty Vehicle Test Cycles
Driving Cycle Duration (seconds)
Average Speed (km per hour)
Maximum Speed (km per hour)
Regulatory Application
Urban
HHDDTS Transient 668 24 77 US fuel efficiency and GHG rule, along with two steady-state cycles
JE05 1829 27 89 Japan’s heavy duty vehicle fuel economy program (engine version for criteria pollutant emissions program)
UDDS (also known as heavy-duty FTP)
1059 30 93 Engine version used for certification of heavy-duty engines in U.S.
MCS (MX1/MX2/MX3) 1000/1000/1000 11/21/23 51/68/71 None
Highway
HHDDTS Cruise 2083 64 95 None
Interurban Mode 80 80 Japan’s heavy duty vehicle fuel economy program
Combined
ETC (Urban/Rural/Motorway)
600/600/600 23/72/89 50/79/93 Engine version used for criteria pollutant emissions program in the EU
WTVC (Urban/Rural/Motorway)
900/500/400 21/43/77 66/76/89 Proposed with modification for China’s HDV fuel consumption program
ACEA long-haul prototype (Urban/Rural/Motorway)
2%/13%/85% 78 85 Under development for EU HDV GHG Program
49
Appendix B: Component Testing
ENGINE TESTING
A brief description of each region’s engine test protocol is provided below.
Japan
Japan’s heavy-duty program does not regulate the engine separately. The engine fuel map is an
essential input for vehicle simulation, however. Each engine intended for use in heavy-duty
application will be tested on an engine dynamometer to generate fuel consumption data at a
minimum of thirty speed-torque points (six engine speeds and five torque values), chosen by the
manufacturer. The manufacturer will use these results to develop an engine map (MJ Bradley 2009).
For testing vehicles in transient operation, engine speed and torque vs. time data must be generated
based on the vehicle speed points in the JE05 Transient Cycle and applying a suitable drivetrain model
(Rakopoulos and Gaikoumis 2009). For each engine, manufacturers will have to supply full load
engine torque, idling engine revolution, maximum output engine revolution, and maximum engine
revolution with load, among other inputs to the drivetrain model.
U.S.
Engines are regulated separately in the U.S. heavy-duty GHG and fuel efficiency program. Engines are
grouped in families; an engine family “consists of several ratings having slightly different horsepower
and/or torque characteristics but no differences large enough to require a different engine family
designation” (EPA 2009). Only one engine per family will be tested (EPA and NHTSA 2011b). For
regulatory purposes, all engines in a family are assumed to have the same emissions performance as
the parent engine in terms of grams or gallons per brake horsepower hour. Thus manufacturers do
not need to test every engine for vehicle fuel economy and GHG emissions compliance.
In practice, two engines in the same family may differ by more than 100 HP in engine power and
more than 200 lb-ft in engine torque. A single engine family can also include more than one engine
model (CARB 2011). The size of engine families warrants further analysis in the U.S. For criteria
pollutant emissions, the parent engine in a family is by definition the highest-emitting engine. These
engine families and parents are preserved under the fuel consumption and GHG emissions rule, so
there is no guarantee that the parents will be the highest consuming engines in the family. Hence an
engine may have fuel consumption well in excess of its certification value. The EPA asserts that this is
unlikely to occur, however (EPA and NHTSA 2011a).
Testing is conducted on the steady-state Supplemental Engine Test (SET) (Figure A-7) and/or
transient Federal Test Procedure (FTP) Engine Cycle, depending on whether the engine is used for
long-haul operation and in vocational applications, or both. The FTP is the engine version of the
UDDS vehicle cycle shown in Figure A-3.
International Alignment of Fuel Efficiency Standards for Heavy-Duty Vehicles © ACEEE
50
China
China does not propose to regulate engines for fuel consumption, but engine parameters as well as
engine fuel consumption maps are key inputs to the vehicle simulation model. The fuel consumption
map will be based upon at least 81 speed-torque data points. These data points are to be selected as
uniformly as possible from the point of 10% engine load to the point of the maximum torque within
the normal range of engine speed (CATARC 2010b). Several additional engine characteristics will
need to be specified as inputs to the simulation as well, including reverse drive torque, engine speed
and fuel consumption during idling, rated and maximum engine speed, and maximum torque
(CATARC 2010a, 2010b). Manufacturers will need to test every engine that will be used in a heavy-
duty vehicle.
EU
The EU program will require an engine fuel map as an input for simulation modeling. The engine fuel
map will be based on fuel consumption rates at more than 80 test points (Schukert 2011), defined by
10 engine speeds at equal intervals and 10 engine load levels (TU Graz 2011). The existing steady-state
and transient engine cycles (World Harmonized Stationary Cycle and World Harmonized Transient
Cycle) are viewed as inadequate, because they do not cover all engine operating conditions (TU Graz
2011).
AERODYNAMICS AND ROLLING RESISTANCE
This section provides details of each region’s handling of coefficients of drag (Cd) and rolling
resistance (Crr), followed by a description of four methods of measuring Cd.
US
The U.S. program adopts a coastdown test as the primary method for measuring aerodynamic drag
coefficient, Cd. However, alternative methods including wind tunnel testing and computational fluid
dynamics can be used with preliminary approval from the agencies. In that case, Cd values determined
from the alternative method must be corrected by a constant adjustment factor, as outlined in the rule
(EPA and NHTSA 2011a).
The overall tire Crr will be calculated by the equation:
Crr=0.425 x Trailer Crr + 0.425 x Drive Crr + 0.15 x Steer Crr
The Crr for trailer tires is specified as 0.006, but Crr for the steer and drive tires is determined by the
vehicle or tire manufacturers per ISO 28580.
Japan
Japan’s vehicle simulation uses standard values for the coefficients of aerodynamic and rolling
resistance, depending on vehicle category. They are computed as follows:
Cd*A = 0.00299 B*H – 0.000832
Crr = 0.00513+17.6/W
51
where A = frontal area, B = full width, H = full height, and W = vehicle curb weight are values fixed
for each regulatory class (based on a “standard plain body”) (CNRE 2005).
China
In China, coastdown testing is recommended to determine tractive load. The test is to be conducted at
full load (CATARC 2010b). For trucks for which manufacturers do not provide coastdown results, a
Cd value of 0.8 will be used, and Crr for bias and radial tires for trucks with 14 tons or more design
mass will be determined by the following equations:
Bias Tires: Crr = 0.0066+0.0000286v
Radial Tires: Crr = 0.0041+0.0000256v
where v is the speed of the testing vehicle in km/h (CATARC 2010b).
EU
The product of drag resistance coefficient and cross sectional area (Cd*A) will be determined by
constant speed testing, but coastdown testing may remain as an alternative option for OEMs (TU
Graz 2011). Regulators may be satisfied with the labeled rolling resistance coefficient provided by tire
manufacturers.
AERODYNAMIC DRAG TESTING
This section describes the various means of determining aerodynamic drag, all of which play a role in
one or more of the regional programs discussed in this report.
Coastdown Testing
The EPA and NHTSA have largely adopted the Society of Automotive Engineers (SAE) Surface
Vehicle Recommended Practice SAE J1263, Road Load Measurement and Dynamometer Simulation
Using Coastdown Techniques (SAE 2010), with some adjustment required due to the fact that the
existing coastdown protocols were established primarily for light-duty vehicles (EPA and NHTSA
2011b).
In coastdown testing, the vehicle is driven on a dry, clean, smooth road not exceeding 0.02% grade. If
grade is greater than 0.02% then its effects should be incorporated into the calculation of road load
(EPA and NHTSA 2011b). A minimum of 10 valid runs, 5 in each direction, must be made (SAE
2010). For each run, the vehicle is accelerated 5 mph above the high point of coastdown speed range,
the transmission is shifted to neutral gear and measurements of speed are taken until the vehicle
reaches a speed less than the lower point of the coastdown speed range. The range of speed over
which the vehicle is tested should be as large as possible considering the length of the straightaway
(SAE 2010). The speed data points collected must range from 70 mph down to 15 mph and must
include 50 mph (EPA and NHTSA 2011b). The coefficients of the road load equation are determined
for each individual valid coastdown run and are then averaged over all pairs of coastdown results (i.e.,
one in each direction) in each data set. Corrections are applied for the wind, temperature, and air

International Alignment of Fuel Efficiency Standards for Heavy-Duty Vehicles © ACEEE
52
density. Finally, the drag area Cd*A is calculated, from which the drag coefficient Cd is determined,
since frontal area of the vehicle is known (EPA and NHTSA 2011b).
This method is simple and is already used by light-duty manufacturers for vehicle certification.
Replicability of the coastdown result is not high, however, and the effect of variable wind direction on
the drag coefficient cannot be captured (EPA and NHTSA 2011b).
Wind Tunnel Methods
A wind tunnel provides a stable test environment in which a full-scale vehicle or a model can be tested
to determine the aerodynamic drag. This method also allows the introduction of positive or negative
yaw angle in order to capture the effect of non-uniform direction of wind on drag coefficient. This
method saves time and helps ensure repeatability of data. However, building a full-scale wind tunnel
is time consuming and costly, and existing facilities in North America are limited. Manufacturers
often use a reduced scale wind tunnel where the scale is reduced to 40% or 12.5% (DTNA 2011).
The U.S. heavy-duty rule requires the use of procedures specified in SAE Wind Tunnel Test
Procedure for Trucks and Buses, SAE J1252 (SAE 1981). SAE J1252 specifies that the tunnel test
section size and speed be determined by a Reynolds number of at least 0.7x10⁶, but recommends that
a higher value be used whenever possible. Researchers from Daimler Trucks North America argue
that the minimum number should be 3 to 4 times higher than the SAE recommended value (DTNA
2011).
The testing protocol consists of multiple baseline runs with full yaw sweep regardless of tunnel type
(SAE 1981). Testing may be performed for Cd measurements with yaw angles 0, +1, +3, +6, +9, 0, -1, -
3, -6, -9, and 0 (SAE 1981), although results from zero yaw angle will be used for compliance (EPA
and NHTSA 2011b).
Computational Fluid Dynamics
This method models the effect of wind drag on the vehicle using either the Navier-Stokes equations or
the Boltzman equation. The Navier-Stokes equations relate the physical law of conservation of
momentum to the flow relationship of a dynamic object when the vehicle is moving through the
airflow or of a static body when air is moving around the static vehicle. It can be termed a “macro”
approach. The Bolzman equation takes a “micro” approach, in which the characteristics of discrete,
individual particles within a fluid are determined to model the overall dynamics and behavior of the
fluid, in this case the airflow (EPA and NHTSA 2011a).
Given the drag coefficient of one vehicle, CFD can easily calculate the drag of variants of that vehicle,
thus saving time and money. However, the accuracy of the result is largely dependent on the
assumptions made for the basic vehicle. (EPA and NHTSA 2011a).
Constant Speed Test
Constant speed testing is an alternative method for measuring Cd, or more properly Cd*A. This is the
recommended method for the EU program (TU Graz 2011). Since the vehicle is driven at constant
speed, the acceleration/deceleration is zero and therefore the tractive force at the wheel is the sum of

53
drag, rolling resistance, and grade force. Determination of tire rolling resistance coefficients, vehicle
frontal area, and the altitude profile will provide all unknown parameters and thus Cd can be readily
calculated. The final value should also be normalized to ambient temperature and pressure (TU Graz
2011).

International Alignment of Fuel Efficiency Standards for Heavy-Duty Vehicles © ACEEE
54
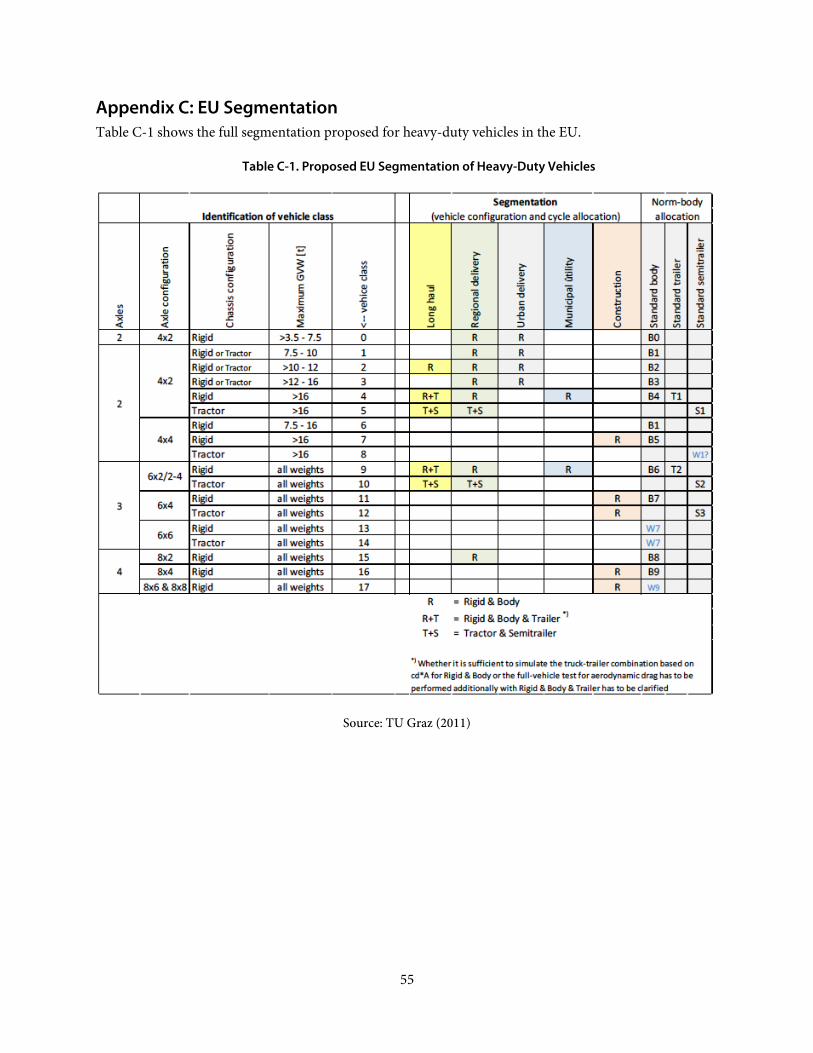
55
Appendix C: EU Segmentation Table C-1 shows the full segmentation proposed for heavy-duty vehicles in the EU.
Table C-1. Proposed EU Segmentation of Heavy-Duty Vehicles
Source: TU Graz (2011)