download (pdf, 7.52mb) - the international council on clean
TRANSCRIPT
F U E L C O N S U M P T I O NCLIMATE CHANGE
e m e r g i n g t e c h n o l o g i e st r u c k e m i s s i o n s
reducing green house gas emiss ions
Prepared by:
NESCCAF Northeast States Center for a Clean Air Future
ICCT International Council on Clean Transportation
Southwest Research Institute
TIAX, LLC
R E D U C I N GHeavy-Duty Long Haul Combination
Truck Fuel Consumption and CO2 Emissions
Final ReportOctober, 2009


i
Prepared by:
NESCCAF Northeast States Center for a Clean Air Future
ICCT International Council on Clean Transportation
Southwest Research Institute
TIAX, LLC
Final ReportOctober, 2009
R E D U C I N GHeavy-Duty Long Haul Combination
Truck Fuel Consumption and CO2 Emissions


iii
Principal Contributors:
Coralie Cooper, NESCCAFFanta Kamakaté, ICCTThomas Reinhart, SwRIMatthew Kromer, TIAX, LLCRobert Wilson, TIAX, LLC
Editor:
Paul Miller, NESCCAF
Report
R E D U C I N GHeavy-Duty Long Haul Combination
Truck Fuel Consumption and CO2 Emissions

iv
R E D U C I N G Heavy-Duty Long Haul Combination Truck Fuel Consumption and CO2 Emissions
ACKNOWLEDGMENTS
NESCCAF and ICCT gratefully acknowledge the generous support provided by The
William and Flora Hewlett Foundation, The Energy Foundation, the ClimateWorks
Foundation, the California Air Resources Board, and the California Energy
Commission. Their vision and support made this study possible.
Many people assisted with information during the simulation modeling and cost
analysis done for this report. We are indebted to the members of the project
Research Steering Committee - listed on the following page - who provided
technical advice throughout the study and reviewed the draft final report. We
owe thanks to additional experts who provided technical input to the study team,
including Fritz Marinko of the Auto Research Center, Kambiz Salari and Rose
McCallen of Lawrence Livermore National Laboratory, and Scott McBroom
formerly of Southwest Research Institute. We would like to acknowledge the work
of Ashok Nedungadi who conducted the vehicle and hybrid system simulation
modeling at Southwest Research Institute, and David Branyon and Nicholas Badain
who were responsible for the engine modeling at Southwest Research Institute. In
addition, Ray Schubert of TIAX developed costs for the truck technologies in this
study. We appreciate their contributions.
Finally, a number of people reviewed the draft report and we are indebted to those
individuals for their advice and comments. We are particularly grateful to the In-
ternational Council on Clean Transportation participants who have reviewed this
report and support its findings and recommendations. We also appreciate the advice
provided by members of the NESCCAF Board who reviewed the draft report and
provided valuable input.

v
Project Steering Committee Members: Bill Van Amburg, Senior Vice President WestStart-CALSTART
Don Anair, Senior Analyst Union of Concerned Scientists
Steve Antcliff, Director of Public StrategyCummins, Inc.
Cheryl Bynum, Group Manager, SmartWay Transport PartnershipU.S. Environmental Protection Agency
Brian Coe, Powertrain Engineering Technical Steward, On Highway Power Systems Caterpillar
David Deppe, Principal Fuel Technologies
Jack W. Gehring, Director, Global Regulatory Policy, Power SystemsCaterpillar
Daniel Hawelti, On-Road Heavy-Duty Diesel SectionCalifornia Air Resources Board
Günter Hörmandinger, Environment Directorate-General, Clean Air & TransportEuropean Commission
Ken Howden, Director, 21st Century Truck Partnership, Vehicles Technologies ProgramU.S. Department of Energy, Office of Energy Efficiency and Renewable Energy
Mitch Greenberg, former Group Manager, SmartWay Transport PartnershipU.S. Environmental Protection Agency
Anthony Greszler, Vice President of Advanced EngineeringVolvo Powertrain North America
Steve Jarosinski, Schneider National, Inc.
Therese Langer, Transportation Program ManagerAmerican Council for an Energy Efficient Economy
Michael Ogburn,Energy Engineering
Michael Roeth, formerly of Navistar International Corporation
Tom Stover,Eaton Corporation
Luke Tonachel, Vehicles Analyst Natural Resources Defense Council
NESCCAF and ICCT Express Our Sincere Appreciation to the Project Steering Committee Members

Board of Directors: Steven P. Suttle, NESCCAF, ChairCormetech, Inc.
Michael J. BradleyM.J. Bradley & Associates, Inc.
James P. Brooks, Director Maine Department of Environmental Protection, Bureau of Air Quality Control
Anne Gobin, Director Connecticut Department of Environmental Protection, Bureau of Air Management
Carolyn L. Green EnerGreen Capital Management, LLC
Jason Grumet, Executive Director National Commission on Energy Policy
Christopher J. Hessler AJW Inc.
John HigginsNew York Department of Environmental Conservation, Division of Air Resources
Adele Hurley University of Toronto, Munk Centre for International Studies
Timothy V. Johnson Corning, Inc.
Barbara Kwetz, Director Massachusetts Department of Environmental Protection, Bureau of Waste Prevention
Professor Morton Lippmann New York University School of Medicine
Douglas L. McVay Rhode Island Department of Environmental Management, Office of Air Resources
Professor Mario Molina University of California, San Diego, Department of Chemistry & Biochemistry
William O’Sullivan New Jersey Department of Environmental Protection, Division of Air Quality
Robert Scott New Hampshire Department of Environmental Services, Air Resources Division
Eric Svenson PSEG
Susan Tierney, Ph.D. The Analysis Group
Richard Valentinetti, Director Vermont Department of Environmental Conservation, Air Pollution Control Division
NORTHEAST STATES CENTER FOR A CLEAN AIR FUTURE
vi
R E D U C I N G Heavy-Duty Long Haul Combination Truck Fuel Consumption and CO2 Emissions

vii
INTERNATIONAL COUNCIL ON CLEAN TRANSPORTATION
The goal of the International Council on
Clean Transportation (ICCT) is to dramati-
cally reduce conventional pollution and
greenhouse gas emissions from personal,
public, and goods transportation in order
to improve air quality and human health,
and mitigate climate change. The Council
is made up of leading government officials
and experts from around the world
that participate as individuals based on
their experience with air quality and
transportation issues.
The ICCT promotes best practices and
comprehensive solutions to improve vehicle
emissions and efficiency, increase fuel
quality and sustainability of alternative
fuels, reduce pollution from the in-use fleet,
and curtail emissions from international
goods movement.

R E D U C I N GHeavy-Duty Long Haul Combination
Truck Fuel Consumption and CO2 Emissions
TABLE OF CONTENTS
ix
TABLE OF CONTENTS
t a b l e o f c o n t e n t st a b l e o f c o n t e n t stable of contents
Table of Contents
Acknowledgments .............................................................................................................................. iv
Executive Summary ........................................................................................................................... 1
Introduction ................................................................................................................................... 9
Purpose of the Study .................................................................................................................... 9
The Importance of the Transportation Sector ................................................................................. 9
Political and Regulatory Context in the U.S. and Internationally .................................................... 11 International Context .......................................................................................................... 11 Climate Change Action by the U.S. Federal Government ...................................................... 13 State Actions to Reduce the Impacts of Climate Change ....................................................... 15
Overview of the Study Method ........................................................................................................... 19
Selecting and Defining a Baseline Class 8 Truck ............................................................................ 20
Validating Simulation Modeling Results for the Representative Class 8 Long-Haul Truck ................ 22 Engine Model ...................................................................................................................... 22 Adjusting the Baseline Engine to 2010 NOx Emissions Requirements ................................... 24 Vehicle Model ..................................................................................................................... 24
Selecting a Drive Cycle ................................................................................................................. 26
Identifying Discrete Vehicle Technology Options for Evaluation ..................................................... 28 Downselection of Technologies Included in this Analysis ...................................................... 28 Transmission System Technologies ....................................................................................... 32 Vehicle Technologies ............................................................................................................ 33 Future Developments in Heavy-Duty Truck Technology ........................................................ 38
Assembling Technology Packages for Model Simulation ....................................................................... 39
Method of Estimating Cost of Technology Package .............................................................................. 42
Method of Cost-Benefit Analysis ......................................................................................................... 44
Fleet-Wide Emissions Benefit Analysis Methodology ............................................................................ 46 Fleet Characterization .......................................................................................................... 46 Fleet Model Validation ......................................................................................................... 46 Technology Adoption Methodology ...................................................................................... 47
Results ................................................................................................................................... 49

xx Ta b l e o f C o n t e n t s
R E D U C I N G Heavy-Duty Long Haul Combination Truck Fuel Consumption and CO2 Emissions
Overview ................................................................................................................................... 49
Emission and Fuel Consumption Reduction Results ....................................................................... 49
CO2 Emission and Fuel Consumption Reduction Potential for Individual Technologies ................... 50
Modeled CO2 Emission and Fuel Consumption Reduction Potential Individual Technologies and Technology Combinations............................................................................................................. 50 Package 1 – Baseline Vehicle and Weight Reduction Evaluation ........................................... 50 Package 2 – 2007 SmartWay Aerodynamic Improvement Plus Wide Base Single Tires ........... 51 Package 3 – Advanced Aerodynamic Drag and Rolling Resistance Improvements .................. 53 Package 4 – Hybrid Electric System ...................................................................................... 53 Package 5 – Mechanical Turbocompound ............................................................................. 54 Package 6 – Electric Turbocompound ................................................................................... 55 Package 7 – Variable Valve Actuation (VVA)......................................................................... 55 Package 8 – Bottoming Cycle ............................................................................................... 55 Package 9 – Longer/Heavier Vehicle Combinations .............................................................. 56 Package 10 – Lower Road Speed .......................................................................................... 60 Package 11 – Advanced EGR Cooling .................................................................................. 62
Maximum Reduction Combinations .............................................................................................. 63 Package 12 – Standard Trailer Maximum Technology Combination ...................................... 63 Package 13 – Longer/Heavier Truck Lower Cost Maximum Technology Combination .......... 64 Package 14 – Longer/Heavier Truck Higher Cost Maximum Technology Combination ......... 64
Maximum Technology Combination Results ................................................................................. 65
Estimate of Fuel Consumption and Emissions Reduced from Idling Reduction ................................ 65
Cost Analysis ................................................................................................................................ 66 Cost Benefit Analysis ........................................................................................................... 68
Fleet-Wide Fuel Consumption and CO2 Emissions Benefit Analysis ............................................... 71 Fleet Wide Analysis Assuming 15 Year Payback Requirement ................................................ 72 Fleet Wide Analysis Assuming 3 Year Payback Requirement. ................................................. 72 Fleet Wide Analysis Assuming Maximum Technology Case ................................................... 72
Conclusions ................................................................................................................................. 74
APPENDIX A: Description of Heavy-Duty Technologies and Modeling Approach ................................. 77
APPENDIX B: Summary of Incremental Costs for Technology Packages ............................................... 95

xiTa b l e o f C o n t e n t s
APPENDIX C: Detailed Information on TIAX Cost Analysis ................................................................. 99
APPENDIX D: Detailed Information on the Fleet Model Analysis ........................................................ 123
APPENDIX E: References ................................................................................................................... 131
Figures
Figure 1. Potential Fuel Savings in the U.S. Long Haul Box Trailer Fleet ......................................... 7
Figure 2. 2006 U.S. GHG inventory .............................................................................................. 10
Figure 3. Fuel Consumption by Medium and Heavy-duty Vehicle Class.......................................... 11
Figure 4. SmartWay™ equipment standards (US EPA 2008) .......................................................... 14
Figure 5. Potential Timeline for a US DOT medium- and heavy-duty fuel economy regulation ........ 15
Figure 6. BSFC Comparison of Simulation Model and Engine Test Data ......................................... 23
Figure 7. Heavy Truck Line-haul Drive Cycle ................................................................................ 27
Figure 8. Grades on Heavy Truck Line-haul Drive Cycle ................................................................ 27
Figure 9. 2008 EIA Long-term Energy Outlook Diesel Price Scenarios ........................................... 45
Figure 10. Historical vs. Modeled Fuel Use in U.S. Combination Class 8 Trucks ............................. 47
Figure 11. Baseline Vehicle Fuel Economy and Sensitivity to Vehicle Mass ..................................... 51
Figure 12. Results From Moderate Drag and Rolling Resistance Reduction ..................................... 52
Figure 13. Results From Advanced Drag and Rolling Resistance Reduction..................................... 52
Figure 14. Efficiencies for Longer/Heavier Vehicles Evaluated ....................................................... 57
Figure 15. Results for Longer/Heavier Trucks with Increased Engine Power at Differing Freight Densitities ................................................................................................................................... 60
Figure 16. Impact of Lower Road Speed on Fuel Consumption ...................................................... 61
Figure 17. 15 Year Net Cost of Ownership for Technology Packages .............................................. 68
Figure 18. 3 Year Net Cost of Ownership for Technology Packages ................................................ 69
Figure 19. Net Vehicle Costs Assuming 3 and 15 Years of Ownership ............................................ 70
Figure 20. Breakdown of Fuel Consumed in Class 8 Trucks ........................................................... 71
xiixii Ta b l e o f C o n t e n t s
R E D U C I N G Heavy-Duty Long Haul Combination Truck Fuel Consumption and CO2 Emissions E X E C U T I V E S U M M A RY Figure 21. 15 Year Payback Requirement Fleet Analysis................................................................. 73
Figure 22. 3 Year Payback Requirement Fleet Analysis................................................................... 73
Tables
Table 1. Technologies and Measures Combined in the Modeled Packages ...................................... 3
Table 2. Heavy-duty Long Haul CO2 and Fuel Consumption Reduction and Cost Results for Analyzed Packages ....................................................................................................................... 5
Table 3. Summary of Japanese heavy-duty vehicle fuel economy regulation .................................... 12
Table 4. The 21st Century Truck Program Technology Goals ......................................................... 13
Table 5. Summary of Northeastern State Climate Legislation/Plans................................................ 17
Table 6: Comparison of Vehicle and Model Results ........................................................................ 25
Table 7. Vehicle Technologies Evaluated for Possible Inclusion in this Study ................................... 28
Table 8. Aerodynamic Improvements Considered .......................................................................... 35
Table 9. Description of Technologies Simulated by SwRI ................................................................ 40
Table 10. Scenario Summary ......................................................................................................... 48
Table 11. Parallel Hybrid System Modeling Results ........................................................................ 54
Table 12. Mechanical Turbocompound System Results .................................................................. 54
Table 13. Electrical Turbocompound System Results ...................................................................... 54
Table 14. Bottoming Cycle System Results .................................................................................... 56
Table 15. Summary for Longer / Heavier Vehicles Evaluated ......................................................... 56
Table 16. CO2 and Fuel Consumption Reductions for Longer / Heavier Vehicles ........................... 58
Table 17. Results for Longer/Heavier Trucks with Higher Engine Power ........................................ 59
Table 18. Maximum Technology Combination Modeling Results ................................................... 65
Table 19. Fuel Consumption and CO2 Reductions from Idle Reduction Technologies ...................... 66
Table 20. Summary of Costs Estimated for Each of the Technology Packages .................................. 67
E X E C U T I V E S U M M A RY
1
EXECUTIVE SUMMARY
e x e c u t i v e s u m m a r ye x e c u t i v e s u m m a r yexecut ive summaryExecutive Summary
R E D U C I N GHeavy-Duty Long Haul Combination
Truck Fuel Consumption and CO2 Emissions
OverviewThis study provides an assessment of available and emerg-
ing technologies that could be used to reduce CO2 emis-
sions and lower fuel consumption from new heavy-duty
long haul combination trucks in the United States in the
2012 to 2017 timeframe. Its findings are drawn from the
results of original cost and technology analyses conducted
for this study, together with information obtained from
previous studies and reports.
In 2006, transportation sources emitted approximately 40
percent of all GHG emissions in the United States.
Medium- and heavy-duty vehicles (above 8,500 gross
vehicle weight rating) represent about 22 percent of the
transportation emissions, up from 15 percent in 1990 (EPA
2009). Trucking is energy-intensive and accounted for
69 percent of freight energy use, consuming 2.35 million
barrels of oil per day in 2008 and generating 363 million
metric tons of carbon dioxide (EIA, 2009). Hence trucks
are an important place to look for energy savings and
climate change mitigation in the transportation sector.
There were over 11 million medium- and heavy-trucks
(those over 10,000 pounds GVWR, Class 3 through 8) on
U.S. roads in 2008 and 684,000 new medium and heavy
trucks were sold into the market in that year (Polk, 2008).
Sales of individual models number in the hundreds or
thousands, in contrast to the tens or hundreds of thousands
for car models. While truck owners and operators are more
affected than passenger vehicle users by fuel expenses,
the demand for fuel economy has historically not been
sufficient to bring all cost-effective efficiency technologies
into the market. Manufacturer risk, low fuel prices, lack
of fuel economy information on individual models, and
undervaluation of fuel economy all limit the introduction of
fuel saving technologies.
Among medium- and heavy-trucks, Class 8 trucks are the
largest CO2 emitters and fuel users, consuming two-thirds
of all truck fuel, or 1.57 million barrels per day. Current
fuel economy for Class 8 trucks is estimated by the US
Department of Energy at 6.0 mpg and projected to rise
modestly to 6.8 mpg by 2025 (EIA, 2009). Substantial
improvements could be made to truck efficiency through
a variety of existing and emerging technologies, including
engine improvements, transmission enhancements, better
aerodynamics and changes in systems and logistics. This
study finds that fuel consumption for new tractor-trailers
could be lowered by 20 percent starting in 2012 and as
much as 50 percent beginning in 2017, while providing
net savings for the owner based on lifetime fuel savings
paying for the incremental vehicle, operation, and mainte-
nance costs.
MethodThe project was directed by an expert steering committee
composed of representatives from major truck and power-
train manufacturers, government agencies, trucking fleets,
and fuel economy and heavy-duty experts from non-profit
organizations. The core of the analysis consisted of a
series of modeled simulations to predict the fuel saved by
incorporating various technology and operational measure
combinations in new trucks. Southwest Research Institute
(SwRI) was engaged to perform vehicle and engine simula-
tion modeling, which provides detailed information on the
acceleration, braking, power, fuel economy, and emissions
performance of different heavy-duty vehicle designs,
including advanced powertrain designs. The technologies
and operational measures selected are further discussed in
Chapter 2, and in Appendix A. TIAX LLC (TIAX) assem-
bled cost information for each package modeled, assessed
the net cost of these packages over two time horizons and

2 E x e c u t i v e S u m m a r y
R E D U C I N G Heavy-Duty Long Haul Combination Truck Fuel Consumption and CO2 Emissions
estimated the United States fleet-wide fuel savings impact
of various technology adoption scenarios.
The baseline vehicle should be a vehicle representative
of the average Class 8 truck in today’s fleet for which
sufficient data has been collected to serve as inputs to
the simulation models. NESCCAF, SwRI and the Steering
Committee selected a Kenworth T-600 Class 8 tractor, a
Volvo D13 engine and an Eaton Fuller 10-speed manual
transmission as the study’s representative vehicle. This
baseline truck and powertrain, although not a combination
available on the market, fulfilled the criteria for a good
baseline vehicle. It has aerodynamic and rolling resistance
characteristics that approximate the average performance
of the current truck fleet. It has a 2007 emission standards
compliant engine that can be upgraded to meet 2010
emissions requirements. And it has a manual transmission
that has a high market share among fuel economy cost
sensitive fleets.
Once the baseline truck and engine was determined, two
simulation models were used to allow the evaluation of
various packages: GT-POWER for engine cycle simulation
and RAPTOR to model the vehicle, including the transmis-
sion and driveline. An important benefit of simulating the
performance of technology packages, rather than individual
technologies, is that it eliminates the possibility that the
reductions will be “double counted”. The benefits associ-
ated with various options are not necessarily additive when
these improvements are combined in a single vehicle,
particularly to the extent that many technologies target the
same sources of mechanical or thermodynamic inefficiency.
The simulation modeling conducted for this analysis avoids
this problem. Both models were validated by comparing
predicted fuel economy results to actual on-road vehicle
fuel economy measurements, or to test cell engine fuel
consumption results.
The test cycle used in this study was based on the Califor-
nia Heavy-Duty Diesel Truck Drive Cycle. The California
cycle was created from analysis of a statistical study of line
haul truck operations in California. The following changes
were made to the California cycle for this study, based on
input from the experts on the Steering Committee:
The portion of high speed driving was increased to
reflect longer average travel distances nationwide.
The speeds used in the California cycle were increased
by 8 percent to reflect current typical truck operating
speeds on long-haul routes nationwide.
Two segments with grade were added. One segment
includes positive and negative 1 percent grades, and a
second segment has positive and negative 3 percent
grades.
The total duration of the cycle is 6,830 seconds (one hour
and 54 minutes), and the total distance traveled is 103.3
miles. It is important to note that the drive cycle chosen for
this study is specific to long-haul trucks. Thus, the results
are specific to long-haul trucks and cannot necessarily
be extrapolated to other heavy-duty trucks, even Class 8
An important benefit of simulating the
performance of technology packages,
rather than individual technologies, is
that it eliminates the possibility that the
reductions will be “double counted”.
3E x e c u t i v e S u m m a r y
trucks, operating on different drive cycles such as regional
haul, pickup and delivery, or drayage.
Technology and Operational Measures A total of 32 technologies and operational measures were
identified and considered for inclusion in this project.
The complete list of the individual vehicle technologies
considered in this study for purposes of evaluating future
Class 8 heavy-duty truck fuel consumption and CO2
emissions reduction potential is available in Appendix A.
The list includes a brief description of each of the technolo-
gies and an explanation of how each option might reduce
CO2 emissions. Some of the technologies selected for
evaluation in this study are fully commercialized. Others,
such as bottoming cycle, are not and may present technical
challenges that could result in delayed introduction or
lower performance than projected in this study.
SwRI did not consider fuel consumption and CO2
reduction technologies that are not currently in production
or for which a design specification is not available in the
literature. As such, the study findings do not represent the
total available potential to reduce heavy-duty vehicle fuel
consumption and CO2 emissions – the results only estimate
what can be done given known technologies. Going
forward, more advanced technologies to improve engine,
vehicle, and transmission technologies could and will likely
be developed that would further reduce truck fuel con-
sumption and CO2 emissions beyond the 2017 timeframe.
Using the most promising individual technologies that
emerged from the initial screening evaluation described
above, in combination with cost estimates for the
individual technologies, a series of technology packages
was assembled for modeling. Generally, these packages
were designed to span the full range of CO2 reduction
potential (i.e., from modest to substantial reductions), so
they necessarily reflect a range of impacts (and costs).
Table 1 presents the technology packages modeled in
three groups: (1) Building block technologies,
(2) Operational measures, and (3) Maximum reduction
combination packages.
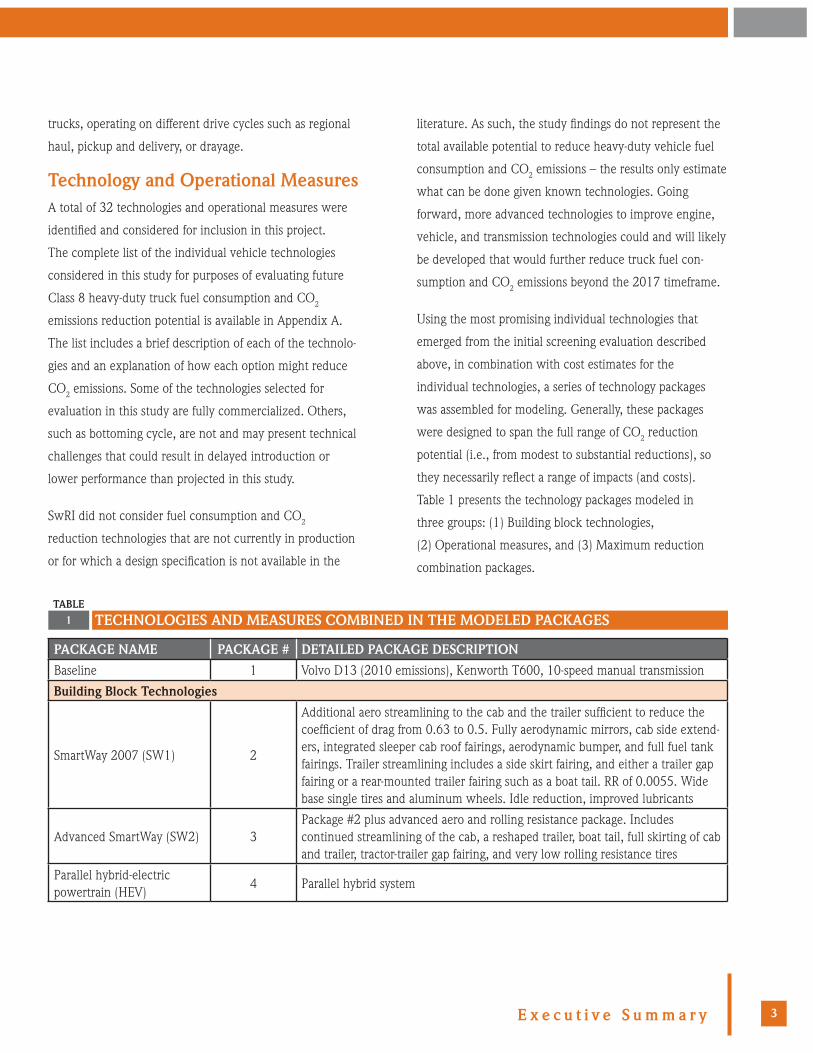
1TABLE
TECHNOLOGIES AND MEASURES COMBINED IN THE MODELED PACKAGES
PACKAGE NAME PACKAGE # DETAILED PACKAGE DESCRIPTION
Baseline 1 Volvo D13 (2010 emissions), Kenworth T600, 10-speed manual transmission
Building Block Technologies
SmartWay 2007 (SW1) 2
Additional aero streamlining to the cab and the trailer sufficient to reduce the coefficient of drag from 0.63 to 0.5. Fully aerodynamic mirrors, cab side extend-ers, integrated sleeper cab roof fairings, aerodynamic bumper, and full fuel tank fairings. Trailer streamlining includes a side skirt fairing, and either a trailer gap fairing or a rear-mounted trailer fairing such as a boat tail. RR of 0.0055. Wide base single tires and aluminum wheels. Idle reduction, improved lubricants
Advanced SmartWay (SW2) 3Package #2 plus advanced aero and rolling resistance package. Includes continued streamlining of the cab, a reshaped trailer, boat tail, full skirting of cab and trailer, tractor-trailer gap fairing, and very low rolling resistance tires
Parallel hybrid-electric powertrain (HEV)
4 Parallel hybrid system

4 E x e c u t i v e S u m m a r y
R E D U C I N G Heavy-Duty Long Haul Combination Truck Fuel Consumption and CO2 Emissions
PACKAGE NAME PACKAGE # DETAILED PACKAGE DESCRIPTION
Mechanical turbocompound 5 Mechanical turbocompound plus Package #7
Electrical turbocompound 6 Electrical turbocompound plus Package #7
Variable Valve Actuation (VVA)
7 Variable valve actuation
Bottoming cycle 8 Bottoming cycle
Advanced EGR 11 Advanced exhaust gas recirculation
Operational Measures
Rocky Mountain Double (RMD) trailers
9 Longer/heavier trailer (rocky mountain doubles – 48’ and 28’ trailers)
60 mph speed limit 10 Slower road speed (60 mph)
Maximum Reduction Combination Packages
Maximum reduction combination 1
12Standard trailer w/advanced aero and rolling resistance tires, hybrid, bottoming cycle, 60 mph (Packages #3, #4, #8, #10)
Maximum reduction combination 2
13Longer and heavier trailer w/advanced aero and rolling resistance tires, hybrid, electric turbocompound, VVA, 60 mph (Packages #3, #4, #6, #7, #9, #10)
Maximum reduction combination 3
14Longer and heavier trailer w/advanced aero and rolling resistance tires, hybrid, bottoming cycle, 60 mph (Packages #3, #4, #8, #9, #10)
1TABLE (continued)
TECHNOLOGIES AND MEASURES COMBINED IN THE MODELED PACKAGES
ResultsThe results from the simulation modeling demonstrated
a broad range of emission reductions and fuel savings for
the 14 technology packages modeled. Table 2 provides the
results obtained for each package. The individual measures
are compared to the baseline vehicle. Table 2 provides the
incremental vehicle cost, which is the modeled package
additional capital cost compared to the baseline (Package
1). The table also includes the net cost of the technology
package, defined as the incremental technology package
cost minus 15 years of fuel savings discounted at a rate of
7 percent.1 Note that a negative net cost means that
fuel savings more than offset the incremental cost of the
emissions reduction technologies being modeled. In other
words, it equates to projected consumer savings over
the lifetime of the vehicle. The net cost analysis assumes
an average price of $2.50 per gallon of diesel fuel, and
assumes that the annual mileage declines as the vehicle
ages. Results from an additional net cost analysis assuming
3 years of fuel savings at a different fuel price is presented
in Chapter 3. Finally, the table provides the length of time
required for the fuel savings to payback the investment in
technology.
The eight building block technologies considered in this
study reveal a range of potential reductions from a modest
improvement for variable valve actuation and advanced
exhaust gas recirculation to almost 28 percent for a host
of aerodynamic, friction and rolling resistance technolo-
gies listed as Advanced Smartway (See Table 1 for list of
Advanced SmartWay technologies). When combined, these
existing and emerging technologies are capable of improv-
ing baseline fuel consumption up to 50 percent.
1 The analysis assumes a truck is driven 1.2 million miles over the 15 year period. It also includes operation and maintenance costs.

5E x e c u t i v e S u m m a r y
2
TABLE
HEAVY-DUTY LONG HAUL CO2 AND FUEL CONSUMPTION REDUCTION AND COST RESULTS FOR ANALYZED PACKAGES
The technology costs range from several hundred dollars
(variable valve actuation and ERG) to moderate ($6,600
for electric turbo compounding) to expensive ($23,000
for SmartWay and hybrid-electric powertrain packages), to
2 Includes idle reduction benefits from a diesel-fired APU3 Includes idle reduction benefits from battery storage; the modeled on-road fuel consumption improvement was 5.6%4 Includes credit for an auxiliary power unit (APU), which is included in the SmartWay package, but is not needed in a hybrid vehicle. 5 The lifetime cost of ownership figures are calculated using fuel savings averaged between grossed out and cubed out trucks.6 Includes idle reduction benefits from battery storage.a Calculations based on year 2022 high volume technology costs, EIA 2022 fuel price ($2.50/gal), a 7% discounted cash flow; time to payback assumes a constant 120,000 miles per year; the cost of ownership calculation assumes annual mileage declines over the life of the vehicle with a total mileage of 1.2 million miles in 15 years.
very expensive (nearly $45,000 for Advanced Smartway).
Despite the wide range in costs, most of these technologies
pay for themselves in the first few years of ownership with
the exception of the hybrid electric powertrain.
PACKAGE NAMEFUEL CONSUMPTION/ CO2 REDUCTION (%)
INCREMENTAL VEHICLE COST ($)a
LIFETIME COST OF OWNERSHIP (15 YEARS, 7%)a
TIME TO PAYBACK a(YEARS)
Baseline n/a n/a n/a n/a
Building Block Technologies
SmartWay 2007 (SW1) 17.8% 2 $22,930 -$23,600 3.1
Advanced SmartWay (SW2) 27.9%2 $44,730 -$55,800 3.8
Parallel hybrid-electric powertrain (HEV)
10%3 $23,0004 $100 7
Mechanical turbocompound 3.0% $2,650 -$5,500 2.0
Electric Turbocompound 4.5% $6,650 -$5,500 3.5
Variable Valve Actuation (VVA) 1.0% $300 -$2,500 0.6
Bottoming cycle 8.0% $15,100 -$4,800 5.2
Advanced EGR 1.2% $750 -$2,600 1.4
Operational Measures
Rocky Mountain Double (RMD) trailers
16.1% (grossed out) 21.2% (cubed out)
$17,500 -$34,1005 2.1
60 mph speed limit 5.0% $0 -$13,900 n/a
Maximum Reduction Combination Packages
Maximum reduction combination 1 (standard 53’ trailer, hybrid, BC, SW2, 60 mph)
38.6% (grossed out) 6
40.2% (cubed out)6 $71,630 -$27,3005 4.8
Maximum reduction combination 2 (RMD, hybrid, electric turbocom-pound, VVA, SW2, 60 mph)
48.7% (grossed out)6
46.2% (cubed out)6 $80,380 -$41,6005 4.3
Maximum reduction combination 3 (RMD, BC, hybrid, SW2, 60 mph)
50.6% (grossed out)6
48.3% (cubed out)6 $89,130 -$37,2005 4.7
6 E x e c u t i v e S u m m a r y
R E D U C I N G Heavy-Duty Long Haul Combination Truck Fuel Consumption and CO2 Emissions
According to this analysis, combinations of technologies
already used in some production heavy-duty long haul
trucks can reduce CO2 emissions by approximately 5-18
percent. Examples of these technologies include hybrid
vehicle systems, turbocompounding, and the SmartWay
package of modest aerodynamic, tire, and idle-reduction
improvements. Reductions beyond this level will require
the introduction of more advanced technologies such as a
bottoming cycle and advanced aerodynamic or tire rolling
resistance improvements. For example, a package including
advanced aerodynamic components and improved tires can
provide a 28 percent CO2 and fuel consumption reduction
for an incremental vehicle cost of $44,730. Even greater
CO2 and fuel consumption reductions can be achieved –
up to 39 percent - using a combination of bottoming
cycle, slower road speed, advanced aerodynamics, and
hybridization.
Operational measures include slowing the speed of Class
8 trucks and increasing the size and weight of truck-trailer
combinations. Assuming a longer and heavier trailer design
alone, CO2 and fuel consumption reductions ranging from
16-21 percent are feasible for an incremental vehicle cost
of $17,500. This result is for a combination of one 48’
trailer with one 28’ trailer (Rocky Mountain Double or
“RMD”). Additional results for other types of longer and
heavier trailer designs are detailed in Chapter 3. Greater
reductions can be achieved by combining longer and
heavier truck trailers with advanced technologies such as
bottoming cycle and hybridization. There are, however,
limitations to the routes that these longer and heavier
combination vehicles can safely operate. The technology
package that provides the greatest CO2 and fuel
consumption reduction – 50 percent from the baseline
vehicle – includes advanced aerodynamics and rolling
resistance technology, a longer and heavier trailer
combination, a hybrid electric drivetrain, and a bottoming
cycle. This package represents both an impressive
improvement in fuel savings and a very complex
technology combination.
It is critical to recognize that while the costs of using
advanced technologies are greater than the cost of con-
ventional long haul truck technologies, fuel-cost savings in
many cases outweigh additional technology costs for the
technology packages. Assuming a 15-year period, fuel cost
savings far outweigh the additional technology costs for 12
of the 13 advanced technology packages. Table 2 shows
net costs of most of the technology packages that produce
up to 50 percent CO2 and fuel consumption reductions is
negative. Truck owners save between $2,500 and $55,800
over the life of the vehicle due to avoided fuel purchases.
As noted in Table 2, the emission reduction packages evalu-
ated in this study include a range of individual technologies
with a range of CO2 and fuel consumption reduction
potential and a range of costs in an effort to provide a
robust overview of the benefits and costs of candidate
CO2-reduction technologies. Given that future technology
advances could reduce costs for these technologies, the
costs presented could be overstated. Consequently, the
complete set of technology packages does not constitute a
low-cost solution to any particular CO2-reduction scenario,
but rather presents a host of possible solutions across a
range of reductions and costs.
Figure 1 depicts the total potential fuel and CO2 emissions
saved in the U.S. heavy-duty long haul combination truck
fleet, assuming penetration of technologies modeled by
SwRI in this study. The top line represents fuel consump-
tion in the U.S. fleet in a business as usual case. In the

7E x e c u t i v e S u m m a r y
business as usual case, approximately 18 billion gallons of
fuel are used in the entire U.S. fleet in 2030. The second
line, with an arrow indicating “3-year payback” shows
one scenario for introduction of technologies into the
U.S. heavy-duty long haul fleet between now and 2022.
According to this scenario, approximately 3 billion gallons
of fuel are saved from the introduction of technologies
into the U.S. heavy-duty long haul fleet. In the “3-year
payback” scenario, only technologies that provide a net
cost savings over three years are introduced into the fleet.
The third line, indicated with an arrow and text saying “15
year payback,” represents the amount of fuel that could be
saved with more aggressive introduction of technologies
to reduce fuel consumption and CO2 emissions into the
U.S. heavy-duty long haul fleet between now and 2030.
In the “15-year payback” scenario, technologies which pay
for themselves within 15 years of purchase are adopted
into the U.S. heavy-duty fleet. As the lower line indicates,
assuming aggressive introduction of the technology
combinations modeled in this study into the U.S. fleet,
approximately 7 billion gallons or 39 percent of total U.S.
heavy-duty long haul fleet fuel consumption could be
avoided. This represents 39 percent of heavy-duty long
haul CO2 emissions as well. Assuming maximum technol-
ogy penetration (the lowest line in the graph), the use of
approximately 8 billion gallons of fuel and 44 percent of
heavy-duty long haul truck CO2 emissions could be avoided
in the U.S. in 2030.
1FIGURE
POTENTIAL FUEL SAVINGS IN THE U.S. LONG HAUL BOX TRAILER FLEET
Business as Usual
0
2
4
6
8
10
12
14
16
18
20
20072008
20092010
20112012
20132014
20152016
20172018
20192020
20212022
20232024
20252026
20272028
20292030
Line
-Hau
l Box
Tra
iler
Flee
t Fue
l Use
(B
Gal
)
3-Yr Payback
15-Yr Payback
Max Technology
Business as Usual
3-Yr Payback
15-Yr Payback
Max Technology

8 E x e c u t i v e S u m m a r y
R E D U C I N G Heavy-Duty Long Haul Combination Truck Fuel Consumption and CO2 Emissions I N T R O D U C T I O NThe analysis does not assume that any existing vehicles are
retrofitted with technologies and as such, could underes-
timate the total potential emissions and fuel use avoided
from heavy-duty technologies evaluated in this study. In
addition, the analysis does not assume the introduction of
any new technologies after 2015, and could therefore
underestimate the benefits realized from advances in
science and engineering. There are also downside risks,
where some of the modeled technologies may not reach
production maturity with the expected fuel savings or cost.
Many controls, reliability, durability, and packaging issues
remain to be overcome to implement all of the modeled
technologies, and some of these issues may prove difficult.
ConclusionsThe results of the analysis suggest that existing and emerg-
ing vehicle, engine, and transmission technologies can
achieve substantial and cost-effective reductions in heavy-
duty vehicle CO2 emissions and fuel consumption in the
2012 to 2017 timeframe. Coupled with operational mea-
sures, the benefits could even be larger. Specifically, CO2
and fuel consumption emissions from heavy-duty vehicles
can be reduced up to 50 percent in this timeframe. Over
a three year period and with a diesel fuel price of $2.50
per gallon, this study found that five of the technology
packages would result in a net cost savings to the truck
owner, taking into account both incremental technology
costs and fuel savings. The analysis shows that most of the
technology combinations that provide the greatest
reductions would not be adopted into the fleet assuming
a three-year payback requirement. This indicates that
given the short payback period demanded by the truck-
ing industry, a number of these technologies will not be
adopted into the U.S. fleet absent regulation. With a longer
payback period of 15 years estimated lifetime net savings
are between $30,000 and $42,000 for owners of vehicles
achieving CO2 and fuel consumption reductions of up to
50 percent.
Introduction of all the technologies and strategies modeled
in this study into the U.S. heavy-duty long haul fleet
between now and 2030 would lead to an estimated 8
billion gallons of diesel fuel saved annually beginning
in 2030, with lesser reductions being achieved as soon
as 2012. The 8 billion gallons of fuel saved annually
represents approximately 44 percent of the total projected
business as usual fuel consumption in the heavy-duty long
haul fleet. Cumulative fuel savings between now and 2030
would equal approximately 90 billion gallons of diesel fuel.
Approximately 97 million metric tons of annual CO2
emissions would be reduced beginning in 2030. This
would be equivalent to a 44 percent reduction in annual
CO2 emissions beginning in 2030 from business as usual
projections. Cumulative CO2 emissions avoided between
now and 2030 would equal approximately 1.1 billion
metric tons.
The results of the analysis suggest that
existing and emerging vehicle, engine,
and transmission technologies can
achieve substantial and cost-effective
reductions in heavy-duty vehicle CO2
emissions and fuel consumption in the
2012 to 2017 timeframe.
I N T R O D U C T I O N
9
INTRODUCTION
i n t r o d u c t i o ni n t r o d u c t i o ni n t r o d u c t i o n Introduction
R E D U C I N GHeavy-Duty Long Haul Combination
Truck Fuel Consumption and CO2 Emissions
Purpose of the StudyThis study provides an assessment of available and
emerging technologies that could be used to reduce carbon
dioxide (CO2) emissions and fuel consumption from heavy-
duty long-haul vehicles in the United States in the 2012 to
2017 timeframe.7 Its findings are drawn from the results
of original cost and technology analyses conducted for this
study, together with information obtained from other avail-
able reports. An impetus for this study was the establish-
ment of climate change action plans in the northeastern
United States, California, and countries outside of the U.S.
that will require substantial reductions in motor vehicle
CO2 emissions if the climate goals are to be met. Another
impetus for this study was the development of a regulation
adopted by the Japanese government to reduce heavy-duty
vehicle fuel consumption. After this study began, the U.S.
Congress passed the Energy Independence and Security
Act of 2007. This act directed the U.S. Department of
Transportation (US DOT) to begin regulation of medium-
and heavy-duty vehicle fuel consumption. Any regulations
resulting from this act should also have the effect of reduc-
ing CO2 emissions. Also, in early 2009, the EPA reached
a finding that CO2 is a danger to human health. The EPA
may soon begin the process of regulating CO2 emissions
from heavy-duty vehicles. CO2 is the only GHG included in
this assessment.
The goal of this assessment is to help define CO2-reducing
heavy-duty vehicle technologies and strategies that are
expected to be feasible, commercially available, and
cost-effective in the 2012 and 2017 timeframe. The study
did not evaluate regulatory changes that would likely be
necessary to allow for widespread use of some operational
changes. For example, changes in state or federal law
would likely be necessary to reduce road speeds, however
an analysis of this and other necessary policy changes was
not included in this study. A wide range of technologies
were evaluated, both individually and in packages, for their
potential to reduce CO2 emissions and fuel consumption
from heavy-duty vehicles. The technologies examined fall
into five primary categories:
(1) off-the-shelf aerodynamic improvement technologies;
(2) off-the-shelf drivetrain technologies;
(3) emerging drivetrain technologies;
(4) emerging aerodynamic improvement technologies; and
(5) operational measures.
The study also includes an assessment of the potential CO2
emissions and fuel consumption avoided by the introduc-
tion of these technologies and operational measures into
the U.S. heavy-duty vehicle fleet.
The results presented in this report have significant
implications for states, provinces, and countries that share
the commitment to reducing transportation-related CO2
emissions as part of a broader effort to address the risks
posed by global climate change.
The Importance of the Transportation SectorIn 2006, transportation sources emitted approximately 40
percent of all CO2 emissions in the United States. Figure 2
on page 10 provides a breakdown of the contribution of
different sources to total U.S. greenhouse gas emissions.
As can be seen in the figure, electricity generation is the
largest source of CO2 emissions in the U.S., followed by
CO2 emissions from transportation sources.
7 CO2 was the only greenhouse gas evaluated in this study.

10 I n t r o d u c t i o n
R E D U C I N G Heavy-Duty Long Haul Combination Truck Fuel Consumption and CO2 Emissions
2FIGURE
2006 U.S. GHG INVENTORY
CO2 Electricity Generation
CO2 Commercial
CH4 Enteric Fermentation
CH4 Landfills
0 500 1000 1500 2000 2500
CO2 Non-Energy Use of Fuels
CO2 Wood Biomass and Ethanol Consumption b
CO2 Transportation
CO2 Residential
N2O Agricultural Soil Management
CO2 Industrial
Source: EPA 2006
EPA’s 2006 GHG inventory provides a breakdown of the
contribution of different mobile sources to total
transportation GHG emissions. According to the
inventory, medium- and heavy-duty vehicles (above 8,500
gross vehicle weight rating (GVWR)) represented about
22 percent of the transportation emissions, up from 15
percent in 1990 (EPA 2008). The majority of medium- and
heavy-duty truck GHG emissions come from diesel-fueled
commercial vehicles and among these commercial vehicles,
Class 8 trucks emit the majority – more than two thirds –
of GHG emissions from medium- and heavy-duty trucks.
Figure 3 provides a breakdown of fuel consumption in
medium- and heavy-duty trucks and, as can be seen, Class
8 trucks are by far the largest consumers of fuel. Class 8
consists of trucks with GVWR above 33,000 lbs. The most
common type of Class 8 truck is the tractor-trailer combina-
tion truck. These vehicles are primarily employed in freight
transportation over long distances or long-haul trucking.
Approximately 70 percent of fuel used by Class 8 trucks
is used in long-haul service with trips over 200 miles long
and regional freight transport – trips that are under 200
miles long. Class 8 tractor trailer trucks’ large share of the
sector’s fuel use is due to their high usage rate compared to
other heavy-duty vehicles. The remainder of fuel consumed
by Class 8 vehicles is used in other types of trucks such as
refuse, dump, and cement trucks. The type of truck evalu-
ated in this study; long haul, tractor trailer trucks consume
approximately 45 percent of total Class 8 fuel annually.
Clearly, significantly reducing heavy-duty truck CO2 emis-
sions is an important part of a comprehensive approach
to address CO2 emissions from the transportation sector
and ultimately reverse the impacts of climate change, in
the United States and globally. This study builds on and
complements the substantial research being conducted
by the U.S. Department of Energy’s 21st Century Truck
Program, the U.S. EPA’s (Environmental Protection Agency)

11I n t r o d u c t i o n
3FIGURE
FUEL CONSUMPTION BY MEDIUM AND HEAVY-DUTY VEHICLE CLASS
2.30%1.10%
3.80%
13.50%
4%
75.30%
Class 3 (10,001 to 14,000 lb)
Class 4 (14,001 to 16,000 lb)
Class 5 (16,001 to 19,500 lb)
Class 6 (19,501 to 26,000 lb)
Class 7 (26,001 to 33,000 lb)
Class 8 (33,001 lb and over)
Source: DOE 2001
SmartWay program, research by truck and engine
manufacturers, and trucking fleet research and
demonstration projects.
The following sections provide additional information
on the political and regulatory context in the United
States and abroad within which heavy-duty CO2 and fuel
economy regulation are to be developed.
Political and Regulatory Context in the U.S. and InternationallyInternational Context
As early as 1992, international awareness of the many
potential risks associated with global warming led 160
countries, including the United States, to adopt a Frame-
work Convention on Climate Change with the stated
objective of achieving “stabilization of greenhouse gas
concentrations in the atmosphere at a level that would
prevent dangerous anthropogenic interference with the
climate system.”[UN 1992]
Toward this objective, signatories pledged to work to
stabilize greenhouse gas emissions. A number of industrial-
ized countries, again including the United States, adopted
the specific near-term goal of returning year 2000 CO2
emissions to 1990 levels. It subsequently became evident
that most countries, including the United States, were not
on track to meet this objective. In response, parties to the
Framework Convention adopted the Kyoto Protocol in
1997, which included targets and timetables for reducing
GHG emissions to specific levels for each country. As of
early 2003, 102 countries had ratified or acceded to the
Protocol. However, the United States – citing economic
concerns – has not ratified the Kyoto Protocol.
12 I n t r o d u c t i o n
R E D U C I N G Heavy-Duty Long Haul Combination Truck Fuel Consumption and CO2 Emissions
Internationally, Japan was the first and remains the only
country to have adopted mandatory fuel economy
standards for heavy-duty vehicles. Japan adopted the
standards in 2005 and they will come into force with
model year 2015.
Japanese Heavy-Duty Fuel Economy Standards
In November 2005, the Japanese government introduced
the first of their kind fuel economy standards for new
medium- and heavy-duty diesel vehicles, which were
estimated to be responsible for approximately one-quarter
of all CO2 emissions from motor vehicles in 2002 in Japan.
Those standards affect commercial trucks with a gross
vehicle weight (GVW) in excess of 3.5 metric tons (about
7,700 lbs) and buses with a carrying capacity above 11
passengers.
Relative to the fuel economy standards required for
passenger vehicles,8 the heavy-duty standards require
modest improvements in fuel economy [ANRE/MLIT
2007]. Table 3 summarizes the average 2015 fuel economy
target by vehicle type and class, along with the relative
improvement over the 2002 baseline, required by the
standards.
3TABLE
SUMMARY OF JAPANESE HEAVY-DUTY VEHICLE FUEL ECONOMY REGULATION
VEHICLE TYPE
VEHICLE CLASS
FUEL ECONOMY (KM/L) IMPROVEMENT (%)
2002 BASELINE 2015 TARGET
Truck
Tractor 2.67 2.93 9.7
Other truck 6.56 7.36 12.2
Total 6.32 7.09 12.2
Bus
Urban 4.51 5.01 11.1
Other bus 6.19 6.98 12.8
Total 5.62 6.30 12.1
The 2015 average target and relative improvement assume a constant 2002 vehicles sales mix
Compliance with the model year 2015 fuel economy
targets is to be measured by reference to individual
standards disaggregated by vehicle class, gross vehicle
weight, and, for lighter trucks, rated cargo load. Each
manufacturer is required to meet the fuel economy target
for each type of vehicle based upon a sales-weighted
average for that category. Fuel economy is measured
through a combination of engine-only fuel consumption
testing and simulation modeling of gear shifting and vehicle
resistance loads.
The Japanese standards explicitly take into account the
trade-off between emissions and fuel consumption. The
reason stated for the relatively modest improvement
required over a 15 year span is because the standard
recognizes that a significantly larger improvement must
be made to overcome fuel economy losses inherent in the
implementation of more stringent emissions regulations.
8 Japan’s aggressive light-duty fuel economy standards finalized in February 2007 require a 23.5 percent improvement in the fuel economy of passenger vehicles from 2004 to 2015.
13I n t r o d u c t i o n
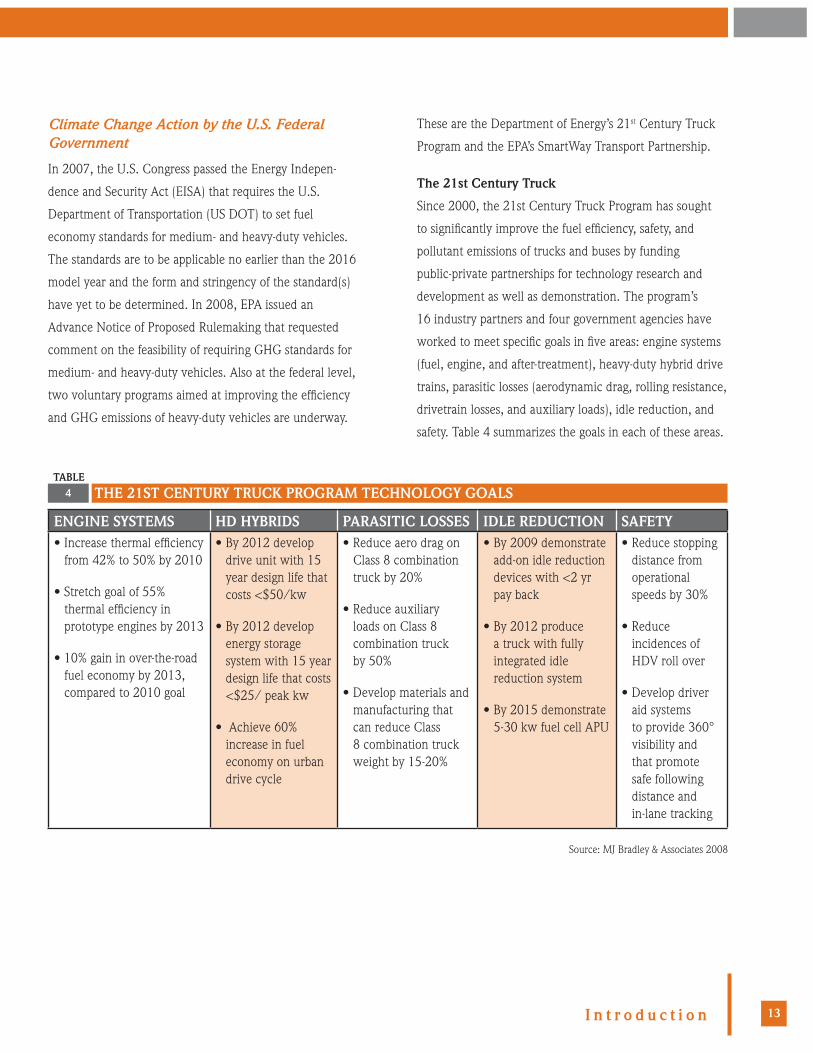
4TABLE
THE 21ST CENTURY TRUCK PROGRAM TECHNOLOGY GOALS
Climate Change Action by the U.S. Federal Government
In 2007, the U.S. Congress passed the Energy Indepen-
dence and Security Act (EISA) that requires the U.S.
Department of Transportation (US DOT) to set fuel
economy standards for medium- and heavy-duty vehicles.
The standards are to be applicable no earlier than the 2016
model year and the form and stringency of the standard(s)
have yet to be determined. In 2008, EPA issued an
Advance Notice of Proposed Rulemaking that requested
comment on the feasibility of requiring GHG standards for
medium- and heavy-duty vehicles. Also at the federal level,
two voluntary programs aimed at improving the efficiency
and GHG emissions of heavy-duty vehicles are underway.
These are the Department of Energy’s 21st Century Truck
Program and the EPA’s SmartWay Transport Partnership.
The 21st Century Truck
Since 2000, the 21st Century Truck Program has sought
to significantly improve the fuel efficiency, safety, and
pollutant emissions of trucks and buses by funding
public-private partnerships for technology research and
development as well as demonstration. The program’s
16 industry partners and four government agencies have
worked to meet specific goals in five areas: engine systems
(fuel, engine, and after-treatment), heavy-duty hybrid drive
trains, parasitic losses (aerodynamic drag, rolling resistance,
drivetrain losses, and auxiliary loads), idle reduction, and
safety. Table 4 summarizes the goals in each of these areas.
ENGINE SYSTEMS HD HYBRIDS PARASITIC LOSSES IDLE REDUCTION SAFETY• Increase thermal efficiency from 42% to 50% by 2010
• Stretch goal of 55% thermal efficiency in prototype engines by 2013
• 10% gain in over-the-road fuel economy by 2013, compared to 2010 goal
• By 2012 develop drive unit with 15 year design life that costs <$50/kw
• By 2012 develop energy storage system with 15 year design life that costs <$25/ peak kw
• Achieve 60% increase in fuel economy on urban drive cycle
• Reduce aero drag on Class 8 combination truck by 20%
• Reduce auxiliary loads on Class 8 combination truck by 50%
• Develop materials and manufacturing that can reduce Class 8 combination truck weight by 15-20%
• By 2009 demonstrate add-on idle reduction devices with <2 yr pay back
• By 2012 produce a truck with fully integrated idle reduction system
• By 2015 demonstrate 5-30 kw fuel cell APU
• Reduce stopping distance from operational speeds by 30%
• Reduce incidences of HDV roll over
• Develop driver aid systems to provide 360° visibility and that promote safe following distance and in-lane tracking
Source: MJ Bradley & Associates 2008

14 I n t r o d u c t i o n
R E D U C I N G Heavy-Duty Long Haul Combination Truck Fuel Consumption and CO2 Emissions
A recent review by the National Academy of Sciences
published in 2008 found that many of the program’s goals
had not been met either because they were not feasible
from an engineering standpoint, or because they were not
adequately funded, or again because planned technologies
were not implemented (NAS 2008). However, the review
highlighted the program’s importance in accelerating the
development of technologies leading to cleaner, safer, and
more efficient vehicles. The review provided a number of
recommendations aimed at a restructuring and refocusing
the program. Finally, it warned that the program’s declin-
ing funding would further impede its ability to meet its
important goals.
The SmartWay Transport Partnership
Initiated by the US EPA in 2004, the SmartWay Transport
Partnership brings together fleets, technology providers,
and retailers to implement fuel savings and GHG reducing
strategies. The program aims to reduce fuel consumption
by 150 million barrels of oil per year and 33 to 66 million
tons of CO2 as well as conventional pollutants. The more
than 1,200 partners account for about an estimated quarter
of all goods moved in the United States (EPA 2008). The
program has focused on identifying and promoting prod-
ucts and practices that reduce conventional and climate
change emissions. The program has certified vehicles and
equipment such as tractors, trailers, idle reduction, and
aerodynamic retrofit kits that meet SmartWay goals. The
certification is not performance based, rather the SmartWay
certified vehicles and equipment have a number of required
features that are expected to enhance their environmental
performance. Figure 4 shows the features in a SmartWay
tractor and trailer.
SmartWay has also developed a draft heavy-duty vehicle
GHG emission and fuel-efficiency test protocol to assist
in the evaluation of technologies and vehicle designs
including hybrid drivetrain technologies. Once finalized,
this protocol will be used to certify SmartWay vehicles and
equipment.
The Energy Independence and Security Act of 2007
Signed into law in December 2007, the Energy Indepen-
dence and Security Act (EISA) of 2007 is primarily known
4FIGURE
SMARTWAY™ EQUIPMENT STANDARDS (EPA 2008)

15I n t r o d u c t i o n
5
FIGURE
POTENTIAL TIMELINE FOR A US DOT MEDIUM- AND HEAVY-DUTY FUEL ECONOMY REGULATION
2008
NAS Study
Regulations firsttake effect in 2016or 2017 model year
First updatepossible in 2019 or
2020 modl year
DOT StudyDOT Regulatory Development
Manufacture Lead Time
2009 2010 2011 2012 2013 2014 2015 2016 2017 2018 2019 2020 2021
for improving the Corporate Average Fuel Economy (CAFE)
standards for light-duty cars and trucks. It also established
a mandatory Renewable Fuel Standard for fuel producers.
The EISA also puts forth a timeline for the US DOT to
develop and implement a fuel economy standard for “work
trucks” (8,500 to 10,000 lbs. GVWR) as well as medium-
and heavy-duty trucks. It is expected that the earliest
model year that might be required to meet fuel economy
limits would be model year 2016 or 2017. Figure 5 depicts
the possible sequence of steps described in the EISA,
beginning with a National Academy of Sciences (NAS)
study of medium and heavy-duty fuel economy. The NAS
study results will inform the development of medium and
heavy-duty vehicle standards required by EISA. The NAS
committee began its activities in late 2008 and is expected
to deliver its final report in March 2010.
Potential EPA Heavy-Duty Vehicle GHG Regulation
In the EPA 2008 Advance Notice of Proposed Rulemak-
ing on regulating GHG emissions, the Agency presents
its assessment of the potential to address climate change
under the Clean Air Act and discusses the regulatory
options the Agency is considering for each major mobile
Source: MJ Bradley & Assoc., 2008
and stationary source type. EPA identified three approaches
to reduce GHG emissions from heavy-duty vehicles. The
Agency asked for comment on the feasibility of reducing
heavy-duty vehicle GHG emissions 40 percent by 2015 and
achieving subsequent, greater reductions beyond 2015.
The first approach is setting an engine CO2 or GHG stan-
dard in a process similar to the current criteria pollutant
emissions standards. The second approach would require
each vehicle model to meet a CO2 or GHG standard
expressed either in grams/mile or grams/ton-mile. The
last approach considers the potential for in-use emission
reduction strategies such as idling reduction to generate
credits.
State Actions to Reduce the Impacts of Climate Change
In the United States, many state and local leaders had
become sufficiently concerned about the issue of climate
change by the end of the 1990s and set out to adopt a
range of measures aimed at reducing GHG emissions
within their jurisdictions. This trend began with a few
leading states in the early 1990s, but accelerated in the
following decade. In 2001 and 2002, approximately

16 I n t r o d u c t i o n
R E D U C I N G Heavy-Duty Long Haul Combination Truck Fuel Consumption and CO2 Emissions
one-third of the states passed new legislation or executive
orders specifically aimed at addressing climate change
[Rabe 2002].9 These policies ranged from comprehensive
state action plans with quantitative GHG reduction targets
to regulations or laws limiting emissions from a specific
sector such as electric power generation or transportation.
In the Northeast, the Regional Greenhouse Gas Initiative
requires power plants to reduce total GHG emissions 10
percent by 2020. In California, Assembly Bill AB 32 “The
Global Warming Solutions Act of 2006” requires reducing
the state’s GHG emissions to 1990 levels by 2020. The
scoping plan adopted by the implementing agency, the
California Air Resources Board (ARB), in December 2008
includes measures targeting emissions from a wide range of
sectors, including heavy-duty vehicles.
The California Global Warming Solutions Act
The California Global Warming Solutions Act of 2006
(AB 32) established a program of regulatory and market
mechanisms to achieve quantifiable and cost-effective
reductions of GHGs. The goal is to achieve 1990 emission
levels by 2020 (an estimated 30 percent reduction) and
an 80 percent reduction below 1990 levels by 2050. The
ARB was required to adopt a plan indicating how emission
reductions will be achieved from significant GHG sources
via regulations, market mechanisms, and other actions.
This plan, named the Climate Change Scoping Plan, was
adopted in December 2008. The scoping plan further
develops the three interrelated components contributing to
emissions in the transportation sector: (1) vehicle technol-
ogy, (2) fuels, and (3) vehicle use. Most of the regulations
in the scoping plan must be adopted by January 1, 2011. In
addition, the ARB has identified some early action measure
to be enforced by January 1, 2010.
The scoping plan includes two regulations targeting
heavy-duty vehicle GHG emissions. The first is an early
action measure, adopted in December 2008, requiring new
and in-use trucks with 53 foot or longer trailers operating
in California to achieve aerodynamic drag and rolling
resistance improvements through SmartWay certified new
equipment and retrofits. New tractors and trailers must
meet the requirements starting with model year 2011,
in-use tractors must comply by 2012, and in-use trailers
by 2014. The second regulation, which is the early phases
of development, would promote hybridization in medium-
and heavy-duty vehicles
Northeast States
In 2001, the Conference of New England Governors
and Eastern Canadian Premiers (NEG/ECP) adopted
the regional “Climate Change Action Plan.” The plan
establishes targets for stabilizing aggregate GHG emissions
in New England, Quebec, New Brunswick, Nova Scotia,
Newfoundland, and Prince Edward Island, at 1990 levels
by 2010, 10 percent below 1990 emissions levels by 2020,
and substantial further reductions (as much as 75 to 80
percent) in subsequent years.
In recent years, other northeastern states have developed
state-specific plans and/or reduction targets, and New
England states have formalized the NEG/ECP targets
by signing them into law or establishing more stringent
targets. These are summarized in Table 5.
9 Additionally, other states adopted measures that were not expressly aimed at climate change but clearly were driven at least in part by the issue of global warming.

17I n t r o d u c t i o n
STATE LEGISLATION OR PLAN
YEAR SIGNED
REDUCTION TARGETS2010 2020 2050
CTAct Concerning CT Global Warming Solutions
200810% below 1990 levels
80% below 1990 levels
ME
Act to Provide Leader-ship in Addressing the Threat of Climate Change
2003 1990 levels 10% below 1990 levels75-80% below 1990 levels
MAGlobal Warming Solu-tions Act
200810-20% below 1990 levels
80% below 1990 levels
NH NEG/ECP Climate Change Action Plan Targets
NJGlobal Warming Response Act
2008 1990 levels 80% below 2006 levels
NYState Energy Plan and Final Impact Statement
20025% below 1990 levels
10% below 1990 levels
PAClimate Change Roadmap
200725% below 2000 emissions by 2025
80% below 2007 emission levels by 2050
RIGlobal Warming Solu-tions Act
Pending 20% below 1990 levels 80% below 1990 levels
VT NEG/ECP Climate Change Action Plan Targets
In response to the expected increase in emissions attributable to the transportation sector, states in the region have adopted the
California motor vehicle GHG standards, are exploring the adoption of a low carbon fuel standard, and are evaluating mechanisms
to reduce vehicle miles traveled (VMT).
5TABLE
SUMMARY OF NORTHEASTERN STATE CLIMATE LEGISLATION/PLANS
Denotes non-legislative action

OVERVIEW OF THE STUDY METHOD

OVERVIEW OF THE STUDY METHOD
19
OVERVIEW OF THE STUDY METHOD
o v e r v i e w o f t h e s t u d y m e t h o do v e r v i e w o f t h e s t u d y m e t h o do v e r v i e w o f t h e s t u d y m e t h o dOverview of the Study Method
R E D U C I N GHeavy-Duty Long Haul Combination
Truck Fuel Consumption and CO2 Emissions
This chapter provides an overview of the method used
to estimate CO2 reductions that could be achieved by
introducing advanced technologies and operational changes
into new Class 8 heavy-duty10, long haul combination
trucks in the U.S. in the 2012-2017 timeframe. The core
of this analysis consists of a series of modeled simulations
to predict the emissions impacts of incorporating various
technology combinations in new trucks. It is important to
note that this study did not quantify the effect of retrofits
to existing trucks and trailers, nor was an attempt made
to predict the impact of technologies that may be invented
and commercialized in the future. Appendix A provides
a more detailed description of the specific methods and
assumptions used in this analysis.
All simulation modeling for this study was performed
by Southwest Research Institute (SwRI) using publicly
available RAPTOR and GT-POWER software. GT-POWER
was used to model the performance, fuel consumption and
CO2 emissions of the engine with a range of alternative
technologies applied. RAPTOR was used to simulate the
performance of the entire vehicle, using the output of the
GT-POWER model as an input. RAPTOR provides detailed
information on the acceleration, braking, and emissions
performance of different truck designs. The modular
structure of the models can accommodate a variety of
vehicle configurations – including trucks, buses, cars, and
motorcycles – and allows for the detailed specification of a
wide range of individual vehicle components. This enables
the user to investigate – at the vehicle level of detail – how
modifying or replacing certain components, either individu-
ally or in combination, affects truck performance across a
number of parameters, over standardized driving cycles; in
terms of climbing performance; steady-state and top speed
performance; maximum acceleration and traction force;
and braking performance.11
The following sections of this chapter describe each basic
step of the analysis method. In brief, these steps consist of:
1. Defining a representative “baseline” long-haul heavy-
duty Class 8 truck and modeling the baseline truck,
using simulation modeling.
2. Validating baseline truck model simulation results
against actual performance of representative 2008
model year vehicles, and adjusting the baseline engine
to meet the 2010 nitrogen oxides (NOx) emission
standard.
3. Developing a list of specific technology and operational
options and assessing the costs and potential CO2-
reducing benefits of each option in isolation using
publicly available data.
4. Performing GT-POWER and RAPTOR model
simulations for the representative engine and truck
technology packages selected for this analysis to assess
fuel consumption and emissions reduction impacts of
the technologies.
5. Assessing the incremental and net costs of different
technologies and technology combinations.
6. Assessing the impacts to the U.S. fleet of heavy-duty
Class 8 long-haul trucks of widespread introduction
of advanced technologies to reduce fuel consumption
and CO2 emissions.
10 Consistent with the classifications used in most existing state and federal regulations, Class 8 heavy-duty vehicles are defined in this study as vehicles with a GVWR more than 33,000 lbs. 11 The range of components that can be individually specified in RAPTOR and GT-POWER includes; vehicle and trailer; engine and engine components; clutches; transmission elements; control elements; shafts (rigid or torsion-elastic); wheel/tire; electrical components; hybrid components; brakes and auxiliaries (such as water pump, air conditioning or power steering). In addition the software allows for modification of assumptions about the driver and about environmental driving conditions (such as shift points and road grade (hills)).

20 O v e r v i e w o f t h e S t u d y M e t h o d
R E D U C I N G Heavy-Duty Long Haul Combination Truck Fuel Consumption and CO2 Emissions
Selecting and Defining a Baseline Class 8 TruckBecause the focus of this study is long-haul, Class 8 tractor
trailers, trucks in this category were first evaluated for
major utility distinctions. The existing heavy-duty truck
fleet exhibits a wide range of fuel efficiency and design
features from one vehicle to another. Some of the differ-
ences in truck fuel efficiency are driven by necessity. For
example, some trailer configurations such as bulk haulers
or flatbeds are less amenable to aerodynamic improvement
than the standard box van trailers. Operators who go
off-road or who pull unusually heavy loads generally need
to use overdrive transmissions that are slightly less efficient
in top gear than direct drive transmissions. They do this
to get an adequate gear ratio spread for their applications.
Operators who run 80,000 pounds or less on highway
often use overdrive transmissions as well, because an
overdrive transmission will provide better overall gearing
for their application. Operators who go off-road or operate
frequently in low friction conditions also may need to use
tires with higher traction and thus higher rolling resistance.
Some operators may find aerodynamic upgrades to be
cost-effective, while other operators may run into opera-
tional issues or may lack the money to pay for upgrades
even if the payback interval is relatively short. Widespread
introduction of wide-base single tires, which can provide a
significant rolling resistance reduction, has been delayed by,
among other issues, perceived downtime concerns.
A portion of the variation in fuel economy of existing
heavy-duty vehicles fuel economy is driven not by variation
in vehicle applications or by practical necessity, but by
buyer preference. Square nose conventional tractors with
external air cleaners and dual vertical exhausts mounted
on the side of the cab are the traditional image of trucking.
These trucks typically have very high aerodynamic drag.
Many truckers, especially owner-operators and small fleets,
persist in buying traditional style trucks, even though
they use significantly more fuel than more aerodynamic
tractor designs. They do this because driver satisfaction and
retention is a big issue for truck fleets, especially smaller
fleets. The recent spike in fuel prices has reduced sales of
traditional style trucks, but they have not disappeared from
the market.
The study team selected an older model of aerodynamic
truck - the Kenworth T-600 – to be the baseline for this
study. This was done in part for purposes of practical
necessity and in part because this truck is representative of
many trucks on the road today. The reasons for selecting
this vehicle include:
• Measured drag and rolling resistance coefficients for the
T-600 are available from a previous SwRI project.
• The T-600 is more aerodynamic than a traditional
truck, but not competitive with the latest aerodynamic
trucks. This truck can be expected to roughly match
the overall trucking fleet average for aerodynamic and
rolling resistance performance.
• The baseline T-600 tractor / trailer combination used
tires with a rolling resistance typical of current product
offerings. Dual wheels were used on every axle except
the steering axle, as is typical on current trucks.
After the baseline vehicle was chosen, a baseline power-
train was selected. The requirements were to select an
engine that could be modeled with reasonable accuracy at
the future 2010 emissions standards, and a transmission
that is typical for long-haul service. SwRI had available to
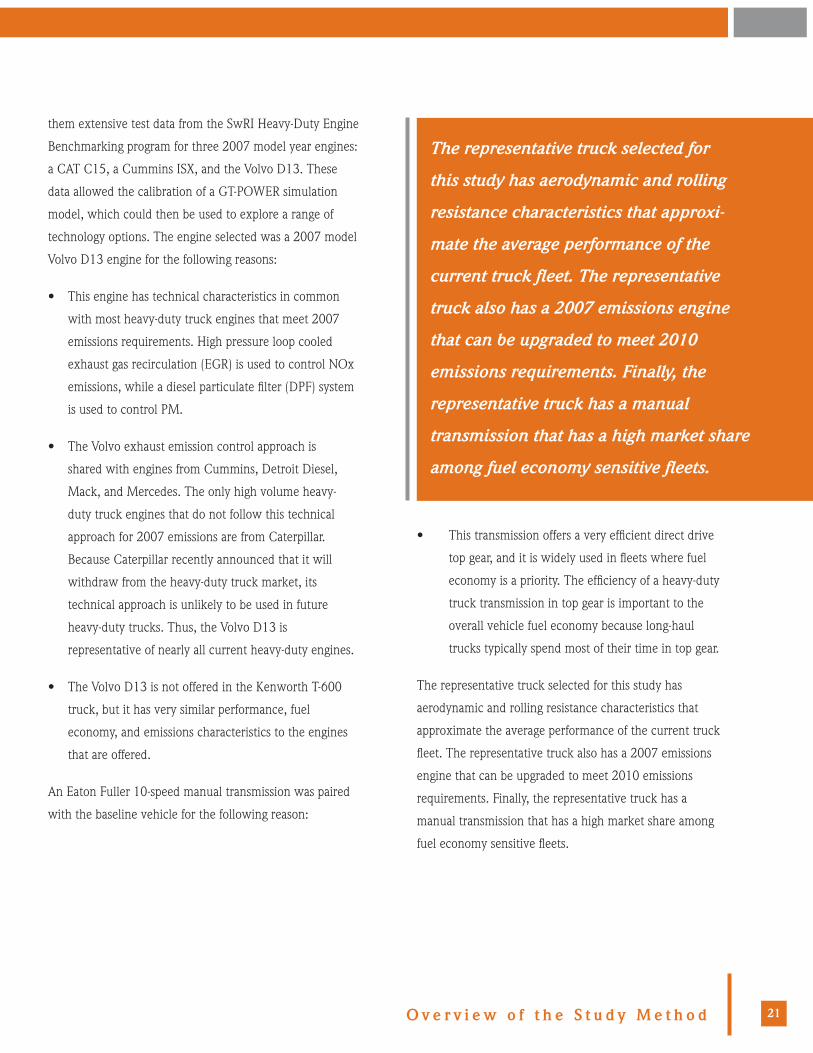
21O v e r v i e w o f t h e S t u d y M e t h o d
them extensive test data from the SwRI Heavy-Duty Engine
Benchmarking program for three 2007 model year engines:
a CAT C15, a Cummins ISX, and the Volvo D13. These
data allowed the calibration of a GT-POWER simulation
model, which could then be used to explore a range of
technology options. The engine selected was a 2007 model
Volvo D13 engine for the following reasons:
• This engine has technical characteristics in common
with most heavy-duty truck engines that meet 2007
emissions requirements. High pressure loop cooled
exhaust gas recirculation (EGR) is used to control NOx
emissions, while a diesel particulate filter (DPF) system
is used to control PM.
• The Volvo exhaust emission control approach is
shared with engines from Cummins, Detroit Diesel,
Mack, and Mercedes. The only high volume heavy-
duty truck engines that do not follow this technical
approach for 2007 emissions are from Caterpillar.
Because Caterpillar recently announced that it will
withdraw from the heavy-duty truck market, its
technical approach is unlikely to be used in future
heavy-duty trucks. Thus, the Volvo D13 is
representative of nearly all current heavy-duty engines.
• The Volvo D13 is not offered in the Kenworth T-600
truck, but it has very similar performance, fuel
economy, and emissions characteristics to the engines
that are offered.
An Eaton Fuller 10-speed manual transmission was paired
with the baseline vehicle for the following reason:
• This transmission offers a very efficient direct drive
top gear, and it is widely used in fleets where fuel
economy is a priority. The efficiency of a heavy-duty
truck transmission in top gear is important to the
overall vehicle fuel economy because long-haul
trucks typically spend most of their time in top gear.
The representative truck selected for this study has
aerodynamic and rolling resistance characteristics that
approximate the average performance of the current truck
fleet. The representative truck also has a 2007 emissions
engine that can be upgraded to meet 2010 emissions
requirements. Finally, the representative truck has a
manual transmission that has a high market share among
fuel economy sensitive fleets.
The representative truck selected for
this study has aerodynamic and rolling
resistance characteristics that approxi-
mate the average performance of the
current truck fleet. The representative
truck also has a 2007 emissions engine
that can be upgraded to meet 2010
emissions requirements. Finally, the
representative truck has a manual
transmission that has a high market share
among fuel economy sensitive fleets.

22 O v e r v i e w o f t h e S t u d y M e t h o d
R E D U C I N G Heavy-Duty Long Haul Combination Truck Fuel Consumption and CO2 Emissions
Validating Simulation Modeling Results for the Representative Class 8 Long-Haul Truck As described in the foregoing section, the specifications
used to describe a representative or “average” truck for
simulation purposes were based on actual 2007 vehicle
characteristics. To validate model simulations of the
vehicle, it was necessary to compare real world data and
other data for the drivetrain and vehicle with the simula-
tion modeling results for the baseline vehicle and the
baseline engine adjusted to 2010 emissions performance.
Engine Model
Once the baseline truck and powertrain was determined,
simulation models were created to allow the evaluation
of various alternative technologies. The engine simulation
was done using GT-POWER, which is a commercial code
widely used for engine cycle simulation. Volvo supplied the
GT-POWER model used in this project, and SwRI calibrated
the model using 2007 D13 data measured at SwRI in the
Heavy-Duty Engine Benchmarking Program. Combustion
(heat release) data from 12 engine operating conditions
were evaluated and used to tune the GT-POWER model to
provide an accurate estimate of actual engine performance
and fuel consumption. Figure A-1 in Appendix A shows the
GT-POWER model of the Volvo D13 engine in its baseline
configuration.
GT-POWER provides an option for automatic control of
certain parameters. The automatic control is set up to use
a selected input, such as fuel quantity, to control a selected
output quantity, such as engine torque. The initial model
created for the baseline engine included a torque control to
match the torque curve of the production engine, and an
EGR control to match the EGR flow rate measured on the
production engine. It is required that the model match the
power and torque of the actual engine. Matching EGR rate
is also important, because it means that the NOx character-
istics of the simulated engine will match those of the actual
engine. The variable geometry (VG) turbocharger also had
a controller set to maintain the boost level and control air/
fuel ratio.
In order to determine if the simulation model provides a
good match to the actual engine, several parameters were
evaluated. Brake specific fuel consumption (BSFC), exhaust
temperature, and air/fuel ratio were selected for model
validation in this study. The goal was for the simulation
model to be within 4 percent of the actual engine BSFC,
within 30º C of the actual exhaust temperature, and within
1 ratio of the actual air/fuel ratio. Figure 6 shows the
match between the model and experimental engine data
for BSFC.
The goal was for the simulation model to
be within 4 percent of the actual engine
BSFC, within 30º C of the actual exhaust
temperature, and within 1 ratio of the
actual air/fuel ratio.

23O v e r v i e w o f t h e S t u d y M e t h o d
6FIGURE
BSFC COMPARISON OF SIMULATION MODEL AND ENGINE TEST DATA
BSFC ERROR
RPM
% L
oa
d
100 % Error -6.00 -4.00 -3.00 -2.00 -1.00 0.00 1.00 2.00 3.00 4.00 6.00
800 1000 1200 1400 1600 1800 2000 2200
Max: 5.50>Range<RangeMin: -5.90
90
80
70
60
50
40
30
20
The tan and light gray areas of Figure 6 show areas where
the model comes within 2 percent of the test data. These
colors dominate most of the area between 1,000 and
1,900 revolutions per minute (RPM), which is where the
engine operates for the majority of the time. There is an
area around 1,500 RPM from 40 percent to 90 percent
load where the model over-predicts the BSFC by more
than 2 percent, but less than 3 percent. At 1,200 RPM, the
model under-predicts BSFC by more than 3 percent from
40 percent to 80 percent load. Figure 6 shows that BSFC
predicted by the simulation model is within 4 percent
of the actual engine data except at very low speed, high
load (below 1000 RPM) and at 2000 RPM, high load. In
actual operation, the engine will spend little or no time
operating at these points, so the match between the engine
and model was judged successful. Because the truck
cruise operation is in the 1,300 to 1,500 RPM range, it is
likely that the engine model will slightly over-predict fuel
consumption.
The exhaust temperature predicted by the simulation was
found to be always within 30º C of the actual engine test
data, so the match between the engine and test data was
considered successful. Typical air/fuel ratios at high load
are as low as 19 or 20. It is important to maintain air/fuel
ratios at or above the minimum values used on the actual
24 O v e r v i e w o f t h e S t u d y M e t h o d
R E D U C I N G Heavy-Duty Long Haul Combination Truck Fuel Consumption and CO2 Emissions
engine, to control PM emissions. This is normally only an
issue at lower speeds and high load. At light load, values as
high as 60 can be found. For most of the operating range
of the engine, less than half a ratio error in the prediction
of air/fuel ratio was found between the modeled and real
world data. For a small area of the operating range, a ½ to
1 ratio underestimate of air/fuel ratio was found. Only at
800 RPM and 20 percent engine load is the error greater
than 2 ratios. These results meet the 1 ratio target for
simulation accuracy in the heart of the operating map.
Given the results discussed in this section, the engine
simulation model was determined to be accurate enough to
use for the baseline 2007 engine.
Adjusting the Baseline Engine to 2010 NOx Emissions Requirements
Once the 2007 model year engine data had been validated,
SwRI adjusted the GT-POWER model so that the baseline
engine would meet 2010 NOx emissions limits. The model
year 2007 emission limit for NOx is 1.2 grams per brake
horsepower-hour (g/bhp-hr). In 2010, the limit will be
lowered to 0.2 g/bhp-hr. Because heavy-duty powertrain
and vehicle technologies to reduce vehicle fuel consump-
tion and CO2 emissions in this study were evaluated for the
years 2008 and 2017, it was imperative that the baseline
engine meet 2010 NOx emission standards in the model-
ing exercise. The Volvo D13 baseline engine uses EGR to
control NOx, and a DPF to control particulate. For 2010,
the engine will also use a selective catalytic reduction
system (SCR) in addition to EGR to control NOx. The
development of the 2010 engine is not complete, so actual
test results for the 2010 engine are not available yet.
Because it is not known exactly how much of the NOx
will be controlled by the EGR versus the SCR system, SwRI
estimated the NOx conversion efficiency of the two
components for the 2010 engine. If it is assumed that the
EGR system removes most of the NOx emissions, this
would result in a fuel consumption penalty compared to
a 2007 engine. Conversely, a very high NOx conversion
efficiency in the SCR system would allow high engine-out
NOx, which would reduce fuel consumption. For the
purposes of this study, SwRI made the assumption of a
conversion efficiency in the 85 percent range for the SCR
system, which would allow the engine to maintain 2007
levels of engine-out NOx. This assumption means that the
2010 engine is projected to have identical fuel consump-
tion and engine-out NOx to the baseline 2007 version.
It is likely that 2010 engines will have a different engine-
out NOx level than was assumed by SwRI for this study.
The error caused by the SwRI estimate that 2007 engine-
out levels will carry into 2010 unchanged is likely to result
in an error in fuel consumption and CO2 emissions of less
than ±3 percent. Recent comments by engine manufactur-
ers to the National Academy of Sciences committee entitled
Assessment of Fuel Economy Technologies for Medium and
Heavy Duty Vehicles indicate that 2010 engines are likely
to have slightly lower fuel consumption than 2007 engines.
SwRI did not estimate the additional CO2 emissions that
will result from the use of urea in the SCR system.
Vehicle Model
A commercial code developed by SwRI called RAPTOR was
used to model the vehicle, including the transmission and
driveline. This program has capabilities similar to GT-Drive
and other commercially available vehicle simulation codes.
Once the vehicle model was created, it was validated by
comparing the predicted fuel economy on three drive
cycles to actual on-road vehicle fuel economy measured

25O v e r v i e w o f t h e S t u d y M e t h o d
using the T-600 truck (but with a different 2004 emissions
engine). For this validation test, drive cycles were created
to match actual driving cycles of the test truck for which
data are available. The “Hwy_65_Drive_Sch” uses a
65 miles per hour (MPH) cruise speed, but the truck
frequently slows to 30 MPH and then accelerates back to
65 MPH. This cycle is intended to simulate traffic conges-
tion. The “Line_Haul_Drive_Sch” is not the schedule
used in this project, but it has similar characteristics. One
significant difference is lower cruising speeds in the drive
cycle used for the comparison. The “constant_65_sch” is a
steady state cruise schedule. In all cases shown in Table 6,
the vehicle GVW was 80,000 pounds.
Note that the engine used in the vehicle testing is not the
same as that used in our modeling. The vehicle has an
engine that meets 2004 emissions requirements. However,
the performance and fuel economy characteristics of the
two engines are very similar. For the model runs, actual
measured engine data for the 2007 Volvo D13 engine were
provided as inputs. The results of the vehicle tests and
model simulations match very well, especially considering
the fact that the engines are not the same. Differences
range from less than 1 percent to a maximum of 2.2
percent on the simulated line haul schedule. Because the
vehicle model was created using data from the test truck,
this close match is not unexpected. Table 6 provides a
comparison of test truck and model results.
Next, a comparison was made between the predicted fuel
economy using two different sets of input data for the
vehicle model:
• Measured Volvo D13 engine data from the Heavy-Duty
Diesel Benchmarking program
• Predicted Volvo D13 engine data from the
GT-POWER model
Using the baseline engine and vehicle configurations at a
GVW of 65,000 pounds, a comparison was made between
measured engine and model results. With the measured
engine data, the predicted fuel economy on the line haul
cycle was 5.82 miles per gallon (MPG), while it was 5.66
MPG using the GT-POWER simulated engine. The GT-
POWER model gave results 2.8 percent lower than the
actual engine data when both were compared using the
same vehicle model. This is within our target of predicting
the actual engine performance within 3 percent over a
driving cycle.
To provide confidence in the engine and vehicle simula-
tions, two levels of comparison were completed success-
fully. First, the RAPTOR vehicle model was validated
by comparison to actual truck test results. Second, the
GT-POWER engine model was validated by comparison
to actual engine test results. In both cases, the program
targets for model validation were achieved.
6TABLE
COMPARISON OF VEHICLE AND MODEL RESULTS
DRIVING CYCLE MODEL MPG VEHICLE MPG DIFFERENCE (%)Hwy_65_Drive_Sch 4.78 4.83 1.0%
Line_Haul_Drive_Sch 5.69 5.57 2.2%
constant_65_sch 5.54 5.57 0.5%

26 O v e r v i e w o f t h e S t u d y M e t h o d
R E D U C I N G Heavy-Duty Long Haul Combination Truck Fuel Consumption and CO2 Emissions
Selecting a Drive CycleAs mentioned previously, the target market segment of this
study is line haul heavy-duty trucking, which accounts for
about 70 percent of the fuel burned by heavy-duty vehicles.
Line haul trucking typically involves extended time at high
speeds. In addition, some time is spent in congested traffic,
which introduces more variation in vehicle speed. Some
time is spent getting from the loading dock to the highway
and back in urban or suburban type driving. This portion
of the driving cycle may have frequent stops and speed
variation.
The test cycle used in this study was based on the Califor-
nia Heavy-Duty Diesel Truck Drive Cycle. The California
cycle was created from analysis of a statistical study of line
haul truck operations in California. The following changes
were made to the California cycle for this study, based on
input from industry experts:
• The portion of high speed driving was increased to
reflect longer average travel distances
• The speeds used in the California cycle were increased
by 8 percent to reflect current typical truck operating
speeds on long-haul routes
• Two segments with grade were added. One segment
includes positive and negative 1 percent grades, and
a second segment has positive and negative 3 percent
grades
Figure 7 shows the drive cycle used in the study. The total
duration of the cycle is 6,830 seconds (one hour and 54
minutes), and the total distance traveled is 103.3 miles.
The average speed over the cycle, including the urban/
suburban portions, is 54.4 miles per hour. The first high
speed segment reaches a cruising speed of 70 MPH, while
the remaining high speed cruise segments are at speeds
ranging from 65 to 67 MPH. The first steady speed cruise
segment is with no grade. The second steady speed cruise
segment has an alternating ±1 percent grade. The third
steady speed cruise segment has an alternating ±3 percent
grade for a portion of the segment. On portions with a
positive 3 percent grade, the vehicle will not be able to
maintain the desired cruise speed. The minimum speed
achieved by the vehicle on the 3 percent grade will provide
a measure of the performance penalty or gain from any
given technology package. The final two steady speed
segments are run with no grade.
Figure 8 on page 27 shows the grades and elevations on
the drive cycle used for this study. The x-axis on this figure
shows distance in miles, rather than time in seconds. In
Figure 7, the 1 percent grade segment runs from 1,740 to
2,700 seconds, and the 3 percent grade section runs from
2,870 to 3,700 seconds. Note that this is a simulation of
rolling hills, not of mountains.
It is important to note that the drive cycle chosen for
this study is specific to long-haul trucks. Thus, the results
described in Chapter 3 are specific to long-haul trucks and
cannot necessarily be extrapolated to other heavy-duty
trucks operating on different drive cycles.

27O v e r v i e w o f t h e S t u d y M e t h o d
7
8
FIGURE
FIGURE
HEAVY TRUCK LINE-HAUL DRIVE CYCLE
GRADES ON HEAVY TRUCK LINE-HAUL DRIVE CYCLE
0
10
20
30
40
50
60
70
80
0 1000 2000 3000 4000 5000 6000 7000
Time (sec)
Ve
hic
le S
pe
ed
(m
ph
)
-4
-3
-2
-1
0
1
2
3
4
0 20 40 60 80 100 120
Distance (miles)
Gra
de
(%
)

28 O v e r v i e w o f t h e S t u d y M e t h o d
R E D U C I N G Heavy-Duty Long Haul Combination Truck Fuel Consumption and CO2 Emissions
Identifying Discrete Vehicle Technology Options for EvaluationA total of 32 technologies were identified and considered
for inclusion in this project. Table 7 lists the individual
vehicle technologies considered in this study for purposes
of evaluating future Class 8 heavy-duty truck fuel consump-
tion and CO2 emissions reduction potential. A complete
description of each of the technologies – including an
explanation of how each option might reduce CO2
emissions – is provided in Appendix A.
Downselection of Technologies Included in this Analysis
As a first step toward identifying technology options for
inclusion in this study, the potential CO2 emissions impact
of each of the options listed in Table 7 were evaluated.
The purpose of the evaluation was to identify promising
technologies and then to identify a select group of
technologies to be included in a set of “maximum
reduction” technology combination simulations conducted
later in the analysis. Technology analysis varied, including
both literature-based and model-based methods.
An overview of each technology and the approach used to
incorporate it into the analysis follows:
Improved SCR Conversion Efficiency
Exhaust after-treatment systems capable of converting a
high percentage of NOx into N2 and O2 may yield higher
powertrain efficiency in the future. This improvement
would be made possible by permitting different balances
between engine efficiency and after-treatment efficiency, if
the durability of such systems is proven by the considerable
work now going on within the industry.
Depending on how much conversion efficiency can be
achieved from an advanced SCR system, an improvement
of up to 3 percent could be achieved in fuel consumption
and CO2 emissions. Since it is not clear what increase in
SCR system performance will prove possible over the next
few years, and there are no published data that provide
7TABLE
VEHICLE TECHNOLOGIES EVALUATED FOR POSSIBLE INCLUSION IN THIS STUDY
ENGINE POWERTRAIN AERODYNAMICSImproved SCR Efficiency Automated Manual Transmission Fully aerodynamic mirrors
Engine Friction Reduction Moderate Hybrid Systems Cab side extenders
Mechanical Turbocompound Aggressive Hybrid Systems Integrated sleeper cab roof fairings
Electric Turbocompound Aerodynamic front bumper
Dual Stage Turbocharging OTHER TECHNOLOGIES Full fuel tank fairings
EGR Pump Mass Reduction Trailer side skirt fairings
Variable Valve Actuation (VVA) Component Friction Improvements Trailer gap fairing
Advanced VVA Reduced Rolling Resistance Rear-mounted trailer fairing
Alternative Combustion Modes Auxiliary Power Unit Undercarriage Flow Device
Insulated Exhaust Ports Advanced tractor-trailer gap seal
Bottoming Cycle OPERATIONAL CHANGES Advanced rear-mounted trailer fairing
Accessory electrification Lower Road Speed
Increased Vehicle Size and Weight
29O v e r v i e w o f t h e S t u d y M e t h o d
good guidance on this topic, SwRI did not make projections
based on improved SCR performance. Therefore, the model
of the 2010 engine matches the efficiency and CO2
emissions of the 2007 engine exactly.
Engine Friction Reduction
Development of engine main and rod bearings is under
way to allow the use of lower viscosity engine oils. The
lower viscosity oil will in turn reduce engine friction in the
bearings and between the piston, rings, and liner. About a
10 percent reduction in engine friction is expected if the
current standard 15W40 engine lube oil can be replaced by
a 5W30 grade. A more expensive synthetic oil is expected
to be required in order to allow the use of a lower viscosity.
For this study, we made the assumption that a 10 percent
reduction in friction could be achieved, which results in a 1
percent improvement in fuel efficiency and CO2 emissions.
This effect was judged to be small enough to leave out of
the rest of the study.
Improved Air Handling Efficiency
Almost all turbocharged heavy-duty diesel engines sold
in North America today use high pressure loop EGR for
control of engine-out NOx levels. To get EGR to flow from
the exhaust manifold to the intake manifold, the pressure
in the exhaust manifold must be higher than the pressure
in the intake manifold, whereas the opposite condition
is the result of a higher efficiency engine/turbocharger
system. To achieve the “negative delta-p” required to cause
EGR flow, turbocharger efficiency is intentionally sacri-
ficed. Some potential ways of avoiding this and achieving
improved air handling efficiency are to use high efficiency
turbocharging in combination with: mechanical or electric
turbocompounding, an EGR pump, dual stage turbo-
charging with an EGR pump, or variable valve actuation.
This technology was evaluated as part of the two
turbocompound packages.
Mechanical Turbocompound
A power turbine is added to the exhaust system after the
normal turbocharger. The backpressure created by the
power turbine allows the use of a very efficient conven-
tional turbo, while still providing the negative delta-p
required to support EGR flow and harvesting useful work
from the exhaust stream. The power turbine is geared to
put power back into the crankshaft through a fluid coupling
that allows control of turbine speed and isolates the power
turbine from engine crankshaft torsional vibration.
Electric Turbocompound
This is the same concept as the mechanical turbocom-
pound, except the power is fed into an electrical machine.
Electric turbocompound is ideal as a power source for a
hybrid system, and will in fact require a hybrid system or
some type of electric propulsion system to utilize the power
generated by the turbine. Independent control of engine
speed and turbine speed makes electric turbocompounding
slightly more efficient than mechanical turbocompounding.
Dual Stage Turbocharging with Intercooling
Achieving the high pressures required by modern engines
can be done more efficiently with two turbos, where each
achieves half of the required pressure ratio, and intercooling
is used between the two turbos and before the intake
manifold. This approach requires an EGR pump, turbo-
compound system, or other device to facilitate EGR flow.
Packaging two turbocharger stages with a turbocompound
power turbine was judged to be very difficult from a cost
and mechanical feasibility standpoint, so this approach was
not evaluated. This technology has a potential benefit of 1
to 2 percent.

30 O v e r v i e w o f t h e S t u d y M e t h o d
R E D U C I N G Heavy-Duty Long Haul Combination Truck Fuel Consumption and CO2 Emissions
EGR Pump
An EGR pump can facilitate EGR flow and help control
the flow rate to achieve the desired level of EGR. This
device makes EGR flow independent of the engine’s
delta-p, which allows the use of high efficiency air handling
systems. Energy used by an EGR pump partially cancels the
efficiency gain from the high efficiency turbocharger we
pair it with. Based on simple spreadsheet calculations, the
EGR pump proved less attractive than turbocompound as a
way of providing the negative delta-p required to drive EGR
flow. This technology was not included in the analysis.
Variable Valve Actuation
In gasoline engines, variable valve actuation (VVA) can
have a huge impact on engine performance and fuel
economy. VVA can be used to improve engine breathing
over wide engine speed ranges, thus increasing power
and/or reducing the pumping losses caused by throttling
the intake. In heavy-duty diesel engines, the potential
benefits of VVA are much more limited, in part due to their
narrower range of operating speeds as compared to gasoline
engines. VVA allows flexibility to operate a turbocharger
at a more efficient point on the compressor map, but with
consideration to maintain adequate SCR temperature at
low loads to prevent an increase in NOx emissions. VVA
can also be used to improve the power output of a turbo-
compound system by leaving more energy (temperature/
pressure) in the exhaust stream. Variable valve actuation
was extensively modeled in GT-POWER, both as a stand-
alone feature and in combination with turbocompounding
and the bottoming cycle. SwRI results show that the ability
of VVA to improve diesel engine efficiency as a stand-alone
feature is rather limited, which agrees with past results
from several engine makers.
Advanced VVA:
There are examples in the literature where dramatic
improvements are claimed from modified engine operating
cycles that VVA can enable, such as the Sturman “Digital
Engine” combustion cycle. This cycle is claimed to be
revolutionary in its ability to inject air during a combustion
event in ways that are impossible in conventional engine
arrangements. According to Sturman, this ability opens
up significant possibilities for efficiency improvement and
in-cylinder emissions control. Unfortunately, the available
literature does not provide enough details to allow SwRI to
attempt to duplicate the claimed results for this study.
Alternative Combustion Modes: LTC / HCCI / PCCI
Low temperature combustion (LTC), homogeneous charge
compression ignition (HCCI), and premixed charge com-
pression ignition (PCCI) are all “alternative” combustion
modes that can be used in place of standard diesel combus-
tion. All of these modes have been developed in an effort
to reduce NOx output, and in the case of HCCI, Particulate
matter (PM) output as well. If NOx is not an issue, these
Electric turbocompound is ideal as a
power source for a hybrid system, and
will in fact require a hybrid system or
some type of electric propulsion system
to utilize the power generated by the
turbine. Independent control of
engine speed and turbine speed
makes electric turbocompounding
slightly more efficient than
mechanical turbocompounding.

31O v e r v i e w o f t h e S t u d y M e t h o d
alternative combustion modes generally suffer from lower
thermal efficiency than conventional diesel combustion.
However, conventional diesel combustion suffers substan-
tial thermal efficiency degradation at low engine-out NOx
levels, so these alternative modes can become attractive.
The performance of these alternative combustion modes
is duty cycle dependent: most of the potential is at low
load. Typically, alternative combustion modes can be used
up to 30 percent or 40 percent load. Therefore, alterna-
tive combustion modes will have little impact on the fuel
economy or CO2 emissions of an engine that operates most
of the time at higher loads, such as in a long-haul truck
application. These modes do not offer a fuel consumption
or CO2 benefit over standard diesel combustion combined
with SCR, so the decision was made not to pursue alterna-
tive combustion modes for this project.
Engine Thermal Management Improvements
The goal of thermal management features is to retain
energy in the gas flow through the engine rather than allow
heat to be lost along the way. Examples include insulated
exhaust ports and a bottoming cycle, discussed below.
Insulated Exhaust Ports
Increased exhaust temperature was calculated for an
engine outfitted with ports insulated using ceramic coatings
or inserts with air gaps. The retained energy can then be
used in an energy recovery device, such as a turbocom-
pound system or a bottoming cycle. The energy potential of
insulated ports and is better at high load, but there can also
be a benefit from higher temperature into an SCR system
for improved NOx conversion efficiency. In practice, the
potential from features such as insulated exhaust ports
is small.
Bottoming Cycle
A bottoming cycle is a heat engine that uses waste heat
from the primary engine, in this case the heavy-duty diesel,
to produce additional work. There are many concepts avail-
able for use in a bottoming cycle, including steam turbines.
Heat sources for a bottoming cycle include exhaust gas
flow, EGR flow, charge air flow, and engine coolant. The
great advantage of a bottoming cycle is that it uses “free”
energy – energy that is otherwise thrown away by the
primary engine. The great disadvantage of a bottoming
cycle is that its efficiency is limited by the amount (flow
rate) and quality (temperature) of waste heat sources,
further disadvantaged by variability in heat sources linked
to varied driving conditions. Bottoming cycles have been
used for many years in stationary power plants, yet so far,
they have not found application in vehicles because of cost,
weight, packaging, reliability, and performance challenges.
The great advantage of a bottoming cycle
is that it uses “free” energy – energy that
is otherwise thrown away by the
primary engine. The great disadvantage
of a bottoming cycle is that its efficiency
is limited by the amount (flow rate)
and quality (temperature) of waste
heat sources, further disadvantaged by
variability in heat sources linked to varied
driving conditions.

32 O v e r v i e w o f t h e S t u d y M e t h o d
R E D U C I N G Heavy-Duty Long Haul Combination Truck Fuel Consumption and CO2 Emissions
After studying the available literature, SwRI decided to
model a steam turbine bottoming cycle using water as the
working fluid. Water has well understood properties and a
boiling temperature favorable for bottoming cycle applica-
tions. Disadvantages include risk of freezing, difficulty
in packaging, surviving on-road vibration, and more, all
requiring careful engineering design consideration to
develop a successful system. A sophisticated spreadsheet
simulation of the bottoming cycle was created in order
to evaluate alternative designs, taking into account many
parameters and assumptions, and calculating temperatures,
pressures and flow rates through the system.
In the evaluation performed by SwRI, by far the best
performance was obtained by heating the bottoming cycle
fluid first with the exhaust gas stream, and then adding
additional heat from the EGR stream. This approach
provided much better results than using either of the two
sources alone. Only about 25 to 30 percent of the exhaust
flow is devoted to EGR, but it is taken from the exhaust
manifold before the turbocharger, therefore offering the
highest quality (temperature) of the available waste-heat
streams.
The amount of energy available from a bottoming cycle
is strongly dependent on engine speed and load. At high
speed and load, the highest temperatures and exhaust flow
rates are achieved, which allows a high bottoming cycle
power. At average loads such as 1400 RPM and 40 percent
load, the modeled bottoming cycle still contributes 7.5
percent of total engine crankshaft power, which translates
into a 7.5 percent reduction in fuel consumption and CO2
emissions.
Transmission System Technologies
Automated Manual Transmission
Most heavy-duty trucks use manual transmissions with 8
to 18 ratios available. The most common transmissions for
line haul applications have 10 ratios with an overdrive top
gear. Torque-converter automatic transmissions, similar
to those used in passenger cars, are used in some stop/go
truck applications but are more expensive do not have an
efficiency advantage in line-haul applications. Automated
manual transmissions have been available on the market
for over 10 years now and are increasing in market share.
Automated manuals have a computer to decide when
to shift and use pneumatic or hydraulic mechanisms to
actuate the clutch and hidden shift levers. An automated
manual can shift as quickly as the best driver, and the
shift schedule can be tailored to match the characteristics
of the engine and vehicle. This reduces variability of fuel
consumption and CO2 emissions between drivers, with all
drivers achieving results closer to those of the best drivers.
An Eaton 10 speed manual transmission was selected as
the baseline transmission for the project and was simulated
with a model driver using good shifting practices. The shift-
ing practices chosen for the automated manual transmis-
sion were identical, meaning that the automated manual
showed no CO2/fuel economy benefit. Therefore, the
automated manual transmission was not included in this
analysis. In the real-world, there would be a fuel economy
improvement proportional to the number of non-fuel-
conscious drivers in a fleet.
Moderate Hybrid Systems
These systems are similar in concept to the mild hybrids
used in light-duty applications using an integrated starter/
generator, often mounted between the engine flywheel and

33O v e r v i e w o f t h e S t u d y M e t h o d
the transmission. Engine start/stop capability is included,
along with limited duration auxiliary power unit (APU)
capability using battery power, electrified accessories,
launch assist, and regenerative braking to recharge the
battery. The battery size is modest to control cost and
weight. A moderate hybrid system was not modeled for
this project. The Steering Committee agreed that a more
powerful “aggressive hybrid” offered much more potential
fuel savings for heavy-duty trucks.
Aggressive Hybrid Systems
These systems are similar in concept to the full hybrids
used in light-duty applications. Both a parallel-hybrid and a
series-hybrid approach were considered in this study.
The first approach has a 50kW motor/generator on the
transmission with a battery, all-electric engine and vehicle
accessories, and APU-capability using the battery. The
second hybrid approach modeled for this study was a series
hybrid in combination with a 2-speed transmission. At
very low speeds, a 10kWh battery pack drives the wheels
through a 200kW electric motor without starting the
engine. At medium speeds, the engine drives a generator
that drives the wheels using a 200 kW electric motor. The
special 2-speed transmission is used to directly connect
engine to the drive wheels only at highway speeds.
The parallel hybrid was chosen for use in this study. The
series hybrid model displayed large energy conversion
losses making this system unattractive. The series hybrid
approach allows the engine to operate at more efficient
speed/load points, but this is not enough to overcome the
energy conversion losses in the electric machines. As a
result, the series hybrid was not able to provide an
advantage over the fuel efficiency of the baseline manual
transmission and was not considered in this study. There
may be ways of operating the series hybrid that would
provide better results, but we were not able to get enough
detail from any company developing a series hybrid system
to accurately model their approach.
Vehicle Technologies
Accessory Electrification
The use of a hybrid system or electric turbocompound
provides a large source of electrical energy that can be
used to drive accessories that are engine-driven on today’s
vehicles. Given the availability of significant electric power,
the following accessories can be converted to electric drive:
electric power steering (EPS), electric water pump (EWP)
electric a/c compressor, and an electric air compressor.
If over 30 kW of electric power is available, the engine
Given the availability of significant electric
power, the following accessories can be
converted to electric drive: electric power
steering (EPS), electric water pump (EWP)
electric a/c compressor, and an electric
air compressor. If over 30 kW of electric
power is available, the engine cooling fan
can also be converted to electric drive,
though in line haul applications the
efficiency savings from an electric
cooling fan is normally not required at
higher vehicle speeds.

34 O v e r v i e w o f t h e S t u d y M e t h o d
R E D U C I N G Heavy-Duty Long Haul Combination Truck Fuel Consumption and CO2 Emissions
cooling fan can also be converted to electric drive, though
in line haul applications the efficiency savings from an
electric cooling fan is normally not required at higher
vehicle speeds. Fan-on time tends to be very low except
during low speed vehicle operation, since ram air provides
adequate cooling under most higher speed conditions.
If electric power is not available, there are still some
technologies that can be applied to reduce the parasitic
power consumption of accessories. Increased component
efficiency is one approach, and clutches can be used to
disengage the alternator and air compressor when they
are not required. Air compressors that are rotating but not
creating pressure absorb about half the power of a pumping
compressor, and compressors normally only pump a small
percentage of the time in long-haul trucks.
For this study, the accessory power demand of a baseline
truck was modeled as a steady state power draw of 5 kW,
and 3 kW for more electrical accessories in individual
vehicle configurations that included electric turbocom-
pounding and/or hybridization. This 2 kW savings versus
average engine power of 100 to 200kW over a drive cycle
nets roughly 1-2% savings compared to a baseline vehicle.
Component Friction Improvements
Engine friction reduction is described in Appendix A.
Lower viscosity lubricants, and lubricants whose viscosi-
ties are less temperature sensitive, can also be applied in
transmissions, differentials, and axles. In many cases, these
components need to be designed to be compatible with
low friction lubricants. The benefits of friction reduction
on these components are sensitive to ambient temperature
with larger benefits found in cold weather. Due to the com-
plexity of modeling friction reductions, realistic reduction
estimates were included in the overall rolling resistance
values that are used in Package 2, Package 3, and all subse-
quent packages, which use the Package 3 values. Package
2 assumes no change in component friction, while Package
3 assumes a 10 percent reduction in component friction.
Aerodynamic Drag Reduction
There are many technical features that are available or
under development to reduce the coefficient of drag (Cd) of
a heavy-duty truck. Because reliable data are not univer-
sally available from independent sources on the effects of
individual features and because modeling the effects of
individual features was beyond the scope of this project, we
modeled the effect of changes in overall Cd from “off-the-
shelf” and “emerging” technologies on the fuel economy
and CO2 emissions of the truck.
A long list of aerodynamic features initially discussed was
used as a starting point to down-select technologies for
the study. That list included: reduced tractor to trailer gap,
trailer side skirts and undercarriage skirts, a boat tail, boat
tail plates, integrated tractor roof fairings, a tractor “eye-
brow,” frontal area reduction (not implemented, in order
to keep carrying capacity constant), trailer edge rounding,
vortex generators, guide vanes, active and passive pneu-
matics, aerodynamic mirrors, replacement of mirrors with
cameras, a trailer underbody wedge, fuel tank fairings,
bumper fairings, and hidden vertical exhaust stacks.
Aerodynamic improvements considered for this study were
broken into two groups, as shown in Table 8.
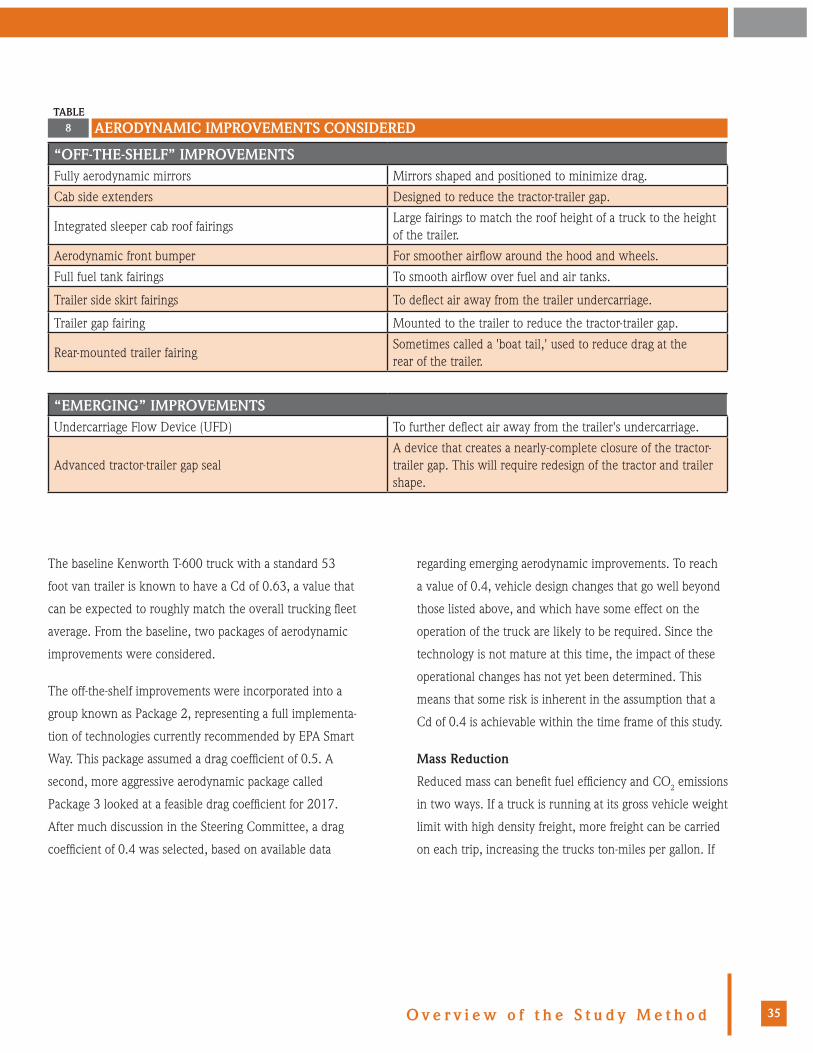
35O v e r v i e w o f t h e S t u d y M e t h o d
“OFF-THE-SHELF” IMPROVEMENTS Fully aerodynamic mirrors Mirrors shaped and positioned to minimize drag.
Cab side extenders Designed to reduce the tractor-trailer gap.
Integrated sleeper cab roof fairingsLarge fairings to match the roof height of a truck to the height of the trailer.
Aerodynamic front bumper For smoother airflow around the hood and wheels.
Full fuel tank fairings To smooth airflow over fuel and air tanks.
Trailer side skirt fairings To deflect air away from the trailer undercarriage.
Trailer gap fairing Mounted to the trailer to reduce the tractor-trailer gap.
Rear-mounted trailer fairingSometimes called a 'boat tail,' used to reduce drag at the rear of the trailer.
“EMERGING” IMPROVEMENTS Undercarriage Flow Device (UFD) To further deflect air away from the trailer's undercarriage.
Advanced tractor-trailer gap sealA device that creates a nearly-complete closure of the tractor-trailer gap. This will require redesign of the tractor and trailer shape.
The baseline Kenworth T-600 truck with a standard 53
foot van trailer is known to have a Cd of 0.63, a value that
can be expected to roughly match the overall trucking fleet
average. From the baseline, two packages of aerodynamic
improvements were considered.
The off-the-shelf improvements were incorporated into a
group known as Package 2, representing a full implementa-
tion of technologies currently recommended by EPA Smart
Way. This package assumed a drag coefficient of 0.5. A
second, more aggressive aerodynamic package called
Package 3 looked at a feasible drag coefficient for 2017.
After much discussion in the Steering Committee, a drag
coefficient of 0.4 was selected, based on available data
regarding emerging aerodynamic improvements. To reach
a value of 0.4, vehicle design changes that go well beyond
those listed above, and which have some effect on the
operation of the truck are likely to be required. Since the
technology is not mature at this time, the impact of these
operational changes has not yet been determined. This
means that some risk is inherent in the assumption that a
Cd of 0.4 is achievable within the time frame of this study.
Mass Reduction
Reduced mass can benefit fuel efficiency and CO2 emissions
in two ways. If a truck is running at its gross vehicle weight
limit with high density freight, more freight can be carried
on each trip, increasing the trucks ton-miles per gallon. If
8TABLE
AERODYNAMIC IMPROVEMENTS CONSIDERED

36 O v e r v i e w o f t h e S t u d y M e t h o d
R E D U C I N G Heavy-Duty Long Haul Combination Truck Fuel Consumption and CO2 Emissions
the truck is carrying lower density freight and is below the
GVW limit, the total vehicle mass is decreased, reducing
rolling resistance and the power required to accelerate or
climb grades.
Weight reduction can be achieved by making components
with lighter materials (high strength steel, aluminum,
composites) or by eliminating components from the
truck. A common component-elimination example is to
use wide-base single tires and aluminum rims to replace
traditional dual tires and rims, eliminating 8 steel rims and
8 tires. Many of the features being added to modern trucks
to benefit fuel economy, such as additional aerodynamic
features or idle reduction systems, have the effect of
increasing truck weight.
Reduced Rolling Resistance
Lowering the rolling resistance of tires through improved
design and inflation reduces the power required to move
the truck down the road, directly reducing fuel consump-
tion and GHG emissions. A well designed wide-base single
tire has lower rolling resistance than traditional dual tires
and manufacturers also offer low rolling resistance versions
of dual tires. Automatic tire inflation and tire monitoring
systems also lower the rolling resistance by helping drivers
operate their tires at optimum pressure. Actual vehicle test-
ing yielded baseline rolling resistance data, while improved
values used in the technology packages were provided by
EPA SmartWay and Michelin. An important consideration
with lower rolling resistance is that traction and brak-
ing performance often suffer as the rolling resistance is
reduced. A balance must be achieved that provides the
lowest practical rolling resistance without too great of an
effect on vehicle performance or safety.
Lower Road Speed
Since aerodynamic drag is a function of speed squared,
reducing speed can improve vehicle fuel economy and
CO2 emissions. Limits to this approach include delivery
time requirements for certain cargo or an increase in the
number of trucks on the road to deliver a given amount
of freight. Any possible increase in the number of trucks
caused by lower speeds could be eliminated by a propor-
tional increase in truck size and weight. To model the
impact of speed alone, a speed limit of 65, 60 and 55 MPH
was imposed on the chosen drive cycle.
Increased Vehicle Size and/or Weight
Trucks that travel at maximum weight or with a maximum
volume of cargo could deliver more freight if heavier
or larger longer trailer combinations, respectively, were
allowed. A truck is said to be “cubed-out” when it is full
of low density freight, while a truck at the GVW limit is
Lowering the rolling resistance of tires
through improved design and inflation
reduces the power required to move the
truck down the road, directly reducing
fuel consumption and GHG emissions.
A well designed wide-base single tire
has lower rolling resistance than
traditional dual tires and manufacturers
also offer low rolling resistance versions
of dual tires.

37O v e r v i e w o f t h e S t u d y M e t h o d
said to be “grossed out” when it is full of high density
freight. Maximum operating efficiency is achieved if a
trucking company is able to load the truck until one or
both of the limits are reached. Increase in the permitted
size and weight of trucks could reduce fuel consumption
on a ton-mile basis and lead to lower CO2 emissions for the
fleet provided that concerns including infrastructure are
addressed. This study considered a 3-axle 53’ trailer and
a variety of Long Combination Vehicles (LCVs) but settled
on one LCV known as a Rocky Mountain Double (RMD)
that consists of a standard 45-48’ trailer towing a second
28’ foot trailer with a maximum GWVR of 120,000lb.
Modeling accounted for these changes by adjusting Cd
and rolling resistance to represent larger, heavier vehicles.
Real and publicly perceived safety considerations of larger
and heavier trucks could be addressed by mandating driver
training, vehicle performance characteristics such as brak-
ing performance and crash compatibility, and by requiring
technologies such as stability control, crash avoidance, and
more.
Idle Reduction
Line haul truck engines use a significant amount of fuel
meeting overnight “hotel loads” for drivers. These hotel
loads include heating, cooling, and electricity to power ap-
pliances (televisions, computers, etc). A typical truck uses
hotel loads that range from 3 to 5 kW (U.S. DOE 2000).
Trucks frequently idle their engines throughout the evening
to meet these loads. Because truck engines are sized for
much higher on-highway power requirements, the engine
operates very inefficiently to provide these small amounts
of power. EPA (SmartWay 2009) estimates that an idling
engine consumes 0.8 to 0.9 gallons of diesel per hour. The
amount of time that a truck spends idling is estimated to
run as high as 2,400 hours per year (nominally 8 hours
per day, 300 days per year) (SmartWay, 2009). Sodolsky
(2002) estimates the average idle time for long haul trucks
to be 1,800 hours per year. These estimates suggest that a
typical line haul truck without idle reduction technology
uses 1,500 to 1,600 gallons per year; total on-road fuel use
for a truck that travels 120,000 miles at 6 MPG is 20,000
gallons, so overnight idling can consume 7 to 8 percent of
the truck’s fuel.
There are several approaches for powering hotel loads
more efficiently. These include shore power systems, which
plug in to an off-board electricity source; direct fire heaters,
which burn diesel fuel directly to meet heating loads;
automatic engine idle control systems, which intelligently
power the engine on and off throughout the evening; bat-
tery powered systems, which use energy stored in a battery
pack charged by the engine; and auxiliary power units,
which are small, highly efficient diesel generators. These
idle reduction technologies are all currently available either
through third party vendors or as add-on options to trucks
directly through manufacturers.
Our analysis focused on the potential for achieving idle
reduction using an APU, included in the SmartWay tech-
nology (package 2); and a battery-based system, included as
part of the hybrid package (package 4). We did not evaluate
shore power systems, as this represents an infrastructure
challenge that lies outside the scope of the study. We
selected an APU rather than a battery based system as
part of the SmartWay package because these systems are
capable of providing hotel loads for longer periods; battery
based systems require that the engine be powered on
frequently (a few minutes per hour) to recharge the battery.

38 O v e r v i e w o f t h e S t u d y M e t h o d
R E D U C I N G Heavy-Duty Long Haul Combination Truck Fuel Consumption and CO2 Emissions
The hybrid package uses a battery-based system because
all of the tertiary systems are already included in standard
hybrid vehicle, so idle reduction is realized for “free.” Both
of these systems are estimated to reduce fuel use to 0.2
gallons per hour (SmartWay 2009), which reduces fuel use
by approximately 6 percent on a line-haul truck.
In addition to estimating the emission reduction potential
of each of the individual technology options described
above and listed in Table 7, rough cost estimates were
developed for each option to gauge the relative cost-effec-
tiveness of employing one CO2 reduction technology versus
another. In most cases, costs available in the literature were
reported as retail costs. In two cases, discussed in more de-
tail on page 43 of this chapter, factory component hardware
costs were converted to retail costs using a markup factor
of 2.0 by TIAX.
Overall, the study encompassed technologies that are
already in production for the U.S., European, or Japanese
truck markets, or that are known to be under development
for production in these markets. These technologies were
identified by SwRI, by other members of the NESCCAF
study team, or by the Research Steering Committee formed
to provide advice during this project. SwRI performed the
fuel consumption and CO2 analysis, while TIAX assembled
functional definitions of each of the CO2 reduction tech-
nologies as they were modeled by SwRI, gathered industry
information on specific technologies using interviews and
technical papers, and performed a cost and impact study
using adoption-rate estimates. The results of TIAX’s analysis
were reported in the form of a matrix of the truck-level
difference in hardware costs (relative to a baseline truck)
for any given package of technologies. The cost matrix is
summarized in Appendix B.
Future Developments in Heavy-Duty Truck Technology
As mentioned above, SwRI did not consider fuel
consumption and CO2 reduction technologies unless
they are currently in production or for which a design
specification is available in the literature. As such, the
study findings do not represent the total available potential
to reduce heavy-duty vehicle fuel consumption and CO2
emissions – the results only estimate what can be done
given known technologies. Going forward, more advanced
technologies to improve engine, vehicle, and transmission
technologies could and will likely be developed that would
further reduce truck fuel consumption and CO2 emissions
beyond the 2017 timeframe. Engine manufacturers and
others are currently working on advanced approaches to
improve truck efficiency. Some of these technologies could
include:
• Improvements in thermal efficiency. The 21st Century
Truck Program has established a target of reaching a
55 percent thermal efficiency for heavy-duty vehicles.
An efficiency similar to that level was not evaluated
because a technical path to achieve this goal has yet to
be identified or demonstrated
• Further reductions in engine friction
• Advanced variable valve actuation that is used to create
a new type of engine cycle (Sturman Digital Engine)
• Alternative combustion modes (HCCI, PCCI, LTC,
others to be invented)
• Advanced bottoming cycles and exhaust thermal-
to-power schemes that extend beyond the steam
bottoming cycle concept modeled in this study

39O v e r v i e w o f t h e S t u d y M e t h o d
Modeling technologies such as those described in the list
above was beyond the scope of this project for two reasons:
first, some of the technologies require very sophisticated
and expensive modeling, and second, in several cases it is
not clear from the literature exactly what to model. Addi-
tional strategies are also available to reduce fuel consump-
tion and GHG’s from transporting freight that were outside
the scope of this analysis including intermodal shipping,
improved logistics to avoid congestion and reduce empty
hauls, driver training and driver aid technologies (real-time
fuel economy monitors, GPS systems for anticipating road
grade changes), improved efficiency for refrigerated cargo,
amongst others.
Assembling Technology Packages for Model SimulationUsing the most promising individual technologies that
emerged from the initial screening evaluation described
above, in combination with cost estimates for the indi-
vidual technologies, a series of technology packages was
assembled for modeling. Generally, these packages were
designed to span a wide range of CO2 reduction potential
so they necessarily reflect a wide range of impacts
and costs.
Package 2 represents a suite of technologies recommended
by the EPA Smart-Way program and available for purchase
today, including aerodynamic improvements, low rolling
resistance tires, and an APU. Package 2 goes one step
beyond Smart-Way by including the rolling resistance
benefits of the best currently available wide-base single
tires. Package 3 represents a further improvement of
aerodynamics and tires, based on estimates of the capability
of emerging technologies.
Most of the remaining packages have been modeled in
comparison to the baseline Package 1 and Package 3.
Packages 4 through 8 and Package 11 were each modeled
to determine their ability to reduce fuel consumption of an
otherwise baseline truck. These powertrain-focused options
were evaluated separately to provide a clearer understand-
ing to the team about how they might be combined in the
final “maximum reduction” packages.
Packages 9 and 10 are unique, in that they involve opera-
tional changes to trucks and do not require new technolo-
gies. Introducing these changes broadly might, however,
require regulatory changes. The effect of speed on fuel
economy is well understood and a variety of types of Long
Combination Vehicles that carry more freight are already in
use in most states in the US and in Canada.
Packages 12-14 use differing combination of technologies
and operational changes to demonstrate various paths to
achieve a maximum reduction in CO2 using the technolo-
gies included in the study available for incorporation into
trucks prior to 2017.
A full GT-POWER and RAPTOR simulation was then
performed for each technology package, using the per-
formance constraints identified for 2017 models. For all
packages except for Package 9 (the longer / heavier vehicle
combinations), engine performance (power and torque)
remained the same as the 2007 baseline vehicle. Engine
power was increased in Package 9 to accommodate the
higher vehicle weight. The specific packages evaluated,
along with model simulation results for each package, are
presented in Chapter 3.

40 O v e r v i e w o f t h e S t u d y M e t h o d
R E D U C I N G Heavy-Duty Long Haul Combination Truck Fuel Consumption and CO2 Emissions
9TABLE
DESCRIPTION OF TECHNOLOGIES SIMULATED BY SWRI
PACKAGE PACKAGE NAME DETAILED PACKAGE DESCRIPTION
1 BaselineVolvo D13 (2010 emissions), Kenworth T600, 10-speed manual transmission
BUILDING BLOCK TECHNOLOGIES
2 SmartWay 2007 (SW1)
Additional aero streamlining sufficient to reduce the coefficient of drag from 0.63 to 0.5 to the cab and the trailer. Fully aerodynamic mirrors, cab side extenders, integrated sleeper cab roof fairings, aerodynamic bumper, and full fuel tank fairings. Trailer streamlining includes a side skirt fairing, and either a trailer gap fairing or a rear-mounted trailer fairing such as a boat tail. RR of 0.0055. Wide-base singles and aluminum wheels. Idle reduction, improved transmission and axle lubricants
3 Advanced SmartWay (SW2)
Package #2 plus advanced aero and rolling resistance package. Includes continued streamlining of the cab/trailer combination, a reshaped trailer, boat tail, full skirting of cab and trailer, tractor-trailer gap fairing, and very low rolling resistance tires
4Parallel hybrid-electric powertrain (HEV)
Parallel hybrid system
5 Mechanical Turbocompound Mechanical turbocompound plus package #7
6 Electrical Turbocompound Electrical turbocompound plus package #7
7 Variable Valve Actuation (VVA) Variable valve actuation
8 Bottoming Cycle Bottoming cycle
11 Advanced EGR Advanced exhaust gas recirculation
OPERATIONAL MEASURES
9Rocky Mountain Double Trailers (RMD)
Longer/heavier trailer (Rocky Mountain doubles – 48’ and 28’ trailers)
10 60 mph speed limit Slower road speed (60 mph)
MAXIMUM REDUCTION COMBINATION PACKAGES
12 Maximum Reduction Combo 1 Standard 53’ trailer, hybrid, bottoming cycle, advanced aero and rolling resistance package, 60mph speed limit (packages #3, #4, #8, #10)
13 Maximum Reduction Combo 2 Longer heavier trailer, bottoming cycle, hybrid, electric turbocompound, VVA, advanced aero and rolling resistance package, 60 mph speed limit (packages #3, #4, #6, #7, #9, #10)
14 Maximum Reduction Combo 3 Longer heavier trailer, hybrid, bottoming cycle, advanced aero and rolling resistance package, 60 mph speed limit (packages #3,#4,#8,#9, #10)
41O v e r v i e w o f t h e S t u d y M e t h o d
An important benefit of simulating the performance of
technology packages, rather than individual technologies,
is that it eliminates the possibility that CO2 reductions will
be “double counted.” The emissions benefits associated
with various options do not necessarily add when these
improvements are combined in a single vehicle, particularly
to the extent that many technologies target the same
sources of mechanical or thermodynamic inefficiency. The
simulation modeling conducted for this analysis avoids
this problem. At the core of each simulation is an engine
map that defines CO2 emissions over a full range of engine
speed and load points. Each map reflects the contribution
of all engine technologies incorporated in the vehicle and
therefore accounts for their composite impact on CO2
emissions. Engine maps were completely replaced for each
engine technology package simulated in this analysis; they
were not added or otherwise manipulated. In the case of
technologies that do not directly affect the engine map
but rather the point on the map at which a vehicle is
operating (e.g., rolling resistance or aerodynamic drag),
the simulation model ascribes benefits to those technolo-
gies in accordance with their cumulative effect on engine
operation. Thus, at any given point in time, the vehicle is
simulated as operating at one speed/load point as deter-
mined by the combination of technologies present; in turn,
the specific CO2 emissions rate for that point in time is
simply read from the underlying engine map.
The following example briefly illustrates how this process
works. As described above, combinations of technolo-
gies are modeled as a complete vehicle system. Take, for
example, a technology package consisting of a combination
of improved aerodynamic drag and reduced vehicle speed.
These improvements will reduce the power demand on
the engine. However, when modeled in combination, the
package provides a reduction in fuel consumption that is
somewhat less than the sum of the individual technology
benefits. The reason for this is that the relative benefit of
aerodynamic drag improvements changes with speed, since
aerodynamic drag is proportional to the square of speed.
In our example, one could measure or simulate at 65 MPH
the improvement in fuel consumption caused by moving
from a baseline aerodynamic package to a new aerody-
namic package. Next, one could measure or simulate
the reduction in fuel consumption caused by slowing the
baseline truck from 65 MPH to 60 MPH. Unfortunately,
the two improvements cannot be simply added together to
determine the benefit caused by both improving aerody-
namics and lowering vehicle speed. A more aerodynamic
truck will have a lower drag force, and therefore it will not
benefit from lower speed to the same extent as a higher
drag truck. There are two correct paths to determine the
benefit of combining these two technologies, and one path
that gives the wrong answer:
1. Correct: first simulate the benefit of improved
aerodynamics at 65 MPH, and then calculate the
benefit of lower speed, using the new, lower coefficient
of drag (Cd) value. These two improvements can be
added together.
2. Correct: first calculate the benefit of lowering speed
from 65 to 60 MPH, and then determine the benefit
of improved aerodynamics at 60 MPH. These two
benefits can be added together.
3. Incorrect: calculate the benefit of improved
aerodynamics at 65 MPH and calculate the benefit of
lower speed using the baseline Cd. These two benefits
are not fully additive.

42 O v e r v i e w o f t h e S t u d y M e t h o d
R E D U C I N G Heavy-Duty Long Haul Combination Truck Fuel Consumption and CO2 Emissions
Note that changes in drag coefficient and speed may result
in a change in required engine power that is different from
the fuel economy benefit that is realized. For example, a
given set of changes might reduce the power requirement
by 30 percent. If all things remain equal, a reduction in
power required should translate directly into a 30 percent
fuel savings. However, if the engine then has to operate at a
less efficient point on its map, the overall fuel savings might
be less, for example only 28 percent. Conversely, if the
changes in vehicle power demand put the engine at a more
efficient point on its operating map, the fuel savings will be
larger than the reduction in power demand. The simulation
technique used in this project accounts for these situations.
Some technologies tend to interfere with each other’s
performance. This interference may be so large that one
would not consider combining the two technologies. An
example of this is a combination of low temperature EGR
and a bottoming cycle or a turbocompound system. Low
temperature EGR by itself reduces fuel consumption,
but if it is combined with a system that extracts energy
from the exhaust, the two technologies work against
each other. Low temperature EGR reduces the exhaust
stream temperature, which will lower the performance of
a turbocompound system or a bottoming cycle. Thus, the
benefits of low temperature EGR and either turbocom-
pound or a bottoming cycle cannot be added together.
Similarly, turbocompound and a bottoming cycle cannot be
combined without substantially degrading the performance
of one of these systems. Because both systems work to
extract energy from the exhaust, they cannot be added
together to provide a benefit even close to the sum of the
two individual benefits.
Method of Estimating Cost of Technology PackagesFor each of the technology combinations listed in Table 9,
TIAX developed net cost estimates from direct published
quotes and pricing guidelines such as those published by
the EPA SmartWay program. Net hardware costs in this
context include system and component costs, as well as
applicable credits in instances where the use of a particular
technology would reduce other component or system costs.
For example, the entire cost of lightweight tires is not
added to the cost of a truck because the lightweight tire
purchase is partially offset by the avoided cost of standard
tires.
When more than one value was found, the estimated
cost was calculated by averaging all values. Key reference
sources for most of the cost estimations are listed in
Appendix C. Input from industry experts was also
incorporated, particularly when the technologies were not
currently available for purchase. Cost assessments were
based on the assumption of reasonable volume production
for the Class 8 line haul truck industry and corresponding
market penetration.
Once costs for individual technologies
were developed, TIAX integrated these
values to arrive at cost estimates for the
technology packages modeled by SwRI.
Total package costs were calculated based
on the assumption that for each tractor
equipped with new technologies, three
trailers would need to be equipped.
43O v e r v i e w o f t h e S t u d y M e t h o d
For certain pre-commercial technologies (such as bottom-
ing cycle), the estimated costs were developed from a
typical bill of materials assuming design and development
costs would be fully amortized. Once costs for individual
technologies were developed, TIAX integrated these values
to arrive at cost estimates for the technology packages
modeled by SwRI. Total package costs were calculated
based on the assumption that for each tractor equipped
with new technologies, three trailers would need to be
equipped. This was based on the industry average ratio of
existing in-use trailers to tractors. Because the packages
included technologies affecting different aspects of the
vehicle (engine, transmission, aerodynamics, etc.), in
most cases the costs were additive. However, there were
some cases (e.g., hybridization combined with electric-
turbo-compounding) for which double-counting had to
be avoided to arrive at an estimated system cost. TIAX
addressed these situations by developing a bill of materials
for each technology package, and from this bill of materials
duplicative components were removed. All of the
technology packages were compared to the 2007
baseline (Package 1).
As described above, rough cost estimates were developed
for each option to gauge the relative cost-effectiveness of
employing one CO2 reduction technology versus another.
This task was performed using available information on
incremental system and component hardware costs. TIAX
obtained incremental system and component hardware
costs as retail costs. In the case of two technologies –
bottoming cycle and hybridization – costs were calculated
as incremental factory manufacturing cost to truck and
engine manufacturers. For these two technologies, the
impact on the retail price of the trucks from a consumer
perspective was then estimated by applying a factor of 2.0
representing “Retail Price Equivalent” (RPE). The basis
for this factor is a series of U.S. Department of Energy
reports published on hybrid electric and automotive fuel
cell system manufacturing cost. Although these reports are
based on the light-duty automotive sector, we assume that
roughly the same market dynamics apply to the heavy-duty
vehicle manufacturing sector (i.e., many of the same Tier
One suppliers serve both light-duty and heavy-duty original
equipment manufacturers (OEMs), and have high-volume
manufacturing and relatively low margins). Therefore,
the 2.0 factor is a reasonable factor for estimating RPE for
heavy-duty vehicle technologies. The ratio of retail price
to ex-factory cost was taken at 2.0 assuming that for these
line haul packages, first tier suppliers would provide most
components to the OEM truck builder. A lower ratio would
be appropriate only if all the technology components were
manufactured from raw materials by the OEM.
The retail price equivalent includes:
• Actual cost of materials, parts and assembly labor,
including facilities, factory tooling (amortized),
equipment maintenance, depreciation cost of operating
capital and utilities, and other process costs
• Factory overhead or mark-up of the OEM and/or Tier
One supplier includes items such as warranty, research
and development, engineering, depreciation, legal,
marketing and sales, corporate overhead, retirement
and health benefits, accounting, shipping and
distribution, corporate taxes, and dealer support
• Dealer discount or mark-up
• Profit
44 O v e r v i e w o f t h e S t u d y M e t h o d
R E D U C I N G Heavy-Duty Long Haul Combination Truck Fuel Consumption and CO2 Emissions
TIAX’s cost estimates attempt to capture all costs to the
manufacturer of incorporating new technologies, and
include an estimate of cost impact at the consumer level
as reflected in the purchase price of a new vehicle.
All costs are presented in 2007 U.S. dollars and assume
the subject technologies will be manufactured in a highly
competitive environment using flexible and lean manu-
facturing methods. Costs are estimated for the year 2012
and beyond assuming that each manufacturer will produce
between 2,000 and 10,000 units per year, thereby
achieving full economies of scale. Importantly, TIAX
did not assume future cost reductions due to currently
unknown advances in either technology design or manu-
facturing – future costs reflect fully learned, high-volume
production of current technology designs. To the extent
that basic science advances in design or manufacturing do
occur, future costs may be lower than estimated. To the
extent that development may require additional features
or improvements to achieve the expected performance
with adequate reliability and durability, future costs may be
higher than estimated.
Method of Cost-Benefit AnalysisAs described above, for each of the technology packages
an incremental and retail price equivalent cost was
determined and is presented in the cost results section of
Chapter 3. Using the incremental vehicle costs and
operations & maintenance (O&M) costs, the net cost
of ownership was calculated for each of the technology
packages. This analysis takes into account the savings
realized through reduced fuel use over two time periods:
(1) a 15-year time horizon; and (2) a three-year time
horizon.12 The 15-year vehicle life is a good proxy for
determining societal benefit from adopting a new technol-
ogy, and hence may be used to justify regulation. However,
experience suggests that truck operator use a far shorter
time horizon in making their vehicle purchase decisions.
The basic elements of these calculations are described
below. A more detailed description of the cost-benefit
analysis is provided in Appendix C.
The TIAX analysis weighs the fuel savings against capital
costs and any change in the yearly maintenance cost, such
as impacts on brake maintenance, major overhaul intervals
and other operation and maintenance costs. Future costs
and benefits are discounted at a rate of 7 percent per year.
The 7 percent figure has been used in regulations such as
the EPA’s Tier 2 [1999] and Heavy-Duty Vehicle Regulations
[1997]. Cost of ownership is defined as follows:
Cost of ownership = (Capital Cost) - Σ(Fuel saved – O&M)/(1+r)t
Where r is the discount rate (7 percent), t is the age of the
vehicle, and the fuel savings and O&M costs are expressed
in dollars per year, and are summed (Σ) over either a
three-year or a fifteen-year time horizon. A negative cost of
ownership implies that a given technology saves the buyer
money.
The fuel savings accrued over the life of the vehicle, and
hence ownership costs, are very sensitive to a truck’s
annual mileage, which varies as a function of vehicle age.
This age dependence was estimated using data from the
12 The 15-year vehicle life is a good proxy for determining societal benefit from adopting a new technology. However, experience suggests that truck operator use a far shorter time horizon in making their vehicle purchase decisions . Several industry sources have suggested payback periods of 18 to 24 months to justify an investment in fuel saving technology. There may be extreme cases where fleets run tractors for a 15-year period, however, this would be extremely rare. Over the road operators typically run 4 years and then sell or trade the vehicle. Because of this an owner of a heavy-duty long haul truck will not realize a cost benefit from introduction of technologies that have a payback period longer than 2 years, even though over the life of the vehicle the technologies could be cost effective. Thus, without regulation or subsidies, many of the technologies evaluated would not likely be introduced into the market.

45O v e r v i e w o f t h e S t u d y M e t h o d
2002 Vehicle Inventory and Use Survey [VIUS 2002], a
wide-ranging survey of the commercial trucking industry;
additional confirmation was provided by discussions with
industry stakeholders. Over the first three to four years of
the vehicle life, trucks operate in long-haul service, which
is characterized by upwards of 100,000 miles traveled
per year, primarily, long-range trips (a radius greater than
several hundred miles), and travel primarily over interstate
highways at highway speeds. This type of duty-cycle
typically dominates the first five to seven years of a tractor’s
life. As trucks age, they tend to migrate into local and re-
gional applications, and a growing fraction get retired from
service altogether. Regional operators tend to drive much
shorter distances (on the order of 50,000 miles per year);
operate within a confined region; and travel a significant
number of miles in urban or exurban areas at lower speeds
with more frequent stops. The median age of trucks in
regional operation is on the order of 18 to 20 years. In
sum, the long-haul portion of a truck’s service life accounts
for 60 percent to 70 percent of the total tractor-trailer fuel
use [VIUS 2002].
The cost of ownership calculations account for this age
dependence by treating mileage as a function of age. In the
case of calculations over a 3-year time horizon, mileage
is assumed to remain constant at 120,000 miles per year.
Over a 15-year time horizon, the annual mileage for a
typical truck on long-haul duty cycles declines dramatically
9FIGURE
2008 EIA LONG-TERM ENERGY OUTLOOK DIESEL PRICE SCENARIOS
$0.00
$0.50
$1.00
$1.50
$2.00
$2.50
$3.00
$3.50
$4.00
2005 2010 2015 2020 2025 2030
Die
sel P
rice
($/
Ga
l)
ReferenceLowHigh

46 O v e r v i e w o f t h e S t u d y M e t h o d
R E D U C I N G Heavy-Duty Long Haul Combination Truck Fuel Consumption and CO2 Emissions
to less than 20,000 miles per year13. Our cost of ownership
analysis focuses only on the long-haul portion of a truck’s
service life. This means that fuel savings accrued during
regional operation are not accounted for. These unaccount-
ed for savings from regional service may be significant for
certain technologies that were considered, such as hybrids;
but fairly small for others, such as aerodynamic improve-
ments or 60 MPH speed governors. In addition, the long
trailer or double trailer configurations that were considered
are not feasible for regional haulers. A more detailed
discussion of this issue is presented in Appendix D.
Fuel price scenarios were a critical element of the analysis
of fuel-savings benefits, and we relied on DOE Energy
Information Administration (EIA) forecasts from their 2008
long-term energy outlook, shown in Figure 9 [EIA 2008].
As additional forecasts are released by EIA these can be
readily used to update the analysis.
Fleet-Wide Emissions Benefit Analysis MethodologyThe last step in the heavy-duty CO2 analysis was to
estimate the amount of fuel and CO2 reduced through
widespread adoption of heavy-duty technologies into the
U.S. fleet of heavy-duty Class 8 long-haul trucks. This work
is described below.
Fleet Characterization
To project the fleet-wide effect of the technology packages
described above, TIAX developed a spreadsheet-based
heavy-duty fleet model. The fleet model uses estimates of
new truck sales, scrap rates, vehicle miles traveled, and
fuel economy to develop a bottom-up estimate of fleet-wide
13 This mileage estimate represents long-haul miles for a typical truck. Included in this “average” data is the fact that some trucks are scrapped, and that most miles are driven on regional routes. Analysis of a regional duty-cycle was not conducted for this study.
characteristics, such as fleet fuel use, fleet VMT, and truck
population. The model uses historical data to estimate
the size, composition, duty cycle, and turnover of the
long-haul truck fleet, and an estimated fleet growth rate
to extrapolate these data into the future. Because many
of the technology packages under consideration, such as
moderate and aggressive improvements to aerodynamics,
apply specifically to “box” or “van” type trailers, the fleet
model calculates benefits only for those tractor-trailer
(“combination”) trucks that primarily tow van trailers.
Based on data from the 2002 Vehicle Inventory and Use
Survey [VIUS 2002], we estimate that these types of trailers
account for 60 percent of the combination truck popula-
tion. In addition, miles accrued on a regional duty-cycle
were not included. A more detailed description of the data
sources and assumptions used to develop this fleet model is
included in Appendix D.
Annual mileage assumptions are based on appropriate
averages for tractor-trailers as a function of vehicle age,
including the effects of vehicle age on annual mileage,
the migration to regional service, and the retirement rate
of older trucks. When the combined impacts of declining
VMT, increasing vehicle retirements, and discounted future
cash flow are considered, fuel savings beyond 15 years
are negligible, so the calculations assume a 15 year truck
lifetime.
Fleet Model Validation
In order to validate the fleet model, TIAX compared the
bottom-up fleet model estimates for fuel use with actual
historical data. Figure 10 illustrates how the modeled fuel
consumption in millions of gallons per year for all Class 8
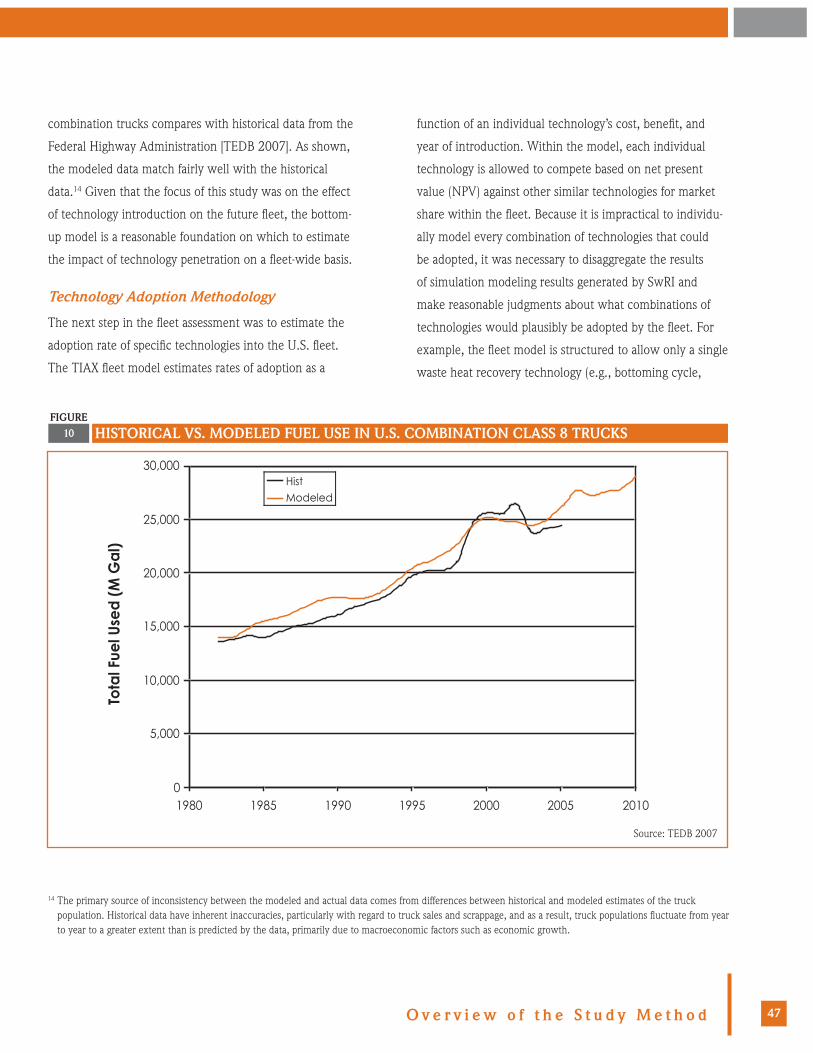
47O v e r v i e w o f t h e S t u d y M e t h o d
14 The primary source of inconsistency between the modeled and actual data comes from differences between historical and modeled estimates of the truck population. Historical data have inherent inaccuracies, particularly with regard to truck sales and scrappage, and as a result, truck populations fluctuate from year to year to a greater extent than is predicted by the data, primarily due to macroeconomic factors such as economic growth.
combination trucks compares with historical data from the
Federal Highway Administration [TEDB 2007]. As shown,
the modeled data match fairly well with the historical
data.14 Given that the focus of this study was on the effect
of technology introduction on the future fleet, the bottom-
up model is a reasonable foundation on which to estimate
the impact of technology penetration on a fleet-wide basis.
Technology Adoption Methodology
The next step in the fleet assessment was to estimate the
adoption rate of specific technologies into the U.S. fleet.
The TIAX fleet model estimates rates of adoption as a
10FIGURE
HISTORICAL VS. MODELED FUEL USE IN U.S. COMBINATION CLASS 8 TRUCKS
0
5,000
10,000
15,000
20,000
25,000
30,000
1980 1985 1990 1995 2000 2005 2010
Tota
l Fue
l Use
d (
M G
al)
HistModeled
Source: TEDB 2007
function of an individual technology’s cost, benefit, and
year of introduction. Within the model, each individual
technology is allowed to compete based on net present
value (NPV) against other similar technologies for market
share within the fleet. Because it is impractical to individu-
ally model every combination of technologies that could
be adopted, it was necessary to disaggregate the results
of simulation modeling results generated by SwRI and
make reasonable judgments about what combinations of
technologies would plausibly be adopted by the fleet. For
example, the fleet model is structured to allow only a single
waste heat recovery technology (e.g., bottoming cycle,

48 O v e r v i e w o f t h e S t u d y M e t h o d
R E D U C I N G Heavy-Duty Long Haul Combination Truck Fuel Consumption and CO2 Emissions
turbo-compounding, or advanced EGR) to be adopted into
a vehicle at a time. This approach is described in greater
detail in Appendix D.
Two different technology adoption scenarios were modeled
for this analysis. The two scenarios differ in the assumed
rate of adoption. These were compared against a reference
case scenario in which the fuel economy and CO2 emis-
sions of the fleet remains constant, but the fleet grows at
a constant rate. The first scenario (“Scenario A”) assumes
maximum penetration of fuel consumption and CO2
reducing technologies into the heavy-duty long-haul fleet.
Under this scenario, the most aggressive technologies that
have a negative cost of ownership over a fifteen-year time
horizon are fully adopted, subject to technology availability
and assumed production capacity technologies. The second
technology adoption scenario (“Scenario B”) uses a rational
buyer model in which the rate of adoption for a given
technology is calculated as a function of time to payback.
Both technology introduction scenarios assume that it
takes several years for new technologies to ramp up to
10TABLE
SCENARIO SUMMARY
SCENARIO A – MAXIMUM TECHNOLOGY ADOPTION SCENARIO SCENARIO B – MARKET DRIVEN
Net-positive NPV technologies are fully adopted3-year payback is used to estimate market-based technology adoption
EIA Ref & High fuel price cases EIA Ref & High fuel price cases
7-year ramp for new technologies 10-year ramp for new technologies
These scenarios and the assumptions used to develop them are described in more detail in Appendix D.
full production and fully penetrate new vehicle sales.
This phase-in period is based on EIA projections for the
introduction of incremental vehicle technology options in
the light-duty sector [EIA 2008], which typically require
five to 10 years to fully penetrate new vehicle sales. The
model also assumes that technology costs decline from
the time of technology introduction until full deployment.
For mature technologies, such as moderate aerodynamic
improvements (Package 2), a faster phase-in period with no
cost reduction is assumed. In the case of Rocky Mountain
doubles, implementation will require buy-in from many
stakeholders, regulatory changes in a number of states, and
some infrastructure changes. In addition, they are not
feasible in urban areas and may not offer benefits for less-
than-truckload (LTL) carriers. Due to these complexities,
we have capped the maximum market penetration at
60 percent of the long-haul tractor-trailer fleet, or
approximately 40 percent of the entire tractor-trailer fleet.
The next chapter provides results for the fuel consumption
and CO2 emissions reduction analysis, cost analysis, cost-
benefit analysis, and fleet-wide CO2 and fuel consumption
reduction analysis.
RESULTS
49
RESULTSR E S U L T Sr e s u l t sr e s u l t s
r e s u l t s Results
R E D U C I N GHeavy-Duty Long Haul Combination
Truck Fuel Consumption and CO2 Emissions
OverviewThe methods described in Chapter 2 and detailed in
Appendices A through C were used to predict the CO2
emissions and fuel consumption impacts and costs associ-
ated with deploying a variety of automotive technologies
on future heavy-duty long-haul trucks. In this report,
fuel consumption results, CO2 emissions, and costs are
presented for one representative long-haul vehicle.
A total of 32 engine, vehicle, drivetrain, load reducing tech-
nologies, and truck configuration or speed modifications
were evaluated in this analysis to quantify associated CO2
reduction potential. Currently available heavy-duty engine
technologies such as aerodynamic drag improvements and
improved tires were evaluated as well as more advanced
technologies such as bottoming cycle and variable valve
actuation. Turbocompounding and hybridization were also
considered. The emissions and fuel consumption benefits
of individual technologies and packages or combinations
of these technologies were analyzed. The study relies on a
systems analysis approach that avoids the “double count-
ing” that could occur by simply combining the emission
reduction benefits of individual technologies. In some
cases, benefits of individual technologies are not additive.
Examples of this issue are presented in the method over-
view to illustrate the impact of a systems analysis approach
on emission benefit projections.
This chapter first discusses the CO2 reduction potential
of individual technologies. Vehicle results are presented
in miles per gallon and ton mile per gallon (ton MPG)
units, but all percent changes are presented in terms of
percent change in total fuel consumed (gallons per mile)
and percent change in total CO2 emissions. In many cases,
MPG and percent savings in fuel consumption are plotted
on the same graph, with MPG on the left hand y-axis, and
percent reduction in fuel consumption and CO2 emissions
presented on the right hand y-axis. The overall CO2 impact,
retail price equivalent, and net cost estimates are then
presented for each of the technology packages evaluated.
The technologies evaluated in this study are described in
Appendix A. Finally, an analysis of the potential CO2 and
fuel consumption reductions that could be achieved in
the U.S. fleet of heavy-duty long-haul vehicles with intro-
duction of technologies to reduce fuel consumption and
emissions is presented. Appendix D describes in detail the
method used to estimate the fleet-wide fuel consumption
and CO2 emissions reductions associated with the
introduction of heavy-duty vehicle technologies.
Emission and Fuel Consumption Reduction ResultsAs described in Chapter 2, the emission benefit analysis
conducted for this study involved several steps. The first
step was a literature survey and engineering assessment to
identify potential CO2 reduction technologies and assess
their likely emission reduction capabilities. These included
both stand-alone technologies and those appropriate for
inclusion with other technologies in combination pack-
ages. Second, an actual vehicle model from the U.S. fleet
was selected to represent a Class 8 long-haul truck. Third,
SwRI’s RAPTOR and commercially available GT-POWER
software were used to assess the CO2 and fuel consump-
tion impacts of individual or combinations of technologies
for the Class 8 long-haul truck. A systems analysis was
subsequently conducted for the selected technology
packages. The results of these analyses are presented in the
following sections.
50 R e s u l t s
R E D U C I N G Heavy-Duty Long Haul Combination Truck Fuel Consumption and CO2 Emissions
CO2 Emission and Fuel Consumption Reduction Potential for Individual TechnologiesIndividual technologies were first evaluated to aid in the
selection of options for inclusion in technology packages or
combinations which were then subjected to more in-depth
evaluation using GT-POWER and RAPTOR simulation code
(as described in the method section). This initial evaluation
was designed to provide approximate CO2 reduction
estimates for use solely in the context of selecting tech-
nologies for further investigation. Because this first part
of the study served a preliminary screening function, no
technologies were evaluated using full model simulations.
All technologies were evaluated using data from published
literature.
From the published literature, individual technologies
were found to produce a broad range of projected CO2
reductions. The analysis indicates that evolutionary engine
and drivetrain technologies generally provide reductions
ranging from 1 to 10 percent. The technologies offering
the most significant CO2 reductions are aerodynamic drag
improvements (10 percent to 26 percent), bottoming cycle
(up to 10 percent with the configuration evaluated), trailer
weight and size increases (up to 30 percent), and reduced
road speed (up to 10 percent). Other technologies show-
ing significant reduction potential over a long-haul cycle
include mechanical and electrical turbocompounding and
hybridization.
The only GHG considered in this study was CO2. Some
evaluation was done of the potential to reduce hydrofluo-
rocarbons (HFCs) from air conditioning systems and also to
reduce CO2 emissions associated with the additional load
of running the air conditioning system. However, these
approaches were not analyzed in the simulation model-
ing given the small relative contribution of HFC leakage,
and given the fact that CO2 emissions from powering air
conditioning represent a very small share of heavy-duty
vehicle CO2 emissions from fuel consumption. For the
same reason, approaches to reduce N2O or other tailpipe
GHG emissions from long-haul trucks were not evaluated.
Finally, approaches to reducing carbon black from long-haul
trucks were not evaluated as part of this study.
Modeled CO2 Emission and Fuel Consumption Reduction Potential for Individual Technologies and Technology CombinationsThe following sections describe the results of the
simulation modeling conducted by SwRI.
Package 1 – Baseline Vehicle and Weight Reduction Evaluation
Figure 11 shows the fuel economy of the baseline vehicle
in MPG. The baseline vehicle on the highway duty cycle
described in Chapter 2 achieved a fuel economy of 5.4
MPG. In addition to evaluating the baseline vehicle fuel
economy in this simulation, the potential to reduce fuel
consumption and CO2 emissions by reducing weight from
the baseline weight of 80,000 pounds was evaluated. For
the purpose of this calculation, the weight reduction could
come either from carrying lighter freight or from a reduc-
tion in the empty weight of the truck. If the vehicle mass is
reduced to 65,000 pounds, the fuel economy improves to
5.9 MPG. The fuel savings and CO2 reduction on the
baseline vehicle amount to about 0.5% per 1,000 pounds
of mass reduction. This result suggests that efforts to
reduce the empty vehicle mass will have only a modest
benefit on fuel economy, at least on a long haul route.
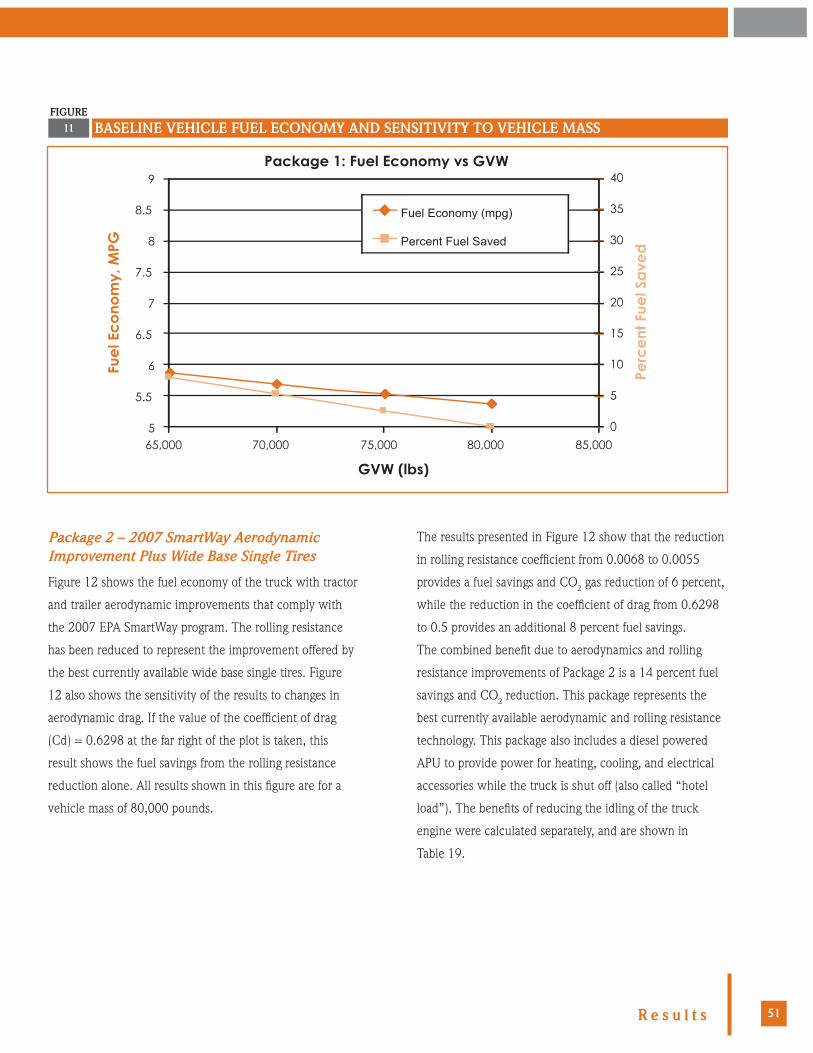
51R e s u l t s
11FIGURE
BASELINE VEHICLE FUEL ECONOMY AND SENSITIVITY TO VEHICLE MASS
Package 1: Fuel Economy vs GVW
5
5.5
6
6.5
7
7.5
8
8.5
9
65,000 70,000 75,000 80,000 85,000
GVW (lbs)
Fue
l Ec
on
om
y, M
PG
0
5
10
15
20
25
30
35
40
Perc
en
t Fu
el S
ave
d
Fuel Economy (mpg)
Percent Fuel Saved
Package 2 – 2007 SmartWay Aerodynamic Improvement Plus Wide Base Single Tires
Figure 12 shows the fuel economy of the truck with tractor
and trailer aerodynamic improvements that comply with
the 2007 EPA SmartWay program. The rolling resistance
has been reduced to represent the improvement offered by
the best currently available wide base single tires. Figure
12 also shows the sensitivity of the results to changes in
aerodynamic drag. If the value of the coefficient of drag
(Cd) = 0.6298 at the far right of the plot is taken, this
result shows the fuel savings from the rolling resistance
reduction alone. All results shown in this figure are for a
vehicle mass of 80,000 pounds.
The results presented in Figure 12 show that the reduction
in rolling resistance coefficient from 0.0068 to 0.0055
provides a fuel savings and CO2 gas reduction of 6 percent,
while the reduction in the coefficient of drag from 0.6298
to 0.5 provides an additional 8 percent fuel savings.
The combined benefit due to aerodynamics and rolling
resistance improvements of Package 2 is a 14 percent fuel
savings and CO2 reduction. This package represents the
best currently available aerodynamic and rolling resistance
technology. This package also includes a diesel powered
APU to provide power for heating, cooling, and electrical
accessories while the truck is shut off (also called “hotel
load”). The benefits of reducing the idling of the truck
engine were calculated separately, and are shown in
Table 19.

52 R e s u l t s
R E D U C I N G Heavy-Duty Long Haul Combination Truck Fuel Consumption and CO2 Emissions
12
13
FIGURE
FIGURE
RESULTS FROM MODERATE DRAG AND ROLLING RESISTANCE REDUCTION
RESULTS FROM ADVANCED DRAG AND ROLLING RESISTANCE REDUCTION
Package 2: Cd Sweep: Crr=0.0055, GVW = 80klbs
5
5.5
6
6.5
7
7.5
8
8.5
9
0.35 0.4 0.45 0.5 0.55 0.6 0.65
Coefficient of Drag (-)
Fue
l Ec
on
om
y, M
PG
0
5
10
15
20
25
30
35
40
Perc
en
t Fu
el S
ave
d
Fuel Economy (mpg)
Percent Fuel Saved vs Package 1
Package 2 Cd = 0.5
Coefficient of Drag (-)
Fue
l Ec
on
om
y, M
PG
Perc
en
t Fu
el S
ave
d
Package 3: Cd Sweep with Crr=0.0045, GVW = 80klbs
5
5.5
6
6.5
7
7.5
8
8.5
9
0.3 0.35 0.4 0.45 0.5 0.55 0.6 0.650
5
10
15
20
25
30
35
40
Fuel Economy (mpg)
Percent Fuel Savedvs Package 1
Package 3 Cd = 0.4

53R e s u l t s
Package 3 – Advanced Aerodynamic Drag and Rolling Resistance Improvements
The next set of technologies evaluated included advanced
technologies to improve aerodynamic drag such as sealing
the gap between the cab and the trailer and significantly
improved tires with lower rolling resistance.
Package 3 includes a reduction in the aerodynamic
drag coefficient to 0.4 from the original value of 0.63
(Package 1) and 0.5 (Package 2). Interviews with engineers
responsible for aerodynamic design of trucks indicate that
a reduction in drag coefficient to 0.4 will not be possible by
adding new features to current designs of trucks and trail-
ers. A complete redesign of the truck/trailer combination
vehicle will probably be required, and this is likely to have
significant impacts on the operational characteristics of the
vehicle. The coefficient of rolling resistance is reduced to
0.0045 from the original value of 0.0068 and the Package
2 value of 0.0055. Figure 13 shows the results in terms of
MPG and percent fuel savings for an 80,000 pound truck.
The results presented in Figure 13 show that the reduction
in rolling resistance coefficient from 0.0068 to 0.0045
provides a fuel savings and CO2 reduction of 10.6 percent,
while the reduction in aerodynamic drag coefficient from
0.63 to 0.4 provides an additional 14.1 percent fuel
savings. The overall benefit of Package 3 is a 24.7 percent
fuel savings and CO2 reduction compared to the baseline
truck.
It is interesting to note that a long/heavy combination
vehicle with Package 3 characteristics and a GCW of
140,000 pounds provides nearly identical fuel consumption
and GHG emissions to a Package 1 (baseline) vehicle at
80,000 pounds GCW. In other words, a turnpike double
combination vehicle with Package 3 aerodynamic and
rolling resistance features can deliver nearly twice the
freight of a baseline Package 1 vehicle at approximately
equal fuel consumption.
This package also includes a diesel powered APU which
reduces idling. The emissions and fuel consumption
reductions associated with reduced idling for the package
are shown in Table 19.
Package 4 – Hybrid Electric System
Two hybrid systems were evaluated in combination with
Package 3, the aggressive aero and rolling resistance
improvements. Each version of the hybrid drivetrain also
includes electrification of engine accessories, which is
assumed to reduce total engine-driven accessory load from
5 kW to 3 kW. The first hybrid system to be evaluated was
a series hybrid. Despite several iterations in the model-
ing effort, favorable fuel consumption results were not
achieved. There is a commercial series hybrid system under
development, but the control strategy being developed for
this system was not available for evaluation during the time
of this study.
Results are presented here for the second hybrid system
evaluated - a parallel hybrid similar in concept to those
used in many passenger cars. A 50 kW motor/generator
was installed along with a battery storage system. At first,
the motor/generator was coupled to the engine flywheel.
Later, the motor/generator was moved to the transmis-
sion input, on the other side of the clutch. This allowed
the engine to be disconnected from the driveline during
regenerative braking, increasing the energy that can be
recaptured. Putting the electric motor on the transmission
side of the clutch also allows the truck to move at low
speeds on electric power alone.

54 R e s u l t s
R E D U C I N G Heavy-Duty Long Haul Combination Truck Fuel Consumption and CO2 Emissions
Initially, a 10 kW-hr battery pack was used with the parallel
hybrid system. Later, a 4 kW-hr battery pack was simulated
in order to reduce the system cost and weight. The fuel
economy penalty for the smaller battery pack was small,
so the smaller 4 kW-hr battery pack was chosen for the
final configuration. The results for the final parallel hybrid
system are shown in Table 11.
If the hybrid system is applied to the baseline Package 1
vehicle, the savings will be 5.5 percent. In addition to the
improvement in fuel economy during the long-haul drive
cycle, a hybrid can be used to handle hotel loads such
as heating, cooling, and electricity when the vehicle is
stationary. Instead of idling all night, the engine can be run
for a few minutes each hour to charge the battery pack.
This hotel load reduction nearly doubles the fuel consump-
tion benefit of hybridizing a tractor-trailer, increasing its fuel
consumption benefit to 10 percent. An APU is not included
in Package 4, since the battery storage of power takes care
of idle reduction.
Package 5 – Mechanical Turbocompound
A mechanical turbocompound system was added to
the GT-POWER engine model in this study. The vehicle
model includes Package 3, the aggressive aero and rolling
resistance package. Variable valve actuation was added to
11
12
13
TABLE
TABLE
TABLE
PARALLEL HYBRID SYSTEM MODELING RESULTS
MECHANICAL TURBOCOMPOUND SYSTEM RESULTS
ELECTRICAL TURBOCOMPOUND SYSTEM RESULTS
VEHICLE MASS BASELINE MPG (PKG. 3) HYBRID MPG % REDUCTION IN FUEL
CONSUMPTION & CO2 EMISSIONS65,000 lbs. 7.95 8.46 6.0%
80,000 lbs. 7.18 7.61 5.6%
140,000 lbs. 5.20 5.50 5.5%
VEHICLE MASS BASELINE MPG (PKG. 3)
MECHANICAL TURBO-COMPOUND MPG
% REDUCTION IN FUEL CONSUMPTION & CO2 EMISSIONS
65,000 lbs. 7.95 8.15 2.4%
80,000 lbs. 7.18 7.36 2.4%
140,000 lbs. 5.20 5.35 2.9%
VEHICLE MASS BASELINE MPG (PKG. 3)
ELECTRICAL TURBO-COMPOUND MPG
% REDUCTION IN FUEL CONSUMPTION & CO2 EMISSIONS
65,000 lbs. 7.95 8.30 4.2%
80,000 lbs. 7.18 7.49 4.1%
140,000 lbs. 5.20 5.43 4.2%

55R e s u l t s
help provide more exhaust energy to the power turbine
within the constraints of maintaining the efficiency of the
base engine. The results are summarized in Table 12.
The performance of a turbocompound system is sensitive
to engine load, so better results are achieved with heaver
truck combinations. If mechanical turbocompound is
applied to the 80,000 pound baseline Package 1 vehicle,
the reduction in fuel consumption and GHG emissions will
be 2.9 percent.
Package 6 – Electric Turbocompound
An electrical turbocompound system was added to the
GT-POWER engine model in this study. The vehicle
model includes Package 3, the aggressive aero and rolling
resistance package. Electric turbocompound also includes
electrification of engine accessories, which is assumed
to reduce the total accessory load from 5 kW to 3 kW.
Variable valve actuation was added to help provide more
exhaust energy to the power turbine within the constraints
of maintaining the efficiency of the base engine. The results
are summarized in Table 13.
Most of the difference in performance between the
mechanical and electrical turbocompound is due to the
conversion of accessories from mechanical to electric drive.
Another factor is that the electric generator allows the
power turbine to run at a speed independent of the engine
crankshaft speed, which slightly improves the efficiency
of the turbocompound system itself. If electric turbocom-
pound is applied to the baseline Package 1 vehicle, the fuel
and CO2 savings will be 4.2 percent.
Package 7 – Variable Valve Actuation
VVA was explored in the GT-POWER engine model
within the constraints of maintaining the baseline diesel
combustion cycle. Maintaining both baseline EGR flow
rates and high load air/fuel ratios was also a requirement,
in order to maintain baseline NOx and PM emissions.
Within these constraints, only about a 1 percent reduc-
tion in fuel consumption could be obtained with VVA,
regardless of the performance of the baseline vehicle. One
percent reductions were found both against a Package
1 baseline, as well as against a Package 3 baseline. This
result is consistent with results achieved by diesel engine
manufacturers who have evaluated VVA. Alternative
engine cycles were not evaluated because there is not
enough information available in the literature to allow
modeling of the alternative cycles.
Package 8 – Bottoming Cycle
This technology is described in Appendix A along with a
detailed description of the modeling approach used in this
study. The GT-POWER model of the engine was combined
with a spreadsheet-based bottoming cycle model to create
an engine fuel map. In the vehicle model, the bottoming
cycle fuel map was combined with the aggressive aero and
rolling resistance improvements of Package 3. In addition,
the bottoming cycle includes electric accessories, since the
bottoming cycle expander is connected to a generator. As
in other packages using electrically powered accessories,
it was assumed that the accessory power demand on the
engine is reduced from an average of 5 kW to 3 kW.
Because the bottoming cycle relies on EGR and exhaust
heat, anything that reduces exhaust temperature will
reduce the performance of the bottoming cycle. Therefore,
features such as turbocompound, VVA, and low tempera-
ture EGR should not be combined with a bottoming cycle.
These features were all evaluated in combination with a
bottoming cycle, and they all provided reduced bottoming
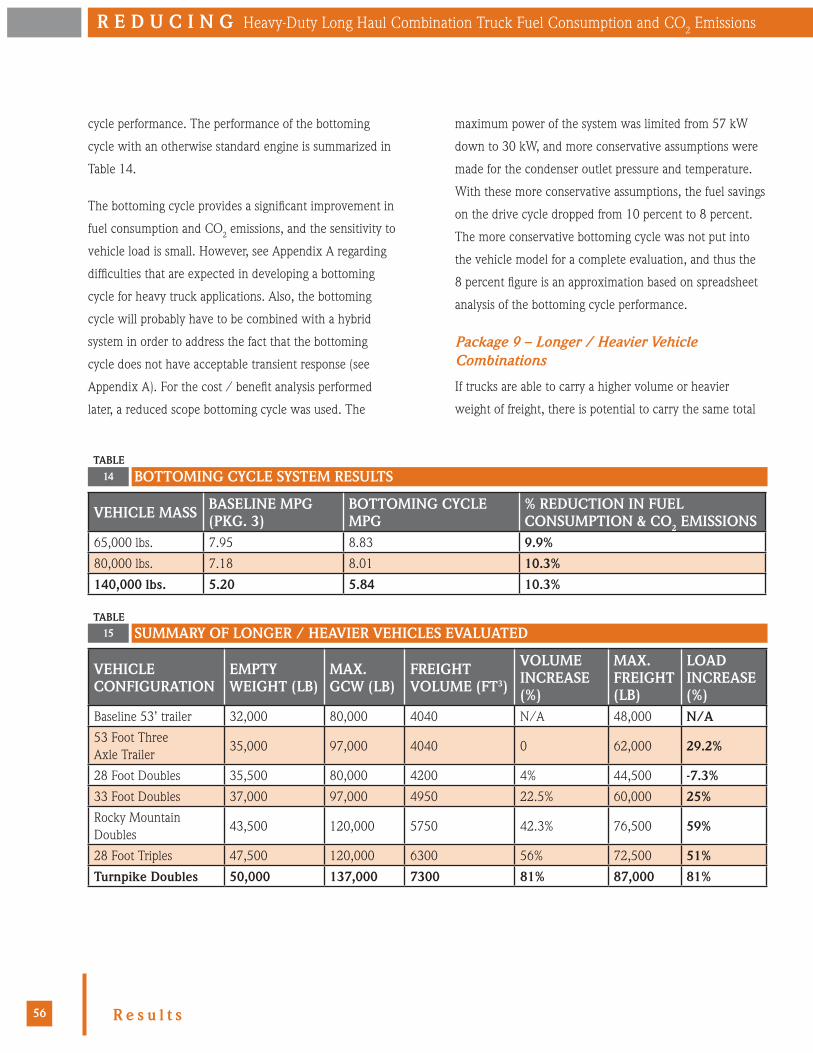
56 R e s u l t s
R E D U C I N G Heavy-Duty Long Haul Combination Truck Fuel Consumption and CO2 Emissions
cycle performance. The performance of the bottoming
cycle with an otherwise standard engine is summarized in
Table 14.
The bottoming cycle provides a significant improvement in
fuel consumption and CO2 emissions, and the sensitivity to
vehicle load is small. However, see Appendix A regarding
difficulties that are expected in developing a bottoming
cycle for heavy truck applications. Also, the bottoming
cycle will probably have to be combined with a hybrid
system in order to address the fact that the bottoming
cycle does not have acceptable transient response (see
Appendix A). For the cost / benefit analysis performed
later, a reduced scope bottoming cycle was used. The
14
15TABLE
TABLE
BOTTOMING CYCLE SYSTEM RESULTS
SUMMARY OF LONGER / HEAVIER VEHICLES EVALUATED
VEHICLE MASS BASELINE MPG (PKG. 3)
BOTTOMING CYCLE MPG
% REDUCTION IN FUEL CONSUMPTION & CO2 EMISSIONS
65,000 lbs. 7.95 8.83 9.9%
80,000 lbs. 7.18 8.01 10.3%
140,000 lbs. 5.20 5.84 10.3%
VEHICLE CONFIGURATION
EMPTY WEIGHT (LB)
MAX. GCW (LB)
FREIGHT VOLUME (FT3)
VOLUME INCREASE (%)
MAX. FREIGHT (LB)
LOAD INCREASE (%)
Baseline 53’ trailer 32,000 80,000 4040 N/A 48,000 N/A
53 Foot Three Axle Trailer
35,000 97,000 4040 0 62,000 29.2%
28 Foot Doubles 35,500 80,000 4200 4% 44,500 -7.3%
33 Foot Doubles 37,000 97,000 4950 22.5% 60,000 25%
Rocky Mountain Doubles
43,500 120,000 5750 42.3% 76,500 59%
28 Foot Triples 47,500 120,000 6300 56% 72,500 51%
Turnpike Doubles 50,000 137,000 7300 81% 87,000 81%
maximum power of the system was limited from 57 kW
down to 30 kW, and more conservative assumptions were
made for the condenser outlet pressure and temperature.
With these more conservative assumptions, the fuel savings
on the drive cycle dropped from 10 percent to 8 percent.
The more conservative bottoming cycle was not put into
the vehicle model for a complete evaluation, and thus the
8 percent figure is an approximation based on spreadsheet
analysis of the bottoming cycle performance.
Package 9 – Longer / Heavier Vehicle Combinations
If trucks are able to carry a higher volume or heavier
weight of freight, there is potential to carry the same total

57R e s u l t s
amount of freight using less fuel. There is also a potential
of reducing the number of trucks required to move a given
amount of freight. This offers the potential for congestion
reduction in locations where truck traffic makes up a
substantial portion of overall traffic.
This study evaluated a number of existing truck combina-
tions that are used in some areas of the United States today.
This approach allowed for a direct comparison with the
efficiency of existing vehicle combinations. The range of
vehicle combinations modeled is presented in Table 15.
All of the combinations listed in the table use a standard
tandem axle tractor. The Rocky Mountain double is a
combination of a 48 foot trailer with a second 28 foot
trailer. A turnpike double is a combination of two 48 foot
trailers. In the summer of 2009, the Canadian province of
Ontario started a one year pilot program to evaluate the
safety and performance of combination vehicles consisting
of one tractor with two 53 foot trailers. This 53 foot double
is larger than any vehicle evaluated in this study.
Some of the trailer configurations shown in Table 15
provide significant increases in either freight volume,
maximum freight load, or both. Each configuration was
evaluated on the long-haul vehicle cycle described in
Chapter 2 with a range of freight densities (and thus a
range in GCW). Results are presented in terms of ton-miles
per gallon in Figure 14 for varying freight densities. On the
sloped portion of each curve, the vehicle load is volume
limited. In other words, the trailer is completely full,
14FIGURE
EFFICIENCIES FOR LONGER/HEAVIER VEHICLES EVALUATED
Package 9 Trailer Configurations at 500 HP
100
150
200
250
6 7 8 9 10 11 12 13 14 15 16Freight Density (lb/ft3)
Ton
s-M
iles
/ G
allo
n F
ue
l x
Std 53 ft 5 Axle 28 ft Double
33 ft Double 28 ft Triple
Rocky Mntn Double Turnpike Double
53 ft 6 Axle
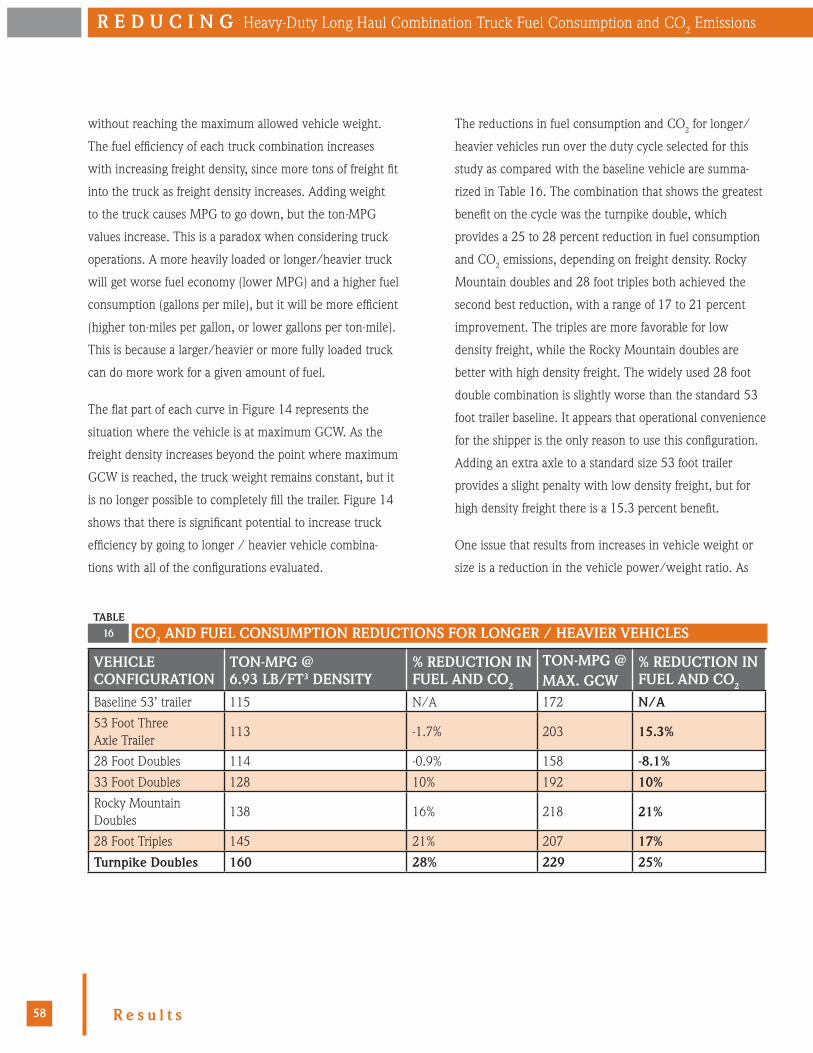
58 R e s u l t s
R E D U C I N G Heavy-Duty Long Haul Combination Truck Fuel Consumption and CO2 Emissions
without reaching the maximum allowed vehicle weight.
The fuel efficiency of each truck combination increases
with increasing freight density, since more tons of freight fit
into the truck as freight density increases. Adding weight
to the truck causes MPG to go down, but the ton-MPG
values increase. This is a paradox when considering truck
operations. A more heavily loaded or longer/heavier truck
will get worse fuel economy (lower MPG) and a higher fuel
consumption (gallons per mile), but it will be more efficient
(higher ton-miles per gallon, or lower gallons per ton-mile).
This is because a larger/heavier or more fully loaded truck
can do more work for a given amount of fuel.
The flat part of each curve in Figure 14 represents the
situation where the vehicle is at maximum GCW. As the
freight density increases beyond the point where maximum
GCW is reached, the truck weight remains constant, but it
is no longer possible to completely fill the trailer. Figure 14
shows that there is significant potential to increase truck
efficiency by going to longer / heavier vehicle combina-
tions with all of the configurations evaluated.
The reductions in fuel consumption and CO2 for longer/
heavier vehicles run over the duty cycle selected for this
study as compared with the baseline vehicle are summa-
rized in Table 16. The combination that shows the greatest
benefit on the cycle was the turnpike double, which
provides a 25 to 28 percent reduction in fuel consumption
and CO2 emissions, depending on freight density. Rocky
Mountain doubles and 28 foot triples both achieved the
second best reduction, with a range of 17 to 21 percent
improvement. The triples are more favorable for low
density freight, while the Rocky Mountain doubles are
better with high density freight. The widely used 28 foot
double combination is slightly worse than the standard 53
foot trailer baseline. It appears that operational convenience
for the shipper is the only reason to use this configuration.
Adding an extra axle to a standard size 53 foot trailer
provides a slight penalty with low density freight, but for
high density freight there is a 15.3 percent benefit.
One issue that results from increases in vehicle weight or
size is a reduction in the vehicle power/weight ratio. As
16TABLE
CO2 AND FUEL CONSUMPTION REDUCTIONS FOR LONGER / HEAVIER VEHICLES
VEHICLE CONFIGURATION
TON-MPG @ 6.93 LB/FT3 DENSITY
% REDUCTION IN FUEL AND CO2
TON-MPG @ MAX. GCW
% REDUCTION IN FUEL AND CO2
Baseline 53’ trailer 115 N/A 172 N/A
53 Foot Three Axle Trailer
113 -1.7% 203 15.3%
28 Foot Doubles 114 -0.9% 158 -8.1%
33 Foot Doubles 128 10% 192 10%
Rocky Mountain Doubles
138 16% 218 21%
28 Foot Triples 145 21% 207 17%
Turnpike Doubles 160 28% 229 25%

59R e s u l t s
17TABLE
RESULTS FOR LONGER/HEAVIER TRUCKS WITH HIGHER ENGINE POWER
VEHICLE CONFIGURATION
BASELINE ENGINE POWER (HP)
HIGHER ENGINE POWER (HP)
% FUEL AND CO2 PENALTY FOR HIGHER POWER
6.93 LB/FT3 HI DENSITY53 Foot Three Axle Trailer
500 600 3.6% 3.8%
Turnpike Doubles 500 700 6.7% 4.8%
the power/weight ratio declines, the vehicle can suffer
from a decrease in acceleration capability, and the speed
that can be maintained on hills will decline. This could
result in trucks becoming more of an impediment to light
vehicle traffic, particularly where there are limited opportu-
nities for cars to pass slower trucks. One way to deal with
this issue is to increase engine power to make up for some
or all of the loss in power/weight ratio.
A concern with higher engine power is the potential to
reduce the fuel savings achieved by the longer / heavier
vehicle combination. To address this concern, SwRI
modeled two vehicle configurations with higher engine
power. The two selected configurations were the three axle
53 foot trailer and the turnpike doubles. For the three axle
50 foot trailer, the maximum GCW is 97,000 pounds, a
21 percent increase over the standard 80,000 pounds.
The GT-POWER engine model was scaled up to 600 horse-
power (HP), 20 percent more than the standard model, to
match the higher GCW.
For the turnpike doubles vehicle combination, the maxi-
mum GCW is 137,000 pounds, a 71 percent increase over
the standard GCW of 80,000 pounds. It is not practical to
increase engine power to this extent, so the GT-POWER
engine model was scaled up to 700 HP, a 40 percent
increase. This power level will still suffer some accelera-
tion and hill climbing performance penalty compared to
the baseline truck. Table 17 shows the effect of increased
power on the efficiency of the two truck combinations.
Increasing engine power to limit vehicle performance losses
does increase fuel consumption, but the penalty is much
smaller than the benefit in overall fuel consumption that
can be achieved with larger / heavier vehicle combina-
tions. Even if power/weight ratios are held constant to
maintain vehicle performance, the longer/heavier vehicles
do save fuel and reduce CO2 emissions. The results in Table
17 can also be used to evaluate the potential savings of
engine downsizing. A downsizing of 20 percent results in
less than a 4 percent fuel savings, and even a 40 percent
downsizing only saves 5 to 6 percent.
The fuel consumption and CO2 emissions increases that
result from moving to higher horsepower engines are
depicted graphically in Figure 15. In Figure 15 the results
for the longer/heavier trucks with the baseline engine are
shown in the solid orange and dotted gray lines. The results
for the longer/heavier trucks with the higher horsepower
engines are shown in the solid gray and dotted orange
lines. The graph in Figure 15 shows the penalty in ton
miles of freight moved per gallon of fuel that results from

60 R e s u l t s
R E D U C I N G Heavy-Duty Long Haul Combination Truck Fuel Consumption and CO2 Emissions
the use of higher horsepower engines in these two trucks.
In this analysis, several simulations using the longer/
heavier truck settings were run over the drive cycle with
several different assumptions about freight densities.
All of the results reported in this section for longer/
heavier combination vehicles include Package 3 rolling and
aerodynamic features as a baseline. If long/heavy combina-
tions are built using baseline Package 1 technology, the fuel
economy (MPG) and ton-miles per gallon numbers will be
lower, and fuel consumption will be higher. However, the
basic relationships regarding percent fuel and CO2 saved
for each variation compared to the baseline will be almost
identical. All of the longer heavier truck configurations
15
FIGURE
RESULTS FOR LONGER / HEAVIER TRUCKS WITH INCREASED ENGINE POWER AT DIFFERING FREIGHT DENSITIES
1 0 0
1 5 0
2 0 0
2 5 0
6 7 8 9 1 0 1 1 1 2 1 3 1 4 1 5 1 6
Ton
s M
iles
pe
r G
allo
n F
ue
l
Turnpike Do uble a t 7 0 0 Hp
Turnpike Do uble a t 5 0 0 Hp
5 3 ft, 6 Ax le a t 6 0 0 Hp
5 3 ft, 6 Ax le a t 5 0 0 Hp
Package 9: Penalty for Higher Power Engines
Freight Density (lb/ft^3)
assume the use of additional safety features in the cost
analysis, including anti lock disk brakes, vision assists, and
stability controls.
Package 10 – Lower Road Speed
Road speed reduction is a well known method for improv-
ing vehicle fuel economy. In this study, the standard engine
model was combined with the vehicle model of Package
3, the aggressive aero and rolling resistance improvements.
The drive cycle was modified by imposing a range of speed
limits onto the cycle: no limit, 65 MPH, 60 MPH, and
55 MPH. As the cruise road speed is reduced, the vehicle
specification normally will be changed to match. The rear
axle ratio will be increased numerically to provide higher

61R e s u l t s
engine RPM at a given road speed. This is done to
maintain the ability to climb a grade without the need for
downshifting.
The study looked at two scenarios for lower road speed.
In the first scenario, the road speeds were reduced, but no
vehicle changes were made to compensate. In the second
scenario, the final drive ratio (rear axle ratio) was modified
to match the reduction in road speed for the 60 and 55
MPH routes. This is done to maintain the match between
engine and road speeds. Figure 16 summarizes the results
for the two vehicle scenarios.
On the driving cycle evaluated, this package yielded only a
1 percent benefit for reducing road speed to 65 MPH. This
is because the drive cycle includes only a small portion at
speeds above 65 MPH. The step down from 65 to 60 MPH
provides an additional improvement of almost 3 percent.
This step influences all of the cruise portions of the drive
cycle. There is no evident penalty for matching the final
drive ratio to maintain engine RPM at 60 MPH. At 55
MPH, fuel consumption improves by an additional 3.6 to
4.4 percent from 60 MPH. The overall fuel savings caused
by reducing maximum route speed from 70 MPH to 55
MPH is 7.3 to 8.1 percent, depending on whether or not
the final drive ratio is adjusted. The improvement would be
larger if the baseline vehicle route included more time at
70 miles per hour.
Overall, a benefit of about 0.7 percent per MPH speed
reduction is seen. This is less than the 1 percent per MPH
figure often quoted in the literature. There are two reasons
16FIGURE
IMPACT OF LOWER ROAD SPEED ON FUEL CONSUMPTION
Perc
en
t Fu
el S
ave
d
Package 9: Fuel Savings vs Speed Limit
Speed Limit (mph)
0
1
2
3
4
5
6
7
8
9
5 0 5 5 6 0 6 5 7 0 7 5
wrt P a cka ge 3 - no cha nge in FD
wrt P a cka ge 3 - w ith cha nge in FD
62 R e s u l t s
R E D U C I N G Heavy-Duty Long Haul Combination Truck Fuel Consumption and CO2 Emissions
that may explain the discrepancy. The figures quoted in the
literature are normally for steady state operation on level
ground. The drive cycle used in this study included some
suburban type driving at speeds below 55 MPH, as well as
some driving on grades. The differences in drive cycle will
tend to reduce the benefit of lower road speed. In addition,
the vehicle model used for this study included aggressive
aerodynamic and rolling resistance reductions, which also
tends to reduce the benefit of lower road speed. If the same
analysis was performed on a Package 1 baseline vehicle,
the benefit is expected to be closer to 0.9 percent per MPH
speed reduction.
One issue must be dealt with in considering lower road
speed limits for trucks. As the speed limit goes down, the
travel time will increase. If the lower speed only applies
to a small portion of the route, the increase in travel time
will be minimal. This is the case for situations where traffic
or road conditions often limit the truck’s speed to a value
below the road speed limit. Vehicles in this situation will
also experience little savings in fuel. However, on long-haul
routes where traffic density is relatively low, a reduction
in cruise speed will translate directly into increased trip
time. These vehicles will experience a significant fuel
consumption and CO2 reduction. To some extent, this will
also mean that more trucks are required to deliver a given
amount of freight over a given distance per day. Overly
aggressive road speed limits will increase truck traffic
density and will impede traffic flow in areas where passing
is difficult.
Package 11 – Advanced EGR Cooling
By reducing the temperature of the EGR stream, lower
NOx can be achieved. If NOx is held constant, the timing
can be advanced to improve engine’s brake specific fuel
consumption in g/kW-hr. In this study, an auxiliary EGR
cooler was added to the GT-POWER engine model to drop
the EGR stream temperature by about 60º C from the
standard engine values. For example, at 1400 RPM and
60 percent load, the EGR temperature coming out of the
EGR cooler was reduced from 167º C down to 104º C. In a
vehicle, this would be accomplished with a secondary EGR-
to-air heat exchanger at the front of the vehicle. There are
some significant practical concerns about condensation that
need to be resolved in order to use this approach in vehicle
applications. It is important not to have condensation
coming into the turbocharger compressor inlet, in order to
avoid corrosion of the compressor wheel.
According to the GT-POWER engine model, fuel consump-
tion and CO2 emissions can be reduced by 1 to 1.2 percent
using advanced EGR. The performance advantage is largest
for lightly loaded trucks, since the brake specific fuel
consumption benefit is largest at light loads.
The drive cycle used in this study
included some suburban type driving
at speeds below 55 MPH, as well as
some driving on grades. The differences
in drive cycle will tend to reduce the
benefit of lower road speed. In addition,
the vehicle model used for this study
included aggressive aerodynamic and
rolling resistance reductions, which
also tends to reduce the benefit of lower
road speed.

63R e s u l t s
Because low temperature EGR going into the cylinder also
reduces the temperature of the exhaust coming out of the
cylinder, low temperature EGR does not work well with
systems that extract energy from the exhaust, such as
turbocompound or a bottoming cycle.
Maximum Reduction CombinationsTo determine the potential benefit of combining several
vehicle and engine technologies, additional simulation runs
were made using selected combinations of technologies
evaluated in Packages 1 through 11. Three combinations
were selected for the maximum reduction packages. One
combination was built to evaluate the maximum benefit
that could be obtained within the constraint of current
vehicle size and weight limits. This becomes Package
12. The second configuration added a longer / heavier
vehicle combination to Package 12 and substituted electric
turbocompound for the bottoming cycle to reduce cost and
technical risk. This is Package 13. Finally, a version was
created to represent a maximum technology version of
Package 13. This is Package 14, which also includes
the bottoming cycle and the longer / heavier vehicle
combination.
Several of the technologies evaluated did not provide
enough benefit to be included in the maximum technology
combinations. The Package 2 aerodynamic and rolling
resistance improvements were left out in favor of the more
advanced Package 3, which is expected to be available by
2017. Mechanical turbocompound (Package 5) was left out
in favor of the higher performing electric turbocompound.
Advanced EGR (Package 11) was not used, because it
reduced the energy available for the exhaust energy
recovery systems.
VVA was used in combination with turbocompound, but
not with the bottoming cycle. This is due to the tendency
to reduce exhaust temperature available to the bottom-
ing cycle system. VVA is used with the turbocompound
system, where it can be tuned to help the overall system
performance. From Package 10 (reduced road speed) a 60
mph speed was chosen. The 60 MPH speed was selected
to minimize the potential increase in traffic density that
a low road speed could cause, as well as to minimize the
disruption to normal traffic flow that slow-moving trucks
would cause. In addition, the 60 MPH speed would not
require such a large re-gearing of the trucks as would
be necessary with the 55 MPH option. These three
combination packages, along with the modeling results
are provided below.
Package 12 – Standard Trailer Maximum Technology Combination
Package 12 includes the following technologies in a
standard 80,000 pound GCW, standard 53 foot trailer
vehicle combination:
• Aggressive aero and rolling resistance reduction,
without the APU (idle reduction is achieved using the
hybrid system) (Package 3)
• Parallel electric hybrid drivetrain with electrified
accessories (Package 4)
• Bottoming cycle (Package 8)
• 60 MPH road speed governor (Package 10)
This configuration represents the maximum improvement
in fuel consumption and CO2 emissions that is technically
64 R e s u l t s
R E D U C I N G Heavy-Duty Long Haul Combination Truck Fuel Consumption and CO2 Emissions
feasible within the 2017 timeframe of the study for a
standard 53 foot, 80,000 pound GCW truck. This
conclusion was based on conversations with experts in
industry, Steering Committee members, and experts at
national laboratories.
Package 13 – Longer/Heavier Truck Lower Cost Maximum Technology Combination
Package 13 includes a Rocky Mountain double vehicle
configuration. The Rocky Mountain double is a combina-
tion of one 48 foot trailer with one 28 foot trailer. This
approach is more conservative than the use of turnpike
doubles (two 48 foot trailers), but the safety and political
implications of going to such a large vehicle combination
could be a considerable challenge. Package 13 includes:
• Aggressive aero and rolling resistance reduction,
without the APU (idle reduction is achieved using the
hybrid system) (Package 3)
• Parallel electric hybrid drivetrain with electrified
accessories (Package 4)
• Turbocompound (Package 6)
• VVA (Package 7)
• Rocky Mountain doubles (Package 9)
• 60 MPH road speed governor (Package 10)
This configuration represents the maximum improvement
in fuel consumption and CO2 emissions in the 2017 time-
frame at a lower cost and technical risk than package 14.
Package 14 – Longer/Heavier Truck Higher Cost Maximum Technology Combination
This configuration is a modification of Package 13. The
bottoming cycle is regarded as having a high technical risk,
higher cost, and having other difficult issues to overcome
before a production feasible system could be made
available. Package 14 replaces the electric turbocompound
system and VVA modeled in package 13 with a bottoming
cycle. Otherwise, Package 14 matches 13:
• Aggressive aero and rolling resistance reduction,
without the APU (idle reduction is achieved using the
hybrid system) (Package 3)
• Parallel electric hybrid drivetrain with electrified
accessories (Package 4)
• Bottoming cycle (Package 8)
• Rocky Mountain doubles (Package 9)
• 60 MPH road speed governor (Package 10)
This configuration represents the maximum improve-
ment in fuel consumption and CO2 emissions that can be
achieved with reasonable technical risk within the 2017
time frame of the study. This package is basically a long/
heavy version of Package 12.

65R e s u l t s
Maximum Technology Combination Results
Fuel and CO2 savings have been calculated for vehicles
operating at several freight densities. First, calculations
were run at a freight density of 8.17 lb/ft3. This density
results in a GCW of 65,000 pounds in a standard 53 foot
tractor/trailer combination vehicle. The results were
also calculated for freight density greater than 13.3 lb/
ft3, which will result in all vehicles evaluated running at
their maximum legal GCW. The low density calculation is
typical of “cubed out” applications (the trailer is completely
full with low density freight, and the vehicle is under the
GCW limit), while the high density calculation represents
“grossed out’ applications (the trailer is not filled, but the
truck is at the GCW limit). The results are summarized in
Table 18.
Package 14 provides the best results of all the simulated
packages. Package 14 includes both the longer / heavier
vehicle combination and a bottoming cycle. According to
the simulation results, a maximum of 50 percent reduction
in fuel consumption and CO2 emissions is possible. Package
13, which substitutes a less technically risky turbocom-
pound system for the bottoming cycle, also provides
impressive results, only 3.1 to 3.3 points less than Package
18TABLE
MAXIMUM TECHNOLOGY COMBINATION MODELING RESULTS
TECHNOLOGY PACKAGEFUEL SAVINGS / CO2 REDUCTION
GROSSED OUT DENSITY > 13.3 LB/FT3
CUBED OUT DENSITY = 8.17 LB/FT3
12 – 53 foot trailer, bottoming cycle 36.9% 38.6%
13 – Turnpike doubles, electric turbocompound 46.9% 44.2%
14 – Turnpike doubles, bottoming cycle 50% 47.5%
14. Package 12 offers less potential benefit, but the overall
savings are still over 36 percent compared to the baseline
vehicle. These results make it clear that by combining
several fuel saving technologies, a dramatic improvement
in vehicle fuel efficiency is possible.
Estimate of Fuel Consumption and Emissions Reduced from Idling Reduction The potential reductions in CO2 and fuel consumption that
result from the use of idling reduction technologies were
not estimated as part of the simulation modeling, since the
drive cycle used in the simulation modeling did not include
an idle segment. Idling reduction benefits were calculated
outside of the simulation model. Total gallons of fuel used
on road per year per truck was estimated to be 20,000 gal-
lons of fuel, a typical value for a long haul truck that travels
120,000 miles per year. Next, the idle fuel consumption
rate in gallons per hour was multiplied by an assumed
1,800 hours of idling per year per truck. For the purposes
of this analysis, the total fuel consumption per truck
per year was calculated by summing the fuel consumed
annually during idling and driving. The reduction in fuel
consumption attributable to idling reduction technologies

66 R e s u l t s
R E D U C I N G Heavy-Duty Long Haul Combination Truck Fuel Consumption and CO2 Emissions
was estimated by assuming all of the 1,800 hours of engine
idling would be replaced by a more efficient auxiliary
power unit or, in the case of the hybrid, a battery that is
periodically recharged by the engine. The results of this
analysis are shown in Table 19. The table shows results
only for those technology packages that include idle reduc-
tion technology such as a diesel APU or a hybrid system.
These are packages 2, 3, 4, 12, 13, and 14.
The next sections describe the results of the package cost
and cost benefit analyses conducted by TIAX using the
SwRI modeled results for the different technology
combinations. In addition, results from the TIAX fleet
19TABLE
FUEL CONSUMPTION AND CO2 REDUCTIONS FROM IDLE REDUCTION TECHNOLOGIES
PACKAGE # DESCRIPTION% FUEL CONSUMPTION AND CO2 REDUCTION COMPARED TO PACKAGE 1
% FUEL CONSUMPTION AND CO2 REDUCTION COMPARED TO PACKAGE 1 - WITH IDLING REDUCTION
2 SmartWay 14% 17.8%
3Advanced SmartWay
24.7% 27.9%
4 Hybrid 5.5% 10%
12Maximum reduction combination 1
36.9% grossed out 38.6% cubed out
38.6% grossed out 40.2% cubed out
13Maximum reduction combination 2
46.9% grossed out 44.2% cubed out
48.7% grossed out 46.2% cubed out
14Maximum reduction combination 3
50% grossed out 47.5% cubed out
50.6% grossed out 48.3% cubed out
model analysis estimating the amount of fuel use and
CO2 emissions that could be avoided with introduction of
heavy-duty efficiency improving technologies is provided.
Cost AnalysisAs described in Chapter 2, TIAX estimated costs for each
of the technology packages modeled by SwRI. Appendix
B provides detailed costs for components in each of the
technology packages and Appendix C presents a detailed
explanation of how these costs were developed. Table 20
presents a summary of these costs.

67R e s u l t s
20TABLE
SUMMARY OF COSTS ESTIMATED FOR EACH OF THE TECHNOLOGY PACKAGES
PACK-AGE
PACKAGE NAME DESCRIPTION
CAPITAL COST INTRO YEAR
O&MCOMMENTS
INITIAL FLOOR ($/MI)1 Baseline – – – – – –
2 SmartWay
Improved aero & tires, idle reduction, and advanced lubricants
$22,930 $22,930 2009 ($0.004)
Cost information from EPA’s SmartWay website. Costs are based on three trailers and one tractor and include an APU.
3Advanced SmartWay
Generation 2 aero & tires
$66,530 $44,730 2015 ($0.004)Estimates based on feedback from experts and TIAX cost estimates
4 HEV Parallel hybrid $35,000 $23,000 2012 ($0.006)
Based on component-level estimates with assumed RPE of 2.0, and early-stage demonstration vehicles.
5Mech. Turbo (MTC)
Includes VVA $5,300 $2,650 2010 ($0.003) Based on industry experi-ence with small turbines
6Elec. Turbo (ETC)
Includes accessory electrificaiton & VVA
$13,100 $6,550 2012 ($0.007)
Component-level estimates similar to those used for the HEV and mechanical turbocompounding.
7 VVA Var. valve actuation $600 $300 2009 $0.000 $50 incremental cost per cylinder
8Bottoming Cycle (BC)
Steam cycle, ~30 kW
$30,200 $15,100 2015 ($0.003)
TIAX bottom-up estimate based on prospective bill-of-materials and assumed RPE of 2.0.
9Rocky Mt Double
48’ trailer + 28’ trailer
$25,000 $17,500 2015 ($0.002)
TIAX estimate based on assumed engine, safety, and brake upgrades, and increased number of trailers.
10 60 MPH 60 MPH speed limit $0 $0 2010 $0.000 Assumes no additional cost
11 Adv. EGRLow-temp EGR system
$1,500 $750 2010 $0.000 Estimated cost of added cooling and pumps.
12Max Tech, Std. trailer
SW2 + 60 MPH + HEV + BC
$117,330 $71,630 2015 ($0.013)Sum of individual packages
13Low Cost Tech. Combination
SW2 + 60 MPH + HEV + ETC + RMD
$124,830 $80,380 2015 ($0.012)Sum of individual packages
14Max Tech, Long trailer
SW2 + 60 MPH + HEV + BC + RMD
$142,330 $89,130 2015 ($0.015)Sum of individual packages

68 R e s u l t s
R E D U C I N G Heavy-Duty Long Haul Combination Truck Fuel Consumption and CO2 Emissions
Cost Benefit Analysis
As described in Chapter 2, TIAX calculated the net cost
of ownership over a 3 year and a 15 year time horizon.
They assumed two fuel costs: 1) $2.50 per gallon of diesel
fuel; and 2) $3.53 per gallon of diesel fuel. TIAX used a 7
percent discount rate for the analysis. Figure 17 summa-
rizes the results of the cost benefit analysis for the 15 year
ownership case assuming a $2.50 per gallon price of diesel
fuel and a $3.53 per gallon price of diesel fuel. Negative
numbers indicate a cost savings for the vehicle owner. As
can be seen from Figure 17, at both $2.50 per gallon of
diesel fuel and at $3.53 per gallon of diesel fuel, for 12 of
the 13 technology packages, owners will recoup the entire
incremental vehicle purchase price in fuel savings; the
exception is the hybrid package when evaluated at $2.50
per gallon, which has a slightly positive lifetime cost of
ownership.
17FIGURE
15 YEAR NET COST OF OWNERSHIP FOR TECHNOLOGY PACKAGES
-$100
-$80
-$60
-$40
-$20
$0
$20
$40
Smartw
ay
Adv. Sm
artway
HEV (I
ncl. Idle
reductio
n)
Mech. T
urbo
Elec. T
urbo
VVA Botto
ming C
ycle
Rocky M
t Double
60 M
PH
Adv. EG
R
Tech. C
ombo 1
Tech. C
ombo 2
Tech. C
ombo 3
Ne
t Co
st o
f Ow
ners
hip
(10
00 $
)
EIA Low Fuel Price ($2.50/gal)
EIA High Fuel Price ($3.53/gal)
The technology packages that provide the greatest savings
over the 15 year period are Advanced SmartWay, Rocky
Mountain double, and the three maximum technology
combination packages shown at the far right of the graph.
Figure 18 summarizes the results for the 3 year owner-
ship scenario assuming both a cost of $2.50 per gallon of
diesel and $3.53 per gallon of diesel. As can be seen from
Figure 18, the net cost of ownership is much higher than
in the 15 year case, since the vehicle owner recoups only
the amount of money saved from lower fuel consumption
over a period of 3 years instead of a 15 year period. Over
a period of 3 years at $2.50 a gallon, 5 technology pack-
ages pay for themselves. The remaining 8 do not. The five
include: mechanical turbocompounding, variable valve
actuation, Rocky Mountain doubles, 60 MPH speed, and
advanced EGR. In the 3 year net cost of ownership case at
a diesel price of $3.53 per gallon, 9 technology packages
are cost effective and 4 are not.

69R e s u l t s
18FIGURE
3 YEAR NET COST OF OWNERSHIP FOR TECHNOLOGY PACKAGESN
et C
ost
of O
wne
rshi
p (
1000
$)
-$25
-$15
-$5
$5
$15
$25
$35
Smartway
Adv. Smartway
HEV (Incl. Idle reduction)
Mech. Turbo
Elec. Turbo
VVABottom
ing Cycle
Rocky Mt Double
60 MPH
Adv. EGR
Tech. Combo 1
Tech. Combo 2
Tech. Combo 3
EIA Low Fuel Price ($2.50/gal)
EIA High Fuel Price ($3.53/gal)
A more detailed discussion of these results is included in
Appendix C.
Figure 19 depicts the relative benefits and costs of each
of the evaluated technology packages for the 3 year and
15 year ownership period at $2.50 per gallon of diesel
fuel. As this figure suggests, for both ownership scenarios,
the technology packages span a broad range of reduction
potential and costs. For example, in the three year cost of
ownership scenario, packages providing CO2 reductions
from 2.5 percent to 28 percent encompass a net cost range
from approximately negative $10,000 (i.e., net consumer
savings) to positive $10,000. Clearly, a least-cost solution
would favor the technology packages in the lower end of
this cost range. Nevertheless, for purposes of this study, we
have assumed a technology supply curve1 that includes all
of the evaluated technology packages. This allows for the
fact that least-cost technologies may not be viable for some
segments of the market and that vehicle manufacturers
may therefore choose not to implement specific CO2
reduction solutions across the entire vehicle class. For
example, because approaches such as longer and heavier
trailers or technologies such as turbocompounding may be
limited to a subset of heavy-duty vehicles, a supply curve
constructed solely on the basis of least-cost solutions may
understate the actual cost of class-wide CO2 reduction
solutions. Including all of the evaluated technology
packages in the development of the supply curve provides
a more robust indication of likely class-wide impacts.
The diamonds in Figure 19 represent the CO2
reduction supply curve for long-haul trucks assuming a
1 A supply curve indicates the relationship between CO2 emissions reduction potential and cost.

70 R e s u l t s
R E D U C I N G Heavy-Duty Long Haul Combination Truck Fuel Consumption and CO2 Emissions
3 year ownership period from the time of initial purchase.
The net cost is equal to the additional purchase price of
the truck minus the fuel cost savings over three years,
discounted at 7 percent. Each point represents the net
cost of ownership for a different technology or technology
combination. Presumably, a rational fleet operator would
adopt technologies that offer net negative ownership. As
indicated, at least one technology provides CO2 and fuel
consumption reductions of about 20 percent are obtainable
for a net negative cost (i.e., three year fuel savings exceed
incremental technology costs). The figure also includes
a second set of cost of ownership calculations to show
the results of a sensitivity analysis in which the assumed
time of ownership is 15 years rather than three. With the
longer vehicle life (shown as squares in Figure 17), most
technology packages reflect negative net costs. The package
which fails to pay back over 15 years is the parallel hybrid
system. The hybrid system can only be made to pay back in
combination with other more cost-effective or with higher
fuel costs; for example, it may interact synergistically with
electrified waste-heat recovery systems, such as electric
turbocompounding. The economics of the hybrid system
are hampered both by the duty cycle used in the study,
which offers only modest benefits; and battery replace-
ment, which is assumed to be required every six years2.
In the 15 year ownership scenario, estimated lifetime cost
savings can be as high as $56,000 for a vehicle achieving
approximately a 28 percent reduction in CO2 and fuel
consumption. Assuming a three year ownership scenario,
costs are estimated to be $10,000 for the same level of
emission reduction.
19FIGURE
NET VEHICLE COSTS ASSUMING 3 AND 15 YEARS OF OWNERSHIP
Ne
t Co
st o
f Ow
ners
hip
(1,
000
$)
-$60
-$50
-$40
-$30
-$20
-$10
$0
$10
$20
$30
$40
0% 10% 20% 30% 40% 50% 60%
% Reduction in CO2 and Fuel Consumption
3-Yr Cost of Ownership
15-Yr Cost of Ownership
2 At this point, battery replacement intervals and strategy are highly speculative as there is not any operational data by which to judge.

71R e s u l t s
20FIGURE
BREAKDOWN OF FUEL CONSUMED IN CLASS 8 TRUCKS
0
5,000
10,000
15,000
20,000
25,000
30,000
35,000
40,000
45,000
Fue
l use
(M
ga
llons
)
2007 2010 2013 2016 2019 2022 2025 2028
Other Class 8Regional Haul CombinationLong Haul Combination
Fleet-Wide Fuel Consumption and CO2 Emissions Benefit AnalysisThe last step in the study was to estimate the potential to
reduce CO2 emissions and fuel consumption in the U.S.
heavy-duty long haul fleet from the introduction of existing
and emerging technologies. A detailed discussion of these
results, as well as fuel price sensitivity analysis, is included
in Appendix D. TIAX conducted this analysis using a
propriety fleet model. In the fleet model, technologies are
adopted as they become cost effective.
The analysis includes that portion of the fuel consumed
by long haul tractors hauling dry box van trailers. A
breakdown of fuel use in different types of Class 8 trucks
is shown in Figure 20 to illustrate the fraction of Class 8
fuel consumed in long haul tractor trailer trucks. As can
be seen from the figure, approximately 45 percent of total
Class 8 truck fuel is consumed in the long haul box trailer
fleet segment – shown in the gray wedge. The TIAX fleet
model focuses on this fleet segment because many of the
technologies modeled by SwRI would not offer the same
benefits over a regional duty cycle, and many aerodynamic
devices cannot be implemented on irregularly shaped
trailer bodies.
The red wedge shows the amount of fuel consumed
annually by regional and local heavy-duty trucks hauling
combination trucks. The yellow wedge represents the
combined fuel use of all remaining combination trucks,
such as flatbed or lowboy trailers.
In the next section, the TIAX analysis of potential CO2 and
fuel consumption reductions that could be realized with

72 R e s u l t s
R E D U C I N G Heavy-Duty Long Haul Combination Truck Fuel Consumption and CO2 Emissions
introduction of efficiency improving technologies into the
U.S. fleet of long haul combination vehicles is presented.
Results for the analysis are shown for a 15 year payback
case, a 3 year payback case, and a maximum technology
penetration case.
Fleet Wide Analysis Assuming 15 Year Payback Requirement
Figure 21 depicts the total potential fuel and CO2 emissions
savings in the U.S. heavy-duty long-haul box trailer fleet,
assuming penetration of technologies modeled by SwRI in
this study. The analysis estimates the technology adoption
that could occur over a 20 year timeframe, assuming that
all technologies which offer a 15 year payback are fully
adopted by the fleet. Each wedge in the graphic represents
a different technology modeled by SwRI and the benefit
associated with adoption of that technology into the U.S.
heavy-duty long-haul fleet. The analysis does not assume
that any existing vehicles are retrofitted with technologies,
with the exception of a 60 MPH speed limit.3 As such, the
figure could underestimate the total potential emissions
and fuel use avoided from heavy-duty technologies
evaluated in this study.
In this scenario, by 2022, 30 percent of total U.S. heavy-
duty long-haul combination truck CO2 and fuel consump-
tion could be avoided. By 2030, the fuel savings grows to
39 percent of the total for this fleet segment.
Fleet Wide Analysis Assuming 3 Year Payback Requirement
The second fleet-wide analysis evaluated the fuel con-
sumption and CO2 emission reductions that would be
achieved using the assumptions described for Scenario B
in Chapter 2. In this scenario, technologies are adopted by
an increasing fraction of the fleet as the time to payback
decreases; if the time to payback is three years, 50 percent
of the fleet will adopt a technology. Figure 22 graphically
presents the results of this scenario. In this case, fuel use
and CO2 emissions from the long-haul truck fleet are
reduced by 11 percent, or by 1.8 billion gallons, by 2022
and by 3 billion gallons by 2030. In contrast to the 15 year
payback scenario, the year-by-year fuel reductions projected
in the 3 year payback case slow the growth in total fleet
fuel use, but do not appreciably reduce consumption below
present-day levels.
In both the scenarios described above, fleet fuel use begins
to grow again starting in 2022 to 2024 due to the lack of
new technology after 2017. This is due to the constraints
of this study that required a design specification for
technologies evaluated.
Fleet Wide Analysis Assuming Maximum Technology Case
In the maximum technology case, TIAX used a diesel price
of $4.40 per gallon and a 15 year payback requirement.
At this diesel price, all of the technologies evaluated by
SwRI were adopted by the fleet model, resulting in CO2
and fuel consumption reductions even greater than the
15 year payback case. In this case, 44 percent of U.S. long
haul combination truck fuel use and CO2 emissions were
reduced in 2030. The higher fuel price allowed for the
hybrid technology to be adopted into the fleet model.
Impact on Regional Heavy-Duty Trucks and
Alternative Tractor-Trailer Configurations
As discussed in Chapter 2, our analysis focused on long-
haul combination trucks. The fuel used by Class 8 long
haul trucks represents a subset of total, lifetime Class 8
3 Speed governors are already widely deployed, but are typically fixed to a higher speed limit.

73R e s u l t s
21
22
FIGURE
FIGURE
15 YEAR PAYBACK REQUIREMENT FLEET ANALYSIS
3 YEAR PAYBACK REQUIREMENT FLEET ANALYSIS
SW160 MPH R.M. Double
SW2M Turbo
E Turbo
0
2
4
6
8
10
12
14
16
18
20
2007
2008
2009
2010
2011
2012
2013
2014
2015
2016
2017
2018
2019
2020
2021
2022
2023
2024
2025
2026
2027
2028
2029
2030
Fue
l Use
d/A
void
ed
(B
Ga
l)
HEV+B. Cycle
HEV+ETurbo
Bottoming Cycle
E Turbo
M Turbo
SW2
R.M. Double
60 MPH
SW1
Fuel Used
2022: 4.7B Gallons of Fuel Saved
(30% below the base case)
SW1
60 MPH
R.M. DoubleSW2
M TurboE Turbo
2022: 1.8B Gallons of Fuel Saved(11% below the base case)
0
2
4
6
8
10
12
14
16
18
20
2007
2008
2009
2010
2011
2012
2013
2014
2015
2016
2017
2018
2019
2020
2021
2022
2023
2024
2025
2026
2027
2028
2029
2030
Fue
l Use
d/A
void
ed
(B
Ga
l)
HEV+B. Cycle
HEV+ETurbo
Bottoming Cycle
E Turbo
M Turbo
SW2
R.M. Double
60 MPH
SW1
Fuel Used

74 R e s u l t s
R E D U C I N G Heavy-Duty Long Haul Combination Truck Fuel Consumption and CO2 Emissions
combination truck fuel usage since long-haul trucks are
typically sold into regional service after several years. As
such, our analysis does not attempt to account for fuel
savings benefits that accrue once the same truck migrates
from long-haul operation to regional service. Nor does it
attempt to account for technology adoption in the
approximately 40 percent of the Class-8 heavy-duty fleet
that does not pull van-type trailers (e.g., tankers, flat beds,
etc). These two fleet segments can leverage many of the
approaches that have been analyzed for long-haul trucking,
but also present unique challenges that are expected to
reduce the potential benefits.
The main challenges with transferring technologies from
the long-haul trucking fleet to trucks operating in regional
service include: different duty cycles and the greater variety
of trailers in the regional fleet. For example, in the case of
the non-van trailer segment of the fleet, the non-uniformity
of the trailer would prevent full implementation of the
aerodynamic improvements specified in Packages 2 and
3. As such, the projected benefits of the improved aerody-
namic packages would be lower in these applications than
in a long-haul truck. However, some other technologies
that were examined in this study could likely offer very
similar benefits as with the long-haul truck.
Because regional service trucks frequently operate on a
more stop and go type cycle than do long-haul trucks, some
of the most cost-effective benefits for long-haul trucks –
such as aerodynamic and rolling resistance improvements –
will not achieve the same benefit over a regional duty
cycle. While the tires-and-wheels benefits would carry over
to other duty cycles, aerodynamic benefits will be reduced
under lower speed operation. On the other hand, given the
frequent periods of inefficient low-load operation, in-use
idling, and frequent braking, hybrids are likely to perform
significantly better in regional service than in long-haul
operation.
Approaches for addressing these challenges in the regional
fleet could include: (1) developing regional-haul specific
retrofit packages, such as limited aero, or a start-stop idle
reduction mode; and (2) implementing regional haul-
specific fuel consumption packages in the approximately
20 percent of new tractor sales that enter the regional fleet
directly.
ConclusionsThe results of the analysis suggest that existing and
emerging automotive technologies can achieve substantial
and cost-effective reductions in heavy-duty vehicle CO2
emissions and fuel consumption in the 2012 to 2017 time-
frame. Specifically, CO2 and fuel consumption emissions
from heavy-duty vehicles can be reduced up to 20 percent
with technologies such as mechanical turbocompounding
The results of the analysis suggest that
existing and emerging automotive
technologies can achieve substantial and
cost-effective reductions in heavy-duty
vehicle CO2 emissions and fuel
consumption in the 2012 to 2017
timeframe.

75R e s u l t s
and moderate aerodynamic drag and rolling resistance im-
provements. CO2 and fuel consumption can be reduced up
to 50 percent in the 2017 timeframe using more advanced
technologies. Policy changes to require reduced road speed
or allow for increased weight or length vehicles were not
evaluated as part of this study but would likely be required
to reach the 50 percent reduction level. Assuming a three
year vehicle ownership period and a diesel fuel price of
$2.50 per gallon, this study found that five of the technol-
ogy packages capable of achieving these reductions would
result in net cost savings to the vehicle owner, taking into
account both incremental technology costs and fuel savings
over the three year period, and three others achieve cost
savings over a four year period. The analysis shows that
some of the technology combinations that provide the
greatest reductions would not be adopted into the fleet
assuming a three year payback requirement. This indicates
that given the short payback period demanded by the
trucking industry, most of these technologies will not be
adopted into the U.S. fleet absent regulation or incentives.
With a longer vehicle ownership period of 15 years, net
savings are between $30,000 and $42,000 for owners of
vehicles achieving CO2 and fuel consumption reductions
in the 40 to 50 percent range. Aggressive introduction
of the technologies and strategies modeled in this study
into the U.S. heavy-duty long haul fleet between now and
2030 would lead to an estimated eight billion gallons of
diesel fuel saved annually beginning in 2030, with lesser
reductions being achieved as soon as 2012. The 8 billion
gallons of fuel saved annually represents approximately
44 percent of the total projected business as usual fuel
consumption and CO2 emitted by the heavy-duty long haul
fleet. Cumulative fuel savings between now and 2030
would equal approximately 90 billion gallons of diesel fuel.
Approximately 97 million metric tons of CO2 emissions
could be reduced beginning in 2030. Cumulative CO2
emissions avoided between now and 2030 would equal
1.1 billion metric tons.


A P P E N D I X A
77
APPENDIX AA P P E N D I X Aa p p e n d i x aa p p e n d i x a
a p p e n d i x aAppendix A
R E D U C I N GHeavy-Duty Long Haul Combination
Truck Fuel Consumption and CO2 Emissions
APPENDIX A: Description of Heavy-Duty Technologies and Modeling Approach
A-1TABLE
TECHNOLOGIES AND OPERATIONAL MEASURED CONSIDERED
EFFICIENCY MEASURE: DESCRIPTION AND CO2/FUEL SAVINGS METHOD INCLUDED IN
PACKAGESENGINE TECHNOLOGIES
1Improved SCR Conversion Efficiency
After treatment improvements that allow increased engine efficiency in EPA 2010-compliant engines.
NO
2Engine Friction Reduction
Improved engine bearings to allow lower viscosity oil, reducing energy lost to friction.
2, 3, 12, 13,14
3Mechanical Turbocompound
An extra turbine in the exhaust harvests waste energy and delivers it to the crankshaft.
5
4Electric Turbocompound
An extra turbine in the exhaust harvests waste energy and generates electricity to power accessories or propel the vehicle.
6, 13
5Dual Stage Turbocharging
Twin-turbocharging with charge-air cooling for increased efficiency. EGR pump required to meet emissions.
NO
6 EGR PumpMechanical pump that moves exhaust into the intake manifold. Required in high-efficiency turbocharger or dual-stage turbocharger applications to meet emissions.
NO
7Variable Valve Actuation (VVA)
Advanced control of engine valves to improve efficiency, power, and emissions.
5, 6, 7, 13
8 Advanced VVAAdvanced control of engine valves, used to create new combustion cycles such as in the Sturman Digital Engine. Insufficient data available.
NO
9Alternative Combustion Modes
Low temperature combustion (LTC), homogeneous charge compression ignition (HCCI), and premixed charge compression ignition (PCCI) to reduce emissions at certain operating points.
NO
10Insulated Exhaust Ports
To increase exhaust temperature for improved energy recovery in a turbocompound system or a bottoming cycle.
5, 6, 8, 12, 13, 14
11 Bottoming CycleAn additional thermal cycle, such as a steam turbine, added to harness waste energy from hot engine exhaust.
8, 12, 14
TRANSMISSION SYSTEM AND ELECTRIFICATION TECHNOLOGIES
12Automated Manual Transmission
A manual transmission clutched and shifted by a computer for maximum efficiency and reduced driver variability.
NO
13Moderate Hybrid Systems
A heavy-duty hybrid with moderate power level and moderate energy storage - a stop start system.
NO
14Aggressive Hybrid Systems
A heavy-duty hybrid with significant power and energy storage capability, studied in both parallel and series architectures.
4, 12, 14
15Accessory electrification
Powering water pumps and air compressors with electricity instead of using traditional belts or gears.
4, 6, 12, 13, 14
16Component Friction Improvements
Use of lower viscosity lubricants in the transmission, differentials, and axles.
2, 3, 12, 13, 14

78 A p p e n d i x A
R E D U C I N G Heavy-Duty Long Haul Combination Truck Fuel Consumption and CO2 Emissions
EFFICIENCY MEASURE: DESCRIPTION AND CO2/FUEL SAVINGS METHOD INCLUDED IN
PACKAGESAERODYNAMIC DRAG AND ROLLING RESISTANCE REDUCTION TECHNOLOGIES
17Fully aerodynamic mirrors
Mirrors shaped and positioned to minimize drag. 2, 3, 12, 13, 14
18 Cab side extenders Designed to reduce the tractor-trailer gap. 2, 3, 12, 13, 14
19Integrated sleeper cab roof fairings
Large fairings to match the roof height of a truck to the height of the trailer.
2, 3, 12, 13, 14
20Aerodynamic front bumper
For smoother airflow around the hood and wheels. 2, 3, 12, 13, 14
21 Full fuel tank fairings To smooth airflow over fuel and air tanks. 2, 3, 12, 13
22Trailer side skirt fairings
To deflect air away from the trailer undercarriage. 2, 3, 12, 13, 14
23 Trailer gap fairing Mounted to the trailer to reduce the tractor-trailer gap. 3, 12, 13, 14
24Rear-mounted trailer fairing
Sometimes called a ‘boat tail,’ used to reduce drag at the rear of the trailer.
3, 12,13, 14
25Undercarriage Flow Device (UFD)
To further deflect air away from the trailer’s undercarriage. 3, 12, 13, 14
26Advanced tractor-trailer gap seal
A device that creates a nearly-complete closure of the tractor-trailer gap.
3, 12, 13, 14
27Advanced rear-mounted trailer fairing
To significantly reduce drag at the rear of the trailer. 3, 12, 13, 14
28 Mass ReductionLightweight materials and component elimination to increase payload capacity and reduce the power required to accelerate or climb hills.
1
29Reduced Rolling Resistance
Lowering the rolling resistance of tires through improved design and inflation to reduce the power required to move the truck.
2, 3, 12, 13, 14
OPERATIONAL MEASURES
30 Lower Road Speed Reducing speed improves vehicle fuel economy and CO2 emissions. 10, 12, 13, 14
31Increased Vehicle Size and/or Weight
Changes to weight limits, number of trailers, and truck design to increase cargo capacity while preserving road safety and infrastructure.
9, 13, 14
IDLE REDUCTION TECHNOLOGIES
32
Auxiliary Power Unit (APU) or hybrid system that provides power while the engine is off
Provides the driver with overnight cabin heat or cooling and with electricity without idling the main diesel engine
2, 3, 4, 12, 13, 14
A-1TABLE
TECHNOLOGIES AND OPERATIONAL MEASURED CONSIDERED (continued)

79A p p e n d i x A
A-1FIGURE
GT-POWER MODEL OF THE VOLVO D13 ENGINE
Engine System Technologies and ModelingThe engine system was modeled using a commercial one
dimensional computational fluid dynamics code called GT-
POWER. This code is widely used in the engine industry
to predict engine performance characteristics. As described
in Chapter 2, the Volvo D13 engine was chosen for use
in this study. Chapter 2 also describes the validation work
that was done to calibrate the model with measured engine
data, and to demonstrate that the model provides an
adequate simulation of the actual 2007 model Volvo D13.
See Figure A-1 above for a layout of the GT-POWER model
of the baseline Volvo D13 engine.
Improved SCR Conversion Efficiency
SCR systems typically have a NOx conversion efficiency of
75 to 90 percent, which means that 75 to 90 percent of

80 A p p e n d i x A
R E D U C I N G Heavy-Duty Long Haul Combination Truck Fuel Consumption and CO2 Emissions
the NOx in the exhaust is successfully reduced to N2 and
O2. There is considerable work going on in the industry to
improve conversion efficiency and improve the durability
of SCR systems so that conversion efficiency is maintained
over the life of the system. For a given NOx emissions
standard, higher conversion efficiency in the SCR system
will allow a higher engine-out NOx level. As the permitted
engine-out NOx level increases, better fuel economy and
lower CO2 emissions can be achieved.
Modeling Approach:
For the 2010 version of the D13, Volvo plans to add SCR to
the existing emissions control hardware, which consists of
a diesel particulate filter for PM control and EGR for NOx
control. SwRI assumed that the 2010 version of the engine
will maintain the current engine-out NOx level, which will
require an SCR efficiency of about 82 percent. By retaining
the current engine-out NOx, the engine also retains its
current fuel consumption and CO2 emission levels. It may
prove possible to improve the performance of the SCR sys-
tem, so that engine-out NOx levels can be increased. Other
design and calibration tweaks may lead to small efficiency
gains. Depending on how much conversion efficiency can
be achieved from the SCR system, an improvement of up to
3 percent could be achieved in fuel consumption and CO2
emissions. Since it is not clear what increase in SCR system
performance will prove possible over the next few years,
and there are no published data that provide good guidance
on this topic, SwRI did not make projections based on
improved SCR performance. Therefore, our model of the
2010 engine matches the efficiency and CO2 emissions of
the 2007 engine exactly.
Engine Friction Reduction
Development of engine main and rod bearings is under
way to allow the use of lower viscosity engine oils. The
lower viscosity oil will in turn reduce engine friction in the
bearings and between the piston, rings, and liner. About a
10 percent reduction in engine friction is expected if the
current standard 15W40 engine lube oil can be replaced
by a 5W30 grade. This change has already been made
in Europe, where $9/gallon fuel pays for the savings in
a single oil change interval. In order to go to the lower
viscosity oil, synthetic is required. This roughly doubles
the cost of an oil change. A potential issue should be noted
here: if the increased cost of low viscosity oil does not
pay for itself in fuel savings within the oil change interval,
operators may go back to using higher viscosity oil. Given
the need to maintain the production of higher viscosity oils
for older engines, it is likely that several grades of oil will
be available on the market for many years.
Modeling Approach:
There is no straightforward way of modeling engine friction
reduction. Sophisticated bearing analysis can be used to
predict friction in bearings, and other analyses can be used
to predict friction between pistons and liners, in the valve
train, and in other engine components. For this study,
we made the assumption that a 10 percent reduction
in friction could be achieved, and then did some simple
calculations to predict the benefit. At a typical cruise
condition, engine friction consumes around 10 percent of
the crankshaft output power. A 10 percent reduction in this
friction will thus provide a 1 percent improvement in fuel
efficiency and CO2 emissions. This effect was judged to be
small enough to leave out of the rest of the study.
81A p p e n d i x A
Improved Air Handling Efficiency
Almost all heavy-duty diesel engines sold in North America
today use high pressure loop EGR for control of engine-out
NOx levels. Engines from Caterpillar are the sole excep-
tion, and these engines are being withdrawn from the truck
market at the end of 2009. To get EGR to flow from the
exhaust manifold to the intake manifold, the pressure in
the exhaust manifold must be higher than the pressure in
the intake manifold. When the exhaust manifold pressure
is higher than the intake manifold pressure, this is called
having a negative Δp, where Δp refers to the difference
in pressure between the intake and exhaust manifolds.
High efficiency turbos naturally produce a positive Δp over
much of the operating range, so turbocharger efficiency is
intentionally compromised in order to facilitate EGR flow.
If it is possible to produce EGR flow without reducing
turbo efficiency, the overall engine efficiency will increase.
Some potential ways of achieving improved air handling
efficiency are listed below.
Modeling Approach:
Both mechanical and electrical turbocompound options
were modeled and optimized using GT-POWER.
Mechanical Turbocompound
A power turbine is added to the exhaust system behind
the normal turbocharger. The backpressure created by the
power turbine allows the use of a very efficient conven-
tional turbo, while still providing the negative Δp required
to support EGR flow. This improves the air handling
efficiency. The power turbine is geared to put power back
into the crankshaft. A fluid coupling is normally used to
isolate the power turbine from engine crankshaft torsional
vibration. The fluid coupling also allows for some variation
in the ratio of crankshaft speed to power turbine speed.
The basic effect of the power turbine is to add exhaust
restriction, which enables EGR flow. This causes the engine
pumping loss to increase to overcome the restriction
imposed by the power turbine. However, unlike a simple
exhaust restriction, the power turbine can recover energy
from the exhaust, which more than compensates for the
pumping loss created by the added restriction.
Modeling Approach:
A power turbine was added to the engine. It was geared to
the engine through a fluid coupling to prevent damage to
the gears from torsional vibration. Several scenarios were
simulated:
• Variable geometry primary and power turbines
• Fixed geometry (higher efficiency) primary and
power turbines
• A range of power turbine flow capacities
• Variable valve actuation
The basic strategy used in the modeling study was to
achieve as large as possible fuel efficiency improvement
at part load cruise conditions. As a result, the maximum
power from the turbocompound was somewhat less
than that found in some production applications, where
increased engine power is often an important goal. On
the baseline engine, a variable geometry turbocharger is
required to control EGR flow. With the turbocompound,
this proved unnecessary. Fixed geometry turbines proved to
be the most efficient approach, with the added advantage
of lower cost and complexity. A relatively small power
turbine flow capacity was selected, in order to improve
performance under part-load conditions.

82 A p p e n d i x A
R E D U C I N G Heavy-Duty Long Haul Combination Truck Fuel Consumption and CO2 Emissions
Variable valve actuation (VVA) can be used to provide more
exhaust energy to the turbos (higher exhaust temperature)
under part load conditions, with little penalty to base
engine efficiency. Because this approach proved effective,
the results reported in Chapter 3 include the use of VVA.
Overall, the best results were obtained with fixed geometry
primary and power turbines, a relatively small power
turbine flow capacity, and VVA.
In the course of developing the turbocompound model,
it was important to retain the engine-out NOx and PM
performance of the baseline engine. Therefore, care was
taken to maintain air/fuel ratios and EGR flow at values
very close to the baseline engine. Many iterations of the
model were run to achieve the desired results.
Electric Turbocompound
This is the same concept as the mechanical turbocom-
pound, except the power is fed into an electrical machine.
Electric turbocompound is ideal as a power source for a
hybrid system, and will in fact require a hybrid system or
at least an electric motor connected to the driveline, since
the power generated will be more than the accessories can
consume under at least some operating conditions.
Modeling Approach:
The electric turbocompound benefits from the use of an
electrical generator connected to the power turbine. This
eliminates the need to have the power turbine and engine
speeds match at a fixed ratio. As a result, the electric
turbocompound is slightly more efficient. In addition, the
electrification of accessories was combined with electric
turbocompound. This reduced the assumed accessory
load from 5 kW to 3 kW, providing a significant efficiency
benefit.
The GT-POWER engine model started with the mechanical
turbocompound results, and then the system was re-
optimized for the conversion to electrical turbocompound
configuration. Once again, considerable care was taken
to maintain air/fuel ratios and EGR flow, to avoid any
increase in NOx or PM emissions.
There is one aspect where the electric turbocompound is
less efficient than the mechanical system. Because there
are losses in generating and in using electricity, a smaller
portion of the shaft power from the power turbine actually
appears at the wheels of the vehicle.
Dual Stage Turbocharging with Intercooling
Modern engines require high pressure ratios. The pressure
ratio is the ratio between intake manifold pressure and
ambient pressure, and values up to 4 are common in pro-
duction engines. One negative effect of high pressure ratio
is that it limits the efficiency of a turbocharger. Using two
turbos in series with intercooling between the two turbos
and aftercooling between the second turbo and the intake
manifold would allow higher turbocharger efficiency. This
approach requires an EGR pump, turbocompound system,
or other device to facilitate EGR flow. The combination of
two engine turbochargers with an EGR pump or turbocom-
pound results in serious cost, complexity, and packaging
issues. This is a lot of hardware to fit on the engine.
Modeling Approach:
This technology approach was not modeled in GT-POWER.
Based on simple spreadsheet calculations, it appears that
the efficiency of an engine can be improved by about
2 percent by the use of dual stage turbocharging with
intercooling. However some, if not all, of this improvement
would be lost in powering an EGR pump. Packaging two

83A p p e n d i x A
turbocharger stages with a turbocompound power turbine
was judged to be very difficult from a cost and packaging
standpoint, so this approach was not evaluated.
High Efficiency Turbocharging
This is the same concept as dual stage turbocharging, but
within the limits of a single stage turbocharger. Because an
efficient turbocharger produces a positive Δp, this approach
will require an EGR pump, turbocompound system, or
other device to facilitate EGR flow.
Modeling Approach:
This is the same concept as dual stage turbocharging,
but within the limits of a single stage turbocharger. This
technology approach was not modeled as a stand-alone
technology in GT-POWER. Based on simple calculations, it
appears that the efficiency of the engine can be improved
by about 1 percent by the use of high efficiency single
stage turbocharging. This benefit would be lost when
an EGR pump is added to provide adequate EGR flow.
However, this approach is attractive in combination with
turbocompound, where an EGR pump is not needed. A
high efficiency single stage turbocharger was used with
both mechanical and electric turbocompound versions as
described in previous sections.
EGR Pump
An EGR pump can facilitate EGR flow and help control the
flow rate to achieve the desired level of EGR. This device
makes EGR flow independent of the engine’s Δp, which
allows the use of high efficiency air handling systems.
Unfortunately, an EGR pump consumes power, which at
least partially cancels the efficiency gain from the improved
air handling system. Also, an EGR pump adds cost, weight,
and complexity to the engine package.
Modeling Approach:
An EGR pump was not modeled using GT-POWER. Based
on simple spreadsheet calculations, the EGR pump proved
less attractive than turbocompound as a way of providing
the negative Δp required to drive EGR flow.
Variable Valve Actuation
In gasoline engines, variable valve actuation can have a
huge impact on engine performance and fuel economy.
VVA can be used to improve engine breathing, and thus
power, and/or to reduce the pumping losses caused by
throttling the intake. In heavy-duty diesel engines, the
potential benefits of VVA are much more limited. This is
partly due to the much narrower operating speed range
of heavy-duty diesel engines. VVA allows flexibility to
operate the turbochargers at a more efficient point on the
compressor map. This may allow the use of a more efficient
turbo with a narrower map. VVA would only be used at
appropriate speed/load conditions. When applying VVA to
a heavy-duty diesel, the designer needs to consider how
to maintain adequate SCR temperature at low loads to
prevent an increase in NOx emissions. VVA can also be
used to improve the power output of a turbocompound
system by leaving more energy (temperature) in the
exhaust stream.
Modeling Approach:
Variable valve actuation was extensively modeled in GT-
POWER, both as a stand-alone feature and in combination
with turbocompounding and the bottoming cycle. SwRI
modeled VVA as a way of optimizing the standard diesel
combustion cycle. The ability of VVA to improve diesel
engine efficiency as a stand-alone feature is rather limited.
This is not surprising; several engine makers have evalu-
ated VVA with the conventional diesel cycle and found
84 A p p e n d i x A
R E D U C I N G Heavy-Duty Long Haul Combination Truck Fuel Consumption and CO2 Emissions
little benefit. There are examples in the literature where
dramatic improvements are claimed from modified engine
operating cycles that VVA can enable. The Sturman “Digital
Engine” is one example. Unfortunately, the available
literature does not provide enough detail to allow SwRI to
attempt to duplicate the claimed results.
Low Temperature Combustion / HCCI / PCCI
Low temperature combustion (LTC), homogeneous
charge compression ignition (HCCI), and premixed charge
compression ignition (PCCI) are all “alternative” combus-
tion modes that can be used in place of standard diesel
combustion. All of these modes have been developed in
an effort to reduce NOx output, and in the case of HCCI,
PM output as well. If NOx is not an issue, these alternative
combustion modes generally suffer from lower thermal
efficiency than conventional diesel combustion. However,
conventional diesel combustion suffers substantial thermal
efficiency degradation at low engine-out NOx levels, so
these alternative modes can become attractive. The perfor-
mance of these alternative combustion modes is duty cycle
dependent: most of the potential is at low load. Typically,
alternative combustion modes can be used up to 30 per-
cent or 40 percent load. Therefore, alternative combustion
modes will have little impact on the fuel economy or CO2
emissions of an engine that operates most of the time at
higher loads, such as in a long haul truck application. PCCI
does not require hardware changes unlike HCCI. Hardware
changes required for HCCI include additional injector(s).
Control changes include careful control of injection timing
and precise control of EGR flow and air/fuel ratio in the
cylinder.
Modeling Approach:
These “alternative” combustion modes are intended to
provide reduced engine-out NOx. They can reduce the
need for aftertreatment systems, and this is the main
reason for considering alternative combustion modes.
These modes do not offer a fuel consumption or CO2
benefit over standard diesel combustion combined with
SCR, so the decision was made not to pursue these modes
for this project. Another issue is that it is extremely difficult
to accurately model these combustion modes, and a full
three dimensional computational fluid dynamics model is
required.
Engine Thermal Management Improvements
The goal of thermal management features is to retain
energy in the gas flow through the engine rather than allow
heat to be lost to the engine coolant, to air under the hood,
or to other loss paths. This approach is only of value if the
retained energy is going to be used in some way, or if it is
necessary to reduce underhood temperatures to protect
certain components from heat related damage.
In the 1980s, there was a lot of research in the engine
industry on the subject of “adiabatic engines.” The
term adiabatic refers to a thermodynamic process such
as compression or expansion in the cylinder that takes
place without any heat transfer between the working
gas and the combustion chamber walls. The idea behind
the adiabatic engine concept was that by insulating the
combustion chamber, the engine would reject less heat and
have a higher efficiency. Unfortunately, it turned out that
heat rejection to the coolant was not reduced as much as
expected, and efficiency actually fell. Heat transfer between
the working gas in the cylinder and the ceramic coated
85A p p e n d i x A
cylinder walls actually increased. The energy diverted from
the cooling system went out the exhaust. This experience
makes it clear that attempts to implement simple
thermodynamic concepts in an engine can have
unintended consequences.
Modeling Approach:
Insulated ports and a bottoming cycle were modeled as
described below.
Insulated Ports and Manifolds
Ceramic coatings or inserts with air gaps are used to
increase exhaust temperature. The retained energy can
then be used in an energy recovery device, such as a
turbocompound system or a bottoming cycle. The energy
potential of insulated ports and manifolds is better at high
load, but there can also be a benefit from higher tempera-
ture into an SCR system for improved NOx conversion
efficiency.
Modeling Approach:
Insulated ports were modeled in GT-POWER. The heat
transfer coefficient for the port walls can be adjusted in
the model to predict the performance of insulated ports.
Insulated manifolds were not simulated in this project.
The heat loss of manifolds to the air outside the engine is
expected to be significantly lower than the heat loss of the
ports to the cooling water jacket in the cylinder head. The
benefits of insulated ports proved to be small.
Bottoming Cycle
A bottoming cycle is a heat engine that uses waste heat
from the primary engine (the heavy-duty diesel) to produce
additional work. There are many concepts available for
use in a bottoming cycle, including steam turbines. For the
steam turbine approach, many different working fluids can
be considered. Potential sources of waste heat include:
• The exhaust gas flow
• EGR flow
• Charge air flow
• Engine coolant
The great advantage of a bottoming cycle is that it uses
“free” energy – energy that is going to be thrown away by
the primary engine. The great disadvantage of a bottoming
cycle is that its efficiency is limited by the poor quality (low
temperature) of most waste heat. In addition, the amount
of waste heat available also varies greatly with the engine’s
operating condition. Bottoming cycles have been used for
many years in stationary power plants. So far, they have
not found application in vehicles because of cost, weight,
packaging, reliability, and performance issues.
Another issue that must be dealt with in using a bottoming
cycle is finding a way to deal with the very poor transient
response of the bottoming cycle. When there is a sudden
increase in demand for engine power, it will take consider-
able time for the bottoming cycle to see the resulting
waste heat increase and increase its own power output
accordingly. Also, if there is a sudden decrease in engine
power demand (the driver takes his foot off the throttle),
the bottoming cycle will continue to make power for some
time because of waste heat already in the system.
One way to deal with the transient response issue is to
combine the bottoming cycle with a hybrid electric drive
system. Electricity produced by the bottoming cycle can be

86 A p p e n d i x A
R E D U C I N G Heavy-Duty Long Haul Combination Truck Fuel Consumption and CO2 Emissions
used directly to supplement engine power when desired. If
the bottoming cycle cannot produce power when needed,
stored electrical energy can be used. If the bottoming cycle
is making power that the vehicle does not immediately
require, this energy can be stored in the hybrid system
battery.
Unfortunately, this combination of bottoming cycle and
hybrid technologies means that two large, complex, and
expensive systems must be packaged together in the
vehicle. Making all systems fit in a truck, work together,
and achieve reliability will be a daunting challenge for
engineers.
Modeling Approach:
After studying the available literature, SwRI decided
to model a steam turbine bottoming cycle using water
as the working fluid. Water has a boiling temperature
which makes it very attractive for extracting work from a
relatively low temperature heat source. There are issues
that would need to be dealt with if a water-based cycle is
used. One of the biggest issues is the potential for freezing.
A water-based bottoming cycle will require insulation, a
heating system to prevent freezing during extended idle
periods, and an emergency dump system to drain the water
in case the heating system fails.
A sophisticated spreadsheet simulation of the bottoming
cycle was created in order to evaluate alternative designs.
The spreadsheet takes into account many parameters, and
calculates temperatures, pressures, and flow rates through
the system. Many assumptions must be made in order to
model a bottoming cycle. The assumptions used in this
project are listed on the following page.
• Working fluid: water
• Power turbine / expander efficiency: 70 percent at
all operating conditions
• Feed pump efficiency: 100 percent (since the feed
pump power is very low, this is not a major factor)
• Pump inlet conditions: saturated water at 40º C on
a standard 25º C day (a range of inlet temperatures
was evaluated to determine the sensitivity of the
system to inlet temperature and thus to condenser
performance)
• Maximum system pressure: 35 bar
• Pressure drop across all heat exchangers: 10 kPa
(3” Hg)
• Approach temperature of all heat exchangers:
14º C (this is an assumption about the efficiency of
the heat exchangers – we assumed performance
similar to charge air coolers used on trucks)
• Expander outlet minimum quality = 0.9 (10 percent
liquid water maximum, to protect the hardware from
erosion damage)
• Variable speed feed pump (to match the system flow
to the available heat)
• Variable speed/geometry expander (to match the
available heat)
• Low side pressure: 0.07 bar (this is a substantial
vacuum, which is required to get the condensation
temperature of water down to 40º C)

87A p p e n d i x A
• Minimum exhaust temperature after heat exchanger:
150º C (this was selected to avoid condensation
issues in the exhaust)
• Exhaust stream temperature after the DPF and SCR
systems is assumed to be 7º C lower than the
turbocharger outlet temperature (based on SwRI
test experience)
• 90 percent efficient electrical generator and electric
drive motor (81 percent of the power from the
bottoming cycle turbine is assumed to reach the
vehicle transmission)
As noted above, SwRI evaluated the following four heat
sources for the bottoming cycle:
1) engine coolant;
2) charge air from the turbocharger compressor;
3) EGR gas flow, and 4) exhaust gas flow.
The engine coolant carries a large portion of the power
released by burning fuel, and therefore it is a significant
potential source of heat for the bottoming cycle. Unfor-
tunately, the quality (temperature) of the coolant heat is
very low (about 90º C), so it is hard to extract much useful
work from coolant heat. In other words, a bottoming cycle
using waste heat from the engine coolant will have a large
energy input, but very low efficiency, and therefore low
power output.
Charge air is a more promising source because at high
engine load, the temperature is much higher than coolant
temperature. However, charge air temperature is very sensi-
tive to engine speed and load. At typical cruise conditions,
the amount of heat energy and the quality (temperature)
of the energy is fairly low. SwRI’s evaluation showed that a
bottoming cycle using energy from the charge air would be
fairly effective at full load, but not very effective over the
vehicle drive cycle.
EGR gas flow is taken from the exhaust manifold before the
turbocharger, so it offers the highest quality (temperature).
Only about 25 to 30 percent of the exhaust flow is devoted
to EGR, however, so this limits the total energy available
from the EGR stream. Because of the high quality of EGR
energy, it offers the best bottoming cycle efficiency.
Exhaust gas flow is lower in quality than EGR flow, since it
is taken after the turbocharger turbine and the downstream
exhaust aftertreatment systems. However, the total amount
of energy available is high, so this is an attractive heat
source.
In the evaluation performed by SwRI, by far the best
performance was obtained by heating the bottoming cycle
fluid first with the exhaust gas stream, and then adding
additional heat from the EGR stream. This approach
provided much better results than using either of the two
sources alone. It was also far superior to using charge
air and/or engine coolant as heat sources. Even when
using both exhaust and EGR as heat sources, the amount
of energy available from a bottoming cycle is strongly
dependent on engine speed and load. At high speed and
load, the highest temperatures and exhaust flow rates are
achieved, which allows a high bottoming cycle power.
However, the SwRI model shows that the bottoming
cycle can provide power that is a significant percentage of
engine power down to relatively low engine speeds and
loads. For example, at 1200 RPM and 20 percent load, the
bottoming cycle provides 7.3 percent of engine crankshaft
power, which translates into a 7.3 percent reduction in fuel
consumption and CO2 emissions.
88 A p p e n d i x A
R E D U C I N G Heavy-Duty Long Haul Combination Truck Fuel Consumption and CO2 Emissions
Note that there are many engineering problems that will
need to be overcome in order to implement a bottoming
cycle in a truck. Packaging of all the necessary hardware
into a truck will be a challenge. The bottoming cycle
hardware will introduce a weight penalty to the truck.
Developing the system to operate over the range of
ambient conditions encountered in service is also a major
controls and design challenge. The bottoming cycle hard-
ware and controls must also be able to function over the
full engine speed/load operating range, as well as dealing
with startup and shutdown transients. Another important
issue is heat rejection. Since the proposed bottoming cycle
takes energy from the engine exhaust, about 75 percent
of that energy must be rejected by the bottoming cycle as
waste heat. This increases the overall vehicle heat rejection
requirement. Higher heat rejection can lead to a greater fan
power requirement and higher aerodynamic drag, both of
which would counteract the benefit of the bottoming cycle.
As a result, some design compromise is probably required
which would limit the maximum output (and thus heat re-
jection) of the bottoming cycle system. Achieving adequate
bottoming cycle reliability and durability in a vehicle where
high levels of vibration and wide temperature swings are a
part of everyday service will be a very difficult task.
Bottoming cycles are widely used today in stationary power
plants. In stationary power applications, however, many
factors are more favorable than in a truck. These include
the following:
• Stationary power is an essentially zero vibration
environment
• In power plants, the operating and ambient
temperature ranges are limited
• Space (packaging) is not a major concern
• Heat rejection capacity is not a major concern
• The large energy stream of a power plant can justify
a high cost bottoming cycle system
• Operating conditions are far closer to steady state in
a power plant than in a truck
• Power plant load factors tend to be higher than truck
load factors. A high load factor favors bottoming
cycle performance
Transmission System TechnologiesModeling Approach:
All transmission and vehicle simulations were made using
RAPTOR, a commercially available vehicle simulation code
developed by SwRI.
Automated Manual Transmission
Torque converter automatic transmissions are relatively
rare in heavy-duty truck applications. There are several
reasons for this, including cost. Torque converter automat-
ics are generally used only in stop-and-go applications such
as city buses, garbage trucks, and cement mixers. Most
heavy-duty trucks use manual transmissions with 8 to 18
ratios available. The most common transmission for line
haul applications is a 10 speed manual transmission with
an overdrive top gear ratio.
Automated manual transmissions have been available on
the market for over 10 years now, and they have been
increasing in market share. Automated manuals allow the
vehicle control module, rather than the driver, to decide
when to shift. Pneumatic or hydraulic mechanisms then
89A p p e n d i x A
actuate the clutch and transmission controls to execute the
shifts. An automated manual can shift as quickly as the best
driver, and the shift schedule can be tailored to match the
characteristics of the engine and vehicle. This reduces the
fuel consumption and CO2 emissions variability between
drivers, making all drivers achieve results closer to those
of the best drivers. Automated manual transmissions also
reduce the level of skill required, which has become an
advantage as the trucking industry struggles to replace
retiring drivers.
Modeling Approach:
An Eaton 10 speed manual transmission was selected as
the baseline transmission for the project. Inputs to the
RAPTOR model include the gear ratios of each gear, along
with assumptions regarding the efficiency of each gear.
SwRI assumed 98 percent efficiency for the lower gears,
and 99 percent efficiency for the tenth gear, which is direct
(1:1 ratio).
A key factor in modeling a manual transmission is making
assumptions about driver behavior. The driver can have
an appreciable effect on truck fuel economy, and selection
of shift points is a large part of this. If the driver keeps
the engine operating at high RPM, the fuel economy will
suffer. If the driver is aggressive in heavy traffic, the truck
will experience more dramatic speed fluctuations than
with a less aggressive driver, also affecting fuel economy.
In the current study, the speed vs. time drive cycle was
pre-determined. This ignores the effect of different drivers
who will vary speed more or less, depending on tempera-
ment. Shift points are still a factor that will influence fuel
economy on the drive cycle. SwRI chose to shift up at
1800 RPM in situations where the drive cycle called for full
power. Downshifts were set to occur at a point resulting in
1700 RPM if full power is required. In situations where full
power is not required, the shift points were selected to be
lower to achieve good fuel economy. This is the approach a
good driver will take. The good driver might also decide to
sacrifice some vehicle performance in order to improve fuel
economy and use lower shift points at full load.
The shift strategy used in the RAPTOR model also repre-
sents a typical shift strategy for a fully automated manual
transmission. For the purpose of this study, there is no
difference between the manual and automated manual
transmissions, since both are modeled in the same way. In
the field, there will be a difference between manual and
automated transmissions. A very fuel conscious driver
might be able to do a little better than an automated
manual, while a more performance oriented driver is likely
to use more fuel than an automated transmission.
Moderate Hybrid Systems
These systems are similar in concept to the mild hybrids
used in light-duty applications using an integrated starter/
generator. Engine start/stop is included, along with limited
duration auxiliary power unit capability, electrified acces-
sories, launch assist, and regenerative braking to recharge
the battery. The battery size is kept modest to control cost
and weight.
Modeling Approach:
A moderate hybrid system was not modeled for this
project. The Steering Committee agreed that an aggressive
hybrid offered much more potential fuel savings for heavy-
duty trucks.
90 A p p e n d i x A
R E D U C I N G Heavy-Duty Long Haul Combination Truck Fuel Consumption and CO2 Emissions
Aggressive Hybrid Systems
These systems are similar in concept to the full hybrids
used in light-duty applications. Two approaches were
considered in this study. The first approach has a 50kW
motor/generator on the transmission with a 4 kW-hr
battery. This is a parallel hybrid approach. Both the engine
and the hybrid motor are connected to the drivetrain (al-
though the engine does have a clutch). The parallel hybrid
system uses a high voltage battery that allows electrification
of all accessories including the engine cooling fan. This
system can support start/stop and APU functions to greatly
reduce idle time. Up to 50 kW of additional power is
available for launch or hill climb support.
The second hybrid approach modeled for this study was a
series hybrid. In this case, the engine is only connected to
the drive wheels at highway speeds using two transmission
ratios. At lower speed, the engine drives a generator which
in turn is used to drive a 200 kW electric motor. The series
hybrid has a larger capacity battery, allowing the vehicle
to support hotel load of heating, cooling, and electricity
supply (APU function) all night without charging. The
larger battery also allows low speed operation of the truck
without starting the diesel engine.
Modeling Approach:
RAPTOR includes extensive code for hybrid system
simulation. Care is taken to make sure that the state of
battery charge at the beginning and end of the cycle is
the same, for example, to ensure comparability between
design alternatives. A parallel hybrid system was evaluated
in several configurations. The initial configuration had the
electric motor on the engine side of the clutch, and used
a 10 kW-hr battery. Better performance was achieved by
moving the electric motor to the transmission side of the
clutch. This allowed the engine to be disengaged during
some braking conditions, which increases the amount of
energy that can be captured from regenerative braking.
The final version of the parallel hybrid system reduced the
battery capacity to 4 kW-hr, in order to limit the cost and
weight of the battery package. The system assumed that 50
percent of the battery capacity was available for use. This is
done to achieve good battery life.
In the series hybrid analysis done as part of this study, we
were unable to demonstrate significant fuel savings because
we were not able to acquire the necessary controls strate-
gies used by developers of series hybrids. Thus, the analysis
for this study focused on the parallel systems.
Vehicle TechnologiesModeling Approach:
All transmission and vehicle simulations were done using
RAPTOR, a commercially available vehicle simulation code
developed by SwRI.
Accessory Electrification
The use of a hybrid system or electric turbocompound
provides a source of electrical energy that can be used to
drive accessories that are engine driven on today’s vehicles.
Given the availability of significant electric power, the
following accessories can be converted to electric drive:
• Electric Power Steering (EPS)
• Electric Water Pump (EWP)
• Electric A/C compressor
• Electric air compressor
• Eliminate conventional alternator
91A p p e n d i x A
If 30 kW of electric power is available, the engine cooling
fan can also be converted to electric drive. In line haul
applications, the efficiency savings from an electric cooling
fan is limited, because the fan only runs as needed, and it is
normally not required at higher vehicle speeds.
If electric power is not available, there are still some
technologies that can be applied to reduce the parasitic
power consumption of accessories. The alternator and air
compressor can use clutches to disengage them when they
are not required. This can provide a significant parasitic
power reduction. Air compressors that are not pumping
absorb about half the power of a pumping compressor, and
compressors normally only pump a small percentage of the
time.
Modeling Approach:
Good data providing power consumption values for each
accessory over a range of operating conditions were not
available. A simplified assumption was made that the
average power demand for mechanically driven accessories
is 5 kW, and the average power demand for electrically
driven accessories is 3 kW. This provides a 2 kW advantage
for the electrically driven accessories over the entire drive
cycle. Since the average engine power level over the drive
cycle is in the 100 to 200 kW range, this represents a 1 to
2 percent improvement in efficiency and reduction in CO2
emissions. In general, the effect of accessory power con-
sumption in trucks is much less than in cars. The average
load on a car engine over a drive cycle may be in the 10 to
20 kW range. At this level, a 1 kW reduction in accessory
loads makes a significant difference (5 to 10 percent).
Given the higher loads experienced by truck engines,
accessory demand is a much smaller share of overall fuel
consumption.
Accessory power demand was modeled in RAPTOR as a
continuous, steady state power draw of 5 kW for standard
accessories, and 3 kW for electrical accessories. There is
room for additional research to improve upon this very
simple modeling approach by using actual measured data to
improve the modeling assumptions.
Friction Improvements
Engine friction reduction is described in a previous section.
Lower viscosity lubricants, and lubricants whose viscosity is
less temperature sensitive, can also be applied in transmis-
sions, differentials, and axles. In many cases, components
need to be redesigned in order to be compatible with low
friction lubricants. The benefits of friction reduction on the
vehicle are sensitive to ambient temperature. Larger ben-
efits are found in cold weather. These improved lubricants
are normally higher cost synthetics. Synthetic low friction
lubricants are already options in today’s trucks and have
become standard on a few models.
Modeling Approach:
The modeling of vehicle related friction improvements is
very complex. Friction arises in the transmission, driveshaft
joints, axles, and wheel bearings. Rather than deal with this
complexity, friction reduction assumptions were included
in the overall rolling resistance values that are used in
Package 2, Package 3, and all subsequent packages, which
use the Package 3 values. Package 2 assumes no change
in vehicle friction, while Package 3 assumes a 10 percent
reduction in vehicle friction.
Aerodynamic Drag Reduction
There are many technical features that are available or
under development to reduce the coefficient of drag (Cd)
of a heavy-duty truck. In many cases, reliable data are

92 A p p e n d i x A
R E D U C I N G Heavy-Duty Long Haul Combination Truck Fuel Consumption and CO2 Emissions
not available on the effect of individual features, or data
are only available from the manufacturers of the features.
Therefore, in this study, we simply modeled the effect of
drag coefficient on the fuel economy and CO2 emissions of
the truck. Two packages were considered. The first package
(Package 2) assumed a drag coefficient of 0.5, which was
estimated to be the drag coefficient of a SmartWay tractor/
trailer combination. The second, more aggressive package
called “Advanced SmartWay” (Package 3) looked at a
feasible drag coefficient for 2017. After much discussion
in the Steering Committee, a drag coefficient of 0.4 was
selected, based on available data.
The list of aerodynamic features that were discussed
included: reduced tractor to trailer gap, trailer side skirts
and undercarriage skirts, a boat tail, boat tail plates,
integrated tractor roof fairings, a trailer “eyebrow,” frontal
area reduction (not implemented, in order to keep carrying
capacity constant), trailer edge rounding, vortex generators,
guide vanes, active and passive pneumatics, aerodynamic
mirrors, replacement of mirrors with cameras, a trailer
underbody wedge, fuel tank fairings, bumper fairings,
“teardrop” shaped trailer, wheel fairings, and hidden
vertical exhaust stacks.
It should be noted that Package 2 is available on the
market today. The market share of vehicles equipped with
the full package is very low, for a number of reasons. One
of these issues is the fact that some tractor and trailer
aerodynamic features are very damage prone, and that
damage results in the loss of several years worth of fuel
saving benefits. Another issue is that fleets are concerned
about the down time related to the failure of a wide base
single tire. Additional development is required to mitigate
these issues to the point where most heavy-duty truck
buyers find them cost effective.
Package 3 is much farther from being ready for wide-spread
use. Other than a couple of laboratory demonstrations,
Package 3 remains undefined in detail. There will be
many challenges in the development of the Package 3 drag
coefficient, especially in minimizing the impact on vehicle
functionality (trailer volume, vehicle maneuverability, load-
ing dock compatibility, damage resistance, and minimizing
weight increase). It is the consensus of experts consulted
in industry as well as members on the Steering Committee
that these issues could be overcome by 2017.
Modeling Approach:
Modeling of aerodynamic features to determine their
individual impact on drag coefficient is beyond the scope
of this project. This type of modeling would require a so-
phisticated three dimensional computational fluid dynamics
program. Therefore, in this study, we simply modeled the
effect of drag coefficient changes on the fuel economy and
CO2 emissions of the truck. The two packages discussed
above (SmartWay and Advanced SmartWay) were modeled.
Drag coefficients of 0.5 (SmartWay) and 0.4 (Advanced
SmartWay) were simply entered into the RAPTOR model
along with vehicle frontal area. The model then calculated
the drag power over the vehicle drive cycle.
Mass Reduction
There are opportunities to reduce the mass of a tractor /
trailer. Reduced mass can benefit fuel efficiency and CO2
emissions in two ways. First, if the truck is running at the
GVW limit with high density freight, more freight can be
carried. This increases the amount of freight that can be

93A p p e n d i x A
moved for a given amount of fuel. Second, if the truck is
running with lower density freight, the total vehicle mass
is reduced, which reduces rolling resistance and the power
required to accelerate or climb grades.
There are two primary approaches for mass reduction.
Material upgrades can achieve the same performance with
lighter weight. Examples include the substitution of thinner
high strength steels for standard steel, or the use of alumi-
num or composite in place of heavier materials. A second
approach is to reduce the number of components required.
The main example of this approach is to substitute single
wheels and tires where dual wheels are used today. Single
wheels and tires that can carry the same load as standard
dual wheels are commonly known as wide base singles.
Modeling Approach:
Vehicle mass is an input to the RAPTOR model. The effect
of vehicle mass changes was evaluated by changing the
input value in the model. RAPTOR uses vehicle mass to
determine the energy required to accelerate and slow the
vehicle, as well as the vehicle rolling resistance.
Reduced Rolling Resistance
Lower rolling resistance reduces the power required to
move the truck down the road, which directly reduces
fuel consumption and CO2 emissions. Tire design and tire
inflation are the primary factors contributing to rolling
resistance. Wide base single tires offer much lower rolling
resistance than standard double wheels. Tire manufacturers
are working on designs to decrease the rolling resistance
of both standard and wide base single tires. Tire pressure
monitoring and automatic tire inflation systems are
available to ensure that tires are operated at the optimum
pressure.
Modeling Approach:
The rolling resistance coefficient is an input to the RAPTOR
model. The baseline number came from actual vehicle
testing on a Kenworth T-600 truck and trailer combination.
The lower rolling resistance values used in Packages 2 and
3 came from publications, unpublished data, or projections
from EPA and/or Michelin. The rolling resistance assump-
tion for Package 3 included an assumption of a 10 percent
reduction in vehicle friction, in addition to tire-related
improvements.
Lower Road Speed
Since aerodynamic drag is a function of speed squared,
the fuel economy and CO2 emissions of vehicles can be
improved by reducing speed. Limits on this approach
include increases in trip time and possibly increases in the
number of trucks on the road that would be required to
deliver a given amount of freight.
Modeling Approach:
The maximum road speed is defined by the drive cycle.
The baseline drive cycle is defined in Chapter 2. To
evaluate the effect of imposing lower road speed limits on
trucks, the drive cycle was modified by limiting the maxi-
mum speed to 65, 60, and 55 MPH. RAPTOR then used
the modified drive cycles to determine the fuel savings that
can be achieved with lower road speeds.
Increased Vehicle Size and/or Weight
Some trucks run “cubed out.” In other words, the trailer
is completely full with low density freight, and the vehicle
is under the GVW limit. Other trucks run “grossed out,”
which means that the trailer is not filled, but the truck is
at the GVW limit. Some trucks operate less than full in
either sense. To achieve good operating efficiency, trucking

94 A p p e n d i x A
R E D U C I N G Heavy-Duty Long Haul Combination Truck Fuel Consumption and CO2 Emissions
companies strive to load the truck until one of the two
limits is reached. An increase in the permitted size and
weight of trucks can reduce fuel consumption on a ton-
mile basis and lead to lower CO2 emissions for the fleet.
The advantages of increased truck size and weight are
straightforward. Fuel consumption and CO2 emissions are
reduced. Traffic density is reduced, since fewer trucks are
required to move a given amount of freight. Labor cost is
reduced, since fewer drivers are required.
Unfortunately, there are also disadvantages to increased
truck size and weight that must be dealt with. The first
disadvantage is that there are both real and publicly
perceived safety risks for larger and heavier trucks. This
disadvantage might be dealt with by mandating vehicle
performance characteristics such as stability control,
braking performance, and crash compatibility. In addition,
driver training and driver performance requirements could
be put in place for operators of larger, heavier trucks.
Another disadvantage is road damage from heavy trucks
and the issue of whether trucks pay enough in taxes and
fees to cover the damage they cause. This issue might be
dealt with by limits on axle load, possibly with standards
on suspension performance, and by adjustments to the tax
and fee structure. Another factor that must be considered is
the structural integrity of bridges. Some routes may require
upgrades before heavier trucks could safely operate.
One final potential disadvantage of larger, heavier trucks is
also one of the benefits: lower cost shipping. The concern
here is that a more efficient trucking industry would lead to
more shipping in general, and thus cancel some of the CO2
advantage of larger, heavier trucks – frequently referred to
as the “rebound effect.” In this study, the potential impact
of “rebound” has not been included in the estimation of
fuel use or CO2 reductions in the longer/heavier truck
cases.
Modeling Approach:
RAPTOR allows the use of any desired tractor and trailer
combination. To explore the effect of allowing larger,
heavier vehicles, the vehicle model was modified in
RAPTOR. Higher empty vehicle weights were applied, the
appropriate freight weights were applied, and the model
was run to determine changes in fuel consumption and
CO2 emissions. In addition, the rolling resistance and Cd
values were modified for some vehicle combinations. The
rolling resistance of drive axle tires is higher than that for
trailer tires, so if the ratio between drive axles and trailer
axles changed, the rolling resistance coefficient was modi-
fied to account for the change. Similarly, the aerodynamic
drag of a multi-trailer combination will be higher that that
of a single trailer, because of an additional trailer-to-trailer
gap and additional undercarriage elements. Thus, modified
Cd values were also applied to account for the higher drag
expected with multiple trailer combinations.

A P P E N D I X B
95
APPENDIX BA P P E N D I X Ba p p e n d i x ba p p e n d i x b
a p p e n d i x bAppendix B
R E D U C I N GHeavy-Duty Long Haul Combination
Truck Fuel Consumption and CO2 Emissions
B-1TABLE
APPENDIX B
TECH-NOLOGY PACK-AGES
FUNCTIONAL DESCRIPTION AND NOTES
INCRE-MENTAL RETAIL COST ESTI-MATE*
PARTS COST* COMMENTS
Package 1. 2008 baseline.
Kenworth T-600 with 10-speed manual, 2007 Volvo D-13 engine - adjusted to meet 2010 NOx emissions standards. Aero assump-tions: Bumper fairing, partially aerodynamic mirrors, partial fuel tank fairing, integrated roof fairing, exhaust system out of the air stream (aero drag coefficient: .6298) (coefficient of rolling friction: .0068)
Package 2. SmartWay package
SmartWay package. Includes: Additional aero streamlining sufficient to reduce the coefficient of drag from 0.63 to 0.5 to both the cab and the trailer. Fully aerodynamic mirrors, cab side extenders, integrated sleeper cab roof fairings, aerodynamic bumper, full fuel tank fairings. Trailer streamlining includes a side skirt fairing, and either a trailer gap fairing or a rear-mounted trailer fairing such as a boat tail. RR of 0.0055. Super singles and aluminum wheels. Idle reduction, improved lubricants
$22,930
Cab Streamlin-ing: $2750
Trailer Aero - side skirts, gap reducer and rear flap: $2,400
Low Viscos-ity lubri-cants: $500
cab tires: replace 8 wheels w/4 super singles: (4 tires + wheels) x ($1,279/tire + $575/wheel) - (8 tires + wheels) x ($582/tire + $205/wheel) = $1,120
trailer tires: replace 8 wheels with 4 super singles, same calculation as for cab tires times three trail-ers ($1,120 x 3 = $3,360)
APU: $8000
see SmartWay “Technical Specifications and Requirements 2007 tractor and 2007 trailer”. SmartWay specifications, including: 10% - 20% im-provement in FE overall (including idle reduction) idle reduction capable of providing 8 hours of idle free auxiliary power, heat and/or air conditioning - assume APUassumes one tractor and three trailers
Package 3. advanced aerodynamics - 2017.
An advanced aero & tire package for 2015 and beyond that includes: Full trailer aero (boat tail, full skirting); tractor-trailer gap optimization; further tractor streamlining and wheel fairings; reshaped aerodynamic trailer. Tires assume RR of 0.0045 using advanced super single tires. Also includes APU
$44,730
Cab Streamlin-ing: $4,750
Trailer Aero - side skirts, gap reducer and rear flap: $4,500 ($1,500 times three trailers)
Low Viscos-ity lubri-cants: $500
cab tires - replace 8 wheels w/4 super singles: (4 tires + wheels) x ($1,279/tire + $575/wheel) - (8 tires + wheels) x ($582/tire + $205/wheel) = $1,120
trailer tires: replace 8 wheels with 4 super singles, same calculation as for cab tires times three trail-ers ($1,120 x 3 = $3,360)
APU: $8000
Trailer reshaping, including tear drop roof, rounded edges, etc
assumes CD of 0.4, tire RR of .0045 and one tractor and three trailers
APPENDIX B: Summary of Incremental Costs for Technology Packages
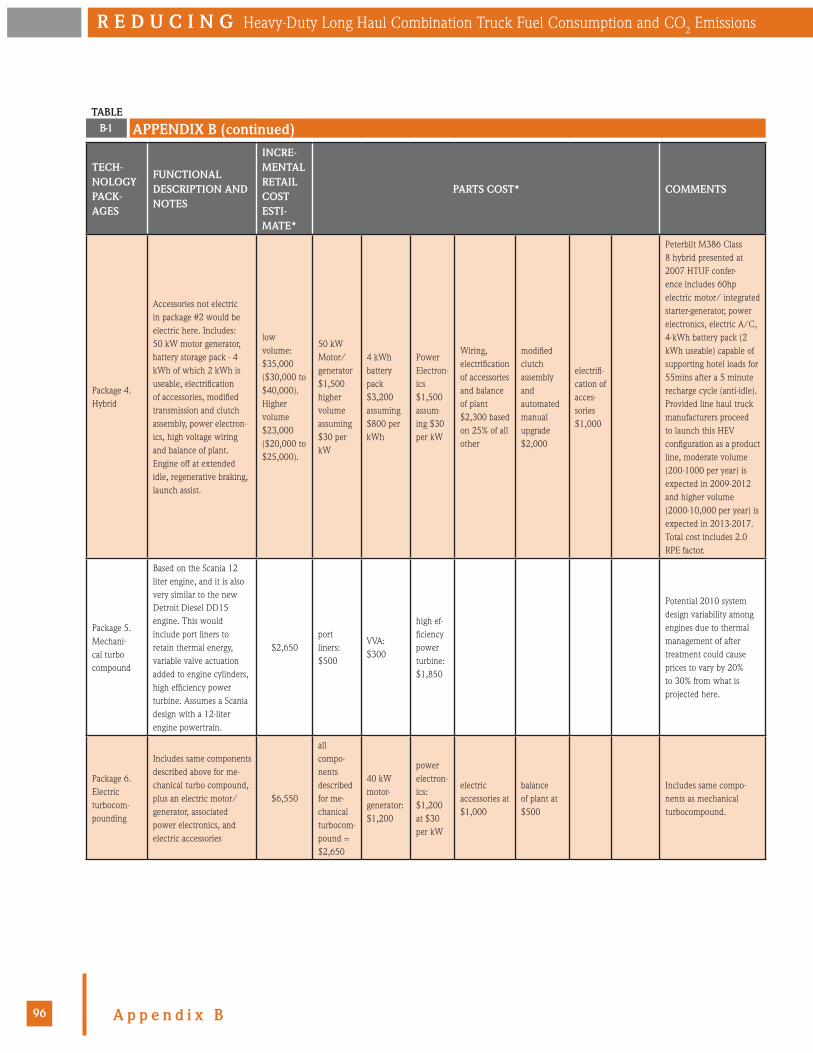
96 A p p e n d i x B
R E D U C I N G Heavy-Duty Long Haul Combination Truck Fuel Consumption and CO2 Emissions
TECH-NOLOGY PACK-AGES
FUNCTIONAL DESCRIPTION AND NOTES
INCRE-MENTAL RETAIL COST ESTI-MATE*
PARTS COST* COMMENTS
Package 4. Hybrid
Accessories not electric in package #2 would be electric here. Includes: 50 kW motor generator, battery storage pack - 4 kWh of which 2 kWh is useable, electrification of accessories, modified transmission and clutch assembly, power electron-ics, high voltage wiring and balance of plant. Engine off at extended idle, regenerative braking, launch assist.
low volume: $35,000 ($30,000 to $40,000). Higher volume $23,000 ($20,000 to $25,000).
50 kW Motor/generator $1,500 higher volume assuming $30 per kW
4 kWh battery pack $3,200 assuming $800 per kWh
Power Electron-ics $1,500 assum-ing $30 per kW
Wiring, electrification of accessories and balance of plant $2,300 based on 25% of all other
modified clutch assembly and automated manual upgrade $2,000
electrifi-cation of acces-sories $1,000
Peterbilt M386 Class 8 hybrid presented at 2007 HTUF confer-ence includes 60hp electric motor/ integrated starter-generator, power electronics, electric A/C, 4-kWh battery pack (2 kWh useable) capable of supporting hotel loads for 55mins after a 5 minute recharge cycle (anti-idle). Provided line haul truck manufacturers proceed to launch this HEV configuration as a product line, moderate volume (200-1000 per year) is expected in 2009-2012 and higher volume (2000-10,000 per year) is expected in 2013-2017. Total cost includes 2.0 RPE factor.
Package 5. Mechani-cal turbo compound
Based on the Scania 12 liter engine, and it is also very similar to the new Detroit Diesel DD15 engine. This would include port liners to retain thermal energy, variable valve actuation added to engine cylinders, high efficiency power turbine. Assumes a Scania design with a 12-liter engine powertrain.
$2,650port liners: $500
VVA: $300
high ef-ficiency power turbine: $1,850
Potential 2010 system design variability among engines due to thermal management of after treatment could cause prices to vary by 20% to 30% from what is projected here.
Package 6. Electric turbocom-pounding
Includes same components described above for me-chanical turbo compound, plus an electric motor/generator, associated power electronics, and electric accessories
$6,550
all compo-nents described for me-chanical turbocom-pound = $2,650
40 kW motor-generator: $1,200
power electron-ics: $1,200 at $30 per kW
electric accessories at $1,000
balance of plant at $500
Includes same compo-nents as mechanical turbocompound.
B-1TABLE
APPENDIX B (continued)

97A p p e n d i x B
TECH-NOLOGY PACK-AGES
FUNCTIONAL DESCRIPTION AND NOTES
INCRE-MENTAL RETAIL COST ESTI-MATE*
PARTS COST* COMMENTS
Package 7. VVA
conventional lost motion VVA
$300
$50 per cylinder incremen-tal cost for VVA imple-mentation in produc-tion volumes
Package 8. Bottoming cycle added to Sturman VVA.
VVA, steam Rankine bottoming cycle system. 30 kW rating at 1600 rpm full load and 100 F ambient. High speed turbine expander-gener-ator, flywheel, air-cooled condenser, stainless steel EGR boiler, stack boiler, balance of plant, controls and power electronics, battery.
$15,100 (assuming thousands of units per
year),
Turbine generator and flywheel: $2,160 for a 30 kW system
Air-cooled Condens-er based on large mobile AC condens-ers; 90 kW2 and heat rejection; 13 ft2 face area: $550
EGR boiler stainless steel: $400
stack boiler: $1,000
Packaging, assembly labor and balance of plant: $2,000
Controls and power electon-ics: $1,300 ($400 for controls plus $30/kW for power elec-tronics)
Energy storage: $150 (battery or ultra-capacitor sized to capture peak load for 10 seconds)
Total cost includes 2.0 RPE factor.
Package 9. Rocky Moun-tain Doubles with GVW increase
Rocky mountain doubles include one 28’ trailer and one 48’ trailer. Max GVW is 120,000 lbs. Includes increased engine size (increase of 3L), safety fea-tures (disc brakes, stability controls, vision systems), engine cooling and after treatment systems also increase proportionally. the transmission is also modified for higher loads.
$17,500
Increase engine size from 13L to 16L with after treat-ment and modify transmis-sion: $7,500
Add safety features (disc brakes, antilock, vision assists, and stability controls): $4,000
Incre-mental cost of four doubles instead of three single trailers, includ-ing trailer aero, is $6,000
Package 10. Reduced maximum road speed to 60 MPH ap-plied to one of the above packages
no cost itemnegli-gible cost increase
B-1TABLE
APPENDIX B (continued)

98 A p p e n d i x B
R E D U C I N G Heavy-Duty Long Haul Combination Truck Fuel Consumption and CO2 Emissions
TECH-NOLOGY PACK-AGES
FUNCTIONAL DESCRIPTION AND NOTES
INCRE-MENTAL RETAIL COST ESTI-MATE*
PARTS COST* COMMENTS
Package 11. Advanced EGR
Additional EGR cooler or enhanced primary EGR cooler, as well as ad-ditional corrosion-resistant plumbing to remove excess water, minor changes to the system control.
$750
cooler modifica-tions: $500
balance of plant: $250
Package 12. Bottoming cycle/ single trailer/advanced aero/hybrid-ization/lower road speed
combination of packages 3, 4, 8, 9, and 10, minus duplicate components
$71,630package 3 = $44,730
package 4 = 15,000
package 8 = $15,100
package 10 = no cost
Credit for motor, pwr electronics = $3,600
$3,200 in duplicated compo-nents subtracted from total cost
Package 13: electrical turbocom-pounding/hybridiza-tion/double trailer/lower road speed
combination of packages 3, 4, 6, 9, and 10, minus duplicate components
$80,380package 3 = $44,730
package 4 = 15,000
package 6 = $6,550
package 9 = $17,500
package 10 = no cost
Credit for motor, pwr elec-tronics = $4,200
$3,400 in duplicated compo-nent costs subtracted from total cost
Package 14: bottoming cycle/hybridiza-tion/double trailer/lower road speed
combination of packages 3, 4, 8, 9, and 10, minus duplicate components
$89,130package 3 = $44,730
package 4 = 15,000
package 8 = $15,100
package 9 = $17,500
package 10 = no cost
Credit for motor, pwr elec-tronics = $3,600
$3,200 in duplicated compo-nents subtracted from total cost
*unless noted, all costs were obtained as retail costs from published data. For two technologies - hybrid and bottoming cycle, ex-factory costs were first estimated and then a retail price equivalent (RPE) markup was applied to estimate the retail cost for these packages.
B-1TABLE
APPENDIX B (continued)

A P P E N D I X C
99
APPENDIX CA P P E N D I X Ca p p e n d i x ca p p e n d i x c
a p p e n d i x cAppendix C
R E D U C I N GHeavy-Duty Long Haul Combination
Truck Fuel Consumption and CO2 Emissions
Appendix C: Detailed Information on TIAX Cost Analysis
Cost of Package 1: Baseline VehicleKenworth T-600
10 speed manual
2007 Volvo D-13
Aero assumptions:
Bumper fairing, partially aerodynamic mirrors, partial fuel
tank fairing, integrated roof fairing, exhaust system out of
the air stream (aero drag coefficient: 0.63) (coefficient of
rolling resistance: .0068).
Estimated Cost: $125,000 to $135,000 on a fleet purchase
basis
Cost of Package 2: SmartWay 1The “SmartWay 1” package as defined by SwRI includes
the following upgrades over the baseline tractor-trailer:
• Additional aero streamlining sufficient to reduce the
coefficient of drag from 0.63 to 0.5) to both the cab
(fully aerodynamic mirrors, cab side extenders,
integrated sleeper cab roof fairings, aerodynamic
bumper, and full fuel tank fairings) and the trailers.
The trailer streamlining includes a side skirt fairing,
and either a trailer gap fairing or a rear-mounted
trailer fairing such as a boat tail.
• Improved rolling resistance sufficient to reduce
the coefficient of rolling resistance to 0.0055. We
have assumed super single low rolling resistance (RR)
tires and lightweight aluminum wheels. Super single
tires have a steer tire RR coefficient of 0.0058, a
drive tire RR of 0.0073, and trailer tire RR of 0.0052.
• Idle reduction (capable of providing eight hours of
idle-free auxiliary power, heat and/or air
conditioning).
• Improved lubricant package
For this package, TIAX assumed that an Auxiliary Power
Unit was necessary at a cost of $8,000. The incremental
cost of improved cab streamlining was estimated to be
$2,750 for the tractor, while low viscosity lubricants were
estimated to have a lifetime incremental cost of $500. A
set of four super single low rolling resistance tires and their
associated aluminum wheels are estimated to cost $1,120.
One set of four is required for both tractor and for each
trailer. The trailers also include $2,400 for aerodynamic

100 A p p e n d i x C
R E D U C I N G Heavy-Duty Long Haul Combination Truck Fuel Consumption and CO2 Emissions
retrofits, which include skirts and either a front fairing or
a boat tail. Trailer dimensions were 13’ 5” to 13’ 7” high,
48’ - 53’ long, and 102” wide).
Total marginal cost for this package was estimated at
$22,930 including one modified tractor, three modified
trailers and the APU.
Cost of Package 3: SmartWay 1 + SmartWay 2This advanced SmartWay package (Package 3) includes
additional trailer aerodynamic devices needed to achieve a
reduction in CD from 0.5 to 0.4. This package also includes
lower rolling resistance tires sufficient to lower the coeffi-
cient of RR to 0.0045. The lower rolling resistance tires are
assumed to be an incremental improvement from the super
single tire package in Package 2 and therefore incur no ad-
ditional cost. Achieving this level of aerodynamic improve-
ment requires a combination of advanced drag reduction
approaches that have not been demonstrated commercially.
Achieving this level of drag reduction is very challenging
given the present operational constraints of industry. Based
on discussions with industry experts [Salari, Marinko] and
a review of the available literature, we estimate that a CD
of 0.4 is feasible using the following combination of design
modifications to the tractor and the trailer:
– Smartway Tractor: Going from the baseline
(Package 1) “partial Smartway” tractor to a full
Smartway tractor reduces CD of the vehicle from
0.63 to 0.59. This represents a 6% reduction in CD.
– Advanced Smartway tractor modifications:
Additional streamlining of the tractor beyond the
level offered by Smartway includes underbody
treatments, down exhaust, a lowered ride height, as
well as continued optimization of the tractor body.
It would also require wheel skirts or hubcaps. We
have assumed that these further design modifications
could reduce CD by an additional 4 to 6%.
– Gap Treatments: Improved integration between the
tractor and trailer interface. This could take the
form of a front fairing on the trailer, or extended cab
side and roof fairing treatments. These types of
devices have demonstrated reductions in CD that
range from 3% to 5% [TMA].
– Trailer Roof Redesign: Redesign of the trailer body
to use a tear drop design that smooth airflows
coming off the top and side of the tractor. In addition,
an inset roll-up door and aerodynamic mud flaps can
offer additional reductions. Don-Bur, a trailer
manufacturer in England, currently manufactures
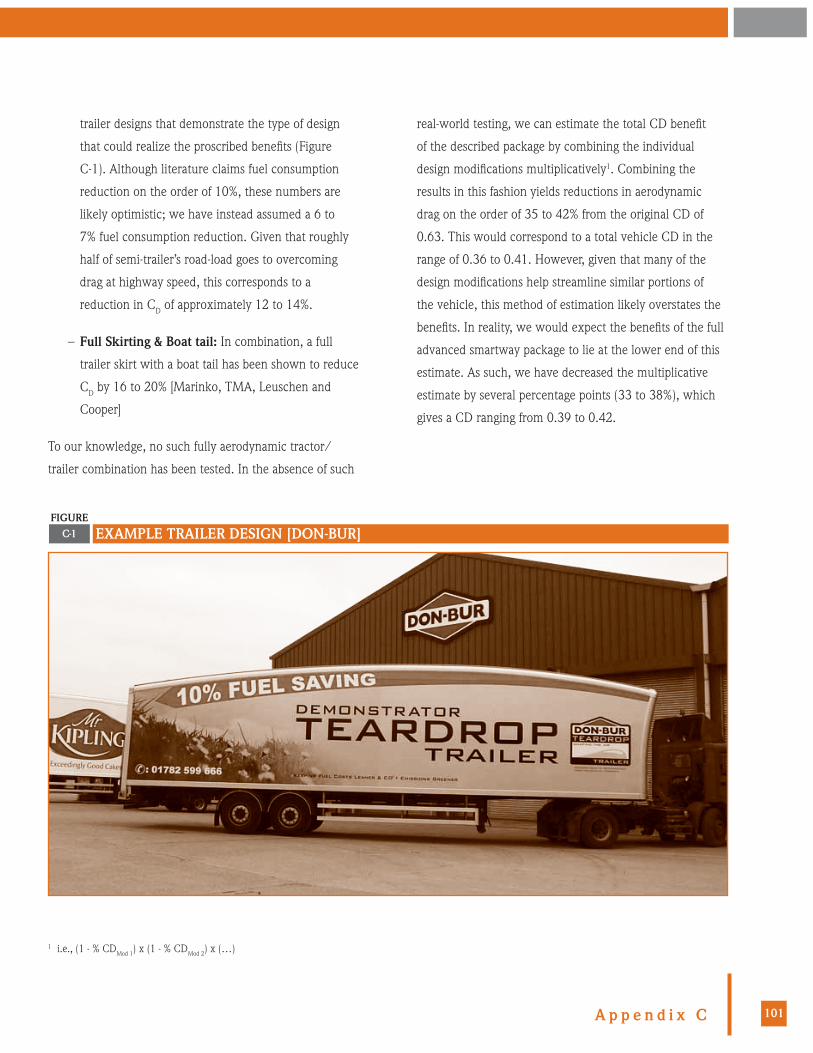
101A p p e n d i x C
trailer designs that demonstrate the type of design
that could realize the proscribed benefits (Figure
C-1). Although literature claims fuel consumption
reduction on the order of 10%, these numbers are
likely optimistic; we have instead assumed a 6 to
7% fuel consumption reduction. Given that roughly
half of semi-trailer’s road-load goes to overcoming
drag at highway speed, this corresponds to a
reduction in CD of approximately 12 to 14%.
– Full Skirting & Boat tail: In combination, a full
trailer skirt with a boat tail has been shown to reduce
CD by 16 to 20% [Marinko, TMA, Leuschen and
Cooper]
To our knowledge, no such fully aerodynamic tractor/
trailer combination has been tested. In the absence of such
real-world testing, we can estimate the total CD benefit
of the described package by combining the individual
design modifications multiplicatively1. Combining the
results in this fashion yields reductions in aerodynamic
drag on the order of 35 to 42% from the original CD of
0.63. This would correspond to a total vehicle CD in the
range of 0.36 to 0.41. However, given that many of the
design modifications help streamline similar portions of
the vehicle, this method of estimation likely overstates the
benefits. In reality, we would expect the benefits of the full
advanced smartway package to lie at the lower end of this
estimate. As such, we have decreased the multiplicative
estimate by several percentage points (33 to 38%), which
gives a CD ranging from 0.39 to 0.42.
C-1FIGURE
EXAMPLE TRAILER DESIGN [DON-BUR]
1 i.e., (1 - % CDMod 1) x (1 - % CDMod 2) x (…)

102 A p p e n d i x C
R E D U C I N G Heavy-Duty Long Haul Combination Truck Fuel Consumption and CO2 Emissions
DELTA CD PER TRAILER QUANTITY TOTAL (3 TRAILERS)
Tires + Wheels – cab – $1,120 Times 1 $1,120
Tires + Wheels - trailer – $1,120 Times 3 $3,360
Smartway cab 6% $2,750 Times 1 $2,750
Advanced Smartway cab 4 to 6% $2,000 Times 1 $2,000
Tear-drop trailer 12 to 14% $7,500 Times 3 $22,500
Skirting, boat-tail, & gap treatment
18 to 21% $1,500 Times 3 $4,500
APU – $8,000 Times 1 $8,000
Lubricants – $500 Times 1 $500
Total ~33 to 38% $23,990 – $44,730
C-1TABLE
COSTS & CD BENEFITS OF THE ADVANCED SMARTWAY (CD = 0.4) PACKAGE
The costs for such a package are highly uncertain, as no
such design has been demonstrated commercially. The
following assumptions are used to estimate the total cost of
the advanced smartway package:
– It is assumed that as smartway trailer designs are
more widely adopted, features such as boat-tails, side
skirts, and trailer gap fairings are likely to be
integrated into the design of the trailer. In
addition, we have not included boat-tailing in the
advanced smartway specification. These changes
would dramatically reduce the cost of these features
compared to the retrofit devices that were priced
in package 1. We have assumed that the skirts, boat
tail, plus gap fairing will cost on the order of $1,500
per trailer, down from the $2,400 assumed for the
original Smartway package (package 2).
– The major additional cost comes from the trailer
design modifications that have been proposed. No
actual cost estimates are currently available for such
a system in high-volume production; it is likely that
demonstrator versions would cost about double
a typical dry-box van trailer, which cost on the order
of $30,000. In high volume, the cost of these design
modifications would be significantly lower. We have
assumed that in high volume, the price of this
advanced tear-drop design would increase the cost of
the trailer by 20%, giving an incremental price of
$7,500 per trailer.
– Design modifications to the tractor are assumed to
come at a slightly lower incremental cost to those
anticipated for Package 2. The proposed
modifications include evolutionary modifications
to the tractor design (which may increase
manufacturing costs), as well as underbody
treatments and full skirting of the cab. In
combination, we estimate these design modifications
to cost on the order of $2,000.
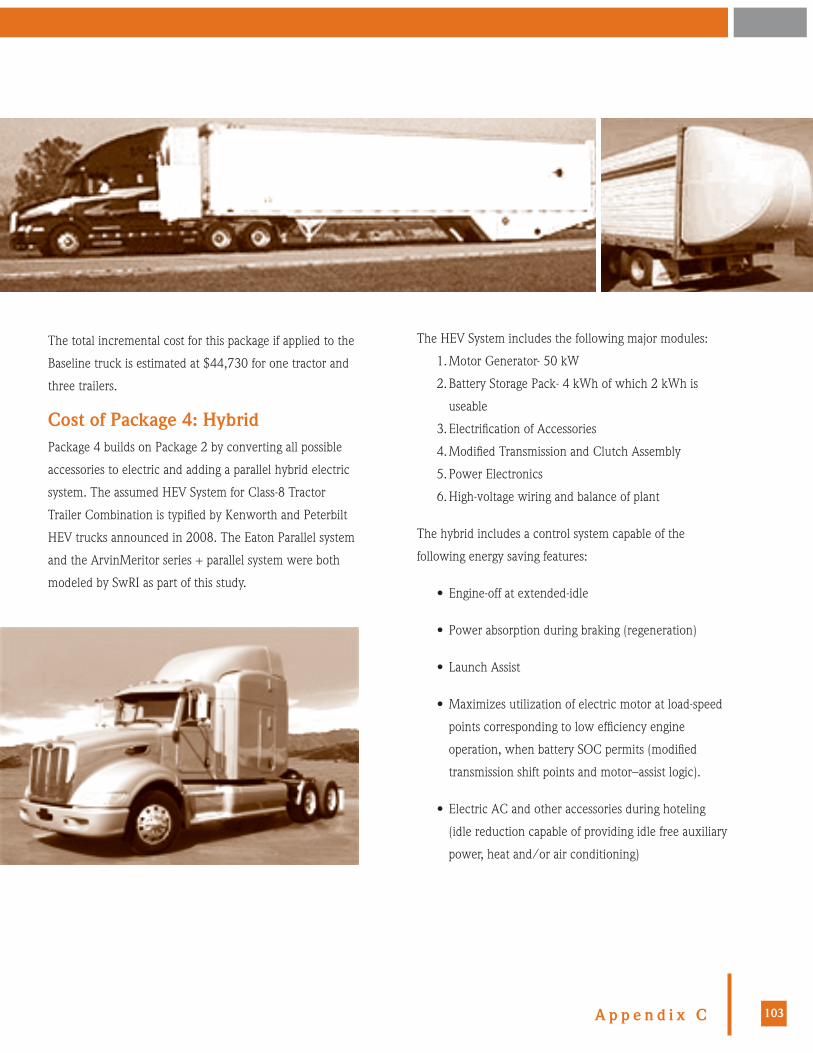
103A p p e n d i x C
The total incremental cost for this package if applied to the
Baseline truck is estimated at $44,730 for one tractor and
three trailers.
Cost of Package 4: HybridPackage 4 builds on Package 2 by converting all possible
accessories to electric and adding a parallel hybrid electric
system. The assumed HEV System for Class-8 Tractor
Trailer Combination is typified by Kenworth and Peterbilt
HEV trucks announced in 2008. The Eaton Parallel system
and the ArvinMeritor series + parallel system were both
modeled by SwRI as part of this study.
The HEV System includes the following major modules:
1. Motor Generator- 50 kW
2. Battery Storage Pack- 4 kWh of which 2 kWh is
useable
3. Electrification of Accessories
4. Modified Transmission and Clutch Assembly
5. Power Electronics
6. High-voltage wiring and balance of plant
The hybrid includes a control system capable of the
following energy saving features:
• Engine-off at extended-idle
• Power absorption during braking (regeneration)
• Launch Assist
• Maximizes utilization of electric motor at load-speed
points corresponding to low efficiency engine
operation, when battery SOC permits (modified
transmission shift points and motor–assist logic).
• Electric AC and other accessories during hoteling
(idle reduction capable of providing idle free auxiliary
power, heat and/or air conditioning)
104 A p p e n d i x C
R E D U C I N G Heavy-Duty Long Haul Combination Truck Fuel Consumption and CO2 Emissions
• Electrification of Cooling Fan, Steering, Brakes,
Water pump
Cost Estimate and Assumed Timing of Market Introduction:
Moderate volume cost was estimated to be approximately
$35,000 (range of $30,000 to $40,000). Higher volume
cost was estimated to be approximately $23,000 (range of
$20,000 to $26,000). Provided line haul truck manufactur-
ers proceed to launch this HEV configuration as a product
line, moderate volume (200-1000 per year) is expected in
2009-2012 and higher volume (2000-10,000 per year) is
expected in 2013-2017. The details of these cost estimates
are provided below.
The ex-factory cost of HEV-equipped heavy duty trucks can
be expected to follow the common evolution from high
premiums in the early years (as driveline suppliers attempt
to at least partially recoup their non-recurring design-
development investments), followed by price reductions
due to increased sales volume (economies of scale of
manufacturing and assembly). The price history of HEV-
equipped transit buses can provide an indication of these
early cost trends. For example in the early years when HEV
bus sales were in the 10s per year, the price premium for
an HEV-equipped transit bus was approximately $200,000
per bus. Later when sales volume rose to 50-100 per year,
the price premium decreased to approximately $100,000
per bus. Now that BAE and Allison each have about 1000
HEV buses deployed, the initial investment is presumably
largely recovered and prices are in position to decrease as
volume increases more (currently 15% to 20% of all transit
bus sales are HEV).
The Class-8 HEV truck cost evolution is expected to follow
similar trends, only with a somewhat lower cost starting
point (since the first HEV line-haul truck announced in
2008 leveraged the previous heavy-duty hybrid manu-
facturing infrastructure). The fleet buyer’s decision for
heavy-duty trucks will be much more sensitive to payback
period and demonstrable fuel-saving benefits than was the
case for the transit industry (where the FTA absorbs a large
share of the investment of a new vehicle). A number of
heavy-duty HEV trucks have already been purchased by
fleets for demonstration and evaluation purposes, and in
the early years these too have been priced at a significant
(non-economic) premium, justified by the value of the early
lessons and demonstration evaluation. Government fund-
ing has been available in some instances. In 2005-2007 a
number of heavy-duty HEV truck models were announced
to be in limited production, such as:
• In 2007 International launched their Class 6-7
Durastar-based HEV in volumes of about 200 trucks
so far, reportedly at $53,000 premium with PTO
($43,000 without PTO).
• Eaton successfully completed their trial of a fleet
of HEV delivery trucks (Class 4) and announced they
are moving into production.
• Freightliner plans to produce 1500 M2 HEV trucks
(Class 6-7) based on the Eaton system in the next
three years.
• Peterbilt introduced a Class 8 hybrid using the Eaton
system and an automated-manual transmission. Bill
Kahn of Peterbilt reported $9,600 savings per year
through 8% FE improvement and anti-idling; and
105A p p e n d i x C
indicated a less than 3 year pay-off for the hybrid
system.
• Volvo announced production of heavy-duty HEV
trucks starting in 2009.
• Arvin Meritor agreed to supply Class 8 HEV trucks
for Walmart.
• Azure/StarTrans producing Class 3 HEV Ford shuttle
buses at approximately $35,000 premium.
As of the first quarter 2008, the aggregate number of
heavy-duty HEV trucks in service (including delivery
trucks) is estimated at 500 and the sales volume is
expected to be about 200-400 per year in 2008, a figure
which includes the Fed Ex, Purolator, UPS and Coca Cola
HEV demonstration trucks (Reference: telecom with Bill
Van Amburg of WestStart, March 2008). Although line
haul HEV trucks are quite few in number, this is expected
to change since Peterbilt, Volvo, International and other
truck builders have recently announced Class 8 Line-Haul
HEV demonstrator vehicles.
For the short term (2009-2011), given fuel price
expectations, the interest in HEV trucks is relatively robust,
and year-over-year sales are expected to be robust. If this
scenario in fact comes true, the HEV truck sales volume
will reach approximately 1000 (which is about 3-4% of
sales) by the year 2010. This level of sales would not be
expected to be enough to really drive down HEV prices
significantly, but the HEV market would then be positioned
to rapidly expand (see below).
The key assumption is that driveline suppliers such as
Eaton, Allison and BAE will elect to offer a single common
HEV architecture across all heavy duty truck models and
body types. This will accomplish economies of scale and
volume parts discounts in the assembly of HEV trucks. For
example the new Peterbilt Class 8 HEV Line-Haul truck
utilizes essentially the same Eaton-assembled HEV archi-
tecture and components as used in the Class 4 Eaton HEV
delivery truck.
Another key assumption is that the driveline manufacturer
does not have to reach an annual production volume of
20,000 units in order to reduce costs significantly. It is
estimated that a new cost plateau can be reached at about
2500 or more annual production for any given driveline
manufacturer (and this volume can be made up of diverse
truck types such as HEV delivery trucks, HEV utility trucks,
HEV line haul trucks, etc)2. One scenario is that HEV truck
sales continue to rise after 2010 and this “trigger point” of
2500/year might be reached at some point in the 2014-
2020 timeframe, depending on a number of factors.
The market for HEV trucks (including HEV line-haul
trucks) will be driven by several factors:
• Diesel fuel prices sustained at well above $3.00 a
gallon and/or increasing.
• Greenhouse gas policy actions by California and
other states as well as the Federal government
(carbon taxes, carbon cap and trade, LCFS
measures, etc)
• Anti-idling and over-nighting restrictions set by state
and local authorities
2 Telecon with Bill Van Amburg of WestStart, March 2008

106 A p p e n d i x C
R E D U C I N G Heavy-Duty Long Haul Combination Truck Fuel Consumption and CO2 Emissions
C-2FIGURE
HEV COSTS AS A FUNCTION OF ANNUAL VOLUME
$100,000-200,000
Late 2007
Li -Ion Battery Cost Reduction
2-3/Year 25/Year 250/Year 2,500/Year 25,000/Year
Note: Costs in 2008 Dollars
50,000
100,000
All HD Truck Industry HEV Sales
10/Year 100/Year 1000/Year 10,000/Year 10,000/Year
Individual Supplier Volume
2004-2006 First Prototypes
“Trigger Point” withStep Change in Cost
Acceleration of Market
(2014-2020 Timeframe)Robust HEV
Market
DESCRIPTION % COMPONENT COSTS AT FACTORYMotor/Generator 50kW 13% $1,500 assuming $30 per kW
Battery Pack 4 kWh 28% $3,200 assuming $800 per kWh
Power Electronics 13% $1,500 assuming $30 per kW
Wiring/Balance of Plant %20 $2,300 based on 25% of all other
Modified Clutch Assembly and Automated Manual Upgrade
16% $2,000
Electrification of Accessories 9% $1,000
Total Components Cost 100% $11,500
Initial Low Volume Pricing $35,000Higher Volume Retail Pricing @ 2.0 RPE $23,000
C-2TABLE
HEV SYSTEM COMPONENTS

107A p p e n d i x C
Estimated Pricing of the HEV Option for Class-8 Line-Haul Trucks (low volume)
It is instructive to review the rough costs of individual
major components of a typical truck sized HEV system
Table C-2 shows the major components of a typical HEV
system and the cost of each component (not including such
one-time investments as design and development testing).
Based on the above reasoning the premium pricing of the
HEV option is presented in three timeframes as follows:
• Near term (low volume) $60,000 to $100,000
per truck
• Moderate volume of 200-1000 per year: $30,000 to
$40,000 per truck
• Higher volume of 2000-10,000 per year: $20,500 to
$26,000 per truck
In the year 2012-2015 the moderate volume might be
applicable, and in the year 2015-2020 the higher volume
might be applicable.
Fleet buyer’s decision criteria as to HEV based on cost and benefits
The early adopters of HEV line-haul trucks are likely to be
large fleet owners who might use a longer payback period
as their threshold, whereas the sole-proprietors will be
following later in the product lifecycle after volume is up
and costs are somewhat reduced.
Forward pricing strategies are likely to come into play in
the heavy-duty truck HEV market. The truck builders may
offer artificial discounts on their HEV option in anticipation
of driving up sales volumes enough to lower their unit
production costs (ex-factory). It has been reported that
Toyota used similar strategies in the early years of light-duty
hybrid car sales, offering the Prius at a premium far under
their true incremental cost.
Cost of Package 5: Mechanical TurbocompoundingPackage 5 builds on Package 2 by adding a mechanical
turbo compound system. This package, based on the Volvo
D12 engine, is very similar to the new Detroit Diesel
DD15 engine. The costs of a mechanical turbocompound
system include the addition of port liners to retain thermal
energy ($500), the addition of VVA to the engine cylinders
($300), and a high efficiency power turbine ($1,850). The
package also incorporates a Scania design with a 12-liter
engine power train. It is important to note the potential for
2010 system design issues and variability among engines
due to thermal management of aftertreatment devices. This
variability could cause a 20-30% price impact on estimated
package cost. Total cost for this package was estimated at
$2,650.
Cost of Package 6: Electrical TurbocompoundingBecause there is a great deal of overlap between the
electrical turbocompounding system and both the mechani-
cal turbocompound and the hybrid system, the electrical
turbocompound costs use similar assumptions to these
other cost estimates. The electric turbocompound includes
the same components as a mechanical turbo-compound.
In addition, it adds an electric motor/generator, associated
power electronics, and electric accessories. Because it
includes several components in common with the hybrid,
electric turbocompounding can be synergistically combined
with the hybrid package at lower cost than would be sug-
gested by our estimate of the two standalone systems.
108 A p p e n d i x C
R E D U C I N G Heavy-Duty Long Haul Combination Truck Fuel Consumption and CO2 Emissions
The costs of an electrical turbocompound system include
the mechanical turbocompound package cost of $2,650
(see above) plus the 40 kW motor-generator ($1,200),
associated power electronics ($1,200 at $50 per kW),
electric accessories at $1,000 and balance of plant at $500
for a total cost of $6,550.
Cost of Package 7: Variable Valve ActuationPackage 7 adds variable valve actuation (VVA) to Package
5 (mechanical turbocompounding). VVA is expected to
work best when combined with a turbo compound system.
There are two distinct designs of VVA, only one of which is
in production:
• Full-Authority VVA, which is designed to be fully
adjustable during engine transients, actuated with
fast response devices such as camless or hydraulic-
electric mechanisms (e.g. Sturman VVA technology)
• Conventional “lost-motion” VVA which has restricted
preset valve settings which are cam actuated (e.g.
Caterpillar VVA).
Full-Authority VVA Costs: Potential VVA technology
suppliers such as Sturman have yet to show that their fully
adjustable VVA system is market-ready; test data from pro-
totypes are not available. The fully adjustable configuration
of VVA is likely to carry a significant cost increase to the
manufacturer. Hydraulic valve actuation or camless actua-
tion mechanisms would add a significant cost in excess of
any potential cost savings for manufacturers once control
logic software is embedded in engine control software. Soft-
ware advancements were assumed to be free. Presumably a
significant portion of the cost associated with implementing
any full-authority VVA package would be licensing fees
and amortized development costs. We were not able to
accurately estimate the cost for this type of VVA.
Conventional “Lost-motion” VVA Costs: This type of VVA
design was selected as the basis for Package 7. An estimate
of $50 per cylinder incremental cost was assigned for VVA
implementation in production volumes. The total marginal
cost therefore is estimated at $300 above the Package 5
Costs (see above).
Cost of Package 8: Bottoming CyclePackage 8 combines VVA, SmartWay 2 (Package 3) and a
Rankine bottoming cycle system recovering heat from both
the EGR cooler and an exhaust stack boiler. It was assumed
that the EGR cooler and bottoming cycle system would be
co-designed as a package to meet both emissions and fuel
economy targets. Bottoming cycles are a relatively mature
technology for stationary diesel and natural gas engines in
the 1,000 kW to 20,000 kW class, and bottoming cycle
controls and packaging issues are relatively benign because
of constant speed operation at relative steady load. Bottom-
ing cycles have never been used for trucks, but early-stage
designs currently are being explored by selected engine
manufacturers. There are current examples from the 21st
Century Truck program, including conceptual designs
by Cummins and Caterpillar. For example, the Cummins
Rankine cycle [reference to DOE advanced engine paper
needed] uses heat from a massive EGR system. However,
because these designs are preliminary, it was decided to
develop a preliminary generic design for a truck bottoming
cycle on which to base the costing. The system was de-
signed to avoid impacting the DPF or NOx aftertreatment.
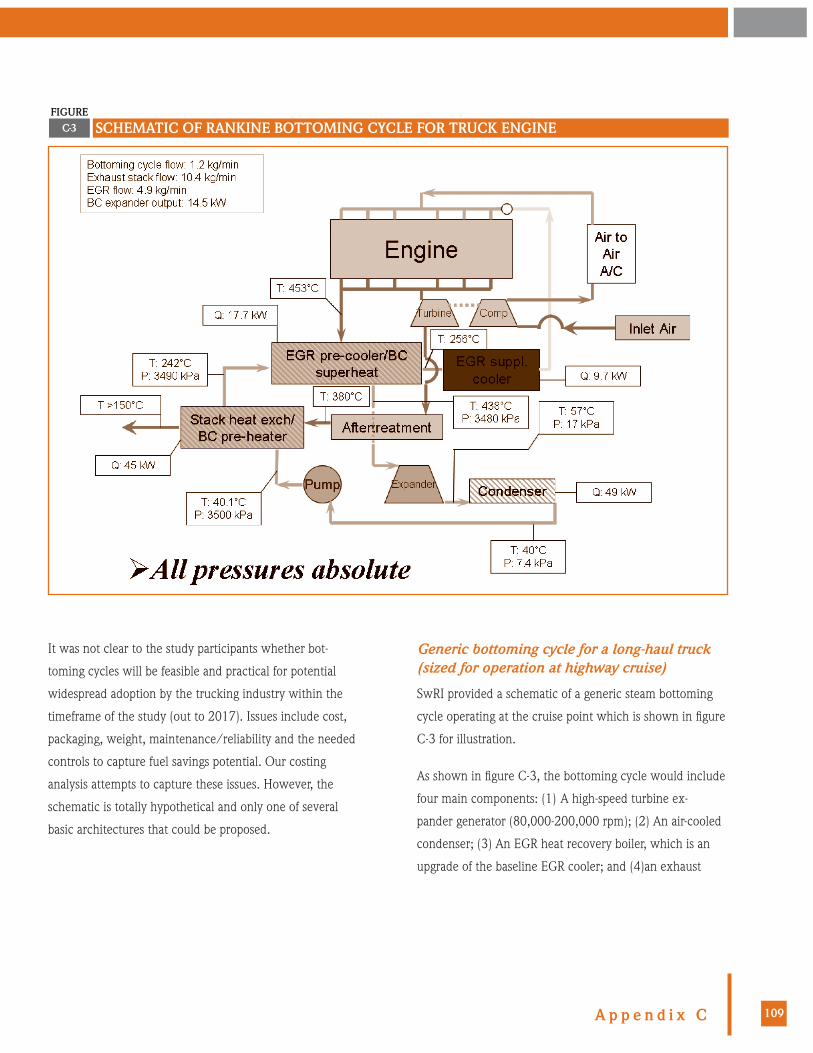
109A p p e n d i x C
It was not clear to the study participants whether bot-
toming cycles will be feasible and practical for potential
widespread adoption by the trucking industry within the
timeframe of the study (out to 2017). Issues include cost,
packaging, weight, maintenance/reliability and the needed
controls to capture fuel savings potential. Our costing
analysis attempts to capture these issues. However, the
schematic is totally hypothetical and only one of several
basic architectures that could be proposed.
C-3FIGURE
SCHEMATIC OF RANKINE BOTTOMING CYCLE FOR TRUCK ENGINE
Generic bottoming cycle for a long-haul truck (sized for operation at highway cruise)
SwRI provided a schematic of a generic steam bottoming
cycle operating at the cruise point which is shown in figure
C-3 for illustration.
As shown in figure C-3, the bottoming cycle would include
four main components: (1) A high-speed turbine ex-
pander generator (80,000-200,000 rpm); (2) An air-cooled
condenser; (3) An EGR heat recovery boiler, which is an
upgrade of the baseline EGR cooler; and (4)an exhaust

110 A p p e n d i x C
R E D U C I N G Heavy-Duty Long Haul Combination Truck Fuel Consumption and CO2 Emissions
stack heat exchanger/boiler. The SwRI bottoming cycle
design also includes additional battery storage to provide
for absorbing excess power during rapid decelerations, hill
climbs and other transient events.
System sizing for the line haul truck presents an interest-
ing optimization problem which deserves a more detailed
analysis than was possible under this project. The highway
cruise point on level roadway requires only a 12-14 kW
rated bottoming cycle, but this is seen as suboptimal con-
sidering the real life situations of accelerations and climbing
at grades. At the other extreme, the full load operation can
support a 57 kW rated bottoming cycle, but this is seen as
overly costly since the truck engine only rarely operates at
true full rated load and speed. Therefore an intermediate
rating was selected as a basis for costing. The bottoming
cycle system was assumed to be sized for 30 kW rating at
1600 rpm full load and 100 F ambient. The basic premise
is that for a long-haul truck, if the bottoming cycle is not at-
tractive at highway cruise, it probably will not make sense
for the complete typical drive cycle. The available EGR heat
is assumed to be supplemented by an exhaust stack heat
exchanger. The condenser is a finned-tube air-cooled heat
exchanger stacked with the engine radiator and assumes a
heat transfer coefficient of 20 BTU per hr-ft2-F. The fin-tube
boiler has a volume of approximately 1 cubic ft.
Cost Estimate:
The total marginal cost estimated for the 30 kW bottom-
ing cycle was $15,100 after production volumes become
significant (thousands per year). This technology will not
be available until 2015-2017 at the earliest and initial cost
the first few years would be expected to be at least double
($34,000 to $40,000). The basis for this cost estimate is
provided below.
Steam vs organic working fluid for Rankine bottoming cycle
The system assumed for Package 8 uses a steam Rankine
cycle. Steam has better heat transfer characteristics
and the potential for higher efficiency, but can present
expansion-turbine design challenges at small scale. These
challenges arise because high sonic velocity translates into
high turbine RPM (~200,000 RPM) and large expansion
ratio require multiple stages to realize efficiency potential.
Organic working fluids have higher molecular weight,
lower speed of sound, and lower pressure ratio, and hence
offer better matching with small turbine expanders (and
other types of expanders as well). Most bottoming cycle
developers for stationary engines have selected an organic
working fluid. These other working fluid systems could also
be an appropriate design choice.
In order to size and cost the various components, we
analyzed the steam cycle shown in figure C-XX above,
assuming:
• Heat to boil and superheat (by 150ºF) water is
supplied by the recoverable heat from the exhaust, as
defined above.
• Heat to preheat the water from the condensing temp
to the boiling temperature is supplied by an
economizer transferring heat from the exhaust
leaving the boiler to the feed water.
• Rough estimates from steam tables T-s diagram,
assuming 70% efficient expander.
• Condensing temperature is 200ºF at 100ºF
ambient, 150ºF at 60ºF ambient and 100ºF at 20ºF
ambient. There is a smaller temperature difference at

111A p p e n d i x C
20ºF ambient because there is no air conditioning
load and less overall thermal stress on the cooling
system.
The estimated bottoming cycle power output is 14 kW at
the truck highway cruise point. This power output can be
obtained at boiling temperatures of either 400ºF or 500ºF.
At the higher boiling temperature (500ºF), less heat can
be recovered from the exhaust, but the Rankine cycle
efficiency is higher; the reverse is true at the lower boiling
temperature of 400ºF.
The steam Rankine cycle requires a high speed (80,000-
200,000 RPM) turbine expander – generator. The electric
power output of this generator in turn powers a battery,
with power extracted as needed to contribute to the engine
shaft power output. The condenser is a finned tube air
cooled heat exchanger, stacked with the other air cooled
heat exchangers behind the front grill (air conditioning
condenser, charge air cooler, bottoming cycle condenser,
engine radiator). The estimated size and weight are based
on the following assumptions: (1) 20 fins/inch; (2) An air
side “h” of 20 Btu/hr-ft2-ºF; (3) Half of the overall heat
transfer resistance occurs on the air side; and aluminum
comprises approximately 15% of the volume solid material.
The boiler is a finned tube HX with fins on the exhaust
side. Its estimated size and weight are based on the follow-
ing assumptions: (1) 10 fins/inch; (2) Exhaust side “h” of
20 Btu/hr-ft2-ºF; (3) Half of the overall heat transfer
resistance occurs on the exhaust side; and aluminum
comprises approximately 15% of the volume solid material.
Rough estimates of the dimensions and weights of the
major bottoming-cycle components of a 30 kW output at
100ºF ambient temperature are summarized in Table C-3.
Figure C-3 shows the dimensions of the major components
compared with the physical dimensions of a typical heavy
duty truck engine.
MAJOR COMPONENT OF 12 KW SYSTEM APPROXIMATE DIMENSIONS WEIGHT (LB)Turbo expander – generator 6 inch diameter by 16 inches long 75
Air cooled condenser 36 inch X 20 inch X 1.5 inch deep 15
Exhaust heat recovery boiler 6 inch X 8 inch X 24 inch long 50
Exhaust Stack Heat Exchanger 6 inch X 8 inch X 24 inch long 50
Misc – working fluid, tubing, feed pump ~ 0.75 ft3 50
Total ~ 3 ft3 240
C-3TABLE
ESTIMATED DIMENSIONS AND WEIGHT OF MAJOR COMPONENTS OF BOTTOMING CYCLE
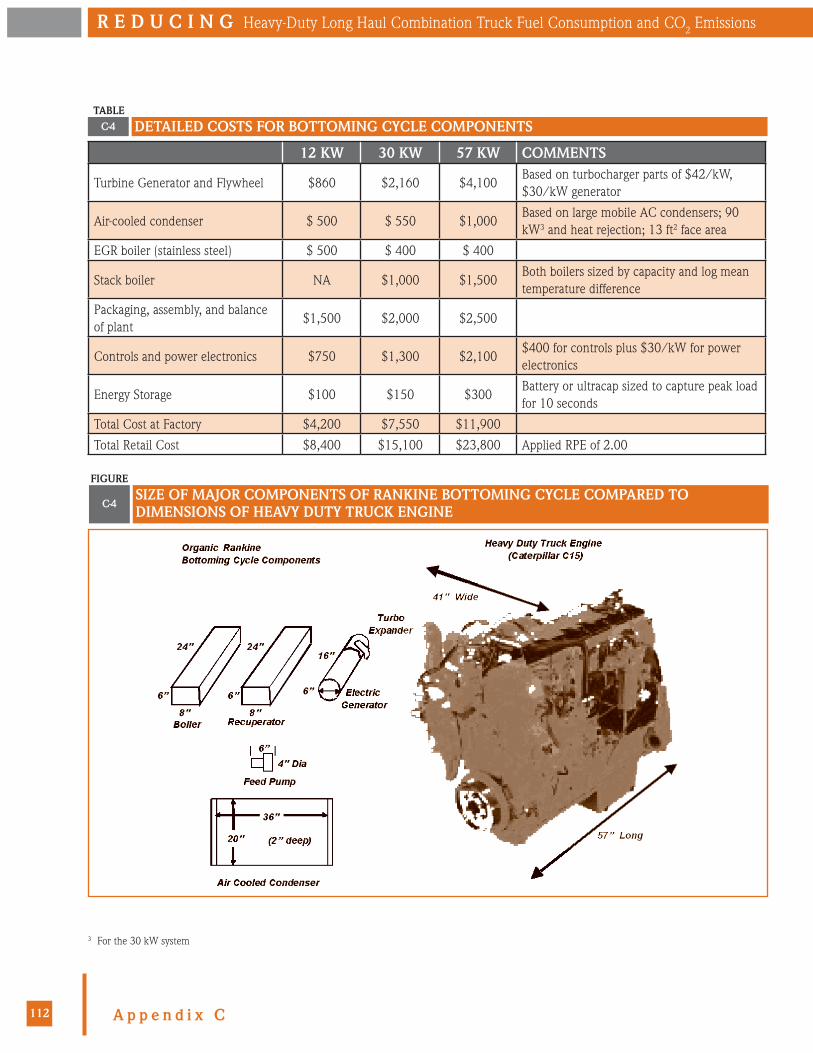
112 A p p e n d i x C
R E D U C I N G Heavy-Duty Long Haul Combination Truck Fuel Consumption and CO2 Emissions
12 KW 30 KW 57 KW COMMENTS
Turbine Generator and Flywheel $860 $2,160 $4,100Based on turbocharger parts of $42/kW, $30/kW generator
Air-cooled condenser $ 500 $ 550 $1,000Based on large mobile AC condensers; 90 kW3 and heat rejection; 13 ft2 face area
EGR boiler (stainless steel) $ 500 $ 400 $ 400
Stack boiler NA $1,000 $1,500Both boilers sized by capacity and log mean temperature difference
Packaging, assembly, and balance of plant
$1,500 $2,000 $2,500
Controls and power electronics $750 $1,300 $2,100$400 for controls plus $30/kW for power electronics
Energy Storage $100 $150 $300Battery or ultracap sized to capture peak load for 10 seconds
Total Cost at Factory $4,200 $7,550 $11,900
Total Retail Cost $8,400 $15,100 $23,800 Applied RPE of 2.00
C-4TABLE
DETAILED COSTS FOR BOTTOMING CYCLE COMPONENTS
C-4
FIGURE
SIZE OF MAJOR COMPONENTS OF RANKINE BOTTOMING CYCLE COMPARED TO DIMENSIONS OF HEAVY DUTY TRUCK ENGINE
3 For the 30 kW system

113A p p e n d i x C
Bottoming Cycle Component Costs:
Based on the sizes, materials, and weights of these
components, and based on the typical costs of conventional
HVAC manufactured items such as heat exchangers and
compressors which are similar in function, cost for the
bottoming cycle system were estimated. The estimated
costs for these components are detailed in Table C-4.
Figure C-4 provides a schematic illustrating the size of the
different bottoming cycle components relative to a heavy-
duty truck engine.
Cost of Package 9: Longer / Heavier TrucksPackage 9 builds on Package 2 with “highway doubles”
which create a gross vehicle weight (GVR) and volume
increase. This package is assumed to be based on the
Scandinavian approach of 60 metric tons (about 132,000
pounds) and 25 meters total combination length. We
estimated the cost for this package by assuming three cost
elements:
• Powertrain modifications for maintaining speed
at grade
• Safety features
• Incremental cost of two doubles vs three singles
(assuming that in fleets, ten “doubles” would suffice
in place of fifteen single trailers).
In the power-train area, the base engine size would
increase by approximately 3L to accommodate the added
load. Besides the engine block itself, engine cooling and
aftertreatment systems (as well as some other smaller
systems) would also have to increase proportionally. The
transmission would need to be modified for higher loads.
We estimate the incremental cost of these power-train
modifications to be $7,500.
Safety features such as disc brakes, stability controls, and
vision systems were assigned a retail incremental cost
budget of $4,000.
The incremental cost of two doubles over three single
trailers was estimated at $6,000. This includes the added
cost of the trailer, plus the additional aerodynamic devices
and super single tires included in the Advanced Smartway
package.
C-5FIGURE
ROCKY MOUNTAIN DOUBLE
(Source: FHA)

114 A p p e n d i x C
R E D U C I N G Heavy-Duty Long Haul Combination Truck Fuel Consumption and CO2 Emissions
The total retail incremental cost for this package was
estimated at $17,500. It is interesting to note that Rocky
Mountain Doubles could be a negative cost package, since
fleet operators may find that they would need fewer cabs to
move an equivalent amount of freight. This nuance is not
captured in our analysis.
Cost of Package 10: Reduced Road SpeedThis package assumes speeds would drop to 60 miles per
hour or below. There were no hardware or technology
costs associated with this package.
Cost of Package 11: Advanced EGRThe advanced EGR concept that was modeled requires
additional cooling to a conventional EGR system. The
lower temperature exhaust reduces NOx, which allows
timing to be advanced, thereby offering incremental ef-
ficiency improvement. Such a system would likely require
an additional EGR cooler (or an enhanced primary EGR
cooler), as well as additional corrosion-resistant plumbing
to remove excess water and minor changes to the system
control. We estimate this package will cost on the order of
$750 ($500 for the cooler modifications, plus $250 for the
additional balance of plant).
Cost of Packages 12, 13, and 14: Maximum Technology CombinationsThe costs of three modeled packages are described in
this section – packages 12, 13, and 14. The costs of the
maximum technology combination packages are calculated
as the sum of the individual technology packages, less the
cost of any duplicate components (e.g., both the hybrid and
electric turbocompounding include a motor/generator):
Package 12: The maximum technology combination with
a single trailer – is estimated to cost $71,630. This includes
the cost of Package 3 ($44,730), Package 4 ($23,000),
Package 8 ($15,100), and Package 10 (No cost), minus
$3,200 in duplicated components between the hybrid
and bottoming cycle systems (motors, energy storage, and
power electronics). Package 12 also does not need the APU
that is included as part of package 3, because the hybrid
system already offers these idle reduction benefits; this
reduces the cost by an additional $8,000.
Package 13: Is estimated to cost $80,380. As described
in Chapters 2 and 3, this package includes a longer heavier
trailer, advanced aerodynamics (package 3 - $44,730),
hybrid (package 4 - $23,000), Package 6 ($6,550), Package
9 ($17,500), and Package 10 (No cost), minus $3,400 in
duplicated components between the hybrid and electric
turbocompounding systems and minus $8,000 for the
omission of the APU.
Package 14: The maximum technology combination
with a double trailer – is estimated to cost $89,130. This
includes the cost of Package 3 ($44,730), Package 4
($23,000), Package 8 ($15,100), Package 9 ($17,500), and
Package 10 (No cost), minus $3,200 in duplicated compo-
nents between the hybrid and bottoming cycle, and minus
$8,000 with the removal of the APU.
O&M CostsOperations and Maintenance (O&M) includes any ad-
ditional maintenance or repair costs that are incurred with
the addition of new technologies. For a typical long-haul
truck, O&M accounts for 5% of the total capital cost
every 100,000 miles [OOIDA]. We anticipate that many
115A p p e n d i x C
of the technologies examined would incur incremental
O&M costs significantly lower than this, for a number of
reasons: they typically do not require any additional routine
maintenance; they may require variations on existing
designs (and hence would have a similar repair schedule),
rather than the addition of new components; and to the
extent that new components are included, these are often
highly reliable and may be expected to last the life of
the vehicle. For packages that fall into this category, we
estimated that O&M costs would be close to those seen in
stationary applications, which are typically closer to 1% of
the capital cost per year [IEA]4. However, several packages
include specific components or add complexity that would
lead to significantly higher O&M costs. We estimated O&M
for these systems on a case-by-case basis.
Package 2 (Smartway): ($0.004/mi) The improved
aerodynamic cab and trailer design is not anticipated to
add significantly to O&M costs over the baseline vehicle.
However, the additional cost of single wide tires is incurred
every time tires are replaced and/or retreaded. OOIDA
estimates tire replacement costs of approximately $2,800
per 100,000 miles. The super single tires that were
specified cost approximately 10% more than the tires that
they replace; hence, it is assumed that they incur a $280
incremental cost per 100,000 miles. In addition, it is
assumed that the advanced lubricants need to be replaced
every 300,000 miles.
Package 3 (Advanced SmartWay): (negligible) Includes
only additional trailer aerodynamics, which we do not
anticipate will add to O&M costs.
Package 4 (Hybrid): ($0.006/mi) The hybrid includes
the addition of an electric motor/generator, power
electronics, electric accessories additional wiring, and a
battery. The added electronics and motor tend to be highly
reliable and should not require additional maintenance.
Added O&M due to these components is estimated at 1%
of capital per 100,000 miles. Real-world experience with
batteries in trucking applications, which includes a service
life of hundreds of thousands of miles, is limited. Batteries
in light-duty hybrids have demonstrated service lives of
100,000 to 200,000 miles over a 10 year life. For long-haul
trucking, we assume that batteries will last for 6 years. The
O&M costs amortize the future (discounted at 7%) battery
replacement cost over six years and include this cost in the
per-mile O&M5.
Package 5 & 6 (Mechanical & Electrical Turbo-
compounding): ($0.0003-$0.0007/mi) Both packages
require the addition of a power turbine and VVA; electrical
turbocompounding requires a power turbine plus an
additional motor and power electronics. These factors are
estimated to incur 1% for every 100,000 miles.
Package 7 (VVA): (negligible) Requires design modifica-
tion to the engine cylinders. This is not anticipated to add
significantly to O&M costs.
Package 8 (Bottoming Cycle): ($0.003/mi) The bottom-
ing cycle adds considerable complexity to the vehicle. For
this system, we assume a higher O&M cost of 2% for every
100,000 miles.
4 To equate capital costs in stationary applications (expressed in $/kWh) to mobile applications ($/mi), we assume an average vehicle speed of 60 MPH.
5 The longer service life (in terms of mileage) compared to light-duty applications reflects that: (1) there is a limited window for calendar life-based degradation, which can be an important limit on battery lifetime; (2) the steady-state nature of most of the long-haul duty cycle suggests that the battery will not see nearly as many cycle as a battery in a light-duty duty cycle. These estimates will need to be validated against real-world experience.
116 A p p e n d i x C
R E D U C I N G Heavy-Duty Long Haul Combination Truck Fuel Consumption and CO2 Emissions
Package 9 (Rocky Mountain Double): ($0.002/mi)
The Rocky Mountain Double includes a larger engine and
exhaust system, additional safety features and brakes; these
factors are not anticipated to add significantly to vehicle
O&M. These are estimated to incur 1% for every 100,000
miles. In addition, because the Rocky Mountain Double
includes 1.33 times more trailers, there is an added super
single tire replacement cost equal to one third the tire
replacement cost of the Smartway package.
Package 10 (60 MPH Speed Limit): (negligible) No
added cost.
Package 11 (Advanced EGR): (negligible) As an
enhancement to the conventional EGR system that already
exists on the baseline vehicle, we do not anticipate
additional costs.
Package 12 (Technology Packages): For the combined
technology packages, O&M costs are estimated as the sum
of the individual technology O&M costs.
The incremental cost of each technology package was
estimated following the methods described in Chapter 2.
Cost-Benefit ResultsUsing the methodology described in Chapter 2, TIAX
evaluated the cost effectiveness of different technology
packages. As discussed previously, two different figures of
merit were examined – the net cost of ownership over a
fifteen year vehicle lifetime, and the net cost of ownership
over a three year time horizon for both the 2008 EIA
reference and high fuel price scenarios. The results of these
calculations are shown in Figure C-6.
Two overarching themes emerge from these calculations.
First, there are a number of technologies that appear very
attractive when viewed over the fifteen time horizon (or
over a three-year time horizon with high fuel prices).
However, under the reference fuel price scenario (roughly
$2.50 per gallon), only the lower priced, lower benefit
technologies (VVA, advanced EGR, mechanical turbo-com-
pounding), and the two packages that entail operational
changes (speed limit reduction and longer, heavier trailers)
have a negative cost of ownership. This finding illustrates
the challenge of deploying new technologies in the fleet:
while a technology may be cost effective over the vehicle’s
service life, if fuel prices remain low, it may not be adopted
by the market.
Cost-Benefit Results of Individual Packages
Examining the results on a technology-by-technology basis,
these cost-of-ownership calculations may be used to loosely
group the technology packages into several categories:
Operational Changes – Speed limit & Longer, heavier
trailers (Packages 9 and 10): These packages are highly
cost-effective approaches to saving fuel. They each offer
significant savings over both a fifteen-year time horizon and
a three-year time horizon under both high and low fuel
price scenarios. Implementing these packages is as much of
a political question as they are an economic question.
Low Capital Cost Technologies – Advanced EGR,
VVA, Mechanical turbo-compounding, electric turbo-
compounding (Packages 5, 6, 7, and 11): These pack-
ages are generally low-cost (ranging from a few hundred
dollars to $7,000 for electric turbo-compounding), and
offer benefits that range from 1 to 4.5%. With the excep-
tion of electric turbo-compounding, they each offer payback
117A p p e n d i x C
within three years under the reference case fuel scenario;
electric turbo-compounding achieves payback in just under
four years under the reference case, and has a negative
cost of ownership over a fifteen-year time horizon in both
fuel price scenarios. These technologies are all relatively
low technical risk and are likely to be available in the next
several years. They would all potentially be attractive to
buyers who are sensitive to first cost.
High Capital Cost Technologies – Smartway,
Advanced Smartway, Hybrid and Bottoming cycle
(Packages 2, 3, 4, and 10): These packages all offer
significant fuel savings, but come at much higher cost
than the technologies discussed above. None of these
technologies achieve payback within three years under the
reference fuel price scenario. However, both Smartway
packages offer very high value over a fifteen year time
horizon, and are also very attractive over a three-year
time horizon with high fuel prices. The greatest barrier
to widespread adoption of the Smartway package is that,
given current standard practice in industry, the trailer
aerodynamic devices must be deployed on three different
trailers. The advanced Smartway package must also over-
come this barrier to adoption; in addition, its implementa-
tion would require dramatic changes to trailer design. The
bottoming cycle is a high technical risk package that could
offer high single-digit or low double-digit fuel savings; it
is likely to offer favorable payback over a fifteen-year time
horizon, or over a three-year time horizon with high fuel
prices. The hybrid package has a positive cost of ownership
over a three-year time horizon, and just breaks even over
fifteen years under the reference fuel price scenario. One
of the key factors influencing the hybrid’s payback is the
amortized cost of battery replacement. However, there are
synergies that may be realized when the hybrid system is
combined with other electrification strategies.
Technology Combinations (Package 12, 13, and 14):
The technology combination packages are highly cost-
effective when viewed over a fifteen year time horizon, and
are close to a negative cost of ownership over a three year
time horizon under a high fuel price scenario. However,
under the reference fuel price scenario, the realized fuel
savings over the first three years are not great enough to
overcome the high initial cost.
To the extent that the technology combination packages
are cost effective, it is due primarily to the inclusion of
the obvious winning technologies (Smartway, 60 MPH
governor, and Rocky Mountain Double). In some respects,
the cost-effectiveness of these individual technologies,
reflected by their negative cost of ownership, masks the
inclusion of other, less cost-effective approaches. At the
same time, the technology combination packages do
benefit from synergies between the hybrid system and
electric turbocompounding (in the case of the “Low Cost
Technology Combination”); and synergies between the
hybrid system and the bottoming cycle (in the case of the
two “Max. Technology Combinations”). Because there is
significant overlap in the components needed to implement
these increasingly electrified systems, the combinations are
more cost-effective than the standalone systems.
Figures C-7 and C-8 summarize graphically the 3-year and
15-year payback analyses. Figure C-7 shows the results of
the analysis for the 15-year payback case. The solid colored
bars represent the EIA low fuel price scenario and the
hatched bars represent the EIA high price scenario. In this
graph, negative numbers indicate a savings for the truck
owner.

118 A p p e n d i x C
R E D U C I N G Heavy-Duty Long Haul Combination Truck Fuel Consumption and CO2 Emissions
C-6
C-7
FIGURE
FIGURE
NET COST OF OWNERSHIP CALCULATION FOR TECHNOLOGY PACKAGES – 15 YEAR TIME HORIZON WITH TWO FUEL PRICE SCENARIOS
NET COST OF OWNERSHIP CALCULATION FOR TECHNOLOGY PACKAGES – 3 YEAR PAYBACK WITH TWO FUEL PRICE SCENARIOS
-$100
-$80
-$60
-$40
-$20
$0
$20
$40
Smartw
ay
Adv. Sm
artway
HEV (I
ncl. Idle
reductio
n)
Mech. T
urbo
Elec. T
urbo
VVA Botto
ming C
ycle
Rocky M
t Double
60 M
PH
Adv. EG
R
Tech. C
ombo 1
Tech. C
ombo 2
Tech. C
ombo 3
Ne
t Co
st o
f Ow
ners
hip
(10
00 $
)
EIA Low Fuel Price ($2.50/gal)
EIA High Fuel Price ($3.53/gal)
Ne
t Co
st o
f Ow
ners
hip
(10
00 $
)
-$25
-$15
-$5
$5
$15
$25
$35
Smartway
Adv. Smartway
HEV (Incl. Idle reduction)
Mech. Turbo
Elec. Turbo
VVABottom
ing Cycle
Rocky Mt Double
60 MPH
Adv. EGR
Tech. Combo 1
Tech. Combo 2
Tech. Combo 3
EIA Low Fuel Price ($2.50/gal)
EIA High Fuel Price ($3.53/gal)

119A p p e n d i x C
C-8
FIGURE
ANALYSIS OF CO2 AND FUEL USE AVOIDED IN THE U.S. LONG-HAUL FLEET ASSUMING ALL TECHNOLOGIES WITH A 15 YEAR PAYBACK ARE USED.
SW160 MPH R.M. Double
SW2M Turbo
E Turbo
0
2
4
6
8
10
12
14
16
18
20
2007
2008
2009
2010
2011
2012
2013
2014
2015
2016
2017
2018
2019
2020
2021
2022
2023
2024
2025
2026
2027
2028
2029
2030
Fue
l Use
d/A
void
ed
(B
Ga
l)
HEV+B. Cycle
HEV+ETurbo
Bottoming Cycle
E Turbo
M Turbo
SW2
R.M. Double
60 MPH
SW1
Fuel Used
2022: 4.7B Gallons of Fuel Saved
(30% below the base case)
Figure C-7 illustrates the results of the 3-year payback
scenario. In this Figure, solid bars also represent the EIA
low fuel price of $2.50 per gallon of diesel in 2022 and the
hatched bars represent the EIA high fuel price scenario of
$3.53 per gallon in 2022.
To assess the impact of fuel saving devices on the line-haul
tractor trailer fleet, we incorporated the results of the above
analysis into our bottom-up tractor trailer fleet model.
Because these technologies focus primarily on the long-haul
(as opposed to regional) portion of the fleet, the analysis
focuses on this fleet sub-segment. Two different technol-
ogy adoption scenarios were considered, and analysis was
conducted for both high and low fuel prices scenarios.
Reference Fuel Price ScenarioPredicted Fuel Consumption Reduction under Scenario A
The fleet model estimates that the technologies adopted in
Scenario A (the 15-year time horizon, which uses lifetime
NPV to select technologies) have the potential to reduce
fuel use in the long-haul truck fleet by 30%, or 4.7B gal-
lons, by 2022 under the reference case fuel price scenario.
These dynamics are illustrated in Figure C-6, which shows
the total projected fuel use to 2030, as well as the avoided
fuel use associated with individual fuel-saving technologies
for the long-haul section of the tractor trailer fleet.
Note that the top 3 technologies in the legend are not used under this case.

120 A p p e n d i x C
R E D U C I N G Heavy-Duty Long Haul Combination Truck Fuel Consumption and CO2 Emissions
As shown, fleet fuel use declines until 2022 to 2024, at
which point it slowly begins to rise again. Initially, reduc-
tions are primarily due to phase-in of trucks with SmartWay
1 packages and the 60-MPH speed limit. Beginning in
2017, SmartWay 2 and Rocky Mountain doubles dominate
the reduction wedge, although the turbo-compounding
package also offers significant benefit. The increase in fleet
fuel use beginning in 2022 arises due to continued growth
in freight ton-miles, coupled with the fact that no new
improvement options are introduced into the model after
2017. In reality, innovation will continue past this point,
but this nuance is not captured in the model, as it is not
clear which technology options will be available. Initially,
mechanical turbocompounding is adopted. Because it has
a net-negative cost of ownership and it offers greater fuel
savings than VVA and advanced EGR, it supersedes these
technologies in the fleet. Similarly, as the cost of electri-
cal turbocompounding goes down and fuel prices rise, it
supersedes mechanical turbocompounding in the market
beginning in the 2017 to 2020 timeframe. Due to their
high initial and O&M costs, neither the hybrid nor bottom-
ing cycle packages are adopted under the reference fuel
price scenario6.
Fuel Price and Technology Adoption Scenario Comparison
Figure C-9 shows the avoided fuel use in five-year incre-
ments for both scenarios under the low and high fuel price
scenario. As shown, Scenario A offers significantly more
fuel savings than Scenario B, particularly in the refer-
ence fuel price scenario. As might be expected, the high
fuel price scenario has a comparatively greater effect on
Scenario B (market-driven adoption) than on Scenario A.
As shown, Scenario A already implements most of the
available technologies across the entire fleet even under the
low fuel price scenario. The additional improvements occur
due to adoption of the bottoming cycle beginning in the
2020 timeframe.
The reduced fuel use in Scenario B stems from increased
technology penetration across the board: the combined
penetration of the two Smartway packages increases from
35 to 40% to over 60%, while Rocky Mountain Doubles
become nearly fully adopted. In addition, both electric
turbocompounding and the bottoming cycle increase their
market share at the expense of mechanical turbocom-
pounding, VVA, and advanced EGR.
6 Appendix E includes year-by-year market penetration of different technologies.
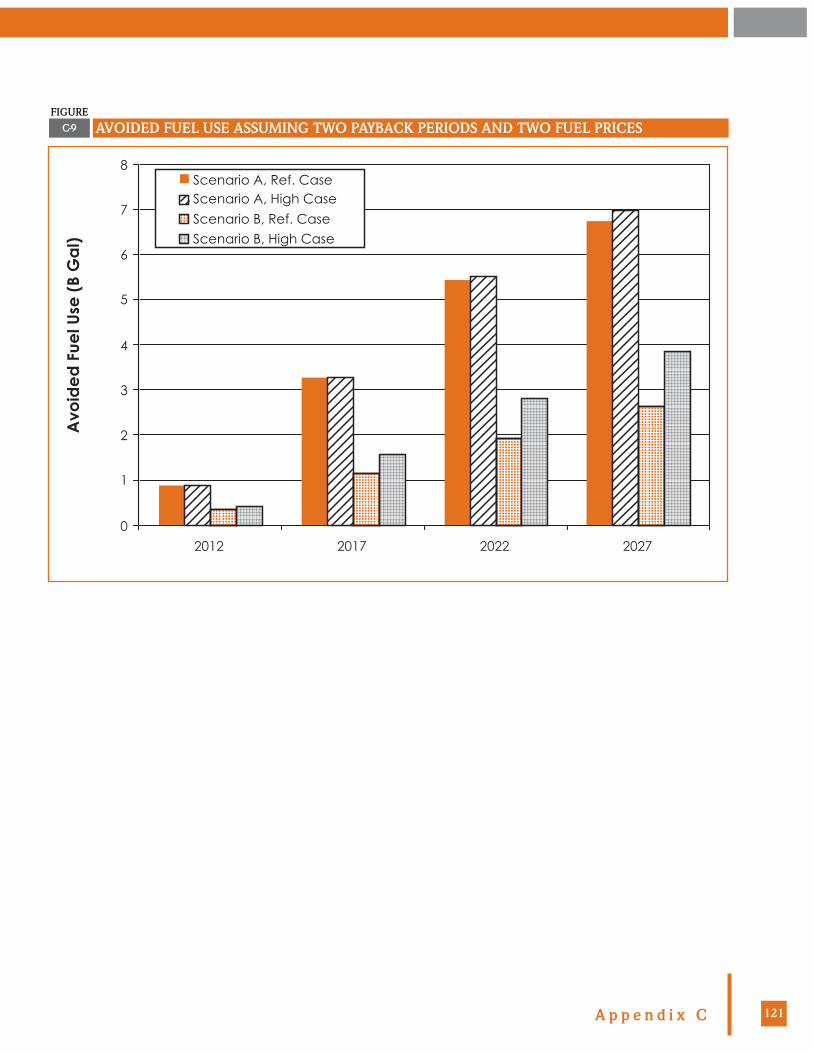
121A p p e n d i x C
C-9FIGURE
AVOIDED FUEL USE ASSUMING TWO PAYBACK PERIODS AND TWO FUEL PRICES
0
1
2
3
4
5
6
7
8
2012 2017 2022 2027
Avo
ide
d F
uel U
se (
B G
al)
Scenario A, Ref. CaseScenario A, High Case
Scenario B, Ref. Case
Scenario B, High Case

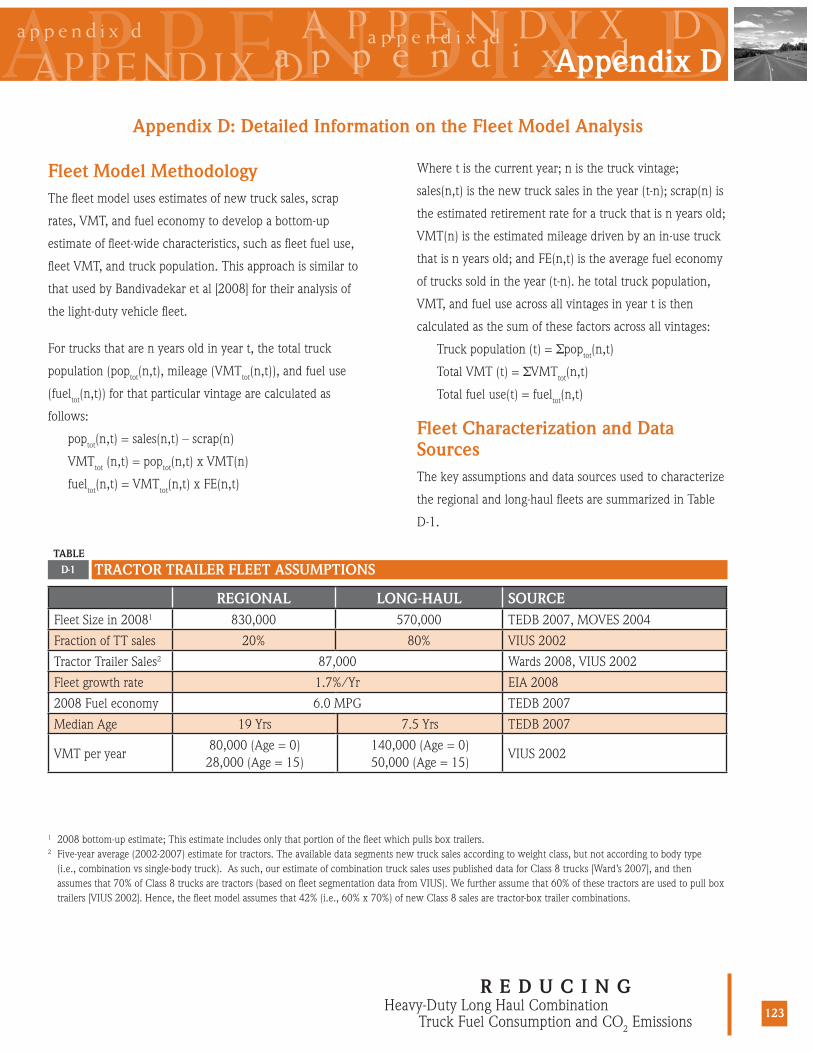
A P P E N D I X D
123
APPENDIX DA P P E N D I X Da p p e n d i x da p p e n d i x d
a p p e n d i x dAppendix D
R E D U C I N GHeavy-Duty Long Haul Combination
Truck Fuel Consumption and CO2 Emissions
Fleet Model MethodologyThe fleet model uses estimates of new truck sales, scrap
rates, VMT, and fuel economy to develop a bottom-up
estimate of fleet-wide characteristics, such as fleet fuel use,
fleet VMT, and truck population. This approach is similar to
that used by Bandivadekar et al [2008] for their analysis of
the light-duty vehicle fleet.
For trucks that are n years old in year t, the total truck
population (poptot(n,t), mileage (VMTtot(n,t)), and fuel use
(fueltot(n,t)) for that particular vintage are calculated as
follows:
poptot(n,t) = sales(n,t) – scrap(n)
VMTtot (n,t) = poptot(n,t) x VMT(n)
fueltot(n,t) = VMTtot(n,t) x FE(n,t)
Appendix D: Detailed Information on the Fleet Model Analysis
Where t is the current year; n is the truck vintage;
sales(n,t) is the new truck sales in the year (t-n); scrap(n) is
the estimated retirement rate for a truck that is n years old;
VMT(n) is the estimated mileage driven by an in-use truck
that is n years old; and FE(n,t) is the average fuel economy
of trucks sold in the year (t-n). he total truck population,
VMT, and fuel use across all vintages in year t is then
calculated as the sum of these factors across all vintages:
Truck population (t) = Σpoptot(n,t)
Total VMT (t) = ΣVMTtot(n,t)
Total fuel use(t) = fueltot(n,t)
Fleet Characterization and Data Sources The key assumptions and data sources used to characterize
the regional and long-haul fleets are summarized in Table
D-1.
REGIONAL LONG-HAUL SOURCEFleet Size in 20081 830,000 570,000 TEDB 2007, MOVES 2004
Fraction of TT sales 20% 80% VIUS 2002
Tractor Trailer Sales2 87,000 Wards 2008, VIUS 2002
Fleet growth rate 1.7%/Yr EIA 2008
2008 Fuel economy 6.0 MPG TEDB 2007
Median Age 19 Yrs 7.5 Yrs TEDB 2007
VMT per year80,000 (Age = 0)
28,000 (Age = 15)140,000 (Age = 0) 50,000 (Age = 15)
VIUS 2002
D-1TABLE
TRACTOR TRAILER FLEET ASSUMPTIONS
1 2008 bottom-up estimate; This estimate includes only that portion of the fleet which pulls box trailers. 2 Five-year average (2002-2007) estimate for tractors. The available data segments new truck sales according to weight class, but not according to body type (i.e., combination vs single-body truck). As such, our estimate of combination truck sales uses published data for Class 8 trucks [Ward’s 2007], and then assumes that 70% of Class 8 trucks are tractors (based on fleet segmentation data from VIUS). We further assume that 60% of these tractors are used to pull box trailers [VIUS 2002]. Hence, the fleet model assumes that 42% (i.e., 60% x 70%) of new Class 8 sales are tractor-box trailer combinations.

124 A p p e n d i x D
R E D U C I N G Heavy-Duty Long Haul Combination Truck Fuel Consumption and CO2 Emissions
The data sources used to characterize the fleet include the
Vehicle Inventory and Use Survey [VIUS 2002] from the
U.S. Census Bureau, the DOE’s Energy Information Admin-
istration [EIA 2008], the Transportation Energy Data Book
[TEDB 2007] published by Oak Ridge National Laboratory,
and Ward’s Automotive handbook [Ward’s 2007],. In addi-
tion, the EPA’s MOVES [2004] emissions model was used
to help guide our methodology.
In general, sources such as Ward’s, TEDB, and the FHA
provide the most accurate source of absolute numbers,
such as total vehicle miles traveled (VMT) and vehicle
population. The VIUS data, which is a broad-based survey
of commercial truckers, was then used to add fidelity to
these bottom-line numbers. For example, while VIUS’s
estimate of the total truck population is likely to be less
accurate than the FHA’s (which is based on actual registra-
tions), it can provide useful estimates of the breakdown
between regional and long-haul service or average annual
VMT for trucks function of age.
An initial survey of the tractor-trailer fleet using VIUS
indicated that these trucks exhibit widely varying duty
cycles and annual mileage depending on the truck’s age
and vocation. For the first five to seven years of its life, a
typical tractor-trailer would serve in “long haul” operation:
this duty-cycle is characterized by high annual mileage (up-
wards of 100,000 miles per year); long-range trips (operates
in a radius greater than several hundred miles); and travel
primarily over interstate highways at highway speeds. As
trucks age, an increasing fraction of these long-haul opera-
tors migrate to “regional” operation. These regional haulers
generally drive much shorter distances (on the order of
50,000 miles per year); operate within a confined region;
and may travel a significant number of miles in urban or
exurban areas at lower speeds with more frequent stops.
The median age of trucks in regional operation is on the
order of 18 to 20 years.
To capture the effect of these different operational profiles,
we segmented the tractor trailer fleet into “regional” and
“long haul” operators according to the average primary trip
length: Regional haul includes those tractor-trailers that
operate primarily within a 200-mile radius, while long-haul
operators have a primary radius greater than 200 miles.
Based on a review of available data, a profile for each sub-
segment of the fleet was developed. This profile includes
vehicle miles traveled as a function of age, survivorship as a
function of age, and the fraction of new vehicles that enter
each of the different fleets.
For both the regional and long-haul sub-fleets, mileage is
estimated to decline linearly with age to a minimum at
16 years, at which point the annual mileage is constant
throughout the remainder of the vehicle’s life. There is
limited data regarding trucks older than 16 years; however,
experience suggests that there is a floor to the miles that
an operator can use a truck and maintain profitability. The
average annual miles of a tractor trailer over a 19 year
median life is about 74,000 miles.
The segmentation of the fleet between long-haul service,
regional service, and retired trucks is estimated as a
function of vehicle age, shown in Figure D-1. As discussed
above, most new trucks (estimated at 80%) begin their
life in long-haul service and then migrate into the lower-
mileage regional segment. This migration is modeled using
a “long-haul service” survivorship curve, and is based
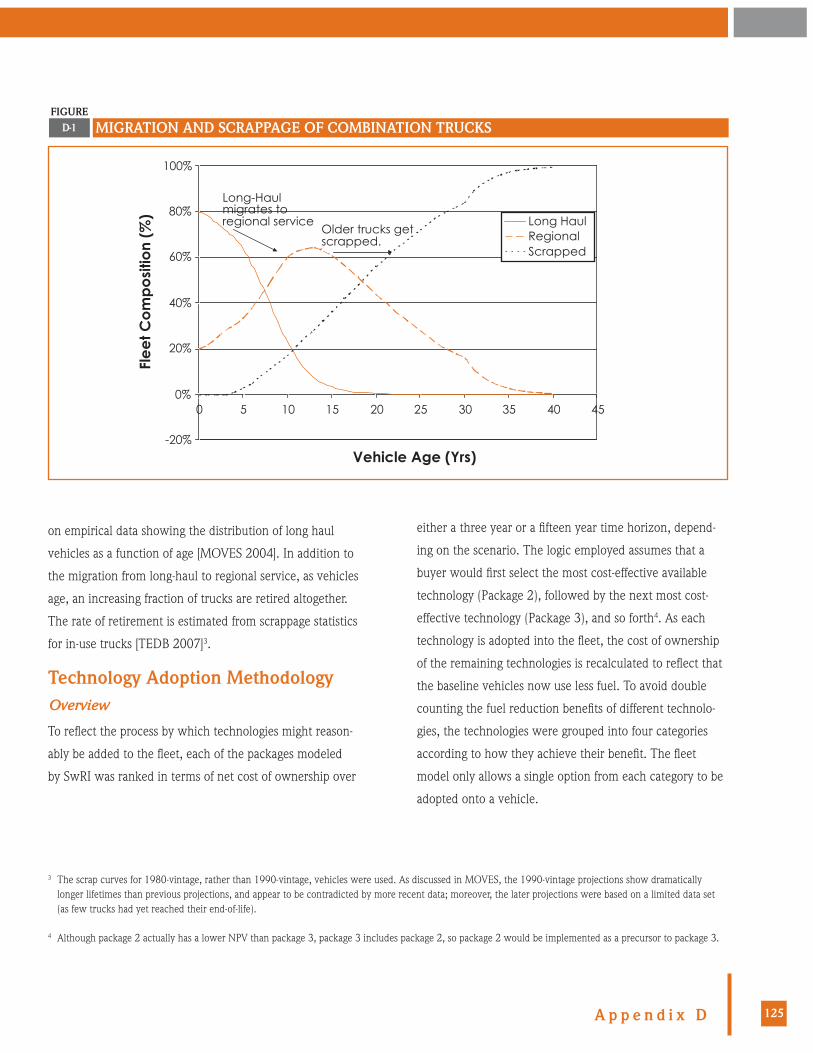
125A p p e n d i x D
D-1FIGURE
MIGRATION AND SCRAPPAGE OF COMBINATION TRUCKS
-20%
0%
20%
40%
60%
80%
100%
0 5 10 15 20 25 30 35 40 45
Vehicle Age (Yrs)
Fle
et C
om
po
sitio
n (%
) Long HaulRegionalScrapped
Long-Haul migrates to regional service
Older trucks get scrapped.
on empirical data showing the distribution of long haul
vehicles as a function of age [MOVES 2004]. In addition to
the migration from long-haul to regional service, as vehicles
age, an increasing fraction of trucks are retired altogether.
The rate of retirement is estimated from scrappage statistics
for in-use trucks [TEDB 2007]3.
Technology Adoption MethodologyOverview
To reflect the process by which technologies might reason-
ably be added to the fleet, each of the packages modeled
by SwRI was ranked in terms of net cost of ownership over
either a three year or a fifteen year time horizon, depend-
ing on the scenario. The logic employed assumes that a
buyer would first select the most cost-effective available
technology (Package 2), followed by the next most cost-
effective technology (Package 3), and so forth4. As each
technology is adopted into the fleet, the cost of ownership
of the remaining technologies is recalculated to reflect that
the baseline vehicles now use less fuel. To avoid double
counting the fuel reduction benefits of different technolo-
gies, the technologies were grouped into four categories
according to how they achieve their benefit. The fleet
model only allows a single option from each category to be
adopted onto a vehicle.
3 The scrap curves for 1980-vintage, rather than 1990-vintage, vehicles were used. As discussed in MOVES, the 1990-vintage projections show dramatically longer lifetimes than previous projections, and appear to be contradicted by more recent data; moreover, the later projections were based on a limited data set (as few trucks had yet reached their end-of-life).
4 Although package 2 actually has a lower NPV than package 3, package 3 includes package 2, so package 2 would be implemented as a precursor to package 3.

126 A p p e n d i x D
R E D U C I N G Heavy-Duty Long Haul Combination Truck Fuel Consumption and CO2 Emissions
AERODYNAMICS & ROLLING RESISTANCE
POWERTRAIN EFFICIENCY HIGHER PAYLOAD REDUCE ROAD SPEED
SmartWay Advanced SmartWay
VVA Adv. EGR Mech T.C. Elec. T.C. Bottoming Cycle HEV HEV + Elec T.C. HEV + Bot. Cycle
Rocky Mountain Double
60 MPH
D-2TABLE
GROUPINGS OF TECHNOLOGIES FOR FLEET ANALYSIS
YEARAERO & ROLLING RES. PACKAGES POWERTRAIN EFFICIENCY HIGHER
PAYLOADREDUCED
SPEEDSW1 SW2 MECH. TURBO ELEC. TURBO RMD 60 MPH
2007 0% 0% 0% 0% 0% 0%
2008 0% 0% 0% 0% 0% 0%
2009 20% 0% 0% 0% 0% 0%
2010 40% 0% 14% 0% 0% 20%
2011 60% 0% 29% 0% 0% 40%
2012 80% 14% 43% 0% 0% 60%
2013 71% 29% 57% 0% 0% 80%
2014 57% 43% 71% 0% 0% 100%
2015 43% 57% 86% 0% 9% 100%
2016 29% 71% 100% 0% 17% 100%
2017 14% 86% 100% 0% 26% 100%
2018 0% 100% 100% 0% 34% 100%
2019 0% 100% 86% 14% 43% 100%
2020 0% 100% 71% 29% 51% 100%
2021 0% 100% 57% 43% 60% 100%
2022 0% 100% 43% 57% 60% 100%
2023 0% 100% 29% 71% 60% 100%
2024 0% 100% 14% 86% 60% 100%
2025 0% 100% 0% 100% 60% 100%
2026 0% 100% 0% 100% 60% 100%
2027 0% 100% 0% 100% 60% 100%
2028 0% 100% 0% 100% 60% 100%
2029 0% 100% 0% 100% 60% 100%
2030 0% 100% 0% 100% 60% 100%
D-3TABLE
ILLUSTRATIVE FLEET ADOPTION RATES FOR TECHNOLOGIES IN SCENARIO A
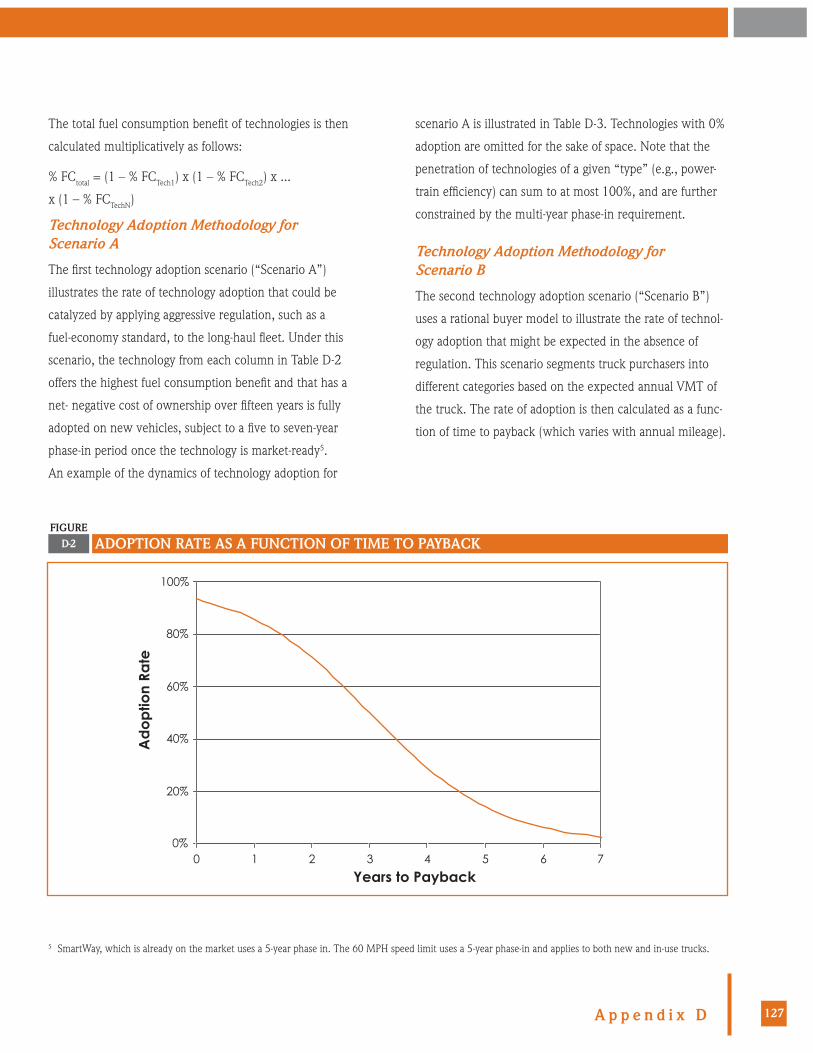
127A p p e n d i x D
The total fuel consumption benefit of technologies is then
calculated multiplicatively as follows:
% FCtotal = (1 – % FCTech1) x (1 – % FCTech2) x ...
x (1 – % FCTechN)
Technology Adoption Methodology for Scenario A
The first technology adoption scenario (“Scenario A”)
illustrates the rate of technology adoption that could be
catalyzed by applying aggressive regulation, such as a
fuel-economy standard, to the long-haul fleet. Under this
scenario, the technology from each column in Table D-2
offers the highest fuel consumption benefit and that has a
net- negative cost of ownership over fifteen years is fully
adopted on new vehicles, subject to a five to seven-year
phase-in period once the technology is market-ready5.
An example of the dynamics of technology adoption for
scenario A is illustrated in Table D-3. Technologies with 0%
adoption are omitted for the sake of space. Note that the
penetration of technologies of a given “type” (e.g., power-
train efficiency) can sum to at most 100%, and are further
constrained by the multi-year phase-in requirement.
Technology Adoption Methodology for Scenario B
The second technology adoption scenario (“Scenario B”)
uses a rational buyer model to illustrate the rate of technol-
ogy adoption that might be expected in the absence of
regulation. This scenario segments truck purchasers into
different categories based on the expected annual VMT of
the truck. The rate of adoption is then calculated as a func-
tion of time to payback (which varies with annual mileage).
5 SmartWay, which is already on the market uses a 5-year phase in. The 60 MPH speed limit uses a 5-year phase-in and applies to both new and in-use trucks.
D-2FIGURE
ADOPTION RATE AS A FUNCTION OF TIME TO PAYBACK
0%
20%
40%
60%
80%
100%
0 1 2 3 4 5 6 7
Years to Payback
Ad
op
tion
Rate
128 A p p e n d i x D
R E D U C I N G Heavy-Duty Long Haul Combination Truck Fuel Consumption and CO2 Emissions
The adoption rules use a three-year payback threshold,
which assumes that 50% of fleet owners will adopt a
technology if it offers discounted payback in three years
or less; 70% adopt given payback in two years or less. The
relationship between time to payback and adoption rate is
shown in Figure D-2. The guideline of three-year payback
(and 70% adoption at two years) was based on feedback
from truck industry experts on the steering committee,
who suggested that this was a reasonable methodology to
adopt for our market-based model.
Unlike the criterion for adoption used in Scenario A, which
either fully adopts a technology (subject to phase-in) or
does not adopt it at all, the three-year payback model
in Scenario B allows for varying fractions of the fleet to
adopt a technology. One outcome of this approach is that
different mutually-exclusive technologies (such as bottom-
ing cycle and turbo-compounding, or SmartWay 1 and
SmartWay 2) are allowed to compete in the market place.
In these cases, the relative rate of adoption for competing
technologies is calculated from the ratio of the estimated
penetration rate of one technology to another6.
An example of the dynamics of technology adoption for
Scenario B is illustrated in Table D-4. Technologies with 0%
adoption are omitted for the sake of space. Note that the
penetration of technologies of a given “type” (e.g., power-
train efficiency) can sum to at most 100%, and are further
constrained by the multi-year phase-in requirement.
6 The actual adoption rate for two technologies (Technology 1 and Technology 2), assuming that technology 1 has the higher assumed penetration rate, is calculated as follows: Actual adoption rate, Tech 1 = ATech 1 x ATech 1/(ATech 1 + ATech 2)
Where ATech 1 is the adoption of technology 1 in isolation and ATech 2 is the adoption of tech. 2 in isolation. For example: If SmartWay 1 has a rate of payback that leads to 50% adoption, and SmartWay 2 has a rate of payback that leads to 25% adoption, then SW1 = 0.5 x 0.5/(0.5 + 0.25) = 33% SW2 = 0.5 x 0.25/(0.5 + 0.25) = 17%
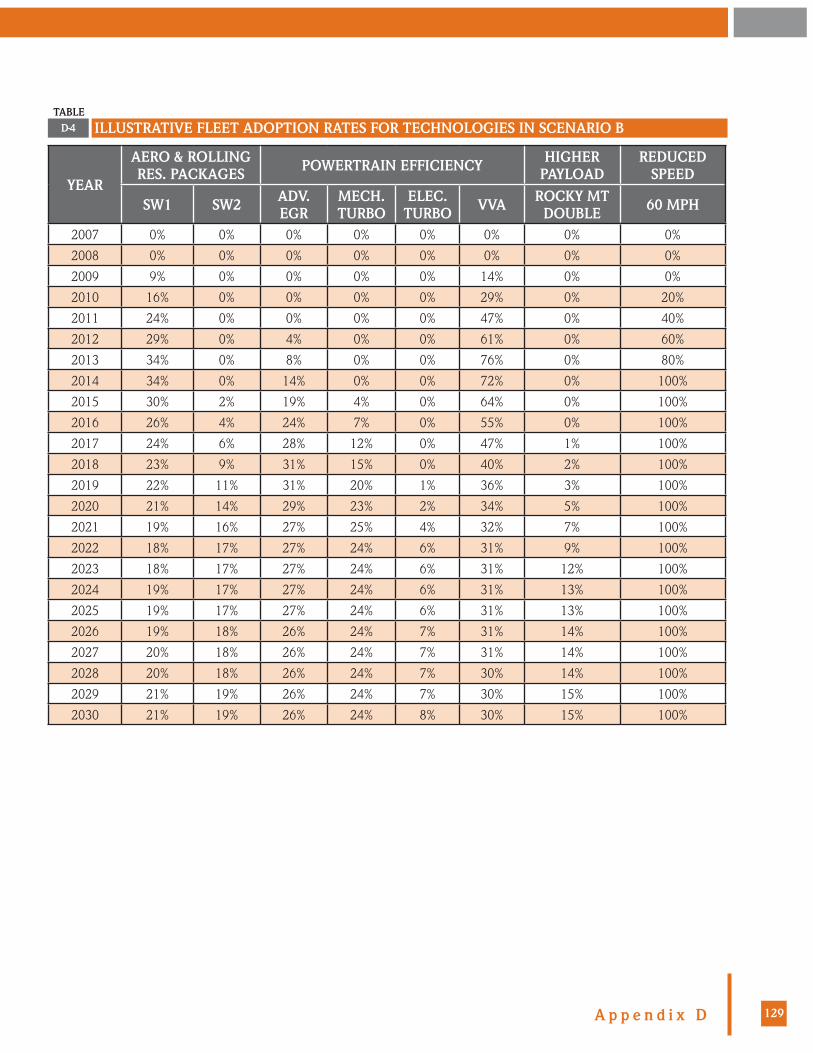
129A p p e n d i x D
YEAR
AERO & ROLLING RES. PACKAGES POWERTRAIN EFFICIENCY HIGHER
PAYLOADREDUCED
SPEED
SW1 SW2 ADV. EGR
MECH. TURBO
ELEC. TURBO VVA ROCKY MT
DOUBLE 60 MPH
2007 0% 0% 0% 0% 0% 0% 0% 0%
2008 0% 0% 0% 0% 0% 0% 0% 0%
2009 9% 0% 0% 0% 0% 14% 0% 0%
2010 16% 0% 0% 0% 0% 29% 0% 20%
2011 24% 0% 0% 0% 0% 47% 0% 40%
2012 29% 0% 4% 0% 0% 61% 0% 60%
2013 34% 0% 8% 0% 0% 76% 0% 80%
2014 34% 0% 14% 0% 0% 72% 0% 100%
2015 30% 2% 19% 4% 0% 64% 0% 100%
2016 26% 4% 24% 7% 0% 55% 0% 100%
2017 24% 6% 28% 12% 0% 47% 1% 100%
2018 23% 9% 31% 15% 0% 40% 2% 100%
2019 22% 11% 31% 20% 1% 36% 3% 100%
2020 21% 14% 29% 23% 2% 34% 5% 100%
2021 19% 16% 27% 25% 4% 32% 7% 100%
2022 18% 17% 27% 24% 6% 31% 9% 100%
2023 18% 17% 27% 24% 6% 31% 12% 100%
2024 19% 17% 27% 24% 6% 31% 13% 100%
2025 19% 17% 27% 24% 6% 31% 13% 100%
2026 19% 18% 26% 24% 7% 31% 14% 100%
2027 20% 18% 26% 24% 7% 31% 14% 100%
2028 20% 18% 26% 24% 7% 30% 14% 100%
2029 21% 19% 26% 24% 7% 30% 15% 100%
2030 21% 19% 26% 24% 8% 30% 15% 100%
D-4TABLE
ILLUSTRATIVE FLEET ADOPTION RATES FOR TECHNOLOGIES IN SCENARIO B


A P P E N D I X E
131
APPENDIX EA P P E N D I X Ea p p e n d i x ea p p e n d i x e
a p p e n d i x eAppendix E
R E D U C I N GHeavy-Duty Long Haul Combination
Truck Fuel Consumption and CO2 Emissions
Appendix E: References[Ang-Olson 2002] Ang-Olson, J. and Schroeer, W. “Energy Efficiency Strategies for Freight Trucking: Potential Impact on
Fuel Use and Greenhouse Gas Emissions.” Transportation Research Record: Journal of the Transportation Research Board.
(1815):11-18. 2002.
[ANRE/MLIT 2007] Agency for Natural Resources and Energy (ANRE) and the Ministry of Land, Infrastructure and Transport
(MLIT). “Concerning Revisions of Evaluation Standards for Automobile Manufacturers with Regard to Energy Efficiency: Joint
Final Report of the Automobile Evaluation Standards Subcommittee of the Advisory Committee for Natural Resources and Energy
and the Automobile Fuel Efficiency Standards Subcommittee of the Council for Transport Policy.” February 2007.
[Bandivadekar 2008] Bandivadekar, A.; Bodek, K.; Cheah, L.; Evans, C.; Groode, T.; Heywood, J.; Kasseris, E.; Kromer, M.; Weiss,
M. “On the Road in 2035: Reducing Transportation’s Petroleum Consumption and GHG Emissions.” LFEE 2008-05 RP.
Cambridge, MA: MIT, Laboratory for Energy and the Environment, 2008.
[CARB 2004] California Air Resources Board. “Staff Report: Initial Statement of Reasons for Proposed Rulemaking: Airborne Toxic
Control Measure to Limit Diesel-Fueled Commercial Motor Vehicle Idling.” Sacramento, CA. July 22, 2004.
[Don-Bur 2009] Don-Bur. “The New, Aerodynamic, Fuel Saving Teardrop Trailer.” Don-Bur website.
<http://www.donbur.co.uk/gb/products/aerodynamic_teardrop_trailer.shtml> (July 20, 2009)
[DOE 2000] U.S. Department of Energy “Roadmap for the 21st Century Truck Program.” US Department of Energy 21CT-001.
December 2000.
[EIA 2008] Energy Information Administration (EIA). “Annual Energy Outlook 2008 (Full Release).” Washington, DC: US Depart-
ment of Energy, Energy Information Administration. 2008. <http://www.eia.doe.gov/oiaf/aeo/> (October 28, 2008).
[EPA 1997] Environmental Protection Agency. “Final Regulatory Impact Analysis: Control of Emissions of Air Pollution from
Highway Heavy-Duty Engines.” September 1997.
[EPA 2009] Environmental Protection Agency. “Inventory of U.S. Greenhouse Gas Emissions and Sinks: 1990-2007.” April 2009.
[EPA 1999] Environmental Protection Agency. “Regulatory Impact Analysis - Control of Air Pollution from New Motor Vehicles:
Tier 2 Motor Vehicle Emissions Standards and Gasoline Sulfur Control Requirements.” EPA 420-R-99-023. December 1999.

132 A p p e n d i x E
R E D U C I N G Heavy-Duty Long Haul Combination Truck Fuel Consumption and CO2 Emissions
[EPA 2009] Environmental Protection Agency. “Idling Reduction Technologies”. Smartway program website.
<http://epa.gov/smartway/transport/what-smartway/idling-reduction-available-tech.htm> (July 20, 2009)
[EPA 2008] Environmental Protection Agency. “SmartWay Technology Package Savings Calculator.” March 18, 2008
<http://www.epa.gov/smartwayshipper/calculator/loancalc.htm> (July 7, 2009)
[Frey 2005] Frey, K. “Best Practices Guidebook for Greenhouse Gas Reductions in Freight Transportation.” North Carolina State
University: TIAX/GI HD Powertrain Study. 2005.
[Langer 2004] Langer, T. “Energy Saving Through Increased Fuel Economy for Heavy-Duty Trucks.” American Council for an
Energy-Efficient Economy. February 11, 2004.
[Leuschen 2006] Leuschen, J. and K. Cooper. “Full-Scale Wind Tunnel Tests of Production and Prototype, Second-Generation
Aerodynamic Drag-Reducing Devices for Tractor-Trailers.” National Research Council-Canada. SAE 06CV-222. 2006
[Lovins 2004] Lovins, A.B., Datta, E.K., Bustnes, O-E., Koomey, J.G., and Glasgow, N.G. “Winning the Oil Endgame.” Rocky
Mountain Institute. 2004.
[Marinko 2009] Marinko, F. “Personal Correspondence.” Automotive Research Center. July 17, 2009
[MOVES 2004] Beardsley, M., Brzezinski, D., Gianelli, B., Koupal, J., and Srivastava, S. “MOVES2004 Highway Vehicle
Population and Activity Data”. US Environmental Protection Agency. EPA420-P-04-020. December 2004.
[NAS 2008] National Research Council of the National Academies. “Review of the 21st Century Truck Partnership.” Washington,
D.C. 2008.
[NESCCAF 2008] NESCCAF. “Input from NESCCAF Steering Committee members.” April 2007-August 2008.
[Rabe 2002] Rabe, Barry G. “Statehouse and Greenhouse: The Evolving State Government Role in Climate Change.” Arlington,
VA: Pew Center on Global Climate Change. November 2002. p. 7
[Polk 2008] R.L. Polk & Company. “Extract from TIPNET™ database of commercial vehicle registrations, Class 3 – 8 (VIN-
defined) trucks in service as of September 2008”
[Polk 2008] R.L. Polk & Company. “Extract from TIPNET™ database of commercial vehicle registrations, new U.S. registrations,
Class 3 – 8 (VIN-defined), 2003 – 2007”

133A p p e n d i x E
[Salari 2009] Salari, K. “Personal Correspondence.’ Lawrence Livermore National Laboratory. July 15, 2009.
[SWC 2009] Southwest Wheel Company. “Southwest Wheel Company website.” Dallas, TX. <www.southwestwheel.com/>
(July 7, 2009)
[Stodolsky 2000] Stodolsky, F., L. Gaines, and A. Vyas. “Analysis of Technology Options to Reduce the Fuel Consumption of Idling
Trucks”. Argonne National Laboratory-Center for Transportation Research. June 2000.
[TEDB 2007] Davis, S. and Diegel, S. “Transportation Energy Data Book: Edition 26.” Oak Ridge National Laboratory.
ORNL-6978. 2007.
[TMA 2007] Truck Manufacturers Association. “Test, Evaluation, and Demonstration of Practical Devices/Systems to Reduce
Aerodynamic Drag of Tractor/Semitrailer Combination Unit Trucks”. Prepared for the National Energy Technology Laboratory.
DE-FC26-04NT42117. April 2007.
[UN 1992] United Nations. “Report of the Intergovernmental Negotiating Committee for a Framework Convention on Climate
Change on the Work of the Second Part of Its Fifth Session, Held at New York From 30 April to 9 May, 1992,” UN Document
A/AC.237/18, Part II. May 15, 1992.
[U.S. DOT 2008] US Dept. of Transportation – Federal Highway Administration. “Figure 5-1. Energy Consumption by Freight Trans-
portation Mode: 2006” <http://ops.fhwa.dot.gov/freight/freight_analysis/nat_freight_stats/docs/08factsfigures/figure5_1.htm>
(August 31, 2009).
[VIUS 2002] U.S. Department of Commerce, U.S. Census Bureau. “Vehicle Inventory and Use Survey: 2002.” December 2004.
[Vyas 2002] Vyas, A., Saricks, C. and Stodosky, F. “The Potential Effect of Future Energy-Efficiency and Emissions-Improving
Technologies on Fuel Consumption of Heavy Trucks.” Argonne National Laboratory. ANL/ESD/02-4. 2002.
[Ward’s 2007] Ward’s Auto. “Ward’s Motor Vehicle Facts and Figures.” New York: Penton Media. 2007.
[Wood 2008] Wood, R. “Personal Correspondence.” Solus, LLC. May 18, 2008.
[Woodrooffe 2006] Woodrooffe, John. “Federal Bridge Formula: How It Influences Vehicle Dynamic Behavior”. 9th International
Symposium on Heavy Vehicle Weights & Dimensions, Penn State University. June 2006.


F U E L C O N S U M P T I O NCLIMATE CHANGE
e m e r g i n g t e c h n o l o g i e st r u c k e m i s s i o n s
reducing green house gas emiss ions
Principal Contributors:
Coralie Cooper Transportation Program Manager NESCAUM/NESCCAF 89 South Street, Suite 602 Boston, MA 02111 Tel: 617-259-2022 Email: [email protected] www.nescaum.org
Fanta Kamakaté Program Director International Council on Clean Transportation One Post Street, Suite 2700 San Francisco, CA 94104 Tel: 415-399-9019 Email: [email protected]
Tom Reinhart Program Manager, Engine Design & Development Southwest Research Institute 6220 Culebra Road, P.O. Drawer 28510 San Antonio, Texas 78238-5166 Tel: 210-522-5876 Mob: 210-382-4577 Fax: 210-522-4581 Email: [email protected]
ICCT International Council on Clean Transportation
1225 Eye ST NW Suite 900 Washington, DC 20005 Tel: 202.534.1600 Fax: 202.534.1601 www.theicct.org
One Post Street, Suite 2700 San Francisco, CA 94104 Tel: 415.399.9019 Fax: 415.399.9172
NESCCAF89 South Street, Suite 602
Boston, MA 02111 Tel: 617.259.2000 Fax: 617.742.9162 www.nescaum.org
www.nesccaf.org
Matt Kromer Senior Technologist TIAX, LLC 15 Acorn Park Cambridge, MA 02140 Tel: 617-498-6021 Email: [email protected]
Editor:
Paul Miller Deputy Director NESCAUM/NESCCAF 89 South Street, Suite 602 Boston, MA 02111 Tel: 617-259-2022 Email: [email protected]