new jersey clean air council: alternative fuel vehicle
TRANSCRIPT

New Jersey Clean Air Council: Alternative Fuel
Vehicle Strategies
April 8, 2014
Rob Gibbs, Manager – Market Strategy & Development
$12.9
$7.0
$5.1
$1.2
$1.8
$5.4
$5.3 $5.4
$6.7
12.9
7.0 6.9 6.6
5.3 5.4
6.7
-
2
4
6
8
10
12
14
Cruz CV(Average)
Prius HEV Prius PHEV Volt PHEV iMiev BEV Leaf BEV Tesla S BEV
Fu
el C
os
t (c
en
ts/ m
ile)
Vehicle Type
Electricity
Gasoline
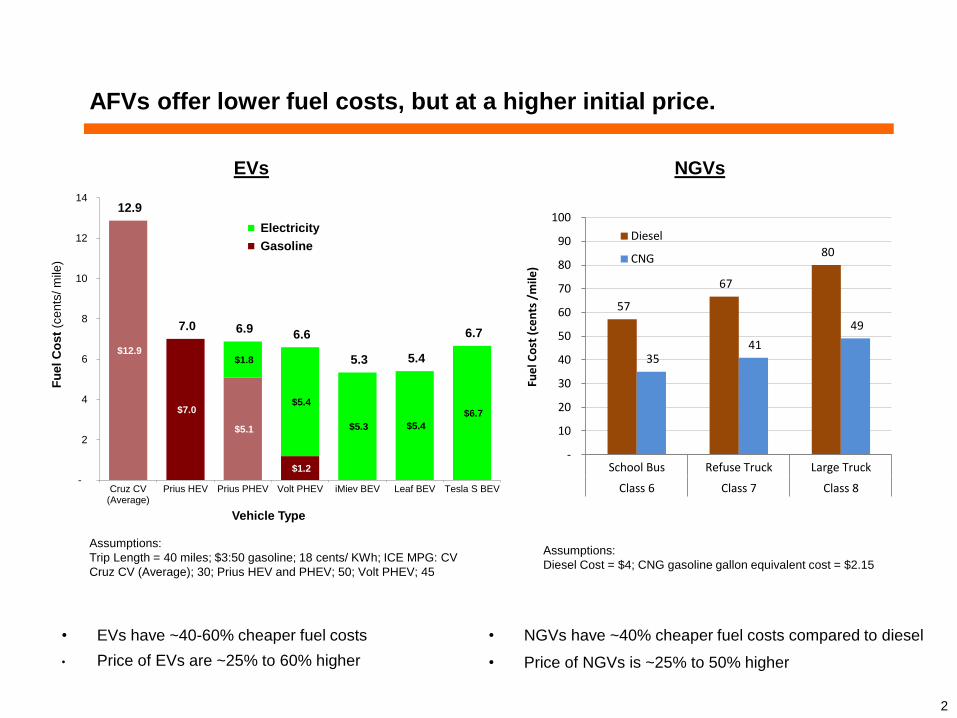
AFVs offer lower fuel costs, but at a higher initial price.
2
EVs NGVs
• EVs have ~40-60% cheaper fuel costs
• Price of EVs are ~25% to 60% higher
• NGVs have ~40% cheaper fuel costs compared to diesel
• Price of NGVs is ~25% to 50% higher
57
67
80
35 41
49
-
10
20
30
40
50
60
70
80
90
100
School Bus Refuse Truck Large Truck
Class 6 Class 7 Class 8
Fuel
Co
st (
cen
ts /
mile
)
Diesel
CNG
Assumptions:
Trip Length = 40 miles; $3:50 gasoline; 18 cents/ KWh; ICE MPG: CV
Cruz CV (Average); 30; Prius HEV and PHEV; 50; Volt PHEV; 45
Assumptions:
Diesel Cost = $4; CNG gasoline gallon equivalent cost = $2.15
EVs and NGVs will penetrate different markets.
3
Under current market conditions, EVs are expected to be the predominant AFV in the
light duty vehicle market:
• Cheaper and better-performing batteries have made cars more affordable and increased
their range to cover the distance traveled by most consumers
• No/limited infrastructure costs make economics for light duty EVs superior to NGVs; EVs
also have $7,500 federal tax credit to offset purchase price
• Most major auto manufacturers now offer EV passenger cars, while only one offers an
NGV passenger car
NGVs are expected to penetrate the medium/heavy duty market
• Power requirements cannot be effectively met by batteries
• Higher NGV infrastructure costs can be spread across fleets
• Some large fleets already converting
Electric Vehicles

There are a two main kinds of plug-in vehicles, each with different driving and charging characteristics.
Battery Electric Vehicles (BEVs) are powered
solely by energy stored in the vehicle’s battery
system, and have no gasoline back-up..
Plug-in Hybrid Electric Vehicles (PHEVs) is a hybrid
vehicle that obtains energy from two sources; a)
hydrocarbon-based fuel and b) an onboard battery.
BEVs expected to charge primarily at 240V
Charging Level Charging Times
Level 1, 120V ~7 hours
Level 2, 240 V 1.4 – 3 hours
DC Fast Charge, 200-
450 VDC
10 minutes
Charging Level Charging Times
Level 1, 120V ~17 hours
Level 2, 240 V 3.5 – 7 hours
DC Fast Charge, 200-
450 VDC
30 – 45 minutes
PHEVs expected to charge primarily at 120V
5
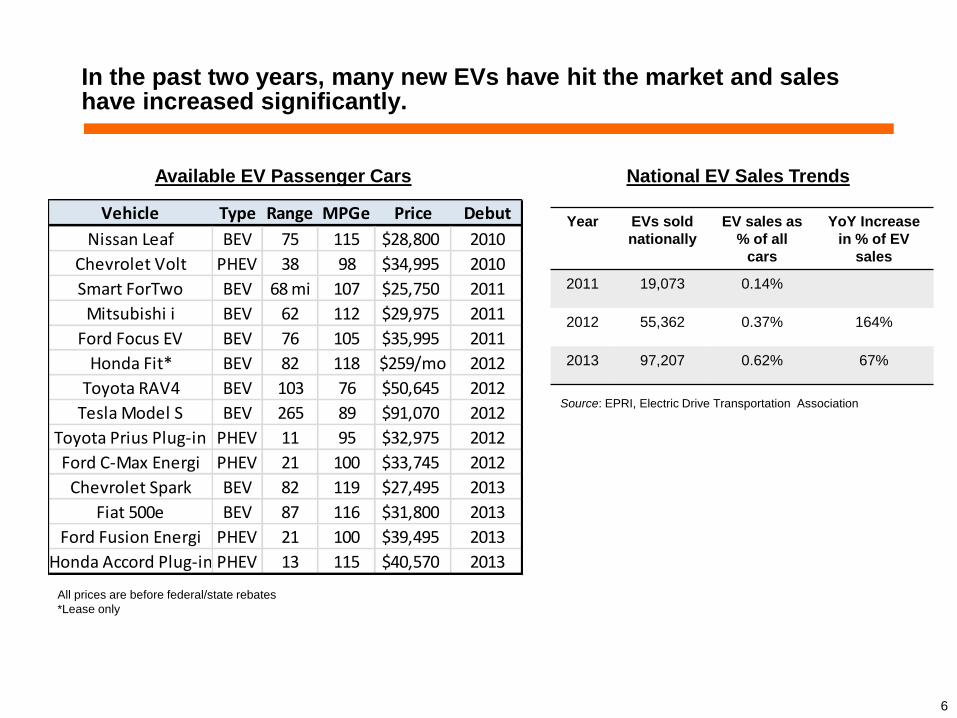
In the past two years, many new EVs have hit the market and sales have increased significantly.
All prices are before federal/state rebates
*Lease only
Vehicle Type Range MPGe Price Debut
Nissan Leaf BEV 75 115 $28,800 2010
Chevrolet Volt PHEV 38 98 $34,995 2010
Smart ForTwo BEV 68 mi 107 $25,750 2011
Mitsubishi i BEV 62 112 $29,975 2011
Ford Focus EV BEV 76 105 $35,995 2011
Honda Fit* BEV 82 118 $259/mo 2012
Toyota RAV4 BEV 103 76 $50,645 2012
Tesla Model S BEV 265 89 $91,070 2012
Toyota Prius Plug-in PHEV 11 95 $32,975 2012
Ford C-Max Energi PHEV 21 100 $33,745 2012
Chevrolet Spark BEV 82 119 $27,495 2013
Fiat 500e BEV 87 116 $31,800 2013
Ford Fusion Energi PHEV 21 100 $39,495 2013
Honda Accord Plug-in PHEV 13 115 $40,570 2013
Available EV Passenger Cars
Source: EPRI, Electric Drive Transportation Association
Year EVs sold
nationally
EV sales as
% of all
cars
YoY Increase
in % of EV
sales
2011 19,073 0.14%
2012 55,362 0.37% 164%
2013 97,207 0.62% 67%
National EV Sales Trends
6

1,891
3,115
1,476
2,119
1,218
1,614
0
500
1,000
1,500
2,000
2,500
3,000
3,500
2010 2011 2012 2013 2014 2015
Nu
mb
er
of
Ve
hic
les
High
Medium
Low
7
However, the ramp up is expected to be slow, with ~1,500 EV sales projected in PSE&G service territory this year.
Source: EPRI
Annual Adoption of EVs in PSE&G Service Territory

Consumer education is a key component to getting buyers to purchase, or even consider, EVs.
8
• The single largest factor favorably influencing customers to purchase an EV is fuel
savings (91%), well above the second reason, environmental impact (63%)
• The largest factors negatively impacting the decision to purchase an EV are:
– Battery range / access to charging stations (75%)
– Price (74%)
– Reliability (57%)
– Performance and handling (49%)
– Lack of clear understanding of cost advantage (49%)
• Most of these negative factors stem from a lack of information, as each is
addressable with current car offerings. For example, PHEVs like the Chevy Volt
have no requirement for charging stations and pose no range issues.
• As EVs penetrate deeper into the market, beyond a niche of green buyers, fuel
savings and economics will become even more important.
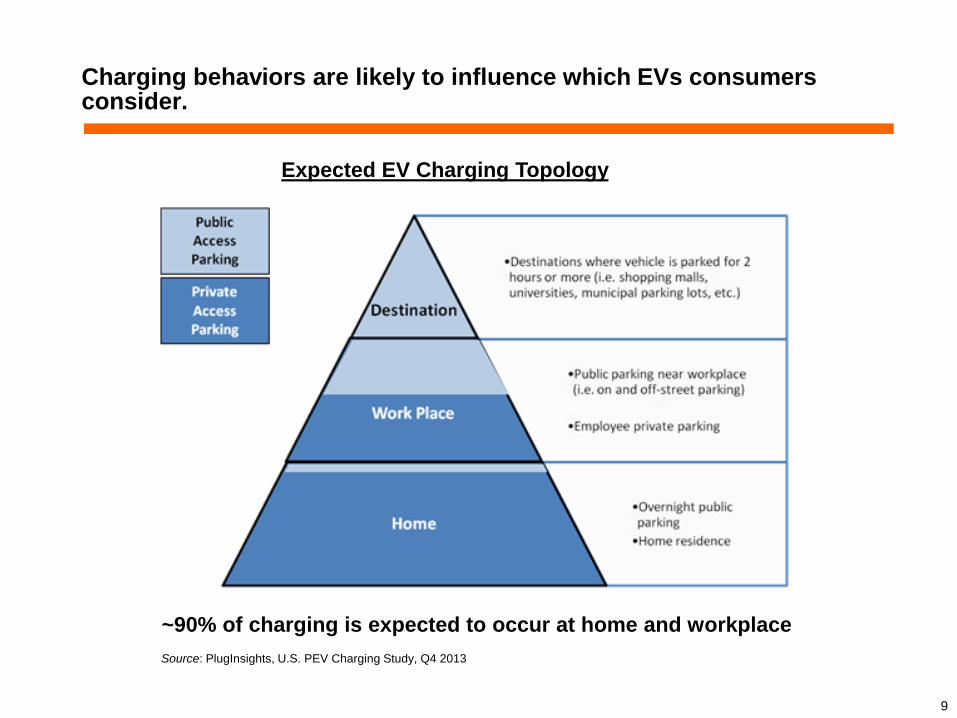
Charging behaviors are likely to influence which EVs consumers consider.
Source: PlugInsights, U.S. PEV Charging Study, Q4 2013
~90% of charging is expected to occur at home and workplace
Expected EV Charging Topology
9

Natural Gas Vehicles

11
CNG is better for smaller fleets with localized traffic, whereas LNG is
appropriate for long-haul trucking.
• Time fill requires no storage; designed to refuel
overnight.
• Fast fill requires storage; designed to refuel quickly.
Storage tanks operate at higher service pressure
(4300 psi) so it can deliver fuel faster than fuel
coming directly from the compressor
• Lower infrastructure costs make CNG more
applicable for most non-long-haul vehicles than LNG
Compressed Natural Gas (CNG) Liquified Natural Gas (LNG)
• CNG cryogenically stored at <160°C;
• 1/600th the volume of CNG:
- Smaller storage tanks/lighter trucks
- Longer mileage
- Like CNG, will evaporate into the air in the
event of a leak or rupture
• Perfect for long-haul trucking or marine
applications
• LNG infrastructure more expensive than CNG
• Must be used quickly or will “boil off” unless
cooled constantly

12
The NGV market can be broken down into three main types of potential
fleets.
Market Segment Characteristics Examples
Large, well-capitalized companies
• Have capital to invest in NGV infrastructure • Have scale and mileage to make paybacks work • Want turnkey solutions; work with private
developers and/or government/utility programs where available
• UPS • Pepsi/Fritto-Lay • Waste Management
Government fleets • Budget constraints limit capital availability • Fleet size/mileage vary • Often have sustainability motives in addition to
economics • Bureaucratic hurdles (e.g., NJ school buses need
legislative change to use CNG)
• Port Authority • Municipal waste • School and municipal
bus fleets
Small and mid-sized fleet owners
• Limited capital for infrastructure investments • Scale and mileage typically can’t sustain
infrastructure on their own • Often unwilling to enter into long-term refueling
contracts due to uncertain future revenues
NGV Market Segments

13
The cost of NGV infrastructure is the major impediment to customer
adoption, particularly for small and medium-sized fleets.
Type
Total vehicle incremental
cost
VMT per vehicle*
Simple Payback Incremental Vehicle Cost
Only
Simple Payback Incl. Fast-Fill
Infrastructure Cost**
Simple Payback Incl. Time-Fill Infrastructure
Cost***
Class-3 Ford F-350
$90,000 20,000 4 years 87 years 35 years
Class-5 Walk-in Delivery
Truck $400,000 20,000 18 years 107 years 51 years
Class-7 Dump Truck
$300,000 25,000 2 years 14 years 7 years
Class-8 Tractor
$500,000 68,000 2 years 12 years 6 years
Economics of CNG Purchases for Customer with 10-Vehicle Fleet
* NREL’s “Business Case for Compressed Natural Gas in Municipal Fleets”, June 2010 and USDOT figures
**Assumes $2M fast-fill station cost, national VMT averages, and fuel price differential of $1.80 per DGE
***Assumes $750K time-fill station cost, national VMT averages, and fuel price differential of $1.80 per DGE
• Without large fleets and/or high annual VMT, the payback on the infrastructure is prohibitive for most
small/mid-sized fleet owners.
• Other factors delaying conversion:
o Inertia for fleet owners (what they have works)
o Existing fleet purchasing commitments
o Available footprint for CNG refueling infrastructure

New Jersey has less NGV infrastructure than other states that have more active utility involvement and government incentives.
• New Jersey Stations - 13 installed in past
3 years; 15 in PSE&G territory:
- Governmental entities (12 sites)
- Private (8 sites – all Clean Energy)
- Gas utilities (9 sites) – note PSE&G
has 5 sites, but all but 1 are no longer
compatible with current CNG vehicle
standards.
• Reasons NJ Lags Other States
– Gas quality in northern PSE&G
service territory
– Lack of utility & state investments
– No meaningful state incentives for
NGV’s
State Total Stations Open to
the Public
CA 256 141
NY 111 36
OK 93 73
UT 88 43
TX 63 36
PA 51 27
IL 40 10
CO 36 17
NC 35 19
FL 32 11
NJ 29 5
OH 25 14
GA 24 10
MA 23 11
VA 19 5
CT 16 7
MD 9 2
RI 6 3
NGV Refueling Stations
14 Source: U.S. Dept. of Energy
15
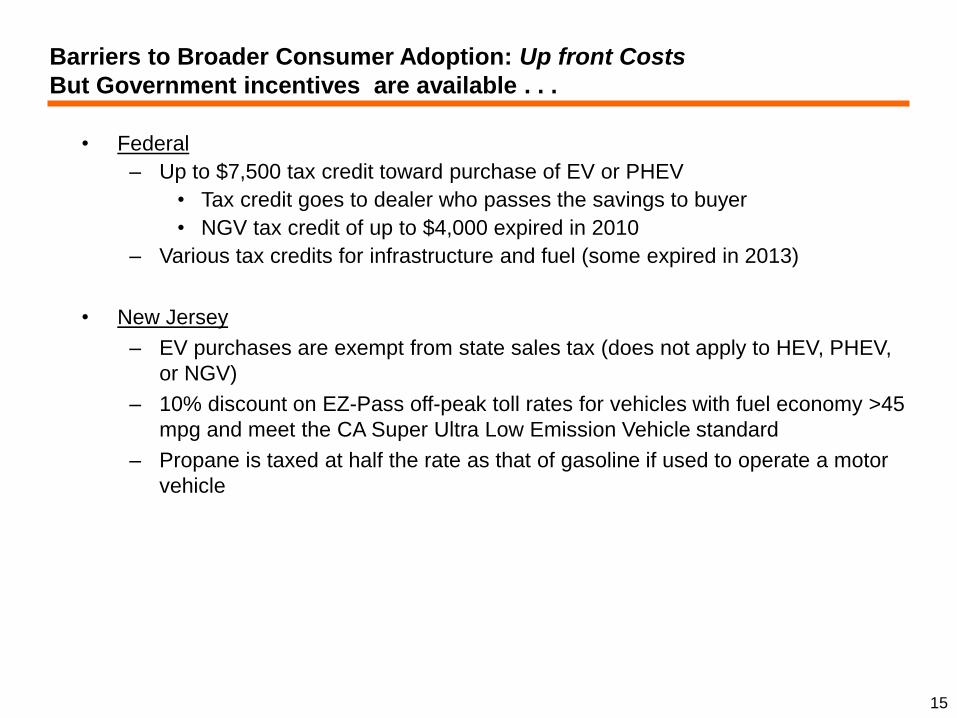
Barriers to Broader Consumer Adoption: Up front Costs
But Government incentives are available . . .
• Federal
– Up to $7,500 tax credit toward purchase of EV or PHEV
• Tax credit goes to dealer who passes the savings to buyer
• NGV tax credit of up to $4,000 expired in 2010
– Various tax credits for infrastructure and fuel (some expired in 2013)
• New Jersey
– EV purchases are exempt from state sales tax (does not apply to HEV, PHEV,
or NGV)
– 10% discount on EZ-Pass off-peak toll rates for vehicles with fuel economy >45
mpg and meet the CA Super Ultra Low Emission Vehicle standard
– Propane is taxed at half the rate as that of gasoline if used to operate a motor
vehicle
16
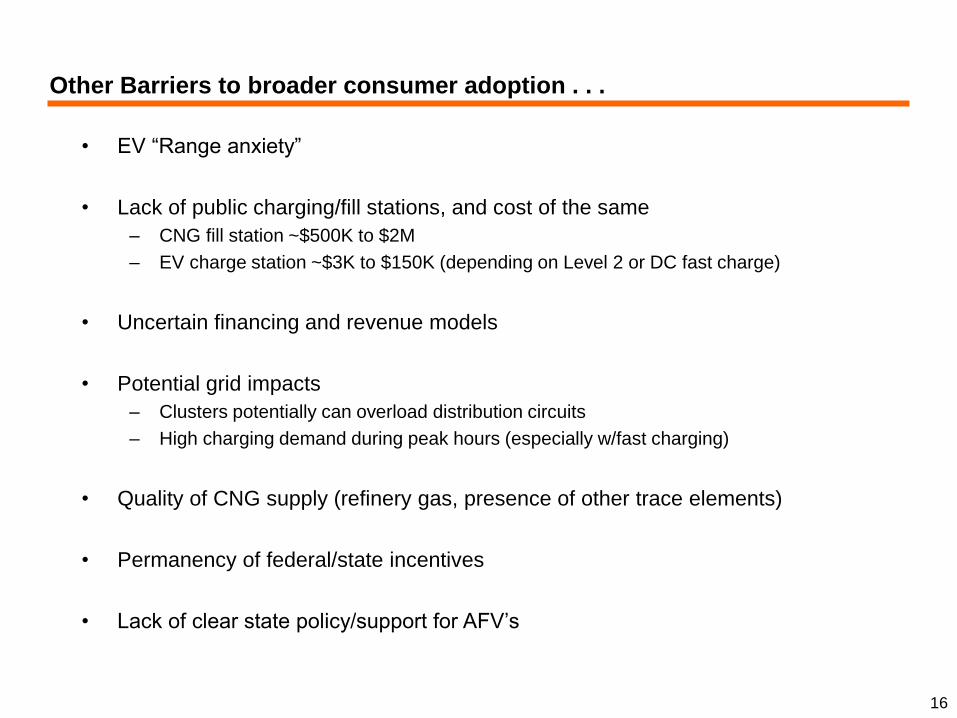
Other Barriers to broader consumer adoption . . .
• EV “Range anxiety”
• Lack of public charging/fill stations, and cost of the same
– CNG fill station ~$500K to $2M
– EV charge station ~$3K to $150K (depending on Level 2 or DC fast charge)
• Uncertain financing and revenue models
• Potential grid impacts
– Clusters potentially can overload distribution circuits
– High charging demand during peak hours (especially w/fast charging)
• Quality of CNG supply (refinery gas, presence of other trace elements)
• Permanency of federal/state incentives
• Lack of clear state policy/support for AFV’s
17
How PSE&G can help . . .
• For Electric Vehicles
– Educate customers (online tools, etc.)
– Help bring costs down with available rate options
– Provide financial incentives to promote EVs
– Potentially fill gaps in refueling infrastructure
• For Natural Gas Vehicles
– Educate customers
– Work to address gas quality issues
– Utilities can provide refueling infrastructure

18
Enablers to help NJ achieve increased AFV growth ...
• Incentivize utilities to invest in AFV’s to help reduce the existing barriers – through the
establishment of cost recovery mechanisms that encourage investment and cost
recovery
• Ensure streamlined procedures are in place to consider and approve utility filings
• Enable Utilities to offer AFV installation and maintenance services through competitive
offerings
• Extend sales tax exemption to a broader range of AFV’s other than just BEV
• Provide a NJ state income tax credit or rebate to purchasers of BEV’s or PHEV’s
• Establish a Alternative Fuels Incentive Grant (AFIG) Program similar to PA’s.