does the life-cycle theory really matter? saving and
TRANSCRIPT

Connecticut CollegeDigital Commons @ Connecticut College
Psychology Honors Papers Psychology Department
2013
Does the Life-Cycle Theory Really Matter? Savingand Spending Habits of College StudentsKaitlin KarlsonConnecticut College, [email protected]
Follow this and additional works at: http://digitalcommons.conncoll.edu/psychhp
Part of the Economics Commons, and the Psychology Commons
This Honors Paper is brought to you for free and open access by the Psychology Department at Digital Commons @ Connecticut College. It has beenaccepted for inclusion in Psychology Honors Papers by an authorized administrator of Digital Commons @ Connecticut College. For moreinformation, please contact [email protected] views expressed in this paper are solely those of the author.
Recommended CitationKarlson, Kaitlin, "Does the Life-Cycle Theory Really Matter? Saving and Spending Habits of College Students" (2013). PsychologyHonors Papers. 38.http://digitalcommons.conncoll.edu/psychhp/38

Running head: LIFE-CYCLE THEORY AND COLLEGE STUDENTS
Does the Life-Cycle Theory Really Matter?
Saving and Spending Habits of College Students
A thesis presented by
Kaitlin Karlson
to the Department of Psychology
in partial fulfillment of the requirements
for the degree of
Bachelor of Arts
Connecticut College
New London, CT
May 2013

LIFE-CYCLE THEORY AND COLLEGE STUDENTS ii
Abstract
This study looked at the financial behavior of college students and recent alumni as it relates to
economic theory and the life-cycle hypothesis. With student loans increasing dramatically and
credit card debt becoming more of a reality, it is critical to understand what drives financial
stability or instability after graduation. The pool of 230 participants was composed of 174
women and 56 men, representative of eight years of graduating classes, 2009-2016, from
Connecticut College. Students comprised 29.1% of the participants and alumni made up the
remaining 70.9%. Participants completed a survey including three quantitative measures on
credit card use, financial well-being, and attitudes toward debt, as well as an extensive
demographic questionnaire regarding spending and saving habits. Results suggested that
participants overestimated future salaries, making it difficult for them to smooth current
consumption based on future earning as predicted by the life-cycle model. Debit and credit were
not the primary methods of payment of the participants who reported a preference for using cash.
Students who were confident financially were more responsible with their credit cards and more
tolerant of debt. The life-cycle hypothesis, although a theoretically sound model, was not upheld
by participants in this study.

LIFE-CYCLE THEORY AND COLLEGE STUDENTS iii
Acknowledgements
This thesis represents the capstone of my college career, combining my passions for
economics and psychology. Without a few key people, this work would not have been possible.
Thank you...
...to Dr. Stuart Vyse, for your guidance and support throughout the past four years. From
playing music during Psychology 101, to teaching me about interaction effects and follow-up
tests, to challenging me to develop my own behavioral economics research project, you have
allowed me to take responsibility for my own learning. You stood by me through all of the ups
and downs this year, and for that I will be forever grateful.
...to Dr. Ann Devlin, for your patience as I navigated the ins and outs of APA style. Your
attention to detail focused me throughout the editing process and your standard for excellence
challenged me to strive for success.
...to Dr. David Chavanne, for your input and advice throughout the course of my writing
process. Your insight these last two semesters has been invaluable.
...to the members of the Behavioral Economics Research Group (BERG), for keeping this
journey lighthearted and for reminding me how much I love learning about psychology.
...to all of the professors in the Economics and Psychology Departments at Connecticut
College who helped me to discover the connection between the two disciplines.
...to my friends and teammates, for listening to me endlessly rant about the work still to
be done and for keeping me company into the late hours of the night.
...to Coach, for always believing in me.
...and last, but certainly not least, to Mom and Dad for making all of this possible. I
would not have made it without your unconditional support throughout this year.

LIFE-CYCLE THEORY AND COLLEGE STUDENTS iv
Table of Contents
Abstract............................................................................................................................................ ii
Acknowledgements.........................................................................................................................iii
Table of Contents............................................................................................................................ iv
List of Tables....................................................................................................................................v
List of Figures................................................................................................................................. vi
List of Appendices......................................................................................................................... vii
Introduction...................................................................................................................................... 1
Method........................................................................................................................................... 32
Results............................................................................................................................................ 35
Discussion...................................................................................................................................... 48
References...................................................................................................................................... 64
Appendices..................................................................................................................................... 70

LIFE-CYCLE THEORY AND COLLEGE STUDENTS v
List of Tables
Table 1: Mean Rank of Preferred Methods of Payment................................................................38
Table 2: Correlation Matrix of Credit Card Use, Financial Well-being, and Attitudes Toward
Debt................................................................................................................................................ 40
Table 3: Correlation Matrix of Attitudes Toward Debt, Expected Starting Salary, and
Confidence in Estimation............................................................................................................... 41
Table 4: Correlation Matrix of Attitudes Toward Debt, Expected Mid-Career Salary, and
Confidence in Estimation............................................................................................................... 42
Table 5: Correlations Between Financial Well-Being and Debt at Graduation.......................... 43
Table 6: Mean Rank of Popular Items Purchased by Students..................................................... 44
Table 7: Percentages of Students Reporting Various College Payment Methods.........................45
Table 8: Percentages of Students Reporting Various Types of Financial Aid Received...............46
Table 9: Reported Allowance per Month Received by Students................................................... 47
Table 10: Percentage of Participants who Hold Credit and Debit Cards.................................... 47
Table 11: Percentage of Students and Alumni Having and Following a Budget..........................48

LIFE-CYCLE THEORY AND COLLEGE STUDENTS vi
List of Figures
Figure 1: Model of the Life-Cycle Hypothesis..................................................................................1
Figure 2: The Crazy Growth of Student Loans................................................................................6
Figure 3: Combined Average Debt by Grade Level...................................................................... 13
Figure 4: Results of a Mixed Design Analysis of Variance on Starting Salary.............................36
Figure 5. Results of a Mixed Design Analysis of Variance on Mid-Career Salary...................... 37
Figure 6. Tuition Growth in Private and Public Four-Year Colleges.......................................... 58

LIFE-CYCLE THEORY AND COLLEGE STUDENTS vii
List of Appendices
Appendix A: 2012-2013 PayScale Salary Report by College Major............................................70
Appendix B: Alumni Solicitation................................................................................................. 74
Appendix C: Informed Consent Document...................................................................................75
Appendix D: Debriefing Statement...............................................................................................76
Appendix E: Credit Card Use Scale.............................................................................................. 77
Appendix F: Student Financial Well-Being Scale........................................................................ 78
Appendix G: Student Attitudes Toward Debt Scale..................................................................... 79
Appendix H: Student Demographics............................................................................................ 80
Appendix I: Alumni Demographics.............................................................................................. 83
Appendix J: Chart of Federal Student Financial Assistance from 1995-2011............................. .86
LIFE-CYCLE THEORY AND COLLEGE STUDENTS 1
Does the Life-Cycle Theory Really Matter? Saving and Spending Habits of College Students
College students are money-spending machines. In addition to the tens of thousands of
dollars students and their families spend on tuition, while on campus students also spend money
on alcohol, clothing, food, and other activities. These consumption habits may seem harmless,
but when combined with limited income, accumulating credit card debt, and large student loans,
the deficit spending becomes detrimental to future financial well-being. According to Thaler and
Sunstein (2008), “about two-thirds of four-year college students are in debt when they graduate”
(p. 141). How people spend and save their money across their lifetime is supposed to be a
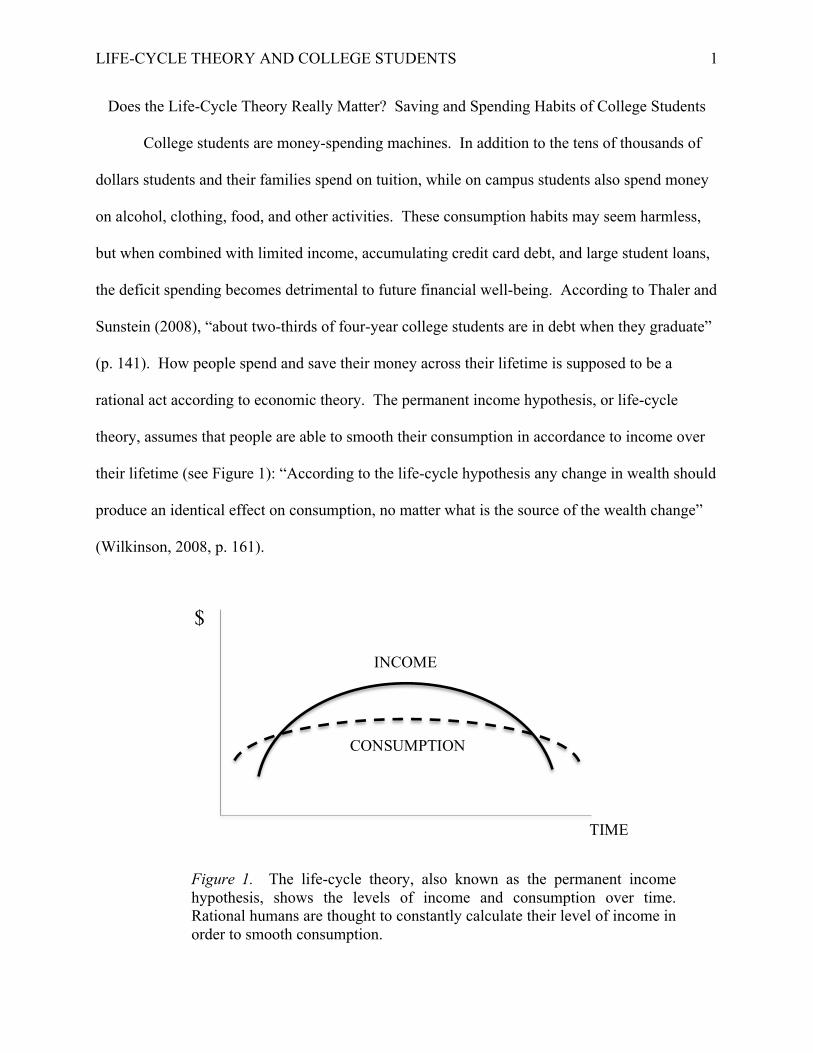
rational act according to economic theory. The permanent income hypothesis, or life-cycle
theory, assumes that people are able to smooth their consumption in accordance to income over
their lifetime (see Figure 1): “According to the life-cycle hypothesis any change in wealth should
produce an identical effect on consumption, no matter what is the source of the wealth change”
(Wilkinson, 2008, p. 161).
Figure 1. The life-cycle theory, also known as the permanent income hypothesis, shows the levels of income and consumption over time. Rational humans are thought to constantly calculate their level of income in order to smooth consumption.
INCOME
CONSUMPTION
TIME
$

LIFE-CYCLE THEORY AND COLLEGE STUDENTS 2
As seen in the model, there are two periods of time where consumption level is greater
than income level. Warneyrd (1999) explains that these periods of deficit spending are
calculated, rational decisions, made so that people can smooth their spending habits: “[the life-
cycle hypothesis] posits that consumers dissave1 early in their lives in anticipation of future
earnings, save when their earnings are high, and, finally, dissave again when they are older and
earnings are lower” (p. 154). In theory, this pattern of consumption smoothing makes sense.
During the early and late stages of life, people are typically unemployed or retired, with spending
levels over their respective income levels: “People often wish to consume more than their
income when they are both young and old, and therefore save most in their middle age”
(Wilkinson, 2008, p. 261). The deficit spending in the adolescent and elderly years is balanced
by a steady salary and pay increase during one’s career. Controlling spending in this manner
requires a degree of self-control and planning that is not only difficult for most people to
achieve, but requires complex calculation: “these models assume that consumers have separate
utilities for consumption in each period and that they use discount factors that weight future
consumption less than current consumption” (Wilkinson, 2008, p.145). This means that changes
in wealth, whether through increases or decreases in salary, investment gains, or bequests should
result in adjusted consumption patterns.
This study explores the student loan and debt crisis through the lens of the life-cycle
model. Analysis of the literature begins with putting the life-cycle hypothesis in the context of
student loan debt, credit, and education. Aspects of spending on college tuition include financial
aid, decisions regarding selecting college majors and future careers, and navigating student
1 To dissave, according to Warneyrd (1999), is a pattern in which consumers are spending greater amounts of money than they are earning. The points at which consumers are dissaving in the life-cycle hypothesis are at the far left and far right of Figure 1.

LIFE-CYCLE THEORY AND COLLEGE STUDENTS 3
loans. In addition to academic behavior while in college, literature on the credit card debt puzzle
is included in order to analyze spending behavior with credit cards. As the present study is
focused on college students, literature concerning knowledge of personal finance, credit card use
and misuse, and debt accumulation were included to increase understanding of the scope of the
issue. Finally, studies regarding debt repayment after college attempt to identify predictive
factors among recent graduates. These sections provide the groundwork for the hypotheses of
the current study as well as policy recommendations in the context of the results.
Debt, Credit, and the Life-Cycle Hypothesis
According to the life-cycle model, it is potentially rational to overspend while in college.
The rationality behind deficit spending arises from the ability to calculate future periods of
earning and saving in order to compensate for current and future spending. Many college
students’ deficit spending pattern may be attributed to a lack of education about financial matters
or having a lower incentive to follow a budget. Although a pattern of deficit spending is deemed
acceptable in accordance with the life-cycle model, as the college years can be considered a time
when consumption should be greater than income, it is still possible for consumption to be too
great for financial stability to be achieved in the future. In addition, a model of rational
overspending assumes that there are calculated plans for the future and does not allow for
ignorance of present and future finances. People may often be unrealistic in their perceptions of
the job market in terms of hiring frequency and what their salaries will be in the future, and as a
result, often fail to make these adjustments. Soman and Cheema (2002) argued that, “consumers
are unable to correctly value their future incomes, and that they lack the cognitive capability to
solve the intertemporal optimization problem required by the life-cycle hypothesis” (p.32). A

LIFE-CYCLE THEORY AND COLLEGE STUDENTS 4
lack of ability to determine future income is a direct contradiction of the assumptions within the
life-cycle hypothesis, and is further complicated by the use of credit.
The introduction of credit and debit cards to the consumption market has complicated the
way in which people spend money. Vyse (2008) claims that the easier and more efficient it is to
spend money, the more difficult it will be to resist spending. Standard economic theory states
that wealth and assets are fungible and that people always act in order to maximize their utility
(Wilkinson, 2008). Fungibility of assets means that units of money are equivalent to each other,
or in other words, a dollar spent in one place is equivalent to a dollar spent somewhere else. This
may be the economically rational way to treat money, but people often fail to accept the
assumption of fungibility and instead split consumption into different mental accounts: “Mental
accounting is the system (sometimes implicit) that households use to evaluate, regulate, and
process their home budget. Almost all of us use mental accounts, even if we’re not aware that
we’re doing so” (Thaler & Sunstein, 2008, p. 50). The way in which people use their credit
cards is one example that challenges the model of fungibility. Credit and debit transactions
should yield the same preferences as cash, but willingness to pay increases significantly when
paying with credit (Wilkinson, 2008). When paying with credit or debit, there is less of a
physical connection to the amount of money paid, resulting in a lower awareness of the amount
of money spent. According to Vyse (2008), it is easy to forget about the past purchases made
with a credit card because the money never leaves your hands. This psychological separation
from spending creates a high-risk financial situation because if people are not aware of their
spending habits, or are less aware due to minimized physical and emotional connection to
spending, they may rack up debt that lowers financial stability in the future.

LIFE-CYCLE THEORY AND COLLEGE STUDENTS 5
An article published in Christianity Today (Blue, Stackhouse, & Hunt, 2011) discussed
the recent charge-happy tendencies in the current market. While not a scientific article, popular
beliefs surrounding credit cards are expressed through the three authors’ past research and
experiences. Each author provided his or her own separate commentary about the current
tendency to rely on credit when making purchases and what this means for people in the long
run. In the article, Blue (2011) claimed that, “some of the more common issues that lead to
credit card debt include a lack of contentment, a lack of self-discipline, the search for security,
and the search for significance” (p. 64). Stackhouse (2011), on the other hand, acknowledged
that, although credit can be beneficial in many situations, accumulating large amounts of debt is
detrimental and financially dangerous. He discussed the easy accessibility and detachment
people feel from the actual monetary amount, leading to increased spending and lowered
awareness. Hunt (2011) mirrored these same sentiments in her column, concluding that
spending within ones means on credit is not a bad thing; in fact, it can build the good credit
necessary to make a major purchase in the future, but racking up debt creates financial
instability.
In college students, the problem is far from limited to the patterns of deficit spending and
use of credit cards. Recent headlines in The Wall Street Journal and The New York Times have
announced that student loan debt is higher than it has ever been, the job market is down,
unemployment rates are up, the economy is still unstable, and using debt for purchases is
becoming more common. According to Indiviglio (2011) student loans had increased by 511%
from their levels in 1999: “In the first quarter of 1999, just $90 billion in student loans were
outstanding. As of the second quarter of 2011, that balance had ballooned to $550 billion”

LIFE-CYCLE THEORY AND COLLEGE STUDENTS 6
(Indiviglio, 2011). In addition, student loan debt has increased at a faster rate than household
debt (see Figure 2).
Figure 2. Data from the New York Federal Reserve show that the cumulative student loan growth since the first quarter of 1999 has increased by over 500% from the levels reported in quarter one of 2011. In comparison, cumulative household debt (not including student loans) has increased by less than 150% in the same period. Proportionally, the growth in cumulative student loan debt is greater than the growth in cumulated household debt (Figure is taken from Indiviglio, 2011).
What may be most interesting about this chart is that it is inclusive of the housing bubble that
was a consequence of the collapse of the financial sector in 2008. This shows the magnitude of
the growth in student loan debt; if a spike of 150% in the debt of the household debt2 was a
precipitating factor in the financial crisis, a spike of 511% in student loans is bound to be
2 Household debt included mortgages, loans, and consumer debt. In order to provide analysis, the numbers for household debt do not include student loans.

LIFE-CYCLE THEORY AND COLLEGE STUDENTS 7
problematic in the future. The combination of credit card debt and student loan debt both play an
important role in determining future financial stability.
Education and the Life Cycle Hypothesis
As previously mentioned, the life-cycle model hypothesizes that people will rationally
overspend at the beginning and ends of their lives. Students fall into the prior category,
generally being unemployed, and therefore, cash outflow is generally greater than cash inflow.
Because of this, it is necessary for people’s incomes to increase past consumption rates both to
repay debt that may have accumulated at the beginning of life and save for the point in the future
where consumption will once again overtake income. Warneyrd (1999) defined saving as:
“saving, to an individual, is not simply what is left after consumption—consumption postponed
so that it can be used at a later date. Rather saving is often a vote of confidence in the future and
an activity that involves both the pain for foregoing consumption and the pleasure of an
anticipated future” (p. 153). The vote of confidence in the future refers to the saving levels at the
midpoint of the life-cycle model, because the increased saving levels indicate that one must
expect to be around to spend the savings in the future.
A common saying in businesses is, “you have to spend money to make money,” advice
that is also applicable when considering higher education. Students currently enrolled in
colleges or universities are spending large amounts in tuition costs in the hope that the education
they attain will create greater salary opportunities in the future. The life-cycle hypothesis
accounts for education spending, with consumption greater than savings for the first stages of
life. McMahon and Wagner (1981) investigated the expected returns to investment in higher
education in terms of future earnings. The researchers analyzed expected earnings data from
2,766 freshmen from 1971 to 1972, all of whom were financial aid applicants, which included

LIFE-CYCLE THEORY AND COLLEGE STUDENTS 8
estimated starting salaries and estimates of real earnings expected in 25 years. The starting
salaries were gathered from the College Placement Council, and, when there were data gaps,
from organizations directly. By inquiring about future expected earnings, McMahon and
Wagner (1981) attempted to capture the ability of college students to assess the financial payoff
of investing in a college education.
Those students planning to continue their education past the bachelor’s degree level
expected a rapid increase in earnings, and that predictions of future earnings varied more than
predictions of earnings immediately post-graduation. In an analysis of expected starting salaries
across intended occupation, McMahon and Wagner (1981) found that students were reasonably
aware of the market in terms of relative differences in earnings and do not seem to be swayed by
the salaries of young alumni. Participants who selected into certain majors were realistic about
future earning potential: “those anticipating careers in health, business, or engineering and
technical fields correctly expect relatively higher salaries than their peers who have selected
social science, teaching, and humanities” (p. 279). Analysis on demographic information
allowed for insight into differences in gender and race. Men predicted higher future salaries than
women, but they also reported going into fields with higher salaries than fields reported by
women. In addition, McMahon and Wagner (1981) found that the data showed that race was not
a factor in size of future earnings: “after controlling for sex, black students anticipate earning at
least as much as white students, both initially and well into their working lives” (p. 278). These
findings suggest that, at the time of this study, college students were fairly accurate in their
evaluations of the future value of their education.
Smith and Powell (1990) provide an additional analysis of the expectations of future
income among college students. Participants included 388 college seniors from two higher

LIFE-CYCLE THEORY AND COLLEGE STUDENTS 9
education institutions in the Midwestern United States, the first a very competitive, large
university, and the second a small, less competitive university. Participants were asked to report
their expected starting salary and their expected salary in ten years, as well as comparable
measures including the estimated average earnings of peers not attending college and estimated
average earnings of peers at the same academic institution. Smith and Powell (1990) found that
there was a general perception that obtaining higher education increases future salary: “College
students clearly perceive there are large income effects associated with a college education,
inasmuch as they anticipate that the incomes of their college peers will be approximately 50
percent higher than those of their high school peers” (p. 199). The researchers found a
significant difference in expected earnings for men and women, with women predicting lower
future salaries than men. This difference can be attributed to gender differences in academic
major and future career aspirations. In addition, the characteristics of a college or university can
have an effect on students’ expected future earning potential, with higher estimations of earnings
reported from the larger more competitive university (Smith & Powell, 1990).
Webbink and Hartog (2004) performed a longitudinal study that compared expected
salary and realized salaries four years later. The basis of this study was the human capital
model3: “students, in deciding on the amount of education, compare the outcomes of the different
options and choose the option with the highest return” (p. 103). This indicates that future salary
is one of the most important decisions for students when determining decisions regarding
education and occupation. A longitudinal data set originally including 3,845 students in the
Netherlands who were enrolled in higher education and were asked to report their demographic
3 The human capital model or human capital theory is based on the assumption that investment in the current aspects of human capital (work, labor, skills) will increase productivity and income potential in the future. In this case, the model is being applied to investing in education, increasing knowledge that will pay off down the road (Webbink & Hartog, 2004).

LIFE-CYCLE THEORY AND COLLEGE STUDENTS 10
information including current level of education, performance in secondary school, and current
academic motivation4. Webbink and Hartog (2004) then estimated a regression model predicting
starting and realized salaries on the basis of the demographic variables. Significant effects
included sex, area of study, and academic performance. Females expected to earn less than
males, certain areas of study result in greater income levels than others, and students who
performed better academically also received higher incomes on average. These results show that
students tend to be realistic about their potential income brackets in the future, particularly in
how they relate to education levels.
Although students are shown to be relatively accurate in their expectations of future
earnings, how much graduates actually earn tends to be partially determined by the academic
credibility of the college or university attended and the quality of their performance within their
major field. Thomas (2000) built on previous studies regarding students’ expected earnings and
education level by examining specific economic returns by college major and quality of
performance during the undergraduate years. In his study, Thomas (2000) used data from the
Baccalaureate and Beyond Study, the National Postsecondary Student Aid Study, and the
Integrated Postsecondary Education Board’s Annual Survey of Colleges5. The decision to attend
college certainly garners a financial payoff, but in addition, “college graduates [are] less likely
4 Current academic motivation was measured using reported hours spent studying, attending class, and completing assignments (Webbink & Hartog, 2004). 5 The data included information on education and work experiences following college graduation, information about applications and enrollments in colleges and universities, and general demographics. Individual variables included gender, race, parents’ education, academic performance, transfers between colleges, and academic major. Experiences in the labor market included variables like career potential, whether a degree was required for a job, the relationship between current job and field of study, whether a job was in the public or private sector, the number of offers received, hours worked, and tenure at the position. On the institutional level, variables included the selectivity of the college, student-faculty ratio, full time enrollment, geographical location, and whether the academic institution was public or private (Thomas, 2000).

LIFE-CYCLE THEORY AND COLLEGE STUDENTS 11
than high school graduates to experience periods of unemployment, but they also enjoy
significant wage premiums over their lifetimes” (Thomas, 2000, p. 282). These returns are
desirable in terms of the human capital model explored by Webbink and Hartog (2004); the
profits over the course of a lifetime make the initial costs – direct cost and opportunity cost – of
an investment worthwhile.
Thomas (2000) found that the average debt accumulated in terms of paying for college or
university was relatively similar across academic fields. When looking at the debt-to-earnings
ratio6, however, natural science majors had a much lower debt to earnings ratio than did
humanities or social science majors. Although the difference in ratios could theoretically be
attributed to differences in either debt or earnings, Thomas (2000) found that debt was relatively
similar across all disciplines and it was the difference in the mean earnings that affected the
ratios. According to Thomas (2000), “debt ratios are commonly used in reports addressing
student indebtedness…surveys of borrowers suggest that those who have debt ratios of 1.0 and
greater face a formidable financial burden that often compromises financial well being” (p. 293).
Achieving a degree from a college or university is becoming an increasingly expensive process,
and students justify spending money on higher education because it will pay off in the long run
in terms of employment, salary, and benefits. As debt-to-earnings ratios creep up for certain
majors, college graduates are not earning enough money immediately after graduation to support
themselves and pay off loans. Thomas (2000) suggests that changes in policy surrounding who
pays what for higher education may make it easier for recent graduates to pay off loan debt, and
that education for indebted students about the future earnings potential of academic majors may
influence the future career choices of indebted students.
6 The debt-to-earnings ratio is a numerical value that captures the proportion of average student loan debt at graduation to average annual earnings (Thomas, 2000).

LIFE-CYCLE THEORY AND COLLEGE STUDENTS 12
College Tuition and Financial Aid
The price of college tuition is steadily rising to new levels. According to Thaler and
Sunstein (2008), “At many private universities, including ours, it costs a student more than fifty
thousand dollars a year in tuition, room, and board. Scholarships and part-time jobs typically do
not cover the cost of college” (p. 140-141). The total cost of attending Connecticut College was
set at $56,790 in 2012, which values a four-year degree at over $200,000 (Connecticut College,
2012). The average financial aid grant for those receiving financial aid was $30,390 per
semester, a number that substantially reduces the immediate cost of attending Connecticut
College, but—because most financial aid is in the form of loans—leaves graduates with a huge
amount of debt. Baum and O’Malley (2003) analyzed Nellie Mae’s National Student Loan
Survey (NASLS) to study the effect of debt on recent college graduates. Nellie Mae is a
subsidiary of Sallie Mae, a corporation operating in the student loan business. The original
NASLS conducted in 1988 concluded that, “an overwhelming majority of borrowers believed
student loans significantly increased their access to and choice among postsecondary institutions,
and most borrowers believed the benefits they received from a college education were worth the
costs of student loans” (p. 7). This holds with both the life-cycle model and the human capital
model regarding future payoffs from a current investment.
As student loans have skyrocketed since 1988, another NASLS was conducted in 2002,
designed to measure the debt burdens on students (Baum & O’Malley, 2003). In their analysis of
the 2002 NASLS survey, Baum and O’Malley reported that the sample included students who
had begun, but not completed, payments on federal student loans. Participants were asked to
complete a survey that included questions about demographics, debt levels, extent of debt
burden, attitudes toward debt, and impact on ability to purchase a home or car. Debt levels were

LIFE-CYCLE THEORY AND COLLEGE STUDENTS 13
higher at four-year institutions than two-year institutions and participants who completed their
degrees owed more than those who did not (Baum & O’Malley, 2003). Debt levels also
increased for those who went on to pursue graduate degrees compared to the levels observed
among undergraduates. Although participants reported believing student loan debt was an
acceptable burden to carry in return for the education received, participants also reported concern
over excessive debt. Baum and O’Malley (2003) concluded that graduates perceived that their
loans caused, “delays in home purchases, getting married, and having children” (p.17). The
average student loan debt increased dramatically from freshman to senior year of college while
credit card debt increased at a much lower rate, ultimately representing a relatively small portion
of the overall debt (see Figure 3). With analysis showing that debt levels are making it more
difficult for recent college graduates to achieve their goals, it is important to determine what is
an acceptable level of college debt.
Figure 3. The combined average debt by grade level, as shown in percentage of average student loan debt and average credit card debt, increases throughout the college experience. These values are in nominal dollar amounts in the year 2002. Proportionally, average student loan debt is greater than average credit card debt. Nellie Mae (2002).

LIFE-CYCLE THEORY AND COLLEGE STUDENTS 14
Financial aid is designed to allow a student to spend more time preparing for the
classroom than working to pay tuition fees. It also allows students who could otherwise not
afford the full sticker price of tuition an opportunity to attain higher education. DesJardins,
Ahlburg, and McCall (2002) studied financial aid’s influence on matriculation decisions as well
as on length and persistence of enrollment of 4,800 students at the University of Minnesota. The
researchers used a hazard model7 to analyze how different types of financial aid impact retention
and graduation rates, hypothesizing that different financial aid packages would have different
effects on student attrition. Types of financial aid included in the packages were grants,
scholarships, loans, and work-study.8 DesJardins et al. (2002) hypothesized that the different
types of aid would have different impacts on student retention rate; it was expected that
scholarships and grants would have a larger impact on positive retention than other forms of aid.
Controlling for ability using ACT9 scores in order to determine whether students of a
certain academic prowess would be more likely to receive a form of financial aid, DesJardins et
al. (2002) found that different types and combinations of aid packages affected the “stopout
rate”10 and the persistence to continue to a degree. Scholarships are the most effective when
compared to grants, loans, and work-study, in that students remain in college without a stopout
7 Hazard models, specifically proportional hazard models, are statistical models that estimate conditional probabilities over time. The model is a type of regression analysis that in this case attempts to highlight the factors affecting retention and graduation rates (DesJardins et al., 2002). 8 Grants are need-based awards that do not require repayments. Scholarships encompass a wide variety of merit-based awards that are often dependent on a performance variable, for example, to continue receiving an athletic scholarship, a student must continue to perform well on the team. Loans include both federal and state loans with interest rates that must be repaid in the future. Work-study is a type of aid that permits a student to work at his educational institution in exchange for an hourly wage (DesJardins et al., 2002). 9 ACT stands for American College Testing and is a standardized test used as a measure to predict future performance in college. 10 The rate at which students withdraw from an educational institution prior to graduation (DesJardins et al., 2002).

LIFE-CYCLE THEORY AND COLLEGE STUDENTS 15
incident for longer. The only form of aid that did not seem to have an effect on stopout behavior
was grants: “[G]rants may allow students to attend college, at least at the study institution
variations in grants do not have a statistically significant effect on retention” (DesJardins et al.,
2002, p. 669). Using these findings, the researchers conducted further policy simulations in
order to suggest future potential changes. These simulations were 1) survival rates with no
financial aid, 2) a reallocation of loan aid to scholarship aid, and 3) frontloading scholarships to
the first two years of study. Survival rates with no financial aid were four percent lower than
survival rates with financial aid. When loans are replaced with scholarships there is an increase
in retention, a positive difference. Frontloading aid decreases stopout incidents in the first two
years of study but results in no significant difference in the second two years when compared to
the baseline (DesJardins et al., 2002). The findings of the research concluded that increased
financial aid, no matter what the type, led to fewer dropouts, and loans led to a longer persistence
in school than did scholarships or grants.
Major and Career Decisions
As discussed in the previous section, college students’ are well aware of how education
level and career choices may determine the amount of money they will make in the future.
Personality factors may be related to how decided one is about his or her future career path, but
they also come into play when deciding what major to select in college. Cebula and Lopes
(1982) studied the monetary and nonmonetary factors influencing the selection of a major field.
They assumed that students were rational in that they understood current labor market conditions
as well as the current income levels and fluctuations. The enrollment data from students in 28
areas of study at the Illinois State University was studied in terms of monthly earnings, change in

LIFE-CYCLE THEORY AND COLLEGE STUDENTS 16
monthly earnings, current trends, job outlook, and score on the GRE11. Comparison salaries
were collected from the College Placement Council, which compiled monthly salary offers
students received from recruiters (Cebula & Lopes, 1982). Economic analysis of the data
showed that all of the aforementioned variables affected the choice of major, but that students
were strongly influenced by future salary levels.
Assuming that humans are rational beings and the life-cycle model is valid, the amount of
money spent in college will depend on the salary level expected in future years. The life-cycle
hypothesis, as thus described, requires that people constantly analyze and discount their spending
and earnings. Chambers et al. (1999) studied personality traits on career decidedness and life
satisfaction. The “Big Five” personality constructs have been established as neuroticism,
extroversion, openness, agreeableness, and conscientiousness. Participants included 249
undergraduates who were asked to fill out a survey for course credit. Measures included the
Career-Decidedness Inventory, the NEO Five-Factor Inventory to measure personality traits, and
the Personal Style Inventory, which also measure personality characteristics in relation to the
“Big Five.” Chambers et al. (1999) found that career decidedness was negatively related to
neuroticism and positively related to conscientiousness and agreeableness. The negative
correlation indicates that high career decidedness is indicative of high levels of neurotic
behavior, while the positive correlation means that high career decidedness was indicative of
high life satisfaction, conscientiousness, and agreeableness.
A recent study by Rothstein and Rouse (2011) examined the effect of student debt on
academic decisions and future employment. Standard economic theory states that, “in a standard
11 GRE stands for Graduate Record Examinations, which are used by graduate level schools to determine achievement at the undergraduate level.

LIFE-CYCLE THEORY AND COLLEGE STUDENTS 17
life-cycle model, student debt has only an income effect12 on career and other post-college
decisions, [but] as debt is unlikely to represent more than one percent of a college graduate’s
lifetime earnings, we expect any such effects to be small” (Rothstein & Rouse, 2011, p.149).
The authors challenge this economic assumption, using a difference-in-differences (DID)
method13 to compare career paths of students on financial aid with those who were not. If there
was no significant difference between the major and career decisions of students on financial aid
versus those who were not, then the life cycle theory would be upheld: the amount of debt
accumulated while in college would have little effect on future career choices. Data for the study
were gathered from the 1995-2002 administrative records from a highly selective, expensive, and
competitive university. This university was in the process of reforming its financial aid policies,
transitioning to a policy where loans were replaced with grants. However, the impact debt has on
the early career decisions of college students is so significant that the income effect cannot
possibly account for all of it.
In the DID analysis, Rothstein and Rouse (2011) found that increased debt aversion
resulted in students opting toward high-salary jobs, even those with fewer benefits and amenities.
Within the same analysis, the researchers found that whether or not a student was on financial
aid affected outcomes in terms of post-graduate careers: “Aid recipients shifted out of industries
with high average salaries and into lower-salary industries, while there was little change in the
industry composition of jobs taken by students not on aid” (p. 156). Although this seems
contradictory as students on financial aid will likely have loans to pay after graduation and
12 The income effect in this case is a proportion of debt to the present discounted value of total lifetime earnings (Rothstein & Rouse, 2011). 13 Difference-in-differences is an econometric technique that measures the affect of a treatment at specific points in time and allows for before and after comparisons (Rothstein & Rouse, 2011).

LIFE-CYCLE THEORY AND COLLEGE STUDENTS 18
therefore may be driven to high salary positions, because financial aid reduced the overall cost of
attending college aid recipients had the financial flexibility to not follow this route.
Additional analyses showed that debt levels had no effect on students’ decisions to
pursue graduate degrees. The authors suggest that in the standard economic view, “there is no
reason to think that high levels of student debt represent a market failure that warrants
intervention” (Rothstein & Rouse, 2011, p.162). This conclusion assumed that students were
smoothing their consumption and were entering into larger amounts of debt because they expect
larger earnings and savings in the future. However, Rothstein and Rouse (2011) found college
students’ post-graduate decisions are affected by the amount of debt with which they graduate:
“College debt affects post-graduation employment decisions: students with more debt are less
likely to accept jobs in low-paying industries and accept higher-paying jobs more generally”
(p.162). Students’ debt not only can affect major decisions and career path, but it could also
influence how easily they will be able to take out loans in the future if the debt has not been
repaid.
Loans, Loans, and More Loans
As higher education expenses rise, students and their families must find alternative ways
of affording higher education. Although the increase in tuition is a large part of the current
student loan crisis, Burdman (2005) argues that the escalation of debt is also due to a shift in the
financial aid system. Students often take out loans to attend college because, as previously
discussed, they expect the return on their education to be greater than what they are spending.
Loans have given many people, who otherwise would not be able to afford it, the chance to
achieve an advanced degree, therefore opening doors to new opportunities. However, according
to Burdman (2005), the number of loans and the amount borrowed within the financial aid

LIFE-CYCLE THEORY AND COLLEGE STUDENTS 19
system has increased: “Since the early 1980s, student financial aid has quietly been transformed
from a system relying primarily on need-based grants to one dominated by loans” (p. 2). This
shift has resulted in larger student loan debt after graduation, and, in many cases, has limited the
options of attending college for many students from low-income families. These students opting
to not take out significant loans in order to attend college are referred to as loan-averse. Through
her analysis, Burdman (2005) explores loan aversion’s role in the financial aid market and
suggests specific policy changes to increase the tolerance of future debt.
Loan aversion, a subset of debt aversion in general, is the avoidance of taking out loans
because of the burden that it would put on the borrower. For some people, loans are a
disincentive to attend college because they may increase future financial burdens. Bridget
Burns, a graduate student and member of the higher education board at Oregon State University
claimed, “ ‘Grants actually give people an incentive to go to school, and loans are a disincentive.
That’s a problem when you’re trying to promote access. Loans alone just don’t do the job’”
(Burdman, 2005, p. 6). The decision to take out a loan, especially for low-income families, is not
an easy one, and many students choose to forgo higher education because they are unwilling to
borrow. According to the American Council on Education, many students who would qualify for
loans and federal aid do not even apply for it when exploring how to pay for college (Burdman,
2005). This failure to apply is often due to the unnecessarily complicated applications (Thaler &
Sunstein, 2008). When these low-income students do apply and receive loans, they sometimes
do not take full advantage of the loans and aid awarded. Loan aversion reflects the doubt in the
market in terms of making a sufficient income in order to repay loans in the future. Regarding
future policy changes, Burdman (2005) recommends that there be 1) more financial aid options

LIFE-CYCLE THEORY AND COLLEGE STUDENTS 20
for low-income students, 2) more efficient loan repayment programs, 3) more education about
financial aid, and 4) more options for part-time higher education.
Credit Card Debt Puzzle
In order to balance consumption and income, many people revolve debt on their credit
cards in order to smooth consumption. Revolving debt refers to the tendency for people to
maintain a balance on their credit card in order to avoid periods of high spending and periods of
no spending. According to Bertaut, Haliassos, and Reiter (2008), “the life-cycle stage of young
households would seem to favor the use of a credit card, given that it offers the possibility for
consumption smoothing through revolving debt” (p. 679). The credit card debt puzzle is the
inclination for people to keep high, unpaid balances on their credit cards at a high interest rate
while still holding liquid assets. Economically it makes more sense to pay off credit card debt
with current liquid assets because the interest rate on credit card debt is significantly higher than
the level of interest that one would accumulate with liquid savings in a bank: “Using the money
from the savings account to pay off the credit card debt amounts to what economists call an
arbitrage opportunity – buying low and selling high – but the vast majority of households fail to
take advantage” (Thaler & Sunstein, 2008, p. 51).
Bertaut et al. (2008) looked at the self-control aspect of holding a balance on one’s credit
card. Although it may not seem logical, credit card holders may fail to pay off their balances in
full in order to prevent themselves from running up the balance month after month: “In deciding
how much credit card debt to revolve, the accountant takes into consideration all standard factors
(e.g., life-cycle, precautionary, borrowing constraints, etc.) but also that a higher unpaid balance
leaves less room to the shopper for charging on the credit card” (Bertaut et al., 2008, p. 659). In
other words, people believe that holding debt at a high interest rate will cause them to spend less

LIFE-CYCLE THEORY AND COLLEGE STUDENTS 21
than they would if they had access to their full credit card limit every month. In addition, people
may keep credit debt instead of paying it off with liquid assets because they may need their
savings if credit is no longer available (Telyukova & Wright, 2008). People see liquidity as an
asset to be used in the case of unexpected expenses; in other words, liquidity provides a sense of
security.
Banks make money by charging their customers interest on unpaid debt. They issue
credit cards with limits partially determined by current income and savings, and apply fees and
interest charges for late payments. As debt carries over month-to-month, interest stacks up as
interest owed becomes part of the balance accrued and the credit card holder ends up paying
interest on interest. Vyse (2008) reports that, “interest, late fees, and annual fees are a major
source of income for the credit card companies, so the banks have an incentive to encourage
customers to maintain high balances without defaulting” (p. 100-101). Bertaut et al. (2008)
found that, “although revolving of high-interest credit card debt could simply reflect a need to
borrow due to limited finances, almost a third of credit card debt revolvers also have liquid assets
that exceed their card balance” (p. 661). Because of this, it would be feasible for people who
revolve their debt to pay it off monthly. Instead it seems that people are reluctant to lower the
levels of their liquid assets, and are willing to tolerate accumulated interest in order to hold on to
liquidity: “Households who revolve credit card debt appear to have target utilization rates of their
credit card limits rather than a specific amount of debt necessary to finance consumption needs”
(Bertaut et al., p. 688-689). This tolerance for debt is concerning, especially among college
students and recent graduates who may not realize the extent of debt they have accumulated, the
difficulty of paying off credit card debt, and the potential damage to their credit score.

LIFE-CYCLE THEORY AND COLLEGE STUDENTS 22
Knowledge of Personal Finance
College students are generally inexperienced at managing their money. Whether due to
lack of education about money management practices or little capability of estimating future
expenditures and income, college students often find themselves accumulating huge amounts of
credit card debt before graduation. Henry, Weber, and Yarbrough (2005) distributed a 13-item
questionnaire to students taking education courses at the University of Louisiana at Lafayette.
The only questions directly relating to budgeting and money management were employment
status, number of jobs, estimated yearly income, and an open response describing budgeting
practices. The researchers found that students either did not understand how to manage their
money or had little desire to make the effort to do so. Although few students kept to a written
budget, Henry, Weber, and Yarbrough (2005) did find that women were more likely than men to
have a budget and that keeping and following a budget becomes more of a habit with age. This
pattern is concerning because maintaining a budget is an important skill to have when living
independently post-graduation, and a lack of money management skills could lead to financial
crisis.
Chan, Chau, and Chan (2012) looked at the relationship between financial management
and financial well being in college students at Hong Kong universities. Because freshmen,
especially in Hong Kong, are prime new clients for many credit card companies, spending often
gets out of control. Students’ new financial independence can lead either to improved financial
responsibility in terms of saving, paying bills, and following a budget, or it could lead to the start
of a long run of debt. One answer has been to educate college students about financial
responsibility, and Chan et al. (2012) wanted to determine whether financial education was
actually related to the behavior of college students in Hong Kong. In a survey of 821

LIFE-CYCLE THEORY AND COLLEGE STUDENTS 23
participants, the researchers posed questions about personality, attitude toward money, tolerance
of debt, and perceived financial knowledge. A combination of open response and index
questions provided a qualitative and quantitative approach to the analysis. Chan et al. (2012)
found that although students did not seem to be struggling with financial difficulties in terms of
accumulating debt, they did report a significant amount of financial stress and reported spending
a great deal of time working outside of school to make money. This pattern is applicable to the
population in the current study because with tuition increases and uncertain economic
environment, there may be greater pressure to find a job while still attending Connecticut
College in order to achieve financial stability.
In a study of college students in the United States, Robb and Sharpe (2009) looked at
levels of financial knowledge and how they affected credit card behavior. Acknowledging that
credit card companies target college students as new clients is again an important factor in
determining accessibility and salience. For credit card companies, college students are a young
and potentially profitable sector of clients because they are likely to start accumulating debt and
paying fees. According to Vyse (2008), “my students, most of whom are still a few years away
from full-time work, are flooded with credit card offers” (p. 12). It is not a bad idea for college
students to maintain a credit card in order to establish good credit, but there is no need to possess
multiple cards in order to do so. Vyse (2008) claims that credit card companies use aggressive
strategies and incentives in order to attract a younger consumer base: “[B]illions of credit card
applications are mailed out each year offering introductory 0 percent APR14 and other
inducements to attract customers. College students fresh out of high school, many of whom have
little or no income are aggressively solicited” (p. 100).
14 APR stands for Annual Percentage Rate and refers to the interest rate on a card for the entire year rather than from month to month.

LIFE-CYCLE THEORY AND COLLEGE STUDENTS 24
Robb and Sharpe (2009) wanted to determine what factors might predict responsible or
irresponsible credit card use, honing in on financial knowledge as a key variable. In order to
achieve a wide sample, the researcher sent an online survey to three sectors of the student
population: undergraduate, graduate, and professional. The dependent variable was the decision
to hold, or revolve, a balance on one’s credit card from month to month. Independent variables
included multiple measures of financial knowledge and attitudinal variables. Robb and Sharpe
(2009) found that approximately a third of their sample kept a revolving balance, therefore
paying interest on the value held on the account. Key findings included that the level of financial
knowledge did not predict carrying a balance, and “being financially independent was positively
related to carrying a revolving balance, and was associated with higher log balances” (Robb &
Sharpe, 2009, p. 32). This outcome is interesting because although being financially
independent requires greater responsibility, the pressure and stress of doing so seemed to lead to
an increased need to rely on credit.
One of the challenges that college freshmen face is the financial separation from parents.
Developing responsibility for and an understanding of personal finances can be intimidating and
challenging when added to the social demands of freshman year. Kidwell, Brinberg, and Turrisi
(2003) looked at attitude, affect, past behavior, and perceived ability in relation to students’
budgeting. Using a sample of university students, all taking introductory psychology, the
participants were given questionnaires measuring a range of behavior from maintaining a
financial budget to level of impulsivity to normative influences pertaining to finances. The study
found that money management attitudes were correlated with one’s cognition, affect,
employment status, and financial situation. Cognition referred to thoughts regarding budgeting
behavior while affect refers to the emotions participants attached to finances and budgeting.

LIFE-CYCLE THEORY AND COLLEGE STUDENTS 25
Kidwell et al. (2003) found that personality variables like having an internal locus of control or
impulsiveness can have strong relationships with the way one spends money. The researchers
also found that monetary parental support and students’ expectation of parental support affected
how careful students were in budgeting.
Credit Card Use and Misuse
The introduction of credit cards into the global economy has drastically reduced our
ability to control spending. Credit card companies market to college students in order to take
advantage of young spenders and develop a consumer base for future years. Hayhoe, Leach, and
Turner (1999) examined the relationship between money attitudes and the number of credit cards
held by college students. The scales in the questionnaire included the Money Beliefs and
Behavior Scale measuring money attitudes, a scale measuring perceived economic well-being, as
well as questions regarding credit card use. The fewer credit cards students reported holding was
related to higher obsession with and retention of money, as well as a lower affective credit
attitude15 (Hayhoe et al., 1999). A significant number of credit cards, in this study more than
four, were correlated with high affective attitude toward credit card use.
In a continuation of the 1999 study, Hayhoe, Leach, Turner, Bruin, and Lawrence (2000)
examined the effect of gender on credit card attitudes and use. A sample of 480 students filled
out surveys containing the Affective Credit Attitude Index, questions about the variety of
purchases, financial practices, and financial stress. Using seven regression analyses, the
researchers controlled for age, income, residence, marital status, gender, affective credit attitude,
number of credit cards with a balance, number of credit cards with a maximum balance, number
15 Affective credit attitude is a subset of the credit attitudes survey and measures the emotional connection to credit. High affective credit attitude is a positive emotional attachment to using credit while a low affective credit attitude signifies low attachment (Hayhoe et al., 1999).

LIFE-CYCLE THEORY AND COLLEGE STUDENTS 26
of credit cards in total, and financial stressors. Hayhoe et al. (2000) found that students with
higher affective credit scores spent more, with women spending primarily on appearance items
and men spending primarily on leisure items. This gender difference suggests that men and
women, although they do not differ significantly in debt levels or quantity of credit cards held,
gain utility from different areas of spending.
Moore and Carpenter (2009) focused on how the money attitudes of college students
affected their behavior in terms of credit card use. This study furthered Roberts and Jones’
(2001) study on money attitudes, where they used a scale measuring the anxiety, power and
prestige, and distrust surrounding college students’ expenditure. Moore and Carpenter (2009)
sought out participants from upperclassmen majoring in a business-related field. Measures
included a money attitude scale, a financial practices scale adapted from Hayhoe et al. (2000)
and used in this study, and a credit card usage scale adapted from Roberts and Jones (2001), also
used in the present study. The researchers found that students’ attitudes toward money were
directly related to their credit card use. Higher scores on the subscales of power and prestige, as
well as anxiety, increased the likelihood of negative credit card use, meaning overspending and
delinquency in paying bills, among students.
As the number of college students owning credit cards has increased, so has the amount
of credit card debt among students. These changes have spurred research into both the spending
habits of college students as well as the levels of credit card debt that students incur. Holub
(2002) compiled a summary of studies by Nellie Mae, the U.S. General Accounting Office, The
Education Resources Institute (TERI), and The Institute for Higher Education Policy (IHEP).
The Nellie Mae study in 2000 looked at credit card ownership among students applying for loans
through Nellie Mae (Holub, 2002). This study showed that the just over 50% of undergraduate

LIFE-CYCLE THEORY AND COLLEGE STUDENTS 27
students held a credit card, whereas, 95% of graduate students owned a credit card. Most
students, as reported in the U.S. General Accounting Office’s 2001 study, reaped positive
benefits from their credit card use (Holub, 2002). These benefits included flexibility in
spending, building good credit, and establishing financial responsibility. However, Holub (2002)
found that the TERI/IHEP surveys revealed far more disadvantages than advantages for college
students owning credit cards. Students who relied on credit to help balance school spending with
respect to tuition and textbooks were far more likely to get stuck revolving balances than were
students who did not rely on credit. The TERI/IHEP survey done in 1998 found that recipients
of student loans were more likely to revolve their credit card balance than were undergraduates
with no loans (Holub, 2002).
A 2002 study by Nellie Mae analyzing credit card usage rates and trends provided a
further snapshot of credit card use among college students (Nellie Mae, 2002). The survey found
that the percentage of undergraduates who held credit cards increased significantly after
freshmen year, supporting the suggestion that credit card companies target college freshmen.
Although the average credit card balance declined from 2000 to 2002, there was still a cause for
concern because the level of debt, from both education loan and credit card balance, for
graduating students was still significant (Nellie Mae, 2002). As students progressed through
school, both their average credit card debt and average student loan debt increased (see Figure
2). According to Nellie Mae’s 2002 study, “[s]tudent loans are designed for student borrowers,
providing payment deferral during college while most students have little to no income” while
“[c]redit cards are designed for people with income…[who can] make payments every month”
(p. 5). This pattern suggests the danger in racking up credit card debt while still in college, when
students often do not have the means to pay balances in full at the end of each month.

LIFE-CYCLE THEORY AND COLLEGE STUDENTS 28
Factors Contributing to Debt Accumulation
Norvilitis, et al. (2006) looked at the effect of personality factors, attitudes toward
money, and overall financial knowledge on the quantity and frequency with which college
students hold credit card debt. Participants included 448 college and university students from
across the continental United States. The majority of participants were sophomores, juniors, and
seniors because the researchers wanted students who had accumulated debt. Surveys consisted
of measures of financial status and credit card use, attitudes toward debt, financial knowledge,
and stress. Norvilitis et al. (2006) found that only a third of students with credit cards pay off the
balance in full monthly, meaning that two thirds are revolving debt. Financial knowledge was
also pinpointed as an important factor in predicting future issues with debt: “It is one of the
strongest predictors of debt and is also one of the most amenable to change” (Norvilitis et al.,
2006, p. 1407). Increasing the amount of financial knowledge and financial information
available to college students could reduce risk of accumulating credit card debt significantly.
Other predictors of debt included number of credit cards, age, and attitudes toward spending.
Most demographic variables like gender, grade point average, and hours spent working were not
correlated with debt (Norvilitis et al., 2006).
In an earlier study, Norvilitis, Szablick, and Wilson (2003) looked at factors that affected
how much debt college students accumulated. Knowing that college students were likely to hold
credit cards, the researchers were hoping to isolate specific predictor variables of small and large
amounts of credit card debt. All 227 participants were from SUNY Buffalo and were relatively
evenly split across class years. Participants were given questionnaires asking about basic
demographic information, the number of credit cards held, financial well-being, attitudes toward
money, impulsivity, satisfaction, and locus of control (Norvilitis et al., 2003). One of the key

LIFE-CYCLE THEORY AND COLLEGE STUDENTS 29
findings of the study was that, “students who request and receive credit cards from on-campus
sources are in greater relative debt than are students who get their credit cards from other places”
(p. 943). This finding implies that college and university administrators could be more active on
campus in regard to credit card solicitors and their access to enrolled students. By increasing the
number of hurdles between students and credit card companies, college administrators could
discourage students from opening new credit accounts. One way to do this is to prevent banks
from signing students up for cards immediately and instead require the students to contact the
bank again at a later date. According to Vyse (2008) by creating this cooling-off period, it may
cause students to re-evaluate their needs: “Cooling-off periods are another kind of asymmetrical
program designed to help people do what is in their long-term interests” (p. 296). Students who
possessed a large amount of debt were stressed about paying off the debt in the future, but other
personality and attitudes toward money factors did not seem to be related to levels of credit card
debt.
Although there is a trend of debt accumulation among college students, not all students
fall into a debt trap. Leclerc (2012) explored the factors contributing to spending habits and
credit card debt in college students, attempting to isolate specific risk factors. Among the
elements surveyed were availability of credit, financial knowledge, social pressures, academic
performance, financial aid, and family income. Not only are credit cards easily obtained, but
they also function as a way to develop financial independence, whether or not an individual is
prepared to take on the responsibility. Owning a credit card increases the psychological ease of
spending, and “[s]tudents feel better about themselves and their social well being if they can
purchase items like electronics and designer clothing that raise their social status” (Leclerc,
2012, p. 150). Family structure surrounding spending, debt, and financial knowledge is also a

LIFE-CYCLE THEORY AND COLLEGE STUDENTS 30
key factor in predicting future behavior. Students who are exposed to a culture where it is
acceptable to overspend and carry large amounts of debt may be at greater risk for following
similar patterns themselves. Parental involvement in financial education in terms of credit cards
and debt is crucial: “Students who had a lower credit card balance were more likely to be
educated by their parents about proper spending and credit debt” (Leclerc, 2012, p. 152-153).
Interestingly, academic performance was also correlated with the level of credit card debt, with
high academic performers carrying lower levels of credit card debt than lower academic
performers (Leclerc, 2012). Although the relationship between academic performance and credit
card debt is strong, in order to strengthen the causal chain one must look at the relationship
between academic performance and personality, as well as the tendency to accumulate credit
card debt. There are likely other factors contributing to this relationship including self-control.
Predicting Debt Repayment After College
Ho Ha and Krishnan (2012) looked at factors predicting repayment of credit card debt,
using survival analysis to look at who succeeds in recovering from credit card debt and who does
not. The researchers attempted to predict credit delinquency in retail stores. Credit
delinquency, or making late payments resulting in accumulated debt, was measured using factors
like how often a customer makes delinquent payments, how long debt is outstanding, the level of
unpaid debt, and the frequency of eventual repayment. Ho Ha and Krishnan (2012) found that in
terms of debt recovery, “the number of purchasing months and the average frequency of
repayments were the most predictive variables” (p. 773). Although this study was focused on
minimizing risk for retail stores in terms of dealing with delinquent credit card users, the strong
predictor variables identified by the authors could shed light on important strategies recent
graduates could employ to recover from potential credit card debt.

LIFE-CYCLE THEORY AND COLLEGE STUDENTS 31
This analysis of the literature summarizes how financial aid and loans, future career
choices, money management skills, and credit card use have affected students economically and
socially. Building on the previous literature, the present study surveyed college students and
alumni in an attempt to draw a connection between financial independence while in college and
future debt and debt repayment, in addition to measuring adherence to the life-cycle hypothesis.
If students and recent alumni were currently employing a pattern of deficit spending, their
actions would be considered rational as long as they expected to make enough money to pay off
that debt in the future. Through surveying both current students and recently graduated alumni,
the present study captured two comparison demographics. This allowed for greater analysis of
the life cycle hypothesis, focusing on the transition from a lack of steady income to the start of
greater financial independence. Hypotheses are grounded in the theoretical framework of the life
cycle hypothesis and the credit card debt puzzle, and consider additional factors that affect how
and why people do not always adhere to predictions. By combining quantitative scales, current
spending habits, and expectations in the future, the present study adds a new dimension to
previous research.
Hypothesis 1. College students will overestimate the median starting salary and mid-
career salary as predicted by the 2012-2013 PayScale College Salary Report (Appendix A).
Hypothesis 2. College students will use credit or debit cards more frequently than they will use
cash. Hypothesis 3. Students who have lower financial confidence will have greater
irresponsible credit card use than those with higher financial confidence. Hypothesis 4. Students
who report greater confidence in their expected starting and mid-career salary will have a higher
debt tolerance while in college than will those who are less confident.

LIFE-CYCLE THEORY AND COLLEGE STUDENTS 32
Method
Participants
This study included 230 participants obtained from the Connecticut College student body
and recent alumni. The student sample consisted of 13 men and 53 women, 88% who identified
as Caucasian. Eighty-four students opted to take the survey, but only 78.5% of these responses
are included in the analysis due to response error and incompleteness. The useable data included
66 students: 17 freshmen (class of 2016), 17 sophomores (2015), 8 juniors (2014), and 24 seniors
(2013). Current Connecticut College students were self-selected from the Psychology 101 and
102 research pool during fall and spring semesters. Students enrolled in these courses received
30 minutes of research credit for participation in the study. The introductory psychology subject
pool consisted primarily of freshman and sophomores who have an interest in psychology, so the
sample may not be representative of the college as a whole. Some current students opted to take
the survey in the library during finals week in exchange for a small incentive, i.e. a piece of
candy, in return for their participation.
Alumni participation was obtained by sending an email through the Office of Alumni
Relations at Connecticut College. This office does not distribute alumni emails to avoid
solicitation, but was willing to have its own staff send out the survey via email. Alumni from the
classes of 2012, 2011, 2010, and 2009 were sent a message asking them to participate in the
survey (see Appendix B). The response rate for alumni was 10.1%, but only 81.2% of these
responses were included in the study due to response error and incompleteness. The useable
alumni responses consisted of 43 men and 121 women, 89% of who identified as Caucasian. Of
the 164 alumni who responded, 40 graduated in 2012, 34 graduated in 2011, 52 graduated in
2010, and 36 graduated in 2009. Alumni self-selected into the study by clicking on the link

LIFE-CYCLE THEORY AND COLLEGE STUDENTS 33
provided and completing the survey. Upon completion of the survey, alumni were entered in a
raffle to receive a $30 gift card. All participants filled out and signed an informed consent
document (see Appendix C) prior to participating in the study. Upon completion, they received a
debriefing form (see Appendix D).
Materials
The survey consisted of three scales measuring attitudes toward credit cards and
budgeting. Each scale was randomized within the survey to account for potential framing effects
and other biases. After participants completed the survey, they filled out a demographic form.
Credit Card Use Scale (CCUS). This scale (Roberts, 2001) was a 12-item measure
designed to assess the typical credit card use of a participant. Statements such as, “My credit
cards are usually at their maximum limit” and “I worry how I will pay off my credit card debt”
were scored on a five-point Likert-type scale ranging from strongly agree (1) to strongly disagree
(5). Statements such as, “I always pay off my credit cards at the end of each month” and “I
rarely go over my available credit limit” were reverse scored. Scores could range from 12-60
with higher scores representative of less responsible credit card use. Roberts (2001) reported a
Cronbach’s alpha of .81, and the obtained alpha in this study was .80 indicating high reliability.
Student Financial Well-Being Scale (SFWB). Lea, Webley, and Walker (1995)
designed an eight-item scale to measure student perceptions of their own financial well-being.
Rather than measuring attitudes toward spending, this scale focused on feelings of financial
security. Statements like, “I worry about repaying my student loans” and “I think a lot about the
debt I am in” were scored on a five-point Likert scale ranging from strongly agree (1) to strongly
disagree (5). Statements like, “I think I am in good financial shape” and “One year from now I
will not be in credit card debt” were reverse scored. Scores ranged from 8 to 40 with higher

LIFE-CYCLE THEORY AND COLLEGE STUDENTS 34
scores indicative of lower financial confidence. Lea et al. (1995) reported a Cronbach’s alpha
for the Student Financial Well-Being Scale of .74 signifying good reliability. The present study
obtained an alpha value of .82 indicating high reliability.
Student Attitudes Toward Debt Scale (SATD). This scale was adapted from that used
by Lea, Webley, and Walker, (1995) and is designed to measure debt tolerance in college
students. Originally a 17-item scale, 2 items deemed not applicable to college students were
removed for the present study. Typical statements include: “Taking out a loan is a good thing
because it allows you to enjoy life” and “Credit is an essential part of today’s lifestyle.”
Questions were measured using a seven-point Likert-type scale ranging from strongly agree (1)
to strongly disagree (7). Scores ranged from 15-75 with high scores suggestive of high debt
tolerance in college students. Lea et al. (1995) reported a Cronbach’s alpha of .79 showing good
reliability while the present study obtained an alpha of .66 indicating moderate reliability.
Student/Alumni Demographics. Participants completed a demographic questionnaire at
the end of the survey. Which demographic questionnaire participants received depended on
whether they were current students at Connecticut College or alumni. Included in the
demographic questionnaire were questions about race, gender, and class year in order to gather
background information about the participant. Questions regarding major and minor, GPA,
plans to attend graduate school, and estimates about future earnings were intended to show
student perceptions of future lifetime income. Financial aid status was to be measured along
with parental contribution to measure student contribution to college spending. Finally,
questions regarding the level of spending and the means of payment gave another means of
measuring budgeting and spending habits.

LIFE-CYCLE THEORY AND COLLEGE STUDENTS 35
Procedure
Participants signed up for the survey either in Frederick Bill Hall, the Psychology
department building, or through email. Psychology 101 or 102 students who wanted to receive
course credit reported to the auditorium in Frederick Bill Hall or to the student center on the
designated date and time to take the survey. Once each student arrived, participants were sent an
email containing the link to the survey and were given as much time as they needed to complete
it. After signing the consent form, six forms of the survey, systematically randomizing the order
of the scales, were presented to the participants via Survey Monkey. The four measures included
in the survey were the Credit Card Use Scale (see Appendix E), the Student Financial Well-
Being Scale (see Appendix F), and the Student Attitudes Toward Debt Scale (see Appendix G).
The demographic form (see Appendix H, see Appendix I) was always the last questionnaire in
the survey. Participants were instructed to fill out the survey to the best of their ability. When
participants completed the survey they were given the debriefing form.
Results
In order to test the hypothesis that college students would overestimate the median
starting salary as predicted by the 2012-2013 PayScale College Salary Report (see Appendix I),
two mixed design analysis of variances were conducted (see Figure 5). The first ANOVA was a
2 (group: students vs. alumni) x 2 (salary: predicted vs. actual starting) mixed design analysis of
variance. There was a significant difference in the main effect of group, F(1,154)=9.03, p=.003.
There was no significant difference for the main effect of predicted vs. actual starting salary as
reported in the PayScale 2012-2013 report. The group by salary interaction effect was
significant, F(1,154)=9.97, p=.002. Simple effects tests for predicted versus actual starting
salaries were calculated separately for students and alumni. Although the simple effects test for

LIFE-CYCLE THEORY AND COLLEGE STUDENTS 36
alumni approached significance with a tendency to underestimate starting salary, neither simple
effects test was significant. In addition, simple effects tests were completed between alumni and
students for predicted verses actual starting salaries. The simple effects test on predicted salary
was significant, F(1,308)=25.96, p<.001, such that current students predicted their starting
salaries to be significantly higher than alumni. There was no significant difference between the
reported actual starting salaries for students and alumni.
The second ANOVA tested the hypothesis that college students would overestimate their
median mid-career salaries as predicted by the 2012-2013 PayScale College Salary Report was
35000
37000
39000
41000
43000
45000
47000
49000
51000
53000
Predicted Starting Salary PayScale Starting Salary
Sala
ry ($
)
Condition
Students
Alumni
Figure 4. Results of a 2(group: students vs. alumni) x 2(salary: predicted vs. actual starting) mixed design analysis of variance show a significant difference between the predicted starting salaries of students and alumni as well as a significant interaction effect.

LIFE-CYCLE THEORY AND COLLEGE STUDENTS 37
tested with a 2 (group: students vs. alumni) x 2 (salary: predicted vs. actual median) mixed
design analysis of variance (see Figure 6). There was a significant main effect of salary,
F(1,154)=7.27, p=.008, indicating that both students and alumni overestimated their mid-career
salaries. Neither the main effect of group (students vs. alumni) nor the interaction of group and
salary was significant. Hypothesis 1 was partially supported: students and alumni over predicted
mid-career salaries in comparison to the PayScale 2012-2013 reported salaries.
To test Hypothesis 2, that participants would be more likely to use credit or debit cards
than cash, Friedman tests on the preferred methods of payment of college students and alumni
were calculated. The test for the entire data set was significant, with cash being used the most
50000
80000
110000
140000
170000
200000
230000
260000
290000
Predicted Mid-‐Career Salary PayScale Mid-‐Career Salary
Sala
ry ($
)
Condition
Students
Alumni
Figure 5. Results of a 2(group: students vs. alumni) x 2(salary: predicted vs. actual median) mixed design analysis of variance show a significant difference between the predicted starting salaries of students and alumni as well as a significant interaction effect.

LIFE-CYCLE THEORY AND COLLEGE STUDENTS 38
frequently, then debit, then credit, and finally checks least frequently (see Table 1). There was a
significant difference in the method of payment with participants using cash most frequently,
then debit, then credit, and checks were the least frequently used, χ2 (3, N = 229) = 183.38, p <
.001. Friedman tests were also performed on the individual differences between payment types.
Participants reported using cash significantly more often than credit, χ2 (1, N = 229) = 4.76, p =
.029, cash significantly more often than checks, χ2 (1, N = 229) = 136.81, p < .001, credit
significantly more often than checks, χ2 (1, N = 229) = 79.59, p < .001, and debit more often than
checks χ2 (1, N = 229) = 84.37, p < .001. Participants reported no significant difference in use of
cash versus debit or credit versus debit.
A test of the student group showed significant differences in the mean rank of preferred
methods of payment with students using cash most frequently, then debit, then credit, and checks
least frequently, χ2 (3, N = 67) = 97.62, p < .001 (see Table 1). Individual Friedman tests were
also performed on the differences between payment types. Students reported using cash
significantly more often than credit, χ2 (1, N = 67) = 10.88, p = .001, cash significantly more

LIFE-CYCLE THEORY AND COLLEGE STUDENTS 39
often than debit, χ2 (1, N = 67) = 4.31, p = .038, debit significantly more often than checks, χ2 (1,
N = 67) = 45.15, p < .001, credit significantly more often than checks, χ2 (1, N = 67) = 48.49, p <
.001, and cash more often than checks, χ2 (1, N = 67) = 55.54, p < .001. Finally, students
reported no significant difference between debit and credit card use.
Finally, among alumni there was a significant difference in the method of payment with
cash, once again the most frequently used, then debit, then credit, and checks which were least
frequently used, χ2 (3, N = 67) = 96.52, p < .001 (see Table 1). Friedman tests were also
performed for alumni on the differences between pairs of payment types. Alumni reported using
cash to pay for purchases significantly more often than checks, χ2 (1, N = 162) = 83.06, p < .001,
credit significantly more often than checks, χ2 (1, N = 162) = 37.56, p < .001, and debit
significantly more often than checks, χ2 (1, N = 162) = 43.56, p < .001. There was no significant
difference between alumni use of cash versus credit, cash versus debit, or credit versus debit. In
sum, these tests indicate that Hypothesis 2 was not supported: students and alumni both use cash
more frequently than either debit or credit.
To test Hypothesis 3 that students with lower financial confidence would have higher
irresponsible credit card use than students with higher financial confidence, Pearson’s
correlations were performed on the CCUS, the SFWB scale, and the SATD scale. Financial
confidence was measured using the SFWB scale with higher scores indicative of higher financial
uneasiness and lower confidence. Higher scores on the SATD were indicative of a higher debt
tolerance. Responsible credit card use was measured using the CCUS, with higher scores
indicative of irresponsible credit card use. In analysis of the overall data set inclusive of both
students and alumni, significant positive correlations existed between the total SFWB, total
CCUS, and total SATD (see Table 2). These relationships indicate that as participants were

LIFE-CYCLE THEORY AND COLLEGE STUDENTS 40
more financially uneasy, they also reported more irresponsible credit card use and had higher
tolerance of debt. The relationship also worked in the opposite direction – participants who
reported being confident financially had lower tolerance of debt and more responsible credit card
use.
Significant positive correlations were also found when separately analyzing the student
and alumni data. For both student and alumni participants, a significant positive correlation
existed between total SFWB, CCUS, and SATD (see Table 2). The same relationships described
previously for the overall data set also held true for the student population and alumni population
separately. Those reporting financial uneasiness had high tolerance of debt and greater
irresponsible credit card use, and those reporting financial confidence had a low tolerance of debt
and reported more responsible credit card use. There were no significant differences between the
correlations of students and alumni as tested using the Fisher method (Howell, 2002).
Hypothesis 3 was supported: low financial confidence is related to irresponsible credit card use.

LIFE-CYCLE THEORY AND COLLEGE STUDENTS 41
In order to test Hypothesis 4, that participants who were more confident in expected
starting and mid-career salaries would have a higher debt tolerance while in college than those
who were less confident, Pearson’s correlations were performed. Analysis of the data, inclusive
of both students and alumni, correlated the total SATD, expected starting salary, and the
confidence in this expectation (see Table 3). There was a significant negative relationship
between scores on the total SATD and expected salary, indicating that SATD scores decreased as
expected salary increased and vice versa. In other words, as participants were less tolerant of
debt, they predicted higher starting salaries. No other significant correlations were found.
Pearson’s correlations were also calculated for the total SATD, expected mid-career salary, and
the confidence in this expectation (see Table 4). No significant relationships were found.
Correlations of total SATD, expected starting salary, and the confidence in this
expectation were also performed separately for student and alumni groups. Analysis of the
student data showed a significant relationship between expected starting salary and confidence.

LIFE-CYCLE THEORY AND COLLEGE STUDENTS 42
The positive correlation indicated that student confidence increased as predicted starting salary
increased. No other significant correlations were found. Second Pearson’s correlations were
calculated for the total SATD, expected mid-career salary, and the confidence in this expectation
was also performed. No significant relationships were found. Analysis of the alumni data
correlated the total SATD, expected starting salary, and the confidence in this expectation.
Second sets of Pearson’s correlations were calculated for the total SATD, expected mid-career
salary, and the confidence in this expectation was also performed. No significant relationships
were found in either of these sets of correlations. As a result, Hypothesis 4 was not supported:
there was no apparent relationship between confidence in future salaries and debt tolerance.
Additional Analyses
Additional analyses performed on the data included Pearson’s correlations of perceived
financial well being, as reported on the SFWB, and level of debt at graduation. Analysis of the
combined student and alumni data set showed a significant positive relationship between the

LIFE-CYCLE THEORY AND COLLEGE STUDENTS 43
SFWB scale and debt at graduation (see Table 5). The positive correlation indicated that as the
amount of debt owed at graduation increased, so did financial uneasiness. When the data set was
split into students and alumni, similar positive correlations were found. Separate analysis of the
student and alumni data also showed significant positive correlations between the SFWB scale
and level of debt at graduation.
Further analysis of alumni data showed a significant positive correlation between the
SFWB scale and the amount of debt alumni report being in currently (see Table 6). This positive
relationship indicates that as current debt levels of alumni increased, so did their financial
uneasiness. The data also showed a significant negative relationship between the SFWB scale
and the current salary of alumni, r(139) = -.24, p = .005. This negative relationship means that
as current salary levels increased, financial uneasiness decreased.
A Friedman test was performed in order to rank the items on which current students
reported spending their money (see Table 6). There was a significant difference in the rank order
of items with the most money spent on food, then clothes, then alcohol, then education supplies,
then travel expenses, then entertainment, then car expenses, and finally electronics, χ2 (7, N = 67)
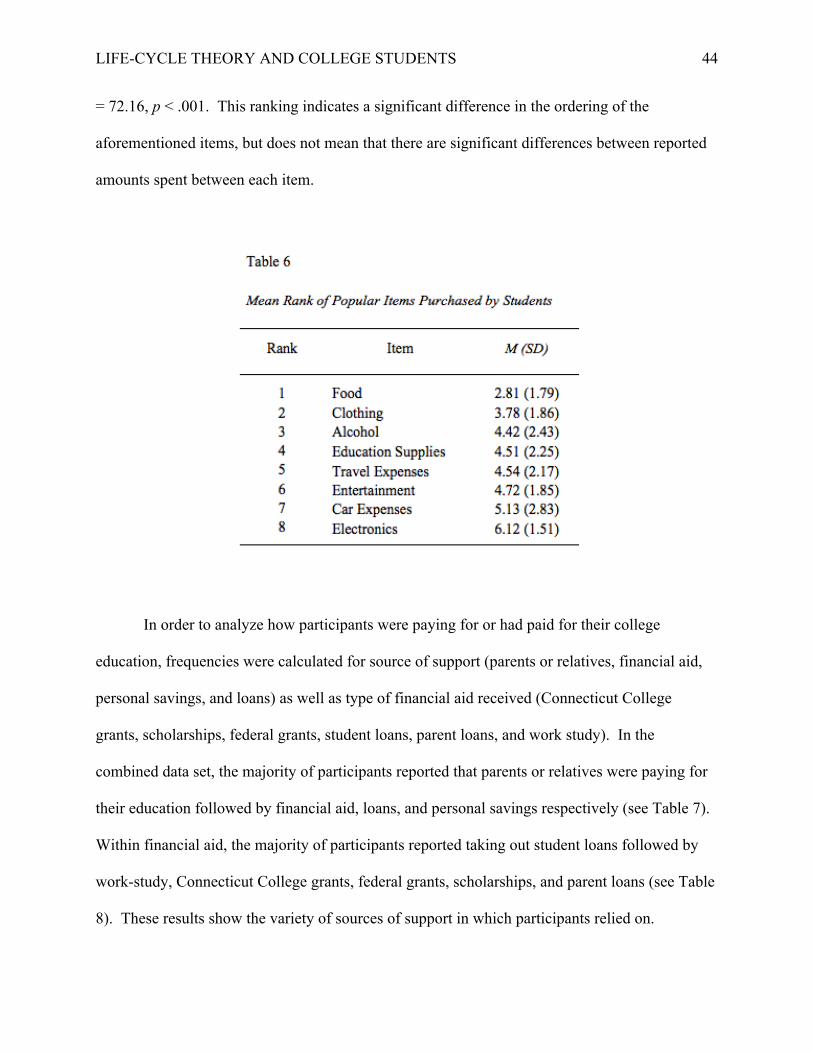
LIFE-CYCLE THEORY AND COLLEGE STUDENTS 44
= 72.16, p < .001. This ranking indicates a significant difference in the ordering of the
aforementioned items, but does not mean that there are significant differences between reported
amounts spent between each item.
In order to analyze how participants were paying for or had paid for their college
education, frequencies were calculated for source of support (parents or relatives, financial aid,
personal savings, and loans) as well as type of financial aid received (Connecticut College
grants, scholarships, federal grants, student loans, parent loans, and work study). In the
combined data set, the majority of participants reported that parents or relatives were paying for
their education followed by financial aid, loans, and personal savings respectively (see Table 7).
Within financial aid, the majority of participants reported taking out student loans followed by
work-study, Connecticut College grants, federal grants, scholarships, and parent loans (see Table
8). These results show the variety of sources of support in which participants relied on.
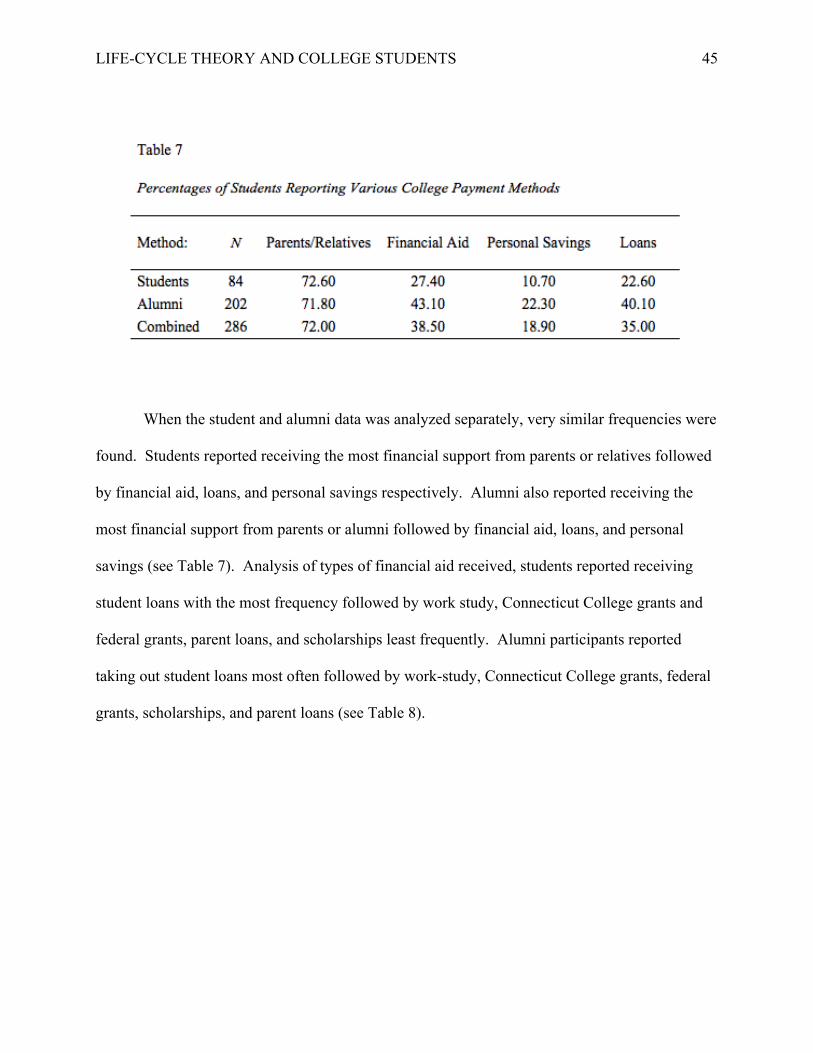
LIFE-CYCLE THEORY AND COLLEGE STUDENTS 45
When the student and alumni data was analyzed separately, very similar frequencies were
found. Students reported receiving the most financial support from parents or relatives followed
by financial aid, loans, and personal savings respectively. Alumni also reported receiving the
most financial support from parents or alumni followed by financial aid, loans, and personal
savings (see Table 7). Analysis of types of financial aid received, students reported receiving
student loans with the most frequency followed by work study, Connecticut College grants and
federal grants, parent loans, and scholarships least frequently. Alumni participants reported
taking out student loans most often followed by work-study, Connecticut College grants, federal
grants, scholarships, and parent loans (see Table 8).

LIFE-CYCLE THEORY AND COLLEGE STUDENTS 46
In order to measure dependency on parents, students were asked whether they earned an
allowance and about their credit card payments. Of the student participants, 23.8% reported
receiving an allowance, reporting a range of $50 to $1000 (see Table 9). Every participant in the
study was required to have access to a credit card, but it was not assumed that participants paid
credit card bills with their own savings. Analysis of who was responsible for paying credit card
bills found that 60% of student participants reported that a parent or relative paid their credit card
bills while only 38.5% reported beings solely responsible. Alumni were asked if they still
received financial help from their parents in order to determine alumni financial dependence or
independence. In addition, 27.6% of alumni participants who were between one and four years
out from graduation reported that their parents still supported them financially.

LIFE-CYCLE THEORY AND COLLEGE STUDENTS 47
Participants were also asked about the number of credit cards and debit cards they held.
Frequencies were calculated for the overall data set as well as the student and alumni data sets
separately (see Table 10). The majority of participants in the combined data set reported having
one credit card and one debit card. This held true for the student and alumni participants when
analyzed separately as well. Alumni reported holding more credit cards than students, indicating
that they accumulated more credit cards in the years following graduation.

LIFE-CYCLE THEORY AND COLLEGE STUDENTS 48
In order to analyze budgeting habits of students and alumni, percentages were calculated.
The majority of alumni reported having and sticking to a budget, while students were split
between holding to a budget and not having one at all. Over ten percent of both students and
alumni reported having a budget, but not following it (see Table 11).
Discussion
Hypothesis 1 stating that college students will be overconfident in terms of predicting
future salaries was based in the literature and theory behind the life-cycle hypothesis. A key
component of the life-cycle model is the assumption that people are able to smooth their
consumption levels based on current and future earnings (Wilkinson, 2008). By measuring the
difference between salary expectations and the median actual salaries realized by people
currently in the workplace, it was possible to assess levels of overconfidence and the ability to
determine future rates of income in order to plan current consumption patterns. Although the
literature showed that students are generally good at predicting their future salaries, this study
hypothesized the opposite in part because of the current economic market and level of
uncertainty. As mentioned in the results, there was a significant difference in the level of

LIFE-CYCLE THEORY AND COLLEGE STUDENTS 49
predicting starting salary between students and alumni, with students predicting higher starting
salaries than alumni. However, the PayScale 2012-2013 starting salaries did not differ greatly
between students and alumni, indicating that actual earning levels were not that different.
Students tended to over predict their starting salary while alumni tended to recall under
predicted starting salaries. Although neither of these differences was statistically significant, the
results suggest a difference in how the student and alumni participant population view or viewed
their chances following graduation. The alumni included in this study graduated from
Connecticut College between 2009 and 2012. Alumni were entering the workforce at a time
when the economy was at its most unstable after the 2008 crisis and when unemployment was
the highest it has ever been. The instability of the market could explain why alumni tended to
under predict their salaries, but this finding could also be attributed to the hindsight bias16.
Alumni were asked to retrospectively report what they thought their starting salaries would be at
graduation in addition to their realized starting salaries. Recalling an expectation in hindsight
may have caused alumni respondents to remember expecting a lower amount due to their current
earning level.
Current students, in contrast, may be predicting a more positive atmosphere for job
potential after graduation. As the economy recovers and the stock market keeps seeing record
highs, people may be becoming more confident in terms of finding and holding on to a job and a
consistent salary. In terms of the life-cycle hypothesis, it is concerning that current students are
overestimating their starting salaries to such a degree. Without a realistic expectation of the job
market and what they may be making immediately following graduation, students may be stuck
16 Also referred to as the “I knew it all along” bias, the hindsight bias refers to the tendency to see past events as obvious. The hindsight bias can also refer to learning that causes one to recall an idea differently than they would have without the learned information (Wilkinson, 2008).

LIFE-CYCLE THEORY AND COLLEGE STUDENTS 50
with loans and bills that they are unable to pay. Although this result supports the hypothesis, it
contradicts previous research. McMahon and Wagner (1981) found that students were fairly
realistic of the job market and starting salaries, predicting salary levels close to realized starting
salaries. One explanation for student participants’ overestimation of starting salary is the
tendency to pursue graduate degrees prior instead of immediately entering the workforce,
therefore increasing salary potential.
Both students and alumni significantly overestimated their mid-career salaries in
comparison with the PayScale 2012-2013 report. PayScale’s methodology consists of surveying
a variety of companies and employers to get accurate starting and mid-career salaries for people
with bachelor’s degrees. Many students attending and graduating from liberal arts institutions
expect or plan to go on to attend graduate school in the future, whether for a masters, doctorate,
or professional degree. For some current students at Connecticut College, a job is not the first
thing they seek to do post-graduation. Many plan to go to grad school prior to starting their first
job, and therefore may be predicting an accurate starting salary, but one that is higher than what
PayScale surveys have found. In addition, the median mid-career salaries reported by PayScale
are for those who have attained bachelor’s degrees only. McMahon and Wagner (1981) found
that students planning on attaining a professional degree expected significantly greater salaries
than students who were not planning on continuing their education. This limitation to bachelor’s
degrees is a caveat for the data found in this study because we are comparing mid-career salary
predictions from students and alumni, many of whom plan to receive a higher degree.
In addition, the student and alumni data used to measure predicted starting salary were
gathered using slightly different questions. While students were asked to predict their starting
salary at graduation, alumni were asked two questions: (1) to recall what they had predicted their

LIFE-CYCLE THEORY AND COLLEGE STUDENTS 51
starting salary to be at the time of graduation and (2) what their actual starting salary was. All
three of these measures were slightly problematic. First, many current students who completed
the survey were underclassmen and did not know what they wanted to major in or what they
wanted their career to be, and, as a result, left this survey question blank. Secondly, alum’s
recollections may have been influenced or anchored by the other questions regarding salary and
their current salary. In order to improve this measure, a longitudinally designed study would
have to determine predicted salary while the participants were still in college, and then follow up
years later.
Hypothesis 2 looked at how people typically made purchases. As described through the
review of the literature, spending with credit and debit cards has become more common. Vyse
(2008) noted that although credit has benefitted many people and allowed them to afford things
that otherwise they could not, credit has also created more problems: “When you can have
anything, not going into debt requires greater self-control than when transactions required cash”
(p. 94). This possibility is concerning because people feel less of a connection with money when
they are swiping a plastic card than when they are paying with tangible money. The easy
accessibility of credit and debit as well as the detachment from the amount of money spent can
result in overspending (Blue, Stackhouse, & Hunt, 2011). Although this study predicted that
participants would report using credit or debit more frequently than cash, this was not the case.
This result may be the byproduct of asking about the frequency of use rather than the percent of
total expenditures. Students may be involved in cash transactions most frequently, saving credit
or debit for larger or more important purchases.
In the overall participant data as well as in the separate student and alumni data, cash was
used most frequently while checks were used least frequently. The difference between the

LIFE-CYCLE THEORY AND COLLEGE STUDENTS 52
ranking of cash, debit, and credit was not significant when compared directly, so it can be
concluded that that rarity in which participants use checks as a method of payment caused the
significant difference. Checkbooks have become less common as debit cards have increased in
popularity among college students who prefer using electronic methods of payment (Cude et al.,
2006). The overall ranking showed that using credit and debit may be a popular option for both
students and alumni, but cash is still the most popular method of payment. The preference for
cash over credit or debit bodes well for students currently attending and recent graduates of
Connecticut College, because if cash is truly a more popular method of payment than credit or
debit, then the population is more likely to be aware of the amount they are spending.
Hypothesis 2 was not supported: participants did not report using debit or credit with
significantly more frequency than they did cash. Furthermore, cash was the most popular
method of payment for the sample of Connecticut College students and alumni, a surprising
result considering the increased salience of credit cards in the college environment (Vyse, 2008).
Hypothesis 3 stated that participants low in financial confidence would be more
irresponsible with their credit cards than those with high financial confidence. This hypothesis
was strongly supported across the combined, student, and alumni data. Correlations of the three
measures included in the survey found significant relationships across the samples in the overall
participant data and the data separated into student and alumni participants. The positive
correlation between the Credit Card Use Scale and the Student Financial Well Being scale
indicated that when participants are less responsible in terms of credit card use, they are also
uneasy when it in terms of their finances. Norvilitis et al. (2006) used the CCUS and the SFWB
scale in their study, but these measures were used for different regression analyses and not
correlated with one another directly. However, Norvilitis et al. (2006) did find that the CCUS

LIFE-CYCLE THEORY AND COLLEGE STUDENTS 53
was predictive of future debt while the SFWB scale predicted the effects of debt. The positive
relationship between the CCUS and the SFWB could be driven in both directions; people who
are not comfortable financially may rely on credit cards to help make purchases to a subjectively
irresponsible level and people who use credit cards irresponsibly could become financially
uneasy due increased monthly bills or interest levels. The direction of causality could differ
between the student and alumni population. Current students may relate more to the latter,
spending without thinking using credit cards and resulting in financial uneasiness, whereas
alumni might find themselves struggling to afford life after college and begin to rely on credit
cards to accommodate for a lack of liquidity and allow for a better standard of living.
In addition to the two scales referenced in the general hypothesis, the Student Attitudes
Toward Debt scale was also included in the analyses. The positive relationship between the
CCUS and SATD scale is a common sense result; participants who were irresponsible with their
credit cards reported being more tolerant of debt. This result is logical because if people use
their credit cards frequently, they will tend to be more psychologically comfortable with using
debt as a means to make purchases regardless of how this behavior affects their financial well-
being. There was also a positive relationship between the SATD and the SFWB. This
relationship showed that when participants reported a higher tolerance toward debt, they were
also financially uneasy. Norvilitis et al. (2006) looked at attitudes toward debt, finding that the
majority of participants could not correctly estimate their debt levels in comparison to their
peers: “Of those students with debt, 73% believed that it would take them less time than the
average student to get out of debt...[and] only 6% thought it would take them longer than the
average student to get out of debt” (p.1405). However, Norvilitis et al. (2006) did not put credit
card use and financial well-being directly in the context of attitudes toward debt. Nevertheless,

LIFE-CYCLE THEORY AND COLLEGE STUDENTS 54
the significant correlations in the present study are consistent with the previous findings because
having a higher tolerance toward debt likely means that one has higher credit card bills, which
will in turn make the future more uncertain.
These relationships strengthen findings from the previous literature, as they are hinted at
across many psychological and economic journals, but they are also a reminder that educating
people about fiscal responsibility, especially college students, is important. Understanding that
college students experience financial uneasiness and have access to and use credit cards is
critical both to college administrators and policy makers. Creating a campus tolerant of credit
cards may be unwise because it may increase risky credit card behavior among students. King
(1997) commented on the trend of increasing credit card debt: “Given the very high interest rates
on most credit cards, this is a disturbing trend that could have more serious implications for
graduates’ financial well-being than student loan debt” (p. 4). It is also important to note that
financial uneasiness and tolerance toward debt can stem from the need to take out loans, either
college or federal, to pay for higher education. When students know that they will have a large
amount of debt at graduation and that they will be responsible for making monthly loan
payments with interest, they may report higher levels of financial uneasiness. Loan aversion
may also contribute to financial uneasiness, stemming from paying off student loan debt
(Burdman, 2005). Providing support and education about managing finances and bills during
and after college could reduce the amount of financial stress experienced.
The life-cycle model was further examined in analysis of Hypothesis 4 looking at the
relationship between predicted future salaries, confidence in these predictions, and tolerance
toward debt. Although Hypothesis 4 was not strongly supported with the correlations, there were
a few noteworthy aspects within the analyses. Analysis of the overall data showed a significant

LIFE-CYCLE THEORY AND COLLEGE STUDENTS 55
negative relationship between how participants scored on the Student Attitudes Toward Debt
scale and expected starting salary. This finding means that as the level of salary expected
increased, participants were less tolerant of debt. This relationship violates the life cycle
hypothesis, which assumes that people will be more tolerant of debt in the present if they expect
higher returns in the future. When the data was analyzed for students and alumni separately,
different significant relationships were found. For the students there was a significant positive
correlation between expected starting salary and confidence, meaning that students who
predicted higher starting salaries were also more confident about their predictions. This
relationship between confidence and salary prediction hints at an overconfidence bias on behalf
of the student participants, but there are also alternate explanations for this higher confidence.
Perhaps the students who were more confident knew the starting salary of someone in the field
they were planning to enter or had received job offers already. In comparison to jobs outsides of
the financial sector, jobs in finance, economics, and marketing tend to have higher starting
salaries and hiring practices that are fairly transparent, which could lead to greater confidence in
students planning to enter these fields. There were no significant correlations between predicted
salary and confidence among the alumni participant data.
The extensive nature of the demographic section of the survey permitted a number of
additional analyses. Student loan debt levels have increased by a large margin over the past
decade (Appendix J). With the burden of paying back student loans being an increased addition
to the challenge of being financially independent post college, the level of debt at graduation
may be a factor in feelings of financial stability. To determine the relationship between financial
well-being and student loan debt, the Student Financial Well Being scale was correlated with
debt at graduation and the current student loan debt reported by alumni. The SFWB scale was

LIFE-CYCLE THEORY AND COLLEGE STUDENTS 56
significantly positively correlated with amount of debt at graduation for the overall data set as
well as the student and alumni data. This relationship indicated that increased levels of debt
owed at the time of graduation were directly related to increased levels of financial uneasiness.
Although causality cannot be assumed, as this is a correlational relationship, it is important to
note that these two variables are related to each other. The direction of causality is most likely to
go from the amount of debt to levels of financial well-being. Reported feelings of well-being are
related to both credit card use and student loan debt.
As a matter of interest, a rank order of items on which students most frequently spend
money was determined. This question was asked only in the student demographic survey and
consisted of eight items. Students reported spending the most money on food followed by
clothes, alcohol, education supplies, travel expenses, entertainment, car expenses, and
electronics. Although there was no expectation or hypothesis posed about this question, the
ordering creates a fairly typical picture of a college student. This result also shows that college
students do spend money on items other than those required for a college education. Boddington
and Kemp (1999) found that college students became increasingly tolerant of debt over four
years of college. Debt tolerance was positively correlated to cores on the impulse buying scale
(Boddington & Kemp, 1999). Although no direct connection can be drawn to the present study,
the relationship between high debt tolerance and impulsive spending indicates a consumption
pattern outside of educational spending. This element of consumption, potentially without
income, is predicted by the deficit spending section of the life cycle model. Part of the deficit
certainly comes from spending on college tuition, but there is also spending on every day items.
College tuition prices for private non-profit four-year colleges have increased by 60% in
the last ten years (see Figure 6). Hacker and Dreifus (2011) compare this increase to the

LIFE-CYCLE THEORY AND COLLEGE STUDENTS 57
subprime mortgage crisis of 2008: “The next subprime crisis will come from defaults on student
debts, starting with for-profit colleges and rising to the Ivy League.” In one bubble the value
was housing prices and in the other the value is future salary level (Hacker & Dreifus, 2011).
The data regarding the various payment methods used to pay tuition, specifically the types of
financial aid received, was analyzed to determine the effect of increased costs. Participants were
asked to indicate how they were paying for college, and many participants reported a
combination of payment methods. Over 70% of alumni and students reported that parents or
relatives are helped to pay for their college education. Having the financial means to provide
this assistance takes some of the burden off the student in terms of future loan debt, but typically
shifts this burden to parents or relatives instead. More alumni reported using personal savings,
taking out loans, or relying on financial aid to pay for college than did current students,
suggesting that their future financial burden may be greater than what will be the experience by
the current students in this study. The finding that fewer current students report receiving
financial aid may be due to sampling bias as the Connecticut College financial aid office does
not report offering less financial aid to current students. However, the result could also indicate
in a change in the culture of paying for education, with more current students relying on their
parents than did alumni who graduated in the past four years.

LIFE-CYCLE THEORY AND COLLEGE STUDENTS 58
Figure 6. Data gathered from The College Board shows substantial increases in tuition have occurred in both private nonprofit four-year colleges and public four-year colleges. Currently the growth rate of tuition is greater than the inflation rate (Clark, 2012).
Connecticut College is committed to providing grants instead of loans, allocating 85% of
all financial aid awarded to grants, which students and their families do not have to pay back
(Connecticut College, 2012). Both students and alumni reported receiving grants as a major
form of financial aid from the college; 28.7% of participants reported receiving Connecticut
College grants including 16.7% of the student participants and 33.7% of the alumni participants.
Once again, the financial aid office does not report any difference in grant funding from 2009-
2016. A larger percentage of alumni than current students reported receiving financial aid
across the board for Connecticut College grants, scholarships, federal grants, student loans, and
eligibility for work-study, but just over 10% of both students and alumni reported relying on
parent loans. This pattern suggests a limitation in the sampling for this study, as well as a
potential selection bias for alumni due to the differences in reported types of financial aid

LIFE-CYCLE THEORY AND COLLEGE STUDENTS 59
received. Connecticut College is a need-based17 not a need-blind18 school, and although these
two practices are not mutually exclusive, it could have consequences in terms of the
demographic accepted to the college (Connecticut College, 2012). The shift in reported financial
aid may be due to a sampling error, but could also be attributed to changes in admissions
policies.
The transition to dependency on parents whether it was a factor of the sample or a true
difference between populations, was further analyzed by looking at whether students earned an
allowance, who was responsible for paying the credit card bill, and whether alumni still were
financial reliant on their parents. Over 20% of current students received a monthly allowance
from their parents. This calculation excluded those who said that they had unlimited access to
their parent’s money. In addition, 60% of students reported that their parents paid their credit
card bill. Norvilitis & MacLean (2010) found that when parents were willing to bail out their
children, responsible credit card use increased: “Parental bailout had a negative direct effect on
problematic credit card use...[and] students who report that their parents would be willing to bail
them out financially reported lower levels of debt” (p. 62). Current Connecticut College students
rely heavily on their parents for spending money, with many not having to figure out how to
spend and save on their own. In addition, just fewer than 30% of alumni participants reported
that they still relied on their parent’s assistance for financial support. This result shows that up to
four years out of graduation, many Connecticut College students are still not financially
independent. There are many reasons for continued dependency, but it is also important that the
17 Eligibility based on need defined as “the amount remaining after subtracting the expected family contribution and outside resources from the cost of education” (Connecticut College, 2012). 18 Need-blind refers to the practice of making admissions decisions without prior consideration of the financial aid needs of a student (Connecticut College, 2012).

LIFE-CYCLE THEORY AND COLLEGE STUDENTS 60
college provide enough financial education and resources that students do not have to rely on
their parents post-graduation.
Participants were asked to self-report the number of credit and debit cards that they
possessed. As expected, the majority of participants only had one credit card and one debit card.
However, alumni reported having up to five credit cards and four debit cards and students
reported having up to three credit cards and three debit cards. Palmer, Pinto, and Parente (2001)
attributed the tendency to have multiple cards to the success of credit card companies in the
college market: “Credit card marketing at the college level is one of first-mover advantage, and
banks’ primary goal is to be the first to put an application in the hands of a student” (p. 111).
Questions were not asked about the frequency of use of the cards, and it remains unknown
whether these cards are store cards or general use cards from different banks. This result is
concerning because, as stated by Majid (2010), “many consumers, even those who can accurately
anticipate their future borrowing, do not truly understand how quickly their debt can grow as a
result of compounding interest” (p. 172). Finally, both student and alumni participants were
asked about their budgeting habits. Specifically, they were asked whether they had a budget, did
not have a budget, or had a budget but did not follow it. The third option was included because
although people often intend to do something they may not follow through. More alumni had
and followed a budget than did students and the two groups reported similar percentages of
participants defecting on the planned budget.
This study looked at the saving and spending behavior of college students in relation to
the life-cycle model (Wilkinson, 2008). Analysis of the data found that students and alumni
spend both in terms of student loans and credit cards. From the data, it is apparent that a large
proportion of the population surveyed was in the left hand section of the life-cycle model (see

LIFE-CYCLE THEORY AND COLLEGE STUDENTS 61
Figure 1). According to the economic model, this outcome means that it is permissible and even
encouraged for people to engage in deficit spending as long as they are accurately calculating
their future earnings. However, results of the first hypothesis determined that both students and
alumni were not proficient at correctly estimating either their starting or mid-career salary. In
addition, expected mid-career salaries were so much greater than the PayScale 2012-2013 report
that if participants were basing their current spending on those expectations, they would be in
financial difficulty if they did not achieve the predicted salary level.
The life-cycle hypothesis does not take into account the difficulties people have with
mental accounting and continuously adjusting their behavior. The theory may make sense
theoretically and provides a good model off of which to base financial behavior, but because
people are not always economically rational actors, it is not upheld in every day life. This study
found that students do not necessarily consider current debt acceptable, even when they are
expecting higher salaries in the future. Increased debt levels, especially when related to student
loans, hang over the heads of current students as well as recent graduates, and are likely not
going to be paid off quickly. The reliance of recent alumni on their parents for financial
assistance even after graduating from college and starting their own life may lead to increased
risk for low credit scores, difficulty obtaining mortgages, and long-term financial insecurity.
Kidwell, and Turrisi (2004) elaborated on these concerns: “High levels of debt have been related
to a variety of negative consequences, such as damaged credit ratings, stress-induced health
problems, and decreased academic performance (p. 1244). If this financial dependence is due to
the struggle to pay off accumulated debt, then the students and alumni are not abiding by the life-
cycle hypothesis because they are spending to a point of indebtedness from which they cannot
recover.

LIFE-CYCLE THEORY AND COLLEGE STUDENTS 62
Liberal arts colleges like Connecticut College may be able to prevent future financial
difficulties for its alumni by making an effort to engage students in conversations regarding
financial well-being. Important tasks for current students to be able to do by graduation includes
the ability to balance a checkbook, work a budget, file their taxes, and understand credit card
statements and interest. These may seem like basic skills, but if education systems fail to focus
on these skills, students may not have the opportunity to learn them. Connecticut College’s
financial aid office has made great strides in focusing on offering grants to students who need
help affording a Connecticut College education. The college itself does not have the same issues
regarding stop out and failure to graduate that the larger, public universities discussed in the
literature do. In terms of credit card use, Connecticut College has partnered with a local bank to
provide a no fees credit card for students. Representatives of this bank come on to campus every
fall to sign students up for checking and savings accounts, but there is no additional financial
education or support for those who do sign up. By offering opportunities to learn about spending
and saving habits, colleges like Connecticut College could substantially improve their students’
well being – especially in the future.
Although this study provided insight into the financial behavior of participants, there are
a number of limitations and improvements that could be made in future studies. Because the
survey was only administered to current Connecticut College students and recent alumni, the
population was limited and not very diverse. The demographics of the participants were skewed
heavily toward white women, and although that is the tendency of the Connecticut College
student body and American colleges nationwide, the study was not representative. There was
potential for response bias in both the alumni and student participants, if those who took the
survey may have had an initial interest in the subject. Economics and psychology were the most

LIFE-CYCLE THEORY AND COLLEGE STUDENTS 63
heavily represented majors among the alumni data, indicating that the information provided in
the email solicitation and the title of the study may have attracted certain types of participants.
The survey was created and completed on Survey Monkey, making it easy to distribute
they questionnaires and collect responses. Some participants were excluded from the study
immediately because they did not agree to the informed consent or they did not report having a
credit card. Additional participants reported having difficulty with the technology on questions
that asked about ranking or frequency of use due to unfamiliarity with the software. In the
demographic section, participants were not asked to report their age, which limited analyses that
could be done, however, life experience could be determined through class year. Questions
regarding the banks participants used were viewed as inappropriate by some participants and
ended up not being necessary for analysis.
This study merely begins to explore what there is to learn about student knowledge of
and behavior around student loan and credit card debt. Future research could gather a more
extensive amount of data about students and alumni and run regression analyses in order to
attempt to find what factors may predict whether someone is at risk of getting into severe debt.
In addition, it would be helpful to hold focus groups to get a sense of current students’ financial
concerns. These focus groups would help to determine causal chains in financial distress as well
as help to determine where further financial education is necessary. Finally, a longitudinal study
of student loan debt, credit card debt, consumption, income, and financial knowledge would
provide more insight into whether people abide by the life-cycle hypothesis and whether learning
through experience is possible.

LIFE-CYCLE THEORY AND COLLEGE STUDENTS 64
References
Baum, S. & O’Malley, M. (2003). College on credit: How borrowers perceive their education
debt. NASFAA Journal of Student Financial Aid, 33(3), 7-19.
Bertaut, C. C., Haliassos, M., & Reiter, M. (2008). Credit card debt puzzles and debt revolvers
for self control. Review of Finance, 13, 657-692. doi:10.1093/rof/rfn033
Blue, R. (2011). Charging into sin? What’s wrong with credit card debt? Christianity Today, 64-
65.
Boddington, L. & Kemp, S. (1999). Student debt, attitudes towards debt, impulsive buying, and
financial management. New Zealand Journal of Psychology, 28(2), 89-93.
Burdman, P. (2005). The student debt dilemma: Debt aversion as a barrier to college access.
Center for Studies in Higher Education, UC Berkeley, 1-27.
Connecticut College (2012). Tuition and fees. Connecticut College Admissions,
<http://www.conncoll.edu/admission/tuition-and-fees.htm>.
Cebula, R. J. & Lopes, J. (1982). Determinants of student choice of undergraduate major field.
American Educational Research Journal, 19, 303-312. doi:10.2307/1162572
Chambers, W., Gibson, L. W., Lounsbury, J. W., Owens, K. S., & Tatum, H. E. (1999). An
investigation of career decidedness in relation to “big five” personality constructs and life
satisfaction. College Student Journal, 33(4), 646.
Chan, S. G., Chau, A. W., & Chan, K. Y. (2012). Financial knowledge and aptitudes: Impacts
on college students’ financial well being. College Student Journal, 46(1), 114-124.
Clark, K. (2012). Tuition at public colleges rises 4.8%. CNN Money.
<http://money.cnn.com/2012/10/24/pf/college/public-college-tuition/index.html>.
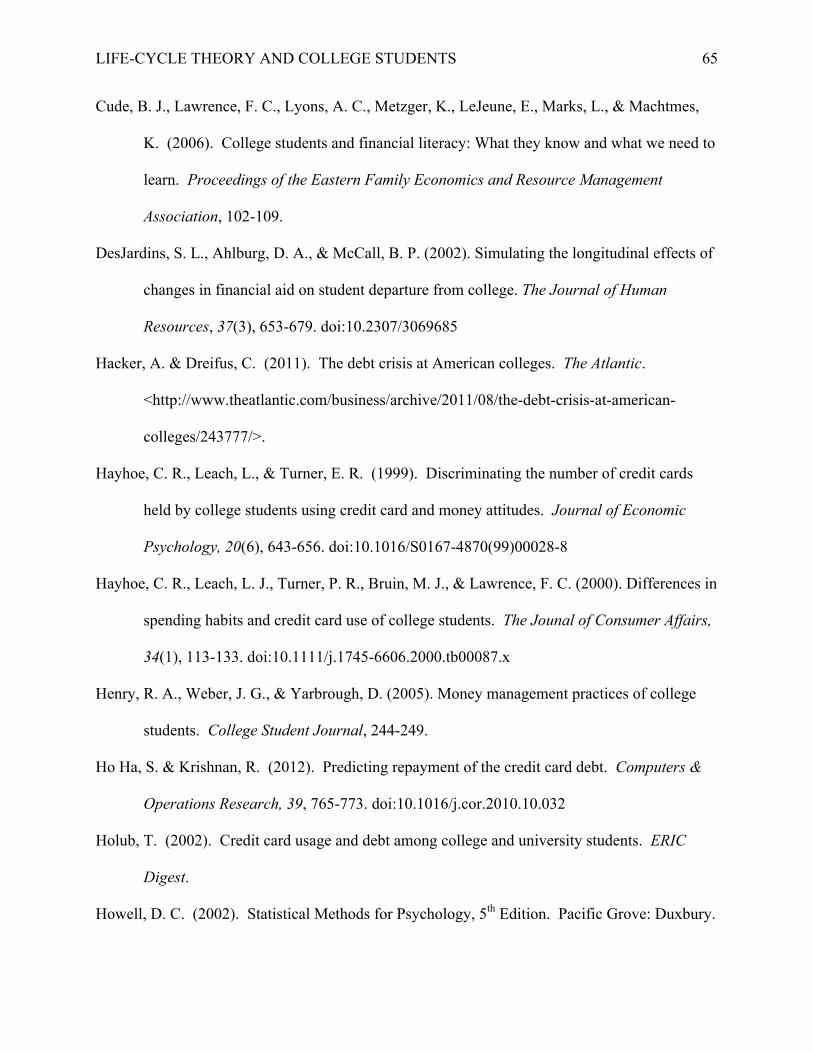
LIFE-CYCLE THEORY AND COLLEGE STUDENTS 65
Cude, B. J., Lawrence, F. C., Lyons, A. C., Metzger, K., LeJeune, E., Marks, L., & Machtmes,
K. (2006). College students and financial literacy: What they know and what we need to
learn. Proceedings of the Eastern Family Economics and Resource Management
Association, 102-109.
DesJardins, S. L., Ahlburg, D. A., & McCall, B. P. (2002). Simulating the longitudinal effects of
changes in financial aid on student departure from college. The Journal of Human
Resources, 37(3), 653-679. doi:10.2307/3069685
Hacker, A. & Dreifus, C. (2011). The debt crisis at American colleges. The Atlantic.
<http://www.theatlantic.com/business/archive/2011/08/the-debt-crisis-at-american-
colleges/243777/>.
Hayhoe, C. R., Leach, L., & Turner, E. R. (1999). Discriminating the number of credit cards
held by college students using credit card and money attitudes. Journal of Economic
Psychology, 20(6), 643-656. doi:10.1016/S0167-4870(99)00028-8
Hayhoe, C. R., Leach, L. J., Turner, P. R., Bruin, M. J., & Lawrence, F. C. (2000). Differences in
spending habits and credit card use of college students. The Jounal of Consumer Affairs,
34(1), 113-133. doi:10.1111/j.1745-6606.2000.tb00087.x
Henry, R. A., Weber, J. G., & Yarbrough, D. (2005). Money management practices of college
students. College Student Journal, 244-249.
Ho Ha, S. & Krishnan, R. (2012). Predicting repayment of the credit card debt. Computers &
Operations Research, 39, 765-773. doi:10.1016/j.cor.2010.10.032
Holub, T. (2002). Credit card usage and debt among college and university students. ERIC
Digest.
Howell, D. C. (2002). Statistical Methods for Psychology, 5th Edition. Pacific Grove: Duxbury.

LIFE-CYCLE THEORY AND COLLEGE STUDENTS 66
Hunt, M. (2011). Charging into sin? What’s wrong with credit card debt? Christianity Today,
64-65.
Indiviglio, D. (2011). Chart of the day: Student loans have grown 511% since 1999. The
Atlantic. <http://www.theatlantic.com/business/archive/2011/08/chart-of-the-day-student-
loans-have-grown-511-since-1999/243821/>.
Kidwell, B., Brinberg, D., & Turrisi, R. (2003). Determinants of money management behavior.
Journal of Applied Social Psychology, 33(6), 1244-1260. doi:10.1016/S0167-
4870(03)00073-4
Kidwell, B. & Turrisi, R. (2004). An examination of college student money management
tendencies. Journal of Economic Psychology, 25, 601-616. doi:10.1016/S0167-
4870(03)00073-4
King, J. E. (1997). Student borrowing: Is there a crisis? Student Loan Debt: Problems &
Prospects: Proceedings from a National Symposium. Washington, D. C.
Lea, S. E. G., Webley, R., & Walker, C. (1995). Psychological factors in consumer debt:
Money management, economic socialization, and credit use. Journal of Economic
Psychology, 16(4), 681-701. doi:10.1016/0167-4870(95)00013-4
Leclerc, K. (2012). Influential factors contributing to college student spending habits and credit
card debt. Perspectives (University of New Hampshire), 149-156.
Majid, F. (2010). The irrationality of credit card debt: Examining the subconscious biases of
credit card users. Law and Psychology Review, 34(1), 165-176.
McMahon, W. W. & Wagner, A. P. (1981). Expected returns to investment in higher education.
The Journal of Human Resources, 16(2), 274-285. doi:10.2307/145512

LIFE-CYCLE THEORY AND COLLEGE STUDENTS 67
Moore, M. & Carpenter, J. M. (2009). The impact of college student money attitudes on credit
responsibility. College Student Journal, 43, 1116-1124.
Nellie Mae. (2002). Undergraduate students and credit cards: An analysis of usage rates and
trends. Report.
Norvilitis, J. M. & MacLean, M. G. (2010). The role of parents in college students’ financial
behaviors and attitudes. Journal of Economic Psychology, 31, 55-63.
doi:10.1016/j.joep.2009.10.003
Norvilitis, J. M., Merwin, M. M., Osberg, T. M., Roehling, P. V., Young, P., & Kamas, M. M.
(2006). Personality factors, money attributes, financial knowledge, and credit-card debt in
college students. Journal of Applied Social Psychology, 36, 1395-1413.
Norvilitis, J. M., Szablicki, P. B., & Wilson, S. D. (2003). Factors influencing levels of credit-
card debt in college students. Journal of Applied Social Psychology, 33, 935-947.
doi:10.1111/j.1559-1816.2003.tb01932.x
Palmer, T. S., Pinto, M. B., & Parente, D. H. (2001). College students’ credit card debt and the
role of parental involvement: Implications for public policy. Journal of Public Policy &
Marketing, 20(1), 105-113. doi10.2307/30000649
Payscale (2012). Best undergrad college degrees by salary. 2011-2012 PayScale College Salary
Report. <http://www.payscale.com/best-colleges/degrees.asp>.
Robb, C. A. & Sharpe, D. L. (2009). Effect of personal financial knowledge on college
students’ credit card behavior. Journal of Financial Counseling and Planning, 20(1), 25-
43.

LIFE-CYCLE THEORY AND COLLEGE STUDENTS 68
Roberts, J. A. & Jones, E. (2001). Money attitudes, credit card use, and compulsive buying
among American College Students. Journal of Consumer Affairs, 35(21), 213-240.
doi:10.1111/j.1745-6606.2001.tb00111.x
Rothstein, J. & Rouse, C. E. (2011). Constrained after college: Student loans and early-career
occupational choices. Journal of Public Economics, 95, 149-163.
doi:10.1016/j.jpubeco.2010.09.015
Smith, H. L. & Powell, B. (1990). Great expectations: Variations in income expectations among
college seniors. Sociology of Education, 63(3), 194-207. doi:10.2307/2112837
Soman, D. & Cheema, A. (2002). The effect of credit on spending decisions: The role of the
credit limit and credibility. Marketing Science, 21(1), 32-53.
doi:10.1287/mksc.21.1.32.155
Stackhouse Jr., J. G. (2011). Charging into sin? What’s wrong with credit card debt?
Christianity Today, 64-65.
Telyukova, I. A. & Wright, R. (2008). A model of money and credit, with application to the
credit card debt puzzle. The Review of Economic Studies, 75(2), 629-647.
doi:10.2307/20185046
Thaler, R. H. & Sunstein, C. R. (2008). Nudge: Improving decisions about health, wealth, and
happiness. Penguin Books: New York.
Thomas, S. L. (2000). Deferred costs and economic returns to college major, quality, and
performance. Research in Higher Education, 42(3), 261-313. doi: 10.2307/40196394
Vyse, S. (2008). Going broke: Why Americans can’t hold on to their money. Oxford University
Press: New York.

LIFE-CYCLE THEORY AND COLLEGE STUDENTS 69
Warneryd, K. E. (1999). The psychology of saving: A study on economic psychology,
Cheltenham, UK and Northampton, MA: Edward Elgar Publishing.
Webbink, D. & Hartog, J. (2004). Can students predict starting salaries? Yes! Economics of
Education Review, 23, 103-113. doi:10.1016/S0272-7757(03)00080-3
Wilkinson, N. (2008). An introduction to behavioral economics. Palgrave MacMillian: New
York.

LIFE-CYCLE THEORY AND COLLEGE STUDENTS 70
Appendix A
2012-2013 PayScale Salary Report by College Major
RANK MAJOR STARTING SALARY ($)
MID-CAREER SALARY ($)
1 Petroleum Engineering 98,000 163,000 2 Aerospace Engineering 62,500 118,000 3 Actuarial Mathematics 56,100 112,000 4 Chemical Engineering 67,500 111,000 5 Nuclear Engineering 66,800 107,000 6 Electrical Engineering 63,400 106,000 7 Computer Engineering 62,700 105,000 8 Applied Mathematics 50,800 102,000 9 Computer Science 58,400 100,000 10 Statistics 49,300 99,500 11 Physics 51,200 99,100 12 Mechanical Engineering 60,100 98,400 13 Biomedical Engineering 54,900 98,200 14 Government 42,000 95,600 15 Economics 48,500 94,900 16 International Relations 40,600 93,000 17 Materials Science & Engineering 60,100 91,900 18 Industrial Engineering 59,900 91,200 19 Software Engineering 59,100 90,700 20 Environmental Engineering 47,900 89,700 21 Geology 45,000 89,400 22 Civil Engineering 53,800 88,800 23 Management Information Systems 51,600 88,600 24 Biochemistry 43,200 88,500 25 Chemistry 44,700 87,500 26 Electrical Engineering Technology 58,400 86,900 27 Information Systems 50,900 86,700 28 Construction Management 49,500 86,100 29 Mathematics 48,500 85,800 30 Finance 47,700 85,400

LIFE-CYCLE THEORY AND COLLEGE STUDENTS 71
31 Molecular Biology 40,100 84,900 32 Computer Information Systems 49,000 84,800
33 Mechanical Engineering Technology 52,900 83,400
34 Biotechnology 41,400 82,800 35 Information Technology 48,900 81,700 36 Industrial Technology 49,700 81,300 37 Food Science 44,000 81,100 38 Civil Engineering Technology 49,500 80,500 39 Industrial Design 43,600 80,300 40 Urban Planning 39,000 79,900 41 Advertising 37,800 77,100 42 Film Production 37,500 76,700 42 Supply Chain Management 50,500 76,700 44 Marketing Management 40,700 76,600 44 Telecommunications 41,600 76,600 44 International Business 42,500 76,600 47 Global & International Studies 40,200 76,500 48 Microbiology 39,700 76,200 49 Occupational Health and Safety 49,600 76,000 50 Classics 35,300 75,900 51 Architecture 41,900 75,200 52 Linguistics 38,300 74,900 53 Political Science 40,300 74,700 54 Accounting 44,300 74,500 55 Marketing and Communications 39,100 73,900 56 Environmental Science 39,800 73,600 57 American Studies 40,900 72,800 58 Philosophy 38,300 72,600 59 Biology 39,100 72,200 60 Literature 39,200 72,000 61 History 39,000 70,200 61 Nursing 54,100 70,200 63 Business 41,400 70,000 64 Zoology 36,500 69,700 65 Agriculture 38,000 69,300

LIFE-CYCLE THEORY AND COLLEGE STUDENTS 72
66 Health Sciences 39,000 68,700 67 German 41,400 68,500 68 Communications 38,900 68,400 69 Geography 39,800 67,400 70 Landscape Architecture 40,600 66,300 71 Spanish 35,900 65,900 72 Hotel Management 40,400 65,800 73 English 38,100 65,500 73 Forestry 42,000 65,500 75 French 39,500 65,100 76 Public Relations 36,500 65,000 77 Multimedia and Web Design 40,500 64,900 78 Journalism 36,800 64,700 79 Speech Communication 38,700 64,400 79 Radio and Television 35900 64,400 81 Fashion Design 36,300 63,900 82 Liberal Arts 35,300 62,500 83 Hospitality and Tourism 36,400 62,300 84 Anthropology 36,000 61,400 85 Human Resources 39,200 61,200 86 Medical Technology 49,600 60,200 86 Psychology 35,200 60,200 88 Humanities 35,600 60,100 89 Public Administartion 41,500 59,700 90 Drama 39,300 58,900 91 Visual Communication 36,700 58,700 92 Religious Studies 34,900 58,400 93 Organizational Management 40,700 58,400 94 Broadcasting 31,800 58,300 95 Fashion Merchandising 37,600 58,100 96 Nutrition 40,600 57,900 97 Health Care Administration 39,600 57,800 98 Sports Management 35,300 57,600 99 Interior Design 35,300 57,500 100 Art 34,400 56,700 100 Criminal Justice 35,200 56,700

LIFE-CYCLE THEORY AND COLLEGE STUDENTS 73
100 Sociology 36,000 56,700 103 Social Science 37,600 56,300 104 Kinesiology 34,100 56,000 105 Photography 35,700 55,600 105 Theater 33,200 55,600 107 Graphic Design 35,500 55,500 108 Recreation and Leisure Studies 34,900 55,300 109 Horticulture 36,800 55,100 110 Education 37,200 55,000 111 Exercise Science 31,300 54,400 112 Dietetics 44,100 54,300 113 Art History 36,400 54,000 114 Physical Education 33,400 53,900 115 Fine Arts 31,800 53,700 116 Animal Science 33,300 53,200 117 Paralegal/Law 36,500 52,100 118 Public Health 35,000 51,300 119 Music 34,600 51,100 120 Biblical Studies 32,500 51,000 120 Interdisciplinary Studies 37,500 51,000 122 Theology 32,400 50,700 123 Sports Medicine 35,700 50,300 124 Athletic Training 34,400 49,800 125 Culinary Arts 31,000 49,700 126 Special Education 33,900 48,900 127 Human Development 33,100 47,800 128 Elementary Education 31,400 46,000 129 SocialWork 33,100 45,300 130 Child and Family Studies 29,300 37,700

LIFE-CYCLE THEORY AND COLLEGE STUDENTS 74
Appendix B
Alumni Solicitation
To Whom It May Concern: As a senior Economics and Psychology major at Connecticut College, I am conducting an honors thesis is the Psychology department. My thesis focuses on credit card behavior and spending habits. I have attached the link to the survey. In return for completing the survey, you will be entered in a raffle to receive a $30 gift card. Thank you in advance for your time. Best, Kaitlin Karlson Connecticut College ‘13
LIFE-CYCLE THEORY AND COLLEGE STUDENTS 75
Appendix C
Informed Consent Document
I hereby consent to participate in Kaitlin Karlson’s research about college students’ and recent alumni’s budgeting decisions. I understand that this research will involve answering questions about my spending and saving habits. While I understand that the direct benefits of this research to society are not known, I have been told that I may learn more about where I choose to spend my money and how my budgeting decisions are influenced. I understand that this research will take about 30 minutes. I have been told that there are no known risks or discomforts related to participating in this research. I have been told that Kaitlin Karlson can be contacted by email at [email protected]. I understand that I may decline to answer any questions as I see fit, and that I may withdraw from the study without penalty at any time. I understand that all information will be identified with a code number and NOT my name. I have been advised that I may contact the researcher who will answer any questions that I may have about the purposes and procedures of this study. I understand that this study is not meant to gather information about specific individuals and that my responses will be combined with other participants’ data for the purpose of statistical analyses. I consent to publication of the study results as long as the identity of all participants is protected. I understand that this research has been approved by the Connecticut College Human Subjects Institutional Review Board (IRB). Concerns about any aspect of this study may be addressed to Professor Jason Nier, Chairperson of the Connecticut College IRB ([email protected]). I am at least 18 years of age, and I have read these explanations and assurances and voluntarily consent to participate in this research about students’ budgeting decisions. Name (printed) ___________________ Signature _______________________ Date _____________________

LIFE-CYCLE THEORY AND COLLEGE STUDENTS 76
Appendix D
Debriefing Statement First of all, thank you for participating in this exploratory study of college students’ and recent alumni’s ability to budget their own funds. With rising financial aid costs and increasing parental support, college students are becoming less aware of how uncontrolled spending can impact their futures. In this research, I am examining the data to see if there is a relationship between financial aid packages, attitudes toward credit cards, and and money management. The standard economic model assumes that humans are rational actors and can smooth their consumption, dependent on income, throughout their lives. However, previous research has shown that college students receive little education about money management practices and show little capability of estimating future expenditures and income. Because of this, college students find themselves with huge amounts of credit card debt before graduation. This has not been helped by the increase in marketing to college student by credit card companies. Please do not reveal the logistics of this study to your friends and classmates until the end of the semester. It is important for accurate statistical analyses for the details of the study to remain confidential. If you are interested in this topic and want to read the literature in this area, please contact Kaitlin Karlson at [email protected]. If you have any concerns about your spending habits or financial situation, contact Student Health Services at 860-439-2275 or the Financial Aid office at 860-439-2058. ). Concerns about any aspect of this study may be addressed to Professor Jason Nier, Chairperson of the Connecticut College IRB ([email protected]). Listed below are two sources you may want to consult to learn more about this topic: Henry, R. A., Weber, J. G., & Yarbrough, D. (2005). Money Management Practices of College
Students. College Student Journal, 244-249. Roberts, J. A. & Jones, E. (2001). Money Attitudes, Credit Card Use, and Compulsive Buying
among American College Students. Journal of Consumer Affairs, 35(21), 213-240.

LIFE-CYCLE THEORY AND COLLEGE STUDENTS 77
Appendix E
Credit Card Use Scale
General Instructions: Circle the number that indicates the extent to which you agree or disagree with each of the following statements about your views or perspectives in general. There is neither a right nor wrong answer to any question.
1. My credit cards are usually at their maximum credit limit. 1 2 3 4 5
2. I frequently use available credit on one credit card to make a payment on another credit card. 1 2 3 4 5
3. I always pay off my credit cards at the end of each month. 1 2 3 4 5 4. I worry about how I will pay off my credit card debt. 1 2 3 4 5 5. I often make only the minimum payment on my credit
card bills. 1 2 3 4 5
6. I am less concerned with the price of a product when I use a credit card. 1 2 3 4 5
7. I am more impulsive when I shop with credit cards. 1 2 3 4 5
8. I spend more when I use a credit card. 1 2 3 4 5
9. I am seldom delinquent in making payments on my credit card(s). 1 2 3 4 5
10. I rarely go over my available credit limit. 1 2 3 4 5
11. I seldom take cash advances on my credit card(s). 1 2 3 4 5
12. I have too many credit cards. 1 2 3 4 5
1 2 3 4 5 Strongly Disagree
Strongly Agree

LIFE-CYCLE THEORY AND COLLEGE STUDENTS 78
Appendix F
Student Financial Well-Being Scale
General Instructions: Circle the number that indicates the extent to which you agree or disagree with each of the following statements about your views or perspectives in general. There is neither a right nor wrong answer to any question.
1. I am uncomfortable with the amount of debt I am in. 1 2 3 4 5
2. I worry about repaying my student loans. 1 2 3 4 5
3. I worry about repaying my credit cards. 1 2 3 4 5
4. I think I am in good financial shape. 1 2 3 4 5
5. I think a lot about the debt I am in. 1 2 3 4 5
6. I have had arguments with others (parents, friends, significant others) about my level of spending. 1 2 3 4 5
7. Five years from now, I will not be in credit card debt. 1 2 3 4 5
8. One year from now, I will not be in credit card debt. 1 2 3 4 5
1 2 3 4 5 Strongly Disagree
Strongly Agree

LIFE-CYCLE THEORY AND COLLEGE STUDENTS 79
Appendix G
Student Attitudes Toward Debt Scale
General Instructions: Circle the number that indicates the extent to which you agree or disagree with each of the following statements about your views or perspectives in general. There is neither a right nor wrong answer to any question.
1. Taking out a loan is a good thing because it allows
you to enjoy life. 1 2 3 4 5 6 7
2. It is a good idea to have something now and pay for it later. 1 2 3 4 5 6 7
3. Using credit is basically wrong. 1 2 3 4 5 6 7 4. I would rather go hungry than purchase food
on credit. 1 2 3 4 5 6 7 5. I plan ahead for larger purchases. 1 2 3 4 5 6 7
6. Being in debt is never a good thing. 1 2 3 4 5 6 7
7. Credit is an essential part of today’s lifestyle. 1 2 3 4 5 6 7
8. It is important to live within one’s means. 1 2 3 4 5 6 7
9. Even on a low income, one should save
a little regularly. 1 2 3 4 5 6 7 10. Borrowed money should be repaid as soon
as possible . 1 2 3 4 5 6 7
11. Most people run up too much debt. 1 2 3 4 5 6 7
12. It is too easy for people to get credit cards. 1 2 3 4 5 6 7
13. I do not like borrowing money. 1 2 3 4 5 6 7
14. Borrowing money is sometimes a good thing. 1 2 3 4 5 6 7
15. I am rather adventurous with my money. 1 2 3 4 5 6 7
1 2 3 4 5 6 7 Strongly Disagree
Strongly Agree

LIFE-CYCLE THEORY AND COLLEGE STUDENTS 80
Appendix H
Student Demographics
Sex (circle): Male Female Gender: _______________ Race (circle): Asian/ Pacific Islander
Black
Hispanic
Native American
Caucasian (White)
Other: __________
Class Year (circle): Freshman
Sophomore
Junior
Senior
Grad Student
Major(s): ______________ Minor(s): _______________ College GPA: ______ Do you plan to go to graduate school? (Circle one). Yes No What is your intended career path? _________________________ What do you estimate your starting salary to be after graduation? _________________ How confident are you in this estimate? 1 2 3 4 5 Not confident Very Confident What do you estimate will be your mid-career salary? _________________ How confident are you in this estimate? 1 2 3 4 5 Not confident Very Confident

LIFE-CYCLE THEORY AND COLLEGE STUDENTS 81
How are you paying for college? (Check all that apply).
Parents or Relatives Financial Aid Personal Savings Student Loans Other: ____________
If you are receiving financial aid, what types of aid do you receive? (Check all that apply).
Connecticut College Grant/Scholarship Outside/Private Scholarships Federal/State Grants Student Loans Payment Plans and Parent Loans Work Study Other: ____________
How much student loan debt do you expect to owe at graduation? ________________ Do your parents help you pay for miscellaneous college fees? (Circle one). Yes No Do you get an allowance? (Circle one). Yes No If so, how much? __________/month How many credit cards do you have? ________________ What bank is it associated with? __________________ Who pays your credit card bill? _________________ How many debit cards do you have? ________________ What bank is it associated with? __________________

LIFE-CYCLE THEORY AND COLLEGE STUDENTS 82
What do you spend YOUR money on at Connecticut College? Please number with 1 being the most money spent.
___ Alcohol
___ Clothes
___ Education Expenses (not including tuition)
___ Electronics
___ Entertainment
___ Food
___ Gas and Auto Maintenance
___ Travel
In the past two weeks, which payment methods did you use most frequently? Please number with 1 being the most money spent.
___ Cash
___ Checks
___ Credit
___ Debit
How often do you use credit to pay for purchases? ______________ How often do you use debit to pay for purchases? _______________ How much money did you spend last week? ______________ What did you spend it on? ________________

LIFE-CYCLE THEORY AND COLLEGE STUDENTS 83
Appendix I
Alumni Demographics
Sex (circle): Male Female Gender: _______________ Race (circle): Asian/ Pacific Islander
Black
Hispanic
Native American
Caucasian (White)
Other: __________
Class Year: _____________ Major(s): ______________ Minor(s): _______________ College GPA: ______ Current Industry: ______________ Current Salary: ______________ What did you estimate your starting salary to be after graduation? _________________ Do you plan to go to graduate school? (Circle one). Yes No Already Attended If you received a graduate degree, what is it in? ___________________ What do you estimate will be your mid-career salary? _________________ How confident are you in this estimate? 1 2 3 4 5 Not confident Very Confident

LIFE-CYCLE THEORY AND COLLEGE STUDENTS 84
How are you paying/did you pay for college? (Check all that apply).
Parents or Relatives Financial Aid Personal Savings Student Loans Other: ____________
If you received financial aid, what types of aid did you receive? (Check all that apply).
Connecticut College Grant/Scholarship Outside/Private Scholarships Federal/State Grants Student Loans Payment Plans and Parent Loans Work Study Other: ____________
How much student loan debt did you owe at graduation? ________________ How much student loan debt do you still owe? _________________ Did your parents help you pay for miscellaneous college fees? (Circle one). Yes No Are your parents still supporting you financially? (Circle one). Yes No How many credit cards do you have? ________________ What bank is it associated with? __________________ How many debit cards do you have? ________________ What bank is it associated with? __________________

LIFE-CYCLE THEORY AND COLLEGE STUDENTS 85
In the past two weeks, which payment methods did you use most frequently? Please number with 1 being the most money spent.
___ Cash
___ Checks
___ Credit
___ Debit
How often do you use credit to pay for purchases? _______________ How often do you use debit to pay for purchases? ______________ Do you have a budget that you stick to? (Circle one). Yes No Do you work with a financial advisor? (Circle one). Yes No

LIFE-CYCLE THEORY AND COLLEGE STUDENTS 86
Appendix J
Chart of Federal Student Financial Assistance from 1995 to 2011
Note. The levels of federal funding for student loans and grants has increased in the overall funds utilized, the number of awards granted, and the average size of the aid from 1995 to 2011. This chart includes numbers for federal grants, loans, and work-study financial aid packages.