does corporate governance really matter?d1c25a6gwz7q5e.cloudfront.net/papers/1281.pdfdoes corporate...
TRANSCRIPT
Does Corporate Governance Really Matter?
David F. Larcker
Scott A. Richardson
�rem Tuna
The Wharton School University of Pennsylvania
Philadelphia, PA 19104-6365
June 9, 2004
We would like to thank David Chun and Roger Boissonnas of Equilar Inc. and J. Thomas Quinn of TrueCourse Inc. for their considerable help on this research project.
Does Corporate Governance Really Matter?
Abstract We examine the relation between a broad set of corporate governance factors and various measures of managerial behavior and organizational performance. Using a sample of 2,126 firms we distill 38 structural measures of corporate governance (e.g., board characteristics, stock ownership, anti-takeover variables etc.) to 13 governance factors using principal components analysis. For a wide set of dependent variables (e.g., abnormal accruals, excessive CEO compensation, debt ratings, analyst recommendations, Q and over-investment) we find that the 13 governance factors on average explain only 1% to 5.5% of the cross-sectional variation using standard OLS multiple regression techniques and 1.4% to 9.1% of the variation using exploratory recursive partitioning techniques. Overall, our results suggest that the typical structural indicators of corporate governance used in academic research and institutional rating services have very limited ability to explain managerial behavior and organizational performance.

Does Corporate Governance Really Matter?
1. Introduction
Corporate governance generally refers to the set of mechanisms that influence the
decisions made by managers when there is a separation of ownership and control. Some
of these monitoring mechanisms are the board of directors, institutional shareholders, and
operation of the market for corporate control. The importance of this topic is obvious
from an examination of the considerable growth in the empirical literature on corporate
governance across accounting, economics, finance, management, and corporate strategy
literatures.1 Typical research studies examine whether different corporate governance
structures impact or constrain executive behavior and/or have an impact on
organizational performance. Examples of these types of studies are Morck, Shleifer, and
Vishny (1988), Byrd and Hickman (1992), Brickley, Coles and Terry (1994), Yermack
(1996), Core, Holthausen, and Larcker (1999), Klein (2002), Gompers, Ishii, and Metrick
(2003).2
Although prior work has provided some insight into the role of corporate
governance, the results of similar studies are frequently contradictory and a consistent set
of results has yet to emerge regarding the importance of corporate governance for
understanding managerial behavior and organizational performance. There are at least
1 There are also many organizations that sell governance ratings (e.g., GovernanceMetrics International, Institutional Shareholder Services, Investor Responsibility Center, and Standard & Poors). The growth in this type of service offerings attests to the perceived importance of corporate governance issues. Although the precise computation of these ratings is proprietary, the scores seem to be based on board independence, distribution of ownership, and other structural characteristics. Despite considerable claims by these organizations, we are not aware of rigorous evidence regarding the ability of these ratings to predict managerial behavior or organizational performance (with the possible exception of Gompers, Ishii, and Metrick, 2003; but note the discussion in Cremers and Nair, 2003 regarding the sensitivity of the Gompers, Ishii and Metrick results). 2 Reviews of the extensive literature corporate governance literature have been provided by Shleifer and Vishny (1997), Bhagat and Black (2002) and Bushman and Smith (2001).

2
seven features of prior research that make it difficult to draw substantive conclusions.
First, most studies use a small set of convenient (easy to collect) set of indicators for
corporate governance, as opposed to developing a more comprehensive set of governance
variables. Second, each study tends to use a different set of governance variables which
makes integration across studies extremely difficult. Third, there is very little analysis
regarding the measurement properties for the selected indicators of corporate governance
(e.g., the traditional psychometric properties of reliability and construct validity).
Moreover, we do not have detailed insight into the number of dimensions (or constructs)
that are necessary to provide a comprehensive assessment of corporate governance.
Fourth, single indicators are used as measures for ill-defined and complex corporate
governance constructs (e.g., percentage of external board members). Such single
indicators are likely to have substantial measurement error for the construct of interest
(e.g., board independence) which will bias the estimated coefficients in typical
methodological approaches. Fifth, the sample size and specific firms included in the
sample vary considerably across studies depending on the dependent variable examined
and the source of the governance variables. These differences make it problematic to
compare results across studies. Sixth, most studies focus on the statistical significance, as
opposed to the incremental explanatory power, of the governance indicators. While
statistical significance is necessary, it is also important to demonstrate explanatory power
in order to draw substantive conclusions about corporate governance. Finally, the
methodological approach used is typically restricted to some type of linear model where
complex interactions among governance are not considered. Since empirical governance

3
research is at an early stage in its evolution, it would be useful to use more exploratory
methods as a complement to traditional linear model approaches.
The purpose of this paper is to develop new measures for corporate governance
from a comprehensive set of indicators and then apply these new measures to a large
sample of firms and across a wide range of dependent variables. We pay particular
attention to developing governance indices that mitigate measurement error and provide a
parsimonious structure for our tests. The results of our principal component analysis
indicates that 13 factors characterize the dimensionality of 38 individual governance
indicators considered in our analysis (e.g., board size, directors that are members of other
boards or busy, multiple dimensions of anti-takeover devices, etc.). Although 13 factors
is a complex outcome, this might be expected, because corporate governance is a
complicated, multidimensional construct.
The 13 constructs derived from the principal component analysis are then used to
determine the importance of corporate governance for accrual choices, analyst equity
recommendations, chief executive officer (CEO) compensation, debt ratings, Tobin’s Q,
and corporate over-investment. These managerial decisions and external valuations
provide a much more comprehensive assessment for the substantive importance of
corporate governance than prior research. Moreover, since we examine multiple
dependent variables using the same set of governance constructs and the same set of
firms, this should enable us to determine whether similar governance constructs are
important across different settings.
Using both traditional multiple regression and exploratory recursive partitioning,
we find that our corporate governance constructs have limited explanatory power for
4
explaining managerial choices or firm valuation. The incremental explanatory power
ranges from 1% to 5.5% for traditional multiple regression and 1.4% to 9.1% for
recursive partitioning analyses. Moreover, the signs of the estimated coefficient are
frequently unexpected. For example, in our analysis of corporate debt ratings and non-
directional measures of abnormal accruals, we find that firms with large boards, busy
directors and anti-takeover provisions (i.e., “bad governance”) tend to have better debt
ratings and lower abnormal accruals. Our overall conclusion is that the typical structural
indicators of corporate governance used in academic research and institutional rating
services have a very limited ability to explain managerial decisions and firm valuation.
These negative results imply either that corporate governance is of modest importance, or
the available indicators of corporate governance are not especially useful.
The remainder of the paper is divided into five sections. Section 2 describes the
sample selection and the governance indicators used in the study. Section 3 presents the
principal component analysis of the governance indicators and develops our 13 construct
measures for corporate governance. Section 4 describes the methodological approach
used to assess the importance of corporate governance for explaining managerial decision
making and firm valuation. The results for each dependent variable are presented in
Section 5. Section 6 provides the summary and conclusions.
5
2. Sample Selection and Corporate Governance Indicators
2.1 Sample
Our sample was generated from the overlap between two comprehensive data sets.
The first data set consisted of the companies covered during 2002 and 2003 by
www.SharkRepellent.net which is a product offering by TrueCourse, Inc. that provides
data on anti-takeover provisions (n = 3,651). The anti-takeover data covers only U.S.
incorporated companies that are included in the major indices (e.g., Fortune 500, S&P
Super 1500, etc.), amended their poison pill since 2001, and/or completed a firmly
underwritten IPO since 1999. The second data set consists of companies covered by
Equilar, Inc. whose fiscal year ends between June, 2002 and May, 2003 and having
complete data on board, board committees (audit and compensation), and equity
ownership by executives and board members (n = 3,000). After merging the
SharkRepellent and Equilar data, we have a final sample of 2,126 individual firms with
complete data. Our sample spans many sectors of the economy and has a distribution of
firms that is very consistent with the composition of the complete Compustat file (see
Table 1). Our sample represents approximately 70 percent of the market capitalization of
the Russell 3000 as of the end of 2003.3
2.2 Corporate Governance Indicators
We collect indicators of corporate governance in seven general categories:
characteristics of the board of directors, stock ownership by executives and board
members, stock ownership by institutions, stock ownership by activist holders, debt and
3 Our sample only covers one year and this limits our ability to generalize the results. However, the single year of data covers a very recent time period and prior work involving large samples also is restricted to a single year (e.g., Bhagat, 2004 and Ashbaugh, Collins, and LaFond, 2004).

6
preferred stock holdings, anti-takeover devices, and unionization. Our board of director
and executive and board ownership data is obtained from Equilar, stock ownership by
institutions and activists is collected from Spectrum data files (13F filings), debt and
preferred stock data is obtained from Compustat, anti-takeover data is collected from
SharkRepellent, and unionization (or the existence of a collective bargaining agreement)
data is collected from 10K filings.
Drawing on prior studies (e.g., Klein, 1998, Bhagat and Black, 2002, Core,
Holthausen and Larcker, 1999, and Ferris, Jagannathan and Pritchard, 2003 and others),
our board of director variables are the number of meetings for the audit committee,
compensation committee, and the total board (denoted as # AC Meetings, # CC Meetings,
and # Board Meetings, respectively), number directors serving on the compensation
committee, audit committee, and the total board (denoted as CC Size, AC Size, and Board
Size, respectively), fraction of board comprised of insider (executive) directors (denoted
as % Board Inside), fraction of the compensation committee and audit committee that is
comprised of affiliated directors (denoted as % CC Affiliated and % AC Affiliated,
respectively)4, indicator variable equal to one if the chairperson of the compensation
committee and audit committee is affiliated and zero otherwise (denoted as CC Chair
Affiliated and AC Chair Affiliated, respectively), the fraction of outside directors and
affiliated directors that serve on four or more other boards, and the fraction of inside
directors that serve on two or more boards (denoted as % Busy Outsiders, % Busy
Affiliated, and % Busy Insiders, respectively), fraction of outside, affiliated, and inside
directors that are older than 70 (denoted as % Old Outsiders, % Old Affiliated, and % Old
4 We use the definition of affiliated (or “grey”) directors developed by Equilar definition (which is a combination of SEC, NYSE, and NASD guidelines). Any outside directors that was mentioned in the “certain transactions” section or a former executive was classified as affiliated.

7
Insiders, respectively), an indicator variable equal to one of there is a lead director (an
outside director that can call meetings of all outside directors in executive session) on the
board and zero otherwise (denoted as Lead Director), an indicator variable equal to one if
an internal executive holds the position of chairperson of the board and zero otherwise
(denoted as Insider Chairman), and the fraction of affiliated and outside directors that
were appointed by existing insiders (denoted as % Affiliated Appointed and % Outsiders
Appointed, respectively).5
Consistent with prior research (e.g., Ashbaugh, Collins, and LaFond, 2004,
Bhagat, 2004, and Klein, 1998), the typical board has about eight members with one or
two internal executives, the chairman of the board is usually an internal executive, and
there is not a lead director (see Table 2). Most of the members of the compensation and
audit committee are outsiders, but there is some evidence that the chair of these
committees is an affiliated director. In contrast to insiders, outside or affiliated directors
are generally not classified as busy. Most boards are not composed of old directors, but
a high percentage of the affiliated and outside directors were appointed by existing inside
directors.
Our board and executive ownership variables are the fraction of outstanding
shares held by the average outside director (denoted as % Outsiders Own)6, fraction of
outstanding shares held by the top executive (denoted as % Top Exec), fraction of
outstanding shares held by the average executive director after excluding the holdings of
the top executive (denoted as % Executives Own (Excl. Top)), and fraction of outstanding
shares held by the average affiliated director (denoted as % Affiliated Own). Similar to
5 This variable was measured by comparing the term of an existing board member to the maximum term for the set of insider directors. If there were no affiliated directors, this variable was set equal to zero. 6 We exclude stock option holdings in our board and executive ownership computations.

8
prior work, the median board and executive group owns less than one percent of the
outstanding equity (e.g., Hall and Liebman, 1998). However, there is considerable
skewness with these measures as evidenced by the mean being substantially larger than
the median.
Institutional ownership is measured as fraction of outstanding shares owned by
block-holders (denoted as % Block Own), number of block-holders (denoted as # Block),
and shareholding of the largest institutional owner (denoted as % Largest).7 The average
company in our sample has two block-holders that own 16 percent of the outstanding
shares (with the largest block-holder owning about nine percent of the outstanding
shares).
The activist variables are measured using the number of activist institutions
holding shares (denoted as # Activists) and the fraction of outstanding shares held by
activist institutions (denoted as % Activists Own). Activist institutions are identified
using the information contained in Cremers and Nair (2003).8 The average company in
our sample has seven activists holding a total of about two percent of the outstanding
shares.
The role of debt as a governance mechanism is measured using the ratio of book
value of debt (Compustat data item 9 plus data item 34) to the market value of equity
7 A block-holder is defined as a shareholder who holds more than five percent of outstanding shares. 8 The following public pension finds are classified as activists (Spectrum manager number): California Public Employees Retirement System (12000), California State Teachers Retirement (12100 and 12120), Colorado Public Employees Retirement Association (18740), Florida State Board of Administration (38330), Illinois State Universities Retirement System (81590), Kentucky Teachers Retirement System (49050), Maryland State Retirement and Pension System (54360), Michigan State Treasury (57500), Montana Board of Investment (58650), Education Retirement Board New Mexico (63600), New York State Common Retirement Fund (63850), New York State Teachers Retirement System (63895), Ohio School Employees Retirement System (66550), Ohio School Employees Retirement System (66610), Ohio State Teachers Retirement System (66635), Texas Teachers Retirement System (82895 and 83360), Virginia Retirement System (90803), State of Wisconsin Investment Board (93405).

9
(Compustat data item 199 * data item 25) and ratio of book value of preferred equity
(Compustat data item 130) to the market value of equity (Compustat data item 199 * data
item 25). These two leverage ratios are denoted as Debt to Market and Preferred to
Market, respectively. The median company has a book value of debt that is
approximately 25 percent market capitalization and preferred stock that is approximately
zero percent of market capitalization.
Our anti-takeover variables are measured using indicator variables regarding
whether a firm has a staggered (or classified) board of directors (denoted as Staggered
Board), requires a supermajority vote for a business combination (denoted as
Supermajority), is incorporated in Delaware (denoted as DE Incorporated), has unequal
voting rights across shareholders or dual classes of stock (denoted as Unequal Voting),
and has a poison pill or where stock purchases can be made at substantial discounts by
existing shareholders if a hostile takeover attempt is made on the firm (denoted as Poison
Pill).9 Sixty three percent of our sample has a staggered board, 24 percent requires a
supermajority vote for takeovers, 61 percent are incorporated in Delaware, nine percent
have dual classes of stock, and 51 percent have a poison pill.
Finally the governance impact of unions is measured using an indicator variable
that is equal to one if the company discloses the existence of a collective bargaining
9 The SharkRepellent data actually includes 15 individual anti-takeover provisions. Rather than attempting to analyze this extensive set of variables, we restrict our attention to a smaller subset of key anti-takeover variables (similar to Gompers, Ishii and Metrick, 2004 who focus on dual class companies and Bebchuk and Cohen, 2004 who focus on the presence of a staggered board ). One provision that is commonly used in prior work is blank check preferred (e.g., Daines and Klausner, 2001). We drop this provision because 92 percent of the SharkRepellent sample has blank check preferred, thus there is little variance in this variable across our sample.

10
agreement and as a zero otherwise (denoted as Union).10 Twenty two percent of our
sample have employees that are at least partially represented by a union.
3. Corporate Governance Constructs
3.1 Methodology
In order to develop our corporate governance constructs, we use exploratory
principal component analysis (PCA) in order to identify the underlying dimensions or
structure of corporate governance and determine which indicators are associated with
each factor.11 We retain all factors with an eigenvalue greater than unity. This results in
13 factors that retain 58.7% of the total variance in the original data. This reduced
solution is then rotated using an oblimin rotation (i.e., an oblique rotation that allows the
retained factors to be correlated) in order to enhance interpretability of the PCA solution.
These 13 factors represent the underlying dimensions of corporate governance (see Table
3).
In order to interpret the factors, it is necessary to determine which indicators have
a statistical and substantive association with each factor. We associate each factor with
those variables that have a loading (or the correlation between the factor and an indicator)
that exceeds 0.40 in absolute value and are statistically different from zero at
conventional levels of significance. Statistical significance is determined using traditional
bootstrapping methods (1,000 samples with replacement) for the rotated 13 factor
10 This variable is hand collected via a search on Lexis-Nexis of form 10-Ks using the following search routine: “Employ! w/30 (labor union! or collective bargaining)”. Prior research has attempted to capture the influence of employees on the firm but have typically measured this via employee stock ownership plans (e.g., Faleye, Mehrotra and Morck, 2004). 11 Our approach contrasts with common practice of arbitrarily selecting a set of single indicators for some assumed governance constructs. We do not use this approach because it does not provide any insight into the underlying structure of corporate governance. Moreover, the use of a single indicator for a complex construct is almost certainly associated with considerable measurement error (i.e., low reliability).

11
solution. The resulting variables that are associated with each factor are summarized in
Table 3.
Each factor (or construct) is assigned a name based on the characteristics of the
indicators that are related to the factor. Two of the factors are associated with only a
single indicator (% Affiliated Own and Lead Director), and thus it is simple to name these
factors. However, the naming of factors with multiple indicators can be more delicate.
For example, the first factor has three relevant indicators that are measures of the number
of individuals on the overall board and the compensation and audit committee. Thus, this
governance factor is named “Board Size.” Similarly, the third factor has four indicators
that are all related to affiliated directors holding important positions on the audit and
compensation committees. Thus, this governance factor is named “Affiliated Presence.”
We use this general approach to name the other factors described in Table 3.
The PCA results in Table 3 produce a relatively interpretable solution (e.g., there
were no cross-loadings or situations where the same indicator is associated with more
than one factor). However, since corporate governance is a complex general construct, it
should not be surprising to find some unexpected results in the PCA solution. For
example, # Activists and Union both load on the factor that we name “Busy Directors.”
The primary indicators of this factor measure the extent of other board involvement by
board members and we use these associations to name this factor. Although somewhat
speculative, # Activists may load on this factor because these organizations take
ownership positions in organizations that they view as having inadequate governance (i.e.,
busy directors is one of the factors that is considered in their internal scoring of corporate
governance). Similarly, organizations that have unionized workers are likely to be older
12
and operating in traditional industries where board members are traditionally involved in
multiple organizations.
Another interesting result in Table 3 is that the indicators % Board Inside, %
Outsiders Own, and % Activists Own do not load on any of the 13 retained governance
factors. This implies that these three indicators are not relevant to the structure of overall
corporate governance. Interestingly, % Board Inside and % Outsiders Own (and to a
lesser extent % Activists Own) are common governance variables used in prior research.
The observation that these variables are not included in the PCA solution raises questions
about whether these variables are useful measures for corporate governance.
With the exception of the anti-takeover factors, the governance construct scores
are computed using the average equal-weighted sum of the standardized indicators
associated with each factor (Grice and Harris, 1998). However, the anti-takeover factors
exhibit a combination of positive and negative loadings, and this suggests certain types of
anti-takeover measures are substitutes for other measures. For example for Anti-
Takeover I, there is a negative association between incorporation in Delaware (which
affords some degree of protection) and the use of a supermajority of approving takeovers.
This result implies that the firms in our sample tend to use one or the other of these two
anti-takeover mechanisms. Rather than computing a simple sum, the score for Anti-
Takeover I is equal to sum of the standardized scores if both indicators are both equal to
zero or both equal to one. For the remaining cases (where only one of the two indicators
is equal to one), the score is equal to the standardized value for that variable. A similar
coding scheme is used for Anti-Takeover II.12
12 With the exception of the two anti-takeover variables, the mean governance scores are equal to zero because the scores are the average of standardized variables (Table 4, Panel A). The two anti-takeover

13
There is evidence of construct reliability (or the inverse of measurement error)
based on the computation of Cronbach coefficient alphas for indicators associated with
each governance construct. For the multi-item scores, coefficient alpha ranges from
0.315 to 0.860 (mean = 0.568 and median = 0.540). Although Busy Directors and Anti-
Takeover II have relatively low alphas (which is not uncommon for measurement
development during the early stages of research), the remaining constructs exceed the
minimum reliability levels suggested by Nunnally (1967). Moreover, none of the
confidence intervals for correlations among the 13 governance constructs include unity at
conventional levels of statistical significance (Table 4, Panel B).13 These results suggest
that our governance constructs are statistically distinct and exhibit construct validity.
3.2 Expected Associations
We classify Board Size, Affiliated Presence, Insider Influence, Anti-Takeover I,
Anti-Takeover II, Old Directors and Busy Directors as increasing in “bad” governance.
Prior research suggests that firms with bigger boards perform worse than firms with
smaller boards (Yermack, 1996). The presence of affiliated directors on the board and
various committees is often argued as compromising the independence of the
board/committee (Klein, 1998). The presence of a dual CEO-Chairperson (Yermack,
1996) and outsiders and/or affiliates who have been appointed by incumbent management
also is assumed to erode the independence of the board. Both anti-takeover factors
variables do not have zero mean scores because of the coding used to combine variables with the positive and negative loadings. 13While many of these correlations are statistically significant at conventional levels, the absolute value for most of these bivariate correlations is quite small in magnitude. With regard to some of the larger correlations, we observe that companies with larger boards also have higher debt and preferred stock holdings (r = 0.340), firms with larger boards also have more directors that are busy (r = 0.328), firms with more affiliated presence also have higher affiliated ownership (r = 0.574), firms with more insider influence also have higher insider ownership (r = 0.325), and firms with busy directors have lower insider ownership (r = -0.310).

14
capture measures that are designed to reduce the power of the market for corporate
control to play its role in disciplining the firm. Finally, old and busy directors are likely
to be less active monitors relative to younger and less busy directors (e.g., Core,
Holthausen and Larcker, 1999).
Block, Debt and Lead Director are classified as increasing in “good” governance.
The presence of a large block-holder is typically argued to be beneficial through the
monitoring benefit of a financially sensitive shareholder (Shleifer and Vishny, 1997).
The presence of debt-holders also offers additional monitoring benefit via external capital
providers who have the incentive and ability to monitor firm activity to protect invested
principle. The appointment of a non-executive director as a lead director is expected to
create additional monitoring benefit on incumbent management.
Meetings, Affiliated Ownership and Insider Ownership have a more ambigrous
relation with “good” governance. For example, prior research examining the stock
ownership of insiders finds some evidence of a non-linear pattern with measures of
corporate performance (Morck, Shleifer and Vishny, 1988). Likewise, the number of
meetings held by the board and committees could be evidence of additional monitoring
but it could also be indicative of problems within the firm that gave rise to additional
meetings.

15
4. Methodological Approach
4.1 Multiple Regression
The methodological approach used in most prior work examining the impact of
corporate governance on various dependent variables utilizes a multiple regression of the
following form:
Dependent Variablet = � +ΣγControls + ΣβGovernance Factorst + εt
Our initial results are based on the statistical significance and incremental explanatory
power associated with the set of governance factors.
One important feature in this structure is that the governance factors are assumed
to have no impact on the controls (and thus no indirect effects of governance on the
dependent variable). As a result, this structure may result in conservative estimates for
the impact of governance on the dependent variable. Another approach is to only include
governance factors as independent variables. This structure would be appropriate if
governance impacts the control variables and both the governance and control variables
impact the dependent variable (i.e., the estimated regression coefficients for the
governance variables will capture the total effect or the sum of the direct effect the
indirect effect through the controls). We report the explanatory power from these types
of total governance effect regressions at the end of Section 5.7.14
14 As with all studies of this type, endogeneity is a potential problem because most (perhaps all) of the governance constructs are choice variables. This econometric problem will produce inconsistent estimates for both the coefficients and standard errors. As discussed in Larcker (2003), it is not clear how to resolve this problem unless exogenous instruments can be identified and n-stage least squares methods are used in the estimation. We acknowledge that our results are limited by the endogeneity of our independent variables.

16
4.2 Recursive Partitioning
One problem with the traditional regression approach is that a simple linear
structure cannot capture the likely complex nonlinearities and interactions among the
independent variables. Moreover, interactions are exceedingly difficult to specify a
priori and tend to produce high levels of multi-collinearity. As an alternative
methodological approach, we also analyze our data with exploratory recursive
partitioning using the well-known CHAID (or Chi-square Automatic Interaction
Detection) algorithm in our analysis (e.g., Kass, 1980, Biggs, de Ville, and Suen, 1991).
Recursive partitioning models are constructed by successively splitting the data into
increasingly homogeneous subsets. At each step, the independent variables are examined
and the one that gives the “best” split is selected. The splitting process is terminated
based on selected traditional “stopping rules.” Recursive partitioning ultimately produces
a tree-like structure that describes the (nonlinear and interactive) associations between the
dependent variable and a set of independent variables.15
Since our dependent variables are continuous, F-tests (similar to traditional
analysis of variance) are computed to determine the best independent variable for a split
and the number of categories in the split. Continuous independent variables are initially
divided into ten intervals with approximately an equal number of cases in each interval.
Exhaustive search is then used to merge categories that are not statistically significant
15Another advantage of recursive partitioning is that it is straightforward to uncover whether governance constructs appear to be complements and substitutes for explaining the dependent variable. Prior research has attempted to look at such complementarities across governance structures in a variety of settings. Examples include Brickley, Coles and Terry (1994), Malette and Fowler (1992), Sundaramurthy, Mahoney and Mahoney (1997) who find board characteristics relate to the adoption of anti-takeover devices, and Conyon and Florou (2004) who find that CEO compensation and stock holding of directors impacts investment decisions made by managers close to retirement age.

17
(p > 0.05).16 Once the best independent variable (and associated categories) is
determined, the selection process is repeated in order to find the next best independent
variable. Eventually, the recursive partitioning process stops when there are no
remaining variables that are statistically significant or the sample size at the split being
considered becomes smaller than a predetermined limit.17 The explanatory power of the
recursive partitioning model can be computed as one minus the ratio of the within-node
variance about the mean of the node to the total variance of the dependent variable (i.e.,
one minus the ratio of error variance to total variance).
One problem with exploratory methods such as recursive partitioning concerns
over-fitting (i.e., the within-sample explanatory power may substantially overstate the
out-of-sample explanatory power). In order to provide a more realistic measure of
explanatory power, we use tenfold cross-validation for the tree. Specifically, the data are
split into ten sub-samples and recursive partitioning is applied to generate ten trees
(where the first tree only uses data from sub-samples two to ten, the second tree only uses
data from sub-sample one and sub-samples three to ten, etc.). The explanatory power is
then computed by applying the tree to the deleted sub-sample. We use the average cross-
validated results for computing the explanatory power of the recursive partitioning.
Although it is possible to simultaneously include both the control and governance
variables into the recursive partitioning, our imposed stopping rules for parent and child
nodes will substantially limit the number of partitions in the tree. Since our primary
focus in on the explanatory power of the governance constructs, we first estimate a
16 Since multiple correlated comparisons are used in the recursive partitioning, Bonferroni adjustments are used to set the overall type I error rates. 17 Our stopping criteria requires that the node being split (i.e., the parent node) has at least 100 observations and the nodes produced (i.e., the child nodes) have at least 50 observations. We require relatively large samples in each node in order to avoid extreme over-fitting of the data.

18
regression of the dependent variable on the controls, and then use the unstandardized
residual from this estimation as the criterion variable in the recursive partitioning. The
predictors in the recursive partitioning are the 13 governance constructs.
5. Results
In this section, we present the results of our empirical analyses examining the
relation between the governance factors and six dependent variables: abnormal accruals,
analyst recommendations, CEO compensation, debt ratings, Tobin’s Q and over-
investment. For each dependent variable, we briefly review the prior research related to
typical control variables and the prior results associated with governance variables. We
then present the statistical significance and explanatory power for the governance
variables after adjusting for the control variables (using both standard OLS regression
techniques and recursive partitioning).18
In order to aid interpreting the results, all of our dependent variables are
increasing in “bad” outcomes. Abnormal accruals are increasing in accrual choices that
deviate from a “normal” level, analyst recommendations are increasing in sells, CEO
compensation is increasing in total compensation paid to the CEO, debt rating is
increasing in speculative grade debt, Q is increasing in poor corporate performance and
over-investment is increasing in investment expenditure that deviates from a “normal”
level. We therefore expect a negative (positive) relation between governance constructs
that are hypothesized as “good” (“bad”) and our dependent variables.
18 The correlations across our dependent variables are quite low (the absolute value of all Pearson (Spearman) correlation coefficients is less than 0.185 (0.139) with the exception of the correlation between Abnormal Accruals and |Abnormal Accruals| which is -0.45) so we have not reduced the set of dependent variables into factors(s) nor used alternative techniques to examine the association between a set of dependent variables and a set of independent variables (e.g., canonical correlation analysis).

19
5.1 Abnormal Accruals
5.1.1 Accruals, Control Variables and Prior Literature
Measures of abnormal accruals are typically used as surrogates for earnings
quality (e.g., Klein, 2002 and Frankel et al., 2002). The flexibility afforded through
accrual accounting makes the accrual component of earnings less reliable than the cash
flow component and therefore a potentially useful measure for examining the quality of
financial reports. As is standard in the literature, we are interested in identifying the
“unexpected” (also called discretionary or abnormal) component of total accruals. Jones
(1991) is the standard technique used for this decomposition. Total accruals are
regressed on variables that are expected to vary with “normal” accruals. We use a cross-
sectional (as opposed to time series) version of the Jones model due to its superior
specification and less restrictive data requirements (DeFond and Subramanyam, 1998 and
Bartov, Gul and Tsui, 2001). Limitations of this measure are the standard criticisms
associated with any expectation model. Deficiencies in the set of independent variables
and the functional form can lead to mis-classification of normal accruals as abnormal and
vice versa (e.g., Bernard and Skinner, 1996).
We use an accrual model which builds on the modified Jones model of Dechow,
Sloan and Sweeney (1995). The modified Jones model assumes that the change in
revenues less the change in accounts receivable is free from managerial discretion (i.e.,
credit sales are assumed to be abnormal) and that capital intensity drive normal accruals.
We include two additional independent variables that have been shown to be correlated
with measures of unexpected accruals. First, we include the book-to-market ratio (BM).
20
BM is measured as the ratio of the book value of common equity (Compustat item 60) to
the market value of common equity (Compustat item 25 x item 199). BM is included as a
proxy for expected growth in the firm’s operations. We expect to see large accruals for
growing firms (see also McNichols 2000, 2002). Second, we include a measure of
current operating performance. Previous research has shown that measures of
unexpected accruals are more likely to be mis-specified for firms with extreme levels of
performance (Dechow et al., 1995). We therefore include current operating cash flows,
CFO (Compustat item 308), as an additional independent variable. The advanced model
is estimated as follows:
TA = α + β1(∆Sales-∆REC) + β2PPE + β3BM + β4CFO + ε
Total Accruals (TA) is the difference between operating cash flows (Compustat
item 308) and income before extraordinary items (item 123) as reported on the statement
of cash flows. ∆Sales is the change in sales (item 12) from the previous year to the
current year, ∆REC is the difference in accounts receivable (item 302) from the start to
the end of the year, and PPE is the end of year property, plant and equipment (item 7).
All variables are scaled by the average of total assets using assets from the start and end
of the fiscal year (item 6). The residual value from this model is labeled Abnormal
Accruals, the estimate of unexpected or abnormal accruals from our extended Jones
model. Independent variables in the accrual model are all winsorized to be no greater
than one in absolute value, with the exception of BM that is winsorized at the extreme
two percentiles (i.e., values less (greater) than the 2nd (98th) percentile are set equal to the
value of the 2nd (98th) percentile). We estimate the model for each 2 digit SIC group
21
separately with the requirement that there be at least 10 firms in each group. This leaves
a sample size of 1,497 firms for the abnormal accrual analysis.
Consistent with prior research, we find a positive coefficient on (∆Sales-∆REC)
and a negative coefficient on PPE (the traditional parameters in the modified Jones
model). We also find that BM and CFO are both negatively associated with total
accruals. In the tests that follow, we examine both the raw values for abnormal accruals
along with their absolute values. If the earnings management is directional, the
appropriate metric is the raw value. For example, if weak governance structures create an
incentive to engage in income increasing earnings management then the research design
should focus on signed measures of unexpected accruals. However, if the earnings
management is non-directional, the absolute value of unexpected accruals is appropriate.
Previous research has found weak associations between measures of corporate
governance (such as the composition of the board and audit committees, financial
expertise of board and committee members, and stock ownership of board members) and
measures of the absolute value of abnormal accruals (e.g., Klein, 2002). It is, however,
not clear how robust these patterns are to more recent and larger samples, inclusion of a
more complete set of governance factors and whether the results are driven by directional
or non-directional accrual measures.
5.1.2 Abnormal Accruals and Governance Factors
Table 5 reports our results on the association between measures of abnormal
accruals and our 13 governance factors. For our sample of 1,497 firms the mean
abnormal accrual is close to zero and the absolute value of abnormal accruals is about six

22
percent of average assets. These numbers are similar to prior research (e.g., Larcker and
Richardson, 2004).
Panel B of table 5 reports standard OLS regression results. Only Anti-Takeover I
and Busy Directors are statistically significant in the OLS specification for the directional
accrual measure and Board Size, Anti-Takeover I and Busy Directors are statistically
significant in the OLS specification for the non-directional accrual measure. Surprisingly,
the governance factors only have the expected signs for the directional accrual measure.
Furthermore, the explanatory power of the governance factors is only 1.3% (5.5%) for the
directional (non-directional) measure. Very few of the governance factors explain cross-
sectional variation in abnormal accruals and the ones that do are not the governance
factors examined in prior literature (e.g., Klein 2002, Jenkins 2002 and Xie, Davidson,
Dadalt, 2002).
Panel C and D of table 5 report the results from our recursive partitioning analysis.
The recursive partitioning tables start with a single node that reports the overall mean and
standard deviation of the relevant dependent variable and number of observations for the
sample used in the analysis. Beneath the first node are branches that correspond to the
governance factor that has the greatest explanatory power. There could be many
branches with the higher branches always reflecting the relatively more powerful
explanatory variable. At each branch there are several nodes corresponding to the split of
that governance factor that generates the greatest explanatory power. Each subsequent
node reports the mean and standard deviation of the dependent variable and the number
of firms at that level in the tree. The F-test above each branch reports the statistical test
for that respective branch.

23
Consistent with the OLS regression result for the directional accrual measure,
Panel C of table 5 shows that only Busy Directors is significant, and the explanatory
power is only 1.4%. There are three groups identified by the recursive partitioning
technique and the sizes of each group suggest a distinctly non-linear relation. There are
144 firms in the first node with the least busy directors (the standardized Busy Director
factor score is less than -0.64) with a mean value of Abnormal Accruals of -0.03, 604
firms in the intermediate busy director node (the standardized Busy Director factor score
is between -0.64 and -0.05) with a mean value of Abnormal Accruals of 0.00, and 749
firms in the third busy director node (the standardized Busy Director factor score is
greater than -0.05) with a mean value of Abnormal Accruals of 0.01).19
More interesting results are found with the non-directional measure. The most
important governance factor is board size. Firms with large boards report smaller
|Abnormal Accruals|. This is inconsistent with prior literature that suggests big boards
are “bad”. Other governance factors do matter in addition to board size. The power of
the recursive partitioning technique is that it captures distinct non-linear interactions
across the governance factors that help isolate interesting substitutability and
complementarities across governance structures. For example, BLOCK only matters for
firms with small boards. Specifically, the BLOCK factor decreases the size of |Abnormal
Accruals|, as expected, and appears to be acting as a substitute mechanism for board size.
Likewise Debt matters only for a subset of firms with large boards. Debt decreases the
magnitude of |Abnormal Accruals|, as expected but only for firms with large boards.
19 All figures for the recursive partitioning results can be read in a similar fashion. Each child node first contains the cut-offs for the relevant governance factor and then reports the mean and standard deviation of the dependent variable (unstandardized residual is used in the recursive partitioning analysis) along with the number of observations for that node.

24
Finally, for large boards with more debt-holders, Board Size enters again with an
unexpected sign. Overall, the largest |Abnormal Accruals| occur for firms with small
boards that have few block-holders and the smallest |Abnormal Accruals| occur for firms
with large boards and large level of external debt financing.
5.2 Analyst Recommendations
5.2.1. Analyst Recommendations, Control Variables and Prior Literature
We use analyst recommendations as a summary measure of the value of the firm.
If governance structures are likely to influence the prospects of the firm then these should
be captured in the recommendations about the firm. Obviously to the extent that
governance structures are correctly priced by capital market participants then firm value
will reflect this aspect of firm fundamental value and we would expect to see no
association between governance factors and analyst recommendations. This is a
limitation of all dependent variables that incorporate a measure of market value and is the
reason that we examine market and non-market based measures.
Analyst recommendation data are collected from Thomson Financial First Call
database. We use the mean consensus recommendation as at the end of the fiscal year.
Recommendations are on a 5 point scale as follows (1 – strong buy, 2 – buy, 3 – hold, 4 –
sell, 5 – strong sell). Control variables for the recommendation analysis include BM (as
defined earlier), EMOM (earnings momentum) calculated as the difference between the
most recent median earnings forecast and last years earnings deflated by the absolute
value of last years earnings, and PMOM (price momentum) calculated as 6 month
calendar return leading up to the recommendation. Both EMOM and PMOM are
measured such that their values are publicly available at the time of the recommendation.

25
We expect recommendations to be decreasing (note that the scale of this variable is 1-
BUY and 5-SELL) in earnings and stock price momentum and increasing in book-to-
market (the inverse of market expectations for growth). These control variables are
chosen from Stickel (2000) who finds that buy analyst recommendations are more likely
for firms who experienced strong earnings and stock price momentum and for glamour
stocks. All control variables are winsorized at the 2nd and 98th percentiles.
5.2.2 Analyst Recommendations and Governance Factors
Panel A of table 6 reports that the mean (median) recommendation for our sample
of 1,495 firms with available data from Thomson Financial is 2.45 (2.48) which
corresponds to a Buy-Hold recommendation. Panel B reports that the control variables
load with expected signs, are significant and collectively they explain 12 percent of the
cross-sectional variation in recommendations.20 The final two columns in panel B of
table 6 report the full model where we include both control variables and the governance
factors. Only four of the 13 governance factors are statistically significant: Meetings,
Old Directors, Insider Ownership and Busy Directors. Both Meetings and Insider
Ownership have statistically significant positive coefficients, suggesting that firms with
more meetings or greater insider ownership receive less favorable recommendations. Old
Directors has a significant negative relation contrary to our expectations – firms with
older directors have more favorable recommendations. Finally, Busy Directors is
positively associated with recommendations, consistent with our conjecture that firms
20 We report results for an OLS specification for the sake of simplicity and consistency across the dependent variables. We have run results using an ordinal logistic regression specification which captures the discrete nature of the dependent variable. Results are virtually identical from this alternate specification.

26
with busy directors suffer from weaker governance. Overall, the inclusion of our 13
governance factors provided an incremental R2 of only 2.6 percent.
Panel C of table 6 reports the recursive partitioning analysis for recommendations.
The dependent variable used in this framework is the residual recommendation after the
inclusion of control variables: EMOM, PMOM, BM. Similar to the OLS results,
Meetings and Busy Directors explain recommendations. Again we find that firms with
more frequent meetings have less favorable recommendations. Busy Directors only
matters for firms with more frequent meetings and again we find that this factor is
positively associated with recommendations – firms with busy boards receive less
favorable recommendations. There is, however, one exception to this pattern. Firms
with the least busy directors (firms for which the standardized Busy Director factor score
is less than -0.59) have the highest (least favorable) recommendations. This is a very
small group (node has 64 firms) and highlights the benefit of the recursive partitioning in
identifying non-linear relations between the governance factors and our dependent
variables.
5.3 Chief Executive Officer (CEO) Compensation
5.3.1. CEO Compensation, Control Variables and Prior Literature
In recent years one of the most high profile governance related scandals has been
the compensation packages offered to top executives. Prior research has examined the
impact of isolated governance structures on various aspects of CEO compensation (e.g.,
Core, Holthausen and Larcker, 1999 for board characteristics and CEO compensation,
and Bertrand and Mullainathan, 2000 for the market for corporate control and CEO pay).
We use a measure of CEO compensation to examine the impact of our governance

27
structures in a specific setting (similar to our over-investment variable examined in
section 5.6), in addition to our other dependent variables that capture overall corporate
performance.
CEO compensation is calculated using data from Equilar. We measure the total
dollar value of all compensation received by the CEO including salary, bonus, the Black-
Scholes value of stock options, restricted stock grants, target value for performance plans
and miscellaneous other pay (including matching contributions for deferred
compensation, life insurance, disclosed perquisities etc.). Control variables include MVE
(market value of equity), BM (as defined earlier), ROA (return on assets) calculated as
net income (item18) deflated by average total assets, RET (12 month return) calculated as
the change in price inclusive of dividends for the fiscal period, σ(ROA) is the standard
deviation of ROA using at least 3 and up to 5 years of prior data, and σ(RET) is the
standard deviation of RET using at least 3 and up to 5 years of prior data. The total
compensation variable and all control variables are winsorized at the 2nd and 98th
percentiles. We also include a vector of industry fixed effects (2 digit SIC) in the CEO
compensation regression (not reported in panel B of table 7).
5.3.2 CEO Compensation and Governance Factors
Panel A of table 7 reports that mean (median) total CEO compensation is about
$7.8 ($3.5) million with a highly skewed distribution. Panel B reports two sets of OLS
regression results. The first two columns report results for the control variables alone
(industry indicator variables are included but not reported). The second two columns also
include our governance factors.

28
The control variables are largely consistent with expectations. Large firms pay
their CEOs more. Riskier firms (lower BM, higher �(RET)) pay their CEOs more, but
higher stock return is associated with lower CEO pay in our sample period. Collectively,
these controls explain nearly 40 percent of the cross-sectional variation in CEO
compensation.
Of the 13 governance factors only Meetings and Busy Directors are statistically
significant in the OLS specification. Firms with more meetings and busy directors pay
their CEOs more. This result is related to the inter-locking and social comparison studies
in the management/sociology literature (e.g., Mizruchi, 2004, and O’Reilly, Main and
Crystal, 1988). In particular, Hallock (1997) find that firms with interlocked
compensation committee (and board) members tend to pay their CEOs more than their
peers. The incremental explanatory power from our governance factors is only 4.4
percent (relative to the 40 percent explanatory power from the controls only
specification).
Panel C of table 7 reports the recursive partitioning results. Again note our
dependent variable is residual compensation after controlling for the set of economic
determinants examined in panel B. We still see only a small explanatory power from the
set of governance variables (6.6 percent). Consistent with the OLS results, Busy
Directors is positively associated with CEO compensation. Meetings is the second most
important governance factor and is generally positively associated with CEO
compensation with the exception of the middle nodes of the Meetings branch for the
highest (right-most) Busy Director node. Finally, Inside Ownership is associated with
29
lower CEO compensation for firms with moderately busy directors who have less
frequent meetings.
5.4 Debt Rating
5.4.1. Debt Rating, Control Variables and Prior Literature
Like analyst recommendations, we examine debt ratings to get an overall picture
of the impact of governance on firm value. This approach has been adopted in prior
research (e.g., Ashbaugh, Collins and LaFond, 2004 for debt ratings, Bhojraj and
Sengupta, 2004 for debt ratings and yield spreads, and Klock, Mansi, and Maxwell, 2004
for yield spreads). A benefit of the debt rating measure is that debt rating agencies (and
we use the Standard and Poor’s rating) are starting to focus on corporate governance
specifically in their rating business. So to the extent that corporate governance matters,
this is likely to be a powerful setting to document such effects.
Debt Rating data are collected from Compustat. We use the senior debt rating for
the firm (Compustat data item 280) as at the end of the fiscal year. We re-code this
variable into seven broad categories increasing in speculative grade debt consistent with
Ashbaugh, Collins and LaFond (2004) as explained in the notes to table 8. We have
multiplied the scale that Ashbaugh et al. use by -1 to ensure that our debt rating variable
is comparable to our other dependent variables (i.e., it is increasing in a “bad” outcome).
Control variables include Leverage (measured as total debt (Compustat data item 9 +
item 34) divided by total assets (item6)), ROA (measured as net income (item 18) divided
by average total assets), Interest Coverage (measured as operating income before
depreciation (item 178) divided by interest expense (item 15)), LOSS (an indicator
variable equal to one if net income is negative, and zero otherwise), SIZE (measured as

30
the log of total assets (item 6)), Subordinated Debt (an indicator variables if the firm has
subordinated debt as measured by a non-missing value for subordinated debt (item 80),
and zero otherwise), Capital Intensity (measured as gross property, plant and equipment
(item 7) divided by total assets (item 6)), Financials or Utilities (an indicator variable
equal to one if the firm is a financial institution, 6000 < SIC ≤ 6999, or a utility, 4900 <
SIC ≤ 4999 or zero otherwise), and BM (as defined earlier). All control variables are
winsorized at the 2nd and 98th percentiles. We do not include Debt as a governance
factor with our debt rating analysis, because debt (Leverage) is already included as a
control variable.
3.4.2 Debt Ratings and Governance Factors
Panel A of table 8 reports that the mean (median) debt rating is -3.68 (-4) which
corresponds to BB/BBB (BBB) grade debt. Panel B reports the controls only and
controls with governance OLS regression specifications.21 The control variables load
largely as expected (consistent with Ashbaugh, Collins and LaFond, 2004). Firms with
greater outstanding debt receive lower debt ratings (note that the dependent variable is
increasing in speculative grade debt). Firms with better accounting performance have
higher (better) debt ratings and firms reporting losses received lower (worse) debt ratings.
Surprisingly, interest coverage is significant in the opposite direction (i.e., firms with
more interest coverage receive lower debt ratings). Large firms and firms in regulated
industries and firms with higher capital intensity (collateral value) receive higher ratings.
21 As with the analyst recommendation tests we have also run results using an ordinal logistic regression specification which captures the discrete nature of the dependent variable. Results are virtually identical from this alternate specification.
31
Finally, firms with subordinated debt receive lower debt ratings and riskier firms (as
measured by BM) receive higher debt ratings.22
Of the 13 governance factors only 4 are significant: Board Size, Anti-Takeover I,
Meetings and Busy Directors. The associations for three of these four variables are
inconsistent with our expectations. Firms with big boards receive higher debt ratings,
firms with anti-takeover provisions receive higher ratings and firms with busy directors
receive higher ratings. Perhaps the relation for anti-takeover measures reflects a potential
benefit to existing debt-holders for mitigating the possibility of asset dilution or change in
the risk profile of the investment. Collectively, the explanatory power from including the
governance factors is only 3.4 percent.
Panel C of table 8 reports the recursive partitioning results (after already
controlling for economic determinants). Board Size is the single most important
governance factor. The relation between Board Size and Debt Rating is largely linear
(where firms with larger boards receiving lower debt ratings, with the exception of the
fourth Board Size node). Consistent with the OLS results, Anti-Takeover I is associated
with better debt ratings, and BLOCK is associated with worse debt ratings, opposite to
our predictions. Similar to the OLS specification, however, is the small explanatory
power from the governance factors, only 7.9 percent of the variation in the residual debt
rating is explained with the 13 potential governance factors, and of the factors that were
significant most were in the opposite direction to what was expected.
22 The positive relation between firm risk and investment grade debt is contrary to the results in Bhojraj and Sengupta (2004). However, the sample sizes and time periods examined in that paper are very different from ours. Bhojraj and Sengupta examine only newly investment grade debt covered on the Lehman Brothers Bond database for the period 1991-96, whereas we examine all types of debt for the 2002-03 period.
32
5.5 Tobin’s Q
5.5.1. Q, Control Variables and Prior Literature
the impact of governance on overall firm value is assessed using Tobin’s Q. This
variable has received considerable attention in the prior governance literature. Examples
of governance variables whose association with Q have been documented include board
size (Yermack, 1996), insider stock ownership (Morck, Shleifer and Vishny, 1988) dual
CEO-chair (Yermack, 1996), and board structure (Bhagat and Black, 2002).
We measure Q as the sum of book value of debt (Compustat item 9 + item 34)
and the book value of equity (item 60) deflated by the sum of the book value of debt and
the market value of equity (item 25 * item199). Note that we have measured Q as book
value relative to market value, hence our predicted signs will be opposite to some prior
research who have used the market to book version of this variable. We have chosen the
reciprocal due to its statistical properties (i.e., normality). The mean (median) Q for our
sample is 0.71 (0.70).
Control variables include SIZE (measured as the log of total assets (item 6)),
Log(Age) (is the log of the number of months that the firm has been listed on a US
exchange as reported in CRSP), SP500 (an indicator variable equal to one if the firm is a
member of the S&P 500 index and zero otherwise), RD (is research and development
expenditure (item 46) divided by total assets (item 6)), # Segments (is the number of
segments as reported on Compustat), and ROA (return on assets measured as net income
(item 18) deflated by average total assets). Control variables were selected based on the
prior specifications used by Morck, Shleifer and Vishny (1998), Yermack (1996), Shin
and Stulz (2000), Daines (2001), Morck and Yang (2001) and Gompers, Ishii and

33
Metrick (2003). All control variables are winsorized at the 2nd and 98th percentiles. We
also include a vector of industry fixed effects (2 digit SIC) in the Q regression (not
reported).
5.5.2 Q and Governance Factors
Panel B of table 9 reports OLS regression results for two models. The first model
is the controls only specification and the second model includes our 13 governance
factors. The control variables are significant in the expected directions. We discuss the
results here describing the relation with respect to Q even though we have measured the
variable as its reciprocal. Larger firms have lower Tobin’s Q ratios. Younger firms,
firms listed on the S&P500, and research active firms have higher Tobin’s Q ratios.
Diversified firms suffer from a discount and are associated with lower Tobin’s Q ratios.
Finally, more profitable firms tend to have higher Tobin’s Q ratios. The control variables
as a group are able to explain 20.6 percent of the cross-sectional variation.
Including the 13 governance factors increases explanatory power by only 1.5
percent. Of the 13 factors only 3 are significant in the OLS specification: BLOCK, Anti-
Takeover II and Busy Directors. Of these three variables only one, Anti-Takeover II, has
the expected sign. Firms with block-holders experience lower Tobin’s Q ratios, and
firms with busy directors experience higher Tobin’s Q ratios. Firms with poison pills in
place and staggered boards (Anti-Takeover II) tend to have lower Tobin’s Q ratios.
Our recursive partitioning results are presented in panel C of table 9. The single
most important governance factor is Debt. The relation between Debt and Q is not linear
(this non-linearity might explain the absence of a relation in the OLS specification). We
see a U-shaped pattern where firms with low and high levels of debt experience lower
34
Tobin’s Q ratios. The lower nodes in the tree reveal that Board Size, Busy Directors and
BLOCK are significant, but all in the opposite direction to what was expected. Firms
with large boards, firms with busy boards and firms with fewer block-holders all
experience higher Tobin’s Q ratios. Note that these variables are significant only after
conditioning on the level of debt, and depending on the level of debt a different
governance factor matters at the second branch of the tree. Finally, Meetings is
negatively associated with Q after conditioning on Debt and Board Size. Collectively,
the set of governance factors explains about 9 percent of the variation in Q. This is the
greatest incremental explanatory power from including the set of 13 governance factors
across all six of our dependent variables. However, it is important to note that most of
the governance factors have unexpected signs.
5.6 Over-Investment
5.6.1. Over-Investment, Control Variables and Prior Literature
Our final dependent variable is a setting specific measure, the extent to which a
firm is engaging in sub-optimal investment expenditure. Similar to measures of CEO
compensation, this allows us to look at a specific decision within the firm to gauge the
influence of governance structures on firm decisions.
We measure over-investment using the framework employed in Richardson
(2004). Specifically, over-investment is the residual from the following investment
model:
Investment Expendituret= � + β1Qt-1 + β2Age t-1 + β3Size t-1 + β4Leverage t-1 + β5Cash t-1 +
ΣYear Indicator + ΣIndustry Indicator

35
Investment expenditure is total investment expenditure (calculated as research and
development expenditure (Compustat data item 46) plus capital expenditure (item 128)
plus acquisition expenditure (item 129) less cash receipts from sale of property, plant and
equipment (item 107) less depreciation and amortization (item 125) as a proxy for
maintenance expenditure.
Control variables for the investment model are drawn from the agency cost/free
cash flow literature (e.g., Jensen 1986 and Harford, 1999) as well as the financing
constraint literature (e.g., Hubbard, 1998 and Fazzari, Hubbard and Petersen, 1988). The
control variables include Q (inverse of the Tobin’s Q ratio) measured as the book value
of debt (item 34 and item 9) and equity (item 60) divided by the sum of market value of
equity (item 25 * item199) and the book value of debt (item 34 and item 9), Age
measured as the log of the number of years the firm has been listed on CRSP as of the
start of the year, Size is the log of total assets (item 6) measured at the start of the year,
Leverage is the sum of the book value of short term (item 34) and long term debt (item 9)
deflated by the sum of the book value of total debt and the book value of equity (item 60),
Cash is the balance of cash and short term investments (item 1) deflated by total assets
measured at the start of the year. The regression includes year and industry (2 digit SIC)
fixed effects. All variables in the over-investment model are winsorized at the 2nd and
98th percentiles.
5.6.2 Over-Investment and Governance Factors
Panel B of table 10 reports two OLS regression specifications. First, we look at
the impact of free cash flow on over-investment. Similar to the findings in Richardson
(2004) we find that over-investment is concentrated in forms with positive values of free
36
cash flow. This is consistent with the agency cost explanation for the relation between
investment expenditure and cash flow (Jensen, 1986). Second, we examine the impact of
our 13 governance factors on over-investment. Of the 13 factors we find no significant
associations in the standard OLS specification and collectively the 13 factors contribute
only 1 percent incremental R2. Prior research examining governance factors in isolation
had found some evidence of association with firm level investment (e.g., Gompers, Ishii
and Metrick, 2003 for anti-takeover provisions, Richardson, 2004 for board composition
and institutional ownership and Baysinger, Kosnik and Turk, 1991 for board
composition).
The recursive partitioning results in panel C of table 10 show that Debt, Anti-
Takeover II and Affiliated Ownership have explanatory power for over-investment.
Collectively, these variables are able to explain 3.9 percent of the variation. Interestingly,
debt is positively associated with over-investment. Firms with higher levels of debt tend
to over-invest more. While the economic magnitudes across the three nodes in the first
branch are not great (over-investment ranges from -2 percent of average assets to +1
percent) this relation is opposite to what we would expect if debt-holders were
constraining over-investment related activity (e.g., Jensen, 1986 and Stulz, 1990). Anti-
Takeover II only matters for firms with low levels of Debt, and the positive relation is as
expected. Firms with takeover protection measures tend to over-invest more (e.g.,
Gompers, Ishii and Metrick, 2003). Finally, the relation between Affiliated Ownership
and over-investment is non-linear.
37
5.7 Summary Across the Dependent Variables
We summarize our results in table 11. Panel A lists all 13 governance factors for
each of the dependent variables for both the OLS regression and recursive partitioning
(RP) specifications. If a factor was significant at conventional levels we mark this with
an asterix (∗). If the significant association was (was not) in the expected direction we
mark it with a “Y” (“N”) that is reported in parentheses next to the asterix. Finally, for
those variables with an ambiguous sign we mark them with a “?”.
For the small number of statistically significant governance variables, we found
only minimal explanatory power across the six dependent variables and many of the
governance factors exhibit unexpected signs. Furthermore, there does not appear to be
much consistency (except for Busy Directors) in the significance of governance factors
across the various dependent variables. The incremental R2 for each of the dependent
variables is routinely less than six percent for OLS results and the highest is 9.1 percent
for the recursive partitioning tests for Q (see panel B of table 11). Thus, there is little
explanatory power from the set of governance constructs.
As noted earlier, our tests are based on an assumption that the governance factors
have no impact on the controls (and thus no indirect effects of governance on the
dependent variable) which may create a conservative estimate of the importance of the
governance factors. In panel C of table 11 we report the R2 from three sets of regressions.
First, we report R2CONTROLS which is the R2 from the set of economic determinants only
(this was reported in each of the earlier tables). Second, we report R2GOVERNANCE which is
the R2 from the set of governance factors only (this was not reported in the earlier tables).
Third, we report R2FULL which is the R2 from the set of economic determinants and

38
governance factors (this was reported in each of the earlier tables). With the exception of
CEO compensation and Debt Rating, the governance factors explain very little of the
cross-sectional variation in our dependent variables. With CEO compensation the single
most important governance variable in the governance only specification was Board Size
which is highly correlated with the economic determinant size. And the governance
factors in the Debt Rating specification loaded with opposite signs. In summary, there is
little systematic evidence that governance structures explain variation in a broad set of
variables where the impact of governance, if it exists, should be evident.
6. Summary and Conclusions
The relation between corporate governance and managerial behavior and
organizational performance is of fundamental importance to practitioners, academics and
policy makers. Assumptions and strongly held beliefs about the importance of
governance are shaping the current regulatory climate for the design of governance
structures. Unfortunately, prior work has generated a set of contradictory results and a
consistent set of results has yet to emerge from the academic literature. In this study, we
undertake a comprehensive analysis of governance structures to develop sophisticated
measures of governance and relate these measures to a wide range of outcome variables
designed to capture managerial behavior and organizational performance. We find very
modest evidence that our measures of corporate governance explain these outcome
variables. The incremental explanatory power from the set of governance factors ranges
from 1% to 5.5% for standard OLS multiple regression approaches and from 1.4% to
9.1% for an exploratory recursive partitioning technique. These results indicate that the

39
standard structural indicators of corporate governance that are typically used in academic
research and institutional rating agencies have a very limited ability to explain managerial
decisions and firm valuation. Alternatively, corporate governance may have a relatively
modest impact on the firm.
The interpretation of our results will ultimately rest on the priors of the reader.
For readers who hold strong priors that governance matters, the absence of a strong
relation must be due to either weak measures of governance structures or weak measures
of outcome variables. While such criticisms are valid, they apply equally to prior
research with smaller sample sizes, limited governance variables, limited outcome
variables and statistical techniques that have imposed a very strict structure on the
relation between governance and these outcome variables. Even after our attempt to
broaden the set of firms, governance measures and outcome variables and utilization of
more general statistical techniques we find little evidence that corporate governance
“really matters”.
Our study has several limitations, and it is important to be explicit about these
concerns. First, we use only one year of data in our analysis and this constrains our
ability to generalize to other periods. This limitation is common to prior research
examining corporate governance and managerial behavior. An advantage of our sample
period is that it is after the changes brought about by the Sarbanes-Oxley Act so it reflects
the current state of play for governance attributes.
Second, corporate governance characteristics and managerial behavior are
endogenous variables. We ignore this endogeneity in our analysis and thus our results
are subject to the standard criticisms of potentially biased estimates. Absent clear theory

40
and the identification of truly exogenous instruments it is very difficult to appropriately
incorporate the endogenous relations into our analysis.
Third, as with prior research our empirical analysis may not adequately capture
economic determinants, and/or we may not have accurately captured managerial behavior
through some of our measures such as abnormal accruals and over-investment. Thus, our
results are subject to the criticism of omitted variables and measurement error. However,
to the best of our ability we have included all variables from prior research that have been
shown to be associated with each of our dependent variables. Nevertheless, there is an
unknown degree of measurement error and omitted variables in our empirical analysis.
Finally, although we have attempted to develop a comprehensive set of governance
indicators, we may have missed the key dimensions of this construct.
References Ashbaugh, H., D. W. Collins, R. LaFond, 2004. The Effects of Corporate Governance in Firms’ Credit Ratings. Working Paper, University of Iowa. Bartov, E., F. A. Gul, and J. S. L. Tsui. 2001. Discretionary accruals models and audit qualifications. Journal of Accounting and Economics, 30, 421-452. Baysinger, B. D., R. H. Kosnik, and T. A. Turk. 1991. Effects of board and ownership structure on corporate R&D strategy. Academy of Management Journal, 34, 205-214. Bebchuk, L. A., and A. Cohen, 2004. The costs of entrenched boards. Working paper, Harvard Law School. Bernard, V. L., and D. J. Skinner. 1996. What motivates managers’ choice of discretionary accruals? Journal of Accounting and Economics, 22, 313-325. Bertrand, M., and S. Mullainathen, 2000. Agents with and without principals. Working paper, University of Chicago. Bhagat, S. 2004. Goverance and performance. Working paper, University of Colorado. Bhagat, S., and B. Black, 2002. The non-correlation between board independece and long-term firm performance. Journal of Corporation Law, 27, 2, 231-273. Bhoraj, S., and P. Sengupta, 2004. Effect of Corporate Governance on Bond Ratings and Yields: The Role of Institutional Investors and Outside Directors. Working Paper, Cornell University. Biggs, D., B. de Ville, and E. Suen. 1991. A method of choosing multiway partitions for classification and decision trees,” Journal of Applied Statistics, 18(1), 49-62. Brickley, J., J. Coles and R. Terry, 1994, Outside Directors and the Adoption of Poison Pills. Journal of Financial Economics, 35, 371-390. Bushman, R. M., and A. J. Smith. 2001. Financial accounting information and corporate governance. Journal of Accounting and Economics, 32, 237-334. Byrd, J. and K. Hickman, 1992, Do Outside Directors Monitor Managers? Evidence from Tender Offer Bids. Journal of Financial Economics, 32, 195-207. Conyon, M. J., and A. Florou, 2004. Does Governance Quality Mitigate Horizon Effects? Investment Patterns Surrounding CEO Departures, Working Paper, University of Pennsylvania.

Core, J. E., R. W. Holthausen, and D. F. Larcker, 1999. Corporate governance, chief executive officer compensation and firm performance. Journal of Financial Economics, 51, 371-406. Cremers, M., and V. B. Nair, 2003. Governance Mechanisms and Equity Prices. Working Paper, Yale School of Management. Daines, R., 2001. Does Delaware Law Improve Firm Value? Journal of Financial Economics, 62, 525-558. Daines, R., and M. Klausner. 2001. Do IPO charters maximized firm value? Anti-takeover provisions in IPOs. Journal of Law, Economics and Organization, 17, 83-120. Dechow, Patricia M., Richard G. Sloan, and Amy P. Sweeney. 1995. Detecting Earnings Management. The Accounting Review, 70, 193-225. DeFond, Mark. L., and K. R. Subramanyam. 1998. Auditor Changes and Discretionary Accruals. Journal of Accounting and Economics, 25, 35-67. Faleye, O., V. Mehrotra and R. Morck, 2004. When Labor has a voice in corporate governance. Working paper, Northeastern University. Fazzari, S. M., R. G. Hubbard, and B. C. Petersen. 1988. Financing constraints on corporate investment. Brookings Papers on Economic Activity, 141-195. Ferris, S. P., M. Jagannathan, and A.C. Pritchard, 2003. Too Busy to Mind the Business? Monitoring Directors with Multiple Board Appointments, Journal of Finance, 58, 1087-1111. Frankel, Richard M., Marilyn F. Johnson, and Karen K. Nelson. 2002. The relation between auditor’s fees for non-audit services and earnings management. The Accounting Review, 77, Supplement, 71-105. Gompers, P. A., J. L. Ishii, and A. Metrick, 2003. Corporate Governance and Equity Prices. Quarterly Journal of Economics 118, 107-155. Gompers, P. A., J. L. Ishii, and A. Metrick, 2004. Incentives vs. Control: An analysis of U.S. Dual-class companies. Working paper, University of Pennsylvania. Grice, James W. and Richard J. Harris, “A Comparison of Regression and Loading Weights for the Computation of Factor Scores,” Multivariate Behavioral Research 33(2), 221-247. Hall, B. J., and J. B. Liebman. 1998. Are CEOs really paid like bureaucrats? Quarterly Journal of Economics, 113, 653-691.
Hallock, K., 1997. Reciprocally interlocking boards of directors and executive compensation. Journal of Financial and Quantitative Analysis, 32, 331-44. Harford, J, 1999. Corporate Cash Reserves and Acquisitions. Journal of Finance, 54, 1969-1997. Hubbard, R. G., 1998. Capital-market imperfections and investment. Journal of Economic Literature, 36, 193-225. Jenkins, Nicole T. 2002. Auditor independence, audit committee effectiveness and earnings management. Working paper, Washington University. Jensen, M. C., 1986. Agency Costs and Free Cash Flow, Corporate Finance and Takeovers. American Economic Review, 76, 659-665. Jones, Jennifer. 1991. Earnings Management During Import Relief Investigations. Journal of Accounting Research, 29, 193-228. Kass, G.V., “An Exploratory Technique for Investigating Large Quantities of Categorical Data,” Applied Statistics, 29(2), 1980, 119-127. Klein, A. 1998. Firm Performance and Board Committee Structure. Journal of Law and Economics, 41, 275-303. Klein, April. 2002. Audit committee, board of director characteristics, and earnings management. Journal of Accounting and Economics, 33, 375-400. Klock, M. S., S. A. Mansi, and W. F. Maxwell, 2004. Corporate Governance and the Agency Cost of Debt. Working Paper, George Washington University. Larcker, D.F. 2003. Discussion of ‘Are Executive Stock Options Associated with Future Earnings’. Journal of Accounting and Economics, 36, 91-103. Larcker, D.F., and S. A. Richardson. 2004. Fees paid to audit firms, accrual choices and corporate governance. Journal of Accounting Research, 42, 625-658. Malete, P., and K. L. Fowler. 1992. Effects of board composition and stock ownership on the adoption of ‘poison pills’. Academy of Management Journal, 35, 1010-1035. McNichols, Maureen F. 2000. “Research Design Issues in Earnings Management Studies. Journal of Accounting and Public Policy, 19, 313-345. McNichols, Maureen F. 2002. Discussion of the quality of accruals and earnings: The role of accrual estimation errors. The Accounting Review, 77, Supplement, 61-69.

Mizruchi, M. 2004. Berle and Means Revisited: The Governance and Power of Large US Corporations. Forthcoming, Theory and Society. Morck, R., A. Shleifer, and R. W. Vishny, 1988. Management ownership and market valuation: An empirical analysis, Journal of Financial Economics, 20, 293-315. Morck, R., and F. Yang, 2001. The Mysterious Growing Value of the S&P 500 Membership. Working Paper, University of Alberta. Nunnally, J., Psychometric Theory (New York: McGraw Hill, 1967). O’Reilly, C. A., B. G. Main, and G. S. Crystal. 1988. CEO Compensation as tournament and social comparison: A tale of two theories. Administrative Science Quarterly, 33, 257-274. Richardson, S. A. 2004. Over-investment of free cash flow. Working paper, University of Pennsylvania. Shin, H., and R. Stulz, 2000. Firm Value, Risk and Growth Opportunities, Working Paper, NBER. Shleifer, A. and R. W. Vishny, 1997, A Survey of Corporate Governance. Journal of Finance, 52 (2), 737-783. Stickel, S. E., 2000. Analyst Incentives and the Financial Characteristics of and Returns to Wall Street Darlings and Dogs, Working Paper, La Salle University. Stulz. R. M. 1990. Managerial discretion and optimal financing policies. Journal of Financial Economics, 26, 3-27. Sundaramurthy, C., J. M. Mahoney, and J. T. Mahoney. 1997. Board structure, anti-takeover provisions, and stockholder wealth. Strategic Management Journal, 18, 231-245. Xie, B., W. N. Davidson III, and P. J. Dadalt. 2002. Earnings management and corporate governance: The roles of the board and the audit committee. Working paper, Southern Illinois University. Yermack, D., 1996. Higher Market Valuation of Companies with a Small Board of Directors. Journal of Financial Economics 40, 185-211.

Table 1
Industry composition for our sample of 2,126 firm observations for the fiscal year ending 06/30/2002 through 05/31/2003 for which we are able to obtain corporate
governance information from Equilar and Shark Repellent.
Panel A: Industry Composition Two-digit
SIC Industry Number Percent of Sample
Compustat Composition
1 Crops 2 0.1 0.2 7 Agriculture Services 2 0.1 0.1
10 Ores 6 0.3 1.2 12 Coal 5 0.2 0.2 13 Oil & Gas 56 2.6 4.0 14 Quarry 5 0.2 0.2 15 Building – Light 9 0.4 0.6 16 Building – Heavy 4 0.2 0.2 17 Construction 3 0.1 0.3 20 Food 21 1.0 1.9 21 Tobacco 5 0.2 0.1 22 Textile Mill 6 0.3 0.7 23 Apparel 10 0.5 0.9 24 Lumber 11 0.5 0.4 25 Furniture 10 0.5 0.5 26 Paper 17 0.8 0.8 27 Printing 25 1.2 1.2 28 Chemicals 191 9.0 5.0 29 Petroleum 12 0.6 0.4 30 Rubber 15 0.7 1.1 31 Leather 6 0.3 0.2 32 Stone 9 0.4 0.6 33 Metal Work – Basic 29 1.4 1.1 34 Metal Work – Fabrication 22 1.0 1.4 35 Industrial 96 4.5 5.2 36 Electrical 128 6.0 5.5 37 Transport – Equipment 40 1.9 1.6 38 Instruments 107 5.0 4.7 39 Misc. Manufacturing 17 0.8 1.0 40 Railroad 8 0.4 0.2 42 Motor freight 12 0.6 0.6 44 Water Transport 8 0.4 0.3 45 Air Transport 16 0.8 0.6 47 Transport – Services 11 0.5 0.3 48 Communications 70 3.3 3.8 49 Utilities 76 3.6 3.0 50 Durables – Wholesale 31 1.5 2.3

Two-digit SIC Industry Number Percent of
Sample Compustat
Composition
51 NonDurables – Wholesale 17 0.8 1.4 52 Garden 5 0.2 0.2 53 General Stores 15 0.7 0.6 54 Food Stores 9 0.4 0.6 55 Auto Dealers 13 0.6 0.3 56 Apparel – Retail 30 1.4 0.6 57 Home Equipment 15 0.7 0.5 58 Eating 20 0.9 1.4 59 Misc. Retail 45 2.1 1.7 60 Depositories 193 9.1 7.9 61 Non-depositories 14 0.7 1.5 62 Brokers 25 1.2 1.0 63 Insurance 74 3.5 2.0 64 Ins Agents 15 0.7 0.5 65 Real Estate 8 0.4 1.3 67 Trusts 109 5.1 6.9 70 Hotels 7 0.3 0.5 72 Personal Services 6 0.3 0.3 73 Business Services 285 13.4 11.0 75 Auto Repair 2 0.1 0.2 78 Movies 6 0.3 0.9 79 Amusements 16 0.8 1.1 80 Health 35 1.6 1.7 81 Legal 1 0.0 0.0 82 Educational 5 0.2 0.3 83 Social 3 0.1 0.2 87 Engineering – Retail 47 2.2 1.8 99 Nonclassifiable 4 0.2 1.0
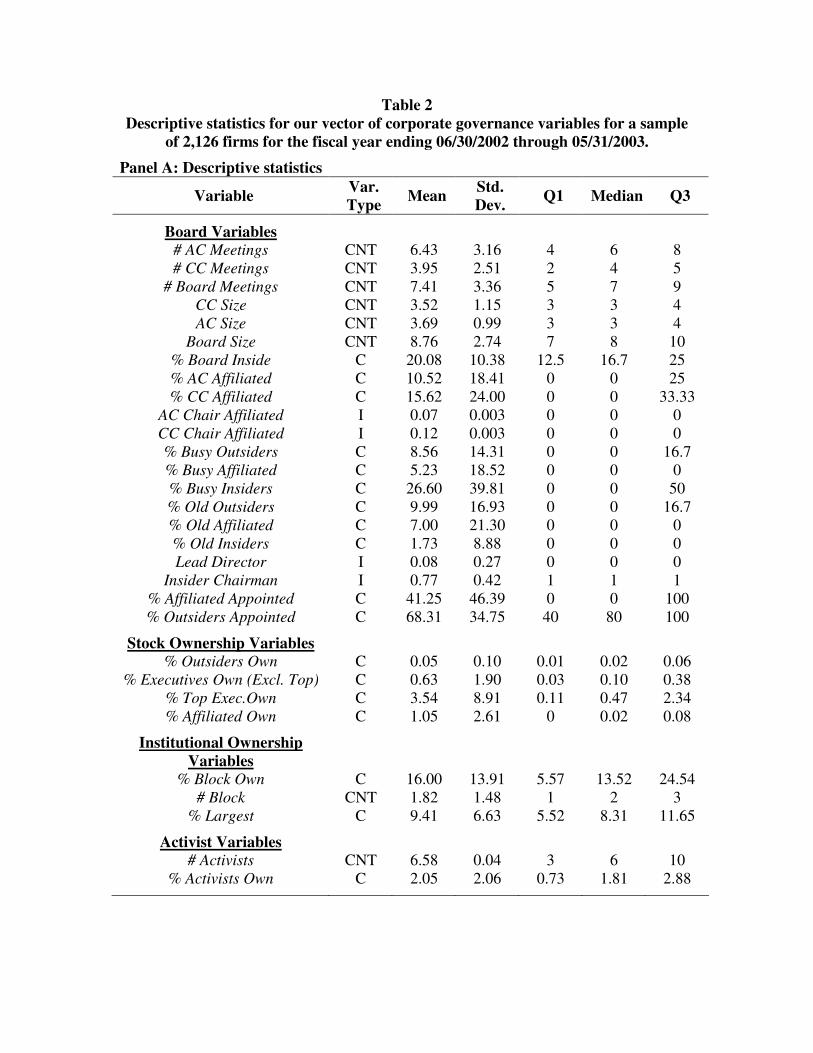
Table 2 Descriptive statistics for our vector of corporate governance variables for a sample
of 2,126 firms for the fiscal year ending 06/30/2002 through 05/31/2003.
Panel A: Descriptive statistics
Variable Var. Type Mean Std.
Dev. Q1 Median Q3
Board Variables # AC Meetings CNT 6.43 3.16 4 6 8 # CC Meetings CNT 3.95 2.51 2 4 5
# Board Meetings CNT 7.41 3.36 5 7 9 CC Size CNT 3.52 1.15 3 3 4 AC Size CNT 3.69 0.99 3 3 4
Board Size CNT 8.76 2.74 7 8 10 % Board Inside C 20.08 10.38 12.5 16.7 25 % AC Affiliated C 10.52 18.41 0 0 25 % CC Affiliated C 15.62 24.00 0 0 33.33
AC Chair Affiliated I 0.07 0.003 0 0 0 CC Chair Affiliated I 0.12 0.003 0 0 0 % Busy Outsiders C 8.56 14.31 0 0 16.7 % Busy Affiliated C 5.23 18.52 0 0 0 % Busy Insiders C 26.60 39.81 0 0 50 % Old Outsiders C 9.99 16.93 0 0 16.7 % Old Affiliated C 7.00 21.30 0 0 0 % Old Insiders C 1.73 8.88 0 0 0 Lead Director I 0.08 0.27 0 0 0
Insider Chairman I 0.77 0.42 1 1 1 % Affiliated Appointed C 41.25 46.39 0 0 100 % Outsiders Appointed C 68.31 34.75 40 80 100
Stock Ownership Variables % Outsiders Own C 0.05 0.10 0.01 0.02 0.06
% Executives Own (Excl. Top) C 0.63 1.90 0.03 0.10 0.38 % Top Exec.Own C 3.54 8.91 0.11 0.47 2.34 % Affiliated Own C 1.05 2.61 0 0.02 0.08
Institutional Ownership Variables
% Block Own C 16.00 13.91 5.57 13.52 24.54 # Block CNT 1.82 1.48 1 2 3
% Largest C 9.41 6.63 5.52 8.31 11.65
Activist Variables # Activists CNT 6.58 0.04 3 6 10
% Activists Own C 2.05 2.06 0.73 1.81 2.88

Variable Var. Type Mean Std.
Dev. Q1 Median Q3
Debt Variables Debt to Market C 0.89 2.16 0.02 0.25 0.84
Preferred to Market C 0.10 1.71 0 0 0
Anti-Takeover Variables Staggered Board I 0.63 0.48 0 1 1
Supermajority I 0.24 0.43 0 0 0 DE Incorporated I 0.61 0.49 0 1 1 Unequal Voting I 0.09 0.29 0 0 0
Poison Pill I 0.51 0.50 0 1 1
Unionization Union I 0.22 0.41 0 0 0
Variable Type refers to the nature of the variable: I (indicator variable), C (continuous variable) CNT (count variable). Board Variables # AC Meetings is the number of audit committee meetings (Equilar data). # CC Meetings is the number of compensation committee meetings (Equilar data). # Board Meetings is the number of board meetings (Equilar data). CC Size is the number of directors serving on the compensation committee (Equilar data). AC Size is the number of directors serving on the audit committee (Equilar data). Board size is the number of directors serving on the board (Equilar data). % Board Inside is the fraction of board comprised of insider (executive) directors (Equilar data). % AC Affiliated is the fraction of the audit committee that is comprised of affiliated (grey) directors. Any outside director who is a former executive or who is mentioned in the “certain transactions” section of the proxy statement is classified as affiliated (Equilar data). % CC Affiliated is the fraction of the compensation committee that is comprised of affiliated (grey) directors (Equilar data). AC Chair Affiliated is an indicator variable equal to one if the chairperson of the audit committee is affiliated and zero otherwise. CC Chair Affiliated is an indicator variable equal to one if the chairperson of the compensation committee is affiliated and zero otherwise. % Busy Outsiders is the fraction of outside directors who serve on 4 or more other boards (Equilar data). % Busy Affiliated is the fraction of affiliated directors who serve on 4 or more other boards (Equilar data). % Busy Insiders is the fraction of insider directors who serve on 2 or more other boards (Equilar data). % Old Outsiders is the fraction of outside directors that are older than 70 (Equilar data). % Old Affiliated is the fraction of affiliated directors that are older than 70 (Equilar data). % Old Insiders is the fraction of inside directors that are older than 70 (Equilar data). Lead Director is an indicator variable equal to one of there is a lead director on the board and zero otherwise (Equilar data). Insider Chairman is an indicator variable equal to one if an executive holds the position of chairperson of the board and zero otherwise (Equilar data). % Affiliated Appointed is the fraction of affiliated directors that were appointed by existing insiders. This variable is set to zero if there are no affiliated directors (Equilar data). % Outsiders Appointed is the fraction of outside directors that were appointed by existing insiders. This variable is set to zero if there are no outside directors (Equilar data).

Stock Ownership Variables % Outsiders Own is the fraction of outstanding shares held by the average outside director (Equilar data). % Executives Own (Excl. Top) is the fraction of outstanding shares held by the average executive director but excludes the holdings of the tope executive. (Equilar data). % Top Exec. Own is the fraction of outstanding shares held by the top executive (Equilar data). % Affiliated Own is the fraction of outstanding shares held by the average affiliated director (Equilar data). All stock ownership variables include only shares of common stock held and exclude options. Institutional Ownership Variables % Block Own is the fraction of outstanding shares owned by block-holders (Spectrum data). A Block-holder is defined as a shareholder who holds more than 5% of outstanding shares. # Block is the number of block-holders (Spectrum data). % Largest is the shareholding of the largest institution (Spectrum data). Activist Variables # Activists is the number of activist institutions holding shares. An activist is defined as per Cremers and Nair (2003). Specifically, the following activist public pension finds are classified as activists: institutions with the following manager numbers on Spectrum are coded as activists: California Public Employees Retirement System (12000), California State Teachers Retirement (12100 and 12120), Colorado Public Employees Retirement Association (18740), Florida State Board of Administration (38330), Illinois State Universities Retirement System (81590), Kentucky Teachers Retirement System (49050), Maryland State Retirement and Pension System (54360), Michigan State Treasury (57500), Montana Board of Investment (58650), Education Retirement Board New Mexico (63600), New York State Common Retirement Fund (63850), New York State Teachers Retirement System (63895), Ohio School Employees Retirement System (66550), Ohio School Employees Retirement System (66610), Ohio State Teachers Retirement System (66635), Texas Teachers Retirement System (82895 and 83360), Virginia Retirement System (90803), State of Wisconsin Investment Board (93405). Manager numbers are in parentheses (Spectrum data). % Activists Own is the fraction of outstanding shares held by activist institutions (Spectrum data). Debt Variables Debt to Market is the ratio of book value of debt (Compustat data item 9 plus data item 34) to the market value of equity (Compustat data item 199 * data item 25). Preferred to Market is the ratio of book value of preferred equity (Compustat data item 130) to the market value of equity (Compustat data item 199 * data item 25). Anti-Takeover Variables Staggered Board is an indicator variable equal to one if the firm has a staggered board and zero otherwise (Shark Repellant data). Supermajority is an indicator variable equal to one if the firm has a supermajority provision for takeovers and zero otherwise (Shark Repellant data). DE Incorporated is an indicator variable equal to one if the firm is incorporated in Delaware and zero otherwise (Shark Repellant data). Unequal Voting is an indicator variable equal to one if there are unequal voting rights across common shareholders and zero otherwise (Shark Repellant data). Poison Pill is an indicator variable equal to one if the firm has adopted a poison pill and zero otherwise (Shark Repellant data). Unionization Union is an indicator variable equal to one if the firm has a unionized labor force and zero otherwise. This variable is hand collected via a search on Lexis-Nexis using the following search routine: “Employ! w/30 (labor union! or collective bargaining)”.

Table 3
Exploratory principal component analysis (PCA). Factors are computed using PCA where we retain all factors with an eigen-value
greater than one. This table reports loadings on individual governance variables for each of the 13 factors. We retain variables where the absolute value of the loading exceeds 0.4 and are significant at conventional levels (using boot-strapped standard
errors).
Factor Component Loading
Standard Error Factor Component
Loading Standard
Error
Board Size Anti-Takeover II CC Size 0.867 0.029 Unequal Voting -0.414 0.156 AC Size 0.856 0.032 Poison Pill 0.489 0.189
Board Size 0.716 0.026 Staggered Board 0.696 0.185
BLOCK Old Directors % Block Own 0.989 0.003 % Old Outsiders 0.694 0.165
# Block 0.847 0.012 % Old Affiliated 0.609 0.114 % Largest 0.808 0.011 % Old Insiders 0.556 0.162
Affiliated Presence Debt
% AC Affiliated 0.819 0.018 Debt to Market 0.806 0.212
% CC Affiliated 0.662 0.052 Preferred to Market 0.793 0.200
AC Chair Affiliated 0.793 0.036
CC Chair Affiliated 0.573 0.065 Affiliated Ownership
% Affiliated Own 0.655 0.160 Insider Influence
% Affiliated Appointed 0.702 0.062 Insider
Ownership
% Outsiders Appointed 0.786 0.048 % Executives
Own (Excl. Top) 0.803 0.088
Insider Chairman 0.478 0.105 % Top Exec. 0.768 0.082
Anti-Takeover I Busy Directors Supermajority 0.814 0.386 # Activists 0.439 0.069
DE Incorporated -0.777 0.401 % Busy Outsiders 0.429 0.129 % Busy Affiliated 0.569 0.178
Meetings % Busy Insiders 0.583 0.160 # AC Meetings 0.779 0.032 Union 0.505 0.148 # CC Meetings 0.668 0.040
# Board Meetings 0.711 0.038 Lead Director Lead Director 0.856 0.358
All variables are as defined in table 2.

Table 4 Descriptive Statistics and Correlations for the Factor Scores.
Panel A: Descriptive Statistics
Factor Mean Std. Dev. Q1 Median Q3
Board Size 0.000 0.835 -0.597 -0.233 0.395 BLOCK 0.000 0.884 -0.628 -0.096 0.557
Affiliated Presence 0.000 0.735 -0.467 -0.467 0.246 Insider Influence 0.000 0.713 -0.495 0.118 0.669 Anti-Takeover I 0.516 1.341 0.791 0.791 0.791
Meetings 0.000 0.731 -0.488 -0.111 0.358 Anti-Takeover II 0.809 1.798 0.769 0.972 1.741
Old Directors 0.000 0.650 -0.371 -0.371 0.121 Debt 0.000 0.826 -0.229 -0.175 -0.034
Affiliated Ownership 0.000 1.000 -0.403 -0.394 -0.083 Insider Ownership 0.000 0.843 -0.343 -0.286 -0.048
Busy Directors 0.000 0.579 -0.473 -0.117 0.332 Lead Director 0.000 1.000 -0.288 -0.288 -0.288
Factor scores are calculated by aggregating the standardized components with the exception of the two anti-takeover factors. These factors both have substitute components. We calculate the anti-takeover factor scores by aggregating the components in a manner that removes the substitutability across components. For example, with Anti-Takeover I if both components are equal to one, we add the standardized components rather than subtracting one from the other.

Panel B: Correlations – Pearson (Spearman) correlations are presented in the upper(lower) diagonal.
1 2 3 4 5 6 7 8 9 10 11 12 13
Board Size (1) -- -.147 (.000)
-.069 (.000)
-.052 (.017)
.006 (.779)
.198 (.000)
.066 (.002)
.023 (.285)
.049 (.023)
-.135 (.000)
-.167 (.000)
.318 (.000)
.066 (.002)
BLOCK (2) -.126 (.000) -- -.055
(.011) -.042 (.053)
.029 (.186)
-.057 (.008)
.068 (.002)
-.025 (.253)
-.014 (.508)
-.032 (.141)
-.021 (.339)
.027 (.217)
.041 (.056)
Affiliated Presence (3) -.062 (.004)
-.077 (.000) -- .107
(.000) -.011 (.616)
-.044 (.044)
-.058 (.007)
.095 (.000)
.150 (.000)
.272 (.000)
.071 (.001)
-.102 (.000)
-.047 (.029)
Insider Influence (4) -.081 (.000)
-.033 (.134)
.191 (.000) -- -.010
(.640) -.115 (.000)
.005 (.816)
.100 (.000)
-.008 (.705)
-.012 (.578)
.198 (.000)
.005 (.833)
.006 (.771)
Anti-Takeover I (5) .074 (.001)
.012 (.572)
-.045 (.037)
-.014 (.524) -- .063
(.003) .079
(.000) -.017 (.446)
.025 (.248)
-.015 (.482)
-.036 (.093)
.049 (.023)
.022 (.312)
Meetings (6) .249 (.000)
-.042 (.054)
-.069 (.001)
-.123 (.000)
.064 (.003) -- .061
(.005) -.054 (.012)
.111 (.000)
-.070 (.001)
-.127 (.000)
.135 (.000)
.079 (.000)
Anti-Takeover II (7) .123 (.000)
.107 (.000)
-.091 (.000)
-.022 (.311)
.080 (.000)
.075 (.001) -- .000
(.996) .043
(.049) -.069 (.001)
.061 (.005)
.062 (.004)
-.040 (.063)
Old Directors (8) .086 (.000)
-.044 (.042)
.063 (.004)
.061 (.005)
-.012 (.587)
-.045 (.039)
-.013 (.547) -- .007
(.731) .008
(.729) .067
(.002) -.016 (.475)
-.032 (.140)
Debt (9) .340 (.000)
-.043 (.048)
.000 (.983)
-.005 (.825)
.043 (.049)
.175 (.000)
.079 (.000)
.075 (.001) -- .094
(.000) .022
(.321) -.015 (.480)
-.008 (.724)
Affiliated Ownership (10) -.127 (.000)
-.052 (.016)
.574 (.000)
.133 (.000)
-.037 (.086)
-.112 (.000)
-.106 (.000)
.106 (.000)
-.018 (.419) -- .040
(.067) -.102 (.000)
-.031 (.157)
Insider Ownership (11) -.271 (.000)
-.007 (.730)
.090 (.000)
.325 (.000)
-.019 (.390)
-.222 (.000)
-.018 (.406)
.127 (.000)
-.019 (.372)
.131 (.000) -- -.154
(.000) -.056 (.010)
Busy Directors (12) .328 (.000)
.092 (.000)
-.120 (.000)
-.034 (.121)
.061 (.005)
.160 (.000)
.127 (.000)
.000 (.988)
.148 (.000)
-.178 (.000)
-.310 (.000) -- .098
(.000)
Lead Director (13) .085 (.000)
.052 (.016)
-.056 (.010)
-.007 (.730)
.027 (.214)
.087 (.000)
-.032 (.139)
-.026 (.224)
.034 (.120)
-.066 (.002)
-.079 (.000)
.115 (.000) --

Table 5 Descriptive statistics for measures of abnormal accruals and ordinary least squares
and recursive partitioning techniques to examine the explanatory power of governance factors for abnormal accruals. The sample consists of 1,497 firm
observations for the fiscal year ending 06/30/2002 through 05/31/2003 for which we are able to obtain corporate governance information from Equilar and Shark
Repellent and accrual information from Compustat. Panel A: Descriptive statistics
Variable Mean Std. Dev. Q1 Median Q3
Abnormal Accruals 0.005 0.100 -0.024 0.016 0.052 |Abnormal Accruals| 0.062 0.079 0.018 0.042 0.076
Panel B: Ordinary Least Squares
Abnormal Accrualst = � +ΣβGovernance Factorst + εt
Abnormal Accruals |Abnormal Accruals| Independent Variable
Predicted Sign ββββ t-statistic ββββ t-statistic
Intercept 0.003 1.19 0.060 27.96 Board Size + 0.001 0.26 -0.011 -3.53
BLOCK - 0.006 1.82 -0.004 -1.67 Affiliated Presence + -0.002 -0.48 0.004 1.30
Insider Influence + 0.002 0.52 0.001 0.27 Anti-Takeover I + 0.008 2.89 -0.008 -3.63
Meetings +/- 0.000 0.03 0.004 1.42 Anti-Takeover II + 0.000 -0.18 0.002 1.19
Old Directors + 0.002 0.51 -0.006 -1.70 Debt - -0.008 -1.20 -0.009 -1.69
Affiliated Ownership +/- -0.003 -0.99 0.004 1.67
Insider Ownership +/- 0.004 1.45 -0.001 -0.35
Busy Directors + 0.014 2.75 -0.014 -3.80 Lead Director - -0.004 -0.04 0.002 0.87
Adjusted R2 0.013 0.055 F-stat 2.48 7.71
The accrual model is estimated using the Jones (1991) technique of decomposing total accruals into a normal (expected) and abnormal (unexpected) component. The method of decomposition is as follows: TA = α + β1(∆Sales-∆REC) + β2PPE + β3BM + β4CFO + ε

TA is the difference between operating cash flows (item 308) and income before extraordinary items (item 123) as reported on the statement of cash flows. ∆Sales is the change in sales (item 12) for the year. ∆REC is the change in receivables reported on the statement of cash flows (item 302) for the year. PPE is the gross amount of property, plant and equipment (item 7). CFO is the operating cash flows (item 308). All variables used in the abnormal accrual model (except BM) are scaled by average total assets using assets from the start and end of the fiscal year. The regression is run for every 2 digit SIC group in the sample with a requirement of at least 10 observations in each group. Independent variables in the accrual model are all winsorized to be no greater than one in absolute value, with the exception of BM that is winsorized at the extreme two percentiles (i.e., values less (greater) than the 2nd (98th) percentile are set equal to the value of the 2nd (98th) percentile). Abnormal Accruals is the residual from the above equation, and |Abnormal Accruals| is the absolute value of the residual from the above equation.

Panel C: Recursive Partitioning for Abnormal Accruals: 1.40% of total variation explained by governance factors

Panel D: Recursive Partitioning for |Abnormal Accruals|: 4.98% of total variation explained by governance factors

Table 6 Descriptive statistics for measures of analyst recommendations and ordinary least
squares and recursive partitioning techniques to examine the explanatory power of governance factors for analyst recommendations. The sample consists of 1,495 firm observations for the fiscal year ending 06/30/2002 through 05/31/2003 for which we
are able to obtain corporate governance information from Equilar and Shark Repellent and recommendation data and control variables from Thomson Financial
and CRSP. Panel A: Descriptive statistics
Variable Mean Std. Dev. Q1 Median Q3
Recommendation 2.45 0.64 2 2.48 2.94
Panel B: Ordinary Least Squares
Recommendationt = � +ΣγControls + ΣβGovernance Factorst + εt
Controls Only Full Model Independent
Variable Predicted
Sign ββββ t-statistic ββββ t-statistic
Intercept 2.183 79.06 2.182 70.77 BM + 0.289 8.45 0.287 8.03
EMOM - -0.040 -3.46 -0.042 -3.63 PMOM - -0.348 -5.99 -0.327 -5.60
Board Size + 0.026 1.04 BLOCK - 0.009 0.46
Affiliated Presence + 0.036 1.56 Insider Influence + -0.001 -0.05 Anti-Takeover I + 0.007 0.41
Meetings +/- 0.080 3.60 Anti-Takeover II + 0.007 0.66
Old Directors + -0.052 -2.04 Debt - 0.006 0.15
Affiliated Ownership +/- 0.028 1.60
Insider Ownership +/- 0.049 2.68 Busy Directors + 0.100 3.34 Lead Director - -0.010 -0.67
Adjusted R2 0.119 0.140 F-stat 68.29 16.15
Incremental R2 from Governance Factors 0.026 F-stat 3.41

Analyst recommendation is collected from Thomson Financial First Call database. We use the mean consensus recommendation as at the end of the fiscal year. Recommendations are on a 5 point scale as follows (1 – strong by, 2 – buy, 3 – hold, 4 – sell, 5 – strong sell). Control variables for the recommendation analysis include BM (book-to-market) calculated as the book value of common equity (Compustat data item 60) divided by the market value of common equity (item 25 * item 199), EMOM (earnings momentum) calculated as the difference between the most recent median earnings forecast and last years earnings deflated by the absolute value of last years earnings, and PMOM (price momentum) calculated as 6 month calendar return leading up to the recommendation. Both EMOM and PMOM are measured such that their values are publicly available at the time of the recommendation that is issued at the end of the fiscal year. These control variables are chosen from Stickel (2000) and all are winsorized at the extreme two percentiles (i.e., values less (greater) than the 2nd (98th) percentile are set equal to the value of the 2nd (98th) percentile).

Pane
l C: R
ecur
sive
Par
titio
ning
for
Rec
omm
enda
tions
: 2.8
4% o
f tot
al v
aria
tion
expl
aine
d by
gov
erna
nce
fact
ors
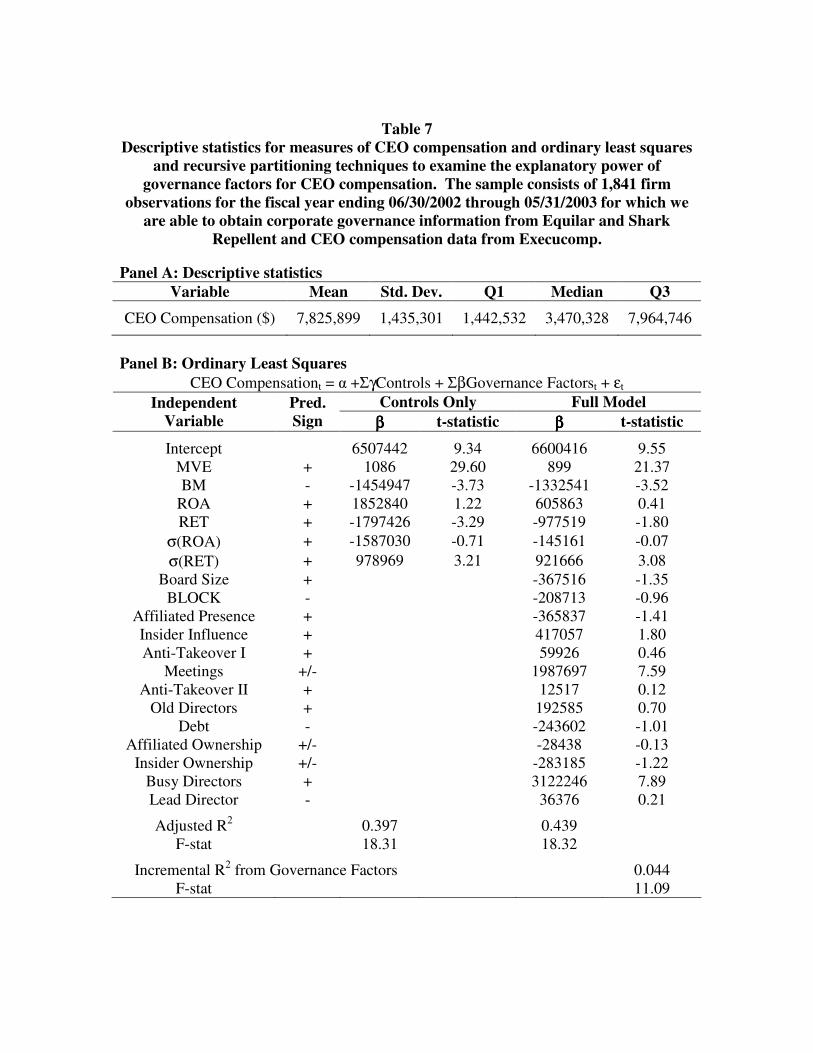
Table 7 Descriptive statistics for measures of CEO compensation and ordinary least squares
and recursive partitioning techniques to examine the explanatory power of governance factors for CEO compensation. The sample consists of 1,841 firm
observations for the fiscal year ending 06/30/2002 through 05/31/2003 for which we are able to obtain corporate governance information from Equilar and Shark
Repellent and CEO compensation data from Execucomp. Panel A: Descriptive statistics
Variable Mean Std. Dev. Q1 Median Q3
CEO Compensation ($) 7,825,899 1,435,301 1,442,532 3,470,328 7,964,746
Panel B: Ordinary Least Squares
CEO Compensationt = � +ΣγControls + ΣβGovernance Factorst + εt
Controls Only Full Model Independent Variable
Pred. Sign ββββ t-statistic ββββ t-statistic
Intercept 6507442 9.34 6600416 9.55 MVE + 1086 29.60 899 21.37 BM - -1454947 -3.73 -1332541 -3.52
ROA + 1852840 1.22 605863 0.41 RET + -1797426 -3.29 -977519 -1.80
σ(ROA) + -1587030 -0.71 -145161 -0.07 σ(RET) + 978969 3.21 921666 3.08
Board Size + -367516 -1.35 BLOCK - -208713 -0.96
Affiliated Presence + -365837 -1.41 Insider Influence + 417057 1.80 Anti-Takeover I + 59926 0.46
Meetings +/- 1987697 7.59 Anti-Takeover II + 12517 0.12
Old Directors + 192585 0.70 Debt - -243602 -1.01
Affiliated Ownership +/- -28438 -0.13 Insider Ownership +/- -283185 -1.22
Busy Directors + 3122246 7.89 Lead Director - 36376 0.21
Adjusted R2 0.397 0.439 F-stat 18.31 18.32
Incremental R2 from Governance Factors 0.044 F-stat 11.09

CEO compensation is calculated using data from Execucomp. It is the total dollar value of all compensation received by the CEO including salary, bonus, the Black-Scholes value of stock options, restricted stock grants, target value for performance plans and miscellaneous other pay (including matching contributions for deferred compensation, life insurance, disclosed perquisities etc.). Control variables include MVE (market value of equity), BM (book-to-market) calculated as the book value of common equity (Compustat data item 60) divided by the market value of common equity (item 25 * item 199), ROA (return on assets) calculated as net income (item18) deflated by average total assets, RET (12 month return) calculated as the change in price inclusive of dividends for the fiscal period, σ(ROA) is the standard deviation of ROA using at least 3 and up to 5 years of prior data, and σ(RET) is the standard deviation of RET using at least 3 and up to 5 years of prior data. The total compensation variable and all control variables are winsorized at the extreme two percentiles (i.e., values less (greater) than the 2nd (98th) percentile are set equal to the value of the 2nd (98th) percentile). We also include a vector of industry fixed effects (2 digit SIC) in the CEO compensation regression.
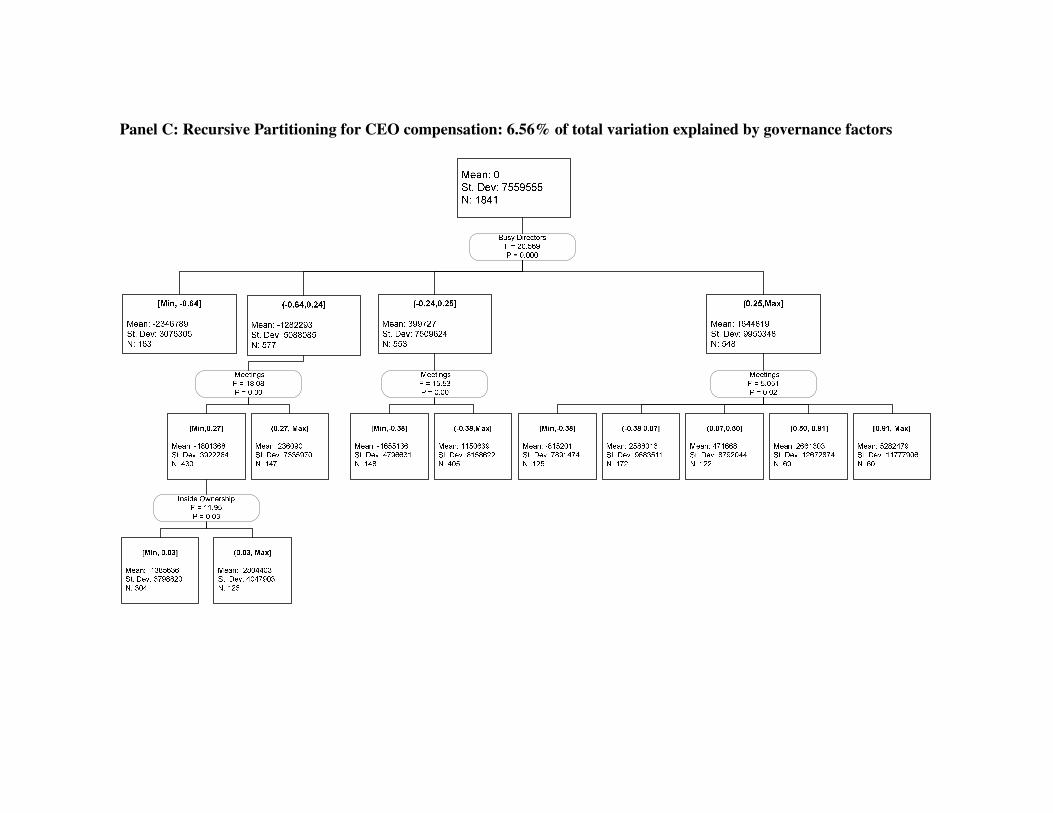
Panel C: Recursive Partitioning for CEO compensation: 6.56% of total variation explained by governance factors

Table 8 Descriptive statistics for measures of debt ratings and ordinary least squares and
recursive partitioning techniques to examine the explanatory power of governance factors for debt ratings. The sample consists of 880 firm observations for the fiscal
year ending 06/30/2002 through 05/31/2003 for which we are able to obtain corporate governance information from Equilar and Shark Repellent and debt
rating control variables from Compustat. Panel A: Descriptive statistics
Variable Mean Std. Dev. Q1 Median Q3
Debt Rating -3.68 1.15 -3 -4 -4
Panel B: Ordinary Least Squares
Debt Ratingt = � +ΣγControls + ΣβGovernance Factorst + εt
Controls Only Full Model Independent Variable
Pred. Sign ββββ t-statistic ββββ t-statistic
Intercept -1.057 -6.28 -1.450 -7.50 Leverage + 0.959 6.65 0.840 5.94
ROA - -4.757 -9.83 -4.384 -9.22 Interest Coverage - 0.079 2.17 0.076 2.14
LOSS + 0.259 2.95 0.206 2.41 SIZE - -0.360 -20.44 -0.296 -12.99
Subordinated Debt + 0.295 4.85 0.227 3.72 Capital Intensity - -0.188 -3.00 -0.083 -1.30
Financial or Utilities - -0.244 -3.86 -0.220 -3.39 BM -/+ 0.247 5.73 0.217 5.12
Board Size + -0.140 -4.07 BLOCK - 0.055 1.89
Affiliated Presence + 0.031 0.84 Insider Influence + 0.016 0.45 Anti-Takeover I + -0.091 -3.88
Meetings +/- 0.119 3.53 Anti-Takeover II + -0.023 -1.52
Old Directors + 0.032 0.88 Affiliated Ownership +/- -0.013 -0.48
Insider Ownership +/- 0.035 0.90 Busy Directors + -0.174 -3.55 Lead Director - 0.031 1.54
Adjusted R2 0.605 0.634 F-stat 150.75 73.48
Incremental R2 from Governance Factors 0.034 F-stat 6.81
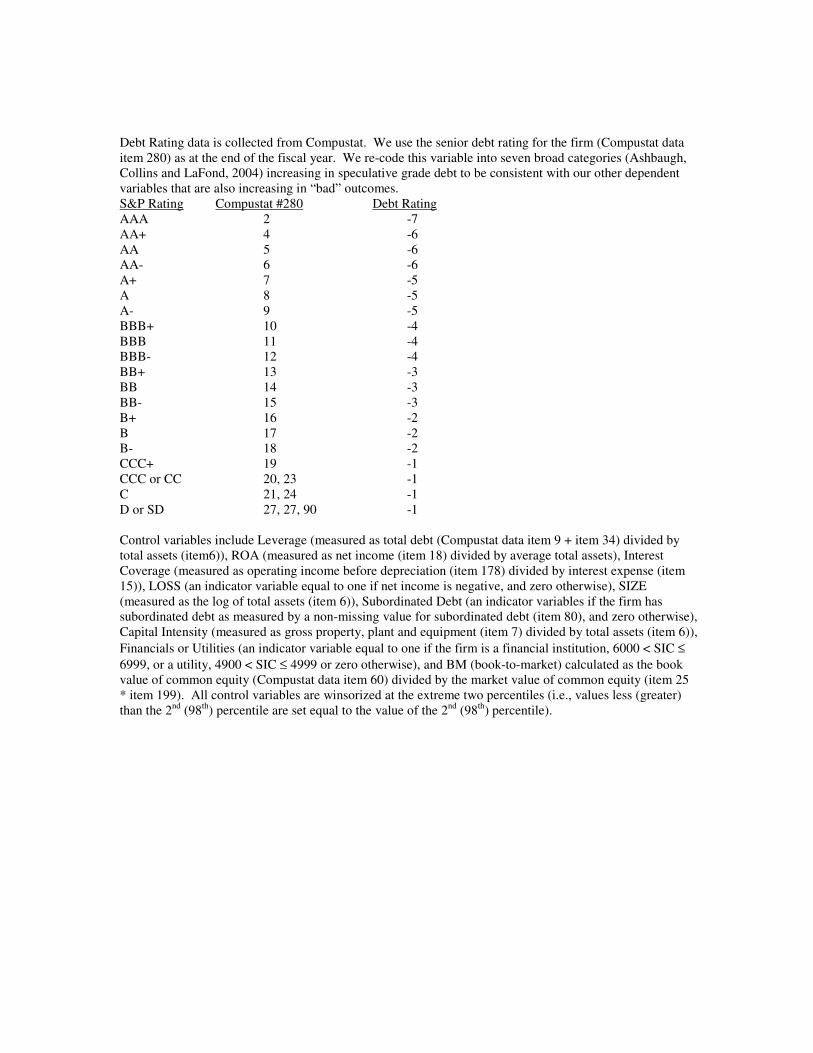
Debt Rating data is collected from Compustat. We use the senior debt rating for the firm (Compustat data item 280) as at the end of the fiscal year. We re-code this variable into seven broad categories (Ashbaugh, Collins and LaFond, 2004) increasing in speculative grade debt to be consistent with our other dependent variables that are also increasing in “bad” outcomes. S&P Rating Compustat #280 Debt Rating AAA 2 -7 AA+ 4 -6 AA 5 -6 AA- 6 -6 A+ 7 -5 A 8 -5 A- 9 -5 BBB+ 10 -4 BBB 11 -4 BBB- 12 -4 BB+ 13 -3 BB 14 -3 BB- 15 -3 B+ 16 -2 B 17 -2 B- 18 -2 CCC+ 19 -1 CCC or CC 20, 23 -1 C 21, 24 -1 D or SD 27, 27, 90 -1 Control variables include Leverage (measured as total debt (Compustat data item 9 + item 34) divided by total assets (item6)), ROA (measured as net income (item 18) divided by average total assets), Interest Coverage (measured as operating income before depreciation (item 178) divided by interest expense (item 15)), LOSS (an indicator variable equal to one if net income is negative, and zero otherwise), SIZE (measured as the log of total assets (item 6)), Subordinated Debt (an indicator variables if the firm has subordinated debt as measured by a non-missing value for subordinated debt (item 80), and zero otherwise), Capital Intensity (measured as gross property, plant and equipment (item 7) divided by total assets (item 6)), Financials or Utilities (an indicator variable equal to one if the firm is a financial institution, 6000 < SIC ≤ 6999, or a utility, 4900 < SIC ≤ 4999 or zero otherwise), and BM (book-to-market) calculated as the book value of common equity (Compustat data item 60) divided by the market value of common equity (item 25 * item 199). All control variables are winsorized at the extreme two percentiles (i.e., values less (greater) than the 2nd (98th) percentile are set equal to the value of the 2nd (98th) percentile).

Panel C: Recursive Partitioning for Debt Ratings: 7.88% of total variation explained by governance factors

Table 9 Descriptive statistics for measures of Q and ordinary least squares and recursive
partitioning techniques to examine the explanatory power of governance factors for Q. The sample consists of 1,691 firm observations for the fiscal year ending
06/30/2002 through 05/31/2003 for which we are able to obtain corporate governance information from Equilar and Shark Repellent and Q related control
variables from Compustat. Panel A: Descriptive statistics
Variable Mean Std. Dev. Q1 Median Q3
Q 0.71 0.36 0.45 0.70 0.93
Panel B: Ordinary Least Squares
Q = � +ΣγControls + ΣβGovernance Factorst + εt
Controls Only Full Model Independent Variable
Pred. Sign ββββ t-statistic ββββ t-statistic
Intercept 0.719 10.91 0.596 7.53 SIZE + 0.034 4.22 0.052 5.50
Log(Age) - -0.046 -4.18 -0.048 -4.14 SP500 - -0.184 -6.29 -0.167 -5.58
RD - -1.003 -7.84 -0.965 -7.46 # Segments + 0.006 1.01 0.007 1.16
ROAt - -0.723 -10.55 -0.717 -10.29 ROAt-1 - 0.084 1.35 0.089 1.42 ROAt-2 - 0.098 1.68 0.071 1.20
Board Size + -0.020 -1.36 BLOCK - 0.032 3.38
Affiliated Presence + 0.004 0.35 Insider Influence + 0.002 0.18 Anti-Takeover I + 0.017 1.88
Meetings +/- 0.010 0.83 Anti-Takeover II + 0.011 2.11
Old Directors + -0.008 -0.62 Debt - -0.008 -0.84
Affiliated Ownership +/- 0.005 0.52 Insider Ownership +/- -0.004 -0.39
Busy Directors + -0.067 -3.36 Lead Director - 0.004 0.50
Overall Model R2 0.206 0.215 F-stat 7.08 6.46
Incremental R2 from Governance Factors 0.015 F-stat 2.49

Q is calculated as the sum of book value of debt (Compustat item 9 + item 34) and the book value of equity (item 60) deflated by the sum of the book value of debt and the market value of equity (item 25 * item199). Our control variables include SIZE (measured as the log of total assets (item 6)), Log(Age) (is the log of the number of months that the firm has been listed on a US exchange as reported in CRSP), SP500 (an indicator variable equal to one if the firm is a member of the S&P 500 index and zero otherwise), RD (is research and development expenditure (item 46) divided by total assets (item 6)), # Segments (is the number of segments as reported on Compustat), and ROA (return on assets measured as net income (item 18) deflated by average total assets). All control variables are winsorized at the extreme two percentiles (i.e., values less (greater) than the 2nd (98th) percentile are set equal to the value of the 2nd (98th) percentile). We also include a vector of industry fixed effects (2 digit SIC) in the Q regression. Note that we have measured Q as the book values relative to market values (this more closely resembles a normal distribution than a Q measure of market values relative to book values), hence our predicted signs will be opposite to some prior research.
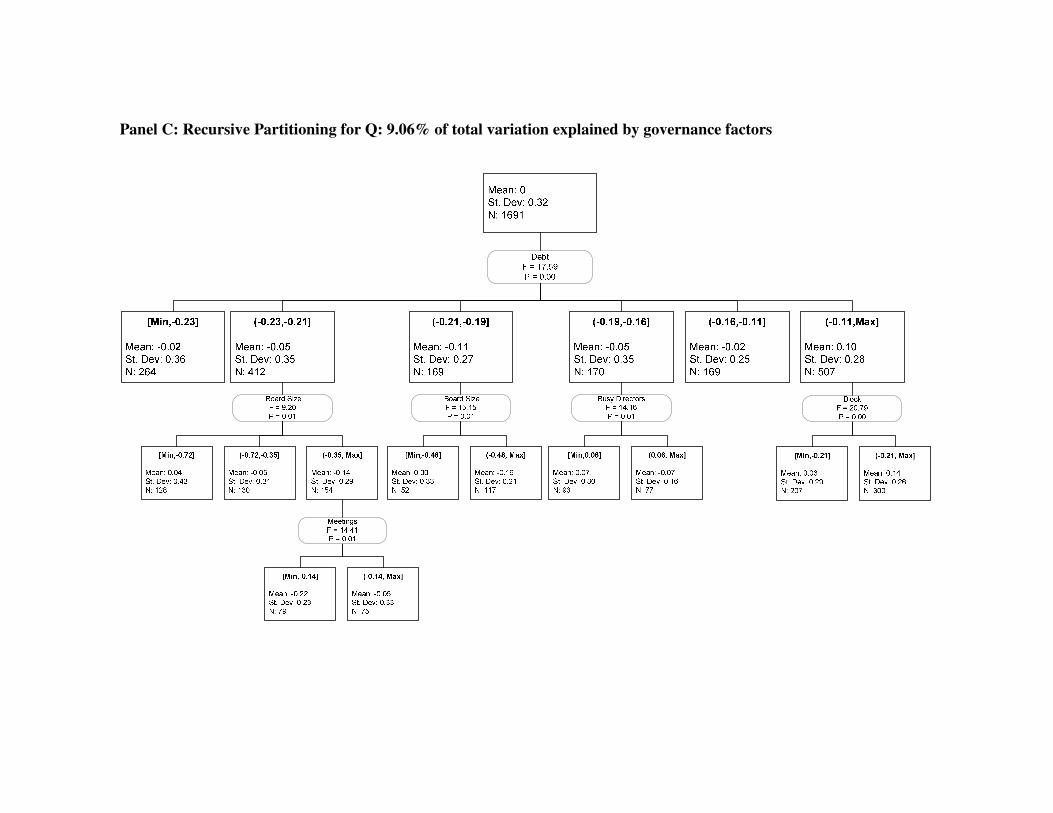
Panel C: Recursive Partitioning for Q: 9.06% of total variation explained by governance factors

Table 10 Descriptive statistics for measures of over-investment and ordinary least squares
and recursive partitioning techniques to examine the explanatory power of governance factors for over-investment. The sample consists of 1,455 firm
observations for the fiscal year ending 06/30/2002 through 05/31/2003 for which we are able to obtain corporate governance information from Equilar and Shark
Repellent and over-investment from Compustat. Panel A: Descriptive statistics
Variable Mean Std. Dev. Q1 Median Q3
Over-Investment -0.005 0.960 -0.056 -0.019 0.027
Panel B: Ordinary Least Squares
Over-Investmentt = � +ΣγControls + ΣβGovernance Factorst + εt
Controls Only Full Model Independent
Variable Predicted
Sign ββββ t-statistic ββββ t-statistic
Intercept -0.012 -3.30 -0.012 -3.15 POS_FCF + 0.195 4.31 0.194 4.21 NEG_FCF 0 0.021 0.84 0.024 0.88 Board Size + -0.001 -0.22
BLOCK - 0.002 .072 Affiliated Presence + -0.004 -1.02
Insider Influence + 0.003 0.79 Anti-Takeover I + -0.002 -0.61
Meetings +/- -0.004 -1.03 Anti-Takeover II + 0.003 1.70
Old Directors + 0.003 0.71 Debt - 0.008 1.37
Affiliated Ownership +/- -0.004 -1.52
Insider Ownership +/- -0.003 -1.03 Busy Directors + -0.005 -0.97 Lead Director - 0.001 0.47
Overall Model R2 0.015 0.016 F-stat 11.99 2.59
Incremental R2 from Governance Factors 0.010 F-stat 1.14

Over-investment is the residual from the following investment model:
Investment Expendituret= � + β1Qt-1 + β2Age t-1 + β3Size t-1 + β4Leverage t-1 + β5Cash t-1 + ΣYear Indicator + ΣIndustry Indicator
Investment expenditure is total investment expenditure (calculated as research and development expenditure (Compustat data item 46) plus capital expenditure (item 128) plus acquisition expenditure (item 129) less cash receipts from sale of property, plant and equipment (item 107) less depreciation and amortization (item 125) as a proxy for maintenance expenditure. The control variables include Q (inverse of the Tobin’s Q ratio) measured as the book value of debt (item 34 and item 9) and equity (item 60) divided by the sum of market value of equity (item 25 * item199) and the book value of debt (item 34 and item 9), Age measured as the log of the number of years the firm has been listed on CRSP as of the start of the year, Size is the log of total assets (item 6) measured at the start of the year, Leverage is the sum of the book value of short term (item 34) and long term debt (item 9) deflated by the sum of the book value of total debt and the book value of equity (item 60), Cash is the balance of cash and short term investments (item 1) deflated by total assets measured at the start of the year. The regression includes year and industry (2 digit SIC) fixed effects. All variables in the over-investment model are winsorized at the extreme two percentiles (i.e., values less (greater) than the 2nd (98th) percentile are set equal to the value of the 2nd (98th) percentile).
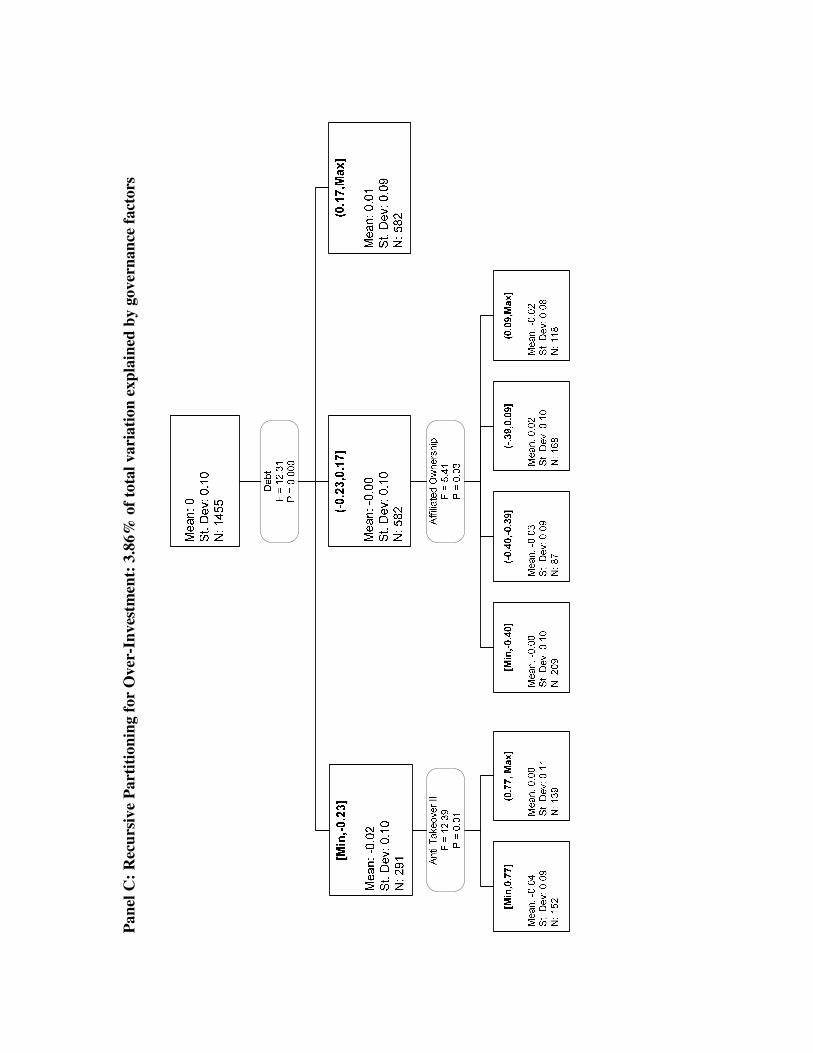
Pane
l C: R
ecur
sive
Par
titio
ning
for
Ove
r-In
vest
men
t: 3
.86%
of t
otal
var
iatio
n ex
plai
ned
by g
over
nanc
e fa
ctor
s
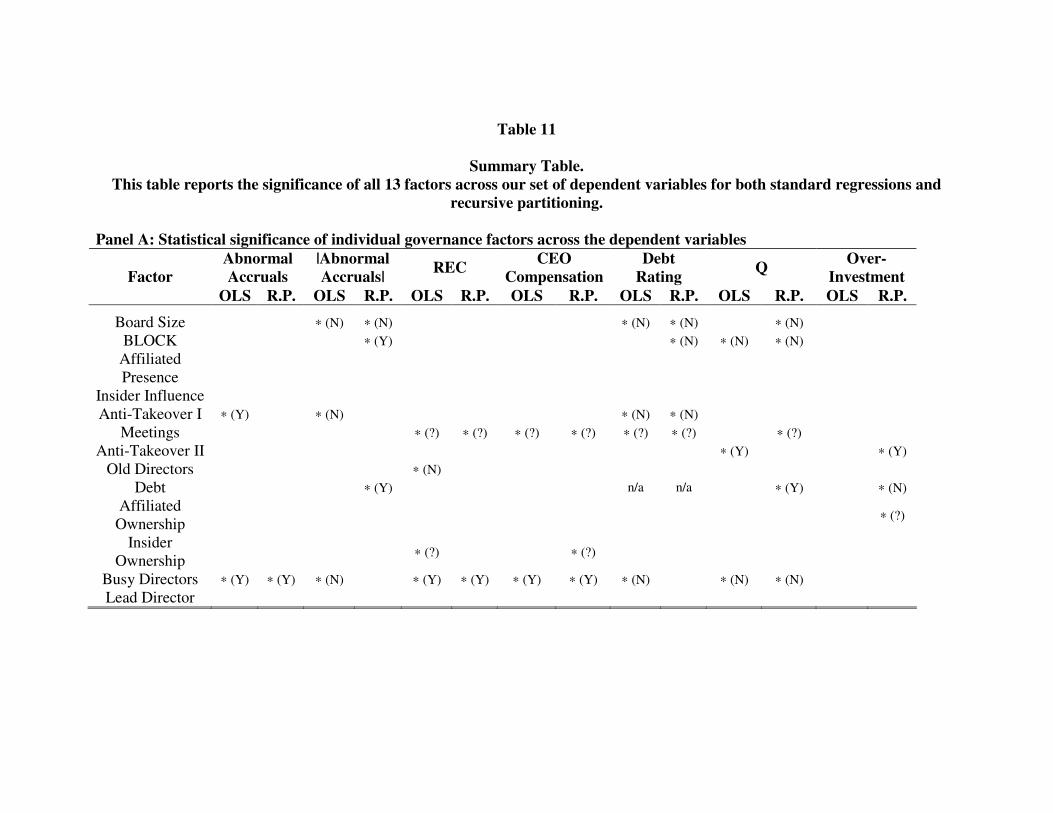
Table 11
Summary Table. This table reports the significance of all 13 factors across our set of dependent variables for both standard regressions and
recursive partitioning.
Panel A: Statistical significance of individual governance factors across the dependent variables Abnormal Accruals
|Abnormal Accruals| REC CEO
Compensation Debt
Rating Q Over-Investment Factor
OLS R.P. OLS R.P. OLS R.P. OLS R.P. OLS R.P. OLS R.P. OLS R.P.
Board Size ∗ (N) ∗ (N) ∗ (N) ∗ (N) ∗ (N) BLOCK ∗ (Y) ∗ (N) ∗ (N) ∗ (N) Affiliated Presence
Insider Influence Anti-Takeover I ∗ (Y) ∗ (N) ∗ (N) ∗ (N)
Meetings ∗ (?) ∗ (?) ∗ (?) ∗ (?) ∗ (?) ∗ (?) ∗ (?) Anti-Takeover II ∗ (Y) ∗ (Y)
Old Directors ∗ (N) Debt ∗ (Y) n/a n/a ∗ (Y) ∗ (N)
Affiliated Ownership
∗ (?)
Insider Ownership
∗ (?) ∗ (?)
Busy Directors ∗ (Y) ∗ (Y) ∗ (N) ∗ (Y) ∗ (Y) ∗ (Y) ∗ (Y) ∗ (N) ∗ (N) ∗ (N) Lead Director
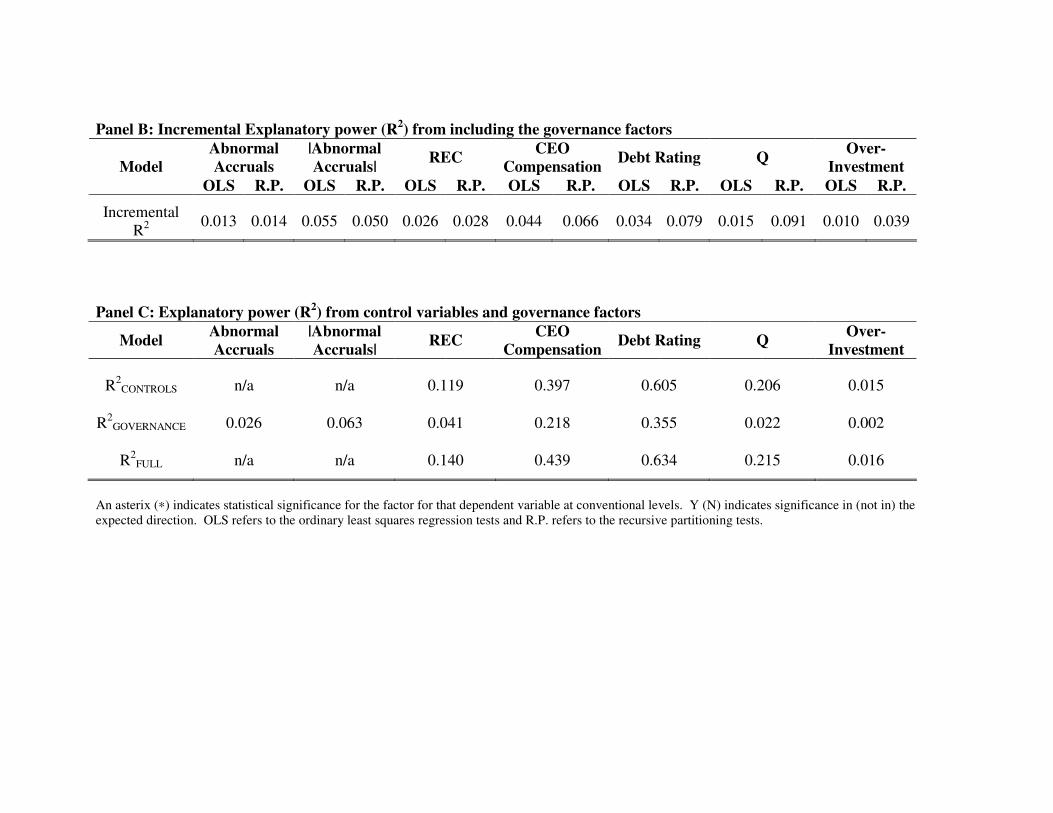
Panel B: Incremental Explanatory power (R2) from including the governance factors Abnormal Accruals
|Abnormal Accruals| REC CEO
Compensation Debt Rating Q Over-Investment Model
OLS R.P. OLS R.P. OLS R.P. OLS R.P. OLS R.P. OLS R.P. OLS R.P.
Incremental R2 0.013 0.014 0.055 0.050 0.026 0.028 0.044 0.066 0.034 0.079 0.015 0.091 0.010 0.039
Panel C: Explanatory power (R2) from control variables and governance factors
Model Abnormal Accruals
|Abnormal Accruals| REC CEO
Compensation Debt Rating Q Over-Investment
R2CONTROLS n/a n/a 0.119 0.397 0.605 0.206 0.015
R2GOVERNANCE 0.026 0.063 0.041 0.218 0.355 0.022 0.002
R2FULL n/a n/a 0.140 0.439 0.634 0.215 0.016
An asterix (∗) indicates statistical significance for the factor for that dependent variable at conventional levels. Y (N) indicates significance in (not in) the expected direction. OLS refers to the ordinary least squares regression tests and R.P. refers to the recursive partitioning tests.