does distance still matter in the age of the internet? diana mok
TRANSCRIPT

Does Distance Still Matter in the Age of the Internet?
Diana Mok, Juan-Antonio Carrasco and Barry Wellman
Abstract
Our study is part of the broad debate about the role of distance and technology for interpersonal
contact. To the best of our knowledge, this is the first study that systematically and explicitly
compares the role of distance in social networks pre- and post-Internet. We analyze the effect of
distance on the frequency of email, phone, face-to-face and overall contact in personal networks,
and we compare the findings with its pre-Internet counterpart whose data were collected in 1978
in the same East York, Toronto locality. We use multilevel models with spline specification to
examine the nonlinear effects of distance on the frequency of contact. We compare these effects
for both very close and somewhat close ties, and for different role relationships: immediate kin,
extended kin, friends and neighbours. The results show that email contact is generally insensitive
to distance, but tends to increase for transoceanic relationships greater than 3,000 miles apart.
Face-to-face contact remains strongly related to short distances (within five miles), while
distance has little impact on how often people phone each other at the regional level (within 100
miles). The study concludes that email has only somewhat altered the way people maintain their
relationships. The frequency of face-to-face contact among socially-close friends and relatives
has hardly changed between the 1970s and the 2000s, although the frequency of phone contact
has slightly increased. Moreover, the sensitivity of these relationships to distance has remained
similar, despite the communication affordances of the Internet and low-cost telephony.

Are Cities Losing Their Advantage?
Is the Internet Killing Distance?
Cities have always been interaction maximizers at the crossroads of multiple social
networks: compressing people and building channels to increase the efficiency of encounters,
planned and happenstance (Meier 1962; Massey 1984). Distance has always mattered: the more
physically proximate, the more people interacted (Butts 2009; Hipp and Perrin 2009). While
cars, phones and transit stretched interaction and most communication out to the boundaries of
metropolitan areas, these media were limited in the speed of travel (cars and transit), what they
could communicate (phones), and the cost of communication (cars, transit and phones).
The advent of the Internet has changed the balance between communication and spatial
distance, promising to put into effect what Marshall McLuhan presaged as the “global village”
(1962) and Manuel Castells has called “the space of flows” (2000), where connectivity functions
without regard to place. Email’s social affordances are compelling for communication: high
velocity and zero marginal cost above the monthly flat rate; the ability to contact many people at
once (and for many to respond to one or to many); the ability of communications to be stored and
retrieved later; the lack of visual and audio barriers to making contact; and the ease of
contacting, replying and forwarding (Wellman, 1999; 2001). It is almost as easy to communicate
with ties (both strong and weak) across the globe as across the street – although time-zone
differences still delay some immediate responses.
This fall in the cost of distance for communication has led commentator Frances Cairncross
to assert that the Internet has caused “the death of distance: “friends, colleagues, and customers
could easily be anywhere – around the corner or around the world – and the new ways of

communicating will effectively wipe out distance as a cost factor, indeed, as a perceptible
concept from our lives” (1997: book synopsis on barnesandnoble.com).
Has the Internet actually killed or – less luridly – weakened the effect of distance on
interpersonal relations, and in so doing, helped to reduce a key comparative advantage of cities?
There is more speculation than evidence (Green, 2002). Visions of bucolic communicators e-
chatting abound, with Wired magazine putting on a post-(Leo) Marxist (1964), spin on the new
WiFi machine in the garden (Wellman and Gulia, 1999; Fisher and Wright, 2001; Axhausen,
Urry and Larsen, 2007). At the same time, some worry about increased social isolation (e.g.,
McPherson, Smith-Lovin and Brashears, 2006), with Pope Benedict XVI warning that “if the
desire for virtual connectedness becomes obsessive, it may in fact function to isolate individuals
from real social interaction (2009). Yet, there have not been systematic studies to confront these
visions with reality.
Glocalization
To be sure, the Internet is not the first technological change to affect the relationship of
distance to social interactions. Until the advent of the telegraph, transportation and
communication were tightly coupled, with messages transported by hand. Although the telegraph
was the first decoupler in the mid-1800s, its expense and difficulty of use made it suitable only
for businesses and government – a person-to-person telegraph was only used for life-changing
events, such as marriage, birth, illness or death (Pred, 1973).
In the course of the past 200 years, rail, roads and low-cost airplane flights increased the
range of viable interpersonal contact throughout the developed world and increasingly in the
less-developed world. Where Americans travelled an average of 50 meters per day in 1800, they

travel an average of 50 kilometres in the 2000s (Urry, 2007). Getting on an airplane has become
more like taking a bus in the 1950s than the swellegant airline travel of the 1930s.
Communities became “glocalized” (Hampton and Wellman, 2002) – with extensive long-
distance as well as local relationships – so that they were no longer synonymous with
neighbourhoods. Well before the coming of the Internet, ties with friends and relatives stretched
beyond the neighbourhood. In 1978, in the same East York area of Toronto that we report about
in this paper, 73.0% of an adult’s socially-close (“intimate”) ties with friends and relatives went
beyond the neighbourhood, with 61.3% going outside of the relatively compact borough of East
York itself, and 42.3% stretching beyond all of metropolitan Toronto (Wellman, 1979). Only
22% of the socially-close friends and relatives of residents of the East York area of Toronto lived
within a mile of each other, while one-third (33%) lived more than 100 miles away: the median
distance apart was 10 miles. No East Yorkers had most of their active ties living within a mile’s
walking distance (Wellman, Carrington and Hall, 1988). Other developed countries had similar
situations, for example, Northern California (25% within 5 minutes’ drive; 35% at least an hour
away – Fischer, 1982) and Toulouse, France (28% within 5 minutes’ drive; 17% at least an hour
away – Grossetti, 2007.
Since the 1940s, the telephone has been the great decoupler of communication from
transportation. Like the Internet, it allowed instant communication around the world: people no
longer had to travel to remain in contact. Early commentators feared it would lead to the death of
distance. It did not, although it did incorporate rural folks more fully into broader societies
(Fischer, 1992). In general, the telephone democratized access in the developed world. As it
became affordable, if you could talk and turn a dial (or speak to an operator), you could use it.
In 1968, our East York research found that people use both face-to-face and telephone
contact to maintain their active ties. Moreover, the rate of telephone and face-to-face contact was
positively associated: the more people saw each other, the more they spoke on the phone
(Wellman, 1979; Wellman and Tindall, 1993; see also Fischer, 1982). Thus, even before the
Internet, phoning, driving and flying meant that some “network travellers [were] … not
form[ing] communities with the neighbours any more [except to] share the same public and
semi-public spaces around their front door” (Axhausen, Urry and Larsen, 2007, p. 1).
Despite this long-distance connectivity, our 1978 data showed that proximity continued to
be associated with both face-to-face and phone contact. Telephoning did not fully decouple
communication from travel. Those who have phoned the most have seen each other the most,
and contact by phone as well as by travel declines with distance. The number of friends and
relatives in contact has usually decreased with increasing distance. For example, our study of
East York in 1978 found two distances where the frequency of contact markedly increased – 5
miles – effectively a local trip in Toronto – and 100 miles – a day-trip by car, train or bus (Mok
and Wellman, 2007). Even though telephoning afforded communication to be independent from
physical contact, phone contact also diminished over distance, although not as swiftly as face-to-
face contact. There were multiple reasons: the then-significant expense of long distance calls,
low ability to have caller and receiver available simultaneously, and the intertwining of phone
and face-to-face contact – with calls used to sustain contact in-between meetings and to arrange
future meetings. In practice, phoning and visiting are part of the same social system, rather than
being independent arrangements (Mok and Wellman, 2007).
Glocalization has been, at most, a halfway house on the route to the supposed death of
distance. Data from other developed countries show that before and after the advent of Internet,

there have been many nearby ties and even more contact. For example, in 2005, nearly two-
thirds of Zurich residents’ socially-close ties lived within 25 km, only one-fifth lived more than
100 km away, and the number of face-to-face visits dropped exponentially with distance (Frei
and Axhausen, 2007; Axhausen, Urry and Larsen, 2007). A study of ties in Rotterdam and New
Haven found that about 30% are with people living in the same neighbourhood (Blokland and
Mitzman, 2003). European and Thai studies have found that the type of relationship is associated
with residential distance: the more important and stronger ties tend to live closer to one another
(Axhausen, Urry and Larsen, 2007; Faust, et al., 2000; Chua, Madej and Wellman, 2010).
Email and Personal Networks
Although the telephone supplemented, rather than replaced, face-to-face contact, what of the
Internet – with its greater social affordances for the death of distance? The evidence to date has
suggested that distance still matters. Early North American studies have shown that even with
the advent of email, there is lower overall contact – face-to-face, phone and email – with
community ties who live further away . Yet, although only a minority of friends and relatives are
walking-distance neighbours, there is still “glocalization”, with frequent email contact with near-
by friends and relatives (Stern and Dillman, 2006; Wellman and Hogan, et al., 2006; Quan-Haase
and Wellman, 2002; Chen, Boase and Wellman, 2002; Boase, et al., 2006; Carrasco, Miller and
Wellman, 2008)).Internet communication has joined the telephone to work synergistically with
face-to-face contact in an integrated personal communication system (Boase, 2008; Carrasco,
Miller and Wellman, 2008; Kenyon and Lyons, 2006; Kim, et al., 2007). Frequent email contact
with active friends and relatives is associated with frequent telephone and face-to-face contact.
Rather than replacing other forms of contact, email intertwines with them in maintaining ties and
arranging face-to-face visits and phone chats (Green, 2002; 2002; Boase, et al., 2006; Wellman

and Hogan, et al. 2006; Curtice and Norris, 2007; Stern and Messer, 2008). If someone moves to
another city, there is likely to be a modal shift, with email used more extensively to maintain the
tie. Yet, people use face-to-face and phone contact more for the initial development of
relationships (Hampton and Wellman, 2002, 2003; Shklovski, Kraut and Cummings, 2008).
The only reliable contrary evidence comes from large-sample Canadian time-use data
showing that heavy Internet users spend less face-to-face time with household members as well
as friends and relatives (Veenhof, et al., 2008). Moreover, some forms of ICTs – instant
messenger (IM), mobile phone, and mobile texting – are primarily restricted to contact with close
ties(Curtice and Norris, 2007; Miyata, Boase and Wellman, 2008).
Research Approach
Key Questions
1. What is the role of distance in influencing how members of personal networks stay in
touch? Is distance differentially related to email, face-to-face, and phone contact? If so, is there a
continuous gradient, or do the effects of distance increase (or decrease) nonlinearly?
2a. Do different types of relationships vary in terms of which media they use to communicate
at different distances? 2b. Do the effects of distance vary according to the type of relationship:
strong vs. less strong; kin vs. non-related? 2c. If so, is there a continuous gradient, or are there
nonlinear places where the effects of distance increase (or decrease) markedly? For example,
stronger ties may not require as much face-to-face contact. Moreover, as ties with relatives tend
to be densely knit in kinship systems, while friendship ties tend to be more discrete relationships,
relations with kin may survive greater distances than relations with friends (Wellman, 1990;
Wellman and Wortley, 1990). Earlier surveys have used crude distance and contact categories

that have not allowed researchers to ascertain precisely the relationship of distance to contact. By
contrast, we use continuous measures.
3. Have the effects of distance on fact-to-face and phone contact changed pre- and post-
Internet? If so, are the changes similar for different types of role relationships? Our study
uniquely adds a temporal dimension by examining the changing role of distance in influencing
face-to-face and phone contact between the 1970s and the 2000s. This is possible because the
samples for the third East York study (in 2005) and the second East York study (in 1978) are
drawn from the same locality and asked similar questions.
Building on our Pre-Internet Analysis
The present paper, together with an earlier companion study (Mok and Wellman, 2007),
addresses these questions. . To provide a basis for comparison with the pre-Internet results, we
ask similar research questions to those poised in our analysis of the 1978 data (Mok and
Wellman 2007).
In the companion pre-Internet paper, the results showed a marked drop in the frequency of
face-to-face contact at about five miles; the frequency continued to decrease steadily further
away, with substantial declines happening at about 50 miles and 100 miles. The results also
showed that distance affected telephone contact differently, with one marked drop at about 100
miles.
The present paper uses 2005 interview data from the third East York study (the
Connected Lives study) to estimate similar models of the frequency of email, phone and face-to-
face contact between the respondents and their community ties and to compare our results with
those from the 1978 data (Mok and Wellman, 2007). We build on the companion paper in two

ways. First, we examine the role of distance in affecting the frequency of email contact, in
addition to face-to-face and phone contact.
Second, we test the nonlinear relationship between distance and contact, using a spline
specification in a multilevel model. (In the previous paper, the small sample size made an
explicit test of nonlinearity difficult.) By contrast, most studies of social networks have neglected
distance while concentrating on network structure, composition, and contents. “Distance” in such
studies has usually referred to network distance: how many links does it take to connect two
persons. When network analysts use geographical distance, they often use it crudely as a
dichotomous measure, such as asking if ties remain within a neighbourhood or reach beyond it.
We broaden the existing studies by treating distance as a continuous measure and testing if
distance affects short- and long-distance contact similarly. To do this, we use Geographic
Information Science (GIS) techniques to geocode the street address of each respondent and the
road intersections of the respondents’ ties, measuring straight-line residential distance between
the respondent and each community tie.
Methods
Data Collection
Our research is part of the Connected Lives study whose overarching goal is to assess the
role of communication media in everyday life and its impact on personal networks. Our analysis
is based on four-hour interviews in 2005 with 86 respondents. Using a name generator,
interviewers asked respondents (referred to as “egos”) to name other people (referred to as
“alters”) with whom ego has a specific connection. After enumerating a set of alters, each
ego/respondent described the attributes of these alters and reported on both ego-alter connections
and connections between alters (for details, see Hogan, Carrasco and Wellman, 2007 and

Carrasco, Miller and Wellman, 2008). We asked about two types of socially-close “active” ties
that comprise about 10% of the average person’s network (Bernard, 2008; Boase, et al., 2006;
Wellman and Hogan, et al. 2006).
* Very Close Ties (“Intimates”): People with whom you discuss important matters,
regularly keep in touch with or are there for you when you need help (mean = 11.6; median
= 10 alters).
* Somewhat Close Ties (“Non-Intimates”): People who are more than casual acquaintances
but not very close (mean = 12.2 alters; median = 10 alters).
This “closeness” approach not only measures tie strength, it defines the personal network
boundary of “active ties”: excluding less close friends and acquaintances. The complete active
personal networks ranged between 3 and 66 (the maximum allowed), with a mean of 23.8 alters,
and a standard deviation of 14.5. The subsample geocoded ranged between 3 and 15, with a
mean of 12.1 and a standard deviation of 3.2.
We gathered detailed information in a manner that somewhat privileged stronger very close
and somewhat close ties (Hogan, Carrasco and Wellman, 2007). Spatial information was
geocoded with 95% success. Respondents reported information about communication and
interaction patterns with alters: face-to-face, socializing, telephone and email. Telephone use
includes both landline and mobile phones. Email use includes instant messaging that was rarely
used by these respondents (Wellman and Hogan, et al., 2006).
East York and the East Yorkers
East York, the scene of our case study, is a residential area (population 114,240; 2001
census) of Toronto that has been the locale of NetLab’s two previous community studies in pre-
Internet times: a survey in 1968 (Wellman, 1979) and interviews in 1978 (Wellman and Wortley,

1990). Although it is not feasible to do a third longitudinal wave with the same respondents 25
years later, East York retains its value for comparisons between the pre-Internet and the Internet
eras.
East York sits squarely within the arterial highway system of Toronto. It is bounded on the
west by an expressway, on the south by a subway line, and buses frequently travel main routes.
The population is ethnically and socioeconomically mixed, residing in working/middle-class
houses and apartment buildings. Mobile phone and broadband Internet service is widely
available throughout Toronto, the largest metropolitan area of Canada.
Two demographic changes in East York are relevant. First, East York’s population is older
now. According to the 2001 census, the median age in East York was 37.4 years, while in both
1976 and 1981, the median age was 30 years. Second, recent immigration and high-rise
apartment development have made the East York cityscape more complex than its village-like
past. Previously in 1978, almost all East Yorkers were Canadian born or of British-Canadian
ethnicity. In the 2000s, East York is similar to much of the metropolitan Toronto area in its
percentage of foreign-born residents. Fifty-three percent of East York residents were Canadian-
born in 2001, similar to the 58% of the interview respondents. Visible minorities (i.e., nonwhite-
Canadians) are principally East Asians and South Asians. Their ethnic groups are
underrepresented in the present study because of language and cultural barriers. In most other
respects, our data reflect census demographics, including gender, age, income, education and
family composition (Gram, Wellman and Zinko, 2009)

East Yorkers vary in their Internet use. Heavy Internet users have lived in Toronto and their
current homes for a shorter period than those who do not use the Internet (Table 1).1 On the other
hand, a greater proportion of heavy users are immigrants, compared to non-users. Among these
immigrants, heavy users entered Canada more recently than non-user immigrants did, and they
use the Internet to keep in contact with friends and relatives in their homelands.
Distance and Mode of Communication
The number of alters with respect to distance generally declines until a slight rise at far
transoceanic distances (Figure 1). The number of alters drops by 45.4% when distance increases
to between four and eight miles; it falls by another 50.0% when distance increases to between
eight and 12 miles, a geographic scope that is beyond the boundary of East York. The number of
alters levels off at less than 20 times beyond 20 miles at the regional level and then rises again
when distance becomes transoceanic, beyond 3,000 miles.
> Figure 1: Contacts by Distance <
Figure 2 shows the scatterplots of the frequency of email contact (a) within 500 miles and
(b) 500–3,000 miles and (c) beyond 3,000 miles. Figure 3 shows the scatterplots for face-to-face
contact (0–5 miles and 5–50 miles, 50–500 miles, and beyond 500 miles), and Figure 4 shows
the scatterplots for phone contact (0–100 miles and 100–500 miles, as well as beyond 500 miles).
>Figures 2-4: Scatterplots for Email, Face-to-Face and Phone Contact<
The mean frequency of email is highest within 50 miles, at 104.9 times a year. It drops by
34.1% to 69.1 times for distances between 50 and 500 miles, increases by 32.7% to 91.6 times a
year for distances between 500 and 3,000 miles, and increases to 104.8 times a year beyond
3,000 miles. These numbers suggest that distance and email contact are related to one another 1 “Heavy users” are respondents who use the Internet at least 7 hours a week; “moderate users” use it less than
7 hours a week, while “non-users” do not use the Internet at all. See the expanded online version of the paper for the table of sample characteristics by Internet use: www.chass.utoronto.ca/~wellman/publications/index.html

nonlinearly. Heavy users are more involved in longer distance relationships than non-users: both
the mean and the median distance among heavy users are 2.5 times longer than for non-users.
Heavy users have more extended kin (aunts, cousins, etc.) in their active networks than non-
users, but a smaller proportion of neighbours. (All role relationships are self-identified.)
Phone contact and distance also have a nonlinear relationship. The mean frequency of
contact is highest within 100 miles, at 73.9 times a year. It decreases by 39.8% to 44.5 times a
year, when distance is 100 to 500 miles. It then increases by 17.8% to reach 52.5 times for
distance greater than 500 miles.
Meanwhile, face-to-face contact drops monotonically with distance. The mean frequency
falls from 64.4 times a year (more than weekly) within five miles to only 35.7 times (5 to 50
miles). It further declines by one-third to 19.1 times a year when distance is 50 to 200 miles and
6.6 times (once every two months) when distance is 200 to 500 miles. Beyond 500 miles,
respondents meet their active ties 1.8 times a year.
Figures 5, 6 and 7 present a complementary view to the relationship between distance and
mode of communication. Despite the widespread prevalence of email, about 60% of the alters
living within 3,000 miles are never in contact with the East Yorkers by email. This percentage
changes substantially for distance greater than 3,000 miles, where only 45% of the alters are
never in contact by email. As discussed before, heavy use of email (weekly or more frequently)
is proportionally higher for distances greater than 3,000 miles. Phone contact frequency tends to
be higher for distances within 100 miles. At the same time, the proportion of contact that is never
done by phone is almost invariant with respect to distance. Finally, face-to-face frequency of
contact shows a marked drop with respect to distance, consistent with the previous results
presented in this section.

> Figures 5-7: Bar Graph Frequencies of Contact by Media <
Analytic Models
We divide the sample of socially-close alters in two ways. One way is by role relationship:
immediate kin, extended kin, friends and neighbours. The second way is by intimacy: those who
are very close (“intimates”) and those who are somewhat close (“non-intimates”). Because
intimacy is not independent of kinship, we then interrelate intimacy by role relationship. All
relationships are self-identified by the respondents and include only those alters living outside of
the respondents’ households.
The analysis involves four models, each focusing on a different mode of contact.
• Model 1: Frequency of email contact
• Model 2: Frequency of phone contact
• Model 3: Frequency of face-to-face contact
• Model 4: Frequency of overall contact
In all four models, we estimate a multilevel model to control for the network structure of the
data by grouping community ties by their corresponding respondent (see Wellman and Frank,
2001). Following our previous study, we estimate a simplified version of the multilevel model.
The simplified version assumes that the slope is deterministic and that only the intercept varies at
the respondent level. This simplification allows us to focus on how the slope parameter may vary
by the different types of role relationship and tie strength. Our basic estimating equation is:
ijjijjijjij uXZXZY εγγγγ +++++= 011100100 . (1)
The subscript i refers to the respondent; the subscript j refers to the community tie. The
dependent variable Yij is quantitative (frequency of contact) and Xij is the set of explanatory
variables (e.g., residential distance between the respondent and the tie) affecting Yij, with Xij

being measured at the tie level. Note that Zj is a vector that describes the characteristics of
respondent j; u0j and jε are the errors at the respondent and the tie level, respectively.
The estimating equation (1) is expanded to include a spline specification. A spline
specification linearly segments the regression line, allowing the line segments to have different
slope estimates. In the simplest case, suppose the data suggest a single knot (cusp point between
two line segments) at distance dk , which divides the data into two subsamples. We further
assume that Zj affect the two line segments similarly. Let 1=d if dij kX ≥ . These assumptions
provide the estimating equation for the spline model (see online version for a detailed
derivation):
( ) ijjijjdijijjij uXZkXdXZY εγγγγγ +++−+++= 0211
210
110
111
100 (2)
We estimate equations (1) and (2). Our discussions first focus on the spline models that test
if the various linear segments possess different slopes. (We do not use spline models to analyze
“neighbours” because only eight live further than five miles away.) The slopes may differ
because the dynamics of travel and communication can be nonlinear. For example, an overnight
trip of 100 miles has more in common with one of 150 miles than it does with a short drive of 50
miles.
In the spline specification, the knots for each mode of contact are based on prior scatterplots
and experimentation with the knot positions that would maximize the log-likelihood function.
For email contact, three knots are at 50, 500, and 3,000 miles; for phone contact, two knots are at
100 and 500 miles; for face-to-face contact, three knots are at 5, 50, and 200 miles.
The dependent variables in all four models are the frequency of email, phone, face-to-face,
and overall contact. Overall contact refers to the sum of all types of contact. All frequencies are

measured in times per year and are transformed by the natural logarithm, as small increases in
frequency are more important for rare contact than for very frequent contact. Because of a large
number of null responses for email, Model 1 focuses on positive frequencies only. As a result,
the number of observations in Model 1 reduces from 1,019 to 448.
In all four models, the key independent variable is the natural logarithm of the residential
distance between the respondent and the network tie, using the same reasoning as for frequency.
The slope parameter is interpreted as the percentage change in the frequency of contact for each
percentage change in distance. To control for potential bias due to the presence of coworkers
who meet face-to-face frequently for long hours daily, we have recoded their distance to zero.
One might believe that immigrant respondents in the sample (n=440) are more likely to be
involved in long-distance relationships than non-immigrants. Therefore, contacts between
immigrants and their community ties could be less sensitive to or even increase with distance. To
investigate this potential difference between immigrants and non-immigrants, we introduce two
covariates into our model. The first covariate is a dichotomous variable that identifies
immigrants in the sample—that is, the variable receives a one if the respondent is an immigrant
and a zero otherwise. The parameter estimate of this dichotomous variable would allow us to test
explicitly if immigrants have more contact than non-immigrants. The second variable cross
multiplies this dichotomous variable with the residential distance between the respondent and
his/her community tie. The parameter of this variable allow us to test if immigrants are more or
less sensitive to distance than non-immigrants when contacting their community ties.2
In general, our results show that contacts between immigrants and their community ties are
not statistically different from non-immigrants (see online version for a role relation analysis) 2 Immigrants refer to respondents who were born outside of Canada regardless of the year of arrival. We reran
the models by identifying “recent immigrants” who have stayed in Canada for less than 10 years (n=190) or five years (n=153). The result is comparable to what is reported in the present study.

The parameter for the dichotomous variable that identifies immigrants in the sample receives
insignificant estimates in most of the models; the parameter for the crossed variable (between the
dichotomous variable and residential distance) also receives insignificant estimates. The
exception is email contact among extended kin: immigrants are less sensitive to distance than
non-immigrants when emailing their extended kin.
How Communication Mode and Distance Affect Contact
Email Contact (Model 1)
The evidence shows that although email weakens the negative effects of distance on
contact, distance has not died. Overall, the respondents email their active ties 50.6 times a year.
Most importantly, the frequency of email contact drops slowly over distance: for each percent
increase in distance, the frequency declines by 0.1%. However, for long-distance relationships of
more than 3,000 miles, the frequency of email increases. For each percent increase in distance
beyond 3,000 miles, the frequency rises by 4.5%: these are usually immigrants in active
transoceanic contact with their kin.3
The mean frequency of email contact is highest among extended kin (193.1 times per year),
followed by immediate kin (104.8 times: parents and adult children, including in-laws), and
much less often by neighbours (51.4) and friends (41.7). Email contact is mostly insensitive to
distance: most estimates for the slope parameter are statistically insignificant. The exception is
immediate kin, whose email contact is nonlinearly related to distance. The slope receives an
estimate of -0.3, meaning that for each percent increase in distance, email contact decreases by
0.3% [exp(-0.3)-1]. This holds only within 3,000 miles; for immediate kin who live further than
3,000 miles, the frequency of email increases by 8.3% [exp(-0.27-0.03-0.05+2.57)-1]. Of the
3As only six neighbours live further than fives miles away from their egos, all discussions of neighbours are
based on the multilevel model without spline specification.

three knots at 50, 500 and 3,000 miles, only the knot at 3,000 miles receives an estimate that is
significant. Those alters residing more than 3,000 miles away are almost always either friends
and relatives back in immigrants’ homelands or friends and relatives who have moved away
from Canada.
Intimates email each other 1.8 times more often (a mean of 68.8 times per year) than non-
intimates (38.6) times a year (slightly more than once every two weeks). Email contacts among
intimates and non-intimate email contact are similarly sensitive to distance. For each percent
increase in distance, the frequency of email and message contact declines by 0.1%. However,
none of the knots receive a significant estimate.
Intimates: Intimate extended kin email each other most often (almost 5 times a day), 13.6
times more often than intimate immediate kin do (112.6 times); however, we are mindful that the
group of intimate extended kin constitutes a small sample size of 24. Intimate neighbours (84.8
times) email each other 2.4 times more often than intimate friends do (34.9 times).
Most parameter estimates for distance and the knots are insignificant except for intimate
immediate kin and friends whose frequency of emails decreases as distance increases. Among
intimate immediate kin, the frequency drops by 0.3% (at the 0.05-significance level) for each
percent increase in distance, but it rises by 8.6% for those immediate kin who live further than
300 miles away from each other. Email contact among intimate friends is insensitive to distance
within 50 miles, but drops over distance beyond the knot of 50 miles. For each percent increase
in distance beyond 50 miles, the frequency drops by 0.5%.
Non-Intimates: Only 10 of the small number of non-intimate immediate kin email each
other, a sample size too small for valid statistical estimates. Non-intimate extended kin email
each other the most frequently: 193.7 times a year. This number is about one-tenth as frequent as

the extraordinarily high frequency of their intimate counterparts. Their email contact is not
sensitive to distance. None of the knots receive a significant estimate.
Non-intimate friends email each other a mean of 40.8 times a year, a intimate friends do
(34.9). Neighbouring is especially sensitive to levels of intimacy: those who are non-intimates
email each other infrequently (19.5 times a year), only 23.0% of the rate of their intimate
counterparts.
Overall, email contact among non-intimates is insensitive to distance for kin. By contrast,
while the frequency of contact with friends and neighbours is insensitive to distance within 50
miles, their email contact increases at a rate of 0.7% beyond 50 miles.
> Table 1 about here: Model 1 results: Email/Instant message contact <
Phone Contact (Model 2)
While the frequency of email contact is only slightly related to distance, the frequency of
phone contact declines with distance. Contact generally drops smoothly over distance, although
there is a marked drop at the 100-mile cusp point. However, contact increases beyond 500 miles.
Overall, respondents are in phone contact with their active ties 18.6 times a year. Within 100
miles, the frequency of phone contact hardly drops (the slope parameter receives an insignificant
estimate); beyond 100 miles, it declines at 0.2%. The other knot at 500 miles receives a
significant estimate of 1.0. Although these data are for the entire sample, analysis of the minority
of East Yorkers who do not use email provide similar results.
Immediate kin phone the most often, a mean of 53.3 times a year. Extended kin phone 27.9
times a year. Friends call more often (20.8) than neighbours (17.8). Intimates phone more often
(40.5) than non-intimates (8.3). The frequency of phone contact drops at a similar rate among
different role relationships (0.01%), but the slope estimates are not significant except for

extended kin, whose frequency drops at a rate of 0.2%. Phone contacts among intimates and non-
intimates are sensitive to distance only beyond 100 miles, at which point contacts drop at a rate
of 0.5%.
Intimates: Frequency of phone contact is highest among intimate immediate kin, who call
70.4 times a year (slightly more than weekly). Intimate extended kin have the second highest
frequency of 44.2 times a year (slightly less than once a week), followed by intimate friends
(43.0) and neighbours (39.3).
Phone contact is generally insensitive to distance among intimate role relationships, except
for immediate kin and friends. Among immediate kin, phone contact is insensitive to distance
within the cusp point of 100 miles, beyond which frequency drops at a rate of 0.7%. Among
intimate friends, frequency drops smoothly over distance at a rate of 0.1%, similar to the 1978
East York data: people call somewhat distant kin, rather than visiting them.
Non-Intimates: Non-intimate extended kin phone most often (18.0 times a year), while non-
intimate immediate kin (10.7 times) phone about half as often; non-intimate friends call each
other 8.6 times a year while non-intimate neighbours call the least often (7.9 times a year).
Phone contact is generally insensitive to distance among kin. By contrast, it is sensitive to
distance for friends: their phone contact shows two cusp points, at 100 and 500 miles. Within
100 miles, their phone contact is not sensitive to distance; between 100 and 500 miles, contact
drops at a rate of 0.6%; beyond 500 miles, it increases at a rate of 0.6%.
> Table 2 about here: Model 2 results: Phone contact <
Face-to-Face Contact (Model 3)
The respondents meet their active ties face-to-face an average of 40.0 times a year. The
mean frequency shows a marked drop at the cusp point of five miles, a fairly local drive or

transit ride for East Yorkers. Within five miles, the frequency drops by 0.1% for each percent
increase in distance; beyond five miles, the decline in frequency accelerates to 0.3%. All other
knots receive insignificant estimates.
The mean frequency of face-to-face contact differs by role relationship. Neighbours meet an
average of 92.8 times a year, with a big decline in contact among immediate kin to 49.0 times a
year, extended kin (33.0) and friends (26.7). Intimates meet more often (43.5 times per year) than
non-intimates (36.4).
Not surprisingly, face-to-face contact is the contact medium that is most sensitive to
distance. While face-to-face contact among kin (both immediate and extended) is not sensitive to
distance, contact with non-kin (friends, etc.) drops smoothly over distance at a rate of 0.1%, and
all knots receive insignificant estimates. For each percent increase in distance, face-to-face
contact decreases by 0.1%. The frequency of contact for neighbours drops more markedly
(0.3%). Among intimates, face-to-face contact is sensitive to distance; it drops at a rate of 0.1%
within five miles and an additional 0.3% beyond five miles. The frequency of face-to-face
contact among non-intimates drops smoothly over distance, at 0.2%.
Intimates: Intimate neighbours understandably meet face-to-face the most often: 85.6 times
a year (slightly less than twice a week). Intimate immediate kin meet 54.3 times a year, followed
by intimate friends (34.9), with intimate extended kin meeting the least often (23.7).
Among intimate immediate kin and friends, the frequency of face-to-face contact is not
sensitive to distance. Extended kin show a different pattern. The frequency shows a marked drop
at the five-mile cusp point: within five miles, the frequency is not sensitive to distance; beyond
five miles, the rate of decline reaches 0.5%. The frequency of face-to-face contact among
neighbours declines smoothly at a rate of 0.3% for each percent increase in distance.

Non-Intimates: Similar to their intimate counterparts, non-intimate neighbours also meet
face-to-face the most often (98.5 times a year). Non-intimate extended kin meet twice as often
(58.0) as their intimate counterparts; non-intimate friends meet 18.6 times a year. The small
number of non-intimate immediate kin meet only 21.6 times a year, about half as often as their
intimate counterparts do. When immediate kin do not fit the norm of intimacy, contact is low and
usually takes place only in larger kinship group gatherings (Wellman, 1990).
Face-to-face contact among all non-intimate role relationships is sensitive to distance except
for non-intimate immediate kin and friends, who receive insignificant estimates for all distance
variables and knots. The frequencies for non-intimate extended kin and neighbours drop
smoothly over distance, at a rate of -0.3%. All knots receive insignificant estimates.
> Table 3 about here: Model 3 results: Face-to-face contact <
Overall Contact (Model 4)
As people use many media to stay in contact with their active ties, it is important to look at
the overall personal communication systems. By one medium or another, respondents are in
contact with their alters an average of 110.1 times a year, nearly twice per week. Overall, email
is used most often (50.4 times a year), followed by face-to-face (39.6 times) and phone (18.5
times), although specific profiles vary by alter, role relationship and tie strength.
There is no cusp point: the mean frequency of contact drops smoothly over residential
distance, with all coefficient estimates for the knots being insignificant. The frequency drops by
0.1% for each percent increase in distance. This result implies that with increasing distance,
phone and then email compensate for less face-to-face contact.
Among the various role relationships, neighbours (160.8 times a year) contact each other the
most frequently, followed by immediate kin (164.9 times), extended kin (124.1 times), and

friends (96.6 times). The strength of ties also matters: intimates communicate twice as often
(147.8 times) as non-intimates (78.8 times).
Overall contact among immediate kin and extended kin are not sensitive to distance: all the
coefficient estimates for distance and the knots are statistically insignificant. Among friends, the
frequency of overall contact drops smoothly over distance: for each percent increase in distance,
contact drops by 0.1% (at 0.10-significance level). Extended kin show a nonlinear pattern. Their
overall contact is insensitive to distance within 150 miles; beyond 150 miles, frequency of
contact increases by 0.2%.
Overall contact with intimates is only moderately sensitive to distance: the ties are strong
enough that they find a way to be in touch. Frequency drops modestly at a rate of 0.1%, but
increases at a rate of 0.01% beyond 150 miles. For non-intimates the frequency of overall contact
decreases with two cusp points: five and 50 miles. Within five miles, the decrease occurs at a
rate of 0.1%; between five and 50 miles, the rate is 0.4%, and beyond 50 miles, the frequency
increases at a rate of 0.7%.
Intimates: Neighbours are in contact the most frequently: 217.0 times a year, followed by
intimate immediate kin (205.4 times), friends (139.8 times) and extended kin (129.3 times) –
their frequency is one-half as often as immediate kin.
Overall, contacts among intimate immediate kin and extended kin are not sensitive to
distance. Intimate friends show a different pattern: their frequency of contact is insensitive to
distance within 50 miles, beyond which their frequency drops by 0.7%. Beyond 150 miles, their
frequency decreases minutely by 0.001% for each percent increase in distance.
Non-Intimates: Unlike their intimate counterparts, non-intimate extended kin are in overall
contact the most often among various kinship groups at an average of once every three days

(171.9 times a year). Neighbours are in contact at an average of 141.2 times a year. Non-intimate
friends are in contact only 53.7 times a year, while the small number of non-intimate immediate
kin contact the least often at an average of once every three weeks (22.7 times).
Contacts among non-intimate friends are not sensitive to distance. Contacts are most
sensitive to distance among non-intimate kin (at a rate of -0.4%), while those among neighbours
drop at 0.3%. Immediate kin show a non-linear pattern: their contacts are not sensitive to
distance within five miles, but drop at 1.0% between five and 50 miles. Beyond 50 miles, overall
contacts increase at a rate of 2.5%. Their frequency drops at 0.3% beyond 150 miles.
> Table 4 about here: Model 4 results: Overall contact <
Comparing How Distance Has Mattered Before and After the Internet
Has the influence of distance on the frequency of contact changed after the Internet? To
address this question, we compare the 2005 data from the third East York study (reported on
here) to the pre-email data from the second (1978) East York study (reported in more detail in
Mok and Wellman, 2007; Wellman, Carrington and Hall, 1988). Our comparison uses multilevel
models without spline.
The 1978 and 2005 samples differ somewhat in terms of the characteristics of the role
relationships (see expanded online version of this paper). First, the present post-Internet study
involves relationships with longer mean distances than the pre-Internet second study. The mean
distance in the 2005 study is two times greater than the mean reported in the 1978 study. Yet, the
median distance is somewhat lower in the present study (6.4 miles) than in the 1978 study (8.5
miles), using the Wilcoxon-Mann-Whitney test. This suggests that while the Internet has helped
maintain contact with extremely distant ties, it has not expanded the spatial range of all active
ties.
Second, the present study contains an older sample than the second study. Third, the present
study contains more transoceanic immigrants and hence a greater likelihood of very distant ties.
Fourth, respondents from the present study have identified a significantly greater percentage of
intimates among their active ties: 54.2% as compared to only 39.1% in the second study. Fifth,
the present study includes more friends, but fewer neighbours and immediate kin.
Our comparison is made, based on the results reported in tables 2(b), 3(b) and 4(b). In these
tables, the column “SEY-t” shows the t-statistics associated with testing the difference in
parameter estimates between the 1978 and the 2005 East York studies. Overall, the frequency of
phone contact has increased from 1978 to 2005 (0.10 sig.): from 12.3 to 20.9 times a year. The
higher mean in 2005 is driven primarily by the higher frequency among those who are not related
by kinship: they phone 50.9 times a year, compared to 9.8 times in 1978. In particular, friends—
especially intimate friends—have become less sensitive to distance. The slope parameter reduces
by half from 0.3% in 1978 to 0.1% in 2005. This increased frequency probably reflects the much
lower costs of long-distance telephony in 2005.
The frequency of face-to-face contact and its sensitivity to distance have scarcely changed
between the 1970s and the 2000s. Overall, the mean frequency of face-to-face contact is 44.8
times a year in 1978 and 46.5 times in 2005: an insignificant difference. Moreover, the frequency
of face-to-face contact has a similar relationship with respect to distance, pre- and post-Internet.
The principal difference is that extended kin—especially non-intimate kin—meet more often in
2005, compared to 1978. The mean (30.9 in 1978 versus 59.1 in 2005) is about twice of the mean
reported in the second East York study (10-percent significance level). Face-to-face contact
among neighbours has also become more sensitive to distance (-0.01% in 1978 versus -0.3% in
2005), while friends have become less sensitive (-0.3% in 1978 versus -0.2% in 2005).

The implication of these results is that despite the advancement in telecommunication
technologies, face-to-face contact remains substantially local. Both its frequency and its
sensitivity to distance have hardly changed, pre- and post-Internet. In particular, kin and
intimates meet as often in 2005 as they did in 1978.
Has Distance Died?
Summary
Despite persistent fears about the death of community in both the developed and less
developed worlds, the East Yorkers we studied have abundant contact with their active ties, an
average of 110.1 times per year (about twice per week). As people have a median of 23 active
ties, this means they use a variety of media to have 2,863 contacts per year – about eight per day
– and this is just with the active ties that typically comprise only 10% of their networks.
Email has joined face-to-face and phone as a major medium of communication. Once
distance has been accounted for, people email more frequently than they phone or meet each
other. Indeed, people email each other most often (50.6 times), followed by face-to-face contact
(39.8 times) and phone contact (18.6 times). Although not all ties use email, those who do use it,
use it a lot.
Distance is dead only if email is looked at in isolation. Email contact is insensitive to
distance. It is as frequent at 500 miles as at 5 and 50 miles. When relationships are very distant –
transoceanic – email is almost the only medium the East Yorkers use for contact, as Internet
phone services such as Skype had not become widely known.
Although email gets the lions-share of hype and analysis these days, it is the relationship
that is the most important – and not the medium of communication. Most active ties

communicate by multiple means. The exceptions are the obvious extremes: neighbours and alters
living 3,000 miles apart.
Despite the distance-insensitivity of the Internet, distance still matters for the overall
relationship. Yet, different modes of communication have different sensitivities to distance:
(a) The frequency of email shows a cusp point at 3,000 miles: within 3,000 miles, distance
decreases by 0.1% for each percent increase in distance; beyond 3,000 miles, the frequency
of contact increases at 4.4%.
(b) Phone contact is half as sensitive to distance as face-to-face contact. Its sensitivity to
distance drops modestly beyond 100 miles, but increases beyond 500 miles.
(c). Face-to-face contact displays a marked drop at five miles. Beyond five miles, the
frequency of face-to-face contact drops nearly twice as fast as those relationships that live
within five miles. Not surprisingly, neighbours meet each other face-to-face the most often.
Distance has little impact on how often people phone each other within 100 miles. As this is
an appreciably further distance than that covered by Toronto’s flat-rate telephone plans, the 100-
mile cusp point is not heavily driven by costs. However, 100 miles is at the outer limit of a day’s
drive from East York, suggesting that face-to-face and phone contact are intertwined. Despite the
prevalence of low-cost telephone plans for longer distances, the frequency of phone contact
drops twice as fast for relationships that are more than 100 miles apart.
Tie strength and traditional kinship ties remain important predictors of who contacts whom.
Intimates contact each other more often than non-intimate active ties, regardless of the mode of
contact: face-to-face, by phone or by email. Yet, non-intimates have much contact, calling into
questions assumptions of “social isolation” based only on the dearth of intimate ties (e.g.,
McPherson, Smith-Lovin and Brashears, 2006).

People related by kin—immediate kin or extended kin—are usually in contact with one
another more often than friends or neighbours. Immediate kin are especially apt to be in
frequency contact. The only exception is that friends and neighbours tend to have more face-to-
face contact than extended kin.
Technology has only partially altered the way people maintain their relationships in this
Canadian city. The frequency of face-to-face and phone contact among various role relationships
have hardly changed between the 1970s and the 2000s. Such contact is also similarly sensitive to
distance, pre- and post-Internet, with the exceptions of intimate neighbours and non-intimate
friends. Face-to-face and phone contacts among non-intimate friends have become less sensitive
to distance.
The frequency of overall contact is similar between 1978 and 2005, despite the addition of
email to the ensemble of communication media. Although the mean frequency of overall contact
of once every three days in 2005 is up a bit from once every four days in 1978, mean contact is
not statistically different. However, the frequency of overall contact has become less sensitive to
distance in 2005, reflecting the zero-distance cost of email, lower costs for short and long
distance telephony, and lower airplane travel costs.
As the frequency of face-to-face and phone contact have hardly changed between the two
studies, email accounts for the lion’s share of lower sensitivity to distance. Almost all of the
intercept parameters in 2005 receive an estimate that is not significantly different from those in
1978. The exceptions are face-to-face contact among intimate neighbours and non-intimate
friends. Among intimate neighbours, the frequency of face-to-face contact in 2005 is half as
often as in 1978; among non-intimate friends, the frequency in 2005 is less than one-third of that
in 1978. These results reflect email’s advantage in maintaining contact with weaker ties (Boase

et al., 2006). Moreover, face-to-face contacts among non-intimate friends have also become less
sensitive to distance, perhaps reflecting email’s ease of use and zero cost for arranging such
meetings.
Telephoning is coupled with face-to-face contact in 2005, just as it was in 1978. The
frequency of face-to-face and phone contact is positively related: those who are seen the most
phone the most, and contact by both phone and face-to-face declines by distance.
However, there does appear to be some shift from phone to email. Phone contact among
intimates, intimate and non-intimate friends are less than half as sensitive to distance in 2005 as
compared to 1978.
Implications
Our study has multiple implications for understanding communication technology and social
networks. As with any case study, our specific findings pertain only to the East York locality.
Yet, we believe that their implications are pertinent to North America, the developed world, and
perhaps, the less developed world (for a similar rural Canadian analysis, see Collins, Mok,
Carrasco and Wellman, forthcoming).
First, the results above suggest some “specialization” of various modes of contact with
respect to distance. Face-to-face contact is predominantly local, which involves mainly short-
distance relationships. Despite the widespread availability of cars, transit and planes, its
frequency drops rapidly beyond five miles. By contrast, phone contact is regional. It allows
people to reach alters who live further away: its frequency drops slowly within 100 miles but
drops faster beyond 100 miles. Email is by far the fastest and easiest way to reach people across
provinces and nations.
Second, this is fuzzy specialization, with almost everyone using multiple media, but in
different proportions, depending on their distance apart and the nature of their relationship. All
but neighbours phone or email; all but transoceanic ties have appreciable face-to-face and phone
contact. In between, people use whatever means is necessary and deemed appropriate to
communicate. Although people have become more comfortable with email since its mostly
instrumental use a decade ago, it is hard to hug online. Yet, our interviews tell us that some
people prefer emailing friends and relatives because of its ease and quickness of use: not
everyone wants a nuanced, hugging relationship in every interaction (Wellman and Hogan, et al.,
2006).
Third, distance still matters for personal networks in the Internet era. The frequencies of
both face-to-face and phone contact drop significantly over distance. What is more striking is
that the degree of sensitivity is similar pre- and post-Internet, despite the putative ability of the
Internet to facilitate face-to-face and phone contact. This result contributes to the on-going
debate regarding the death of geography in the advent of telecommunication technologies—our
results support the anti-thesis that geography still matters.
Fourth, compared to 1978, the Internet has enabled the East Yorkers to have more contact
with more ties (Wellman and Hogan, et al., 2006). Face-to-face and phone contact remain high,
with Internet contact (email, etc.) added on to it. This is consistent with American and world
survey data Quan-Haase and Wellman, 2002; Chen, Boase and Wellman, 2002; Boase, et al.,
2006).
Fifth, distance has become effectively shorter in the transitions from carriages to railroads to
expressways to airplanes. With email and phone contact, time may be simultaneous, although
communicators still must deal with time-zone work/sleep cycles. With glocalization, people exist

in multiple times, local and distant (Zeruvabel, 1985; Hongladarom, 2002; Galison, 2003). For
example, one of us will email the editors of this journal trusting they will get our file tomorrow
across the Atlantic; then, one will phone the other 100 km apart – “it’s done”; finally, we will
hug our spouses and turn out the lights in “real time”.
Sixth, the proliferation of email (and IM) and mobile phone use is part of the great
transitions away from door-to-door contact (walking) and place-to-place contact (by phone,
transit or driving). While neighbours still walk door-to-door, and many households drive/fly to
have place-to-place contact, our interviews make it clear that much communication is person-to-
person (Wellman, 2001). At each end of the communication link, people login to their Internet
accounts as individuals, and not as households. Not only is the relationship relatively insensitive
to distance, it can be independent of any other household member. Although still somewhat
sensitive to distance, mobile phone ties also share the characteristic of person-to-person contact
in comparison to traditional landline phones. While our data are from Toronto, we suspect this
transition is happening globally, albeit unevenly (Fortunati, 2003).
Seventh, the result is a personalized and somewhat mobile society, even though we have to
email from somewhere. Our “place” is wherever our computer and phone are (Casey, 1997; Urry
2007). Yet, the continued prevalence of kinship and neighbourhood ties suggests that traditional
solidarities remain strong. Email especially enables kinship ties to be active over great distances,
as the social cohesion of relatives partially surmounts distance. There is a solidary core of some
(but not all) kin, combined with a multitude of sparsely-knit friends. Yet, at the same time,
friendship remains abundant and strong, using whatever communication means needed, time and
availability deemed most necessary for the contact.
Eighth, the continuing importance of kin shows that even in the age of personal networks,
interpersonal social systems are more than the sum of their ties. Kinship is synergistic, with the
social system keeping members in contact. This calls into question overly strong assertions that
the Internet has fostered a world consisting only of voluntary friendship relationships.
Ninth, the combination of face-to-face, phone and email communication means that the role
of cities as interaction maximizers remains, in modified form. Cities continue to foster face-to-
face contact, and much contact is local. There is no global village. Rather, there is glocalization,
with extensive local contact joined by amplified long-distance connectivity. The city is no longer
the boundary – if it ever was – it is the hub.
References
Axhausen, Kay, John Urry and Jonas Larsen. 2007. “The Network Society and the Networked
Traveller.” Research Paper 435, IVT, Swiss Federal Institute of Technology Zurich, May.
Benedict XVI, Pope. 2009. “New Technologies, New Relationships.” January 24.
http://www.vatican.va/holy_father/benedict_xvi/messages/communications/documents/hf_b
en-xvi_mes_20090124_43rd-world-communications-day_en.html
Bernard, H. Russell. 2008. “Honoring Peter Killworth.” Paper presented to the International
Sunbelt Social Network conference,” St. Petersburg, FL, January.
Blokland, Talja and L.K Mitzman. 2003. Urban Bonds. Cambridge: Polity.
Boase, Jeffrey. 2008. “Personal Networks and the Personal Communication System.”
Information Communication and Society 11: 490-508.
Boase, Jeffrey, John Horrigan, Barry Wellman and Lee Rainie. 2006 The Strength of Internet
Ties. Washington: Pew Internet and American Life Project, January.
Butts, Carter. 2009. “The Importance of Simple Things.” Plenary presentation to the

International Sunbelt Social Network Conference, San Diego, March.
Cairncross, Frances. 1997. The Death of Distance. Boston: Harvard Business School Press.
Carrasco, Juan-Antonio, Eric J. Miller and Barry Wellman. 2008. “How Far and With Whom do
People Socialize? Empirical Evidence about Distance Between Social Network Members.”
Transportation Research Record: Journal of the Transportation Research Board 2076: 114-
122.
Casey, Edward. 1997. The Fate of Place. Berkeley: University of California Press.
Castells, Manuel. 2000. The Rise of the Network Society, 2nd ed. Oxford Blackwell.
Castells, Manuel, Mireia Fernandz-Ardevol, Jack Linchuan Qiu and Araba Sey. 2006. Mobile
Connectedness. Cambridge, MA: MIT Press.
Chayko, Mary. 2008. Portable Communities. Albany: State University of New York Press.
Chen, Wenhong, Jeffrey Boase and Barry Wellman. 2002. “The Global Villagers” Pp. 74-113 in
The Internet in Everyday Life, edited by Barry Wellman and Caroline Haythornthwaite.
Oxford: Blackwell.
Chua, Vincent, Julie Madej and Barry Wellman. 2010. “Personal Communities.” Sage Handbook
of Social Network Analysis. London: Sage: forthcoming.
Collins, Jessica, Diana Mok, Barry Wellman and Juan-Antonio Carrasco. 2009. “‘Chapleau Has
Joined the World.’” American Behavioral Scientist: forthcoming
Curtice, John and Pippa Norris. 2007. “Isolates or socialites?” Pp. 239-59 in British Social
Attitudes: the 23rd Report, ed. by A. Park, J. Curtice, K. Thomson, M. Phillips and M.
Johnson. London: Sage.

Faust, K., B. Entwisle, R.R. Rindfuss, S.J. Walsh, and Y. Sawangdee. 2000. "Spatial
Arrangement of Social and Economic Networks Among Villages in Nang Rong District,
Thailand " Social Networks 21: 311-37.
Fischer, Claude. 1982. To Dwell Among Friends. Berkeley: University of California Press.
Fischer, Claude. 1992. America Calling. Berkeley: University of California Press.
Fisher, Dana, and Larry Michael Wright. 2001. “On Utopias and Dystopias.” Journal of
Computer Mediated Communication 6: http:// jcmc.indiana.edu/vol6/issue2/fisher.html
Fortunati, Leopoldina, James Katz, and Raimonda Riccini. 2003. Mediating the Human Body.
Mahwah, NJ: Lawrence Erlbaum.
Frei, Andreas and Axhausen, Kay. 2007. “Size and Structure of Social Network Geographies.”
Research Paper 444, IVT, Swiss Federal Institute of Technology, Zurich, September.
Gram, Sarah, Barry Wellman and Natalie Zinko. 2009. “East York: A Profile.” 2nd ed. Toronto:
NetLab Report.
Green, Nicola. 2002. “On the Move: Technology, Mobility and the Mediation of Social Time
and Space.” The Information Society 18:281-92.
Grossetti, Michel. 2007. “Are French Networks Different?” Social Networks 29: 391-404.
Hampton, Keith, and Barry Wellman. 2002. "The Not So Global Village of Netville." Pp. 345-
371 in The Internet in Everyday Life, edited by Barry Wellman and Caroline
Haythornthwaite. Oxford: Blackwell.
Hipp, John and Andrew Perrin. 2009. “The Simultaneous Effect of Physical Distance and Social
Distance on the Formation of Neighborhood Ties.” City & Community 8: 5-25.
Hampton, Keith, and Barry Wellman. 2003. "Neighboring On and Offline in Netville, the Wired
Suburb." City and Community 1: 277-311.

Hogan, Bernie, Juan-Antonio Carrasco and Barry Wellman. 2007. “Visualizing Personal
Networks.” Field Methods 19: 116-44
Hongladarom Soraj. 2002. “The Web of Time and the Dilemma of Globalization.” The
Information Society 18: 241-49.
Kenyon, Susan and Glenn Lyons. 2006. “Changing Access to Key Activities over Time.” ICT,
Everyday Life and Change conference, Bergen, NL, November.
Kim, Hyo, Wang Jae Kim, Han Woo Park and Ronald Rice. 2007. “Configurations of
Relationships in Different Media.” Journal of Computer Mediated Communication 12:
http://jcmc.indiana.edu/vol12/issue4/kim.html
Marx, Leo. 1964. The Machine in the Garden. New York: Oxford University Press.
Massey, Doreen. 1984. Spatial Divisions of Labour. London: Macmillan.
McLuhan, Marshall. 1962. The Gutenberg Galaxy. Toronto: University of Toronto Press.
McPherson, Miller, Lynn Smith-Lovin and Matthew Brashears. 2006. “Social Isolation in
America.” American Sociological Review 71: 353-75.
Meier, Richard. 1962. A Communications Theory of Urban Growth. Cambridge, MA: MIT Press.
Miyata, Kakuko, Jeffrey Boase and Barry Wellman. 2008. “The Social Effects of Keitai and
Personal Computer Email in Japan.” Pp. 209-222 in the Handbook of Mobile
Communication Studies, edited by James Katz. Cambridge, MIT Press.
Mok, Diana and Barry Wellman. 2007. “Did Distance Matter Before the Internet.” Social
Networks 29: 430-61.
Pred, Allen. 1973. Urban Growth and the Circulation of Information. Cambridge, MA: Harvard
University Press.

Quan-Haase, Anabel and Barry Wellman 2002. “Capitalizing on the Internet: Network.” Pp. 291-
324 in The Internet in Everyday Life, edited by Barry Wellman and Caroline
Haythornthwaite. Oxford: Blackwell.
Shklovski, Irina, Robert Kraut and Jonathon Cummings. 2008. “Keeping in Touch by
Technology.” Proceedings of the Human Factors in Computer Science Conference. New
York. ACM Press.
Stern, Michael and Don A. Dillman. 2006. “Community Participation, Social Ties, and Use of
the Internet.” City and Community 5: 409-24.
Stern, Michael and Chris Messer. 2008. “How Family Members Stay In Touch.” Marriage and
Family Review: forthcoming.
Urry, John. 2007. Mobilities. Cambridge, Polity.
Veenhof, Ben, Barry Wellman, Carsten Quell and Bernie Hogan. 2008. “Isolation, Cohesion or
Transformation?” Connectedness: report series: F0004M-16, December 4.
http://www.statcan.gc.ca/pub/56f0004m/56f0004m2008016-eng.pdf. .
Wellman, Barry. 1979. “The Community Question.” American Journal of Sociology 84: 1201-
31.
Wellman, Barry. 1990. “The Place of Kinfolk in Personal Community Networks.” Marriage and
Family Review 15: 195-228.
Wellman, Barry. 1999. “The Social Affordances of E-Mail.” SIGGROUP Bulletin 20: 63.
Wellman, Barry. 2001. “Physical Place and Cyber-Place.” International Journal for Urban and
Regional Research 25: 227-52.

Wellman, Barry, Peter Carrington, and Alan Hall. 1988. "Networks as Personal Communities."
Pp. 130-84 in Social Structures: A Network Approach, edited by Barry Wellman and S.D.
Berkowitz. Cambridge: Cambridge University Press.
Wellman, Barry and Kenneth Frank. 2001. “Network Capital in a Multi-Level World: Getting
Support in Personal Communities.” Pp. 233-73 in Social Capital, edited by Nan Lin, Karen
Cook and Ronald Burt. Chicago: Aldine DeGruyter, 2001.
Wellman, Barry, and Milena Gulia. 1999. "Net Surfers Don't Ride Alone: Virtual Communities
as Communities." Pp. 331-366 in Networks in the Global Village, edited by Barry
Wellman. Boulder, CO: Westview.
Wellman, Barry and Bernie Hogan, with Kristen Berg, Jeffrey Boase, Juan-Antonio Carrasco,
Rochelle Côté, Jennifer Kayahara, Tracy Kennedy and Phuoc Tran. “Connected Lives.” Pp.
157-211 in Networked Neighbourhoods, edited by Patrick Purcell. Guildford, UK: Springer,
2006.
Wellman, Barry and David Tindall. 1993. “Reach out and Touch Some Bodies.” Progress in
Communication Science 12: 63-94.
Wellman Barry and Scot Wortley. 1990. “Different Strokes from Different Folks:”. American
Journal of Sociology 96: 558-88.

Table 1. Model 1 results: Email/Instant message contact (a) With spline i. Single classification Overall Kinship Not related Intimacy
Immediate kin Extended kin All Friend Intimates Non-intimates
knots
(miles) Estimate S.E. Estimate S.E. Estimate S.E. Estimate S.E. Estimate S.E. Estimate S.E. Estimate S.E.
Intercept 3.92 0.53 4.65 0.59 5.26 1.44 3.78 0.18 3.73 0.27 4.23 0.25 3.65 0.23
LnDist -0.12 0.12 -0.27 0.12 -0.45 0.32 -0.05 0.06 -0.03 0.07 -0.13 0.06 -0.12 0.07
d1*(LnDist-kd1) 50 0.00 0.22 -0.03 0.40 0.24 1.01 0.08 0.29 -0.10 0.30 -0.26 0.29 0.51 0.34
d2*(LnDist-kd2) 500 -0.15 0.44 -0.05 0.73 -0.05 1.70 -0.18 0.59 -0.09 0.61 0.32 0.57 -0.71 0.76
d3*(LnDist-kd3) 3000 1.96 1.07 2.57 1.53 0.73 4.01 1.66 1.70 1.60 1.73 1.86 1.20 0.24 2.57
RIMM -0.52 0.25 -0.86 0.72 -2.54 1.37 -0.35 0.27 -0.57 0.38 -0.45 0.38 -0.46 0.33
RIMM*LnDist 0.09 0.05 0.17 0.11 0.35 0.19 0.01 0.06 0.03 0.07 0.09 0.07 0.03 0.07
N 448 112 41 295 202 259 189
IR var 0.25 0.02 0.00 0.00 0.00 0.00 0.00 0.00 0.00 0.00 0.00 0.00 0.00
IT var 2.73 0.21 2.41 0.34 3.42 0.83 2.72 0.23 2.41 0.24 2.75 1.71 0.13
-2LL 1723.80 409.80 159.50 1138.30 754.70 999.50 714.00
ii. Intimates Kinship Not related
Immediate kin Extended kin All Friend
knots (miles) Estimate S.E. Estimate S.E. Estimate S.E. Estimate S.E.
Intercept 4.72 0.61 7.35 2.34 3.95 0.29 3.55 0.43
LnDist -0.28 0.12 -0.72 0.49 0.01 0.09 0.11 0.11
d1*(LnDist-kd1) 50 0.02 0.46 0.37 1.18 -0.52 0.43 -0.78 0.43
d2*(LnDist-kd2) 500 -0.11 0.86 1.29 2.04 0.65 0.83 0.91 0.82
d3*(LnDist-kd3) 3000 2.64 1.58 -5.39 6.11 1.81 2.05 2.38 1.91
RIMM -0.63 0.74 -4.98 1.83 -0.03 0.47 0.29 0.55
RIMM*LnDist 0.15 0.12 0.70 0.28 -0.02 0.10 -0.12 0.11
N 102 24 133 98
IR var 0.00 0.00 0.00 0.00 0.00 0.00 0.0
IT var 2.46 0.36 3.09 1.06 2.90 0.37 2.32 0.344
-2LL 377.60 81.40 519.30 360.50
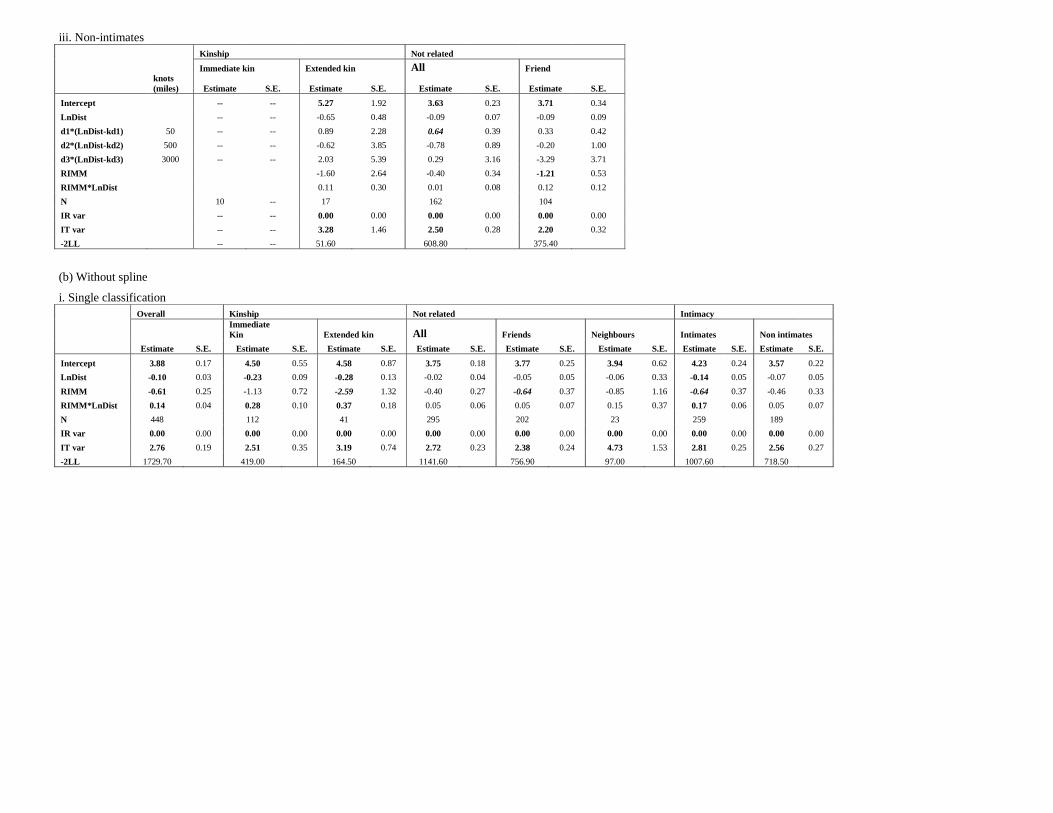
iii. Non-intimates Kinship Not related
Immediate kin Extended kin All Friend
knots (miles) Estimate S.E. Estimate S.E. Estimate S.E. Estimate S.E.
Intercept -- -- 5.27 1.92 3.63 0.23 3.71 0.34
LnDist -- -- -0.65 0.48 -0.09 0.07 -0.09 0.09
d1*(LnDist-kd1) 50 -- -- 0.89 2.28 0.64 0.39 0.33 0.42
d2*(LnDist-kd2) 500 -- -- -0.62 3.85 -0.78 0.89 -0.20 1.00
d3*(LnDist-kd3) 3000 -- -- 2.03 5.39 0.29 3.16 -3.29 3.71
RIMM -1.60 2.64 -0.40 0.34 -1.21 0.53
RIMM*LnDist 0.11 0.30 0.01 0.08 0.12 0.12
N 10 -- 17 162 104
IR var -- -- 0.00 0.00 0.00 0.00 0.00 0.00
IT var -- -- 3.28 1.46 2.50 0.28 2.20 0.32
-2LL -- -- 51.60 608.80 375.40
(b) Without spline
i. Single classification Overall Kinship Not related Intimacy
Immediate Kin Extended kin All Friends Neighbours Intimates Non intimates
Estimate S.E. Estimate S.E. Estimate S.E. Estimate S.E. Estimate S.E. Estimate S.E. Estimate S.E. Estimate S.E.
Intercept 3.88 0.17 4.50 0.55 4.58 0.87 3.75 0.18 3.77 0.25 3.94 0.62 4.23 0.24 3.57 0.22
LnDist -0.10 0.03 -0.23 0.09 -0.28 0.13 -0.02 0.04 -0.05 0.05 -0.06 0.33 -0.14 0.05 -0.07 0.05
RIMM -0.61 0.25 -1.13 0.72 -2.59 1.32 -0.40 0.27 -0.64 0.37 -0.85 1.16 -0.64 0.37 -0.46 0.33
RIMM*LnDist 0.14 0.04 0.28 0.10 0.37 0.18 0.05 0.06 0.05 0.07 0.15 0.37 0.17 0.06 0.05 0.07
N 448 112 41 295 202 23 259 189
IR var 0.00 0.00 0.00 0.00 0.00 0.00 0.00 0.00 0.00 0.00 0.00 0.00 0.00 0.00 0.00 0.00
IT var 2.76 0.19 2.51 0.35 3.19 0.74 2.72 0.23 2.38 0.24 4.73 1.53 2.81 0.25 2.56 0.27
-2LL 1729.70 419.00 164.50 1141.60 756.90 97.00 1007.60 718.50

ii. Intimates Kinship Not related
Immediate kin Extended kin All Friends Neighbours
Estimate S.E. Estimate S.E. Estimate S.E. Estimate S.E. Estimate S.E.
Intercept 4.54 0.57 5.95 1.35 4.03 0.28 3.84 0.40 4.44 0.67
LnDist -0.23 0.09 -0.40 0.20 -0.05 0.07 -0.02 0.08 0.20 0.48
RIMM -0.91 0.75 -4.69 1.72 -0.17 0.46 -0.02 0.54 -0.11 1.35
RIMM*LnDist 0.26 0.11 0.67 0.25 0.04 0.09 -0.02 0.10 -0.17 0.51
N 102 24 133 98 14
IR var 0.00 0.00 0.00 0.00 0.00 0.00 0.00 0.00 0.00 0.00
IT var 2.57 0.37 2.83 0.90 2.91 0.36 2.41 0.35 3.74 1.67
-2LL 386.90 91.70 525.70 369.80 53.00
iii. Non-intimates Kinship Not related
Immediate kin Extended kin All Friends Neighbours
Estimate S.E. Estimate S.E. Estimate S.E. Estimate S.E. Estimate S.E.
Intercept -- -- 3.74 1.03 3.53 0.22 3.72 0.30 2.97 1.20
LnDist -- -- -0.23 0.16 -0.01 0.05 -0.08 0.07 -0.01 0.51
RIMM -1.04 2.38 -0.41 0.33 -1.18 0.52 -1.10 2.05
RIMM*LnDist 0.11 0.28 0.02 0.08 0.11 0.11 -0.10 0.70
N 10 -- 17 162 104 9
IR var -- -- 0.00 0.00 0.00 0.00 0.00 0.00 0.00 0.00
IT var -- -- 2.83 1.11 2.50 0.28 2.19 0.31 5.84 3.70
-2LL -- -- 63.20 615.60 382.10 32.20
Notes:
1. The model with spline is based on the equation ( ) ijjijjdijijjij uXZkXdXZY εγγγγγ +++−+++= 0211
210
110
111
100 , where Yij measures the frequency of
contact; Xij is the residential distance (LnDist) between the respondent and the community tie, and Zj is a dichotomous variable that identifies immigrant respondents (RIMM) in the sample. The variable d is a dummy variable that identifies observations whose distance is greater than the knot kd. The terms
uoj and ijε are the errors of the model.
2. The model without spline is based on the equation ijjijjij uXZY εγγγ ++++= 0100100 . Definitions of the terms are same as before. 3. “IR var” shows the amount of variation at the respondent level, whereas “IT var” is the amount of variation at the community tie level. The total
variation is the sum of IR var and IT var. 4. Estimates in bold faces are significant at the 5 percent level; those that are also italicized are significant at the 10 percent level.

Table 2. Model 2 results: Phone contact
(a) With spline i. Single classification
Overall Kinship Not related Intimacy
Immediate kin Extended kin All Friend Intimates Non-intimates
knots
(miles) Estimate S.E. Estimate S.E. Estimate S.E. Estimate S.E. Estimate S.E. Estimate S.E. Estimate S.E.
Intercept 2.92 0.11 3.98 0.31 3.33 0.51 2.79 0.13 3.03 0.18 3.70 0.14 2.11 0.15
LnDist 0.01 0.03 -0.07 0.07 -0.22 0.11 0.01 0.04 -0.05 0.05 -0.04 0.04 0.03 0.04
d1*(LnDist-kd1) 100 -0.80 0.27 -0.42 0.38 -0.16 0.67 -0.92 0.42 -0.69 0.42 -0.65 0.31 -0.80 0.40
d2*(LnDist-kd2) 500 0.96 0.46 0.37 0.62 0.44 1.13 1.20 0.74 0.97 0.74 0.64 0.53 1.03 0.69
RIMM -0.23 0.17 -0.43 0.45 0.23 0.61 -0.19 0.19 0.04 0.27 -0.06 0.23 0.01 0.22
RIMM*LnDist 0.09 0.03 0.10 0.07 0.09 0.10 0.06 0.05 0.02 0.06 0.11 0.04 0.00 0.05
N 1019 257 112 650 420 550 469
IR var 0.01 0.00 0.00 0.00 0.00 0.00 0.00 0.00 0.00 0.00 0.00 0.00 0.00 0.00
IT var 3.11 0.14 2.33 0.21 2.54 0.35 3.32 0.18 2.83 2.51 0.15 2.69 0.1771
-2LL 4044.70 936.70 425.10 2634.60 1637.80 2064.70 1802.30
ii. Intimates
Kinship Not related
Immediate kin Extended kin All Friend
knots (miles) Estimate S.E. Estimate S.E. Estimate S.E. Estimate S.E.
Intercept 4.25 0.29 3.79 0.62 3.59 0.17 3.76 0.23
LnDist -0.05 0.06 -0.21 0.13 -0.07 0.05 -0.10 0.06
d1*(LnDist-kd1) 100 -0.67 0.36 -0.35 1.02 -0.53 0.61 -0.60 0.62
d2*(LnDist-kd2) 500 0.59 0.58 0.62 1.78 0.40 1.07 0.55 1.10
RIMM -0.53 0.43 -0.37 0.75 0.14 0.30 -0.03 0.36
RIMM*LnDist 0.14 0.07 0.25 0.13 0.08 0.07 0.08 0.08
N 210 52 288 211
IR var 0.00 0.00 0.00 0.00 0.00 0.00 0.00 0.00
IT var 1.78 0.18 2.10 0.44 3.00 0.25 2.62 0.26
-2LL 712.50 185.50 1139.90 807.80

iii. Non-intimates Kinship Not related
Immediate kin Extended kin All Friend
knots (miles) Estimate S.E. Estimate S.E. Estimate S.E. Estimate S.E.
Intercept 2.37 0.92 2.89 0.76 2.06 0.16 2.15 0.24
LnDist -0.03 0.19 -0.25 0.15 0.08 0.05 0.05 0.06
d1*(LnDist-kd1) 100 1.28 1.27 0.23 0.83 -1.12 0.53 -0.86 0.53
d2*(LnDist-kd2) 500 -1.79 1.81 -0.03 1.37 1.54 0.94 1.16 0.93
RIMM 0.39 1.36 0.53 0.89 -0.01 0.23 0.09 0.37
RIMM*LnDist -0.18 0.29 0.01 0.13 -0.02 0.06 -0.03 0.08
N 47 60 362 209
IR var 0.00 0.00 0.00 0.00 0.00 0.00 0.00 0.00
IT var 2.23 0.50 2.41 0.46 2.79 0.21 2.35 0.23
-2LL 163.50 222.80 1407.20 777.90
(b) Without spline i. Single classification
Overall Kinship Not related
Immediate Kin Extended kin All Friends Neighbors
Estimate S.E. SEY-t Estimate S.E. SEY-t Estimate S.E. SEY-t Estimate S.E. SEY-t Estimate S.E. SEY-
t Estimate S.E. SEY-t
Intercept 3.04 0.11 3.96 4.20 0.28 2.19 3.27 0.42 -0.45 2.86 0.12 3.93 3.13 0.17 -2.08 2.88 0.30 0.40
LnDist -0.06 0.02 -1.25 -0.14 0.05 -0.08 -0.21 0.07 0.98 -0.05 0.03 -0.06 -0.10 0.04 4.25 -0.05 0.13 -0.52
RIMM -0.19 0.17 -0.33 0.44 0.21 0.59 -0.16 0.19 0.07 0.27 0.25 0.49
RIMM*LnDist 0.06 0.03 0.07 0.06 0.11 0.09 0.04 0.05 0.02 0.05 0.11 0.19
N 1019 257 112 650 420 96
IR var 0.00 0.00 0.00 0.00 0.00 0.00 0.00 0.00 0.00 0.00 0.00 0.00
IT var 3.16 0.14 2.34 0.21 2.50 0.34 3.34 0.19 2.84 0.20 4.34 0.64
-2LL 4057.0 938.0 426.2 2640.9 1640.0 414.9
Intimacy Intimates Non intimates
Estimate S.E. SEY-t Estimate S.E. SEY-t
Intercept 3.83 0.14 0.95 2.21 0.15 1.45
LnDist -0.11 0.03 0.80 -0.03 0.03 -0.38
RIMM 0.05 0.23 0.01 0.22 RIMM*LnDist 0.06 0.04 -0.01 0.05 N 550 469 IR var 0.00 0.00 0.00 0.00 IT var 2.55 0.15 2.71 0.18 -2LL 2073.1 1806.9

ii. Intimates Kinship Not related
Immediate kin Extended kin All Friends Neighbours Estimate S.E. SEY-t Estimate S.E. SEY-t Estimate S.E. SEY-t Estimate S.E. SEY-t Estimate S.E. SEY-t
Intercept 4.61 0.26 1.61 3.83 0.52 -- 3.65 0.17 1.21 3.88 0.22 -0.70 3.67 0.45 -0.19
LnDist -0.16 0.04 -0.53 -0.22 0.09 -- -0.12 0.04 1.48 -0.17 0.05 2.40 0.24 0.28 1.46
RIMM -0.37 0.42 -0.41 0.72 0.24 0.30 0.07 0.35 0.54 0.71 RIMM*LnDist 0.09 0.06 0.27 0.12 0.03 0.06 0.05 0.07 -0.28 0.32 N 210 52 288 211 41 IR var 0.00 0.00 0.00 0.00 0.00 0.00 0.00 0.00 0.00 0.00 IT var 1.83 0.18 2.02 0.41 3.01 0.25 2.64 0.26 4.40 1.02 -2LL 718.20 187.80 1143.60 811.50 175.10
iii. Non-intimates
Kinship Not related
Immediate kin Extended kin All Friends Neighbours Estimate S.E. SEY-t Estimate S.E. SEY-t Estimate S.E. SEY-t Estimate S.E. SEY-t Estimate S.E. SEY-t
Intercept 2.20 0.89 0.00 2.59 0.60 -0.49 2.14 0.16 1.61 2.30 0.23 -2.44 2.30 0.36 -0.55
LnDist 0.01 0.19 0.16 -0.17 0.10 0.49 0.02 0.04 1.48 -0.01 0.05 4.06 -0.01 0.14 -0.53
RIMM 0.16 1.16 0.62 0.62 -0.01 0.23 0.13 0.37 -0.21 0.59 RIMM*LnDist -0.08 0.21 0.02 0.12 -0.04 0.06 -0.04 0.08 0.07 0.28 N 47 60 362 209 55 IR var 0.00 0.00 0.00 0.00 0.00 0.00 0.00 0.00 0.00 0.00 IT var 2.17 0.47 2.35 0.44 2.83 0.21 2.37 0.23 3.32 0.66 -2LL 167.90 225.10 1413.10 781.50 221.50
Notes:
1. The model with spline is based on the equation ( ) ijjijjdijijjij uXZkXdXZY εγγγγγ +++−+++= 0211
210
110
111
100 , where Yij measures the frequency of
contact; Xij is the residential distance (LnDist) between the respondent and the community tie, and Zj is a dichotomous variable that identifies immigrant respondents (RIMM) in the sample. The variable d is a dummy variable that identifies observations whose distance is greater than the knot kd. The terms
uoj and ijε are the errors of the model.
2. The model without spline is based on the equation ijjijjij uXZY εγγγ ++++= 0100100 . Definitions of the terms are same as before. 3. “IR var” shows the amount of variation at the respondent level, whereas “IT var” is the amount of variation at the community tie level. The total
variation is the sum of IR var and IT var. 4. Estimates in bold faces are significant at the 5 percent level; those that are also italicized are significant at the 10 percent level. 5. The column “SEY-t” shows the t-statistics for comparing the parameter estimates reported in the Second East York study. The sample of Intimate
extended kin is excluded for comparison because the sample size is too small (n=7) in the Second East York study.

Table 3. Model 3 results: Face-to-face contact (a) With spline i. Single classification
Overall Kinship Not related Intimacy
Immediate kin Extended kin All Friend Intimates Non-intimates
knots
(miles) Estimate S.E. Estimate S.E. Estimate S.E. Estimate S.E. Estimate S.E. Estimate S.E. Estimate S.E.
Intercept 3.68 0.09 3.89 0.25 3.50 0.36 3.66 0.11 3.28 0.17 3.77 0.12 3.60 0.14
LnDist -0.14 0.07 -0.12 0.08 -0.10 0.10 -0.16 0.04 -0.09 0.06 -0.08 0.04 -0.22 0.05
d1*(LnDist-kd1) 5 -0.20 0.11 -0.21 0.17 -0.38 0.25 -0.22 0.16 -0.23 0.17 -0.26 0.14 -0.24 0.18
d2*(LnDist-kd2) 50 -0.10 0.28 -0.10 0.36 -0.01 0.57 0.00 0.44 0.04 0.45 -0.30 0.34 0.36 0.47
d3*(LnDist-kd3) 200 0.09 0.29 -0.04 0.38 0.25 0.60 0.03 0.46 -0.14 0.47 0.27 0.36 -0.26 0.48
RIMM -0.15 0.14 -0.36 0.31 -0.36 0.39 -0.08 0.17 -0.16 0.24 0.02 0.19 -0.24 0.19
RIMM*LnDist -0.01 0.03 0.01 0.05 0.03 0.06 -0.01 0.04 0.00 0.05 -0.02 0.04 0.00 0.04
N 1019 257 112 650 420 550 469
IR var 0.00 0.00 0.00 0.00 0.00 0.00 0.00 0.00 0.00 0.00 0.00 0.00 0.00 0
IT var 1.97 0.09 1.11 0.10 1.03 0.14 2.46 0.14 2.28 0.16 1.17 0.10 2.11 0.1398
-2LL 3584.50 754.80 330.70 2443.90 1550.60 1860.40 1691.10
ii. Intimates Kinship Not related
Immediate kin Extended kin All Friend
knots (miles) Estimate S.E. Estimate S.E. Estimate S.E. Estimate S.E.
Intercept 4.00 0.25 3.17 0.52 3.76 0.15 3.55 0.22
LnDist -0.12 0.08 0.13 0.16 -0.09 0.07 -0.06 0.08
d1*(LnDist-kd1) 5 -0.15 0.17 -0.76 0.34 -0.26 0.24 -0.25 0.25
d2*(LnDist-kd2) 50 -0.40 0.39 0.17 0.90 -0.30 0.61 -0.26 0.64
d3*(LnDist-kd3) 200 0.29 0.41 0.14 1.01 0.27 0.63 0.13 0.67
RIMM -0.10 0.33 -0.21 0.58 0.14 0.27 -0.06 0.33
RIMM*LnDist -0.02 0.05 0.03 0.10 -0.04 0.06 -0.01 0.07
N 210 52 288 211
IR var 0.00 0.00 0.00 0.00 0.00 0.00 0.50 0.00
IT var 1.04 0.10 1.29 0.27 2.31 0.19 1.78 2.30
-2LL 606.60 163.30 1067.50 765.80

iii. Non-intimates Kinship Not related
Immediate kin Extended kin All Friend
knots (miles) Estimate S.E. Estimate S.E. Estimate S.E. Estimate S.E.
Intercept 3.07 0.90 4.06 0.45 3.57 0.16 2.93 0.24
LnDist 0.00 0.27 -0.36 0.12 -0.21 0.06 -0.08 0.08
d1*(LnDist-kd1) 5 -0.53 0.47 -0.07 0.29 -0.26 0.23 -0.33 0.23
d2*(LnDist-kd2) 50 1.02 0.84 0.11 0.67 0.32 0.64 0.38 0.61
d3*(LnDist-kd3) 200 -1.26 0.79 0.09 0.66 -0.18 0.68 -0.36 0.66
RIMM -1.38 0.98 -0.86 0.48 -0.16 0.22 -0.32 0.34
RIMM*LnDist 0.12 0.21 0.08 0.07 -0.01 0.06 0.02 0.07
N 47 -- 60 362 209
IR var 0.00 0.00 0.00 0.00 0.00 0.00 0.00 0.0
IT var 0.98 0.22 0.66 0.13 2.50 0.19 2.07 0.21
-2LL 130.70 152.70 1368.50 753.30
(b) Without spline
i. Single classification
Overall Kinship Not related
Immediate Kin Extended kin All Friends Neighbours
Estimate S.E. SEY-t Estimate S.E. SEY-t Estimate S.E. SEY-t Estimate S.E. SEY-t Estimate S.E. SEY-t Estimate S.E. SEY-t
Intercept 3.84 0.09 1.17 4.38 0.19 -0.39 4.08 0.28 2.32 3.75 0.11 0.32 3.49 0.15 -0.79 4.53 0.17 -0.19
LnDist -0.26 0.02 -1.24 -0.30 0.03 0.98 -0.33 0.04 -0.70 -0.25 0.03 -1.63 -0.22 0.03 1.39 -0.31 0.08 -4.61
RIMM -0.10 0.14 -0.17 0.31 -0.57 0.39 -0.05 0.17 -0.06 0.24 0.47 0.28
RIMM*LnDist -0.04 0.03 -0.04 0.04 0.06 0.06 -0.04 0.04 -0.03 0.05 -0.06 0.11
N 1019 257 112 650 420 96
IR var 0.00 0.00 0.00 0.00 0.00 0.00 0.00 0.00 0.00 0.00 0.00 0.00
IT var 2.01 0.09 1.15 0.10 1.07 0.15 2.48 0.14 2.32 0.16 1.40 0.21
-2LL 3602.40 762.70 334.40 2448.40 1556.90 310.60
Intimacy Intimates Non intimates
Estimate S.E. SEY-t Estimate S.E. SEY-t
Intercept 4.02 0.11 -1.12 3.67 0.13 0.93
LnDist -0.25 0.02 0.06 -0.28 0.03 -1.16
RIMM 0.21 0.19 -0.25 0.19 RIMM*LnDist -0.08 0.03 -0.01 0.04 N 550 469 IR var 0.00 0.00 0.00 0.00 IT var 1.82 0.11 2.11 0.14 -2LL 1888.80 1689.20

ii. Intimates
Kinship Not related
Immediate kin Extended kin All Friends Neighbours Estimate S.E. SEY-t Estimate S.E. SEY-t Estimate S.E. SEY-t Estimate S.E. SEY-t Estimate S.E. SEY-t
Intercept 4.50 0.20 -0.08 4.17 0.45 -- 3.89 0.15 -1.22 3.81 0.21 -0.20 4.45 0.24 -2.66
LnDist -0.31 0.03 -0.73 -0.31 0.08 -- -0.23 0.04 0.90 -0.23 0.05 0.46 -0.34 0.15 -1.86
RIMM 0.09 0.33 -0.44 0.62 0.30 0.26 0.12 0.33 1.25 0.39 RIMM*LnDist -0.06 0.05 0.06 0.10 -0.10 0.05 -0.07 0.07 -0.13 0.17 N 210 52 288 211 41 IR var 0.00 0.00 0.00 0.00 0.00 0.00 0.00 0.00 0.00 0.00 IT var 1.10 0.11 1.50 0.31 2.38 0.20 2.40 0.24 1.31 0.31 -2LL 615.80 173.40 1076.40 791.90 130.30
iii. Non-intimates
Kinship Not related Immediate kin Extended kin All Friends Neighbours Estimate S.E. SEY-t Estimate S.E. SEY-t Estimate S.E. SEY-t Estimate S.E. SEY-t Estimate S.E. SEY-t
Intercept 3.65 0.61 -0.66 3.96 0.31 1.99 3.63 0.15 0.12 3.16 0.22 -3.73 4.59 0.22 0.56
LnDist -0.22 0.13 0.84 -0.35 0.05 -0.89 -0.28 0.04 -1.69 -0.20 0.05 4.39 -0.31 0.09 -4.34
RIMM -1.08 0.80 -0.85 0.44 -0.17 0.22 -0.29 0.34 -0.27 0.37 RIMM*LnDist 0.01 0.14 0.09 0.06 -0.01 0.06 0.02 0.07 0.06 0.18 N 47 60 362 209 55 IR var 0.00 0.00 0.00 0.00 0.00 0.00 0.00 0.00 0.00 0.00 IT var 1.02 0.22 0.63 0.12 2.49 0.19 2.09 0.21 1.29 0.25 -2LL 136.10 -- 151.40 1367.90 755.50 171.50
Notes:
1. The model with spline is based on the equation ( ) ijjijjdijijjij uXZkXdXZY εγγγγγ +++−+++= 0211
210
110
111
100 , where Yij measures the frequency of
contact; Xij is the residential distance (LnDist) between the respondent and the community tie, and Zj is a dichotomous variable that identifies immigrant respondents (RIMM) in the sample. The variable d is a dummy variable that identifies observations whose distance is greater than the knot kd. The terms
uoj and ijε are the errors of the model.
2. The model without spline is based on the equation ijjijjij uXZY εγγγ ++++= 0100100 . Definitions of the terms are same as before. 3. “IR var” shows the amount of variation at the respondent level, whereas “IT var” is the amount of variation at the community tie level. The total
variation is the sum of IR var and IT var. 4. Estimates in bold faces are significant at the 5 percent level; those that are also italicized are significant at the 10 percent level. 5. The column “SEY-t” shows the t-statistics for comparing the parameter estimates reported in the Second East York study. The sample of Intimate
extended kin is excluded for comparison because the sample size is too small (n=7) in the Second East York study.

Table 4. Model 4 results: Overall contact (a) With spline i. Single classification
Overall Kinship Not related Intimacy
Immediate kin Extended kin All Friend Neighbours Intimates Non-intimates
knots
(miles) Estimate S.E. Estimate S.E. Estimate S.E. Estimate S.E. Estimate S.E. Estimate S.E. Estimate S.E. Estimate S.E.
Intercept 4.70 0.10 5.11 0.34 4.82 0.51 4.64 0.11 4.57 0.17 5.08 0.17 5.00 0.12 4.37 0.15
LnDist -0.11 0.04 -0.12 0.11 -0.17 0.15 -0.11 0.04 -0.11 0.06 -0.10 0.09 -0.08 0.05 -0.12 0.05
d1*(LnDist-kd1) 5 -0.16 0.12 -0.19 0.24 -0.15 0.36 -0.14 0.16 -0.03 0.18 -1.38 0.67 -0.12 0.14 -0.38 0.19
d2*(LnDist-kd2) 50 -0.18 0.37 0.04 0.62 -1.45 1.03 0.03 0.51 -0.35 0.53 1.98 6.83 -0.68 0.42 1.04 0.59
d3*(LnDist-kd3) 150 0.42 0.37 0.24 0.63 1.96 1.05 0.18 0.51 0.35 0.54 -0.07 8.30 0.89 0.42 -0.80 0.59
RIMM -0.26 0.15 -0.30 0.43 -0.82 0.55 -0.17 0.17 -0.20 0.25 0.33 0.29 -0.04 0.20 -0.23 0.20
RIMM*LnDist 0.08 0.03 0.06 0.07 0.15 0.09 0.06 0.04 0.04 0.05 0.15 0.20 0.10 0.04 0.00 0.04
N 1019 257 112 650 420 96 550 469
IR var 0.00 0.00 0.00 0.00 0.00 0.00 0.00 0.00 0.00 0.00 0.00 0.00 0.60 0.00 0
IT var 2.32 0.10 2.17 0.20 2.05 0.29 2.36 0.13 2.32 0.16 1.42 0.21 1.30 2.25 0.1491
-2LL 3714.00 919.90 395.10 2386.80 1539.60 296.30 1818.10 1694.40
ii. Intimates Kinship Not related
Immediate kin Extended kin All Friend
knots (miles) Estimate S.E. Estimate S.E. Estimate S.E. Estimate S.E.
Intercept 5.33 0.28 4.86 0.52 4.94 0.15 4.94 0.21
LnDist -0.14 0.09 -0.05 0.16 -0.08 0.06 -0.09 0.07
d1*(LnDist-kd1) 5 -0.03 0.21 -0.29 0.39 -0.12 0.23 0.05 0.23
d2*(LnDist-kd2) 50 -0.60 0.56 -0.77 1.17 -0.72 0.68 -1.28 0.69
d3*(LnDist-kd3) 150 0.78 0.57 1.01 1.28 0.90 0.68 1.31 0.70
RIMM -0.10 0.39 -1.20 0.59 0.17 0.26 0.02 0.31
RIMM*LnDist 0.08 0.06 0.36 0.10 0.06 0.06 0.04 0.06
N 210 52 288 211
IR var 0.00 0.00 0.00 0.00 0.00 0.00 0.00 0.00
IT var 1.45 0.15 1.30 0.28 2.12 0.18 1.97 0.20
-2LL 671.70 159.70 1036.70 747.30

iii. Non-intimates Kinship Not related
Immediate kin Extended kin All Friend
knots (miles) Estimate S.E. Estimate S.E. Estimate S.E. Estimate S.E.
Intercept 3.12 1.28 5.15 0.72 4.36 0.15 3.98 0.26
LnDist 0.30 0.39 -0.38 0.20 -0.11 0.06 -0.02 0.08
d1*(LnDist-kd1) 5 -1.31 0.68 -0.04 0.48 -0.25 0.22 -0.30 0.24
d2*(LnDist-kd2) 50 3.50 1.48 -1.05 1.37 0.99 0.72 0.86 0.74
d3*(LnDist-kd3) 150 -2.86 1.42 1.75 1.34 -0.81 0.73 -0.97 0.77
RIMM -0.56 1.39 -1.10 0.76 -0.19 0.21 -0.36 0.36
RIMM*LnDist -0.13 0.29 0.09 0.12 0.00 0.05 0.01 0.08
N 47 60 362 209
IR var 0.00 0.00 0.00 0.00 0.00 0.00 0.00 0.00
IT var 1.99 0.45 1.63 0.32 2.27 0.17 2.19 0.22
-2LL 157.60 197.00 1311.50 749.70
(b) Without spline
i. Single classification
Overall Kinship Not related
Immediate Kin Extended kin All Friends Neighbours
Estimate S.E. SEY-t Estimate S.E. SEY-t Estimate S.E. SEY-t Estimate S.E. SEY-t Estimate S.E. SEY-t Estimate S.E. SEY-t
Intercept 4.77 0.09 2.50 5.20 0.27 0.17 5.23 0.39 1.50 4.67 0.10 2.27 4.66 0.16 0.50 5.12 0.18 1.02
LnDist -0.17 0.02 1.63 -0.18 0.05 1.70 -0.34 0.06 -0.26 -0.15 0.03 1.76 -0.16 0.03 2.99 -0.27 0.08 -3.73
RIMM -0.28 0.15 -0.39 0.42 -1.05 0.55 -0.18 0.16 -0.17 0.24 0.29 0.30
RIMM*LnDist 0.09 0.03 0.09 0.06 0.23 0.08 0.06 0.04 0.04 0.05 0.21 0.11
N 1019 257 112 650 420 96
IR var 0.00 0.00 0.00 0.00 0.00 0.00 0.00 0.00 0.00 0.00 0.00
IT var 2.33 0.10 2.16 2.10 0.29 2.35 0.13 2.32 0.16 1.57 0.23
-2LL 3713.50 918.80 400.30 2383.80 1537.70 314.40
Intimacy Intimates Non intimates
Estimate S.E. SEY-t Estimate S.E. SEY-t
Intercept 5.12 0.11 -0.28 4.42 0.14 1.41
LnDist -0.17 0.02 2.97 -0.19 0.03 3.06
RIMM -0.01 0.19 -0.26 0.20
RIMM*LnDist 0.10 0.03 0.00 0.04
N 550 469 IR var 0.00 0.00 0.00 0.00 IT var 1.83 0.11 2.25 0.15

-2LL 1883.50 1694.80
ii. Intimates
Kinship Not related Immediate kin Extended kin All Friends Neighbours Estimate S.E. SEY-t Estimate S.E. SEY-t Estimate S.E. SEY-t Estimate S.E. SEY-t Estimate S.E. SEY-t
Intercept 5.44 0.23 0.47 5.43 0.43 -- 5.02 0.14 -0.32 5.09 0.20 0.68 5.38 0.23 -0.65
LnDist -0.19 0.04 0.92 -0.29 0.07 -- -0.18 0.04 3.45 -0.19 0.04 1.94 -0.07 0.14 0.26
RIMM -0.17 0.38 -1.35 0.59 0.23 0.25 0.08 0.30 0.93 0.37
RIMM*LnDist 0.10 0.05 0.39 0.10 0.05 0.05 0.04 0.06 -0.05 0.16
N 210 52 288 211 41 IR var 0.00 0.00 0.00 0.00 0.00 0.00 0.00 0.00 0.00 0.00 IT var 1.45 0.14 1.32 0.27 2.14 0.18 2.02 0.20 1.16 0.27 -2LL 670.90 164.20 1039.40 752.30 122.60
iii. Non-intimates
Kinship Not related
Immediate kin Extended kin All Friends Neighbours Estimate S.E. SEY-t Estimate S.E. SEY-t Estimate S.E. SEY-t Estimate S.E. SEY-t Estimate S.E. SEY-t
Intercept 4.32 0.88 -0.48 5.02 0.52 1.80 4.35 0.14 0.76 4.17 0.23 -1.30 4.95 0.23 0.77
LnDist -0.18 0.18 0.34 -0.37 0.08 -1.14 -0.12 0.04 1.68 -0.12 0.05 3.82 -0.29 0.09 -3.87
RIMM -1.38 1.15 -1.21 0.73 -0.20 0.21 -0.36 0.36 -0.34 0.38
RIMM*LnDist 0.06 0.20 0.19 0.11 0.01 0.05 0.01 0.07 0.09 0.18
N 47 60 362 209 55 IR var 0.00 0.00 0.00 0.00 0.00 0.00 0.00 0.00 0.00 0.00 IT var 2.12 0.46 1.68 0.32 2.26 0.17 2.20 0.22 1.37 0.24 -2LL 166.80 -- 202.80 1311.20 751.50 173.00
Notes:
1. The model with spline is based on the equation ( ) ijjijjdijijjij uXZkXdXZY εγγγγγ +++−+++= 0211
210
110
111
100 , where Yij measures the frequency of
contact; Xij is the residential distance (LnDist) between the respondent and the community tie, and Zj is a dichotomous variable that identifies immigrant respondents (RIMM) in the sample. The variable d is a dummy variable that identifies observations whose distance is greater than the knot kd. The terms
uoj and ijε are the errors of the model.
2. The model without spline is based on the equation ijjijjij uXZY εγγγ ++++= 0100100 . Definitions of the terms are same as before. 3. “IR var” shows the amount of variation at the respondent level, whereas “IT var” is the amount of variation at the community tie level. The total
variation is the sum of IR var and IT var. 4. Estimates in bold faces are significant at the 5 percent level; those that are also italicized are significant at the 10 percent level. 5. The column “SEY-t” shows the t-statistics for comparing the parameter estimates reported in the Second East York study. The sample of Intimate
extended kin is excluded for comparison because the sample size is too small (n=7) in the Second East York study.

Figure 1. Number of alters by distance
(a) Alters located within 20 miles
(b) Alters located beyond 20 miles

Figure 2. Scatterplot of frequency of email/instant message contact by distance
(a) Within 500 miles
0
100
200
300
400
500
600
700
800
900
1000
0 100 200 300 400 500
Distanace (miles)
Times in a year
(b) 500–3000 miles and beyond 3000 miles
0
100
200
300
400
500
600
700
800
900
1000
500 1000 1500 2000 2500 3000 3500 4000 4500 5000
Distanace (miles)
Times in a year
Actual observations
Trend line Means
Actual observations
Trend line
Means

Figure 3. Scatterplot of frequency of face-to-face contact by distance
(a) 0–5 miles and 5–50 miles
0
50
100
150
200
250
300
350
0 10 20 30 40 50
Distance (miles)
Frequency (times in a year)
(b) 50–500 miles
0
10
20
30
40
50
60
70
80
90
100
50 100 150 200 250 300 350 400 450 500
Distance (miles)
Frequency (times in a year)
(c) Beyond 500 miles
0
2
4
6
8
10
12
500 1500 2500 3500 4500 5500
Distance (miles)
Times in a year
Actual observations
Trend line
Means
Actual observations
MTrend
line
Actual observation
Trend line
Mean

Figure 4. Scatterplot of frequency of phone contact by distance
(a) 0–100 miles and 100–500 miles
0
200
400
600
800
1000
1200
0 100 200 300 400 500
Distance (miles)
Times in a year
(b) Beyond 500 miles
0
100
200
300
400
500
600
500 1000 1500 2000 2500 3000 3500 4000 4500 5000
Distance (miles)
Times in a year
Note: The trend lines are flat lines almost overlapping with the means. They are excluded for clarity purposes.
Actual observations
Means
Actual observation
Means

54
Figure 5. Frequency of Face to Face Contact by Distance
26
110
81
7 7
134
8123
5
66
8275
92
13 6 9
78
0%
20%
40%
60%
80%
100%
0 - 5 miles
5 - 50miles
50 - 500miles
500 ormoremiles
NeverR arelyW eeklyMonthlyF ew times per weekDaily

55
Figure 6. Frequency of Phone Contact by Distance
54 2 7
1315 18
113
9 17
21726 66
114 18 45
94 7 23
0%
20%
40%
60%
80%
100%
0-100 miles 100-500 miles 500 or moremiles
NeverR arelyWeeklyMonthlyF ew times per weekDaily
Formatted: Left: 1", Right: 1",Top: 1", Bottom: 1", Width: 8.5",Height: 11"

56
Figure 7. Frequency of Email Contact by Distance
32 347 4 947 1 17
134 433
64 319
474 1766
0%10%20%30%40%50%60%70%80%90%
100%
0 - 500 miles 500 - 3000miles
3000 or moremiles
NeverR arelyWeeklyMonthlyF ew times per weekDaily