does differential treatment translate to differential outcomes … · “does differential...
TRANSCRIPT
Does Differential Treatment Translate to Differential Outcomes for Minority Borrowers? Evidence from Matching a Field Experiment to Loan-Level Data
Andrew Hanson
Marquette University
Zackary Hawley Texas Christian University
Hal Martin
Federal Reserve Bank of Cleveland
Working Paper 17-14
June 2017
The views expressed herein are those of the authors and not necessarily those of the Federal Reserve Bank of Minneapolis or the Federal Reserve System. This paper was originally published as Working Paper no. 17-03 by the Federal Reserve Bank of Cleveland. This paper may be revised. The most current version is available at https://www.clevelandfed.org/~/media/content/newsroom%20and%20events/publications/working%20papers/2017/wp%201703%20differential%20treatment%20and%20outcomes%20minority%20borrowers.pdf?la=en. __________________________________________________________________________________________
Opportunity and Inclusive Growth Institute Federal Reserve Bank of Minneapolis • 90 Hennepin Avenue • Minneapolis, MN 55480-0291
https://www.minneapolisfed.org/institute

w o r k i n g
p a p e r
F E D E R A L R E S E R V E B A N K O F C L E V E L A N D
17 03
Does Differential Treatment Translate to Differential Outcomes for Minority Borrowers? Evidence from Matching a Field Experiment to Loan-Level Data
Andrew Hanson, Zackary Hawley, and Hal Martin

Working papers of the Federal Reserve Bank of Cleveland are preliminary materials circulated to stimulate discussion and critical comment on research in progress. They may not have been subject to the formal editorial review accorded offi cial Federal Reserve Bank of Cleveland publications. The views stated herein are those of the authors and are not necessarily those of the Federal Reserve Bank of Cleveland or the Board of Governors of the Federal Reserve System.
Working papers are available on the Cleveland Fed’s website: https://clevelandfed.org/wp

Working Paper 17-03 March 2017
Does Differential Treatment Translate to Differential Outcomes for Minority Borrowers?
Evidence from Matching a Field Experiment to Loan-Level DataAndrew Hanson, Zackary Hawley, and Hal Martin
This paper provides evidence on the relationship between differential treatment of minority borrowers and their mortgage market outcomes. Using data from a fi eld experiment that identifi es differential treatment matched to real borrower transactions in the Home Mortgage Disclosure Act (HMDA) data, we estimate difference-in-difference models between African American and white borrowers across lending institutions that display varying degrees of differential treatment. Our results show that African Americans are more likely to be in a high-cost (subprime) loan when borrowing from lenders that are more responsive to them in the fi eld experiment. We also show that net measures of differential treatment are not related to the probability of African American borrowers having a high-cost loan. Our results suggest that differential outcomes are related to within-institution factors, not just across-institution factors like institutional access, as previous studies fi nd.
Keywords: discrimination, mortgage lending, loan outcomes.
JEL classifi cations: G2; J15.
Suggested citation: Hanson, Andrew, Zackary Hawley, and Hal Martin, “Does Differential Treatment Translate to Differential Outcomes for Minority Borrowers? Evidence from Matching a Field Experiment to Loan-Level Data,” Federal Reserve Bank of Cleveland, Working Paper no. 17-03.
Andrew Hanson is at Marquette University ([email protected]). Zackary Hawley is at Texas Christian University ([email protected]), and Hal Martin is at the Federal Reserve Bank of Cleveland ([email protected]).

I. Introduction
There are substantial documented differences in lending outcomes between white and minority
borrowers. Recent findings show outcome differences for minority borrowers in the form of
higher delinquency rates and more foreclosures (Bayer, Ferreira, and Ross 2016a and Bhutta and
Canner 2013), the price paid for credit (Ghent, Hernández-Murillo, and Owyang 2014 and
Bayer, Ferreira and Ross 2016b), and higher denial rates (Bhutta and Canner 2013).1 These
studies document the persistence of outcome differences even after conditioning on relevant
factors that are typically not available in previous studies, most notably borrower credit scores.
There are also substantial documented differences in borrower treatment between whites and
minorities. Using an in-person audit design Ross, Turner, Godfrey, and Smith (2008) find that
lenders in Chicago are less likely to follow up, offer details about loans, submit requested
information, and give coaching to minority clients than they are to whites. Using an e-mail
based correspondence experiment Hanson, Hawley, Martin, and Liu (2016) find that a national
sample of lenders is less likely to respond, less likely to follow-up, and less likely to offer details
to African American clients than whites.
Despite evidence that both differential outcomes and differential treatment exist, there is
no empirical work that convincingly links the two.2 Even in differential outcome studies that
offer the most comprehensive controls for borrower, lender, and area characteristics, missing
variables prevent researchers from claiming that differential treatment of minorities directly
causes outcome differences. Differential treatment studies on the other hand, often tightly
1 See Ross and Yinger (2002) for a comprehensive review of pre-2000 studies of mortgage discrimination. These studies focus on differential outcomes and work to isolate race as the cause of outcome differences with a focus on limiting omitted variable bias. 2 Collins (2004) estimates the relationship between differential treatment and outcomes indirectly by examining the impact of state-level anti-discrimination laws on segregation and property values. Collins (2004) reports that these laws have essentially no impact on segregation or property values in African American neighborhoods.
2
identify treatment differences using experiments or audits, but are limited to more general
interactions like response or information provision and cannot examine the terms or underwriting
of a real loan.
This paper is the first to examine the link between differential treatment of minority
borrowers and differential outcomes for minority borrowers. Understanding the link between
differential treatment and differential outcomes helps to inform how to reconcile observable
outcome differences between groups. If differential treatment is not strongly linked to
differential outcomes, reconciling between-group differences may rely on changing underlying
characteristics of borrowers or improving access to lenders. If differential treatment is strongly
linked to differential outcomes, reconciling between-group differences may be narrowed by
enforcing fair-lending standards or lender training.
Using the results of an industry-wide field experiment matched to loan-level data on
mortgage applications, we examine how differential treatment of minority borrowers at the
lender-level affects individual minority borrowing outcomes. Identifying lenders at the
institution-branch level, we make difference-in-difference comparisons between African
American and white borrowers across branches practicing varying levels of differential
treatment. We implement both a standard difference-in-difference model and a model using
branch-level fixed effects, and examine how both net and gross levels of differential treatment
affect loan outcomes.
Our results show that African Americans are more likely to be in a high-cost (subprime)
loan when borrowing from branches of lending institutions that are more responsive to them in
the field experiment. We also show that net measures of differential treatment are not related to
the probability of African American borrowers having a high-cost loan. The magnitude of our
3

results suggests that for a one standard deviation increase in the African American response rate
(35 percentage points), African Americans have a 2.4–2.5 percentage point increase in the
likelihood of being in a high-cost loan. These results suggest that differential outcomes are
related to within-institution factors like client steering. This finding is unique, as recent studies
of borrowing outcomes suggest that white-minority differences are largely a function of cross-
institution factors like differential access.
The remainder of the paper begins by describing the experiment used to identify
differential treatment in the mortgage industry. Section III is an overview of the Home Mortgage
Disclosure Act (HMDA) data on lending outcomes and how this data is matched to the
experiment. Section IV describes the empirical methodology for estimating the relationship
between differential treatment and differential outcomes of minority borrowers. Sections V and
VI present our primary results and several robustness checks. The final section of the paper
concludes.
II. Identifying Differential Treatment
Hanson, Hawley, Martin, and Liu (2016) design and implement a field experiment to test for
differential treatment between African American and white borrowers by Mortgage Loan
Originators (MLOs).3 The original experiment is a matched-pair correspondence study, using e-
mail communication with MLOs from borrowers with names that are highly likely to belong to
only one racial group. Correspondence studies of discrimination have been conducted in the
rental market (Ahmed & Hammarstedt 2008; Hanson & Hawley 2011; Carlsson & Ericksson
2014), the labor market (Bertrand & Mullainathan 2004; Bursell 2007; Nunley et al. 2014), and
3 The original experiment also includes a credit score treatment that we do not consider here.
4

in other markets such as peer-to-peer lending (Pope & Sydnor 2011). Oh and Yinger (2015)
provide a recent comprehensive review of both traditional paired testing and correspondence
studies in housing and mortgage markets, while Bertrand and Duflo (2016) review
correspondence studies conducted in several markets, including rental housing.
The subjects of the experiment in Hanson et al. (2016), MLOs, are an initial contact point
for most borrowers when searching for a mortgage. They are licensed sales people that have
discretion about how they interact with clients. MLOs for instance, may offer general financial
advice to clients, specific recommendations about obtaining a loan, an opinion about credit
scores, and terms of a loan. The experimental sample includes 5,181 MLOs (10,362 e-mails)
and is geographically representative of the United States by population (sample sizes in each
state are proportional to state populations). The sample of MLOs in the experiment is 70 percent
white, and 5 percent non-white, with 25 percent of the sample racially unidentified. 42.5 percent
of MLOs in the sample are male, 37 percent female, and 20.5 percent gender unidentified.
The overall response rate from the experiment is 67.0 percent. The gross response rate to
white clients is 68.31 percent, while the gross response rate to African Americans is 65.68
percent. The gross response rate difference reveals a differential treatment of 2.63 percent in the
full sample of MLOs, statistically meaningful at the one percent level. The Hanson et al. (2016)
experiment tests for discrimination on a number of dimensions where MLO treatment may differ,
but we focus on two measures—the gross initial response rate to African Americans and net
initial response rate (African American response rate minus white response rate).4
4 The original experiment tests for differential treatment along several other dimensions including propensity to follow up and the type of information (if any) included in a response. We attempted to use these other measures of differential treatment to examine differential outcomes, but these results generally produce a null finding. We suspect that this null finding is because our other measures of differential treatment are a function of the initial response, and represent a much smaller proportion of MLOs once we match to the HMDA data.
5

Both of our measures are aggregated to the branch level of lending institutions to match
with the HMDA data as described in the next section. The gross response rate to African
Americans is the branch-level aggregate response rate from MLOs to African Americans in the
field experiment. The gross response rate measures the overall responsiveness of the branch to
African American inquiries irrespective of how the branch responds to white clients. The net
response rate is the gross response rate to African Americans minus the gross response rate to
whites from the field experiment.
III. HMDA Data
We combine data on treatment from the experiment with data on borrowers and loans made
available through the Home Mortgage Disclosure Act (HMDA). HMDA requires most lenders5
to collect detailed information about loan applications, including the race of the borrower and
location of the property in question. The HMDA data includes a variety of borrower and loan
characteristics for both applicants and originated loans. For each application, a lender reports the
race of the applicant, the location of the property, the borrower’s income, the loan amount, and
other loan characteristics such as type of loan, whether the property will be owner-occupied, and
the rate spread if loans are designated as high-cost.
HMDA data serves as the underpinning of many studies on differential outcomes by race
in mortgage lending. In seminal work, Munnell et al. (1996) supplements HMDA data with
credit characteristics of borrowers, showing that racial differences in denial rates are partially
(but not fully) accounted for by these characteristics and that substantial differences in denial
rates remain. More recent work on differential outcomes using HMDA include Bayer, Ferreira,
5 Regulators exempt certain institutions, primarily small ones, from reporting in HMDA. See https://www.ffiec.gov/hmda/reporterhistory.htm for details.
6

and Ross. (2016a, 2016b), Bhutta and Canner (2013), and Ghent, Hernández-Murillo, and
Owyang (2014). For more on the construction and limitations of HMDA data, see Avery,
Brevoort, and Canner (2007).
We measure differential outcomes using HMDA data in this study. We examine loans
made in calendar year 2012, the year that the MLO experiment was conducted. The outcome of
interest is the propensity of a borrower to be in a high-cost loan, defined in HMDA as a loan with
an annual percentage rate (APR) that is at least 1.5 percentage points higher than the prevailing
treasury rate of comparable maturity for first liens, and 3.5 percentage points higher for
subordinate liens.6
Linking the experiment and HMDA data involves several steps. We first aggregate the
MLO response behavior to the branch level. The experiment includes 2,684 branch offices
across 50 states and the District of Columbia. Branches are then matched to an institution in the
HMDA data (individual loan applications in HMDA are identified by institution, but not by
branch office). Of the offices in the MLO data, 2,233 are matched to institutions in the HMDA
records. Finally, individual loans in HMDA are matched to the branch level. Because loans in
HMDA are tied to institutions, not branch offices, we use the proximity of the property a loan is
made for to establish the link. In our primary specification, we assume that a loan for a property
in a given census tract originates from a branch of the same institution located in that census
6 We also investigate rates of denial, but find no link between differential treatment in the experiment and that outcome in the HMDA data.
7
tract, if such an office exists.7 Of the 9,783,966 originated loans in the HMDA data, 27,648 can
be matched to an office in the MLO data using this procedure.8
We report summary statistics for the HMDA data in Table 1. Because our matched
sample comprises a small subset of the available HMDA data, we show statistics for four subsets
of the data for purposes of comparison. (Standard deviations are enclosed in brackets.) Column
1 reflects all HMDA applications in 2012. Of these, 17.25 percent are insured by the Federal
Housing Administration, almost 90 percent of loans are for owner-occupied property, applicants
have an average income of $109,159, and make loan requests for $210,657 on average. In terms
of race, 4.8 percent of loans identify the primary applicant as African American and 70.7 percent
as white.9
Loan applications in the HMDA data can fail to result in loan origination for many
reasons, including denial by the underwriter and withdrawal by the applicant. Column 2 restricts
the sample to only those loans that were originated. Of these loans, 3.03 percent are considered
by HMDA guidelines to be high-cost, and have a rate spread that exceeds the prevailing treasury
rate of comparable maturity by 3.15 percentage points on average. Some differences exist
between originations and all loans. For instance, FHA loans comprise 17.25 percent of all loan
applications but only 13.34 percent of originations. Notably, African American applicants
comprise 4.81 percent of all applications, but only 4 percent of originated loans. This is the
7 Because there may be multiple offices of the same institution in a given census tract, we combine the MLO data for such offices into one “joined office” for purposes of analysis. There are 31 instances of such joined-office tracts, reducing the functional number of offices to 2,197. 8 We consider other measures of proximity in a set of robustness checks, including loans made for properties in census tracts immediately adjacent to an office’s tract, and loans in census tracts within a fixed distance from the office’s tract. 9 Because the unit of observation is the application, HMDA does not report when more than one application is made by the same borrower for the same purpose. Borrowers who shop around, or who apply more than once in the same period, will have applications that appear as separate observations.
8

opposite of the trend for white applicants, who comprise 70.74 percent of all applications and
79.05 percent of originated loans.
If we restrict the sample further to examine only originated first liens among African
American or white applicants (column 3), we observe similar values for many variables. The
most notable difference is the lower average rate spread for first liens, something that is expected
given that first liens tend to be less costly than subordinate liens, and that the HMDA threshold
for reporting a rate spread is lower for first liens. We also report summary statistics for income
and loan amount by race in this column. The average income of African American applicants in
this group is 74 percent that of whites, and the loan amounts of African Americans are 85 percent
of white borrowers.
Column 4 summarizes the data according to the same restrictions in column 3, with the
additional restriction that the loan is matched to a branch office in our MLO experiment. This
column shows that our matched sample captures fewer (and less expensive) high-cost loans,
lower income applicants, lower loan amounts, and branches that serve a disproportionately larger
number of white clients (compared to African Americans).
IV. Methodology
By matching the field experiment on borrower treatment to HMDA data, we are able to examine
outcome differences between African American and white borrowers across branch offices with
different levels of differential treatment. We estimate the relationship between treatment and
borrowing outcomes using a difference-in-difference specification. The specification controls
for the race of the borrower, and we are interested in the interaction between borrower race and
differential treatment, controlling either for branch-level fixed effects or the branch-level
9

differential treatment (depending on the specification). Our specifications are designed to
estimate the marginal effect of differential treatment on the propensity for different outcomes
between white and African American borrowers at similar (or in the case of the fixed effects
specification, the same) institutions. Our base specifications are:
(1) 𝑌𝑌𝑖𝑖,𝑗𝑗 =α + 𝛽𝛽1(𝐷𝐷 = 1 if borrower race is African American)𝑖𝑖 +𝛽𝛽2(Branch Response Rate to African Americans)𝑗𝑗 +𝛽𝛽3(𝐷𝐷 = 1 if borrower race is African American ∗ Branch Response Rate )𝑖𝑖,𝑗𝑗 + 𝑋𝑋′𝑗𝑗𝛿𝛿𝑗𝑗 + 𝑍𝑍′𝑖𝑖𝛾𝛾𝑖𝑖 + 𝜀𝜀
and
(2) 𝑌𝑌𝑖𝑖,𝑗𝑗 =α + 𝛽𝛽1(𝐷𝐷 = 1 if borrower race is African American)𝑖𝑖 +𝛽𝛽2(𝐷𝐷 = 1 if borrower race is African American ∗ Branch Response Rate )𝑖𝑖,𝑗𝑗 + 𝛿𝛿𝑗𝑗 + 𝑍𝑍′𝑖𝑖𝛾𝛾𝑖𝑖 + 𝜀𝜀
where 𝑌𝑌𝑖𝑖,𝑗𝑗, the outcome of interest, is an indicator equal to one if a loan made to individual i at
branch j was a high interest or “subprime” loan. The specification in (1) controls for various
loan-level (𝑍𝑍′𝑖𝑖) and branch-level (𝑋𝑋′𝑗𝑗) characteristics, while branch level characteristics drop out
of the fixed effects specification (2). The set of individual-level characteristics contained in the
HMDA data that we use for controls are: the loan amount, applicant income, if the loan was
FHA insured, if the home is to be owner-occupied, and the gender of the applicant. The set of
branch-level characteristics contained in the HMDA data that we use for controls are: the total
number of loans made at the branch, census-tract median family income, census-tract-to-
metropolitan-area median income ratio, and the percentage of minorities living in the census
tract.
10
We estimate each model using two different measures of differential treatment indicated
by the variable 𝐵𝐵𝐵𝐵𝐵𝐵𝐵𝐵𝐵𝐵ℎ 𝑅𝑅𝑅𝑅𝑅𝑅𝑅𝑅𝑅𝑅𝐵𝐵𝑅𝑅𝑅𝑅 𝑅𝑅𝐵𝐵𝑅𝑅𝑅𝑅. The first is the gross response rate to African
Americans from our field experiment, the second is the net response rate (African American
response rate minus white response rate).10
We estimate each model conditional on a loan being made (removing application
denials),11 being a first lien, and the primary applicant being identified as either white or African
American. All standard errors for model (1) estimates are clustered at the branch level. All
standard errors for model (2) estimates are clustered at the institution level. In this study, an
“institution” is a company that makes loans reportable under HMDA, and a “branch” is a specific
loan office of an institution.
V. Results
Table 2 shows the results of estimating (1) and (2) using the gross response rate to African
Americans as the measure of differential treatment. The first four columns of Table 2 show
standard difference-in-difference results, and columns (5) and (6) show results from the fixed
effects specifications.
The Table 2 results suggest a strong positive relationship between MLO response to
African Americans in the field experiment and the propensity for African Americans to receive a
high-cost loan from that branch (𝛽𝛽3 in specification (1) and 𝛽𝛽2 in specification (2)) . The
10We investigated two alternative measures of net discrimination– the response ratio (white/African American) and a dummy variable indicating that whites have a higher response rate than African Americans at a particular branch. These alternative measures produce similar results as the raw net measure results presented here. 11 We estimated models that use application denial as the dependent variable with the same specifications in (1) and (2). This estimation shows a large, negative relationship between both gross response and net response and denial of loans to African Americans, but the standard errors on these results are generally 1.5-2 times point estimates, making them highly unreliable.
11

magnitude of the results, with coefficients ranging from 0.0691 to 0.0729, suggests that when the
response rate to African Americans increases by 10 percentage points, the likelihood that an
African American is in a high-cost loan (conditional on obtaining a first lien mortgage) increases
by between .69 and .73 percentage points. Alternately, for a one standard deviation increase in
the African American response rate (35 percentage points), African Americans have a 2.4–2.5
percentage point increase in the likelihood of being in a high-cost loan. The magnitude of the
results is consistent across specifications that control for loan and branch level characteristics,
and when using the branch-level fixed effects. The coefficient of interest is statistically different
than zero at conventional levels in all specifications.
Table 3 shows results of estimating (1) and (2) using the net response rate to African
Americans as the measure of differential treatment. As in Table 2, the first four columns of
Table 3 show standard difference-in-difference results, and columns (5) and (6) show results
from fixed effects specifications.
The net measure of differential treatment (African American response rate minus white
response rate) has essentially no relationship with the probability that an African American
borrower receives a high-cost loan. The sign on the coefficient of interest is positive, but is
between 1/10th and 1/3rd the magnitude of the gross-measure results, and is not statistically
significant in any specification. We take the results in Table 2 to mean that there is no evidence
to suggest that the probability of an African American being in a high-cost loan is a function of
the net discrimination rate.
These results show that lenders who respond more to African Americans, measured by
gross response rate, also place them into higher interest loans more often compared to white
borrowers at the same branch. Lenders who, on net, respond to African American clients
12
differently do not place African American borrowers into high-cost mortgages at a higher rate.
These findings are consistent with the idea that MLOs target African American clients and then
steer them into high-cost loans.
Although consistent with targeting and steering African American clients, the result could
arise through more than one channel. For instance, these results are also consistent with lenders
specializing in high-cost loans and actively seeking minority clients. Minority clients are, on
average, higher risk as measured by credit scores, making them more likely to qualify only for
subprime loans. Alternatively, lenders may target African American clients not because they
specialize in high-cost loans but because they provide incentives for employees to originate such
loans. The incentives for the originators are such that high-cost products create a larger return for
the institution as well as the originator. Acknowledging this practice, the Consumer Financial
Protection Bureau now enforces the Mortgage Loan Originator Compensation Rule (a 2013
amendment to the Truth in Lending Act) banning the practice of tying loan points, fees, or rates
directly to the compensation of originators.
Regardless of the actual channel that links treatment in the experiment with outcomes,
because the specification includes branch fixed effects, our results must be driven by some
within-institution factor.12 Coupled with the field experiment findings, these results suggest that
African-American borrowers face difficulties when trying to find a mortgage loan originator
(Hanson et al., 2016), and when they do find a lender that is responsive to inquiries about
mortgages, African-American loan-seekers may then receive high-cost loans at a disproportional
rate than similar white applicants at the same branch of a lending institution.
12 Our result is also consistent with credit score divergence between African American and white clients who borrow from the same branch of an institution. We note that this would have to be credit score divergence in addition to the factors we control for such as borrower income.
13

VI. Robustness Checks
In this section we offer several robustness checks on our primary results, as well as a falsification
test. First, because the match between loans and their branches is based on an assumption about
being in the same census tract, we test alternate assumptions to match loans to branches. Next,
we examine the possibility that our primary results are biased by using a sample that includes
lenders that may never make high-cost loans. Finally, we present a falsification test.
Alternative Matching of Loans with Lenders
It is necessary to make a match between loans and particular branches of lending
institutions in the HMDA data to merge them with an observation in the field experiment. For
our primary results, we use only loans where the census tract location of the borrower is an exact
match with the census tract location of the lending institution branch. This is a conservative
approach, and leaves out many loans made to borrowers from a local branch where the borrower
lives in a nearby census tract. We offer two sets of alternative assumptions about the match
between borrower and branch here. First, a borrower matches a branch if the loan was made
from that institution and the borrower is located in a census tract that is within a specified
distance–we use .5, 1, and 1.5 mile ranges, in addition to any loan made within the same census
tract. Second, a borrower matches a branch if the loan was made from that institution and the
borrower is located in an adjacent census tract that is within 2 miles of the branch census tract (in
addition to any loan within the same census tract).
Table 4 shows results using the set of alternative matches between borrowers and
branches using the gross response rate to African Americans as the measure of differential
14

treatment. We report only the fixed effects specifications, estimated with and without controls,
but all models show a similar result. The results using just the .5 mile distance measure only add
about 500 observations, while the results using the 1.5 mile distance measure add about 18,000
observations. The primary results are unaffected by the expansion of the sample by broadening
the definition of a match between borrowers and a branch where the loan was made. The point
estimates are nearly identical to the primary estimation. Results are statistically significant at the
one percent level in most specifications.
Using borrowers matched to branches from adjacent tracts within 2 miles (in addition to
own-tracts), lowers our point estimates slightly from the primary specification. These estimates
add the most observations to the dataset, around 21,000, and show that for a 10 percentage point
increase in the African American response rate, African Americans have a .5 percentage point
increase in the likelihood of being in a high-cost loan, or for a one standard deviation increase in
the response rate to African Americans, they have a 1.75 percentage point increase in the
likelihood of being in a high-cost loan. These results are statistically significant at the one
percent level.
We test the same set of alternative matches between borrowers and branches using the net
response rate for African Americans as the measure of differential treatment. As with the
primary results, and despite adding over 21,000 observations in some specifications, these results
(not reported) are again small in magnitude and not statistically significant. There appears to be
no relationship between net response in our field experiment and the propensity for African
American borrowers to be in high-cost mortgages.
Restricting the Sample to High-Cost Lenders
15
The original estimation sample includes all loans matched to a branch that was part of the
original field experiment. This includes a variety of branches across a wide geography; however,
some of these branches may not include high-cost loans as part of their business model. If this is
true, and African Americans and whites have a different propensity to search for lending
institutions that results in one group being differentially likely to end up at a high-cost lender,
then our standard difference-in-difference results could be biased as they would include both the
propensity to end up in a high-cost loan at a given lender and the propensity to be at a high-cost
lender in the first place. Fixed effects estimation should account for these differences, but only if
there is enough overlap in institutions where both whites and African Americans purchase
mortgages.
As a way to measure how much the estimates reflect the search process and how much
they reflect what happens within a branch or institution, we estimate our primary model
restricting the sample to only branches that actually made a high-cost loan in our data. Table 5
shows the restricted results using gross response rates to African Americans. We also check the
same restriction on the net response rate (results not reported). In both cases, the results are
consistent with our primary findings—African Americans are more likely to be in a high-cost
loan at branches where gross response rates in the field experiment were higher, but no more
likely to be in a high-cost loan at branches where net differences in response rate were larger.
The magnitude of the coefficients in the restricted sample, shown in Table 5, is slightly
larger than the primary estimates, suggesting that search practice may play a small role, but even
abstracting from search differences, the estimated magnitudes suggest that a 10 percentage point
increase in the response rate to African Americans is associated with an increase in the
probability they are in a high-cost loan by .75–.77 percentage points (a one-standard deviation
16

increase in response rate increases the probability of being in a high-cost loan by 2.6–2.7
percentage points). As with the primary results, these results are statistically significant at
conventional levels.
Restricting the sample to only high-cost lenders does not change the null finding for net
response differences. These models produce estimates that are positive, but in most cases near
zero in magnitude, and not statistically significant.
Falsification Test: White Outcomes as a Function of White Response
Our primary results show that African Americans are more likely to be in a high-cost
loan when borrowing from lenders that are more responsive to them in a field experiment. This
suggests a strong link between lender treatment and differential outcomes for African American
borrowers. These results are relative to outcomes for white borrowers, and control for branch-
level fixed effects, eliminating many concerns about potential omitted variables. What the
primary results might miss is that the interaction between own-race response and steering into
high-cost loans might not be peculiar to African Americans. It might be the case that more
responsive lenders to white clients are also more likely to steer whites into high-cost loans. We
test this possibility in a falsification test, re-estimating equations (1) and (2), but using a dummy
variable for a white borrower in place of African American, and the white response rate from our
experiment as the interaction (controlling for this response rate in the difference-in-difference
specifications, and the branch-level effect in the fixed effects specifications).
Table 6 shows estimation results for the probability a white borrower is in a high-cost
loan using the gross white response rate from the field experiment. The gross response rate to
white clients has a negative effect on the propensity for whites to be in a high-cost loan across
17

specifications, although only one specification yields even marginally statistically meaningful
results. We interpret these results to show that there is no evidence that the probability of whites
being in a high-cost loan is a function of whites being targeted by lending institutions.
VII. Conclusion
This paper is the first to examine the link between differential treatment and differential
outcomes for minority borrowers. Using the results of an industry-wide field experiment
matched to loan-level data on mortgage applications, we show that African Americans have an
increased likelihood of being in a high-interest loan at lending institutions that are more likely to
respond to their inquiries about a mortgage. We find no evidence that net measures of treatment
between whites and African Americans are correlated with outcome differences, suggesting that
the mechanism is a within-institution factor like client steering. Our findings are robust to a
number of alternative specifications including different assumptions for matching loans to
branches and different sample restrictions.
Our primary result suggests that differences between white and African American
lending outcomes cannot be fully explained by the borrower characteristics other than race (e.g.,
income and loan characteristics) that we observe. They suggest that if regulators are interested in
further shrinking the race differential in outcomes, they might look more carefully at actions
taken by lenders (such as marketing and communications) early in the lending process, and
might develop analytic tools to focus on the branch or even the individual lender. The finding
that being in a high-cost loan is a function of response to African American clients implies that
interventions intended to eliminate differential outcomes by race may need to be more nuanced
than traditional enforcement of fair lending standards.
18

References
Ahmed, Ali, Mats Hammarstedt. 2008. “Discrimination in the rental housing market: A field experiment on the Internet.” Journal of Urban Economics 64 (2): 362-372.
Avery, Robert, Kenneth Brevoort, and Glenn Canner. 2007. “Opportunities and Issues in Using HMDA Data.” Journal of Real Estate Research 29 (4): 351-380.
Bayer, Patrick, Fernando Ferreira, and Stephen L. Ross. 2016a. “The Vulnerability of Minority Homeowners in the Housing Boom and Bust.” American Economic Journal: Economic Policy 8 (1): 1-27.
Bayer, Patrick, Fernando Ferreira, and Stephen L. Ross. 2016b. “What Drives Racial and Ethnic Differences in High Cost Mortgages? The Role of High Risk Lenders.” Working Paper.
Bertrand, Marianne, and Esther Duflo. 2016. “Field Experiments on Discrimination.” Forthcoming in Abhijit Banerjee and Esther Duflo, (Eds.) Handbook of Field Experiments, Volume 1. North Holland.
Bertrand, Marianne, and Sendhil Mullainathan. 2004. “Are Emily and Greg More Employable Than Lakisha and Jamal? A Field Experiment on Labor Market Discrimination.” American Economic Review 94 (4):991-1013.
Bhutta, Neil, and Glenn B. Canner. 2013. "Mortgage market conditions and borrower outcomes: Evidence from the 2012 HMDA data and matched HMDA-credit record data." Federal Reserve Bulletin 99 (4): 1-58.
Bursell, Moa. 2007. “What’s in a name? - A field experiment test for the existence of ethnic discrimination in the hiring process.” Working Paper.
Carlsson, Magnus, and Stefan Eriksson. 2014. “Discrimination in the rental market for apartments.” Journal of Housing Economics 23: 41-54.
Collins, William J. 2004 "The housing market impact of state-level anti-discrimination laws, 1960–1970." Journal of Urban Economics 55 (3): 534-564.
Ghent, Andra C., Ruben Hernandez-Murillo, and Michael T. Owyang. 2014. "Differences in subprime loan pricing across races and neighborhoods." Regional Science and Urban Economics 48: 199-215.
Hanson, Andrew, and Zackary Hawley. 2011. “Do landlords discriminate in the rental housing market? Evidence from an internet field experiment in US cities.” Journal of Urban Economics 70 (2-3): 99-114.
Hanson, Andrew, Zackary Hawley, Hal Martin, and Bo Liu. 2016. "Discrimination in mortgage lending: Evidence from a correspondence experiment." Journal of Urban Economics 92: 48-65.
19

Munnell, Alicia, Geoffrey Tootell, Lynn Browne, and James McEneaney. 1996. “Mortgage Lending in Boston: Interpreting HMDA Data.” American Economic Review 86 (1): 25-53.
Nunley, John, Adam Pugh, Nicholas Romero, and Richard Alan Seals, Jr. 2014. “An Examination of Racial Discrimination in the Labor Market for Recent College Graduates: Estimates from the Field.” Working Paper.
Oh, Sun Jung, and John Yinger. 2015. "What Have We Learned from Paired Testing in Housing Markets?" Cityscape 17 (3): 15-59.
Pope, Devin, and Justin Sydnor. 2011. “What’s in a Picture? Evidence of Discrimination from Prosper.com.” Journal of Human Resources 46 (1): 53-92.
Ross, Stephen L., Margery Austin Turner, Erin Godfrey, and Robin R. Smith. 2008. "Mortgage lending in Chicago and Los Angeles: A paired testing study of the pre-application process." Journal of Urban Economics 63 (3): 902-919.
Ross, Stephen, and John Yinger. 2002. The Color of Credit. Cambridge: MIT Press.
20
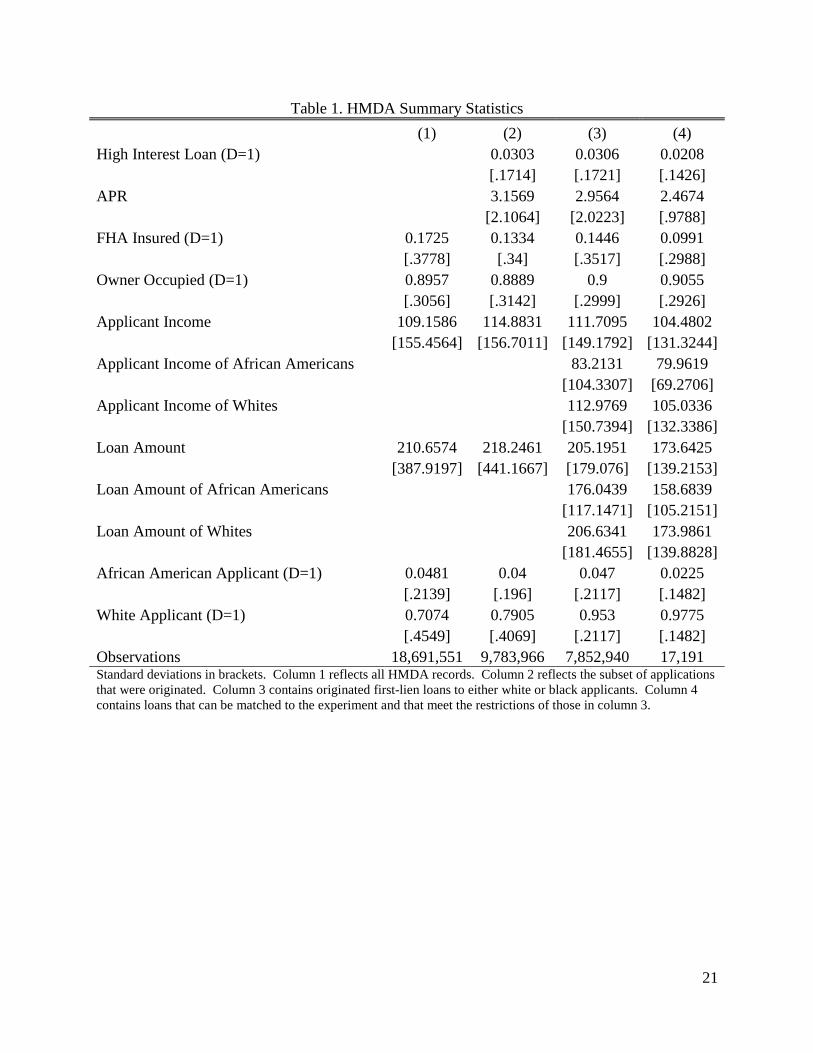
Table 1. HMDA Summary Statistics
(1) (2) (3) (4)
High Interest Loan (D=1)
0.0303 0.0306 0.0208
[.1714] [.1721] [.1426]
APR
3.1569 2.9564 2.4674
[2.1064] [2.0223] [.9788]
FHA Insured (D=1) 0.1725 0.1334 0.1446 0.0991
[.3778] [.34] [.3517] [.2988]
Owner Occupied (D=1) 0.8957 0.8889 0.9 0.9055
[.3056] [.3142] [.2999] [.2926]
Applicant Income 109.1586 114.8831 111.7095 104.4802
[155.4564] [156.7011] [149.1792] [131.3244]
Applicant Income of African Americans
83.2131 79.9619
[104.3307] [69.2706]
Applicant Income of Whites
112.9769 105.0336
[150.7394] [132.3386]
Loan Amount 210.6574 218.2461 205.1951 173.6425
[387.9197] [441.1667] [179.076] [139.2153]
Loan Amount of African Americans
176.0439 158.6839
[117.1471] [105.2151]
Loan Amount of Whites
206.6341 173.9861
[181.4655] [139.8828]
African American Applicant (D=1) 0.0481 0.04 0.047 0.0225
[.2139] [.196] [.2117] [.1482]
White Applicant (D=1) 0.7074 0.7905 0.953 0.9775
[.4549] [.4069] [.2117] [.1482]
Observations 18,691,551 9,783,966 7,852,940 17,191 Standard deviations in brackets. Column 1 reflects all HMDA records. Column 2 reflects the subset of applications that were originated. Column 3 contains originated first-lien loans to either white or black applicants. Column 4 contains loans that can be matched to the experiment and that meet the restrictions of those in column 3.
21
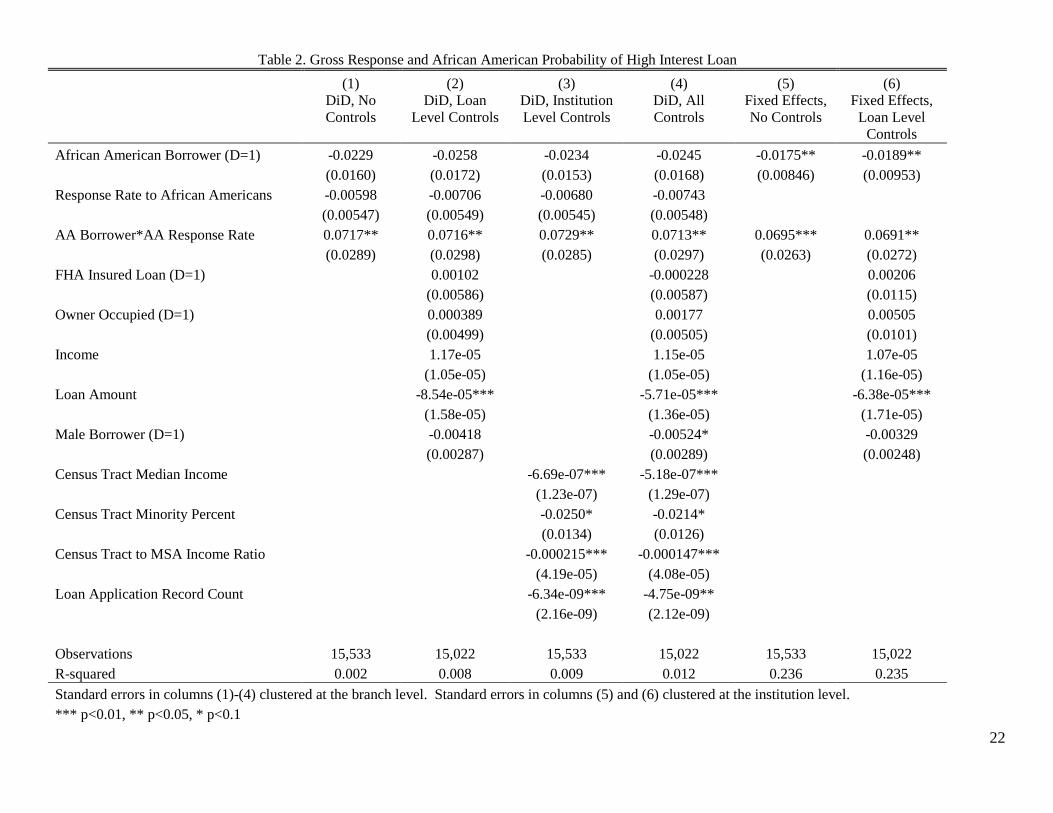
Table 2. Gross Response and African American Probability of High Interest Loan
(1) (2) (3) (4) (5) (6)
DiD, No Controls
DiD, Loan Level Controls
DiD, Institution Level Controls
DiD, All Controls
Fixed Effects, No Controls
Fixed Effects, Loan Level
Controls African American Borrower (D=1) -0.0229 -0.0258 -0.0234 -0.0245 -0.0175** -0.0189**
(0.0160) (0.0172) (0.0153) (0.0168) (0.00846) (0.00953)
Response Rate to African Americans -0.00598 -0.00706 -0.00680 -0.00743
(0.00547) (0.00549) (0.00545) (0.00548)
AA Borrower*AA Response Rate 0.0717** 0.0716** 0.0729** 0.0713** 0.0695*** 0.0691**
(0.0289) (0.0298) (0.0285) (0.0297) (0.0263) (0.0272)
FHA Insured Loan (D=1)
0.00102
-0.000228
0.00206
(0.00586)
(0.00587)
(0.0115)
Owner Occupied (D=1)
0.000389
0.00177
0.00505
(0.00499)
(0.00505)
(0.0101)
Income
1.17e-05
1.15e-05
1.07e-05
(1.05e-05)
(1.05e-05)
(1.16e-05)
Loan Amount
-8.54e-05***
-5.71e-05***
-6.38e-05***
(1.58e-05)
(1.36e-05)
(1.71e-05)
Male Borrower (D=1)
-0.00418
-0.00524*
-0.00329
(0.00287)
(0.00289)
(0.00248)
Census Tract Median Income
-6.69e-07*** -5.18e-07***
(1.23e-07) (1.29e-07)
Census Tract Minority Percent
-0.0250* -0.0214*
(0.0134) (0.0126)
Census Tract to MSA Income Ratio
-0.000215*** -0.000147***
(4.19e-05) (4.08e-05)
Loan Application Record Count
-6.34e-09*** -4.75e-09**
(2.16e-09) (2.12e-09)
Observations 15,533 15,022 15,533 15,022 15,533 15,022
R-squared 0.002 0.008 0.009 0.012 0.236 0.235 Standard errors in columns (1)-(4) clustered at the branch level. Standard errors in columns (5) and (6) clustered at the institution level. *** p<0.01, ** p<0.05, * p<0.1
22

Table 3. Net Response and African American Probability of High Interest Loan
(1) (2) (3) (4) (5) (6)
DiD, No Controls
DiD, Loan Level Controls
DiD, Institution Level Controls
DiD, All Controls
Fixed Effects, No Controls
Fixed Effects, Loan Level
Controls African American Borrower (D=1) 0.0301** 0.0266* 0.0306** 0.0278* 0.0331** 0.0312**
(0.0144) (0.0143) (0.0145) (0.0144) (0.0146) (0.0147)
Response Rate to African Americans -0.00190 -0.00233 -0.00159 -0.00218
(0.00620) (0.00608) (0.00621) (0.00615)
AA Borrower*AA Response Rate 0.0244 0.00865 0.0226 0.00630 0.0149 0.00603
(0.0284) (0.0259) (0.0287) (0.0263) (0.0155) (0.0159)
FHA Insured Loan (D=1)
0.00317
0.00221
0.00382
(0.00641)
(0.00642)
(0.0122)
Owner Occupied (D=1)
0.00371
0.00492
0.00836
(0.00512)
(0.00522)
(0.0112)
Income
1.50e-05
1.42e-05
1.22e-05
(1.11e-05)
(1.11e-05)
(1.28e-05)
Loan Amount
-9.17e-05***
-6.28e-05***
-6.72e-05***
(1.75e-05)
(1.51e-05)
(1.95e-05)
Male Borrower (D=1)
-0.00530*
-0.00637**
-0.00488*
(0.00303)
(0.00306)
(0.00253)
Census Tract Median Income
-6.82e-07*** -5.25e-07***
(1.36e-07) (1.44e-07)
Census Tract Minority Percent
-0.0260* -0.0235*
(0.0144) (0.0136)
Census Tract to MSA Income Ratio
-0.000217*** -0.000145***
(4.51e-05) (4.38e-05)
Loan Application Record Count
-6.39e-09*** -4.58e-09**
(2.32e-09) (2.33e-09)
Observations 14,042 13,571 14,042 13,571 14,042 13,571
R-squared 0.001 0.008 0.009 0.012 0.246 0.243 Standard errors in columns (1)-(4) clustered at the branch level. Standard errors in columns (5) and (6) clustered at the institution level. *** p<0.01, ** p<0.05, * p<0.1
23

Table 4. Gross Response and African American Probability of High Interest Loan: Alternative Matches
(1) (2) (3) (4) (5) (6) (7) (8)
.5 Mile Radius, FE, No Controls
.5 Mile Radius, FE, Loan Level
Controls
1 Mile Radius, FE, No Controls
1 Mile Radius, FE, Loan Level
Controls
1.5 Mile Radius, FE, No Controls
1.5 Mile Radius, FE, Loan Level
Controls
Adjacent Tracts, FE, No Controls
Adjacent Tracts, FE, Loan Level
Controls
African American Borrower (D=1) -0.0180** -0.0193** -0.0106 -0.0113 -0.0247* -0.0258* -0.0134 -0.0142
(0.00853) (0.00955) (0.00915) (0.0102) (0.0130) (0.0140) (0.0103) (0.0111)
AA Borrower*AA Response Rate 0.0677*** 0.0673** 0.0611*** 0.0609*** 0.0683*** 0.0694*** 0.0504*** 0.0505***
(0.0256) (0.0264) (0.0214) (0.0225) (0.0211) (0.0222) (0.0175) (0.0184)
FHA Insured Loan (D=1)
0.00246
0.00422
0.00448
0.00392
(0.0113)
(0.0103)
(0.00717)
(0.00639)
Owner Occupied (D=1)
0.00466
-0.00179
-0.00287
-0.00149
(0.00974)
(0.00731)
(0.00575)
(0.00696)
Income
8.79e-06
2.79e-06
-1.10e-06
2.78e-07
(1.06e-05)
(7.35e-06)
(2.91e-06)
(5.75e-06)
Loan Amount
-5.71e-05***
-3.53e-05***
-1.76e-05
-4.66e-05***
(1.56e-05)
(1.16e-05)
(1.10e-05)
(9.79e-06)
Male Borrower (D=1)
-0.00286
-0.00261
-0.00186
-0.00149
(0.00237)
(0.00187)
(0.00125)
(0.00145)
Observations 16,136 15,603 21,441 20,707 33,761 32,587 36,858 35,471 Standard errors clustered at the institution level. *** p<0.01, ** p<0.05, * p<0.1
24

Table 5. Gross Response and African American Probability of High Interest Loan: High-Cost Lender Sample Restriction
(1) (2) (3) (4) (5) (6)
DiD, No Controls
DiD, Loan Level Controls
DiD, Institution Level Controls
DiD, All Controls
Fixed Effects, No Controls
Fixed Effects, Loan Level
Controls African American Borrower (D=1) -0.0246 -0.0278 -0.0253 -0.0265 -0.0191** -0.0211**
(0.0172) (0.0185) (0.0164) (0.0181) (0.00931) (0.0106)
Response Rate to African Americans -0.00621 -0.00727 -0.00679 -0.00745
(0.00584) (0.00586) (0.00580) (0.00583)
AA Borrower*AA Response Rate 0.0751** 0.0756** 0.0770** 0.0755** 0.0750*** 0.0755**
(0.0307) (0.0317) (0.0303) (0.0316) (0.0285) (0.0296)
FHA Insured Loan (D=1)
0.000664
-0.000773
0.00223
(0.00629)
(0.00631)
(0.0124)
Owner Occupied (D=1)
0.00110
0.00264
0.00525
(0.00535)
(0.00544)
(0.0108)
Income
1.59e-05
1.53e-05
1.34e-05
(1.30e-05)
(1.31e-05)
(1.40e-05)
Loan Amount
-9.29e-05***
-6.28e-05***
-6.96e-05***
(1.75e-05)
(1.52e-05)
(1.92e-05)
Male Borrower (D=1)
-0.00454
-0.00564*
-0.00362
(0.00311)
(0.00313)
(0.00268)
Census Tract Median Income
-7.21e-07*** -5.56e-07***
(1.36e-07) (1.43e-07)
Census Tract Minority Percent
-0.0269* -0.0229
(0.0149) (0.0141)
Census Tract to MSA Income Ratio
-0.000229*** -0.000158***
(4.55e-05) (4.45e-05)
Loan Application Record Count
-7.17e-09*** -5.45e-09**
(2.21e-09) (2.12e-09)
Observations 14,324 13,839 14,324 13,839 14,324 13,839
Standard errors in columns (1)-(4) clustered at the branch level. Standard errors in columns (5) and (6) clustered at the institution level. *** p<0.01, ** p<0.05, * p<0.1
25

Table 6. Falsification Test: White Response and White Probability of High Interest Loan
(1) (2) (3) (4) (5) (6)
DiD, No Controls
DiD, Loan Level Controls
DiD, Institution Level Controls
DiD, All Controls
Fixed Effects, No Controls
Fixed Effects, Loan Level
Controls White Borrower (D=1) -0.0107 0.00610 -0.00472 0.00993 -0.00270 0.00473
(0.0249) (0.0222) (0.0255) (0.0229) (0.0153) (0.0151)
Response Rate to Whites 0.0196 0.0379 0.0248 0.0421
(0.0325) (0.0304) (0.0323) (0.0305)
W Borrower*W Response Rate -0.0210 -0.0398 -0.0268 -0.0441 -0.0364 -0.0460*
(0.0321) (0.0301) (0.0319) (0.0301) (0.0268) (0.0277)
FHA Insured Loan (D=1)
0.00280
0.000671
0.00473
(0.00604)
(0.00614)
(0.0118)
Owner Occupied (D=1)
0.000740
0.00284
0.00684
(0.00506)
(0.00522)
(0.0102)
Income
1.67e-05
1.65e-05
1.64e-05
(1.10e-05)
(1.10e-05)
(1.45e-05)
Loan Amount
-8.88e-05***
-5.78e-05***
-6.84e-05***
(1.62e-05)
(1.40e-05)
(1.88e-05)
Male Borrower (D=1)
-0.00572*
-0.00676**
-0.00568**
(0.00293)
(0.00290)
(0.00251)
Census Tract Median Income
-7.34e-07*** -5.91e-07***
(1.31e-07) (1.38e-07)
Census Tract Minority Percent
-0.0126 -0.0100
(0.0179) (0.0180)
Census Tract to MSA Income Ratio
-0.000227*** -0.000165***
(4.51e-05) (4.47e-05)
Loan Application Record Count
-6.71e-09*** -5.25e-09**
(2.29e-09) (2.30e-09)
Observations 15,700 15,175 15,700 15,175 15,700 15,175
Standard errors in columns (1)-(4) clustered at the branch level. Standard errors in columns (5) and (6) clustered at the institution level. *** p<0.01, ** p<0.05, * p<0.1
26