diversity in lac operon regulation among diverse ... · controlling gene expression, as well as...
TRANSCRIPT
Diversity in lac Operon Regulation among Diverse Escherichiacoli Isolates Depends on the Broader Genetic Background butIs Not Explained by Genetic Relatedness
Kelly N. Phillips,a Scott Widmann,a Huei-Yi Lai,b Jennifer Nguyen,a J. Christian J. Ray,c Gábor Balázsi,d Tim F. Coopera,b
aDepartment of Biology and Biochemistry, University of Houston, Houston, Texas, USAbSchool of Natural and Computational Science, Massey University, Auckland, New ZealandcCenter for Computational Biology and Department of Molecular Biosciences, University of Kansas, Lawrence, Kansas, USAdLaufer Center for Physical and Quantitative Biology and Department of Biomedical Engineering, Stony Brook University, Stony Brook, New York, USA
ABSTRACT Transcription of bacterial genes is controlled by the coordinated actionof cis- and trans-acting regulators. The activity and mode of action of these regula-tors can reflect different requirements for gene products in different environments.A well-studied example is the regulatory function that integrates the environmentalavailability of glucose and lactose to control the Escherichia coli lac operon. Moststudies of lac operon regulation have focused on a few closely related strains. Todetermine the range of natural variation in lac regulatory function, we introduced areporter construct into 23 diverse E. coli strains and measured expression with com-binations of inducer concentrations. We found a wide range of regulatory functions.Several functions were similar to the one observed in a reference lab strain, whereasothers depended weakly on the presence of cAMP. Some characteristics of the regu-latory function were explained by the genetic relatedness of strains, indicating thatdifferences varied on relatively short time scales. The regulatory characteristics ex-plained by genetic relatedness were among those that best predicted the initialgrowth of strains following transition to a lactose environment, suggesting a role forselection. Finally, we transferred the lac operon, with the lacI regulatory gene, fromfive natural isolate strains into a reference lab strain. The regulatory function of these hy-brid strains revealed the effect of local and global regulatory elements in controlling ex-pression. Together, this work demonstrates that regulatory functions can be variedwithin a species and that there is variation within a species to best match a function toparticular environments.
IMPORTANCE The lac operon of Escherichia coli is a classic model for studying generegulation. This study has uncovered features such as the environmental input logiccontrolling gene expression, as well as gene expression bistability and hysteresis.Most lac operon studies have focused on a few lab strains, and it is not knownhow generally those findings apply to the diversity of E. coli strains. We exam-ined the environmental dependence of lac gene regulation in 20 natural isolatesof E. coli and found a wide range of regulatory responses. By transferring lacgenes from natural isolate strains into a common reference strain, we found thatregulation depends on both the lac genes themselves and on the broader ge-netic background, indicating potential for still-greater regulatory diversity follow-ing horizontal gene transfer. Our results reveal that there is substantial naturalvariation in the regulation of the lac operon and indicate that this variation canbe ecologically meaningful.
KEYWORDS lac operon regulation
Citation Phillips KN, Widmann S, Lai H-Y,Nguyen J, Ray JCJ, Balázsi G, Cooper TF. 2019.Diversity in lac operon regulation amongdiverse Escherichia coli isolates depends on thebroader genetic background but is notexplained by genetic relatedness. mBio10:e02232-19. https://doi.org/10.1128/mBio.02232-19.
Invited Editor Vaughn S. Cooper, University ofPittsburgh
Editor Marvin Whiteley, Georgia Institute ofTechnology School of Biological Sciences
Copyright © 2019 Phillips et al. This is anopen-access article distributed under the termsof the Creative Commons Attribution 4.0International license.
Address correspondence to Tim F. Cooper,[email protected].
Received 10 September 2019Accepted 9 October 2019Published
RESEARCH ARTICLEEcological and Evolutionary Science
November/December 2019 Volume 10 Issue 6 e02232-19 ® mbio.asm.org 1
12 November 2019
on May 15, 2020 by guest
http://mbio.asm
.org/D
ownloaded from
Gene regulatory networks allow bacteria to respond to changes in their environ-ment by activating or repressing target genes (1). In this way, cells can exhibit
phenotypes that balance the demands of expressing necessary genes while minimizingthe diverse costs associated with the expression of genes that are not necessary (2–8).Regulatory networks must respond to a diverse array of signals, for example, integrat-ing information regarding the availability of multiple resources that the organism useswith different preference (9). For a particular group of coregulated genes, the integra-tion of these signals defines its regulatory input function. Knowledge of this functionaids in the prediction of gene responses, understanding of the mechanistic basis ofregulation, and understanding of the potential for regulation to evolve, and it is likelyto be helpful in the pursuit of engineering of specific responses in artificial circuits (10).Despite the importance of regulatory input functions, the understanding of theirvariation within a species is limited. This variation is important, as it reflects the potential forevolutionary changes in regulatory function and might reveal differences in selectionpressures affecting different subpopulations.
A good model system with which to study a regulatory input function is the lacoperon (lacZYA) of Escherichia coli (11–15). This operon has been a focus of efforts toexamine the effect on gene expression and regulation of transcription factor stochas-ticity (16), DNA topology (15), transcriptional fidelity (17), and hysteresis (18). It has alsobeen examined to understand the costs of protein expression (3, 6, 19) and theimportance of coordinated gene expression (20) and is established as a target ofselection during growth in defined environments (3, 21, 22). The wealth of informationgained from empirical study of lac operon regulation has made it a focus of attemptsto understand and model gene regulation, including attempts to learn how to manip-ulate the system to change regulatory outputs (14, 20, 23–25).
The lac operon encodes three gene products. LacY is a permease that importslactose into the cell where it is cleaved by LacZ, a �-galactosidase, into glucose andgalactose. LacA is a transacetylase that is thought to facilitate the export of toxic sugarsthat cannot be metabolized by the cell. These genes are beneficial to express inenvironments where lactose is the best available carbon source, being required for itsimport and initial catabolism, but their expression is also associated with a significantcost (3, 6, 21). The lac operon is directly regulated by two environmental signals,positively by lactose and negatively by glucose, that modulate the activity of transcrip-tion factors that bind to cis-regulatory DNA regions. The LacI repressor, a trans-regulator, binds at three operator binding sites, the cis-regulators, in the vicinity of thelac promoter and can interact to cause DNA looping, which promotes repressor bindingand increases repression (26, 27). In the presence of allolactose (a derivative of lactose)or artificial inducers (e.g., isopropyl �-D-thiogalactoside [IPTG]), LacI is released fromDNA, allowing transcription to occur (28). The cAMP-cAMP receptor protein (cAMP-CRP)global regulator complex, another trans-acting factor, binds upstream of the lac operonpromoter to its cis-regulatory region and enhances transcription by promoting therecruitment of RNA polymerase to the lac promoter (29). The production of cAMP isdecreased in the presence of glucose, thereby decreasing the availability of the cAMP-CRPcomplex.
The regulatory control of many genes can be described as logic functions. Thesefunctions integrate complex mechanistic details of regulatory control to describe howregulator activities combine at a cis-regulatory region to determine the expression oftarget genes (13, 14, 30). A simple expectation is that lac genes will be controlled byAND-type logic, whereby expression requires the presence of lactose and absence ofglucose. In fact, experiments using the artificial IPTG inducer and exogenous cAMP toindependently control LacI and CRP activity found that the underlying function is morecomplex, being intermediate between AND and OR functions (13, 14). That work,however, focused on the gene input function of a single K-12 E. coli strain, MG1655, andclose derivatives, which may not be representative of other strains. Though oftenconsidered a wild-type strain, MG1655 was isolated in 1922 and during subsequentpropagation and storage may have been subject to inadvertent selection that affected
Phillips et al. ®
November/December 2019 Volume 10 Issue 6 e02232-19 mbio.asm.org 2
on May 15, 2020 by guest
http://mbio.asm
.org/D
ownloaded from
the lac gene input function (31, 32). Even if the lac regulatory function has not changed,it remains unknown if different natural isolate strains demonstrate different functions.
Two factors suggest the potential for variation in a given regulatory function withina species. In the case of the lac operon, models and experiments have revealed thatmany different regulatory functions can evolve through single mutations (14, 21, 33).Second, lac regulation can be affected by changes occurring outside its immediateregulatory network. Indeed, in a previous study of E. coli populations evolved inenvironments containing lactose or combinations of lactose and glucose, changes inlac expression evolved that were common and due at least in part to mutationsoccurring outside the canonical regulatory network (21). Moreover, that work foundthat the nature of lac regulatory changes reflected the selection environment. Forexample, most populations evolving in an environment that fluctuated daily betweenglucose and lactose evolved to constitutively express the lac genes, whereas popula-tions evolved in the simultaneous presence of glucose and lactose evolved a gradedresponse function, allowing a continuous expression response. Similar findings of selection-dependent changes in gene regulation have been found in populations adapted tochemostat environments (22, 34), during the evolution of a stress response network(35), and inferred from selective benefits of naturally occurring variants controlling thebiosynthesis of arginine (36). Although studies have not compared detailed lac logicfunctions of different E. coli strains, lac structural gene enzyme activity and fitness effectcan vary between isolated lac operons (4, 34).
To the extent that there is variation in gene regulatory functions, a key question isthe relative contribution of cis-regulatory changes that affect the expression of aspecific transcriptional unit (i.e., an operon) and trans-regulatory changes that have thepotential to affect the expression of a regulon potentially containing hundreds of genes(37, 38). This distinction is important because a few trans-regulatory changes may allowa large number of key expression changes to evolve relatively quickly, whereas thesame expression change occurring through cis-regulatory change would take muchlonger, though perhaps with fewer pleiotropic side effects. The distinction between cisand trans control of gene regulation is also relevant to the consequences of horizontalgene transfer. If adaptive changes in gene regulation are cis-regulatory, they are likelyto have fewer antagonistic pleiotropic consequences following transfer to alternativegenetic backgrounds, allowing transfer to more genetically divergent recipients.
To examine natural variation in the lac regulatory input function, we introduced agreen fluorescent protein (GFP) reporter driven by the lac promoter and containing theprimary (O1) and upstream (O3) LacI repressor and CRP binding sites into 21 divergentnatural isolate strains and into two reference lab strains, MG1655 and REL606. We foundsubstantial variation in regulatory functions, which we quantified by fitting a simpleregulatory model to the observed expression data. Some aspects of this variation wereexplained by the genetic relatedness of strains, assessed using phylogenies constructedfrom core and accessory genes, and from only the lac genes. Other parameters variedbut without any phylogenetic signal, consistent with them changing on a relativelyshort time scale. Transfer of a subset of lac operons into a common reference strainindicated that at least some of the variation is determined by trans-regulators encodedby the recipient strain, not the cis-regulatory sequences local to the lac genes. To theextent that regulatory functions are influenced by trans-regulators that have pleiotropicactivity that varies between strains, adaptive changes in gene regulatory functions maybe less likely to remain beneficial following horizontal transfer to new strains.
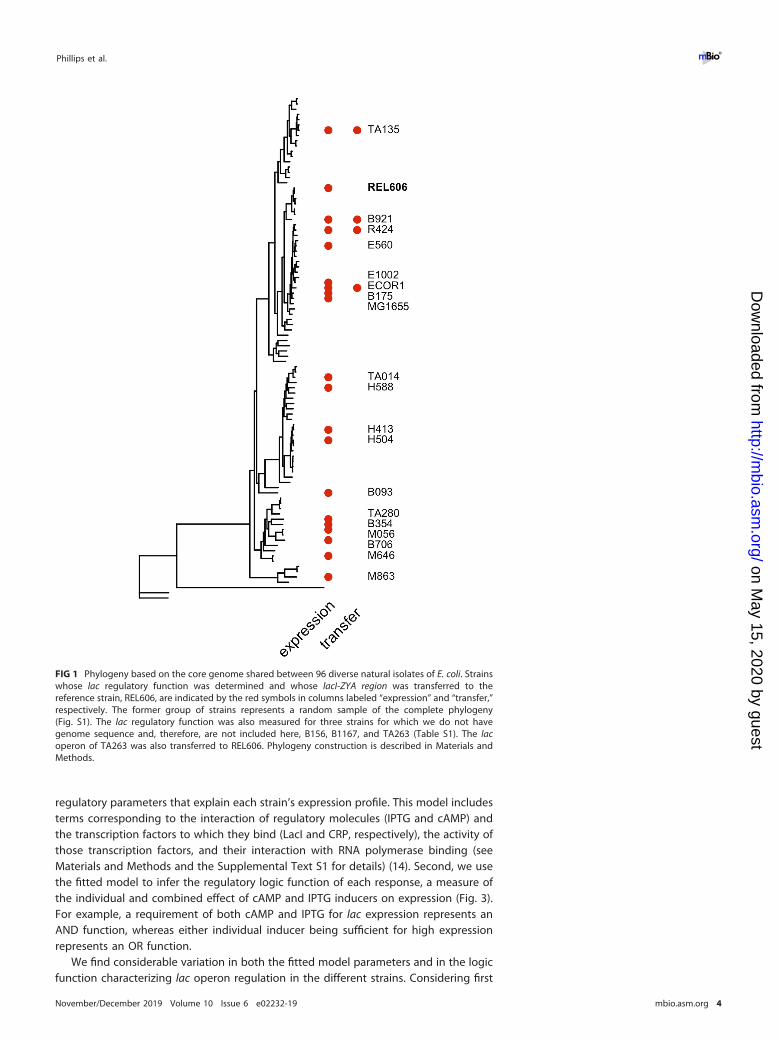
RESULTSlac gene input function of natural isolate E. coli strains. We introduced a Plac-GFP
reporter into 21 natural isolates and two lab strains of E. coli (Fig. 1; see also Table S1in the supplemental material). Fluorescence from this reporter was measured in com-binations of IPTG and cAMP to determine the lac operon expression profile of eachstrain. These profiles exhibit substantial variation across strains (Fig. 2 and S2). Wefollow two approaches to quantify this variation. First, we fit a simple model to estimate
Natural Variation in a Gene Input Function ®
November/December 2019 Volume 10 Issue 6 e02232-19 mbio.asm.org 3
on May 15, 2020 by guest
http://mbio.asm
.org/D
ownloaded from
regulatory parameters that explain each strain’s expression profile. This model includesterms corresponding to the interaction of regulatory molecules (IPTG and cAMP) andthe transcription factors to which they bind (LacI and CRP, respectively), the activity ofthose transcription factors, and their interaction with RNA polymerase binding (seeMaterials and Methods and the Supplemental Text S1 for details) (14). Second, we usethe fitted model to infer the regulatory logic function of each response, a measure ofthe individual and combined effect of cAMP and IPTG inducers on expression (Fig. 3).For example, a requirement of both cAMP and IPTG for lac expression represents anAND function, whereas either individual inducer being sufficient for high expressionrepresents an OR function.
We find considerable variation in both the fitted model parameters and in the logicfunction characterizing lac operon regulation in the different strains. Considering first
FIG 1 Phylogeny based on the core genome shared between 96 diverse natural isolates of E. coli. Strainswhose lac regulatory function was determined and whose lacI-ZYA region was transferred to thereference strain, REL606, are indicated by the red symbols in columns labeled “expression” and “transfer,”respectively. The former group of strains represents a random sample of the complete phylogeny(Fig. S1). The lac regulatory function was also measured for three strains for which we do not havegenome sequence and, therefore, are not included here, B156, B1167, and TA263 (Table S1). The lacoperon of TA263 was also transferred to REL606. Phylogeny construction is described in Materials andMethods.
Phillips et al. ®
November/December 2019 Volume 10 Issue 6 e02232-19 mbio.asm.org 4
on May 15, 2020 by guest
http://mbio.asm
.org/D
ownloaded from
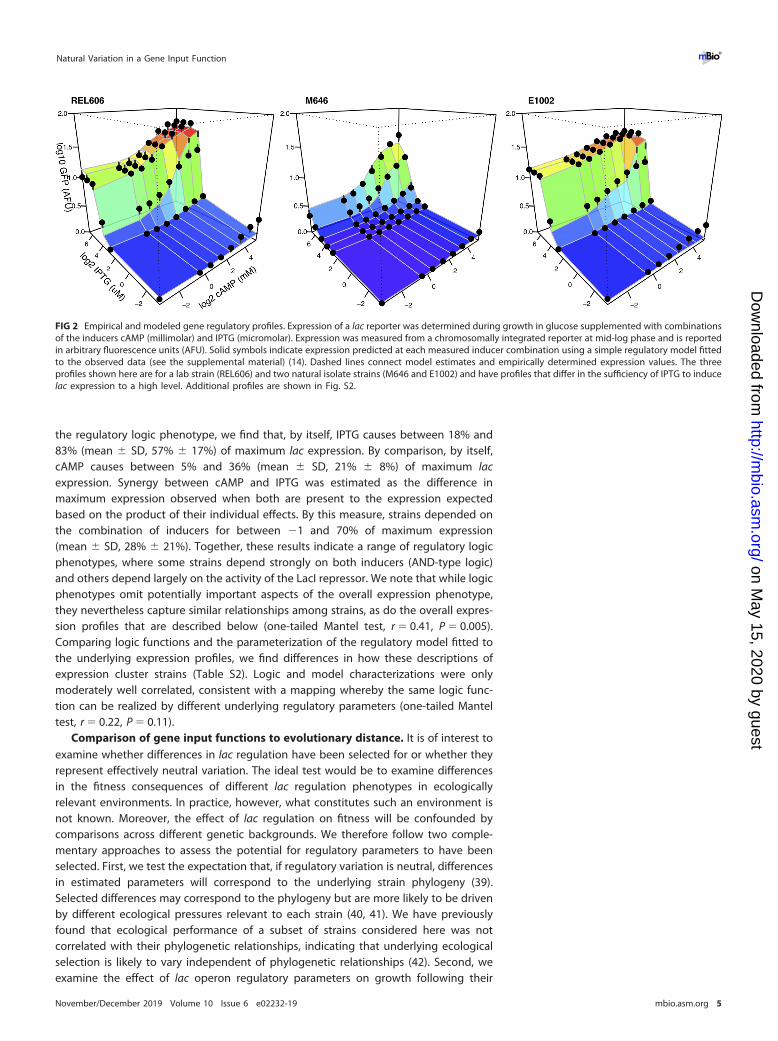
the regulatory logic phenotype, we find that, by itself, IPTG causes between 18% and83% (mean � SD, 57% � 17%) of maximum lac expression. By comparison, by itself,cAMP causes between 5% and 36% (mean � SD, 21% � 8%) of maximum lacexpression. Synergy between cAMP and IPTG was estimated as the difference inmaximum expression observed when both are present to the expression expectedbased on the product of their individual effects. By this measure, strains depended onthe combination of inducers for between �1 and 70% of maximum expression(mean � SD, 28% � 21%). Together, these results indicate a range of regulatory logicphenotypes, where some strains depend strongly on both inducers (AND-type logic)and others depend largely on the activity of the LacI repressor. We note that while logicphenotypes omit potentially important aspects of the overall expression phenotype,they nevertheless capture similar relationships among strains, as do the overall expres-sion profiles that are described below (one-tailed Mantel test, r � 0.41, P � 0.005).Comparing logic functions and the parameterization of the regulatory model fitted tothe underlying expression profiles, we find differences in how these descriptions ofexpression cluster strains (Table S2). Logic and model characterizations were onlymoderately well correlated, consistent with a mapping whereby the same logic func-tion can be realized by different underlying regulatory parameters (one-tailed Manteltest, r � 0.22, P � 0.11).
Comparison of gene input functions to evolutionary distance. It is of interest toexamine whether differences in lac regulation have been selected for or whether theyrepresent effectively neutral variation. The ideal test would be to examine differencesin the fitness consequences of different lac regulation phenotypes in ecologicallyrelevant environments. In practice, however, what constitutes such an environment isnot known. Moreover, the effect of lac regulation on fitness will be confounded bycomparisons across different genetic backgrounds. We therefore follow two comple-mentary approaches to assess the potential for regulatory parameters to have beenselected. First, we test the expectation that, if regulatory variation is neutral, differencesin estimated parameters will correspond to the underlying strain phylogeny (39).Selected differences may correspond to the phylogeny but are more likely to be drivenby different ecological pressures relevant to each strain (40, 41). We have previouslyfound that ecological performance of a subset of strains considered here was notcorrelated with their phylogenetic relationships, indicating that underlying ecologicalselection is likely to vary independent of phylogenetic relationships (42). Second, weexamine the effect of lac operon regulatory parameters on growth following their
FIG 2 Empirical and modeled gene regulatory profiles. Expression of a lac reporter was determined during growth in glucose supplemented with combinationsof the inducers cAMP (millimolar) and IPTG (micromolar). Expression was measured from a chromosomally integrated reporter at mid-log phase and is reportedin arbitrary fluorescence units (AFU). Solid symbols indicate expression predicted at each measured inducer combination using a simple regulatory model fittedto the observed data (see the supplemental material) (14). Dashed lines connect model estimates and empirically determined expression values. The threeprofiles shown here are for a lab strain (REL606) and two natural isolate strains (M646 and E1002) and have profiles that differ in the sufficiency of IPTG to inducelac expression to a high level. Additional profiles are shown in Fig. S2.
Natural Variation in a Gene Input Function ®
November/December 2019 Volume 10 Issue 6 e02232-19 mbio.asm.org 5
on May 15, 2020 by guest
http://mbio.asm
.org/D
ownloaded from

transfer to an environment where lac expression is likely to be influential in determin-ing dynamics.
To test for phylogenetic signal present in regulatory logic and model parameters, weassessed variation in those parameters in the context of phylogenies generated basedon the core genome common to all strains, the accessory genome comprising genespresent in some but not all strains, and a phylogeny based on the lacI-ZYA genes.Phylogenetic signal was assessed using Pagel’s �, which tests for signal against the nullhypothesis of a trait evolving independently of an underlying phylogeny, as would bethe case if it varied either neutrally or due to selection pressures that were not correlatedto genetic relatedness (43). In most cases, the pattern of regulatory parameter variationwas not consistent with any of the tested phylogenies. There were two exceptions tothis trend, as follows: the � parameter, corresponding to the effect of cAMP-CRP on thebinding of RNA polymerase to the lac promoter, which exhibited phylogenetic signalover all phylogenies considered; and the m parameter, corresponding to the extent ofcooperativity of IPTG affecting LacI activity, which followed the lacI-ZYA phylogeny(Table S3 and Fig. S3). Consistent with an overall lack of phylogenetic signal in lacregulatory parameters, Mantel tests examining the relationship between pairwise straindistance based on genetic relatedness and expression landscapes did not find signifi-cant associations (core, r � �0.107, P � 0.37; accessory, r � �0.12, P � 0.34; lacI-ZYA,r � �0.15, P � 0.27).
Relationship between regulatory parameters and growth. The ideal experimentto test for ecologically meaningful effects of among-strain regulatory differences would
FIG 3 lac regulatory logic of E. coli strains. Models describing the lac expression phenotype were fittedfor each of the tested E. coli strains (Fig. S1). Model parameters were used to determine the ratio of logexpression at low IPTG-low cAMP, high IPTG-low cAMP, and low IPTG-high cAMP combinations to thehigh IPTG-high cAMP combination, giving parameters, �1, �2, and �3, and respectively (14). Combina-tions of these parameters describe a particular regulatory logic input function. For example, low valuesof �1, �2, and �3 indicate high lac expression only when both IPTG and cAMP levels are present,reflecting an AND-type logic function. Black symbols indicate parameter estimates of natural isolatestrains. Green and red points indicate estimates of the lab strains REL606 and MG1655, respectively. Thegray point indicates an E. albertii strain, B156, that does not encode several components of the canonicallactose utilization system, including a LacI repressor, and therefore expresses the reporter at high levelsregardless of IPTG (see also Fig. S2).
Phillips et al. ®
November/December 2019 Volume 10 Issue 6 e02232-19 mbio.asm.org 6
on May 15, 2020 by guest
http://mbio.asm
.org/D
ownloaded from
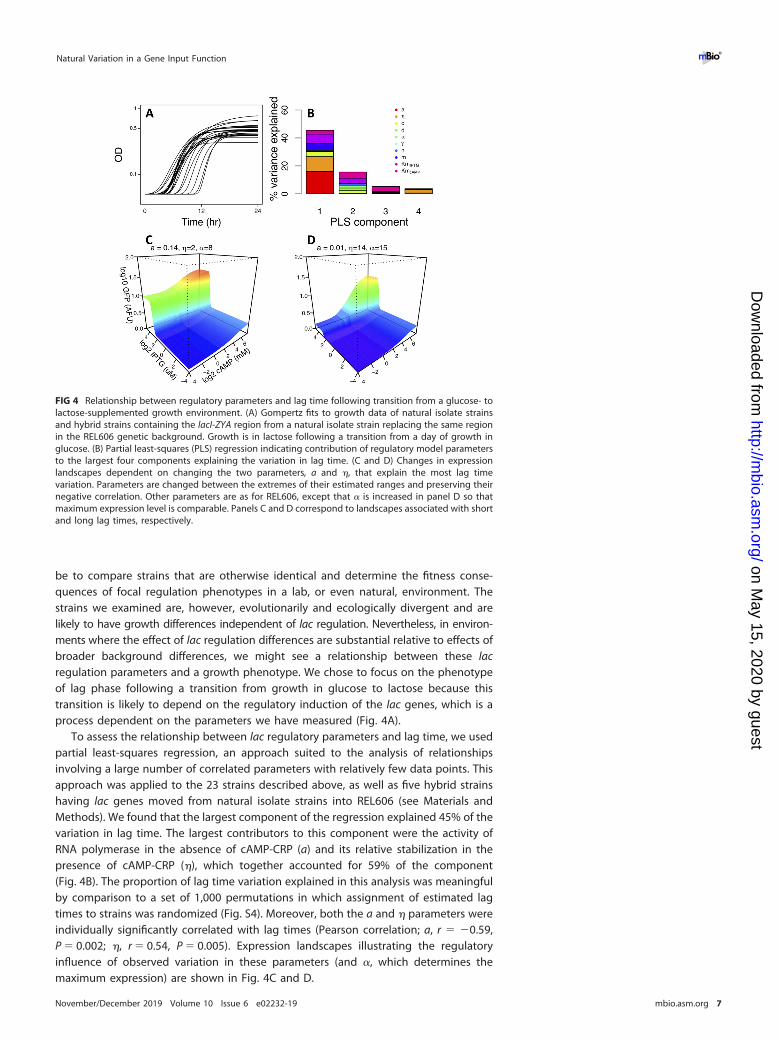
be to compare strains that are otherwise identical and determine the fitness conse-quences of focal regulation phenotypes in a lab, or even natural, environment. Thestrains we examined are, however, evolutionarily and ecologically divergent and arelikely to have growth differences independent of lac regulation. Nevertheless, in environ-ments where the effect of lac regulation differences are substantial relative to effects ofbroader background differences, we might see a relationship between these lacregulation parameters and a growth phenotype. We chose to focus on the phenotypeof lag phase following a transition from growth in glucose to lactose because thistransition is likely to depend on the regulatory induction of the lac genes, which is aprocess dependent on the parameters we have measured (Fig. 4A).
To assess the relationship between lac regulatory parameters and lag time, we usedpartial least-squares regression, an approach suited to the analysis of relationshipsinvolving a large number of correlated parameters with relatively few data points. Thisapproach was applied to the 23 strains described above, as well as five hybrid strainshaving lac genes moved from natural isolate strains into REL606 (see Materials andMethods). We found that the largest component of the regression explained 45% of thevariation in lag time. The largest contributors to this component were the activity ofRNA polymerase in the absence of cAMP-CRP (a) and its relative stabilization in thepresence of cAMP-CRP (�), which together accounted for 59% of the component(Fig. 4B). The proportion of lag time variation explained in this analysis was meaningfulby comparison to a set of 1,000 permutations in which assignment of estimated lagtimes to strains was randomized (Fig. S4). Moreover, both the a and � parameters wereindividually significantly correlated with lag times (Pearson correlation; a, r � �0.59,P � 0.002; �, r � 0.54, P � 0.005). Expression landscapes illustrating the regulatoryinfluence of observed variation in these parameters (and �, which determines themaximum expression) are shown in Fig. 4C and D.
FIG 4 Relationship between regulatory parameters and lag time following transition from a glucose- tolactose-supplemented growth environment. (A) Gompertz fits to growth data of natural isolate strainsand hybrid strains containing the lacI-ZYA region from a natural isolate strain replacing the same regionin the REL606 genetic background. Growth is in lactose following a transition from a day of growth inglucose. (B) Partial least-squares (PLS) regression indicating contribution of regulatory model parametersto the largest four components explaining the variation in lag time. (C and D) Changes in expressionlandscapes dependent on changing the two parameters, a and �, that explain the most lag timevariation. Parameters are changed between the extremes of their estimated ranges and preserving theirnegative correlation. Other parameters are as for REL606, except that � is increased in panel D so thatmaximum expression level is comparable. Panels C and D correspond to landscapes associated with shortand long lag times, respectively.
Natural Variation in a Gene Input Function ®
November/December 2019 Volume 10 Issue 6 e02232-19 mbio.asm.org 7
on May 15, 2020 by guest
http://mbio.asm
.org/D
ownloaded from
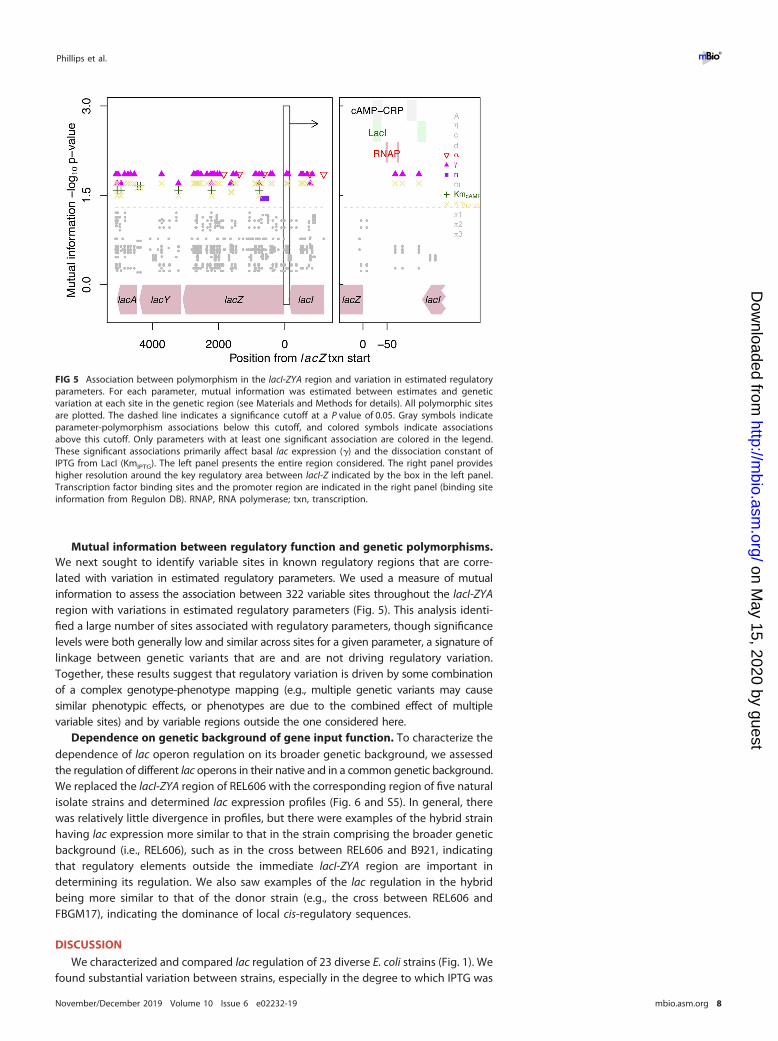
Mutual information between regulatory function and genetic polymorphisms.We next sought to identify variable sites in known regulatory regions that are corre-lated with variation in estimated regulatory parameters. We used a measure of mutualinformation to assess the association between 322 variable sites throughout the lacI-ZYAregion with variations in estimated regulatory parameters (Fig. 5). This analysis identi-fied a large number of sites associated with regulatory parameters, though significancelevels were both generally low and similar across sites for a given parameter, a signature oflinkage between genetic variants that are and are not driving regulatory variation.Together, these results suggest that regulatory variation is driven by some combinationof a complex genotype-phenotype mapping (e.g., multiple genetic variants may causesimilar phenotypic effects, or phenotypes are due to the combined effect of multiplevariable sites) and by variable regions outside the one considered here.
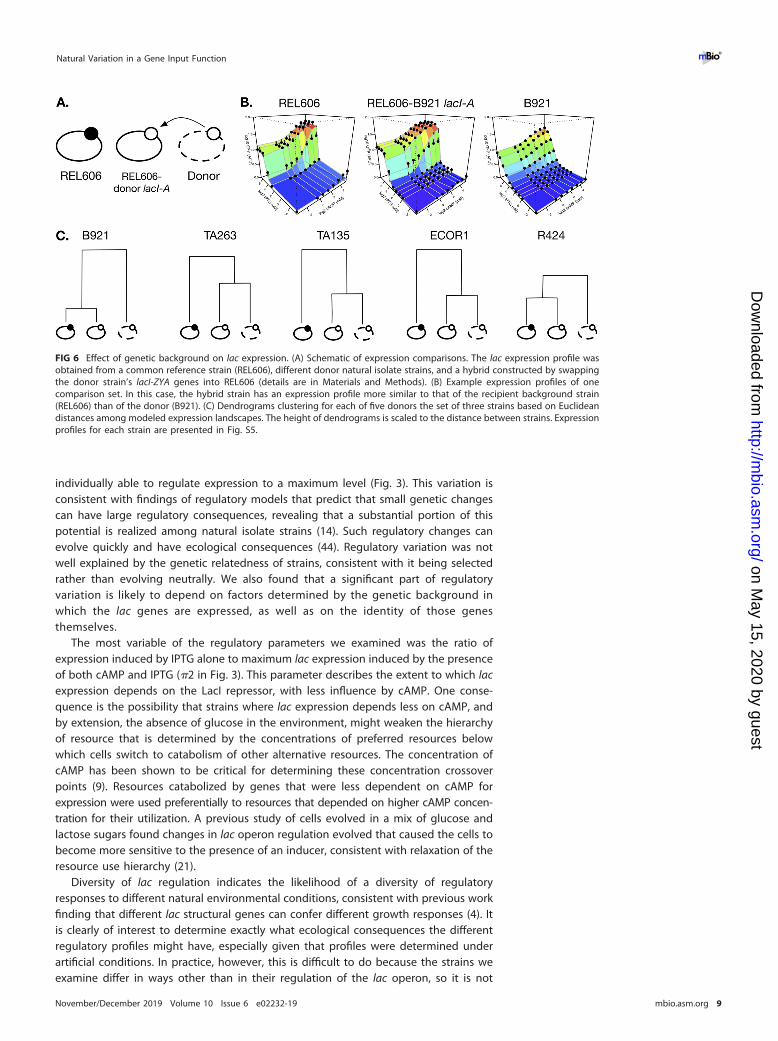
Dependence on genetic background of gene input function. To characterize thedependence of lac operon regulation on its broader genetic background, we assessedthe regulation of different lac operons in their native and in a common genetic background.We replaced the lacI-ZYA region of REL606 with the corresponding region of five naturalisolate strains and determined lac expression profiles (Fig. 6 and S5). In general, therewas relatively little divergence in profiles, but there were examples of the hybrid strainhaving lac expression more similar to that in the strain comprising the broader geneticbackground (i.e., REL606), such as in the cross between REL606 and B921, indicatingthat regulatory elements outside the immediate lacI-ZYA region are important indetermining its regulation. We also saw examples of the lac regulation in the hybridbeing more similar to that of the donor strain (e.g., the cross between REL606 andFBGM17), indicating the dominance of local cis-regulatory sequences.
DISCUSSION
We characterized and compared lac regulation of 23 diverse E. coli strains (Fig. 1). Wefound substantial variation between strains, especially in the degree to which IPTG was
FIG 5 Association between polymorphism in the lacI-ZYA region and variation in estimated regulatoryparameters. For each parameter, mutual information was estimated between estimates and geneticvariation at each site in the genetic region (see Materials and Methods for details). All polymorphic sitesare plotted. The dashed line indicates a significance cutoff at a P value of 0.05. Gray symbols indicateparameter-polymorphism associations below this cutoff, and colored symbols indicate associationsabove this cutoff. Only parameters with at least one significant association are colored in the legend.These significant associations primarily affect basal lac expression (�) and the dissociation constant ofIPTG from LacI (KmIPTG). The left panel presents the entire region considered. The right panel provideshigher resolution around the key regulatory area between lacI-Z indicated by the box in the left panel.Transcription factor binding sites and the promoter region are indicated in the right panel (binding siteinformation from Regulon DB). RNAP, RNA polymerase; txn, transcription.
Phillips et al. ®
November/December 2019 Volume 10 Issue 6 e02232-19 mbio.asm.org 8
on May 15, 2020 by guest
http://mbio.asm
.org/D
ownloaded from
individually able to regulate expression to a maximum level (Fig. 3). This variation isconsistent with findings of regulatory models that predict that small genetic changescan have large regulatory consequences, revealing that a substantial portion of thispotential is realized among natural isolate strains (14). Such regulatory changes canevolve quickly and have ecological consequences (44). Regulatory variation was notwell explained by the genetic relatedness of strains, consistent with it being selectedrather than evolving neutrally. We also found that a significant part of regulatoryvariation is likely to depend on factors determined by the genetic background inwhich the lac genes are expressed, as well as on the identity of those genesthemselves.
The most variable of the regulatory parameters we examined was the ratio ofexpression induced by IPTG alone to maximum lac expression induced by the presenceof both cAMP and IPTG (�2 in Fig. 3). This parameter describes the extent to which lacexpression depends on the LacI repressor, with less influence by cAMP. One conse-quence is the possibility that strains where lac expression depends less on cAMP, andby extension, the absence of glucose in the environment, might weaken the hierarchyof resource that is determined by the concentrations of preferred resources belowwhich cells switch to catabolism of other alternative resources. The concentration ofcAMP has been shown to be critical for determining these concentration crossoverpoints (9). Resources catabolized by genes that were less dependent on cAMP forexpression were used preferentially to resources that depended on higher cAMP concen-tration for their utilization. A previous study of cells evolved in a mix of glucose andlactose sugars found changes in lac operon regulation evolved that caused the cells tobecome more sensitive to the presence of an inducer, consistent with relaxation of theresource use hierarchy (21).
Diversity of lac regulation indicates the likelihood of a diversity of regulatoryresponses to different natural environmental conditions, consistent with previous workfinding that different lac structural genes can confer different growth responses (4). Itis clearly of interest to determine exactly what ecological consequences the differentregulatory profiles might have, especially given that profiles were determined underartificial conditions. In practice, however, this is difficult to do because the strains weexamine differ in ways other than in their regulation of the lac operon, so it is not
FIG 6 Effect of genetic background on lac expression. (A) Schematic of expression comparisons. The lac expression profile wasobtained from a common reference strain (REL606), different donor natural isolate strains, and a hybrid constructed by swappingthe donor strain’s lacI-ZYA genes into REL606 (details are in Materials and Methods). (B) Example expression profiles of onecomparison set. In this case, the hybrid strain has an expression profile more similar to that of the recipient background strain(REL606) than of the donor (B921). (C) Dendrograms clustering for each of five donors the set of three strains based on Euclideandistances among modeled expression landscapes. The height of dendrograms is scaled to the distance between strains. Expressionprofiles for each strain are presented in Fig. S5.
Natural Variation in a Gene Input Function ®
November/December 2019 Volume 10 Issue 6 e02232-19 mbio.asm.org 9
on May 15, 2020 by guest
http://mbio.asm
.org/D
ownloaded from
possible to isolate the influence of lac regulatory differences to strain fitness acrossparticular environments. This issue is controlled for among strains we constructed, inwhich different lac genes were transferred to a common background, but here, regulationoften differed from that in the donor strains, so that differences in effects cannot beeasily interpreted with respect to their donor context. Despite the confounding effectof different backgrounds, we still found a significant relationship between some lacregulatory parameters and the transition of our strains from growth in glucose togrowth in lactose. This result underlines the potential ecological relevance of theregulatory differences we see.
Several studies have identified natural genetic variation underlying ecologicallyrelevant differences in the regulation of focal genes (4, 36, 45). We found limitedindication of an association between genetic polymorphism in the lacI-ZYA region andvariation in regulatory parameters. Although it is not possible to determine which, ifany, of the single-nucleotide polymorphisms (SNPs) we considered might be drivingregulatory variation, we note that there were clusters of significant associations be-tween polymorphisms at the end of the lacZ and lacA genes with the basal level of lacreporter expression (determined by �). There are several possible sources of regulatoryvariation within these regions. In the end of the lacZ gene, there are sites that areresponsible for substrate binding, and variation in these sites can affect LacZcatalytic activity and allolactose production (46–48). In lacA, associations occur inthe stem-loop transcription terminator and in the preceding AT-rich region, sug-gesting that they might affect transcriptional termination and thereby influencelevels of lacZYA transcripts. We note as well that the lac expression parameters weidentify using IPTG and exogenous cAMP may not be realizable in natural environ-ments, for example, because inducer exclusion causes lactose uptake to be moredependent than IPTG uptake on the absence of glucose. To the extent that this istrue, some features of the underlying regulatory network are not expected to bedirectly accessible for selection. In general, however, we interpret the lack of a clearassociation between polymorphisms and regulatory variation as indicating thatmost regulatory variation is complex, having a different genetic basis in differentstrains as well as likely involving the action of several sites, including genes outsidethe canonical regulatory network.
A substantial portion of the regulatory variation we considered was not explained bypatterns of relatedness determined on the basis of core or accessory genomes or of thegenes involved in lac utilization. Discordant patterns of phenotypic and genetic evo-lution are consistent either with regulatory parameters varying neutrally at high ratesor being selected for in a pattern distinct from that determined by the geneticrelatedness of the strains. A previous study found that ecological performance of strainsfrom the same collection used here was not correlated with core or accessory phylog-enies, consistent with the possibility that selection might be important (42). Thispossibility is supported by our finding that regulatory parameters correlated withgrowth dynamics in at least one environment.
Our finding that the broader genetic background can have substantial influenceon the regulation of transferred lac operons highlights the importance of nonca-nonical regulation in determining the expression of lac genes. An example of suchregulation is the influence of DNA supercoiling on the accessibility of regulatoryproteins to the lac promoter (26). We note that an influence of the broaderbackground on gene regulation complicates the goals of rational design of regu-latory networks, potentially putting a premium on strategies that increase robust-ness. A strong dependence on genetic background might also lead to greatervariation in regulation between strains, increasing the chance that an effectiveregulatory strategy can be found in changing environments, but also making it lesslikely that regulation will be successful following horizontal transfer of the lac genesto other recipient strains.
In summary, we found that diverse strains of E. coli have different lac regulatoryprofiles, most of which were realized as differences in the form of the regulatory
Phillips et al. ®
November/December 2019 Volume 10 Issue 6 e02232-19 mbio.asm.org 10
on May 15, 2020 by guest
http://mbio.asm
.org/D
ownloaded from
function and of the relative influence of the regulators, cAMP and IPTG, on expression.This variation reveals a wealth of raw material on which selection can act to optimizegene regulation to new environmental challenges. It also poses a challenge to relevantmodels to be able to explain this diversity of regulation, with some of it coming fromoutside the canonical regulatory network.
MATERIALS AND METHODSBacterial strains and strain construction. Natural isolate strains used as recipients of a lac reporter
construct were chosen from a collection of 96 strains collected and sequenced as part of a Broad Instituteproject and obtained from the Michigan State University STEC Center, as well as from strains described inreference 49 (Fig. 1 and Table S1). The genome sequences of the strains were downloaded from the BroadInstitute website (https://olive.broadinstitute.org/projects/Escherichia%20coli%20Antibiotic%20Resistance) orobtained by de novo Illumina sequencing, as described previously (42). One strain, B156, was included inthis work despite being classified as Escherichia albertii. This species lacks a functional LacI repressor andLacY permease and is unable to grow on lactose. Throughout, we include this strain in individual straindescriptions but omit it from the summary data.
The lab strain REL606 was used as the recipient for the transfer of lacI-ZYA genes from five natural isolatestrains. First, we deleted the corresponding genes in REL606 and replaced them with a chloramphenicolresistance (Cmr) gene cassette. To do this, we amplified the chloramphenicol cassette from pKD3 (50) usingprimers containing 5= extensions complementary to the REL606 sequence on either side of the lacI-ZYA genes(forward primer [overlaps the region immediately downstream of lacA and pKD3], 5=-GCTGAACTTGTAGGCCTGATAAGCGCAGCGTATCAGGCAATTTTTATAATTGTGTAGGCTGGAGCTGCTTC, and reverse primer [overlapsthe region immediately downstream of lacI and pKD3], 5=-GCGGTATGGCATGATAGCGCCCGGAAGAGAGTCAATTCAGGGTGGTGAATCATATGAATATCCTCCTTAG). This product was used to transform REL606 con-taining the red recombineering plasmid pSIM5 (51), and Cmr transformants were selected. These strainshad the lacI-ZYA gene region replaced by the Cmr gene. In the second step, this replacement straincontaining pSIM5 was transformed with the lacI-ZYA region amplified from donor natural isolatestrains using Phusion Hot Start polymerase (New England BioLabs, MA) (forward primer [overlaps at 39bases downstream of lacA], 5=-AGGCCTGATAAGCGCAGCGT, and reverse primer [overlaps at 44 basesupstream of lacI], 5=-TGGCATGATAGCGCCCGGAA). Transformants were selected for incorporation of theincoming DNA by plating on Davis-Mignoli (DM) minimal medium supplemented with thiamine andcontaining lactose as the sole carbon source. The transformed cells contain lacI-ZYA and 44 basesupstream of the lacI gene from the donor while maintaining the �35 promoter site of lacI from REL606.Sequencing of the junctions between recipient and incoming DNA was performed to confirm thesuccessful incorporation of incoming DNA into the target chromosomal site.
Expression of the lac operon was measured using a reporter construct controlled by the Placpromoter region, including the O1 and O3 LacI and the primary CRP binding sites (21). This reporter wascloned into a mini-Tn7 cassette in a suicide vector that was introduced into target strains by conjugation(52). Transposition into the recipient strain attTn7 site was confirmed by PCR. Although the reporterencodes its own cis-regulatory sites and is present at a chromosomal location separate from the nativelac operon, it does reflect the expression of the native operon because it responds to inducer levels inthe cell as a whole, which are determined by expression of the LacY permease encoded by the nativeoperon. Previous work has shown that reporter-driven GFP expression is correlated to native lac operonexpression, as judged by direct enzymatic assays (13, 21).
Expression assays. Regulatory input functions were characterized by measuring the expressionof a Plac-GFP reporter at different combinations of cAMP and IPTG in DM supplemented with2,000 �g/ml glucose. This environment was used because glucose inhibits the production of cAMP,allowing measurement of the regulatory input function from as close to the basal level of Plac-GFPexpression as possible. Strains containing the Plac-GFP reporter were preconditioned in DM mediumsupplemented with 2,000 �g/ml (DM2000) glucose for 24 h and then transferred at a 1:1,000 dilutionto the test environments containing combinations of DM2000 supplemented with cAMP and IPTG.cAMP was added at eight concentrations (0, 0.625, 1.25, 2.5, 5, 10, 20, and 40 mM), and IPTG wasadded at 10 or 6 concentrations (0, 0.78, 1.56, 3.125, 6.25, 12.5, 25, 50, 100, and 200 �M, or 0, 6.25,12.5, 25, 50, and 100 �M), as noted in the text. Strains were grown in these environments for �16 hto an optical density at 450 nm (OD450) of �0.1 to 0.2, which corresponded to mid-log growth phase,as determined by tracking changes in population OD using a VersaMax spectrophotometer (Molec-ular Dynamics, CA). An OD of 0.1 reflects approximately six population doublings from the initialinoculum, such that we assume that GFP expression is at steady state and at a level dependent onpromoter activity. GFP expression was measured using an Accuri C6 (Becton, Dickinson, NJ) flowcytometer. The analysis pipeline was implemented in R. Expression estimates are presented asarbitrary fluorescence units following subtraction of the fluorescence value of the correspondingstrain that did not contain the Plac-GFP reporter. In comparisons of gene regulatory functionsinvolving the reference strain (REL606), a natural isolate strain, and a hybrid with the natural isolatelacI-ZYA region replacing that of REL606, all compared strains were measured in the same experi-mental block.
Phylogeny construction. Core (shared across all recipient strains) and accessory (shared amonga subset of strains) gene regions were identified comparing DNA sequence windows as implementedin Panseq (53). Core regions were defined as regions of 250 bp present in an arbitrary referencestrain that were present at a match of �80% identity in all other strains. A phylogeny was built from
Natural Variation in a Gene Input Function ®
November/December 2019 Volume 10 Issue 6 e02232-19 mbio.asm.org 11
on May 15, 2020 by guest
http://mbio.asm
.org/D
ownloaded from
the core genome by concatenating core regions for each strain and performing a multiple-sequencealignment. Variable sites in this alignment were extracted as an SNP file. We also generatedalignments based on the lacI-ZYA region alone. The gene region alignment and the core andaccessory genomes were used to build phylogenies with which to test for a phylogenetic signal inregulatory parameters estimated from the different test strains. In all cases, PhyML was used to buildmaximum likelihood trees. For the accessory genome, a binary input file indicating the presence/absence of each accessory gene in each strain was analyzed using default parameters of PARS inPHYLIP (54).
Growth rate estimation. Strains were inoculated into LB and grown overnight at 37°C with shaking.A 2-�l aliquot of each culture was transferred to each of three wells in a microtiter plate containing200 �l DM200 glucose medium. Following 24 h of incubation at 37°C with shaking, a 1:100 dilution wasmade into another microtiter plate containing the same medium. After a second 24-h incubation,another 1:100 dilution was made into a microtiter plate containing DM1500 lactose, and the new platewas incubated in a VersaMax plate spectrophotometer. OD450 readings and 3-s shaking periods werecarried out every 3 min for 24 h. A custom script was used to fit a modified Gompertz growth functionto the resulting growth data (55). Growth parameters for each strain were estimated as the average ofestimates for individual replicates weighted by the quality of each fit. In the modified Gompertz function,the parameter best interpreted as lag time, �, corresponds to the time taken for a population to reachits maximum growth rate.
Model and statistical analyses. All analyses were carried out using R (version 3.4.3) (56). Regulatoryinput functions were analyzed in two stages. First, the optim function was used to estimate parametersof a simple model incorporating key features of lac regulation that best fit observed GFP expression ateach combination of cAMP-IPTG concentrations (equation 1 in reference 14). A detailed outline of thismodel is presented in the supplemental material. Briefly, it includes terms that describe CRP activity(fraction bound to cAMP) (A), cAMP-CRP binding cooperativity (n), LacI activity (fraction not bound toIPTG) (R), LacI-IPTG binding cooperativity (m), affinity to binding sites of RNA polymerase in the absenceof cAMP-CRP (a), cAMP-CRP (d), and LacI (d), the effect of cAMP-CRP binding on RNA polymerase bindingstability (�), and maximum (�) and basal (�) expression rates. The model omits some molecular details,such as DNA looping stabilized by bound LacI tetramers, that are known to influence lac expression (15).Nevertheless, for all strains, the fitted models captured a substantial portion of the overall expressionvariation (root mean square error [RMSE] of the fitted models was low relative to overall variation inexpression [mean, 0.106; standard deviation, 0.055]).
Estimates of each model parameter were used to predict an idealized regulatory function thatcharacterized the individual and combined effect of IPTG and cAMP on lac expression (14). Followingprevious work, we used an artificial inducer, IPTG, to manipulate LacI activity. IPTG is not metabolized,allowing concentrations to be maintained through cell growth and reducing potential feedback betweeninducer concentration and cell growth rates (20). The resulting expression profiles will probably differfrom those that would be seen if the natural lactose inducer was used. One reason for this is that IPTGcan passively diffuse into cells, allowing a baseline intracellular concentration independent of the LacYpermease and reducing the influence of inducer exclusion, a posttranslational regulation mechanismthrough which glucose indirectly reduces the activity of the LacY permease (15, 18, 57). Reduced inducerexclusion has the effect of allowing LacI-mediated negative regulation and cAMP-CRP-mediated positiveregulation to be controlled independently so that all combinations of their activity can be measuredeven when some combinations may not be accessible during growth in environments containing onlynatural inducers. We note that many of the analyses we present focus on lac expression occurring atsaturating inducer concentrations, where LacY-independent uptake of IPTG is not expected to have anyadditional regulatory effect. Supporting this, we observed good correspondence between lac expressionestimates using high levels of IPTG and methyl-�-D-thiogalactoside (TMG), an inducer that depends onLacY for import (Fig. S6). We also find a significant correlation between expression levels during growthof strains in (i) glycerol, an environment supporting the production of high levels of endogenous cAMP,and in glucose supplemented with exogenous cAMP, and (ii) lactose and glucose supplemented withcAMP and IPTG (Fig. S6).
Regulatory parameter estimates were tested for an association with genetic variation in the lacI-ZYAregion of 18 of the strains for which expression and regulatory parameter information was available (thesequence of the entire lacI-ZYA region was not available for strains B156, B1167, TA135, TA263, andH413). Alignment of this region included 6,298 bases, of which 322 sites were polymorphic. The functionBUS in the BUS package was used to determine the association between estimated lac expressionparameters and polymorphism. The mutual information between these variables was determined, andsignificance was estimated using a permutation approach to correct for testing over multiple sites (usingoption method � 2).
Tests for phylogenetic signal were performed using the function phylosig in the Phytools package.The functions pd.calc and pd.bootstrap in the package Caper were used to test whether the strains weused were representative of the diversity present in our larger collection of 96 strains (Fig. S1). To do this,we compared the distance separating the strains used here to a distribution of distances between 1,000randomly chosen sets of the same number of strains from the 96 sequenced strains contained in ouroverall phylogeny. Comparisons between strain expression descriptions (model parameterization, logicphenotypes, and the complete expression landscape) were performed using nonparametric Mantel tests,as implemented in the Ecodist package.
Data availability. All relevant data and method scripts have been archived at Dryad (https://doi.org/10.5061/dryad.8cz8w9gk9).
Phillips et al. ®
November/December 2019 Volume 10 Issue 6 e02232-19 mbio.asm.org 12
on May 15, 2020 by guest
http://mbio.asm
.org/D
ownloaded from

SUPPLEMENTAL MATERIALSupplemental material for this article may be found at https://doi.org/10.1128/mBio
.02232-19.TEXT S1, DOCX file, 0.1 MB.FIG S1, PDF file, 0.01 MB.FIG S2, PDF file, 0.1 MB.FIG S3, PDF file, 0.1 MB.FIG S4, PDF file, 0.1 MB.FIG S5, PDF file, 0.1 MB.FIG S6, PDF file, 0.1 MB.TABLE S1, PDF file, 0.1 MB.TABLE S2, PDF file, 0.1 MB.TABLE S3, PDF file, 0.1 MB.
ACKNOWLEDGMENTSSupport for this study was obtained from NSF grants DEB-1253650 (to T.F.C.) and
IOS-071141 (T.F.C. and G.B.).
REFERENCES1. Lee DJ, Minchin SD, Busby S. 2012. Activating transcription in bacteria.
Annu Rev Microbiol 66:125–152. https://doi.org/10.1146/annurev-micro-092611-150012.
2. Kalisky T, Dekel E, Alon U. 2007. Cost-benefit theory and optimal designof gene regulation functions. Phys Biol 4:229 –245. https://doi.org/10.1088/1478-3975/4/4/001.
3. Dekel E, Alon U. 2005. Optimality and evolutionary tuning of theexpression level of a protein. Nature 436:588 –592. https://doi.org/10.1038/nature03842.
4. Dean AM. 1989. Selection and neutrality in lactose operons of Escherichiacoli. Genetics 123:441– 454.
5. Acar M, Mettetal JT, van Oudenaarden A. 2008. Stochastic switching asa survival strategy in fluctuating environments. Nat Genet 40:471– 475.https://doi.org/10.1038/ng.110.
6. Eames M, Kortemme T. 2012. Cost-benefit tradeoffs in engineered lacoperons. Science 336:911–915. https://doi.org/10.1126/science.1219083.
7. Frumkin I, Schirman D, Rotman A, Li F, Zahavi L, Mordret E, Asraf O, WuS, Levy SF, Pilpel Y. 2017. Gene architectures that minimize cost of geneexpression. Mol Cell 65:142–153. https://doi.org/10.1016/j.molcel.2016.11.007.
8. Scott M, Gunderson CW, Mateescu EM, Zhang Z, Hwa T. 2010. Interdepen-dence of cell growth and gene expression: origins and consequences.Science 330:1099–1102. https://doi.org/10.1126/science.1192588.
9. Aidelberg G, Towbin BD, Rothschild D, Dekel E, Bren A, Alon U. 2014.Hierarchy of non-glucose sugars in Escherichia coli. BMC Syst Biol 8:133.https://doi.org/10.1186/s12918-014-0133-z.
10. Kashiwagi A, Urabe I, Kaneko K, Yomo T. 2006. Adaptive response of a genenetwork to environmental changes by fitness-induced attractor selection.PLoS One 1:e49. https://doi.org/10.1371/journal.pone.0000049.
11. Pardee AB, Jacob F, Monod J. 1959. The genetic control and cytoplasmicexpression of “inducibility” in the synthesis of �-galactosidase by E. coli.J Mol Biol 1:165–178. https://doi.org/10.1016/S0022-2836(59)80045-0.
12. Jacob F, Monod J. 1961. Genetic regulatory mechanisms in the synthesisof proteins. J Mol Biol 3:318–356. https://doi.org/10.1016/s0022-2836(61)80072-7.
13. Setty Y, Mayo AE, Surette MG, Alon U. 2003. Detailed map of a cis-regulatory input function. Proc Natl Acad Sci U S A 100:7702–7707.https://doi.org/10.1073/pnas.1230759100.
14. Mayo AE, Setty Y, Shavit S, Zaslaver A, Alon U. 2006. Plasticity of thecis-regulatory input function of a gene. PLoS Biol 4:e45. https://doi.org/10.1371/journal.pbio.0040045.
15. Kuhlman T, Zhang Z, Saier MH, Hwa T. 2007. Combinatorial transcrip-tional control of the lactose operon of Escherichia coli. Proc Natl Acad SciU S A 104:6043– 6048. https://doi.org/10.1073/pnas.0606717104.
16. Choi PJ, Cai L, Frieda K, Xie XS. 2008. A stochastic single-molecule eventtriggers phenotype switching of a bacterial cell. Science 322:442– 446.https://doi.org/10.1126/science.1161427.
17. Gordon AJE, Satory D, Halliday JA, Herman C. 2013. Heritable change
caused by transient transcription errors. PLoS Genet 9:e1003595. https://doi.org/10.1371/journal.pgen.1003595.
18. Ozbudak EM, Thattai M, Lim HN, Shraiman BI, van Oudenaarden A. 2004.Multistability in the lactose utilization network of Escherichia coli. Nature427:737–740. https://doi.org/10.1038/nature02298.
19. Stoebel DM, Dean AM, Dykhuizen DE. 2008. The cost of expression ofEscherichia coli lac operon proteins is in the process, not in the products.Genetics 178:1653–1660. https://doi.org/10.1534/genetics.107.085399.
20. Ray JCJ, Wickersheim ML, Jalihal AP, Adeshina YO, Cooper TF, Balazsi G.2016. Cellular growth arrest and persistence from enzyme saturation. PLoSComput Biol 12:e1004825. https://doi.org/10.1371/journal.pcbi.1004825.
21. Quan S, Ray JCJ, Kwota Z, Duong T, Balazsi G, Cooper TF, Monds RD.2012. Adaptive evolution of the lactose utilization network in experi-mentally evolved populations of Escherichia coli. PLoS Genet8:e1002444. https://doi.org/10.1371/journal.pgen.1002444.
22. Zhong S, Miller SP, Dykhuizen DE, Dean AM. 2009. Transcription, trans-lation, and the evolution of specialists and generalists. Mol Biol Evol26:2661–2678. https://doi.org/10.1093/molbev/msp187.
23. Perfeito L, Ghozzi S, Berg J, Schnetz K, Lässig M. 2011. Nonlinear fitnesslandscape of a molecular pathway. PLoS Genet 7:e1002160. https://doi.org/10.1371/journal.pgen.1002160.
24. Savageau MA. 1998. Demand theory of gene regulation. II. Quantitativeapplication to the lactose and maltose operons of Escherichia coli.Genetics 149:1677–1691.
25. Semsey S. 2014. Mutations in transcriptional regulators allow selectiveengineering of signal integration logic. mBio 5:e01171-14. https://doi.org/10.1128/mBio.01171-14.
26. Fulcrand G, Dages S, Zhi X, Chapagain P, Gerstman BS, Dunlap D, LengF. 2016. DNA supercoiling, a critical signal regulating the basal expres-sion of the lac operon in Escherichia coli. Sci Rep 6:19243. https://doi.org/10.1038/srep19243.
27. Vilar JMG, Leibler S. 2003. DNA looping and physical constraints ontranscription regulation. J Mol Biol 331:981–989. https://doi.org/10.1016/s0022-2836(03)00764-2.
28. Jobe A, Riggs AD, Bourgeois S. 1972. lac repressor-operator interaction:V. Characterization of super- and pseudo-wild-type repressors. J Mol Biol64:181–199. https://doi.org/10.1016/0022-2836(72)90328-2.
29. Zubay G, Schwartz D, Beckwith J. 1970. Mechanism of activation ofcatabolite-sensitive genes: a positive control system. Proc Natl Acad SciU S A 66:104 –110. https://doi.org/10.1073/pnas.66.1.104.
30. Kaplan S, Bren A, Zaslaver A, Dekel E, Alon U. 2008. Diverse two-dimensional input functions control bacterial sugar genes. Mol Cell29:786 –792. https://doi.org/10.1016/j.molcel.2008.01.021.
31. Bachmann BJ. 1996. Derivations and genotypes of some mutant deriv-atives of Escherichia coli K-12, p 1–37. In Neidhardt FC (ed), Escherichiacoli and Salmonella: cellular and molecular biology, 2nd ed. ASM Press,Washington, DC.
32. Jensen KF. 1993. The Escherichia coli K-12 “wild types” W3110 and
Natural Variation in a Gene Input Function ®
November/December 2019 Volume 10 Issue 6 e02232-19 mbio.asm.org 13
on May 15, 2020 by guest
http://mbio.asm
.org/D
ownloaded from
MG1655 have an rph frameshift mutation that leads to pyrimidinestarvation due to low pyrE expression levels. J Bacteriol 175:3401–3407.https://doi.org/10.1128/jb.175.11.3401-3407.1993.
33. de Vos MGJ, Poelwijk FJ, Battich N, Ndika JD, Tans SJ. 2013. Environ-mental dependence of genetic constraint. PLoS Genet 9:e1003580.https://doi.org/10.1371/journal.pgen.1003580.
34. Dykhuizen D, Dean A, Hartl DL. 1987. Metabolic flux and fitness. Genetics115:25–31.
35. González C, Ray JCJ, Manhart M, Adams RM, Nevozhay D, Morozov AV,Balázsi G. 2015. Stress-response balance drives the evolution of a net-work module and its host genome. Mol Syst Biol 11:827– 827. https://doi.org/10.15252/msb.20156185.
36. Suiter AM, Bänziger O, Dean AM. 2003. Fitness consequences of aregulatory polymorphism in a seasonal environment. Proc Natl Acad SciU S A 100:12782–12786. https://doi.org/10.1073/pnas.2134994100.
37. Cooper TF, Remold SK, Lenski RE, Schneider D. 2008. Expression profilesreveal parallel evolution of epistatic interactions involving the CRPregulon in Escherichia coli. PLoS Genet 4:e35. https://doi.org/10.1371/journal.pgen.0040035.
38. Treviño S, Sun Y, Cooper TF, Bassler KE. 2012. Robust detection of hierar-chical communities from Escherichia coli gene expression data. PLoS Com-put Biol 8:e1002391. https://doi.org/10.1371/journal.pcbi.1002391.
39. Fay JC, Wittkopp PJ. 2008. Evaluating the role of natural selection in theevolution of gene regulation. Heredity (Edinb) 100:191–199. https://doi.org/10.1038/sj.hdy.6801000.
40. Le Gall T, Darlu P, Escobar-Páramo P, Picard B, Denamur E. 2005.Selection-driven transcriptome polymorphism in Escherichia coli/Shigellaspecies. Genome Res 15:260 –268. https://doi.org/10.1101/gr.2405905.
41. Whitehead A, Crawford DL. 2006. Neutral and adaptive variation in geneexpression. Proc Natl Acad Sci U S A 103:5425–5430. https://doi.org/10.1073/pnas.0507648103.
42. Wang Y, Díaz Arenas C, Stoebel DM, Flynn K, Knapp E, Dillon MM,Wünsche A, Hatcher P, Moore F-G, Cooper VS, Cooper TF. 2016. Benefitof transferred mutations is better predicted by the fitness of recipientsthan by their ecological or genetic relatedness. Proc Natl Acad Sci U S A113:5047–5052. https://doi.org/10.1073/pnas.1524988113.
43. Pagel M. 1999. Inferring the historical patterns of biological evolution.Nature 401:877– 884. https://doi.org/10.1038/44766.
44. Behringer MG, Choi BI, Miller SF, Doak TG, Karty JA, Guo W, Lynch M.2018. Escherichia coli cultures maintain stable subpopulation structureduring long-term evolution. Proc Natl Acad Sci U S A 115:E4642–E4650.https://doi.org/10.1073/pnas.1708371115.
45. Osborne SE, Walthers D, Tomljenovic AM, Mulder DT, Silphaduang U,Duong N, Lowden MJ, Wickham ME, Waller RF, Kenney LJ, Coombes BK.2009. Pathogenic adaptation of intracellular bacteria by rewiring a cis-
regulatory input function. Proc Natl Acad Sci U S A 106:3982–3987.https://doi.org/10.1073/pnas.0811669106.
46. Huber RE, Hakda S, Cheng C, Cupples CG, Edwards RA. 2003. Trp-999 of�-Galactosidase (Escherichia coli) is a key residue for binding, catalysis,and synthesis of allolactose, the natural lac operon inducer. Biochemis-try 42:1796 –1803. https://doi.org/10.1021/bi0270642.
47. Juers DH, Hakda S, Matthews BW, Huber RE. 2003. Structural basis for thealtered activity of Gly794 variants of Escherichia coli �-Galactosidase.Biochemistry 42:13505–13511. https://doi.org/10.1021/bi035506j.
48. Sutendra G, Wong S, Fraser ME, Huber RE. 2007. �-Galactosidase (Esch-erichia coli) has a second catalytically important Mg2� site. BiochemBiophys Res Commun 352:566 –570. https://doi.org/10.1016/j.bbrc.2006.11.061.
49. Moore F-G, Woods R. 2006. Tempo and constraint of adaptive evolutionin Escherichia coli (Enterobacteriaceae, Enterobacteriales). Biological Jthe Linnean Society 88:403– 411. https://doi.org/10.1111/j.1095-8312.2006.00629.x.
50. Datsenko KA, Wanner BL. 2000. One-step inactivation of chromosomalgenes in Escherichia coli K-12 using PCR products. Proc Natl Acad Sci U S A97:6640–6645. https://doi.org/10.1073/pnas.120163297.
51. Datta S, Costantino N, Court DL. 2006. A set of recombineering plasmidsfor gram-negative bacteria. Gene 379:109 –115. https://doi.org/10.1016/j.gene.2006.04.018.
52. Choi K-H, Gaynor JB, White KG, Lopez C, Bosio CM, Karkhoff-SchweizerRR, Schweizer HP. 2005. A Tn7-based broad-range bacterial cloning andexpression system. Nat Methods 2:443– 448. https://doi.org/10.1038/nmeth765.
53. Laing C, Buchanan C, Taboada EN, Zhang Y, Kropinski A, Villegas A,Thomas JE, Gannon V. 2010. Pan-genome sequence analysis usingPanseq: an online tool for the rapid analysis of core and accessorygenomic regions. BMC Bioinformatics 11:461. https://doi.org/10.1186/1471-2105-11-461.
54. Felsenstein J. 1989. PHYLIP–phylogeny inference package (version 3.2).Cladistics 5:164 –166.
55. Zwietering MH, Jongenburger I, Rombouts FM, van ‘t Riet K. 1990. Modelingof the bacterial growth curve. Appl Environ Microbiol 56:1875–1881.
56. R Core Team. 2017. R: a language and environment for statistical com-puting. R Foundation for Statistical Computing, Vienna, Austria. https://www.r-project.org.
57. Fernández-Castané A, Vine CE, Caminal G, López-Santín J. 2012. Evidenc-ing the role of lactose permease in IPTG uptake by Escherichia coli infed-batch high cell density cultures. J Biotechnol 157:391–398. https://doi.org/10.1016/j.jbiotec.2011.12.007.
58. Zhang X, Bremer H. 1995. Control of the Escherichia coli rrnB P1 pro-moter strength by ppGpp. J Biol Chem 270:11181–11189. https://doi.org/10.1074/jbc.270.19.11181.
Phillips et al. ®
November/December 2019 Volume 10 Issue 6 e02232-19 mbio.asm.org 14
on May 15, 2020 by guest
http://mbio.asm
.org/D
ownloaded from