diagnosis techniques & strategies to reduce non-revenue
TRANSCRIPT

Diagnosis Techniques & Strategies to Reduce Non-revenue Water in the MENA Region
Miyahuna 5-Years NRW Strategic & Investment Plan 2017 – 2021
Eng. Khaldon H. KhashmanACWUA Secretary General

ACWUA Applied Research Project:
“Developing diagnosis techniques and strategies to reduce Non-Revenue Water (NRW) in the Middle East Region ”
The project addressed needed strategies to be adopted by utilities to:
• Improve NRW levels sustainably, • Increase efficiency, • Provide a framework for continuous monitoring &
evaluation.

Selection of Subject Utilities and formation of NRW Task Force
Selection of Subject Utilities and formation of NRW Task Force
Design and Preparation of Utility Assessments‐
DiagnosisNRW assessment matrix
Design and Preparation of Utility Assessments‐
DiagnosisNRW assessment matrix
Implementation of Assessment/Diagnostic
visit
Implementation of Assessment/Diagnostic
visit
NRW Strategies & Identifying
Improvement Measures and Action Plans
NRW Strategies & Identifying
Improvement Measures and Action Plans
Coaching and Mentoring during Plan
Implementation
Coaching and Mentoring during Plan
Implementation Knowledge ExchangeKnowledge Exchange
Diagnostic Tool
Visit Reports
Miyah
una,
AW, S
ana’a,
GCC
W,
Sone
de
The research team adopted the following procedures:

Assessment
• Governance• Environment• Social• etc.
External Factors
Internal Factors
• Management• Capacity• Procedures• Etc.
Good practices
• NRW Monitoring• ALC• Meter Accuracy• Etc.
Performance• L/C/D• Etc.
Utility visit and evaluation
Diagnostic Tool Kit Description

DEVELOPING DIAGNOSIS TECHNIQUES & STRATEGIES TO REDUCE NON‐REVENUE WATER IN MENA REGIONconcept Intervention Resulting
Score Marks
1 2 3 4
Mea
suremen
t
Bulk meter Sectorization 3
Bulk system inputs and outputs are not metered, or partly metered. A large portion of readings are estimated.
Bulk system input, imported bulk, and exported bulk are entirely metered and readings are recorded continuously.
Major distribution mains/subsystems are bulk metered and readings are recorded continuously.
90% of the network is divided into small DMAs and bulk meter readings are recorded continuously.
Input Metering Accuracy 2.5
Most bulk meters used are mechanical. Accuracy of flowmeters is unknown.
Most bulk meters used are mechanical. Meters are checked for accuracy and meters with high errors are replaced.
Electronic flowmeters are used for the most critical input, along with mechanical flowmeters, all checked regularly for accuracy and calibrated.
90% or more of bulk meters used are electromagnetic or equivalent, and regularly checked and calibrated.
Customer Metering 4
Most customers are not metered.
Largest customers are metered. Most other customers are not metered.
All large customers are metered. Most customers are metered.
All customers are metered.
Data Acquisition 2
Most bulk meters and pressure gauges are read manually
The main flow and pressure readings are automated.
90% or more bulk meter reading is automated. Readings are accessed from multiple sources.
90% or more bulk meter reading is automated. Readings are collected in one system that automates calculations and comparisons.
Scoring Matrix for Measurements

DEVELOPING DIAGNOSIS TECHNIQUES & STRATEGIES TO REDUCE NON‐REVENUE WATER IN MENA REGIONconcept Intervention Resulting Score Marks
0 1 2 3 4
Ana
lysis
Top‐Down Water Balance 1
No water balance is calculated.
An IWA water balance is calculated for the entire system.
An IWA water balance is calculated for each subsystem/major distribution network, as well as for the entire system.
An IWA water balance is calculated for each small DMA, subsystems, as well as for the entire system.
Representative KPIs 2
NRW targets are based on percentage levels.
NRW targets are evaluated using percentage mainly, but also other indicators such as l/c/d or l/km/d.
NRW targets are mainly based on different physical and commercial loss indicators, such as ILI and API.
NRW targets are set using physical and commercial loss indicators at the sector/district level.
Bottom‐up Water Balance 2
No measurements of MNF and meter accuracy are measured only in response to complaint or general checks.
Measurements of meter accuracy and MNF in some zones are used to validate the water balance.
Detailed MNF analysis and LNU is made. Meter errors are measured in‐situ or with the help of consumption profiles.
Every water balance is checked and corrected against bottom‐up measurements of loss components.
Economic Level of NRW 2
No financial assessment of NRW is made.
Estimations of cost and benefits for reducing NRW are made.
Analysis of real and administrative losses cost and benefit for the entire system.
Detailed analysis of real and administrative losses cost and benefit for each system.
Scoring Matrix for Analysis

DEVELOPING DIAGNOSIS TECHNIQUES & STRATEGIES TO REDUCE NON‐REVENUE WATER IN MENA REGION
concept Intervention ResultingScore
Marks
0 1 2 3 4
Phy
sica
l Los
s
Active Leakage Control 3
No active leak control, or some leak detection surveys in specific locations are done.
Leak detection is a continuous activity.
Leak detection is continuous and prioritized according to network parameters and visible leaks, and covers the entire network.
Leak detection is continuous and managed according to calculated leakage levels and set targets, and covers the entire network every year.
Speed and Quality of Repair
3.5
Mobilization takes a long time and some repairs are not made.
There are teams ready for repair & maintenance. Time records are kept.
All leaks are repaired within 2 days and repairs are checked for quality. Records of leak location and other information are kept and used.
All leaks are repaired within 1 day and repairs are checked for quality. Repair units are equipped with digital devices for recording exact locations and documenting repair details.
Pressure Management 3
No regulation or monitoring of pressure within the distribution network, except for a number of pilot areas.
Problems related to high pressure in some parts of the network have led to the installation of pressure management devices.
Most of the network has been modified according to hydraulic analysis, and pressure is reduced to minimum values at inlet.
90% or more of the network is pressure managed, including taking regular pressure readings from critical points the use of hydraulic models for verification and monitoring.
Pipeline and Asset
Management3
Reactive management of pipes, valves, fittings, and reservoir assets.
Inspection and replacement of pipes, valves, fittings, and reservoirs according to indications for high priority and continuous problems.
There is a program in application for the inspection and replacement according to technical criteria and supported by strong GIS.
Asset management program is in application and GIS is continuously updated. Both financial and technical parameters are used for prioritization.
Scoring Matrix for Physical Losses

concept Intervention ResultingScore
Marks
0 1 2 3 4
Com
mercial Los
s
Meter Accuracy 3
Reactive replacement of stopped or dysfunctional meters.
Some meter replacement and upgrade for some locations or customers. Large customer meters are maintained and upgraded with high quality meters.
All meters are under 10 years old. Large customer meters are class D or equivalent. Meters are inspected for correct installation.
90% or more of customer meters are class D or equivalent. All meters are replaced or verified for accuracy every 5. Meters are inspected for correct installation.
Meter Reading Accuracy 3
Reading is taken by hand, no checking for abnormalities before issuing bills.
Readings are taken by hand, reading abnormalities are checked, and readers are rotated.
90% or more of readings are taken by handheld devices, reading abnormalities are checked on location, and readers are rotated.
90% or more of readings are taken by AMR, reading abnormalities are advanced, and estimations are minimalized.
Reduction of Unauthorized Consumption
3.5
Reports of unauthorized consumption are reported case by case.
Reporting unauthorized consumption a responsibility of field workers like meter readers. Most cases are deal with.
A specialized inspection team is used for active inspection. Every case reported is verified and dealt with.
Specialized inspection team with custom reports and technical tools. Cases are perused, corrected, and documented.
Accuracy of Customer Database
3.8Data is not audited. Customers may be misplaced or missing.
Feedback from field is systematically used for updating customer database.
Customer database is fully connected to GIS, and campaigns are launched to correct main issues.
Customer database is fully connected to GIS and continuously updated with field data, and new customer information.
Scoring Matrix for Commercial Losses

©2183/5/2016

©2183/5/2016

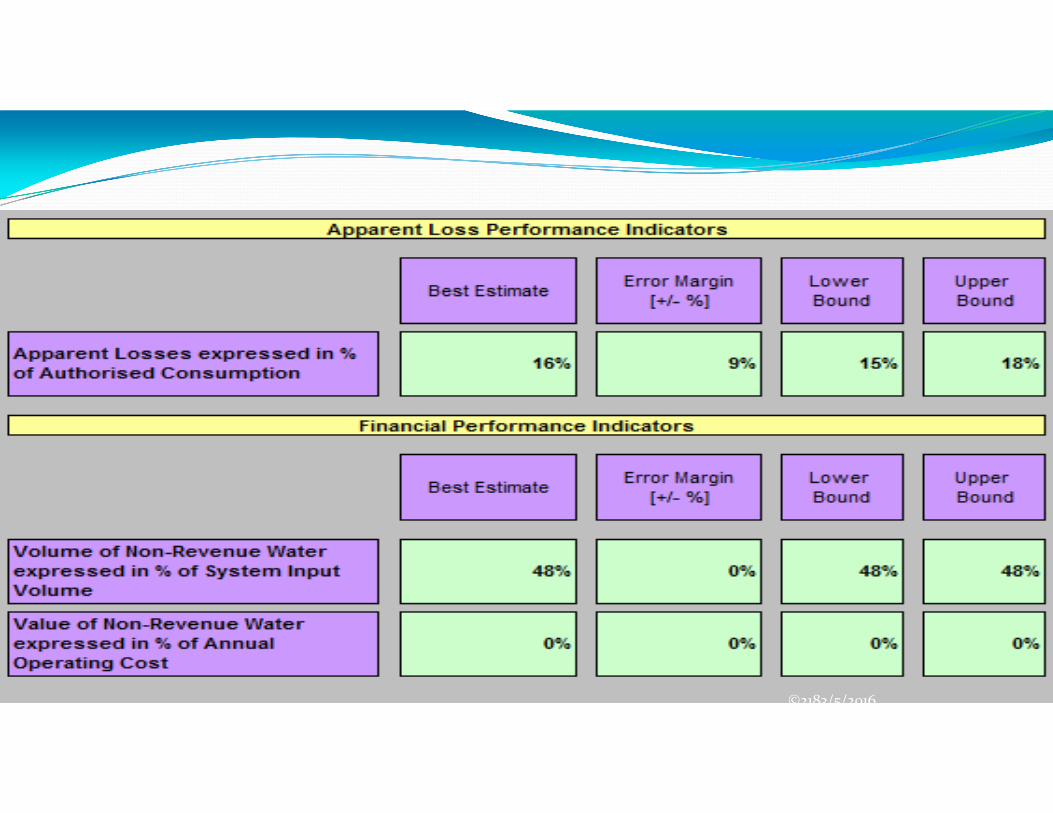
Water balance sheet and performance indicators 2014 for Miyahuna
A water balance and results of performance indicators were prepared for Amman Governorate service area based
on the figure from Miyahuna billing system.
©2183/5/2016

©2183/5/2016
©2183/5/2016

©2183/5/2016
Proposed soft actions plans
• More ambitious soft and active actions plan was introduced to Miyahuna top management showing investments versus gains over five years period duration.
• NRW Miyahuna savings versus investments values for Amman Governorate summary:
• Net water supply Amman Governorate (Miyahuna service area excluding the exported water) for the year 2014 =179.53 mcm (source Miyahuna billing system).
• Authorized consumption (billed and unbilled) 2014 = 94.2 mcm (source Miyahuna billing system). Estimated quantity of losses = 85.253 mcm in 2014.
• NRW% as estimated by water balance sheet 48% (compatible with ISSP and PMU reports).

©2183/5/2016

©2183/5/2016

©2183/5/2016

©2183/5/2016

Conclusions (1)• The proposed capital investment for the rehabilitation of Amman area network
as stated in the Jordan water strategy plan for the years 2016 – 2025 is about 335 m$ and the estimated savings from this plan is 10% in NRW terms which is equal to 8.523 mcm/year with a saving of 12m$.
• Implementing Miyahuna NRW strategic PIP explained in this document is expected to reduce the NRW from the level of 48% to 19.2%.
• The on-going investments of USAID, KFW and AFD are already consideredand included in the prepared Miyahuna NRW strategic PIP.
• Improving of DMAs shall be tackled as a complete package (Hydraulicmodeling restructuring of network, civil works, isolation, PRVs installation,pressure and flow measurements in addition to the construction of a fulldatabase for permanent sustainable monitoring).
©2183/5/2016

Conclusions (2)• This strategy shall be translated into a five years implementation plan with definite
time schedule.
• A steering committee for implementing this strategy shall be formed, and instructed by Miyahuna’s Board of Directors and monitored by the PMU.
• It’s expected that Miyahuna management be committed to support the NRW department and all the activities mentioned above to reduce the NRW components as a continuous daily activities to reach a sustainable level.
• Incentives program shall be developed for the employees working in these activities under the NRW department, maintenance activities, and illegal inspection teams and others.
• Law enforcement supported by the government shall be the key factor to reduce the illegal use.

Arab Countries Water Utilities Association (ACWUA)P. O. Box: 962449, Amman 11196 JordanE-mail: [email protected]: +962-6-5161-700Fax: +962-6-5161-800
©2183/5/2016© Copy Rights Reserved for ACWUA