developing serious games in engineering education
TRANSCRIPT

University of Nebraska - LincolnDigitalCommons@University of Nebraska - LincolnBiological Systems Engineering--Dissertations,Theses, and Student Research Biological Systems Engineering
11-2018
Developing Serious Games in EngineeringEducation: Innovation at the Nexus of Food,Energy, and Water SystemsNathan RiceUniversity of Nebraska-Lincoln, [email protected]
Follow this and additional works at: http://digitalcommons.unl.edu/biosysengdiss
Part of the Bioresource and Agricultural Engineering Commons, Science and MathematicsEducation Commons, and the Secondary Education Commons
This Article is brought to you for free and open access by the Biological Systems Engineering at DigitalCommons@University of Nebraska - Lincoln. Ithas been accepted for inclusion in Biological Systems Engineering--Dissertations, Theses, and Student Research by an authorized administrator ofDigitalCommons@University of Nebraska - Lincoln.
Rice, Nathan, "Developing Serious Games in Engineering Education: Innovation at the Nexus of Food, Energy, and Water Systems"(2018). Biological Systems Engineering--Dissertations, Theses, and Student Research. 84.http://digitalcommons.unl.edu/biosysengdiss/84

DEVELOPING SERIOUS GAMES IN ENGINEERING EDUCATION: INNOVATION
AT THE NEXUS OF FOOD, ENERGY, AND WATER SYSTEMS
by
Nathan Rice
A THESIS
Presented to the Faculty of
The Graduate College at the University of Nebraska
In Partial Fulfillment of Requirements
For the Degree of Master of Science
Major: Agricultural and Biological Systems Engineering
Under the Supervision of Professor Jenny Keshwani and Professor Ashu Guru
Lincoln, Nebraska
November, 2018

DEVELOPING SERIOUS GAMES IN ENGINEERING EDUCATION: INNOVATION
AT THE NEXUS OF FOOD, ENERGY, AND WATER SYSTEMS
Nathan Rice, M.S.
University of Nebraska, 2018
Advisors: Jenny Keshwani and Ashu Guru
At a time when food, energy, and water (FEW) are of the utmost concern to the
security and health of the world, an initiative has begun to understand the interactions
between these systems. The goal of Innovation at the Nexus of Food, Energy, and Water
Systems (INFEWS) is to bring together research fields that typically work in their own
silos to solve complex problems increasing the resiliency and sustainability of the FEW
system. Stemming from this initiative was a project to produce an educational immersive
simulation game to teach youth about how their food is produced, systems thinking, and
sustainable agriculture. The following thesis investigates the current progress of this
project with a focus on the development and implementation of serious games to provide
youth a scientifically authentic environment to understand the complexities of the FEW
system. The Corn-Water-Ethanol-Beef (CWEB) system in the United States Midwest
was selected as the exemplary model for this investigation. The objectives of the thesis
are: (1) develop a theoretical framework for integrating scientific models into serious
educational game design, (2) implement a game-based learning strategy in the classroom
and compare to a traditional educational approach, (3) explore the use the systems
thinking instrument designed by Evagorou et al., (2009) with college age students and
make adjustments to its design to measure students’ capacity for systems thinking, and
(4) identify future areas of research for progressing the INFEWS initiative through
serious educational games.

iii
ACKNOWLEDGEMENTS
My time at the University of Nebraska – Lincoln has forever shaped the path my
life will take. Filled with opportunities for career development, exploration, and
discovery, it is difficult to express the extent of gratitude I have for those who invested in
me along the way. To my advisors, Dr. Jenny Keshwani and Dr. Ashu Guru, I would like
to thank you for constantly challenging me to grow and being my greatest advocate. You
were a constant rock throughout my project illustrating what it means to be a mentor. Dr.
Jeyam Subbiah I would like to thank you for reaching out to me during my undergrad and
showing a genuine interest in my future. Your inspiration is the reason I went on to
pursue a master’s degree. Dr. Deepak Keshwani your ability to interact and build
relationships with students is truly remarkable. I would encourage you to never lose your
intensity and love of teaching as it is a blessing to this campus.
I would also like to thank the students I had the opportunity to work with
throughout this project. To my fellow grad student, Ryan Anderson, it was a pleasure
getting to know you and seeing the remarkable skills you possess. I always appreciated
your reliability and focus. The project would not be where it is today without all your
hard work. Luke Monhollon your big picture thinking was a huge blessing to this project
as it challenged the status quo and pushed us to improve. Jake Eiserman, Ben
Buckwalter, Conner Lunn, Alli Hauger, Capri Keeler and Eesh Gupta I thank you for
coming on to the project as undergrads and high school students and making such a
difference to its success. It was incredible to see such talented young students take the
initiative to learn new skills and I am certain it will pay dividends in your future careers.

iv
TABLE OF CONTENTS
LIST OF FIGURES ........................................................................................................... ix
LIST OF TABLES ............................................................................................................. xi
CHAPTER 1. INTRODUCTION ....................................................................................... 1
1.1 Motivation of Research ............................................................................................ 1
1.2 INFEWs Initiative .................................................................................................... 2
1.3 Scientific Modeling .................................................................................................. 3
1.5 Game-Based Learning .............................................................................................. 5
1.6 Objectives ................................................................................................................. 7
1.7 Research ................................................................................................................... 8
References ..................................................................................................................... 11
CHAPTER 2 TITLE PAGE .............................................................................................. 16
CHAPTER 2. INTEGRATION OF A SCIENTIFIC MODEL INTO SERIOUS
EDUCATIONAL GAME DESIGN: MODEL FRAMEWORK ...................................... 17
Abstract ......................................................................................................................... 17
2.1 Background ............................................................................................................ 18
2.2 Methods .................................................................................................................. 19
2.2.1 Model Identification ........................................................................................ 20
2.2.1.1 Validation/Acceptance .............................................................................. 20
2.2.1.2. Learning Outcomes .................................................................................. 20
2.2.1.3 Level of Detail .......................................................................................... 21
2.2.1.4 API Access ................................................................................................ 22
2.2.2 Decision Point Selection .................................................................................. 22
2.2.2.1 Potential Decision Point List .................................................................... 23
2.2.2.2 Expert Panel Evaluation ............................................................................ 23
2.2.2.3 Model Connection ..................................................................................... 23
2.2.2.4 Game Value: Education, Entertainment, and Engagement ....................... 24
2.2.3 Player Evaluation ............................................................................................. 24
2.2.3.1 Normalization ........................................................................................... 25
2.2.3.2 Category Weighting .................................................................................. 25
2.2.3.3 Scoring System ......................................................................................... 26
2.2.3.4 Scoring Evaluation .................................................................................... 27

v
2.3 Results .................................................................................................................... 27
2.3.1 Model Identification ........................................................................................ 28
2.3.1.1 Learning Outcomes ................................................................................... 28
2.3.1.2 Level of Detail .......................................................................................... 29
2.3.1.3 Access to API ............................................................................................ 30
2.3.1.4 Model Selection ........................................................................................ 30
2.3.2 Decision Point Selection .................................................................................. 30
2.3.2.1 Potential Decision Point List .................................................................... 30
2.3.2.2 Expert Panel .............................................................................................. 31
2.3.2.3 Model/Numerical Representation ............................................................. 32
2.3.2.4 Game Value .............................................................................................. 33
2.3.3 Player Evaluation ............................................................................................. 35
2.3.3.1 Normalization ........................................................................................... 35
2.3.3.2 Category Weighting .................................................................................. 36
2.3.3.3 Scoring System ......................................................................................... 36
2.4 Discussion .............................................................................................................. 37
2.4.1 Model Identification ........................................................................................ 37
2.4.2 Decision Point Selection ................................................................................. 38
2.4.3 Player Evaluation ............................................................................................. 39
2.4.4 Application ...................................................................................................... 40
2.5 Limitations ............................................................................................................. 41
2.6 Conclusion .............................................................................................................. 41
2.7 Funding................................................................................................................... 42
References ..................................................................................................................... 43
CHAPTER 3 TITLE PAGE .............................................................................................. 46
CHAPTER 3. PROGRESSION OF A SYSTEMS THINKING RESEARCH
INSTRUMENT FOR EVALUATION OF UNDERGRADUATE STUDENTS ............. 47
Abstract ......................................................................................................................... 47
3.1 Introduction ............................................................................................................ 47
3.2 Methods .................................................................................................................. 50
3.2.1 Course Design.................................................................................................. 51
3.2.1.1 Course A ................................................................................................... 51
3.2.1.2 Course B.................................................................................................... 52

vi
3.2.1.3 Course C.................................................................................................... 52
3.2.2 Research Instrument Evaluation ...................................................................... 54
3.2.3 Survey Question Rubrics ................................................................................. 55
3.3 Results .................................................................................................................... 58
3.3.1 Course A .......................................................................................................... 58
3.3.1.1 Qualitative Data ......................................................................................... 58
3.3.1.2 Quantitative Data Results ......................................................................... 62
3.3.2 Course B .......................................................................................................... 63
3.3.2.1 Qualitative Data Results ........................................................................... 63
3.3.2.2 Quantitative Data Results ......................................................................... 65
3.3.3 Course C .......................................................................................................... 66
3.4 Discussion .............................................................................................................. 66
3.4.1 Course A .......................................................................................................... 66
3.4.1.1 Research Instrument.................................................................................. 67
3.4.1.2 Intervention ............................................................................................... 68
3.4.1.3 Research Design........................................................................................ 69
3.4.1.4 Conclusion – Course A ............................................................................. 70
3.4.2 Course B .......................................................................................................... 71
3.4.2.1 Research Instrument.................................................................................. 71
3.4.2.2 Intervention ............................................................................................... 72
3.4.2.3 Research Design........................................................................................ 73
3.4.2.4 Conclusion – Course B ............................................................................. 74
3.4.3 Course C .......................................................................................................... 75
3.4.4 Collective Findings .......................................................................................... 76
3.5 Conclusion .............................................................................................................. 77
References ..................................................................................................................... 79
Appendix A ................................................................................................................... 82
CHAPTER 4 AND 5 INTRODUCTION ......................................................................... 88
CHAPTER 4 TITLE PAGE .............................................................................................. 90
CHAPTER 4. COMPARISON OF GAME-BASED LEARNING AND TRADITIONAL
LECTURE APPROACHES TO IMPROVE STUDENT ENGAGEMENT AND
KNOWLEDGE TRANSFER IN STEM EDUCATION: WORK IN PROGRESS.......... 91
Abstract ......................................................................................................................... 91

vii
4.1 Introduction ............................................................................................................ 92
4.2 Methods .................................................................................................................. 93
4.2.1 Sample ............................................................................................................. 93
4.2.2 Intervention ...................................................................................................... 94
4.2.3 Data Collection ................................................................................................ 98
4.2.4 Evaluation ........................................................................................................ 99
4.3 Results .................................................................................................................. 100
4.4 Discussion ............................................................................................................ 103
References ................................................................................................................... 106
Appendix B ................................................................................................................. 108
Appendix C ................................................................................................................. 110
CHAPTER 5 TITLE PAGE ............................................................................................ 113
CHAPTER 5. EFFECT OF GAME-BASED LEARNING ON UNDERGRADUATE
STUDENT UNDERSTANDING OF THE FOOD-ENERGY-WATER NEXUS ......... 114
Abstract ....................................................................................................................... 114
5.1 Introduction .......................................................................................................... 114
5.2 Methods ................................................................................................................ 116
5.2.1 Student Participants ....................................................................................... 116
5.2.2 Game and lecture intervention ....................................................................... 116
5.2.3 Research design and data analysis ................................................................. 117
5.2.4 Instruments .................................................................................................... 117
5.3 Results .................................................................................................................. 118
5.3.1 Impact on Student Content Knowledge ......................................................... 118
5.3.2 Impact on Career Interests ............................................................................. 120
5.3.3 Board Game Assessment ............................................................................... 120
5.4 Discussion ............................................................................................................ 121
5.4.1 Impact on Student Content Knowledge ......................................................... 121
5.4.2 Impact on Career Interests ............................................................................. 123
5.4.3 Board Game Assessment ............................................................................... 123
5.5 Summary .............................................................................................................. 124
5.6 Acknowledgements .............................................................................................. 125
References ................................................................................................................... 126
Appendix D ................................................................................................................. 127

viii
CHAPTER 6. SUMMARY AND RECOMMENDATIONS FOR FUTURE WORK ... 129
6.1 Summary .............................................................................................................. 129
6.2 Recommendations for future work ....................................................................... 131
6.2.1 Theoretical framework for the integration of scientific models into SEG design
................................................................................................................................. 132
6.2.2 Serious Educational Games in the Classroom ............................................... 132
6.2.2.1 Serious Gaming Research Questions ...................................................... 133
6.2.2.2 Implementation Design for Agpocalypse 2050 ...................................... 134
6.2.3 Systems Thinking Instrument ........................................................................ 136
6.3 Conclusion ............................................................................................................ 137
6.4 Acknowledgements .............................................................................................. 137
References ................................................................................................................... 138
Appendix E: Supplemental Information ......................................................................... 139
WRONG GAME, WRONG MESSAGE .................................................................... 139
PRESERVATION BOARD GAME MATERIALS ................................................... 145
Purchase Preservation .............................................................................................. 145
Preservation Board Game Rule Book Pages ........................................................... 146
Preservation Board Game Tiles: Front .................................................................... 151
Preservation Board Game Hazard Card: Front ........................................................ 153
Preservation Board Game Advancement Cards: Front ............................................ 160
Preservation Board Game Career Cards: Front ....................................................... 165
Preservation Board Game Card Backs .................................................................... 166
Preservation Board Game Homework Assignment – Advancements ..................... 167
Preservation Board Game Homework Assignment – Hazards ................................ 168
Beef or No Beef........................................................................................................... 169
Game Theory Lesson Plan .......................................................................................... 175

ix
LIST OF FIGURES
Figure 2.1. Hierarchical tree structure with example weight allocation. .......................... 26
Figure 2.2. Example scoring tree hierarchy. ..................................................................... 27
Figure 2.3. Potential decision point list grouped into categories with a hierarchical
structure............................................................................................................................. 31
Figure 2.4. Restructured decision point list following expert panel inspection. ............... 32
Figure 2.5. Model represented decision point using player input values.......................... 32
Figure 2.6. Example decision using both the scientific model and a numerical solution. 33
Figure 2.7. Remaining decisions that could be calculated with scientific accuracy. ........ 33
Figure 2.8. Final decision point list used for the game. .................................................... 35
Figure 2.9. Category weights applied to the decision point list. ....................................... 36
Figure 2.10. Sustainability score graphical interface used to display the final score in the
game. ................................................................................................................................. 37
Figure 2.11. Model approach for selecting an appropriate scientific model to be used in a
SEG. .................................................................................................................................. 38
Figure 2.12. Model approach for selecting decisions to be included in an SEG. ............. 39
Figure 2.13. Model approach for SEG scoring evaluation system. .................................. 40
Figure 2.14. Theoretical model for integrating a scientific model throughout a SEG
design. ............................................................................................................................... 41
Figure 3.1. Example student answer for question 1 on the systems thinking research
instrument Version 1. Question score = 5. ........................................................................ 59
Figure 3.2. Example student answer for question 2 on the systems thinking research
instrument Version 1. Question score = 5. ........................................................................ 60
Figure 3.3. Example student answer for question 3 on the systems thinking research
instrument Version 1. Question score = 2 ......................................................................... 60
Figure 3.4. Example student answer for question 4 on the systems thinking research
instrument Version 1. Question score = 5. ........................................................................ 61
Figure 3.5. Example student’s response for question 1 illustrating a verbatim response
between pre-post surveys. Top: Pre-survey response. Bottom: Post-survey response. .... 61
Figure 3.6. Example student answer for question 1 in terms of the human food production
system. .............................................................................................................................. 62
Figure 3.7. Example student answer for question 1 in terms of the biological transfer of
energy between organisms. ............................................................................................... 62
Figure 3.8. Example student answer for question 1 of the systems thinking research
instrument Version 2. Both responses are the same student with the top picture being the
pre-survey and the bottom picture the post-survey. .......................................................... 64
Figure 3.9. Example student answer for question 2 of the systems thinking research
instrument Version 2. Both responses are the same student with the left picture being the
pre-survey and the right picture the post-survey. .............................................................. 64
Figure 3.10. Example student answer for question 3 for the systems thinking research
instrument Version 2. Both responses are the same student with the top picture being the
pre-survey and the bottom picture the post-survey. .......................................................... 65

x
Figure 4.1. Course intervention session layout and research instrument timing. ............. 95
Figure 4.2. Fishbone diagram for cause and effect relationships of environmental hazards.
........................................................................................................................................... 96
Figure 4.3. Resource management hierarchy for sustainable decision making. ............... 96
Figure 4.4. Farmer’s Market Dilemma outcomes for each of the four possible scenarios.
........................................................................................................................................... 97
Figure 5.1. Aggregate knowledge increase in students before and after attending game-
based learning curriculum activities. .............................................................................. 118
Figure 5.2. Knowledge increase in students following game-based learning curriculum
activities – Individual items (n= 32~33). NS, *, **, *** Not significant or significant at
P= 0.05, 0.01, or 0.001, respectively using paired sample t-test. ................................... 120
Figure 5.3. Changes in student agricultural career interest following game-based learning
curriculum activities........................................................................................................ 120
Figure 5.4. Student assessment of the game-based learning curriculum materials. ....... 120

xi
LIST OF TABLES
Table 2.1. Potential model functionalities to achieve SEG learning objectives. .............. 28
Table 2.2. Comparison of model functionality to bring about the learning objectives. ... 29
Table 3.1. Course C energy class intervention schedule. ................................................. 53
Table 3.2. Scoring Rubric for Course A research instrument Version 1. ......................... 55
Table 3.3. Scoring Rubric for Course B research instrument Version 2. ......................... 57
Table 3.4. Comparison of systems thinking scores between pre-survey and post-survey
for Course A, Version 1. ................................................................................................... 63
Table 3.5. Comparison of systems thinking scores between post-survey game and post-
survey game+lecture for Course A, Version 1.................................................................. 63
Table 3.6. Comparison of systems thinking scores between pre-survey and post-survey
for Course B, systems thinking instrument Version 2. ..................................................... 65
Table 4.1. Samples used in reporting and evaluation for systems thinking. ................... 100
Table 4.2. Systems thinking grades: Comparison between pre-survey and all post-
surveys. ........................................................................................................................... 101
Table 4.3. Systems thinking grades: Comparison between post-survey game and post-
survey game+lecture. ...................................................................................................... 102
Table 4.4. Environmental attitudes inventory survey results: Comparison between pre-
survey and post-survey. .................................................................................................. 102
Table 4.5. Environmental Attitudes Inventory survey results: Comparison between Post-
survey Game and Post-survey Lecture. .......................................................................... 103

1
CHAPTER 1. INTRODUCTION
1.1 Motivation of Research
The world population is projected to exceed 9 billion people by the year 2050.
This rapid increase in population tied with a global shift from developing to developed
countries puts a huge stress on the world’s food, energy, and water (FEW) systems
(Godfray et al., 2010). With global cereal and meat demand expected to increase by 43%
and 135% respectively from 2005 to 2050 (FAO, 2006), the need for producing more
food with less resources has never been so imperative.
Currently, there are two potential methods for advancing food production to meet
this demand: increasing the acres of agricultural land or increasing yield efficiency.
According to the 2012 Census of Agriculture completed by the United States Department
of Agriculture (USDA), the total US farmland fell from 922.1 million acres in 2007 to
914.5 million acres in 2012 (USDA, 2014). This trend indicates that the agricultural land
usage in the US has plateaued, removing method number one as a potential strategy of
increasing food production. This is further supported by the Midwest land usage
percentages that indicate Nebraska, Iowa, and Illinois farmland makes up 93%, 89%, and
77% of their total land respectively (USDA, 2004). If every acre of land was used to
produce food in these agriculturally heavy states, it would not offset the food
requirements needed by the increasing global population.
This has huge implications for the US Midwest, which in 2015, accounted for
43.5% of all commodity receipts in the US and $40.8 billion in corn alone (USDA,
2015). Without the ability to increase total agricultural land, growth has to occur by
improving yield efficiency. The main drivers for this improvement are advances in

2
technology, genetics, and management practices. The latter is difficult to influence and
predict as it requires user acceptance. Unfortunately, it is also arguably the most
important as it has a direct impact on land health, and whether new technological or
genetic advancements are integrated into farming operations.
A research study by the USDA investigated farmers’ adoption of sustainable
management practices to determine what circumstances impact the rate of adoption
(Caswell et al., 2001). The results from this study indicated that higher rates of adoption
occurred in less experienced farmers and when proper education occurred. These findings
illustrate the importance of developing educational programs to teach stakeholders about
sustainable agricultural management, and the added priority of incorporating the
materials early on in their careers, e.g. in K-12 youth.
1.2 INFEWs Initiative
Seeing the challenges currently facing the FEW system, the National Science
Foundation (NSF) began the initiative, Innovation at the Nexus of Food, Energy, and
Water Systems (INFEWS). The initiative looks to increase the resiliency and
sustainability of the FEW system by advancing research in integrated modeling, decision
support, and Science Technology Engineering Math (STEM) education (National Science
Foundation [NSF], n.d.). A unique feature of this initiative is its focus on bringing
together researchers from different fields to solve complex problems using a systems
approach.
The INFEWS initiative led to the focus of this research to produce an educational
immersive simulation game to teach youth about how their food is produced, sustainable
agriculture, and systems thinking. The game investigates the interactions within the FEW

3
nexus using the Midwest’s corn-water-ethanol-beef (CWEB) system as an exemplary
model. The setting for the game is the Midwest of the US starting from the year 2020 and
lasting till 2050. During the game, players are challenged with producing crops (corn,
soybean, and wheat) and cattle (Angus, Hereford, and Black Baldy) using sustainable
management practices with the goal of feeding the world by 2050.
1.3 Scientific Modeling
A unique feature of the game is its emphasis on scientific authenticity. With
farmers making up only 2% of the world population, few kids have the opportunity to
witness firsthand how food is produced (USDA, 2014). Thus, a goal of the project is to
provide urban youth an accurate representation of the agricultural sector that they could
explore, and introduces them career opportunities within agriculture. For rural youth, the
objective is to simulate the natural agricultural processes so that they can compare the
management decisions they use in the game with the decisions family members are
making on a real farm. This would not only solidify the learning for the students, but also
inadvertently challenge family members to consider their management practices.
To accomplish these objectives, the entire game is built around an integrated
system of agricultural scientific models. These models include the Decision Support
System for Agrotechnology Transfer Model (DSSAT) used to estimate crop growth and
soil health (Jones et al., 2003), Greenhouse Gases, Regulated Emissions, and Energy use
in Transportation Model (GREET) used to measure greenhouse gas emissions and energy
usage (Argonne National Laboratory, n.d.), and the Beef Cattle Nutrient Requirement
Model (BCNRM) used to estimate cattle daily gain (National Research Council, 2016).
Each model is widely accepted and used by researchers, consultants, and policy makers

4
to make decisions in the agricultural sector. In the game, the integrated model serves as
the computational game engine. Players’ management decisions are sent to the model as
inputs with the resulting outputs impacting the state of their agricultural products. Using
scientific models as the computational engine provides the most scientifically accurate
representation of agricultural production outside actual field testing. It also introduces
youth to using scientific models to make decisions, hopefully increasing their affinity to
use such tools later on in their careers.
Literature related to the integration of scientific models into SEGs is limited. Prior
work has described the use of models to improve methodological design of SEGs
(Annetta, 2010; Arnab & Clarke, 2017; Bellotti, Berta, Gloria, & Primavera, 2009;
Linehan, Kirman, Lawson, & Chan, 2011; Zea, Sánchez, Gutiérrez, Cabrera, &
Paderewski, 2009) and theoretical models to bring about learning objectives (Gunter,
Kenny, & Vick, 2008; Kirkley & Kirkley, 2005). However, there is a gap in the literature
on incorporating scientific models to provide authentic game-play for students.
1.4 Systems Thinking
The major educational learning objective of the project is to teach students how to
use systems thinking. Systems thinking was defined by Arnold and Wade (2015) as
follows:
Systems thinking is a set of synergistic analytic skills used to improve the
capability of identifying and understanding systems, predicting their behaviors,
and devising modifications to them in order to produce desired effects. These
skills work together as a system. (p. 675).

5
Two instruments were identified in the literature which used scenarios to test
changes in systems thinking awareness. Sweeney and Sterman (2000) developed the
“Bathtub Dynamics” test which measured students’ ability to understand feedbacks,
delays, and stocks and flows. The study found that few students, all with high educational
backgrounds in math and science, were able to utilize some of the most fundamental
system dynamic principles. The second instrument designed by Evagorou, Korfiatis,
Nicolaou, and Constantinou (2009) used scenarios involving a pizza shop and forest to
test seven skills including identifying system elements, temporal boundaries, spatial
boundaries, subsystems, system interactions, pattern recognition, and feedback loops.
The instrument by Evagorou et al., (2009) was chosen as our project’s baseline
instrument for measuring changes in systems thinking as it broke the concept of systems
thinking into necessary attributes that could be taught and evaluated. These attributes
matched many of the attributes seen in the studies by Castelle and Jaradat (2016), Frank
(2006), and Hooper and Stave (2008). It also placed the attributes into a complexity
hierarchy allowing evaluators to see the progression of student learning over time and
gave educators stepwise goals for teaching the principles of systems thinking. The
instrument was designed for 5th-6th grade students, ages 11-12 years old. Our targeted
audience is middle school to undergraduate students. Thus, an exploration study was
necessary to determine if the research instrument was applicable with the different age
group, and if question formats would need to be altered to challenge the older students. A
full description of the study can be found in Chapter 3.
1.5 Game-Based Learning

6
Over the last decade, game-based learning (GBL) has been an expanding active
learning strategy. GBL is defined in this paper as any approach that uses a game (digital
or hard copy) developed to produce specific educational learning outcomes. This is
slightly different from the term “Serious Educational Games” which generally only refers
to digital games where entertainment is not the primary objective (Tsekleves, et al.,
2016).
Educators’ added interest in GBL stems from the fact that youth are playing an
increasing number of games, with 97% playing at least one hour per day (Granic et al.,
2014). Games are designed to provide continual entertainment resulting in an engaging
learning environment (Gee, 2009). Enhanced retention has been seen in students
compared to text based approaches (Wouters, van Nimwegen, van Oostendorp, & van der
Spek, 2013), and the immersive experience provided by gameplay reduces the perceived
effort for problem solving (Dede, 2009).
Despite these positive attributes, the literature perspective on GBL is highly
varied. The primary reason is a lack of empirical evidence due to the relative newness of
its popularity (Hainey et al., 2016). To better understand the status of GBL, several recent
literature review studies have been performed to identify misconceptions and/or gaps in
knowledge. In a study by Ke et al. (2016), GBL’s foundation of improving engagement
was investigated to provide empirical evidence to its authenticity. Their findings
indicated that GBL does provide an engaging learning environment, but the type of
engagement transforms throughout the gameplay experience. In the review by Hainey et
al. (2016), GBL papers from 2000 to 2013 were analyzed to compare quality applications
of GBL. They concluded that in order to empirically prove the effect of GBL in primary

7
education, more studies were necessary in comparison to traditional approaches,
collaborative gameplay, and impact of 2D vs 3D games.
Additional studies are necessary to validate GBL to provide consensus in the
academic community. Replicating the results of a game scenario is challenging due to the
variety of dependent variables that can influence the results. Thus, research studies
should record detailed methodologies of how their games were used, their features,
learning outcomes that were achieved and those that were not, and comparisons to other
educational approaches. Increasing the amount of empirical evidence on GBL strategies
will improve educators’ understanding the GBL’s constraints, improving their ability to
provide an exceptional learning environment for students.
1.6 Objectives
Four objectives were identified and completed to address the described needs.
1. Develop a theoretical framework for integrating scientific models into serious
educational game design.
2. Explore the applicability of the systems thinking instrument designed by
Evagorou et al., (2009) with college age students and make adjustments to its
design to measure students’ capacity for systems thinking with relation to
identifying system elements, temporal boundaries, spatial boundaries, and
subsystems.
3. Implement a game-based learning strategy in the classroom and compare it to a
lecture based educational approach.
4. Identify future areas of research for progressing the INFEWS initiative through
serious educational games.

8
1.7 Research
Chapter 2 addresses the first objective and accomplishes it through the
development of a theoretical framework for integrating scientific models into SEG
design. The chapter explores three significant steps in the integration process including
the identification of a scientific model, selection of player decision points, and
development of a scoring system for evaluation. The culmination of the chapter describes
how these features fit in the developmental and game domains, producing a baseline
methodology for researchers looking to incorporate scientific models into SEG design.
Chapter 2 was submitted to the Sage journal Simulation & Gaming and is currently in the
review process.
Objective two is addressed in Chapter 3. This chapter describes the findings of
two studies that explored using the system thinking instrument designed by Evagorou et
al., (2009) with undergraduate students. The original instrument measures seven
attributes of system thinkers including system elements, temporal boundaries, spatial
boundaries, subsystems, system interactions, pattern recognition, and feedback loops. The
attributes were split into two groups due to the time requirement to fill out the survey 1)
identification of system elements, spatial boundaries, temporal boundaries, and
subsystems and 2) understanding of systems interaction, pattern recognition, and
feedback loops. The two categories represent a natural divide between testing student’s
system “identification” vs complex system “understanding.” Our initial research only
evaluated student system thinking capacity for the identification attributes in group one.
Alterations were made to the systems thinking research instrument following each
research study based on the feedback of the students and the trends seen in the data. A

9
third study is currently in progress, but the data will not be collected in time for inclusion
in this thesis.
Objective three is addressed in Chapters 4 and 5, and is accomplished through the
implementation of the board game, Preservation, in two junior level engineering courses
at the University of Nebraska – Lincoln. Each course received one lecture session and
one game activity session using the board, Preservation. Both the lecture and the board
game taught about environmental sustainability and game theory. The results were
analyzed to determine gains in student understanding of environmental sustainability and
systems thinking. The two groups were also compared to determine if there was a
difference in knowledge gained between the lecture and game-based learning activity.
Chapter 4 describes the 1st study of the Preservation game with students.
Modifications to the research instruments were made prior to the 2nd Preservation study
described in Chapter 5 due to student feedback and trends seen in the data. The order of
the activities was also changed with each course. The 1st Preservation study intervention
gave the board game activity day one and the lecture day two and vice versa with the 2nd
Preservation study intervention. This was done to produce three groups of participants:
game only, game+lecture, and lecture only. Chapter 4 was published in the American
Society of Engineering Education (ASEE) 2018 Annual Conference Proceeding. Chapter
5 was submitted to the journal North American Colleges and Teachers of Agriculture
(NACTA) and is currently in the review process.
Objective 4 is addressed in Chapter 6. The project’s SEG, Agpocalypse 2050, was
still under development at the time of this thesis’s publication. Thus, the chapter focused
on the research that would be necessary upon its completion. This included validating the

10
scoring system described in the theoretical framework from Chapter 2, potential avenues
for serious educational games in education, and the design of Agpocalypse 2050’s
educational modules.

11
References
Annetta, L. A. (2010). The “I’s” have it: A framework for serious educational game
design. Review of General Psychology, 14(2), 105–112.
https://doi.org/10.1037/a0018985
Arnold, R. D., & Wade, J. P. (2015). A definition of systems thinking: A systems
approach. Procedia Computer Science, 44, 669–678.
https://doi.org/10.1016/j.procs.2015.03.050
Argonne National Laboratory. (n.d.). Greet model. Retrieved from
https://greet.es.anl.gov/
Arnab, S., & Clarke, S. (2017). Towards a trans-disciplinary methodology for a game-
based intervention development process. British Journal of Educational
Technology, 48(2), 279–312. https://doi.org/10.1111/bjet.12377
Bellotti, F., Berta, R., Gloria, A. D., & Primavera, L. (2009). Adaptive experience engine
for serious games. IEEE Transactions on Computational Intelligence and AI in
Games, 1(4), 264–280. https://doi.org/10.1109/TCIAIG.2009.2035923
Castelle, K. M., & Jaradat, R. M. (2016). Development of an instrument to assess
capacity for systems thinking. Procedia Computer Science, 95, 80-86.
https://doi.org/10.1016/j.procs.2016.09.296
Caswell, M., Fuglie, K., Ingram, C., Jans, S., & Kascak, C. (2001). Adoption of
agricultural production practices: Lessons learned from the U.S. Department of
Agriculture Areas Studies Project. Retrieved from USDA Economic Research
Service Website: http://ageconsearch.umn.edu/record/33985/files/ae010792.pdf

12
Dede, C. (2009). Immersive interfaces for engagement and learning. Science, 323(66),
66-69. doi:10.1126/science.1167311
Evagorou, M., Korfiatis, K., Nicolaou, C., & Constantinou, C. (2009). An investigation
of the potential of interactive simulations for developing system thinking skills in
elementary school: a case study with fifth‐graders and sixth‐graders. International
Journal of Science Education, 31(5), 655-674.
https://doi.org/10.1080/09500690701749313
Frank, M. (2006). Knowledge, abilities, cognitive characteristics, and behavioral
competences of engineers with high capacity for engineering systems thinking
(CEST). Systems Engineering, 9(2), 91-103. doi:10.1002/sys.20048
Gee, J. P. (2009). Deep learning properties of good digital games: How far can they go?
In U. Ritterfeld, M. Cody & P. Vorderer (Eds), Serious Games: Mechanisms and
effects (pp. 65 – 80). New York & London: Routledge.
Godfray, H. C. J., Beddington, J. R., Crute, I.R., Haddad, L., Lawrence, D., Muir, J. F., .
. . Toulmin, C. (2010). Food security: the challenge of feeding 9 billion people.
Science, 327(5967), 812-818. doi:10.1126/science.1185383
Granic, I., Lobel, A., & Engels, R. C. M. E. (2014). The benefits of playing video games.
American Psychologist, 69(1), 66-78. DOI: 10.1037/a0034857
Gunter, G. A., Kenny, R. F., & Vick, E. H. (2008). Taking educational games seriously:
Using the RETAIN model to design endogenous fantasy into standalone
educational games. Educational Technology Research and Development, 56(5–6),
511–537. https://doi.org/10.1007/s11423-007-9073-2

13
FAO. (2006). World Agriculture Towards 2030/2050. (FAO, Rome, Italy)
http://www.fao.org/fileadmin/templates/wsfs/docs/expert_paper/How_to_Feed_th
e_World_in_2050.pdf
Hainey, T., Connolly, E. M., Boyle, E. A., Wilson, A., & Razak, A. (2016). A systematic
literature review of games-based learning empirical evidence in primary
education. Computers & Education, 102, 202-223.
https://doi.org/10.1016/j.compedu.2016.09.001
Hopper, M., & Stave, K. A. (2008.) Assessing the effectiveness of systems thinking
interventions in the classroom. Proceedings of the 26th International Conference
of the System Dynamics Society. July 20-24, 2008, Athens, Greece. Retrieved
from https://www.systemdynamics.org/conferences/2008/proceed/index.htm
Jones, J. W., Hoogenboom, G., Porter, C. H., Boote, K. J., Batchelor, W. D., Hunt, L. A.,
… Ritchie, J. T. (2003). The DSSAT cropping system model. European Journal
of Agronomy, 18(3), 235–265. https://doi.org/10.1016/S1161-0301(02)00107-7
Ke, F., Xie, K., & Xie, Y. (2016). Game-based learning engagement: A theory-and data-
driven exploration. British Journal of Educational Technology, 47(6), 1183-1201.
https://doi.org/10.1111/bjet.12314
Kirkley, S. E., & Kirkley, J. R. (2005). Creating next generation blended learning
environments using mixed reality, video games and simulations. TechTrends,
49(3), 42–53. https://doi.org/10.1007/BF02763646
Linehan, C., Kirman, B., Lawson, S., & Chan, G. (2011). Practical, appropriate,
empirically-validated guidelines for designing educational games. In Proceedings

14
of the SIGCHI Conference on Human Factors in Computing Systems (pp. 1979–
1988). New York, NY, USA: ACM. https://doi.org/10.1145/1978942.1979229
National Research Council. (2016). Beef Cattle Nutrient Requirements Model 2016.
Retrieved from http://www.nutritionmodels.com/beef.html#Description
NSF. (n.d.). Innovations at the nexus of food, energy, and water systems (INFEWS).
Retrieved from https://www.nsf.gov/funding/pgm_summ.jsp?pims_id=505241
Richmond, B. (1993). Systems thinking: critical thinking skills for the 1990s and beyond.
Systems Dynamics Review, 9(2), 113-133. https://doi.org/10.1002/sdr.4260090203
Sweeney, L. B., & Sterman, J. D. (2000). Bathtub dynamics: initial results of a systems
thinking inventory. System Dynamics Review, 16(4), 249-286.
Doi:10.1002/sdr.198
Stuff About States. (2004). States by percentage of farmland. Source: USDA Economic
Research Service. http://stuffaboutstates.com/agriculture/farm_by_percent.htm
Tsekleves, E., Cosmas, J., & Aggoun, A. (2016). Benefits, barriers and guideline
recommendations for the implementation of serious games in education for
stakeholders and policymakers. British Journal of Educational Technology, 47(1),
164-183. https://doi.org/10.1111/bjet.12223
USDA. (2015). Cash receipts by commodity state ranking. 30 Aug. 2017, Retrieved from
data.ers.usda.gov/reports.aspx?ID
USDA Census of Agriculture. (2014). Farms and farmland: Numbers, acreage,
ownership, and use. Retrieved from
https://www.agcensus.usda.gov/Publications/2012/Online_Resources/Highlights/
Farms_and_Farmland/Highlights_Farms_and_Farmland.pdf

15
USDA National Agricultural Statistics Service. (2014). Farm Demographics – U.S.
farmers by gender, age, race, ethnicity, and more. Retrieved from
https://www.nass.usda.gov/Publications/Highlights/2014/Farm_Demographics/in
dex.php
Wouters, P., van Nimwegen, C., van Oostendorp, H., & van der Spek. (2013). A Meta-
Analysis of the Cognitive and Motivational Effects of Serious Games. Journal of
Educational Psychology, 105(2), 249-265. doi: 10.1037/a0031311
Zea, N. P., Sánchez, J. L. G., Gutiérrez, F. L., Cabrera, M. J., & Paderewski, P. (2009).
Design of educational multiplayer videogames: A vision from collaborative
learning. Advances in Engineering Software, 40(12), 1251–1260.
https://doi.org/10.1016/j.advengsoft.2009.01.023

16
CHAPTER 2. INTEGRATION OF A SCIENTIFIC MODEL INTO SERIOUS
EDUCATIONAL GAME DESIGN: MODEL FRAMEWORK
Nathan Rice1, Ashu Guru2, Jennifer Keshwani3, and Jeyam Subbiah4
University of Nebraska – Lincoln
Lincoln, NE
Acknowledgements
The authors thank the National Science Foundation (NSF) Innovations at the Nexus of
Food, Energy and Water Systems (INFEWS) program for funding this work and other
related projects under Award Number 1639478. The authors also appreciate the
assistance of Ryan Anderson and Crystal Powers for assisting in game development.
(1) Department of Biological Systems Engineering
(308) 631-5449
Chase Hall 14
Lincoln, NE 68583-0700
(2) Nebraska 4-H
(402) 472-4543
Ag Hall 114
Lincoln, NE 68583-0700
(3) Department of Biological Systems Engineering
(402) 472-9614
Chase Hall 249
Lincoln, NE 68583-0726
(4) Department of Biological Systems Engineering
(402) 472-4944
Chase Hall 210
Lincoln, NE 68583-0726
Department of Food Science and Technology
(402) 472-4944
Innovation Center 245
Lincoln, NE 68588-6205
Chapter submitted to research journal Simulation & Gaming. Status: Under Review.

17
CHAPTER 2. INTEGRATION OF A SCIENTIFIC MODEL INTO SERIOUS
EDUCATIONAL GAME DESIGN: MODEL FRAMEWORK
Abstract
Background: Preparing the future workforce to address Food-Energy-Water (FEW)
problems requires progressive active learning strategies that expand current cognitive
thinking pathways. Serious Education Games (SEGs) have been shown to be a
promising vector in this area, and have been used to produce the outcomes necessary for
attaining science literacy. These attributes led to the trial development of a SEG which
used scientific models as the computational game engine. The goal of the game was to
provide youth a scientifically authentic representation of how agricultural production
occurs in the Midwest of the United States. As little literature guidance existed on using
scientific models in games, the objective of this narrative was to share the experience of
integrating a scientific model into SEG design and to provide a theoretical framework
on how it can be reproduced.
Methods: The three topics covered include the identification of a feasible model,
selection of critical decision points, and the development of a scoring system for
evaluation.
Results: An exemplary case study was used to illustrate the approach in action using the
agricultural sustainability game: Agpocalypse 2050.
Discussion: The culmination of the research was a theoretical framework illustrating
how the approach fits into the game design process. The framework presented a baseline
methodology for researchers to integrate scientific models into a SEG. Using scientific
models in the game encouraged players to discover the principles of how models solve
problems and created a scientifically authentic experience.

18
Keywords: Agroecosystem, Science Literacy, Theoretical Framework, Serious
Educational Games, and Scientific Modeling
2.1 Background
An expanding global population has sparked a movement to prepare the world’s
Food-Energy-Water (FEW) systems for the demands this increase will invoke. Childers,
Corman, Edwards, and Elser (2011) suggest that the predicted food crisis can only be
averted by sustainable solutions that go beyond just thinking outside of the box to
“thinking of a new box” altogether (page 121). The understanding Childers et al. (2011)
stresses is the foundation science literacy looks to build; that individuals grounded in
scientific understanding have the capacity to analyze complex systems and make
decisions for the good of society (University of Nebraska - Lincoln [UNL], n.d.).
Attaining science literacy requires an individual to have scientific understanding,
the capacity for complex decision making (systems thinking), social awareness, and real-
world application (UNL, n.d.). Scientific understanding is the most developed in the
current educational system as it entails the theoretical principles required in science,
technology, engineering and mathematical (STEM) courses. Systems thinking, social
awareness, and real-world application are more difficult to transfer as they require
Bloom’s highest orders of cognition including application, analysis, and evaluation
(Krathwohl, 2002).
Serious educational games (SEGs) have been a vector to achieve learning
outcomes related to science literacy (Katsaliaki & Mustafee, 2015). In the field of
systems thinking, Adachi and Willoughby (2013) performed a longitudinal study that
found playing slow-paced strategic video games improved student problem solving skills.

19
Similarly, Grund, and Meier (2016) showed that SEGs could be used to improve
decision-making skills for most of the capabilities required for effective managerial
decisions. SEGs have also shown strides in improving student understanding of
sustainability issues (Katsaliaki & Mustafee, 2015).
With the goal of using a SEG to bring about science literacy, our research team
developed a 3-D immersive simulation game, Agpocalypse 2050, focused on
sustainability of the Crop-Water-Energy-Beef (CWEB) nexus in the Midwest of the
United States. The game was built around an integrated system of scientific models.
These models directly influence nearly every component of game-play; ensuring players
receive an authentic representation of the decision-making procedure within the
Midwest’s agricultural nexus.
Literature related to the integration of scientific models into SEGs is limited. Prior
work has described the use of models to improve methodological design of SEGs
(Annetta, 2010; Arnab & Clarke, 2017; Bellotti, Berta, Gloria, & Primavera, 2009;
Linehan, Kirman, Lawson, & Chan, 2011; Zea, Sánchez, Gutiérrez, Cabrera, &
Paderewski, 2009) and theoretical models to bring about learning objectives (Gunter,
Kenny, & Vick, 2008; Kirkley & Kirkley, 2005). However, there is a gap in the literature
on incorporating scientific models to provide authentic game-play for students. In this
study, we outline a methodological approach to selecting scientific models to meet a
game’s theoretical principles, matching player decision points with model inputs and
learning objectives, and the development of a scoring system to link model outputs with
student performance.
2.2 Methods

20
This narrative research investigated the steps taken by our research team to
integrate a scientific model into the SEG, Agpocalypse 2050, which focuses on
agricultural production in the Midwest of the United States.
2.2.1 Model Identification
The first challenge in integrating a scientific model into a SEG is choosing the
appropriate model. This may seem intuitive, but can prove to be quite overwhelming due
to the vast array of models that may be available in the selected domain. In this section,
several attributes are discussed to help a researcher make a decision on which model(s)
best fits their application.
2.2.1.1 Validation/Acceptance
Documented validation is the first requirement for a model to be considered for a
SEG. The purpose for using a scientific model is to provide an accurate representation of
a real-world condition. This can only be confirmed by evidence from prior research that
have validated the models. Identifying the models with the largest scientific community
user base should ensure adequate validation exists and narrows the field to a few
accepted models.
2.2.1.2. Learning Outcomes
The goal of a SEG is to provide educational value. Thus, ensuring that the game
meets the desired learning outcomes is essential. An excellent way to start this process is
by identifying the learning objectives the SEG is trying to achieve, and brainstorming a
list of potential model functionalities that could accomplish each objective. This list
represents the ideal functionalities a model could have to accomplish the learning
objectives. For this paper, model functionality describes any model capabilities that can

21
be used to bring about a specific scenario. For example, potential crop model
functionalities could be the capability to simulate crop rotation, multiple crop varieties, or
handle various weather files.
Each model can be inspected to determine which of these functionalities they
contain. It is unlikely that a model will contain all of the functionalities in the list;
however, it should have at least one functionality for each learning objective.
2.2.1.3 Level of Detail
A model’s level of detail (LOD) is an indicator of the temporal and spatial scales
it is capable of simulating. For example, one may consider whether a model can handle
daily, monthly, or yearly time steps; field level vs county level vs country level; etc. The
smaller the scale the model can simulate, the higher its LOD. For the case of model
selection, the model’s LOD must accommodate the game’s LOD. If the game is
simulating on a daily time step, the model must also be able to simulate on a resolution of
the daily scale.
A model is less desirable when its LOD is much higher than that of the game. In
such a circumstance, the models outputs would need to be aggregated to match the LOD
of the game. Issues arise with model validity when altering the scale of data. Changing
model scale also changes the driving variables that characterize a system (Kwatra,
Kumar, Sharma, Sharma, & Singhal, 2016). For example, from a global sustainability
perspective, terms are aggregated together to form broad categories such as poverty level,
ozone depletion, etc. These categories are influenced by global initiatives requiring
millions of people’s participation, but are not helpful for farmer making irrigation
decisions. Conversely, on a regional scale the key indicators are specific such as an

22
individual field’s soil health, community complaints, etc. These inputs provide
stakeholders the information to make managerial decisions, but are less useful in
developing governmental policy (Binder, Schmid, & Steinberger, 2012). Thus, when
changing the intended scale of a model, new validation studies will be required to ensure
that the model is still performing as designed.
2.2.1.4 API Access
It is also important to consider model accessibility to the runtime environment.
Preference is given to models that provide easy to use Application Programming
Interfaces (APIs). APIs expose computer algorithms so that the software routines can be
easily integrated in new applications. An API acts as a software library that includes
documentation to help other developers reuse the provided functionality and computer
code (Monperrus, Eichberg, Tekes, & Mezini, 2012). Code reuse reduces development
time and increases the likelihood of a verified final product. If the prospective model
does not have an API, developers can utilize a programing language to wrap the
underlying model and expose the model’s functionality through these wrappers.
Wrappers are small snippets of programming codes that translate inputs and outputs so
that different software can communicate. Thorough research of existing literature is
necessary before writing wrapper scripts as many options are available through the open
source community. Refer to Anderson et al. (2018) for further details.
2.2.2 Decision Point Selection
Proper identification of player decision points within the SEG has a direct impact
on evaluating player performance i.e. learner assessment and meeting project learning
objectives. This aspect requires balancing player experience, model functionality, and

23
game storyline. The iterative approach described in the following section provides a
standardized method to isolate the essential parameters that characterize a system and the
necessary functionalities to achieve the learning objectives using a scientific model.
2.2.2.1 Potential Decision Point List
The first step is to produce an all-encompassing potential decision point list based
on the game storyline. Individual decisions are then sorted into small sub-categories
based on their scientific topic. Sorting items into scientific categories allows experts and
designers to quickly compare the importance of decision points later in the developmental
process.
2.2.2.2 Expert Panel Evaluation
The list of potential game decisions is then presented to a panel of domain
experts. The experts’ goal is to identify decisions that are emphasized in the real-world as
being important to the system. After expert evaluation, the decision points should be
reduced to only those considered critical to the system.
2.2.2.3 Model Connection
Next, the remaining decision points are evaluated to determine if they can be
scientifically represented using th scientific model (preferred) or a numerical solution.
Completing this evaluation requires each decision to be broken down into its necessary
player inputs. These inputs are then compared to the model inputs with matching
decisions marked as model represented.
The remaining decision points are analyzed to determine if a numerical solution
exists or can be developed to accurately model the scenario. Such solutions should ensure
the scientific authenticity of the game. Any decision that cannot be represented by either

24
the scientific model or a numerical solution is removed from the potential list. The
remaining decision points represent game scenarios that can be feasibly represented with
scientific accuracy.
2.2.2.4 Game Value: Education, Entertainment, and Engagement
The feasible decision points are then evaluated on their ability to add game value
in the form of education, entertainment, or engagement. If a decision does not bring about
one of these three features, it is irrelevant to the game’s success, and is removed from the
list. The following definitions are used to evaluate these criteria. Educational value is
determined by the significance of the category in teaching the learning objectives.
Entertainment value is given to decisions that grab the students’ attention, but do not
require deep thought or understanding. Engagement value occurs when decisions cause
students to actively learn and solve problems. Optimal decisions provide value in all three
categories simultaneously. Prioritizing decisions that maximize game value ensures
players are drawn in to the play experience and the learning objectives are achieved.
Upon completion, the experts, game developers, and educational specialists should be
satisfied with the ability of the decision list to achieve the learning objectives of the game
while accurately portraying the scientific principles.
2.2.3 Player Evaluation
The culmination of the model integration process is the assessment of player
performance. An effectively integrated model takes inputs through player decision points
and outputs values that allow the researcher to evaluate the student’s understanding of the
learning objectives. Using the game scoring system as the evaluation criteria places the
learning objectives at the game’s focal point. However, as the focal point, the scoring

25
system must maintain the scientific authenticity of the game while providing for diverse
gameplay strategies. In this section, a technique is presented on how to develop a scoring
system that balances these critical features and evaluates players’ understanding of
learning objectives.
2.2.3.1 Normalization
One of the most difficult parts of developing a scoring system is accommodating
decisions that contain different unit measures. For example, in Agpocalypse 2050,
decision outputs are in a variety of units including dollars, calories, pounds, and several
unit-less parameters. Merging the quantitative values into a single comparable number is
challenging.
To circumvent this issue, actions can be normalized based upon player
performance. Players are given a rank from 0 – 1 based on their performance with 0
being the worst and 1 being the best. The value players receive is based on threshold
tables designed by the game producers or through comparing performance with other
players. Configuring decision evaluation in this format transforms the decisions into
percent basis. These can then be evaluated individually to determine the outcome of
specific learning objectives or summed to form a single combined score.
2.2.3.2 Category Weighting
A second challenge with developing an educational scoring system is maintaining
the scientific authenticity of the game while promoting the desired practices. Players will
always gravitate toward strategies that lead to success. Unfortunately, the winning
strategy does not always match the desired practices the game is trying to promote. A
technique to combat this issue is assigning decision weights. Weighting decision points

26
allows the researcher to prioritize critical components, and balance the value of decisions
containing similar complexity. This task is easily performed as the categories are already
arranged in a hierarchical tree structure. Similar to a Probability Tree Diagram, each
branch is assigned a weight with the sum of branches on the same level equaling one
(Figure 2.1). The decision weight plays a critical role in determining which game
strategies are successful providing researchers a tool to guide the outcome of the game
without jeopardizing the game’s integrity.
Figure 2.1. Hierarchical tree structure with example weight allocation.
2.2.3.3 Scoring System
Equation 1 illustrates how the overall score is calculated.
𝑆𝑐𝑜𝑟𝑒 = 𝑀 ∗ [∑(∏ 𝑊𝑗,𝑖) ∗ 𝑅𝑖] Equation (1)
𝑘
𝑗=1
𝑛
𝑖=1
W is the decision weight, R is the player’s rank in the base decision (lowest level of the
tree), j is the vertical index path, k is the total number weights in the j path, i is the base
decision’s horizontal index, n is the total number of base decisions, and M is the
maximum score or multiplier.
For example, given the decision weights and ranks as seen in Figure 2.2, and a
maximum score of 1000, the score would be calculated as followed:
Final Score(1.0)
Sub cat 1
(0.32)
Sub cat 2
(0.20)
Sub cat 3
(0.48)

27
𝑆𝑐𝑜𝑟𝑒 = 𝑀 ∗ [(𝑅𝑖=1 ∗ 𝑊𝑗=1,𝑖=1 ∗ 𝑊𝑗=2,𝑖=1) + (𝑅𝑖=2 ∗ 𝑊𝑗=1,𝑖=2 ∗ 𝑊𝑗=2,𝑖=2)
+ (𝑅𝑖=3 ∗ 𝑊𝑗=1,𝑖=3)]
𝑆𝑐𝑜𝑟𝑒 = 1000 ∗ [(0.1 ∗ 0.4 ∗ 0.7) + (0.8 ∗ 0.6 ∗ 0.7) + (0.2 ∗ 0.3)] = 424 𝑝𝑜𝑖𝑛𝑡𝑠
Figure 2.2. Example scoring tree hierarchy.
2.2.3.4 Scoring Evaluation
The scoring system is not evaluated on how accurately it predicts players’ learning
outcomes. For this analysis, traditional assessment metrics are used to determine the
players’ real understanding of the learning objectives. Ideally, players with the highest
contextual understanding also have the highest scores in the game for decisions relating
to that learning outcome. However, for games with highly variable game strategies this
may not be a valid form of analysis. For example, players could have an excellent
understanding of learning objective A, but choose to hurt their score in that area to
elevate their score in learning objective B. For circumstances such as these, in depth case
studies focused on small sections of gameplay prevent contradicting game strategies from
influencing the results.
2.3 Results

28
2.3.1 Model Identification
A case study is given to illustrate the methodological approach in practice. The
topic is the integration of a cropping model into the SEG, Agpocalypse 2050. The
models, DSSAT (Jones et al., 2003), AquaCrop-OS (Food and Agriculture Organization
of the United Nations [FAO], n.d.), APSIM (“APSIM Initiative,” n.d.), and CropSyst
(Stöckle, C, n.d.) were identified as having the largest user base and acceptance. For
simplicity, we only provide a detailed analysis for the model DSSAT which was selected
for inclusion in Agpocalypse 2050. Three of the game learning objectives are listed
below.
1) Develop a systems thinking mindset.
2) Understand sustainable agricultural decision-making.
3) Draw connections between how climate effects the land, and thus the animals and
plants that thrive there.
2.3.1.1 Learning Outcomes
Potential model functionalities were identified that could bring about the targeted
learning objectives (Table 2.1).
Table 2.1. Potential model functionalities to achieve SEG learning objectives.
Learning
Objective #1:
Systems Thinking
Animal manure as a fertilizer, connection to water and soil
systems, multi-seasonal simulations, crop residual, varying
economic prices, etc.
Learning
Objective #2:
Sustainability
Crop rotation, fertilizer management, irrigation management,
water balance, pollutant runoff, etc.

29
Learning
Objective #3:
Climate on land
Variability in weather, impact of max/min temperature, rainfall,
and water stress during crop growth stages, range of soil types,
various crop varieties, natural disasters, etc.
An evaluation was then performed on each model to determine which
functionalities the models were capable of simulating. DSSAT contained multiple
functionalities that could be used to bring about each learning objective. A full list of
results can be seen in Table 2.2.
Table 2.2. Comparison of model functionality to bring about the learning objectives.
Learning Outcomes DSSAT: Present DSSAT: Absent
Systems Thinking Animal Manure, Water/Soil systems, Multi-
seasonal simulations, crop residual
Economic
Prices
Sustainability Crop rotation, fertilizer and irrigation
management, water balance, and pollutant
runoff
Climate on Land Weather files, weather impact during crop
growth stages, soil types, crop varieties
Natural
disasters
2.3.1.2 Level of Detail
Agpocalypse 2050 required a time resolution of one day for crop production.
Players set daily irrigation schedules and crop growth was influenced by daily weather
patterns. DSSAT is capable of handling a daily timescale as this is a necessity for
measuring crop stress sensitivity during key growth stages. The spatial scale simulated
during the game is at the field level where one field equaled 160 acres. DSSAT allows
the user to set field size meeting this requirement.

30
2.3.1.3 Access to API
DSSAT does not have a built in API. However, a literature search yielded an open
source python wrapper, pyDSSAT, developed by He, Pe, & Sun (2015) to compile the
original FORTRAN DSSAT source code.
2.3.1.4 Model Selection
DSSAT passed all of critical evaluation criteria. This included containing model
functionality to bring about the projects learning objectives, having a LOD that is greater
than or equal to the game, and access to an open source program wrapper. The model
APSIM also met these criteria causing the final selection to be based on the required
effort to incorporate the model. In this regard, DSSAT had the advantage as our research
team had access to the authors of the DSSAT source code, and attended a weeklong
workshop on using DSSAT. Given these criteria DSSAT was selected as the crop model
for the game.
2.3.2 Decision Point Selection
2.3.2.1 Potential Decision Point List
Initially, a master list was developed of all potential game decisions. Decisions
were grouped into three primary categories based on where they fit into the sustainability
structure: society, economic, or environment. These primary categories were broken
down into smaller subcategories developing a hierarchical structure (Figure 2.3). Items
on the lowest tier represent the base decisions which are solved for based on player
inputs.

31
Figure 2.3. Potential decision point list grouped into categories with a hierarchical
structure.
2.3.2.2 Expert Panel
The hierarchical structure (Figure 2.3) was brought before a panel of experts
including specialists in agricultural sustainability, economics, food systems, biofuels,
animal science, and biosystems engineering. The experts evaluated each subcategory on
its importance towards sustainable agriculture, and identified missing subcategories
resulting in a restructured decision point list (Figure 2.4).
Sustainability Score
Society
Community
Random Events
GMO Use
Social Events
Immune Pests
Neighborlines
Stealing Water
Community Engagement
Support
Engagement
World
Crops
Grain to Fuel
Food Loss
Food Production
Civic Duty
Economic
Profit
Revenue over MARR
Overhead
Operations
Opportunity
Interest
Revenue over resiliency
Community Jobs
Location of buyers
Hired workers
Input purchases
Machinery purchases
Community outreach
CWEB Jobs
Hired workers
Buy from CWEB
Sell to CWEB
Agricultural Sector
Sell to market
Pay taxes
Environment
Ecosystem
Soil Health
Water Quality
Water Use
Greenhouse Gases
Biodiversity
Resources
Water
Energy
Minerals
Sustainability Score
Soiciety
Community
Random Events
GMO Use
Social Events
Immune Pests
Neighborliness
Support
World
Crops
Food Loss
Food Production
Civic Duty
Economic
ProfitCommunity
Jobs
Location of buyers
Hired workers
Input purchases
Machinery purchases
Community outreach
CWEB Jobs
Hired workers
Buy from CWEB
Sell to CWEB
Environment
Ecosystem
Soil Health
Water Quality
Water Use
Greenhouse Gases
Biodiversity
Resources

32
Figure 2.4. Restructured decision point list following expert panel inspection.
2.3.2.3 Model/Numerical Representation
Next, base decisions were inspected on scientific representation. An example of a
model represented decision point is shown in Figure 2.5 for food production. This is the
optimal decision layout as all necessary inputs are directly fed into the scientific model
with the output containing the information needed for the game.
Figure 2.5. Model represented decision point using player input values.
Game interactions are often more complex than this ideal case and require a
combination of scientific modeling and numerical solutions. For example, with food
production, the desired output for Agpocalypse 2050 was total calories, quality protein,
and energy produced. An example flow diagram of how a scientific model and numerical
solution can be connected is shown in Figure 6. DSSAT supplied yield in bushels given
the player’s management practices. A numerical model converted the yield data from
DSSAT from bushels to calories, quality protein, and energy based on the USDA data for
United States domestic commodity use.

33
Figure 2.6. Example decision using both the scientific model and a numerical solution.
Base decisions that could not be defined through DSSAT or a reliable numerical
solution were removed from the list. The remaining subcategories (Figure 2.7) represent
the game decisions that are significant to the sustainability of a farming operation while
maintaining the game’s scientific authenticity.
Figure 2.7. Remaining decisions that could be calculated with scientific accuracy.
2.3.2.4 Game Value
Sustainability Score
Soiciety
Community
Random Events
GMO Use
Social Events
Immune Pests
Community Support
World
Resource Production
Calories
Protein
Energy
Resource Loss
Calories
Protein
Energy
Economic
ProfitCommunity
Jobs
Hired workers
Input purchases
Machinery purchases
Community outreach
CWEB Jobs
Hired workers
Buy from CWEB
Sell to CWEB
Environment
Soil Health
Water Quality
Water Use
Greenhouse Gases
Biodiversity

34
The final inclusion criteria investigated the added value to the players in terms of
education, entertainment, and engagement. Immune pests was an example of an
educational category for systems thinking. For this category, players’ management
decisions concerning crop rotation and pesticide use influenced the probability of
receiving fields with immune pests. If an immune pest event occurred, crop yield for that
year decreased (economic score), and players received a reduction in community standing
(social score). Players had to balance risk with interactions occurring between various
system elements.
GMO use was an example of the entertainment category. Players decided if they
would incorporate GMO products in their farming operation. GMO crop species had
certain advantages for drought tolerances, pests, etc., but also had a random chance of
causing reductions in the price of their goods due to societal preference. The likelihood of
price reduction correlated with farm size to simulate increased societal scrutiny. As
GMOs have received media attention, players were drawn to how they influenced the
agricultural community at the field and the corporation level. These factors were not
primary learning objectives, but kept players interested in the gameplay.
An example for an engaging category was the economic impact factor. Players
received feedback on how spending influenced economic prosperity in terms of jobs,
labor, value added, and output. Where the players chose to spend their finances and the
amount they spent changed their economic impact. The idea of economic impact was a
new concept to game players and required a deep inspection of the agricultural system to
master the game strategy. The newness of the impact factor caught the players’ attention
and the complexity of the topic required them to actively learn. Value was also added

35
towards the systems thinking learning objective and player entertainment making this an
example of an ideal decision point advancing all three categories of game value. The
finalized decision list can be seen in Figure 2.8.
Figure 2.8. Final decision point list used for the game.
2.3.3 Player Evaluation
2.3.3.1 Normalization
For the normalization of the Agpocalypse 2050 scoring system, each player
received a rank between 0 – 1 depending on their performance compared to all historical
scores at the same stage in the game. For example, a player’s societal score at the end of
year one was compared to the historical score of every other players’ societal score at the
end of year one. Thus, if a player’s rank was 120 out of 1000 people, their normalized
rank would be:
Sustainability Score
Environment
Soil Health
Water Quality
Water use
Greenhouse gases
Biodiversity
Economics
Profit Impact
Employment
Labor
Value Added
Output
Society
Community
Random Events
GMO Use
Social Events
Immune Pests
Community Supprt
World
Resource Production
Calories
Protein
Energy
Resource Loss
Calories
Protein
Energy

36
𝑅𝑎𝑛𝑘 = (1 −120
1000) = 0.88 𝑜𝑟 𝑡𝑜𝑝 88%
Score normalization allowed for multiple game strategies to evolve over time as the score
distribution evolved. Identifying categories other players overlooked became a valuable
strategic advantage.
2.3.3.2 Category Weighting
For category weighting, the societal, economic, and environmental branches each
received an equal one-third weight. These features represented the three pillars of
sustainability. The remaining categories were broken down based on the complexity of
the decision-making and significance of the decision on game play. These weights were
continuously adjusted throughout the game testing procedure (Figure 2.9).
Figure 2.9. Category weights applied to the decision point list.
2.3.3.3 Scoring System
Sustainability Score
1.0
Environment
0.33
Soil Health
0.25
Water Quality
0.15
Water Use
0.15
Greenhouse gases
0.25
Biodiversity
0.2
Economics
0.33
Profit
0.7
Impact
0.3
Employment
0.25
Labor
0.25
Value Added
0.25
Output
0.25
Society
0.33
Community
0.3
Ran. Events
0.6
GMO Use
0.3
Social Events
0.4
Immune Pests
0.3
Comm. Supprt
0.4
World
0.7
Res. Prod.
0.6
Calories
0.41
Protein
0.36
Energy
0.23
Resource Loss
0.4
Calories
0.41
Protein
0.36
Energy
0.23

37
The game scoring system initially provided players their total score and the
individual scores of each pillar (Figure 2.10). Additional information was available by
selecting each of the individual pillars to determine rankings in each subcategory and
receive feedback on low scoring decision points. Equation 1 was used to calculate the
total score given the decision weights as seen in Figure 2.9. The maximum score was set
to be 100.
Figure 2.10. Sustainability score graphical interface used to display the final score in
the game.
2.4 Discussion
This study addressed three challenges of integrating a scientific model into a
SEG: identification of a feasible model, determining critical decision points, and
developing a scoring system for evaluation. The approaches stem from our experience of
integrating scientific models to develop Agpocalypse 2050.
2.4.1 Model Identification
The first challenge addressed in the paper was the identification of a scientific
model. Figure 2.11 models the approach for selecting which model to use for a SEG.

38
Initially a list of potential models is identified through a literature search. Model validity
and acceptance narrow the field to a few commonly used and complete scientific models.
Next, an assessment of model functionality is performed to determine if the learning
objectives can be met. The LOD of the game and remaining models is then compared
with equivalent LOD being the desired case. Finally, an inspection is made of the models
API or availability of program wrappers in the open source community. For the models
that satisfy all of the necessary components, model usability determines the final model
selection dependent on learning objective functionality, LOD alignment with the game,
and usability of the API.
Figure 2.11. Model approach for selecting an appropriate scientific model to be used in
a SEG.
2.4.2 Decision Point Selection
The second challenge addressed in the study was the selection of player decision
points (Figure 2.12). First, game designers develop a decision point list for any decision
that can be included in the game. This list is brought before a panel of domain experts

39
who judge the categories based on their scientific importance to the system. The
researcher(s) then evaluate the categories to determine if they can be mathematically
characterized by the scientific model or a numerical solution. Next, the categories are
scrutinized based on the game value they add to education, entertainment, and
engagement. The remaining categories represent feasible decision points that can be
scientifically represented and add value to game.
Figure 2.12. Model approach for selecting decisions to be included in an SEG.
2.4.3 Player Evaluation
The third challenge was the development of the game’s scoring system to evaluate
student performance (Figure 2.13). Initially, actions are normalized to a value between 0
and 1. This can be based on pre-determined thresholds or a comparison to other players’
performance. Next, categories are given a weight based on the difficulty of the decision
and its importance. The selection of category weights are adjusted throughout game
testing to ensure the desired strategies are emphasized. Equation 1 is used to calculate the

40
final score. The game score and traditional instrument evaluation are compared to
determine if the game accurately predicts student understanding of the learning outcomes.
Figure 2.13. Model approach for SEG scoring evaluation system.
2.4.4 Application
Combining the individual models into a collective theoretical framework
illustrates the integration of a scientific model throughout SEG design (Figure 2.14).
Within the developmental domain, the research team selects an appropriate scientific
model and produces a decision tree framework. In the Game Domain, the selected model
is combined with numerical solutions to form the computational game engine. Player
inputs are received on the selected game decisions and are fed into the game engine. The
output decisions enter into the scoring metric where they are weighted, normalized, and
outputted as a single score. The score provides feedback to the game players altering their
strategy. With each iteration, player understanding of the educational objectives increases
depending on the principles that are emphasized by the decision weights.

41
Figure 2.14. Theoretical model for integrating a scientific model throughout a SEG
design.
2.5 Limitations
The research presented stems from the experience of trial and error as little
literature guidance existed on the topic. As such, these approaches do not represent the
only path that can be taken; their purpose is to provide a baseline methodology for other
researchers looking to merge scientific modeling with game design. Future research is
necessary to advance this methodology through game testing, player evaluation, and
comparison to traditional lecture approaches.
2.6 Conclusion
The theoretical framework presented in this article illustrates how scientific
models can be incorporated into SEGs. Integrating models in this format encourages
players to discover the principles of how models solve problems and the significant
domain parameters. These principles encourage use in complex topic areas where
students require visual representation to grasp material. Using this approach ensures that
the SEG’s primary purpose remains the learning objectives. Model selection, game

42
decision points, and player evaluation continually come back to educational concepts
placing them as the focal point of gameplay. In addition, validating the game results with
traditional instruments increases the game’s credibility and acceptance within the
academic community. The mixed reviews SEGs have received in the literature illustrate
the need for more structured developmental strategies. The theoretical framework
presented in this article represents an initial step to providing this structure for games
including real scientific models.
2.7 Funding
This work was supported by the National Science Foundation [grant number
1639478].

43
References
Adachi, P. J. C., & Willoughby, T. (2013). More than just fun and games: The
longitudinal relationships between strategic video games, self-reported problem
solving skills, and academic grades. Journal of Youth and Adolescence, 42(7),
1041–1052. https://doi.org/10.1007/s10964-013-9913-9
Annetta, L. A. (2010). The “I’s” have it: A framework for serious educational game
design. Review of General Psychology, 14(2), 105–112.
https://doi.org/10.1037/a0018985
Anderson, R., Keshwani, D., Guru, A., Yang, H., Irmak, S., & Subbiah, J. (2018). An
integrated modeling framework for crop and biofuel systems using the DSSAT
and GREET models. Environmental Modelling & Software, 108, 40–50.
https://doi.org/10.1016/j.envsoft.2018.07.004
AquaCrop | Food and Agriculture Organization of the United Nations. (n.d.). Retrieved
from http://www.fao.org/aquacrop
Arnab, S., & Clarke, S. (2017). Towards a trans-disciplinary methodology for a game-
based intervention development process. British Journal of Educational
Technology, 48(2), 279–312. https://doi.org/10.1111/bjet.12377
Bellotti, F., Berta, R., Gloria, A. D., & Primavera, L. (2009). Adaptive experience engine
for serious games. IEEE Transactions on Computational Intelligence and AI in
Games, 1(4), 264–280. https://doi.org/10.1109/TCIAIG.2009.2035923
Binder, C. R., Schmid, A., & Steinberger, J. K. (2012). Sustainability solution space of
the Swiss milk value added chain. Ecological Economics, 83, 210–220.
https://doi.org/10.1016/j.ecolecon.2012.06.022

44
Childers, D. L., Corman, J., Edwards, M., & Elser, J. J. (2011). Sustainability challenges
of phosphorus and food: Solutions from closing the human phosphorus cycle.
BioScience, 61(2), 117–124. https://doi.org/10.1525/bio.2011.61.2.6
Grund, C. K., & Meier, M. C. (2016). Towards game-based management decision
support: Using serious games to improve the decision process. In D. Stelzer, V.
Nissen, & S. Straßburger (Eds.), Proceedings of the Multikonferenz
Wirtschaftsinformatik (MKWI) 2016 (pp. 155–166).
Gunter, G. A., Kenny, R. F., & Vick, E. H. (2008). Taking educational games seriously:
Using the RETAIN model to design endogenous fantasy into standalone
educational games. Educational Technology Research and Development, 56(5–6),
511–537. https://doi.org/10.1007/s11423-007-9073-2
He, X., Pe, L., & Sun, H. (2015). pyDSSAT. Princeton University. Retrieved from
http://xiaoganghe.github.io/pyDSSAT/doc/about_pyDSSAT.html
Jones, J. W., Hoogenboom, G., Porter, C. H., Boote, K. J., Batchelor, W. D., Hunt, L. A.,
… Ritchie, J. T. (2003). The DSSAT cropping system model. European Journal
of Agronomy, 18(3), 235–265. https://doi.org/10.1016/S1161-0301(02)00107-7
Katsaliaki, K., & Mustafee, N. (2015). Edutainment for sustainable development: A
survey of games in the field. Simulation & Gaming, 46(6), 647–672.
https://doi.org/10.1177/1046878114552166
Kirkley, S. E., & Kirkley, J. R. (2005). Creating next generation blended learning
environments using mixed reality, video games and simulations. TechTrends,
49(3), 42–53. https://doi.org/10.1007/BF02763646

45
Krathwohl, D. R. (2002). A revision of Bloom’s Taxonomy: An overview. Theory Into
Practice, 41(4), 212–218. https://doi.org/10.1207/s15430421tip4104_2
Kwatra, S., Kumar, A., Sharma, P., Sharma, S., & Singhal, S. (2016). Benchmarking
sustainability using indicators: An Indian case study. Ecological Indicators, 61,
928–940. https://doi.org/10.1016/j.ecolind.2015.10.049
Linehan, C., Kirman, B., Lawson, S., & Chan, G. (2011). Practical, appropriate,
empirically-validated guidelines for designing educational games. In Proceedings
of the SIGCHI Conference on Human Factors in Computing Systems (pp. 1979–
1988). New York, NY, USA: ACM. https://doi.org/10.1145/1978942.1979229
Monperrus, M., Eichberg, M., Tekes, E., & Mezini, M. (2012). What should developers
be aware of? An empirical study on the directives of API documentation.
Empirical Software Engineering, 17(6), 703–737. https://doi.org/10.1007/s10664-
011-9186-4
Stöckle, C. (n.d.). CS_Suite. Washington State University. Retrieved from
http://modeling.bsyse.wsu.edu/CS_Suite/cropsyst/index.html
University of Nebraska – Lincoln (n.d.). What is Science Literacy? Retrieved from
https://casnr.unl.edu/WhatisSL
Zea, N. P., Sánchez, J. L. G., Gutiérrez, F. L., Cabrera, M. J., & Paderewski, P. (2009).
Design of educational multiplayer videogames: A vision from collaborative
learning. Advances in Engineering Software, 40(12), 1251–1260.
https://doi.org/10.1016/j.advengsoft.2009.01.023

46
CHAPTER 3. PROGRESSION OF A SYSTEMS THINKING RESEARCH
INSTRUMENT FOR EVALUATION OF UNDERGRADUATE STUDENTS
Nathan Rice1, Ashu Guru2, Jennifer Keshwani3, and Jeyam Subbiah4
University of Nebraska – Lincoln
Lincoln, NE
Acknowledgements
The authors thank the National Science Foundation (NSF) Innovations at the Nexus of
Food, Energy and Water Systems (INFEWS) program for funding this work and other
related projects under Award Number 1639478.
(1) Department of Biological Systems Engineering
(308) 631-5449
Chase Hall 14
Lincoln, NE 68583-0700
(2) Nebraska 4-H
(402) 472-4543
Ag Hall 114
Lincoln, NE 68583-0700
(3) Department of Biological Systems Engineering
(402) 472-9614
Chase Hall 249
Lincoln, NE 68583-0726
(4) Department of Biological Systems Engineering
(402) 472-4944
Chase Hall 210
Lincoln, NE 68583-0726
Department of Food Science and Technology
(402) 472-4944
Innovation Center 245
Lincoln, NE 68588-6205
This chapter has not been submitted for publication.

47
CHAPTER 3. PROGRESSION OF A SYSTEMS THINKING RESEARCH
INSTRUMENT FOR EVALUATION OF UNDERGRADUATE STUDENTS
Abstract
Efforts have begun to prepare the future workforce to solve complex problems
using systems thinking. Systems thinking is a mindset of analysis that allows individuals
to draw connections between components increasing their understanding of how a system
will behave. Educators struggle to measure student understanding of systems thinking as
it requires insight into how a student breaks down systems, solves problems, and makes
decisions. A previous study developed a research instrument to measure student systems
thinking capacity in seven necessary skills of systems thinkers. This instrument was
originally designed for 5th-6th grade students. It was adapted in this study to measure
changes in undergraduate students’ capacity to identify system elements, spatial
boundaries, temporal boundaries, and subsystems. Changes were also made to the
original instrument question format to reduce completion time and improve the quality of
responses. Study results showed that the instrument could be used to measure
undergraduate student capacity in the first four attributes of systems thinking. Several
factors were found to influence the instrument results including the time between pre-
post-surveys, question theme, and student background information.
Keywords: Systems Thinking, Research Instrument, Secondary Education, Game Based
Learning (GBL)
3.1 Introduction
Population expansion is threatening the world’s food, energy, and water (FEW)
nexus with massive advances being necessary to feed the world in the decades to come
(Godfray et al, 2010). The highly interconnected nature of the FEW nexus requires a

48
systems approach to be taken (NSF, n.d.). Such an approach is systems thinking which is
defined by Arnold and Wade (2015) as follows:
Systems thinking is a set of synergistic analytic skills used to improve the
capability of identifying and understanding systems, predicting their behaviors,
and devising modifications to them in order to produce desired effects. These
skills work together as a system. (p. 675).
The concept of systems thinking dates back to the work done by Karl Ludwig von
Bertalanffy in 1968 with his text General System Theory (Mitchell, 2005). Since then, its
popularity has been quite volatile with a resurgence during the age of information
technology (Kay and Foster, 1999). With the progress made in computer modeling and
computational power, systems thinking approaches are becoming more feasible, and thus
more widely used in the information systems, agriculture, and medical fields (Mingers
and White, 2010). The importance of a populace capable of utilizing a systems thinking
approach in solving complex problems is well documented throughout the literature
(Briscoe, 2016; Davidson and Venning, 2011; Kunsch, Theys, & Brans, 2007; Mingers
and White, 2010; Richmond, 1993).
Measuring students’ capacity for systems thinking has remained a challenge for
educators. The nature of systems thinking being a mindset of analysis requires an
educator to investigate how a student looks at a problem, the connections they are able to
make, and ultimately their capacity to solve problems. Several research instruments have
been developed to analyze a person’s capacity for systems thinking each with its own
criteria for what systems thinking entails. Castelle and Jaradat (2016) categorized
individuals into four profiles based on their preferences in seven attributes: complexity,

49
integration, interconnectivity, ambiguity, emergence, uncertainty, and evolutionary
development. Frank (2006) identified ten cognitive characteristics of engineers with a
high capacity for engineering systems thinking including: understanding the whole
system, interconnections, multiple perspectives, creativity, ambiguity, implications of
change, new systems, system parallelism, and growth limits. Hopper and Stave (2008)
organized systems thinking into levels based on Bloom’s taxonomy with the following
attributes indicating a progressive increase in systems thinking awareness: recognizing
interconnections, identifying feedback, understanding dynamic behavior, differentiating
types of variables and flows, using conceptual models, creating simulation models, and
testing policies. These three studies investigated the attributes that make a good systems
thinker and/or features that could be tested. However, they did not provide an instrument
to measure changes in students’ capacity for systems thinking using a real-world
scenario.
Two instruments were identified in the literature which used scenarios to test
changes in students’ systems thinking awareness. Sweeney and Sterman (2000)
developed the “Bathtub Dynamics” test which measured students’ ability to understand
feedbacks, delays, and stocks and flows. The study found that few students, all with high
educational backgrounds in math and science, were able to utilize some of the most
fundamental system dynamic principles. The second instrument designed by Evagorou,
Korfiatis, Nicolaou, and Constantinou (2009) used a pizza shop scenario to test seven
skills including identifying system elements, temporal boundaries, spatial boundaries,
subsystems, system interactions, pattern recognition, and feedback loops.

50
The instrument by Evagorou et al., (2009) was chosen as our project’s baseline
instrument for measuring changes in systems thinking as it broke the concept of systems
thinking into necessary attributes that could be taught and evaluated. These attributes
matched many of the attributes seen in the studies by Castelle and Jaradat (2016), Frank
(2006), and Hooper and Stave (2008). It also placed the attributes into a complexity
hierarchy allowing evaluators to see the progression of student learning over time and
gave educators stepwise goals for teaching the principles of systems thinking. The
instrument was designed for 5th grade and 6th students, ages 11-12 years old. Thus, an
exploration study was necessary to determine if the research instrument was applicable
with the different age group and if question formats would need to be altered to challenge
the older students.
The original instrument measures seven attributes of system thinkers. Due to the
time requirement to fill out the survey, the attributes were split into two groups 1)
identification of system elements, spatial boundaries, temporal boundaries, and
subsystems and 2) understanding of systems interaction, pattern recognition, and
feedback loops. The two categories represent a natural divide between testing student’s
system “identification” vs complex system “understanding.” Our initial research only
evaluated undergraduate student system thinking capacity for the identification attributes
in group one.
3.2 Methods
The pizza shop systems thinking research instrument developed by Evagorou et
al., (2009) was originally produced in Greek. After corresponding with Dr. Evagorou, the
2nd author on this paper recreated the instrument using the question descriptions given in

51
Evagorou et al., (2009). The pizza shop map discussed in the Evagorou et al., (2009)
paper was not given in the paper, and thus was excluded in the instruments utilized in this
chapter. As an alternative, students were asked to draw the pizza shop system in question
2. Questions were reproduced to the best of our knowledge, however additional
differences may have occurred during translation.
3.2.1 Course Design
The systems thinking research instrument by Evagorou et al., (2009) was
evaluated with three undergraduate courses at the University of Nebraska – Lincoln.
Changes were made to the instrument following each course based on the feedback
received from students and the result findings. The final iteration of this study, Course C,
was still in progress at the time this thesis was published. Thus, only the course design
and instrument changes for Course C will be discussed in this thesis chapter. Data
findings for Course C will be published at a later date.
3.2.1.1 Course A
Course A occurred in the Fall 2017 semester and consisted of 28 junior standing
mechanized systems management students enrolled at the University of Nebraska –
Lincoln. All students were 19 years of age or older and provided written informed
consent to be included in the study. Every student in the class gave consent to participant
in the study. The study was given exemption status by University of Nebraska – Lincoln
Institutional Review Board (IRB #: 20180117955EX).
The intervention utilized in the course consisted of one 50-min session and one
75-min session with one day between sessions. The first session had students play the
board game, Preservation, designed to teach about environmental sustainability, system

52
effects, and game theory. The second session was lecture format where students went
through several active learning activities regarding environmental sustainability and
game theory. Version 1 of the systems thinking instrument (see Appendix A) was given
pre-intervention and post-intervention with half the class taking the post-survey following
the board game and half following the lecture. This split the class into two sample
populations: game only and game+lecture. For a more detailed look at the course design,
intervention, and methodology see thesis Chapter 4.
3.2.1.2 Course B
Course B occurred in the Spring 2018 semester and consisted of 36 junior
standing biological systems engineering students enrolled at the University of Nebraska –
Lincoln. All students were 19 years of age or older and provided written informed
consent to be included in the study. Every student in the class gave consent to participant
in the study. The study was given exemption status by University of Nebraska – Lincoln
Institutional Review Board (IRB #: 20180117955EX).
The intervention consisted of two 75-min sessions with one day between sessions.
The sessions were equivalent to those given in Course A, however the order was
reversed. The lecture was given in the first session and the Preservation game in the
second session. Version 2 of the systems thinking instrument (See Appendix A) was
given pre-intervention and post-intervention with half the class taking the post-survey
following the lecture and half following game. This split the class into two sample
populations: lecture-only, and lecture+game. For a more detailed look at the course
design, intervention, and methodology see thesis Chapter 5.
3.2.1.3 Course C

53
Course C occurred in the Fall 2018 semester and consisted of ten junior standing
students taking part in an energy science course at the University of Nebraska – Lincoln.
As the course was a minor requirement, there was a wide variety of majors present with
the majority in environmental studies or engineering. All students were 19 years of age or
older and provided written informed consent to be included in the study. Every student in
the class gave consent to participate in the study. The study was given exemption status
by University of Nebraska – Lincoln Institutional Review Board (IRB #:
20180918576EP).
The intervention for Course C was much more expansive compared to the
previous two courses. Ten sessions lasting 50 min each were given over a 12-week
period. Table 3.1 shows the topics and assignments covered during each session.
Evaluation used Version 3 of the systems thinking instrument (See Appendix A). The
pre-survey was given at the beginning of the semester (August 29th) and the post-survey
following the final project (November 28th).
Table 3.1. Course C energy class intervention and homework schedule.
Schedule
Class Date Topic Assignment
1 August 29 Into to FEWS Pre Survey
2 September 19 GREET Model – Intro Simulation Guide
3 September 26 GREET Model – Walkthrough LCA Worksheet
4 October 3 Sustainability – Three Pillars Energy Sustainability Score

54
5 October 10 Preservation – Cooperative Technology Lit Review
6 October 17 Agpocalypse 2050 – intro Reflections
7 October 24 Agpocalypse 2050 – Simulation Beef or No Beef Handout
8 October 31 Preservation – Solo Prepare for Debate
9 November 7 Beef or No Beef – Work Day Prepare for Debate
10 November 14 Beef or No Beef – Debate None
11 November 28 Guest Lecture Post Survey
3.2.2 Research Instrument Evaluation
The survey results were evaluated by three members of our research team using a
blinded coding strategy. An initial rubric was developed which identified what the
researchers should be looking for in each of the four questions; the rubric will be
discussed in detail in the next section. Based on the rubric the researchers scored the
questions on a scale from 1 to 5 with 1 being no understanding and 5 being very
knowledgeable. After independently scoring all the instruments, the researchers came
back together to discuss the values. Any question that had a standard deviation greater
than one between the three researcher’s scores was discussed until a consensus was
reached.
The 1 to 5 scale scoring system utilized in this study varied from the scoring
system used by Evagorou et al., (2009). Their study used a three level scoring system
with level 1 indicating complete failure of the task, level 2 indicating partial successful

55
response, and level 3 indicating an accepted response. During the coding procedure, we
decided three levels was not enough to distinguish between the student responses,
especially within the partially correct level. The majority of the participant population fell
into the partially correct level; however there was a large gap in understanding between
those who were barely partially correct, and those that were almost completely correct.
Thus, adding two levels allowed us to distinguish between these students’ content
understanding.
The coded survey instruments for Course A were evaluated using independent
sample t-tests. Independent sample t-tests were required as many of the students forgot to
place their names on the surveys preventing a paired comparison. The coded survey
instruments for Course B were evaluated using a paired sample t-test. The t-test results
were confirmed using the Mann-Whitney U test which has a similar function to a t-test,
but does not assume the data is normally distributed or the variances between populations
are equal. Instrument reliability was checked using Cronbach’s Alpha.
3.2.3 Survey Question Rubrics
A rubric was developed to guide researchers on responses that classified a
systems thinking mindset. A new rubric was needed for each course as the instrument
design and questions varied between courses. Table 3.2 illustrates the rubric used for
coding Course A, research instrument Version 1. Table 3.3 illustrates the rubric for
coding Course B, research instrument Version 2. A rubric has not been developed for
Course C as the post survey data has yet to be collected.
Table 3.2. Scoring Rubric for Course A research instrument Version 1.
Score Question 1 – Identification of system elements: Score Justification

56
1 Very basic, lists a couple of nutrients or organism types
2 Organism, or component view
3 Farm View, or 3 unique components
4 Good understanding, 4 unique components, beyond farm view
5 Complete Understanding, 5+ unique component types
Score Question 2 – Identification of spatial boundaries: Score Justification
1 Incomplete picture, nothing circled to study
2 Subpar picture, circled a simple subsystem or element to study
3 Average picture, circled they would study a significant subsystem
4 Complete picture, circled they would study more than one component
5 Drew the complete system, circled they would like to study whole system
Score Question 3 – Identification of temporal boundaries: Score Justification
1 Extremes, bad justification
2 Yearly or 10 years, limited justification
3 2 to 10 years, generally focus on either cost of minimizing disasters
4 2 to 5 years, decision made based on reducing cost and minimizing damage
5 3 to 5 years, decision made by frequency of significant events

57
Score Question 4 – Identification of subsystems: Score Justification
1 0 to 1 answered correctly
2 1 answered correctly or two somewhat
3 2 answered correctly
4 All three mostly answered correct, one subsystem
5 All three answered correct, multiple subsystems
Table 3.3. Scoring Rubric for Course B research instrument Version 2.
Score Question 1 – Identification of system elements: Score Justification
1 Lists basic individual elements, no pattern or thought behind choices
2 Labels one or two sections and a couple of individual elements
3 Describes the sections of the restaurant (Kitchen, dining, bathroom, etc.)
4 Captures components of the restaurant and at least one input or output
5 Captures components of the restaurant and multiple inputs and outputs
Score Question 2 – Identification of spatial boundaries: Score Justification
1 Incomplete picture, nothing circled to study
2 Subpar picture, circled a simple subsystem or element to study
3 Average picture, circled they would study a significant subsystem

58
4 Complete picture, circled they would study more than one component
5 Drew the complete system, circled they would like to study whole system
Score Question 3 – Identification of temporal boundaries: Score Justification
1 Incomplete justification, doesn’t make logical sense
2 Somewhat logical justification, surface level
3 Ok reasoning, emphasize importance of recent data
4 Good reasoning, connect advantages of recent data on yearly time scale
5 Great reasoning, indicate prices over long term are influenced by other factors
Score Question 4 – Identification of subsystems: Score Justification
1 0 to 1 answered correctly
2 1 answered correctly or two somewhat
3 2 answered correctly
4 All three mostly answered correct, one subsystem
5 All three answered correct, multiple subsystems
3.3 Results
3.3.1 Course A
3.3.1.1 Qualitative Data

59
Trends within the qualitative data gave researchers insight into how students
interpreted the questions, their background understanding of the topic, and their decision
making process. Figures 3.1 – 3.4 show sample student answers for the systems thinking
research instrument Version 1. This student performed exceptionally well on the
instrument receiving scores of five, five, two, and five respectively for questions one
through four. The only critique to the student’s answers was question 3. The student
made a logical statement saying that the more data you have the better you can
understand what is going on. However, the student did not consider the systems
implications of the cost of collecting the data, and how often extreme events are
impactful to farmers. This resulting in a score of two for question 3.
Figure 3.1. Example student answer for question 1 on the systems thinking research
instrument Version 1. Question score = 5.

60
Figure 3.2. Example student answer for question 2 on the systems thinking research
instrument Version 1. Question score = 5.
Figure 3.3. Example student answer for question 3 on the systems thinking research
instrument Version 1. Question score = 2

61
Figure 3.4. Example student answer for question 4 on the systems thinking research
instrument Version 1. Question score = 5.
Many students had identical answers between their pre-survey and post-survey.
This was seen throughout the questions, but was more rampant on questions one and four.
Figure 3.5 shows this occurring for a student’s response on question one.
Figure 3.5. Example student’s response for question 1 illustrating a verbatim response
between pre-post-surveys. Top: Pre-survey response. Bottom: Post-survey response.
The class also showed a split on how they interpreted question one and two of the
instrument. One third of the class answered this question in terms of the biological

62
transfer of energy between organisms, and the other two thirds in terms of the human
food production system. Figures 3.6 and 3.7 gives example answers for the two groups.
Figure 3.6. Example student answer for question 1 in terms of the human food
production system.
Figure 3.7. Example student answer for question 1 in terms of the biological transfer of
energy between organisms.
3.3.1.2 Quantitative Data Results
The quantitative results for Course A showed no statistically relevant trends
between pre-survey and post-survey scores. Average scores went up for questions 1 and 2
and down for questions 3 and 4; however, score changes were not statistically significant.
A significant difference was seen between post-game only and post-game+lecture in
overall scores (t-statistic = 2.484 and p-value = 0.022) and question 1 (t-statistic = 2.513
and p-value = 0.020). Five of the 28 students had average pre-survey scores ≥ 4 in all
categories. Two of the 23 students had average post-survey scores ≥ 4 in all categories.
Five students did not submit a post-survey instrument and nine students did not put their
names on the surveys. For a summary view of the scores see Tables 3.4 and 3.5.

63
Table 3.4. Comparison of systems thinking scores between pre-survey and post-survey
for Course A, Version 1.
Item Pre-
survey (n=28)
Post-survey (n=23)
t-statistic p-value
Average Scores – Total 3.29 3.27 -0.133 .895
Question 1: System Elements 3.13 3.32 0.633 .529
Question 2: Spatial Boundaries 3.53 3.66 0.489 .627
Question 3: Temporal Boundaries 3.09 2.79 -0.816 .419
Question 4: Subsystems 3.46 3.35 -0.391 .697
Table 3.5. Comparison of systems thinking scores between post-survey game and post-
survey game+lecture for Course A, Version 1.
Item
Post-survey Game (n=10)
Post-survey Game &
Lecture (n=13) t-statistic p-value
Average Grades_All 2.96 3.50 2.484 .022
Question 1: System Elements 2.71 3.78 2.513 .020
Question 2: Spatial Boundaries 3.32 3.92 1.624 .121
Question 3: Temporal Boundaries 2.91 2.69 -0.429 .673
Question 4: Subsystems 3.02 3.61 1.457 .160
3.3.2 Course B
3.3.2.1 Qualitative Data Results
The qualitative data for Course B showed a drop in effort between the pre-surveys
and post-surveys. The majority of the students put visibly less time into answering the
questions on the post-survey often reusing previous responses and not using full
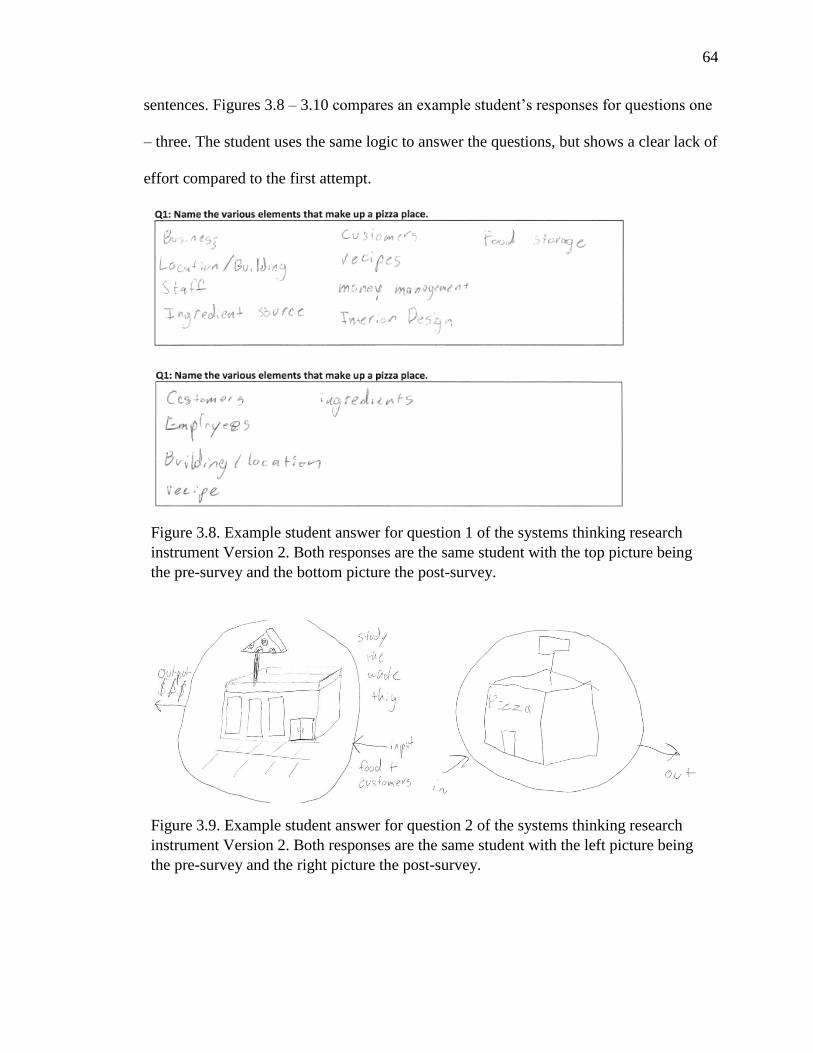
64
sentences. Figures 3.8 – 3.10 compares an example student’s responses for questions one
– three. The student uses the same logic to answer the questions, but shows a clear lack of
effort compared to the first attempt.
Figure 3.8. Example student answer for question 1 of the systems thinking research
instrument Version 2. Both responses are the same student with the top picture being
the pre-survey and the bottom picture the post-survey.
Figure 3.9. Example student answer for question 2 of the systems thinking research
instrument Version 2. Both responses are the same student with the left picture being
the pre-survey and the right picture the post-survey.

65
Figure 3.10. Example student answer for question 3 for the systems thinking research
instrument Version 2. Both responses are the same student with the top picture being
the pre-survey and the bottom picture the post-survey.
3.3.2.2 Quantitative Data Results
The quantitative results for Course B showed a statistically significant downward
trend in student scores between pre-survey and post-survey (p-value = 0.041, n = 33).
Average student scores fell in each of the individual questions, however these were not
statistically significant. No significant difference was seen between the post-lecture only
and the post-lecture+game. One in 33 students had average pre-survey scores ≥ 4 in all
categories. Two of the 33 students had average post-survey scores ≥ 4 in all categories.
For a summary view of the scores see Table 3.6.
Table 3.6. Comparison of systems thinking scores between pre-survey and post-survey
for Course B, systems thinking instrument Version 2.

66
Items Pre-
survey (n=33)
Post-survey (n=33)
p-value (2-tailed)
Average Scores – Total 3.14 2.96 0.041
Question 1: System Elements 2.76 2.63 0.479
Question 2: Spatial Boundaries 3.06 2.99 0.579
Question 3: Temporal Boundaries 3.06 2.68 0.053
Question 4: Subsystems 3.69 3.56 0.460
3.3.3 Course C
Course C was currently in progress at the time this thesis was published so data
results have not been collected. Results will be published for Course C at a later date.
3.4 Discussion
When evaluating the results, the research team distinguished between three
unique influencing factors.
1) The instrument’s ability to capture systems thinking.
2) The intervention’s ability to teach systems thinking.
3) Impact of research design on student answers.
Each of these factors could explain data trends and shape research findings, making it
difficult to isolate the true cause.
3.4.1 Course A
Course A was the first attempt of using the systems thinking research instrument
designed by Evagorou’s et al. (2009) to measure undergraduate students’ capacity for
identifying system elements, spatial boundaries, temporal boundaries, and subsystems.
The information collected in this course set the groundwork for future testing and

67
provided hypotheses on how to improve the research design, intervention, and question
format in later courses.
3.4.1.1 Research Instrument
The quantitative data results showed no significant trends between the pre-survey
and post-survey scores. It was unclear at this point whether the lack of difference was due
to the intervention not improving student system thinking capacity or from the
instrument’s inability to capture changes in student understanding. There was a
significant difference between post-sample populations with game+lecture achieving
significantly higher scores compared to game only (t-statistic = 2.484 and p-value =
0.022). The research team had two hypotheses to explain this trend. 1) The instrument
was able to capture students systems thinking awareness, and the combination treatment
was more effective at teaching systems thinking. The lack of difference between the pre-
survey and post-survey was due to the short time window between instruments and
reduced effort on the post-survey. 2) The difference between post-sample populations
was due to a low sample size with a disproportionate amount of low scoring students
being in the game-only population. This hypothesis will be further discussed in section
3.4.1.3.
The research team gained confidence in the instruments ability to measure
systems thinking by looking at students that received high scores. In total, five of the 28
students received an average score of four or greater in every question. These students
showed a clear grasp on how to break down a complex system and stood apart from their
fellow classmates. The low number of students with a high propensity to use systems
thinking was expected as the literature shows that few individuals have the capacity to
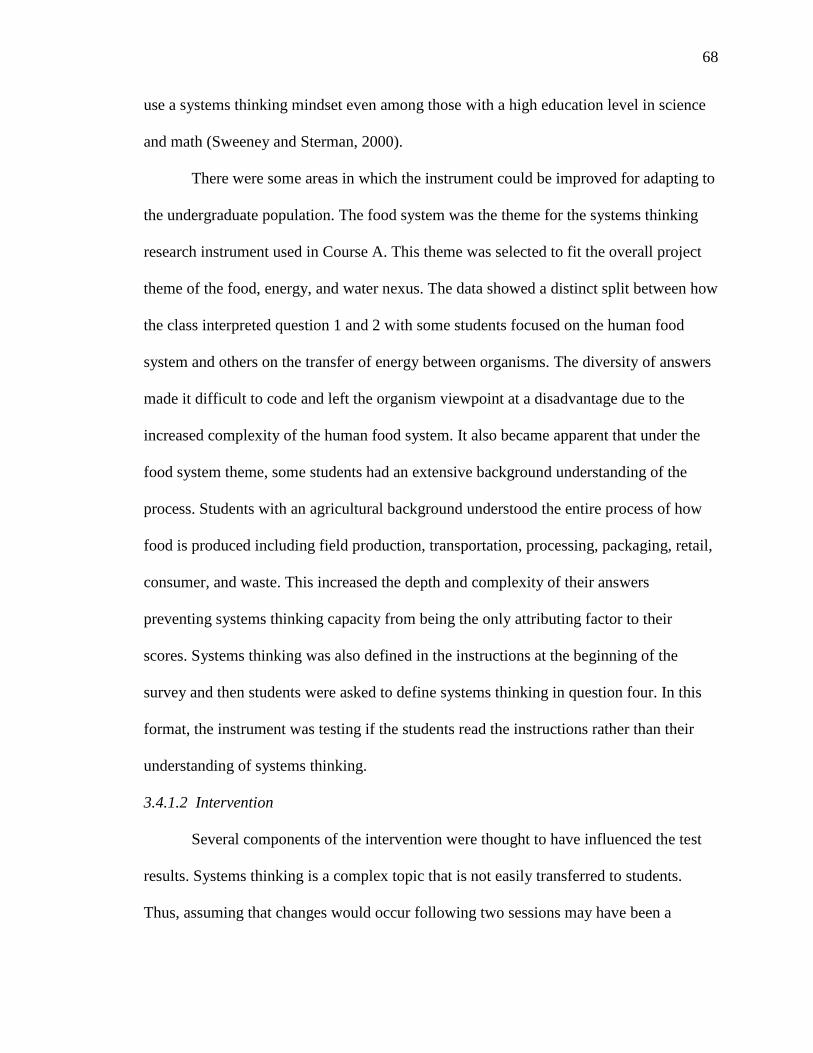
68
use a systems thinking mindset even among those with a high education level in science
and math (Sweeney and Sterman, 2000).
There were some areas in which the instrument could be improved for adapting to
the undergraduate population. The food system was the theme for the systems thinking
research instrument used in Course A. This theme was selected to fit the overall project
theme of the food, energy, and water nexus. The data showed a distinct split between how
the class interpreted question 1 and 2 with some students focused on the human food
system and others on the transfer of energy between organisms. The diversity of answers
made it difficult to code and left the organism viewpoint at a disadvantage due to the
increased complexity of the human food system. It also became apparent that under the
food system theme, some students had an extensive background understanding of the
process. Students with an agricultural background understood the entire process of how
food is produced including field production, transportation, processing, packaging, retail,
consumer, and waste. This increased the depth and complexity of their answers
preventing systems thinking capacity from being the only attributing factor to their
scores. Systems thinking was also defined in the instructions at the beginning of the
survey and then students were asked to define systems thinking in question four. In this
format, the instrument was testing if the students read the instructions rather than their
understanding of systems thinking.
3.4.1.2 Intervention
Several components of the intervention were thought to have influenced the test
results. Systems thinking is a complex topic that is not easily transferred to students.
Thus, assuming that changes would occur following two sessions may have been a

69
juvenile attempt. In addition, the intervention never explicitly taught the students about
systems thinking components. The goal was to see these changes naturally occur by
challenging the students to solve complex system problems. However, Hmelo-Silver and
Azevedo (2006) argue that students need to be taught how to draw connections and
understand interrelationships before they can be expected to think systematically.
The significantly relevant differences seen between post-game only and post-
game+lecture required future inspection into the potential learning outcomes of the
intervention. The preliminary results indicated the game activity was not as effective as a
combination treatment of game+lecture, and also posed the question of lecture only being
the significant attributer.
3.4.1.3 Research Design
Several areas of the research design may have influenced the study results. The
survey took students approximately 15 to 20 minutes to finish, and was taken at the
beginning and end of the first session for those in the game only group and within a two
day period for those in game+lecture. Several students inquired the instructors on why
they had to fill out the same survey twice especially within such a short time window.
The students were also aware that the instrument did not have any right or wrong
answers, and they would be given full credit for their participation. It is likely that this
impacted their motivation to fill out the instrument a second time, which in Version 1 was
highly dependent on student effort. In addition, the short time gap between pre-survey
and post-survey caused many students to remember verbatim what they previously
answered.

70
The random sampling for groups may also have caused the difference in post
scores between game only and game+lecture. The average pre-survey score for game
only was 2.96 compared to 3.50 in the game+lecture. Since evaluation used independent
t-test sampling, individual student scores were compared to the rest of the sample
population. As the game only had a disproportionate amount of the low performing
students the results were skewed in favor of game+lecture. This is a product of having a
smaller sample size and could have been avoided using paired t-test which focuses on the
difference between values rather than the value itself (Levine, Ramsey, & Smidt, 2001).
3.4.1.4 Conclusion – Course A
Course A gave the first look at using the systems thinking research instrument
with undergraduate students. Quantitative findings were inconclusive, but the qualitative
data showed promising results especially when considering students with a clear
understanding of systems thinking. Several concerns were raised with the intervention
design, including the length of the intervention and the time between taking the pre-
survey and post-survey. However, preliminary finding between post-game only and post-
game+lecture prompted at least one more test to completely understanding the learning
outcome findings. An added priority in Course B was to ensure student names were
placed on the research instruments to allow for a paired t-test sampling.
Changes to the systems thinking research instrument following Course A were as
follows:
1) Question theme switched from the food system to the original pizza shop theme.
2) Systems thinking definition was removed from the instructions.

71
The goal of changing the theme was to reduce the diversity of answers, and ensure
students would have similar background information. The definition of systems thinking
was removed to prevent students from copying the definition verbatim in question 4.
3.4.2 Course B
The goal for Course B was to answer several of the issues that arose in Course A.
This included providing more evidence that the research instrument could measure
undergraduate students’ systems thinking capacity related to identifying system elements,
spatial boundaries, temporal boundaries, and subsystems, investigating how the
instrument theme impacted student answers, and whether intervention type and/or order
influenced student results.
3.4.2.1 Research Instrument
The quantitative results for Course B showed a statistically significant trend of
student scores dropping post-intervention (p-value = 0.041, n = 33) and no significant
trends between post-lecture and post-lecture+game. In addition, students with a clear
understanding of systems thinking once again separated themselves from the rest of the
class. This occurred with two courses using two different complex systems. These
findings indicate that the research instrument does capture students’ systems thinking
capacity with regards to identifying system elements, spatial boundaries, temporal
boundaries, and subsystems, and the drop in student scores between pre-survey and post-
survey were associated with the intervention and/or research design.
Using the pizza shop theme did reduce the diversity of answers given by the
students allowing for added consistency in the coding efforts. There was no discernable
difference between student background understanding of the restaurant industry, albeit a

72
few students did note that they had previously worked in a pizza shop. Overall, the pizza
shop theme proved to be a more effective vector to analyze student understanding of
systems thinking.
There were still several areas in which the instrument could be improved.
Students were still spending 15 to 20 minutes to complete the survey. Reducing the
instrument length would improve the likelihood that students give optimal effort for all
questions. In addition, question one and two were still highly reliant on student effort.
The more detail and time put into these questions resulted in a higher score. Ideally these
would be changed to focus on the quality of the response rather than the quantity.
It was also realized during the coding procedure that the tables in question three
were ambiguous with no true right answer. This was most likely due to an error made in
the initial translation of the research instrument from Greek to English. This left the
student explanation as the only distinguishing factor between responses, and caused many
of the students to question what they were being asked to answer. The graphing element
used in Version 1 was a clearer representation of what the students were supposed to
identify. It also allowed them to quickly compare trends, reducing the time requirement
for the question.
3.4.2.2 Intervention
The quantitative data showed no increase in systems thinking capacity in any of
the four categories. The intervention actually saw a statistically relevant decrease in
scores (p-value = 0.041). Also, no trends were seen between post-lecture and post-
lecture+game. Combining the results from Course A and B, illustrates that the
intervention did not successfully increase student systems thinking capacity. The research

73
team’s hypothesis for this result was that the intervention length of two sessions was not
long enough to impact student’s systems thinking capacity, and the intervention did not
specifically address the skillsets that were being tested i.e. identifying system elements,
spatial and temporal boundaries, and subsystems.
The order of the game and lecture sessions did not seem to impact students’
systems thinking understanding. Also, the game session appeared to not have an impact
on student outcomes as lecture only received the same scores as lecture+game for Course
B. However, these finding are not reliable indicators of treatment teaching proficiency as
significant changes were not seen across any of the treatments. Systems thinking is also a
difficult learning objective to use when comparing teaching strategies as the results from
this study indicate multiple sessions are required to see changes in students’ systems
thinking understanding. This means that an effective study would require multiple game
sessions and lecture sessions, each designed to teach the same material. This would
present many challenges to providing the same baseline material to students and in
developing the three population groups seen in this study, game-only, lecture-only, and
lecture+game. A different learning objective may be better suited for this type of
analysis. One that would allow for significant changes in student understanding to occur
within a short time window.
3.4.2.3 Research Design
The decreasing systems thinking scores was a product of the research design. The
research instrument had already been shown to capture students excelling in systems
thinking skills for two different complex systems. In addition, if the intervention was the
cause we would expect no change as students should at least maintain their previous

74
understanding of systems thinking. The two areas of research design that were thought to
be attributing to the reduction in student scores were the short time window between the
pre-survey and post-survey and having no incentive for filling out the surveys. Many of
the students were copying what they answered previously, but were leaving out some of
the detail they had originally included. In addition, they knew they would receive full
credit for filling out the surveys regardless of the answers they gave.
There was no issue in sampling during Course B as a paired t-test was used. This
allowed the researchers to evaluate the change in student understanding regardless of the
initial understanding of the collective group. Moving forward paired t-test should
continue to be implemented for evaluation purposes.
3.4.2.4 Conclusion – Course B
The results of Course B provided more evidence that the systems thinking
research instrument could measure undergraduate students’ systems thinking capacity
with regards to identifying system elements, spatial boundaries, temporal boundaries, and
subsystems. The primary evidence of this was seen by analyzing the qualitative results of
students that received high scores in all systems thinking categories. The pizza shop
theme provided a more homogeneous answer set and prevented student’s technical
background from impacting the results. The intervention order and type did not seem to
influence student scores, however the learning objective being measured in this study was
not a reliable indicator. More than two sessions were required to see changes in student
systems thinking capacity. The time between pre-survey and post-survey needed to be
increased to reduce verbatim responses. Finally, changes to the research instrument

75
needed to be made to reduce the instrument time requirement and place the focus on
quality answers instead of quantity.
Changes to the systems thinking research instrument following Course B were as
follows:
1) Questions one and two were merged to streamline student responses. The number
of elements students should identify was limited to six instead of unlimited.
2) Question three was changed back to the graphing question used in Version 1 and
was placed as the last question in the instrument as it did not follow the pizza
shop theme.
3) Defining systems thinking and subsystems was removed from question 4.
Students were now required to identify three subsystems and understand what
makes them subsystems.
The changes made for Version 3 were designed to greatly reduce the time requirement for
filling out the survey instrument. Constraints were also added to the questions to prevent
students who spend more time answering from receiving a higher score just because they
labeled more elements.
3.4.3 Course C
The goal of testing this instrument in Course C was to see if changes in students
systems thinking capacity occurred following ten intervention sessions. This greatly
expanded the intervention length compared to the previous courses’ two sessions, and
increased the time between the pre-survey and post-survey from two days to 14 weeks.
Course C was still in progress at the time this thesis was published, thus the results were
not available for discussion.

76
The data collection from Course C will hopefully provide evidence on how much
time is required to see changes in students’ systems thinking capacity. The team has
hypothesized that 12 weeks may still not be enough time, and that years of being
engrossed in a systems thinking culture may be required. The impact of Version 3
research instrument changes will also be evaluated using the course results. One concern
that was raised for the Version 3 changes was that students would have difficulty
visualizing the system without being asked to draw it. If this occurs, question 1 may be
changed to ask the students to draw six elements that capture the pizza shop system rather
than listing six words or a map of the system may be given.
3.4.4 Collective Findings
Findings emerged throughout the research project about the nature of systems
thinking and how to measure it. Results supported the findings of Sweeney and Sterman
(2000) that stated few individuals, even within high educational levels of math and
science, have the capacity to utilize basic systems thinking skills. Initial results also
supported the Richmond (1993) statement that systems thinking is difficult to teach and
requires a culture of learning to be fully grasped. Students that showed a clear grasp of
systems thinking stood out among their fellow classmates. They were able to completely
break down a complex system, evaluate how it behaves, and make decisions about what
they saw. The typical student understood and utilized pieces of systems thinking skills,
however they had difficulty merging these skillsets to evaluate complex questions.
The research instrument, intervention, and design were found to influence the
evaluation of systems thinking. The theme of the instrument proved to be important in
determining the size of the answer pool, and changed students’ background

77
understanding. An ideal theme has clear spatial constraints to limit the breadth of
proposed answers, and should be a topic the participants have experienced but does not
give an advantage to expert knowledge.
The time between the pre-survey and post-survey also influenced instrument
results. Taking the instrument twice within a short time frame caused students to copy
responses verbatim or reduce the effort they gave on filling out the questions in the post-
survey. It is recommended to maximize the time between surveys, and in short time
windows provide two versions of the instrument each with a different system to evaluate.
Constraining the instrument questions was one of the most significant changes
made to the research instrument. Unconstrained questions placed emphasis on quantity
rather than quality of responses. This compounded the issue of effort, giving students the
advantage for longer answers. Providing constrained questions results in a smaller answer
pool, equity between responses, and shortens the instrument completion time.
3.5 Conclusion
This research project investigated using the systems thinking research instrument
developed by Evagorou’s et al. (2009) to measure changes in undergraduate student
systems thinking capacity with regards to identifying system elements, spatial
boundaries, temporal boundaries, and subsystems. Tests occurred in three undergraduate
courses at the University of Nebraska – Lincoln. The preliminary results showed that the
research instrument was able to measure undergraduate students’ systems thinking
capacity. Three iterations of changes were made to the instruments question format with
the most notable changes being adding constraints to the responses and reducing the time
requirement.

78
Several factors were identified to influence test results including the time between
the pre-survey and post-survey, question theme, and participant background information.
The intervention given to teach students about systems thinking was not extensive
enough to see any change. The third course was still in progress and greatly expanded the
intervention length. The results from this course will provide evidence on how long it
takes to see changes in student systems thinking capacity, and will potentially set the
stage for a longitudinal research study on student systems thinking understanding.

79
References
Arnold, R. D., & Wade, J. P. (2015). A definition of systems thinking: A systems
approach. Procedia Computer Science, 44, 669–678.
https://doi.org/10.1016/j.procs.2015.03.050
Briscoe, P. (2016). Global Systems Thinking in Education to End Poverty: Systems
Leaders with Concerted Push. CCEAM, 43(3), 5-19.
Castelle, K. M., & Jaradat, R. M. (2016). Development of an instrument to assess
capacity for systems thinking. Procedia Computer Science, 95, 80-86.
https://doi.org/10.1016/j.procs.2016.09.296
Davidson, K.M. and Venning, J. (2011). Sustainability decision-making frameworks and
the application of systems thinking: an urban context. Local Environment, 16(3),
213-228. https://doi.org/10.1080/13549839.2011.565464
DeVane, B., Durga, S., and Squire, K. (2010). ‘Economists who think like ecologists’:
Reframing systems thinking in games for learning. E-Learning and Digital
Media, 7(1). http://dx.doi.org/10.2304/elea.2010.7.1.3
Evagorou, M., Korfiatis, K., Nicolaou, C., & Constantinou, C. (2009). An investigation
of the potential of interactive simulations for developing system thinking skills in
elementary school: a case study with fifth‐graders and sixth‐graders. International
Journal of Science Education, 31(5), 655-674.
https://doi.org/10.1080/09500690701749313

80
Frank, M. (2006). Knowledge, abilities, cognitive characteristics, and behavioral
competences of engineers with high capacity for engineering systems thinking
(CEST). Systems Engineering, 9(2), 91-103. doi:10.1002/sys.20048
Godfray, H. C. J., Beddington, J. R., Crute, I.R., Haddad, L., Lawrence, D., Muir, J. F., .
. . Toulmin, C. (2010). Food security: the challenge of feeding 9 billion people.
Science, 327(5967), 812-818. doi:10.1126/science.1185383
Hmelo-Silver, C. E., & Azevedo, R. (2006). Understanding complex systems: Some core
challenges. The Journal of the Learning Sciences, 15(1), 53–61.
https://doi.org/10.1207/s15327809jls1501_7
Hopper, M., & Stave, K. A. (2008.) Assessing the effectiveness of systems thinking
interventions in the classroom. Proceedings of the 26th International Conference
of the System Dynamics Society. July 20-24, 2008, Athens, Greece. Retrieved
from https://www.systemdynamics.org/conferences/2008/proceed/index.htm
Kay, J.J. and Foster, J. (1999). About Teaching Systems Thinking. In Savage, G. and
Roe, P (Eds.), Proceedings of the HKK conference, 14-16 June, 1999, University
of Waterloo, Ontario. 165-172.
Kunsch, P.L., Theys, M. and Brans, J.P. (2007). The importance of systems thinking in
ethical and sustainable decision-making. Central European Journal of Operations
Research, 15(3), 253-269. DOI 10.1007/s10100-007-0029-8
Levine, D., Smidt, R. K., & Ramsey, P. P. (2001). Applied statistics for engineering and
scientists: Using Microsoft Excel and MINITAB. Prentice Hall.
Mingers, J. and White, L. (2010). A review of the recent contribution of systems thinking
to operational research and management science. European Journal of

81
Operational Research, 207(3), 1147-1161.
https://doi.org/10.1016/j.ejor.2009.12.019
Mitchell, G. (2005). Bertalanffy’s General Systems Theory. Retrieved from
http://www.mind-development.eu/systems.html
Richmond, B. (1993). Systems thinking: critical thinking skills for the 1990s and beyond.
Systems Dynamics Review, 9(2), 113-133. https://doi.org/10.1002/sdr.4260090203
Sweeney, L. B., & Sterman, J. D. (2000). Bathtub dynamics: initial results of a systems
thinking inventory. System Dynamics Review, 16(4), 249-286.
Doi:10.1002/sdr.198

82
Appendix A
Systems Thinking Instrument Version 1 – Course A
Systems Thinking Survey
The following survey is designed to help you understand and build skills in Systems
Thinking.
Let’s start with a definition of a system. A system is a set of elements that interact with
each other. For example, a forest may be considered as a system and it may have
elements such as plants, insects, animals, reptiles, soil, rocks, water, etc. A sub-system is
a smaller system that is part of a larger system. For example, a tree, pond, etc. may be
considered as a sub-systems of the forest.
Instructions: Answer the following questions or problems to the best of your knowledge.
Feel free to draw diagrams if it helps you in answering a particular question. There is no
right or wrong answer. Try your best!
Q1: Name the various elements that make up a food system.
Q2: I would like to study the food system and how it operates. On the paper, draw a
food system and mark the area that you think I should study.
Q3: Look at the graph below that shows the cost of climate disasters in the US on a
yearly basis. The X axis on the graph shows the time in years and the Y axis shows
the damage amount in billions of dollars. Notice how the damage amount varies
with time

83
Q3 (i): How often will you like to assess the change in damage amount due to
climatic events, knowing that each time you collect data costs you 1 million dollars
and that damages above 25 billion influences the profitability of your regions
farming operations?
Q3 (ii): Explain why?
Q4 (i): In your own words explain what do you understand by the term “system”?
Q4 (ii): In your own words explain what do you understand by the term “sub-
system”?
Q4 (iii): Can you name any other smaller subsystems within the food system?
0
25
50
75
100
125
150
175
200
1980 1985 1990 1995 2000 2005 2010
Dam
age
Am
ou
nts
(B
iilio
ns
$)
Time (Years)

84
Systems Thinking Instrument Version 2 – Course B
Systems Thinking Survey
Instructions: Answer the following problems to the best of your knowledge. Feel free to
draw diagrams if it helps you in answering a particular question. There is no right or
wrong answer. Try your best!
Think of your favorite Pizza Place and answer the following questions.
Q1: Name the various elements that make up a pizza place.
Q2: I would like to study the pizza place as a system and how it operates. On the paper,
draw a pizza place and MARK the area that you think I should study.
Q3: Look at the tables below that shows the fluctuation in price of cheese. Notice how the
price of cheese and pizza varies with the time.

85
Q3 (i): Which table would you choose to use in order to decide if the price of the pizza is
influenced by the price of cheese?
Q3 (ii): Explain why?
Q4 (i): In your own words explain what do you understand by the term “system”?
Q4 (ii): In your own words explain what do you understand by the term “sub-system”?
Q4 (iii): Can you name any other smaller subsystems within the Pizza system?

86
Systems Thinking Instrument Version 3 – Course C
Systems Thinking Survey
Instructions: Answer the following problems to the best of your knowledge. Feel free to
draw diagrams if it helps you in answering a particular question. There is no right or
wrong answer. Try your best!
Think of your favorite Pizza Place and answer the following questions.
Q1: Using 6 words, name the primary system elements that make up a pizza place.
1. ___________________ 2. ___________________
3. ___________________ 4. ___________________
5. ___________________ 6. ___________________
Q2: I would like to study the pizza place as a system and how it operates. Circle which
elements you listed in Q1 you think I should study. *Note* you can choose more than one.
Q3: Name 3 sub-systems within the pizza place?
1. _________________ 2. __________________ 3. _________________
Briefly describe why these are sub-systems:
Q4: Look at the graph below that shows the cost of climate disasters in the US on a yearly

87
basis. The X axis on the graph shows the time in years and the Y axis shows the damage
amount in billions of dollars. Notice how the damage amount varies with time
Q3 (i): How often will you like to assess the change in damage amount due to climatic
events, knowing that each time you collect data costs you 1 million dollars and that damages
above 25 billion influences the profitability of your regions farming operations?
Q3 (ii): Explain why?
0
25
50
75
100
125
150
175
200
1980 1985 1990 1995 2000 2005 2010
Dam
age
Am
ou
nts
(B
iilio
ns
$)
Time (Years)

88
CHAPTER 4 AND 5 INTRODUCTION
The purpose of this introduction is to provide clarity and context for the reader on
the coming Chapters 4 and 5. These chapters investigate our efforts in evaluating the
educational value of the board game, Preservation, in two junior undergraduate courses at
the University of Nebraska – Lincoln. Chapter 4 was published in the American Society
of Engineering Education (ASEE) 2018 Annual Conference Proceedings as a work in
progress. Chapter 5 was submitted to the journal North American Colleges and Teachers
of Agriculture (NACTA) and is currently in the review process. As both of these works
have been submitted for publication we would like to leave them in their original form.
However, Chapter 4 was still a work in progress at the time of its publication, and thus
can result in confusion to the reader on how it correlates to Chapter 5.
The following description has been included to clarify this issue. Chapter 4
captures our research team’s first attempt at using the board game, Preservation, in an
undergraduate classroom. A second course was planned the following semester so we
wrote Chapter 4 recording the initial findings from the first course with our planned
designs for the second. Only data for the first course is presented in Chapter 4 which
included the sample populations: game-only and game+lecture. The third sample group,
lecture-only, was hoped to be gained during the second course by reversing the session
order giving the lecture first and then the game activity. This would have provided three
sample population groups from the two courses: lecture-only, game-only, and
game+lecture. With these groups we hoped to look into how lecture activities compared
to game activities and if a combination treatment is important. However, after analyzing
the first class data, the research team decided that significant changes needed to be made

89
to the evaluation instruments in order to capture the student’s understanding of systems
thinking and more realistic environmental sustainability learning objectives. This
included changing the theme of the systems thinking research instrument and switching
to a retrospective instrument for environmental sustainability.
Chapter 5 covers the second undergraduate course which utilized the revised
research instruments. The session order was reversed in this course creating two sample
populations: lecture only and lecture+game. However, as the research instruments were
significantly changed between course one and two, we did not discuss comparisons with
course one as initially intended. Chapter 5 only refers to the second course with no data
being included from the first course.

90
CHAPTER 4. COMPARISON OF GAME-BASED LEARNING AND TRADITIONAL
LECTURE APPROACHES TO IMPROVE STUDENT ENGAGEMENT AND
KNOWLEDGE TRANSFER IN STEM EDUCATION: WORK IN PROGRESS
Nathan Rice1, Jennifer Keshwani2, Deepak Keshwani3, and Ashu Guru4
University of Nebraska – Lincoln
Lincoln, NE
Acknowledgements
The authors thank the National Science Foundation (NSF) Innovations at the Nexus of
Food, Energy and Water Systems (INFEWS) program for funding this work and other
related projects under Award Number 1639478. The authors also appreciate the
assistance of Capri Keeler and Alli Hauger in developing the Preservation board game.
(1) Department of Biological Systems Engineering
(308) 631-5449
Chase Hall 14
Lincoln, NE 68583-0700
(2) Department of Biological Systems Engineering
(402) 472-9614
Chase Hall 249
Lincoln, NE 68583-0726
(3) Department of Biological Systems Engineering
(402) 472-6714
Chase Hall 212
Lincoln, NE 68583-0726
(4) Nebraska 4-H
(402) 472-4543
Ag Hall 114
Lincoln, NE 68583-0700
Chapter published in American Society of Engineering Education (ASEE) 2018 Annual
Conference Proceeding

91
CHAPTER 4. COMPARISON OF GAME-BASED LEARNING AND TRADITIONAL
LECTURE APPROACHES TO IMPROVE STUDENT ENGAGEMENT AND
KNOWLEDGE TRANSFER IN STEM EDUCATION: WORK IN PROGRESS
Abstract
In the modern educational system, educators are constantly striving to increase student
engagement. Improving student engagement leads to an increase in learning motivation,
ultimately enhancing students’ ability to grasp complex topic areas. A common strategy
to achieve higher engagement levels in the classroom is game-based learning (GBL).
GBL has received mixed reviews due to a lack of data comparison and the difficulty of
balancing entertainment with educational value. The objective of this study was to
investigate how student knowledge transfer compares between a GBL activity and a
classroom lecture within STEM education. The GBL activity developed for the study was
a cooperative board game called Preservation. During the game, players worked together
to mitigate a tide of environmental threats related to the corn-water-ethanol-beef system
in the Midwest. The primary learning outcomes measured during the study were student
attitudes towards the environment and their capacity for systems thinking. Students in
two junior level undergraduate courses completed pre-post-surveys after experiencing
one of three treatments: group one – played Preservation, group two – played
Preservation with supporting lecture, and group three – received lecture only. Assessment
focused on changes in student environmental attitudes and overall understanding of
system interactions. Initial findings suggest that the combination treatment provided the
greatest change in systems thinking, however, no change occurred with respect to
environmental attitudes. The results of this study will be used to direct the development
of subsequent games and hands-on activities to promote transformational learning
strategies in STEM education.

92
Keywords: Game Based Learning (GBL), Systems Thinking, Secondary Education,
Environmental Sustainability, STEM Education
4.1 Introduction
Engagement in school is one of the primary building blocks to a successful
educational system. Fredricks et al. (2004) preformed a literature review on the outcomes
of effective engagement, finding evidence for improved achievement and lower dropout
rates. However, maintaining student engagement in the classroom has become
increasingly difficult in recent years. Students are constantly being pulled to multi-media
devices, which provide a level of entertainment that is difficult to match in the classroom.
Consequently an emphasis has been placed on developing teaching strategies to improve
student engagement including Active Learning, Flipped Classroom, and, the focus of this
research, Game-Based Learning (GBL).
GBL has been defined many ways in the literature, but for this study, it will refer
to any approach that uses a game (digital or hard copy) developed to produce specific
educational learning outcomes. This is slightly different from the term “Serious Games”
which generally only refers to digital games where entertainment is not the primary
objective (Tsekleves, et al., 2016).
The interest of academics in GBL stems from the fact that youth are playing an
increasing number of games, with 97% playing at least one hour per day (Granic et al.,
2014). Games are also designed to provide continual entertainment resulting in an
engaging learning environment (Gee, 2009). Additionally, the immersive experience
provided by gameplay reduces the perceived effort for problem solving (Dede, 2009).

93
This engagement and perception of lowered effort provides educators a possible avenue
to teach complex topic areas.
The literature perspective on GBL is highly varied. The primary reason is a lack
of empirical evidence due to the relative newness of its popularity (Hainey et al., 2016).
To better understand the status of GBL, several recent literature review studies have been
performed to identify misconceptions and/or gaps in knowledge. In a study by Ke et al.
(2016), GBL’s foundation of improving engagement was investigated to provide
empirical evidence to its authenticity. Their findings indicate that GBL does provide an
engaging learning environment, but the type of engagement transforms throughout the
gameplay experience. In the review by Hainey et al (2016), GBL papers from 2000 to
2013 were analyzed to compare quality applications of GBL. They concluded that in
order to empirically prove the effect of GBL in primary education, more studies were
necessary in comparison to traditional approaches, collaborative gameplay, and impact of
2D vs 3D games.
GBL has been identified in many studies to be a promising approach to improve
classroom engagement, and provide an effective environment for problem solving (Dede,
2009; Gee, 2009; Tsekleves, et al., 2016). However, arguments have been made that there
currently isn’t enough definitive evidence to holistically validate these claims (Hainey et
al., 2016). The objective of this study is to provide empirical evidence on how student
knowledge transfer compares between a GBL activity and a traditional classroom lecture
within STEM education.
4.2 Methods
4.2.1 Sample

94
Two junior level undergraduate courses accepted to take part in the study (Course
A and Course B), accounting for 64 students in total. Within this population are three
primary degrees including mechanized systems management, biological systems
engineering, and agricultural engineering. All students were 19 years of age or older and
provided consent to be included in the study. The study was given exemption status by
University of Nebraska – Lincoln Institutional Review Board (IRB #: 20180117955EX).
Only results for Course A are presented in this paper as Course B testing is still in
progress.
4.2.2 Intervention
The intervention used in the study consisted of one 50-min lecture session and
one 75-min game session with one day between sessions. The game session had students
play the board game, Preservation, designed to teach about environmental sustainability,
system effects, and game theory. The lecture session went through several active learning
activities regarding environmental sustainability and game theory. The order of the
sessions varied between the two courses with Course A receiving the game session first
and lecture session second, and Course B receiving the lecture session first and the game
session second. Pre-surveys were given to students immediately prior to session one. Half
of the post-surveys were given following session one and half following session two.
Collectively between the two courses, this produced three sample population groups:
game-only, lecture-only, and game+lecture. Figure 4.1 illustrates how the sessions were
laid out between the two courses and the timing of the pre-surveys and post-surveys.

95
Figure 4.1. Course intervention session layout and research instrument timing.
4.2.2.1 Lecture Material
The curriculum developed for the in-class lecture was split into two primary
topics: Environmental Sustainability and Game Theory. The first activity for
environmental sustainability was a fishbone diagram designed to teach students about the
cause and effect of agricultural management practices. A Fishbone diagram is a tool for
root-cause analysis. It is similar to a tree diagram in that it starts with a broad topic, and
continues to branch until the source is reached. During the activity, students were
prompted to identify the causes of environmental hazards, grouped into major the
categories land use, chemical pollution, climate change, and fresh water use. As students
progressed to the root cause of each of the issues, the teacher prompted a discussion on
how individual components combine to influence the entire system. See Figure 4.2 for
the Fishbone diagram layout used in the study.

96
Figure 4.2. Fishbone diagram for cause and effect relationships of environmental
hazards.
The second environmental sustainability activity introduced the students to the
Resource Management Hierarchy, see Figure 4.3. During this activity, students were
given 19 management decisions and were instructed to match each with the appropriate
level. Many of the decisions were purposely designed to match multiple categories,
allowing the students to debate the correct answer. After completing the matching
activity the teacher prompted the students to discuss how they use each of the five
categories in their daily lives.
Figure 4.3. Resource management hierarchy for sustainable decision making.

97
For the game theory lecture, students were introduced to basic principles and
definitions using the “Prisoner’s Dilemma” (Kuhn, 2017). Students then preformed two
classroom activities during which they competed against one another using game theory
principles. The first activity, titled The Farmer’s Dilemma, had the students decide if they
should advertise their products. The potential outcomes seen in Figure 4.4 were given to
the students, and after competing three rounds in pairs they determined who made the
most money. After tabulating the results, a discussion was made on why the groups
trended toward a certain direction and examples of this occurring in real-world situations.
Figure 4.4. Farmer’s Market Dilemma outcomes for each of the four possible scenarios.
In the final game theory activity, titled 80% of the Average, the class worked
together to determine when the best time was to sell their corn. Students were given a
scenario where they were told their corn had just been harvested and they can store it for
a maximum of 100 days. Based on research the most effective time to sell is when 40%
of the corn has been sold. Students were then asked to discuss with their classmates at
what time they were going to sell their produce. After discussing, they wrote down their
actual sell time ranging from 1 day to 100 days. The ideal time was calculated and a class

98
discussion was performed on why students chose the date they did. Throughout all of
these activities, candy was used as an incentive for winning or completing scenarios.
4.2.2.2 Game Activity - Preservation
The game activity developed for the study was a cooperative board game called
Preservation. It is a four person game focused on environmental sustainability within the
corn-water-ethanol-beef nexus in the Midwest. The goal of the game is to unlock four
technological advancements, one for each of the environmental threats: Land Use,
Climate Change, Chemical Pollution, and Fresh Water Use. To do this, players collect
technology cards containing advancements. These advancements are based upon a review
of literature in agricultural technology. The players’ adversary is a tide of environmental
threats that grow in magnitude over the course of the game. If these threats are left
unmanaged, they rapidly expand ending any hope of a sustainable environmental system.
With an interchangeable game board, eight character roles, and random card placement,
students must navigate a unique game scenario each time they play.
4.2.3 Data Collection
Each class was split into two population groups with each group receiving a
different intervention listed as follows Class A Group 1 – game only, Class A Group 2 –
game+lecture, Class B Group 1 – Lecture only, and Class B Group 2 – game+lecture.
Two survey instruments were used in the data collection procedure. The Environmental
Attitudes Inventory developed by Milfont et al. (2016) was used to measure changes in
students’ attitudes toward environmental sustainability. To reduce the time of the survey,
the shortened version was implemented, and blocks were removed to better align with the
study’s learning objectives. Metrics included in the study include Enjoyment of Nature,

99
Confidence in Science and Technology, Environmental Threat, Personal Conservation
Behavior, and Human Utilization of Nature. The finalized survey consisted of 30 Likert
scale questions that can be seen in Appendix A.
The second instrument, designed by Evagorou et al. (2009), was used in the study
to test students understanding and ability to use systems thinking. The survey uses a
variety of questions including short answer, diagraming, and numeric solutions. The
original instrument measures seven attributes of system thinkers including system
elements, temporal boundaries, spatial boundaries, subsystems, system interactions,
pattern recognition, and feedback loops. The attributes were split into two groups due to
the time requirement to fill out the survey 1) identification of system elements, spatial
boundaries, temporal boundaries, and subsystems and 2) understanding of systems
interaction, pattern recognition, and feedback loops. The two categories represent a
natural divide between testing student’s system “identification” vs complex system
“understanding.” Our initial research only evaluated student system thinking capacity for
the identification attributes in group one. Questions escalade in comprehension as the
survey progresses from basic to advanced systems thinking characteristics. For more
information on the exact instrument used in the study, see Appendix B.
4.2.4 Evaluation
The qualitative systems thinking survey results were evaluated by three members
of our research team using a blinded coding strategy. An initial rubric was developed
which identified what the researchers should be looking for in each of the four questions.
Based on the rubric the researchers scored the questions on a scale from 1 to 5 with 5
being very knowledgeable and 1 being no understanding. After independently scoring all

100
the instruments, the researchers came back together to discuss the values. Any question
that had a standard deviation greater than one was discussed until a consensus was
reached on what score the question should receive.
The coded systems thinking survey and the environmental sustainability
instrument were quantitatively evaluated using independent sample t-tests. Independent
sample t-tests were required as many of the students forgot to place their names on the
surveys preventing a paired comparison. The t-test results were confirmed using the
Mann-Whitney U test which has a similar function to a t-test, but does not assume the
data is normally distributed or the variances between populations are equal. Instrument
reliability was checked using Cronbach’s Alpha.
4.3 Results
Survey results for the first junior level engineering course are given in the
following section. Table 4.1 indicates the syntax and sample size used throughout the
evaluation procedure unless otherwise stated. Comparisons between the student’s pre-
survey and post-survey surveys for systems thinking are reported in Table 4.2. No
significant changes occurred between the pre-survey and post-survey. The average score
for all questions remained relatively constant with the pre-survey scoring 3.29 and the
post-survey 3.27 (t=-0.133 and p = 0.895). The largest change came from the Q3:
Temporal boundaries were students’ scores fell from 3.09 to 2.79 (t=-0.816, p=0.416).
Table 4.1. Samples used in reporting and evaluation for systems thinking.
Sample Sample Size
(n)
Description
Pre-survey 28 All Pre-surveys taken by the class

101
Post-survey 23 All Post-surveys including game only and
game+lecture
Post-game 10 Post-surveys for game only
Post-game+lecture 13 Post-surveys for game+lecture
Table 4.2. Systems thinking grades: Comparison between pre-survey and all post-
surveys.
Item Pre-
survey
Post-
survey
Mean
Difference t-statistic p-value
Systems Thinking - Overall 3.29 3.27 -0.02 -0.133 .895
Q1: System Elements 3.13 3.32 0.19 0.633 .529
Q2: Spatial Boundaries 3.53 3.66 0.13 0.489 .627
Q3: Temporal Boundaries 3.09 2.79 -0.29 -0.816 .419
Q4: Sub-System Elements 3.46 3.35 -0.11 -0.391 .697
Table 4.3 reports the comparison of interventions, post-game and post-
game+lecture, for the systems thinking survey. A significant difference exists between
the overall scores of the post-game and post-game+lecture with 2.96 and 3.50
respectively (t=2.484 and p = 0.022). The only individual question to contain a
significant difference was Q1: Identification of system element (t=2.513 and p = 0.020).
The main outlier in the sample is Q3: Temporal boundaries were post-game scored higher
than post-game+lecture with 2.91 and 2.69 respectively (t=-0.429 and p=0.673).

102
Table 4.3. Systems thinking grades: Comparison between post-survey game and post-
survey game+lecture.
Item
Post-
survey
Game
Post-survey
Game &
Lecture
Mean
Difference t-statistic p-value
Systems Thinking - Overall 2.96 3.50 0.54 2.484 .022
Q1: System Elements 2.71 3.78 1.07 2.513 .020
Q2: Spatial Boundaries 3.32 3.92 0.59 1.624 .121
Q3: Temporal Boundaries 2.91 2.69 -0.22 -0.429 .673
Q4: Sub-System Elements 3.02 3.61 0.59 1.457 .160
Table 4.4 reports the comparison between the pre-survey and post-surveys for the
Environmental Attitudes Inventory research instrument. A significant change was not
seen in any of the metrics. The average score for all of the questions remained constant
with scores of 2.64 and 2.69 for pre-survey and post-survey respectively (t = 0.537 and
p=5.94). The largest change occurred in the metric “Confidence in Science and
Technology” with the pre-survey scoring 2.26 and Post-survey 2.50 (t=1.253 and p
=0.216).
Table 4.4. Environmental attitudes inventory survey results: Comparison between pre-
survey and post-survey.
Item Pre-survey
(n=25-27)
Post-
survey
(n=20-22)
Mean
Difference t-statistic p-value
Environmental
Attitudes - Overall 2.64 2.69 0.05 0.537 .594
Enjoyment of Nature 3.54 3.58 0.04 0.302 .764
Confidence in Science
and Technology 2.26 2.50 0.24 1.253 .216

103
Environmental Threats 2.30 2.27 -0.04 -0.190 .850
Personnel Conservation
Behavior 2.72 2.80 0.09 0.515 .609
Human Utilization of
Nature 2.45 2.33 -0.13 -0.862 .393
Table 4.5 compares the differences in intervention strategies, post-game and post-
game+lecture, for the Environmental Attitudes Inventory research instrument. Significant
differences were not found for any of the metrics with the average score for all metrics
remaining relatively constant (t=-0.536 and p=0.598).
Table 4.5. Environmental Attitudes Inventory survey results: Comparison between
Post-survey Game and Post-survey Lecture.
Item
Post-survey
Game
(n=9-10)
Post-
survey
Lecture
(n=11-12)
Mean
Difference t-statistic p-value
Environmental
Attitudes - Overall 2.73 2.66 -0.07 -0.536 .598
Enjoyment of Nature 3.67 3.51 -0.15 -0.893 .382
Confidence in Science
and Technology 2.60 2.42 -0.18 -0.618 .543
Environmental Threats 2.25 2.28 0.03 0.093 .927
Personnel Conservation
Behavior 2.83 2.78 -0.06 -0.241 .812
Human Utilization of
Nature 2.30 2.35 0.04 0.195 .847
4.4 Discussion
The goal of the study was to inspect the differences in learning outcomes based on
varying educational interventions including game only, lecture only, and lecture+game.
The game used during the interventions was a cooperative board game called

104
Preservation focused around the Midwest’s CWEB nexus. The learning outcomes used to
evaluate intervention success were students’ understanding of system thinking and
attitudes to environmental sustainability.
Initial findings from Course A, indicate that the intervention game+lecture had a
significant increase in systems thinking compared to game only (t=2.484 and p=0.022).
These results lead to the assertion that supporting games through traditional classroom
lecture material improves the success of teaching complex topics. However, these finding
are still preliminary as Course B testing is still in progress, and contains the lecture only
data necessary for a complete analysis of intervention strength.
Significant changes in the students’ environmental attitudes were not seen for any
of the metrics, and differences were not observed between intervention types. The lack of
change regardless of educational strategy has prompted further inspection into the
viability of the instrument to evaluate the project. A revised instrument is under
development which shifts the focus from inherently held beliefs towards students’
understanding of sustainability factors. Additional changes to instrument design are also
being considered to address student feedback on the pre-post-format. Students voiced
complaints with having to take the same instrument twice within a two-day period. From
a research perspective, this increases the risk that students will not provide the same level
of effort on both attempts skewing the results. Support for this speculation can be seen in
the systems thinking results were students actually performed worse on average between
pre-survey and p-survey. A potential solution being considered is switching from pre-
post-surveys to retrospective.

105
The initial finding of this study indicate that the ability of GBL to bring about
learning outcomes greatly depends on the intervention strategy. Future inspection into
this research will provide clarity on whether GBL exceeds traditional lecture approaches,
and if a synergistic effect exists when supporting GBL with traditional lecture material.

106
References
Dede, C. (2009). Immersive interfaces for engagement and learning. Science, 323(66),
66-69.
Evagorou, M., Korfiatis, K., Nicolaou, C., & Constantinou, C. (2009). An investigation
of the potential of interactive simulations for developing system thinking skills in
elementary school: a case study with fifth‐graders and sixth‐graders. International
Journal of Science Education, 31(5), 655-674.
Fredricks, J. A., Blumenfeld, P.C., & Paris, A. (2004). School engagement: Potential of
the concept: State of the evidence. Review of Educational Research, 74, 59-50.
Gee, J. P. (2009). Deep learning properties of good digital games: How far can they go?
In U. Ritterfeld, M. Cody & P. Vorderer (Eds), Serious Games: Mechanisms and
effects (pp. 65 – 80). New York & London: Routledge.
Granic, I., Lobel, A., & Engels, R. C. M. E. (2014). The benefits of playing video games.
American Psychologist, 69(1), 66-78.
Hainey, T., Connolly, E. M., Boyle, E. A., Wilson, A., & Razak, A. (2016). A systematic
literature review of games-based learning empirical evidence in primary
education. Computers & Education, 102, 202-223.
Ke, F., Xie, K., & Xie, Y. (2016). Game-based learning engagement: A theory-and data-
driven exploration. British Journal of Educational Technology, 47(6), 1183-1201.
Kuhn, S. (2017). "Prisoner's Dilemma", The Stanford Encyclopedia of
Philosophy (Spring 2017 Edition), Edward N. Zalta (ed.),
https://plato.stanford.edu/archives/spr2017/entries/prisoner-dilemma/.

107
Milfont, T. L., & Duckitt, J. (2010). The environmental attitudes inventory: A valid and
reliable measure to assess the structure of environmental attitudes. Journal of
environmental psychology, 30(1), 80-94.
Tsekleves, E., Cosmas, J., & Aggoun, A. (2016). Benefits, barriers and guideline
recommendations for the implementation of serious games in education for
stakeholders and policymakers. British Journal of Educational Technology, 47(1),
164-183.

108
Appendix B
Systems Thinking Survey
The following survey is designed to help you understand and build skills in Systems
Thinking.
Let’s start with a definition of a system. A system is a set of elements that interact with
each other. For example, a forest may be considered as a system and it may have
elements such as plants, insects, animals, reptiles, soil, rocks, water, etc. A sub-system is
a smaller system that is part of a larger system. For example, a tree, pond, etc. may be
considered as a sub-systems of the forest.
Instructions: Answer the following questions or problems to the best of your knowledge.
Feel free to draw diagrams if it helps you in answering a particular question. There is no
right or wrong answer. Try your best!
Q1: Name the various elements that make up a food system.
Q2: I would like to study the food system and how it operates. On the paper, draw a
food system and mark the area that you think I should study.
Q3: Look at the graph below that shows the cost of climate disasters in the US on a
yearly basis. The X axis on the graph shows the time in years and the Y axis shows
the damage amount in billions of dollars. Notice how the damage amount varies
with time

109
Q3 (i): How often will you like to assess the change in damage amount due to
climatic events, knowing that each time you collect data costs you 1 million dollars
and that damages above 25 billion influences the profitability of your regions
farming operations?
Q3 (ii): Explain why?
Q4 (i): In your own words explain what do you understand by the term “system”?
Q4 (ii): In your own words explain what do you understand by the term “sub-
system”?
Q4 (iii): Can you name any other smaller subsystems within the food system?
0
25
50
75
100
125
150
175
200
1980 1985 1990 1995 2000 2005 2010
Dam
age
Am
ou
nts
(B
iilio
ns
$)
Time (Years)

110
Appendix C
Environmental Attitudes Survey Instructions: Answer the following questions to the best of your understanding. There is
no right or wrong answer.
ID Question Strongly
disagree
Strongly
agree
1 I really like going on trips into the
countryside, for example to forests or fields. 0 1 2 3 4
2 I find it very boring being out in wilderness
areas. 0 1 2 3 4
3 Being out in nature is a great stress reducer
for me. 0 1 2 3 4
4 I have a sense of well-being in the silence of
nature. 0 1 2 3 4
5 I find it more interesting in a shopping mall
than out in the forest looking at trees and
birds.
0 1 2 3 4
6 I think spending time in nature is boring. 0 1 2 3 4
7 Science and technology will eventually
solve our problems with pollution,
overpopulation, and diminishing resources.
0 1 2 3 4
8 Modern science will NOT be able to solve
our environmental problems. 0 1 2 3 4
9 We cannot keep counting on science and
technology to solve our environmental
problems.
0 1 2 3 4
10 Humans will eventually learn how to solve
all environmental problems. 0 1 2 3 4
11 The belief that advances in science and
technology can solve our environmental
problems is completely wrong and
misguided.
0 1 2 3 4

111
12 Modern science will solve our
environmental problems. 0 1 2 3 4
13 If things continue on their present course,
we will soon experience a major ecological
catastrophe.
0 1 2 3 4
14 When humans interfere with nature it often
produces disastrous consequences. 0 1 2 3 4
ID Question Strongly
disagree
Strongly
agree
15 Humans are severely abusing the
environment. 0 1 2 3 4
16 The idea that the balance of nature is
terribly delicate and easily upset is much
too pessimistic.
0 1 2 3 4
17 I do not believe that the environment has
been severely abused by humans. 0 1 2 3 4
18 People who say that the unrelenting
exploitation of nature has driven us to the
brink of ecological collapse are wrong.
0 1 2 3 4
19 I could not be bothered to save water or
other natural resources. 0 1 2 3 4
20 In my daily life I’m just not interested in
trying to conserve water and/or power. 0 1 2 3 4
21 I always switch the light off when I don’t
need it on any more. 0 1 2 3 4
22 In my daily life I try to find ways to
conserve water or power. 0 1 2 3 4
23 I am NOT the kind of person who makes
efforts to conserve natural resources 0 1 2 3 4
24 Whenever possible, I try to save natural
resources. 0 1 2 3 4
25 Protecting peoples’ jobs is more important
than protecting the environment. 0 1 2 3 4

112
26 Humans do NOT have the right to damage
the environment just to get greater
economic growth.
0 1 2 3 4
27 Protecting the environment is more
important than protecting economic growth. 0 1 2 3 4
28 Protecting the environment is more
important than protecting peoples’ jobs. 0 1 2 3 4
29 The question of the environment is
secondary to economic growth. 0 1 2 3 4
30 The benefits of modern consumer products
are more important than the pollution that
results from their production and use.
0 1 2 3 4
113
CHAPTER 5. EFFECT OF GAME-BASED LEARNING ON UNDERGRADUATE
STUDENT UNDERSTANDING OF THE FOOD-ENERGY-WATER NEXUS
Jennifer Keshwani1, Nathan Rice2, Changsoo Song3, and Ashu Guru4
University of Nebraska – Lincoln
Lincoln, NE
Acknowledgements
The authors thank the National Science Foundation (NSF) Innovations at the Nexus of
Food, Energy and Water Systems (INFEWS) program for funding this work and other
related projects under Award Number 1639478. The authors also appreciate the
assistance of Capri Keeler and Alli Hauger in developing and designing Preservation.
(1) Department of Biological Systems Engineering
(402) 472-9614
Chase Hall 249
Lincoln, NE 68583-0726
(2) Department of Biological Systems Engineering
(308) 631-5449
Chase Hall 14
Lincoln, NE 68583-0700
(3) Social and Behavioral Sciences Research Consortium
(402) 472-1831
WHIT 370B
Lincoln, NE 68583-0866
(4) Nebraska 4-H
(402) 472-4543
Ag Hall 114
Lincoln, NE 68583-0700
Chapter submitted to the research journal North American Colleges and Teachers of
Agriculture (NACTA). Status: Under Review.

114
CHAPTER 5. EFFECT OF GAME-BASED LEARNING ON UNDERGRADUATE
STUDENT UNDERSTANDING OF THE FOOD-ENERGY-WATER NEXUS
Abstract
A growing population and increased demands on limited resources requires preparing
future generations to solve problems using systems thinking skills. A game-based
learning experience was developed to provide opportunities for students to explore the
food-energy-water nexus through the corn-water-ethanol-beef system. In this study, third
year agricultural or biological systems engineering students participated in a game-based
learning activity and supporting lecture materials. They then completed a self-reflective
assessment to identify learning gains, impacts on career interests, and assessment of the
game materials. Students indicated an increase in knowledge related to the
interconnection of the food-energy-water nexus and the corn-water-ethanol-beef system
in general. No impact on career interests was reported. Student feedback on the game was
generally positive with a few suggestions for improvements such as improving the clarity
of the instructions and further stressing the technical content.
Keywords: Game Based Learning (GBL), Retrospective Research Instrument, FEW
Nexus, Secondary Education, STEM Education
5.1 Introduction
A growing population continues to demand increasing amounts of food, energy,
water (FEW) and other resources. There is a pressing need to prepare a society capable of
understanding the connections between the coupled FEW systems (Bazilian et al., 2011).
Therefore, there is a critical need to develop transformative educational approaches to
prepare a society and workforce capable of systems thinking with an understanding of the
FEW system.

115
One potential avenue to meet this need is game-based learning (GBL).
Incorporating games into education may have promise to increase student learning.
Educational games have been shown to promote abstract thinking and mastery of
complex concepts (Dondlinger, 2007). Therefore, this educational approach would be
beneficial for teaching students the complex dynamics of the corn-water-ethanol-beef
(CWEB) system. Furthermore, studies have shown that 97% of youth spend at least one
hour playing games each day (Granic et al., 2014). Gameplay decreases players perceived
effort to problem solve due to the immersive experience (Dede, 2009). Improved student
engagement has been linked to improved achievement and lower dropout rates (Fredricks
et al., 2004).
While GBL has been associated with improved engagement that varies during the
game playing experience (Ke et al., 2015) limited empirical studies have been conducted
to determine the effectiveness of game playing on learning and engagement (Hainey et
al., 2016). The “Educational Immersive Simulations to Enhance Understanding of Corn-
Water-Ethanol-Beef (CWEB) System Nexus” is an INFEWS/T4 grant project funded by
the National Science Foundation (NSF). The overall goal of this project is to develop an
educational immersive simulation game to enhance understanding of the complex
interactions of the CWEB system nexus through outreach activities including 4-H
programs, partnerships with high school teachers, and engagement of undergraduate
students and the public.
As part of the CWEB System Nexus project, a board game called Preservation
was created. Preservation is a cooperative game in which players battle environmental
hazards while unlocking technological advancements. The objective of this study was to

116
explore the effectiveness of Preservation as an intervention combined with traditional
lecture activities to promote understanding of the interconnectedness of the FEW system
and move towards preparing a future workforce to solve these challenges.
5.2 Methods
5.2.1 Student Participants
Undergraduate students were recruited from a biological systems engineering
course during the Spring 2018 semester. All students were 19 years of age or older and
provided written informed consent to be included in the study. The study was given
exemption status by University of Nebraska – Lincoln Institutional Review Board (IRB
#: 20180117955EX). A total of 36 students consented to participate in the session
survey.
5.2.2 Game and lecture intervention
The game component consisted of playing the board game, Preservation, in teams
of 3-4 participants. The session was designed to educate youth about environmental
sustainability and systems thinking through cooperative gameplay. During the activity
players are challenged to think critically about the issues facing the world's
environmental health and learn to make decisions that transcend individual agendas. The
goal of the game is to mitigate the effects of environmental threats by unlocking
technological advancements. Players collect cards to unlock advancements and respond
to the rippling effects of environmental threats that increase in frequency throughout the
game.
The lecture component covered topics related to environmental sustainability and
game theory. Students were guided through a series of active learning activities including

117
developing a fish-bone diagram to identify and describe the causes of environmental
hazards, separating resource management decisions into a hierarchy, and experiencing
two game theory scenarios: Prisoner’s Dilemma and Farmer’s Market Dilemma. The
game theory scenarios were designed to help students understand the effect of social
choices and pressures on decision making.
5.2.3 Research design and data analysis
The class was split into two sections to complete the assessment instrument. All
of the students in the class participated in both the game and lecture components of the
intervention. One half completed the retrospective instrument after completing just the
lecture; the other half completed the instrument after completing the board game and
lecture based activities.
Survey results were evaluated using paired sample t-tests. The t-test results were
confirmed using the Mann-Whitney U test which has a similar function to a t-test, but
does not assume the data is normally distributed or the variances between populations are
equal. Instrument reliability was checked using Cronbach’s Alpha.
5.2.4 Instruments
A retrospective survey instrument was developed for this study (See Appendix
D). The questions included: understanding questions, such as how well the student
understood the benefits of renewable and nonrenewable energy sources; career interests,
such as how interested the student is in building a career in the agricultural areas; beliefs
related to science and the environment, such as agreeing or disagreeing with the
statement that humans will eventually learn how to solve all environmental problems. An
open comment section was also included for students to provide additional suggestions.

118
5.3 Results
The results of the survey instrument are as follows. There was no significant
difference found in any of the measures between students who participated in only the
lecture over those who participated in the board game and supporting lecture activities.
Therefore, the results from both samples were aggregated to evaluate the intervention as a
whole. The first result section describes the learning effects found in students after the
intervention. The next section covers the impact on career interests. Finally, the student
assessment of the board game is presented.
5.3.1 Impact on Student Content Knowledge
In general, students reported an increase in understanding of the content
knowledge presented in the board game and accompanying lecture materials (Figure 5.1).
None of the students indicated that they did not understand the knowledge at all, however
the percentage of students indicated understanding the material moderately or extremely
well increased after playing the board game.
Figure 5.1. Aggregate knowledge increase in students before and after attending game-
based learning curriculum activities.

119
Analysis of individual assessment items revealed larger impacts on some content
knowledge areas (Figure 5.2). Student understanding of the interconnection of FEW
nexus and the CWEB system in general had the largest increases in student perceived
understanding. This correlates well with the focus of the game and lecture materials. The
next largest increase in understanding focused on the different types of adaptations
necessary for survival. Significant increases were found for 12 of the 14 knowledge areas
(indicated by NS, *, **, *** Not significant or significant at P= 0.05, 0.01, or 0.001,
respectively in Figure 5.2).

120
Figure 5.2. Knowledge increase in students following game-based learning curriculum
activities – Individual items (n= 32~33). NS, *, **, *** Not significant or significant at
P= 0.05, 0.01, or 0.001, respectively using paired sample t-test.
5.3.2 Impact on Career Interests
Student career interests were not significantly impacted as a result of participating
in the game and lecture experience (Figure 30).
Figure 5.3. Changes in student agricultural career interest following game-based learning
curriculum activities.
5.3.3 Board Game Assessment
The participating students appreciated the developed board game (Figure 5.4).
Student responses indicated that it was easy to understand and helpful in developing
understanding and building interest in science and technology.
Figure 5.4. Student assessment of the game-based learning curriculum materials.

121
Students were given the opportunity to provide general feedback on the board
game. Representative student quotes are provided. Concerns were raised regarding the
clarity of the instructions, as one student simply requested ‘Better instructions,’ however
most of the comments highlighted the student enjoyment of the game experience. For
example, comments included,
“I thought it was fun overall!”
“The game was super fun. Maybe improve the instructions.”
“This game was awesome. If supported with more background information, I think it
could really increase people’s understanding.”
Some students provided suggestions to improve the learning potential of playing
the games,
“Include light reading sections to improve understanding of different technologies.”
“It was very fun, but I wish it was more informative if that was your point. Make it a rule
to read off advancements when playing them?”
“Maybe find a way to include economic costs.”
“Maybe make it so more hazard cards are used instead of just 4 or 5.”
While others felt that the game was already capable of helping them learn, “It
made me think pretty hard.”
5.4 Discussion
5.4.1 Impact on Student Content Knowledge
The focus of the board game and lecture activities is on the FEW nexus by using
the CWEB system as an exemplary model. It is not surprising that students reported the

122
largest learning gains in these content areas. It also indicates that the primary purpose of
the intervention was successful.
The next largest increase in knowledge was reported for the understanding of the
different types of adaptations necessary for survival. This content was not explicitly
included in the game or lecture material. This increase in knowledge may be a result of
the adaptations required to successfully play the game. Students may have realized that
their initial strategy was not leading to beneficial results leading to an adaptation of their
game playing strategy to find success. While this is not exactly the meaning behind
morphological, physiological or behavioral adaptations necessary for survival, it may
have been an interesting interpretation by the students.
As expected, there was little to no impact on the content knowledge areas not
covered by the game or supporting lecture. Content areas such as the factors that
influence daily/seasonal changes on Earth, the effects of natural and human activity on an
ecosystem and natural influences on global climate were not included in the learning
activities. These categories served as a reliability check to ensure students were
answering consistently and honestly.
Some content areas may have experienced a ceiling effect in that students came
into the activity already have a firm understanding of a topic. For example, the benefits of
renewable and nonrenewable energy sources are fairly well known, especially given the
sample of junior level agricultural and biological systems engineering students. Providing
an increase in reported knowledge in these areas would not be expected, however it may
be interesting to repeat this study with a younger population to explore impacts in this
content area.

123
Another consideration is that the intervention was presented to the students during
class time. Students are conditioned to indicate learning gains on quizzes and exams and
may have felt pressure to claim an increase in their understanding. The consistent trend of
increased scores for all content areas, although some were not statistically significant,
supports this theory. However, the range in learning gains (0.12 to 0.45 on a scale of 1 to
5) suggests that despite the natural student tendency to claim learning gains, students
perceived their learning was greater in some content areas than others.
5.4.2 Impact on Career Interests
The results of this study show no impact on career interests as a result of
participating in the game and accompanying lecture activities. This is not surprising
given the student population. Participating students were in a junior level class of the
biological systems or agricultural engineering degree program. These students were
already committed to pursuing a STEM career and likely already knew whether they
wanted to focus in the agricultural sciences.
Repeating this study with a junior high or high school population may reveal an
impact on career interests before students have identified the path they plan to pursue.
Future work will explore the impact on younger participants.
5.4.3 Board Game Assessment
Overall, the students appeared to enjoy playing the game and felt that learning
could be achieved through this method. We hypothesized that combining GBL with
traditional lecture would improve overall understanding. However, both the lecture and
game activities received similar results. In hindsight this should have been expected as
the traditional lecture actually integrated multiple active learning strategies. These results

124
support that GBL can promote learning equivalent to other active learning strategies and
student engagement is the most critical component rather than teaching format.
As with any study, there are limitations to this work. The sample population of 3rd
year undergraduate students may be too educated to fully assess the impact of the
intervention. These students already have a strong understanding of science and
engineering fundamentals. In addition, their commitment to a future career path is
established and unlikely to be swayed by a short term intervention. Another limitation of
this study was the lack of clarity in the instructions. Several students indicated that better
instructions would have been helpful and thus may have impacted their learning
experience. Finally, the experiment took place with nine groups all playing the game at
the same time. Only three instructors where present to manage the teams resulting in less
one on one interactions between students and instructors.
Future plans for this work include testing the game and lecture materials on
younger audiences. This will help identify the potential for the game to impact career
interests and fully explore the content knowledge gains. It is also planned to test the
independent effects of game alone or lecture activities alone. Training videos to teach
game play are being developed that will both improve the clarity of instructions and
improve consistency among game playing experiences. An additional study will also
compare students playing the game cooperatively and as individuals. This will give
students a better understanding of why making sustainable decisions in the real world is
difficult as every stakeholder has a different agenda.
5.5 Summary

125
The goal of this study was to explore the effectiveness of Preservation as an
intervention combined with traditional lecture activities to promote understanding of the
interconnectedness of the FEW system and move towards preparing a future workforce to
solve these challenges. The results indicate that students perceived an increase in
understanding of several content knowledge areas related to the interconnectedness of the
food, energy, water system and the corn-water-ethanol-beef system as a model.
Participating students were not persuaded to change their career interests as a result of
playing Preservation and experiencing the supporting lecture activities. This may be a
result of the age of the study population and their existing interest in pursuing a STEM
career. Overall, the students enjoyed playing the game and provided valuable feedback
for improvements.
5.6 Acknowledgements
The authors thank the National Science Foundation (NSF) Innovations at the
Nexus of Food, Energy and Water Systems (INFEWS) program for funding this work
and other related projects under Award Number 1639478. The authors also appreciate the
assistance of Capri Keeler and Alli Hauger in developing and designing Preservation.

126
References
Bazilian, M., Rogner, H., Howells, M., Hermann, S., Arent, D., Gielen, D., & Yumkella,
K. K. (2011). Considering the energy, water and food nexus: Towards an
integrated modelling approach. Energy Policy, 39(12), 7896-7906.
https://doi.org/10.1016/j.enpol.2011.09.039
Dede, C. (2009). Immersive Interfaces for Engagement and Learning. Science,
323(5910), 66-69. doi: 10.1126/science.1167311.
Dondlinger, M. J. (2007). Educational Video Game Design: A review of the literature.
Jour. of Applied Educational Technology, 4(1), 21-31.
Fredricks, J. A., Blumenfeld, P. C., & Paris, A. H. (2004). School Engagement: Potential
of the Concept, State of the Evidence, School Engagement: Potential of the
Concept, State of the Evidence. Rev. of Educational Research, 74(1), 59-109.
https://doi.org/10.3102/00346543074001059
Granic, I., Lobel, A., & Engels, R. C. M. E. (2014). The benefits of playing video games.
American Psychologist, 69(1), 66-78. http://dx.doi.org/10.1037/a0034857
Hainey, T., Connolly, T. M., Boyle, E. A., Wilson, A., & Razak, A. (2016). A systematic
literature review of games-based learning empirical evidence in primary
education. Computers and Education, 102, 202-223.
https://doi.org/10.1016/j.compedu.2016.09.001
Ke, F., Xie, K., & Xie, Y. (2015). Game-based learning engagement: A theory- and data-
driven exploration. British Jour. of Educational Technology, 47(6), 1183–1201.
https://doi.org/10.1111/bjet.12314

127
Appendix D

128

129
CHAPTER 6. SUMMARY AND RECOMMENDATIONS FOR FUTURE WORK
6.1 Summary
The issues facing the world’s FEW systems requires the use of progressive active
learning strategies to prepare the future workforce to address complex problems. SEGs
have been identified as a potential vector to teach systems thinking, improve retention,
and increase student engagement (Adachi &Willoughby, 2013; Dede, 2009; Grund &
Meier, 2016; Ke, Xie, & Xie, 2016; Wouters, van Nimwegen, van Oostendorp, & van der
Spek, 2013). The implementation of SEGs can be challenging due the variability in
design and the balance of educational and entertainment content. This thesis addressed
several issues identified during the development of the agricultural SEG, Agpocalypse
2050, including the integration of a scientific model into SEG design, evaluating
undergraduate students’ systems thinking capacity using systems thinking research
instrument, and measuring learning outcomes from a game-based learning activity.
Chapter 2 investigated the development of a theoretical framework to implement
scientific models into SEG design. Integrating scientific models into the educational
game ensured the principles being displayed to students were scientifically accurate and
introduced students to how scientific models solve complex problems. The framework
presented in this chapter addressed three important steps in the implementation process
including the identification of an appropriate scientific model, selection of player
decision points, and the development of a scoring system for evaluation. The final
framework illustrated how these steps fit into the developmental and game domains, and
provided a baseline methodology for producing SEGs around scientific models.

130
Chapter 3 addressed the exploration of using the systems thinking instrument
designed by Evagorou et al., (2009) to measure undergraduate systems thinking capacity.
The instrument provides feedback on seven attributes of successful systems thinkers
including the identification of system elements, spatial boundaries, temporal boundaries,
subsystems, system interactions, pattern recognition, and feedback loops. The instrument
was designed for 5th grade students ages 11-12 and we needed to evaluate junior
undergraduate students. Due to the time requirement to fill out the survey, we split the
attributes into two groups 1) identification of system elements, spatial boundaries,
temporal boundaries, and subsystems and 2) understanding of systems interaction, pattern
recognition, and feedback loops. The attributes were split into these two categories as it
represented a natural divide between testing system “identification” vs complex system
“understanding”. Our initial research only evaluated student capacity for the first group
of identification attributes.
Two studies were performed which evaluated student feedback to taking the
research instrument, changes in their systems thinking capacity following an intervention,
and trends in the answer responses. The findings from the studies indicated that the
research instrument did capture students’ systems thinking capacity in the first four
attributes. Students did not like the length of the instrument, especially if they were
required to take it twice within a short time frame. Students put in significantly more
effort on their first attempt resulting in lower systems thinking scores in all four
categories on their second attempt. To address this issue the time requirement of the
instrument was shortened and the time between the pre-post instruments was lengthened.

131
The instrument is currently being tested in a third course, but the data will not be
collected in time for inclusion in this thesis.
Chapters 4 and 5 described the findings of testing the game-based learning
activity, Preservation, in two engineering undergraduate courses. During the activity,
students played the board game Preservation and received one traditional lecture on
environmental sustainability and game theory. Students took a survey instrument for
systems thinking and environmental sustainability pre-post-intervention for the 1st
Preservation study. The instruments were altered following the study due to feedback
from students and trends seen in the data. For the 2nd Preservation study, students took a
systems thinking research instrument pre-post-intervention and a retrospective
environmental sustainability research instrument post-intervention. The findings from the
2nd study showed relevant changes in student understanding of the CWEB nexus and
environmental sustainability. There was not, however any change in the students’
capacity for systems thinking nor was there any difference between students that received
lecture only or game + lecture. Feedback from students in the 2nd Preservation study
have led to additional changes in the instrument design and timing of the instruments. A
3rd Preservation study is currently in progress to evaluate instrument changes from the 2nd
Preservation study, and to investigate how a longer intervention impacts systems thinking
awareness.
6.2 Recommendations for future work
There are several areas of future work that are necessary to test and validate the
game, and to provide additional empirical evidence on SEG learning outcomes after
Agpocalypse is fully developed. Several of these topics will be specific to our game,

132
however design strategies presented can be extrapolated for use in other SEG design
testing.
6.2.1 Theoretical framework for the integration of scientific models into SEG design
The theoretical framework for integrating scientific models into SEG design
described a procedure for selecting player decision points and the development of a
scoring system to evaluate their understanding of the learning objectives. This procedure
was developed to ensure the decision points focus upon the learning objectives and the
score can measure if those objectives are being met. Upon the completion of
Agpocalypse 2050, game testing needs to be performed to evaluate if this framework
achieved these goals. This includes isolating the decision points for each learning
objective, their associated score, and comparing the scores to student actual
understanding of each objective. Actual understanding should be tested using traditional
metrics for each of the objectives. Ideally, students with the highest game scores will
have the greatest understanding of the learning objectives. The results of the game testing
will provide empirical evidence of the framework’s usefulness in game design, identify
learning objectives in Agpocalypse 2050 that are not being met, and guide refinement of
the weights in the game’s scoring system.
6.2.2 Serious Educational Games in the Classroom
Serious educational games have been rapidly expanding in the last decade.
However, due to the newness of its expansion, additional empirical evidence is necessary
to validate their effectiveness as an educational tool (Hainey et al., 2016). Upon
completion, Agpocalypse 2050 is a perfect vector to provide evidence in many of these

133
areas. This section will address several areas that have been identified as needing
additional research and potential design implementations to achieve them.
6.2.2.1 Serious Gaming Research Questions
This section covers several research questions that have been posed by our team
to look at the impact of serious games in education. The purpose of these questions is to
explore the potential of video games in the classroom in comparison to other teaching
approaches, and to determine what topics or circumstances lend themselves to serious
game activities.
1. Do video games bridge the gap between learning and doing?
A common challenge in education is to teach students how to apply the information they
learn. This is especially prevalent in the math and science fields where students are taught
the theoretical principles of how the world works, but have limited access to test those
interactions. By their nature, gaming environments are designed to let players explore and
perform actions in an alternate reality that models the real world. Game environments
could thus be tested on their ability to teach players the application side of coursework. If
successful this would provide an alternative teaching mechanism for topics that are too
expensive or dangerous to recreate in the real world.
2. Do video games help players understand domain knowledge of a previously
unexplored topic faster than traditional teaching methods?
When people are introduced to a new topic there is a sharp learning curve to acquire
domain knowledge before they can begin to problem solve. This can be a sticking point
in the educational realm where most courses start out with several weeks of background
information before they enter into the actual topic of the course. It can also be a challenge

134
for jobs with high turnover as employers are constantly training new employees. The
visual component of videos games provide an excellent vector for illustrating complex
topics and improves retention of information. These attributes can be used to rapidly get
players past domain knowledge to the problem solving stage where they can begin to
make valuable impact.
3. How does the gaming experience differ from other hands-on-learning
activities? What circumstances lends to each type?
The educational field is pushing educators to use active learning strategies. However,
there is little guidance on choosing which active learning strategy fits best in different
circumstances and topics. A study that compares the outcomes of various active learning
strategies would provide clarity to their differences and when it is appropriate to use
them.
4. Does the inclusion of video games make the classroom more interactive? How
much of this interaction is meaningful? What features of games lead to quality
interactions?
Many traditional lectures consist of educators lecturing on a topic while students take
notes. This type of educational format does not allow for quality interactions with the
educator or between students. A study could assess the impact of video games in the
classroom on interpersonal interactions. Video games are often seen as solitary
experiences, however there are games that require collaboration between players. The
entertaining aspect of the games may also cause discussions to break out after the play
experience to investigate how each person navigated the game challenges.
6.2.2.2 Implementation Design for Agpocalypse 2050

135
Up to this point, the only classroom game testing that has occurred is with our
board game, Preservation. An extensive amount of testing is necessary to validate
Agpocalypse 2050 to ensure learning objectives are met. Due to the length of play time,
testing the game in traditional educational formats may be challenging. The full game
teaches a vast array of topics which would require several months of class time to cover.
Thus, the strategy suggested in this thesis is to break the large game into smaller
simulations that focus on a single important concept. For example, the cropping scene
can be extracted from the game allowing educators to teach about irrigation, fertilizer
use, crop rotation, or other agricultural management scenarios. This simulation would be
designed for 50 min, and constraints would be made to the controls to limit the actions
available to players. This is much easier to implement in the classroom as it requires less
time to introduce and play the game. It also allows educators to choose which topics they
would like to incorporate in their classroom to best align with course content.
The simulations should be split into two types: mission-based and comparison-
based. In mission-based, the simulations begin with a task or mission the players need to
complete. The mission focuses the players’ actions and specifies the bounds of the game.
Example missions include producing the most grain in 5 years, producing the most
energy efficient grain, formulating the least cost ration for cattle, etc. Every member of
the class is given the same task with the goal of accomplishing it. Mission-based goals
are a great way of assessing student understanding as everyone has the same initial
conditions meaning their actions are the only distinguishing factor to the results.
Comparison-based simulations split the class into two groups, where each group
has a different game feature the simulation is comparing. For example, group A could be

136
farming in eastern Nebraska and group B farms in western Nebraska. Following the
simulation players come back together and discuss how the differing game feature
impacted the results. The focus of comparison based simulations is on exploration rather
than performance. It allows the players to visualize the cause and effect of different initial
conditions or management practices improving their understanding going forward.
Implementation design is critical to the successful integration of game-based
learning activities in the classroom. The activity needs to fit into the existing educational
frameworks and cover a topic that is currently part of the curriculum. The students need
to be able to pick up the activity quickly, meaning it must have simple controls that are
intuitive for the user, and does not require a lot of background information. Finally, the
educator requires a built in mechanism to evaluate students’ actions, such as a scoring
system or game log.
6.2.3 Systems Thinking Instrument
The systems thinking instrument designed by Evagorou et al., (2009) has received
three iterations of changes with the most recent iteration currently being tested in a junior
undergraduate energy seminar course. Previous findings indicated students did not like
the time requirement of filling out the instrument, especially when they were required to
fill it out twice in three days. The current test reduced the time requirement of the
instrument and implemented it at the beginning and end of the semester. Additional
efforts are necessary to test the final three attributes with undergraduate students. Once
all seven attributes have been tested with undergraduate students, the SEG activities
developed in the INFEWS project should be evaluated on their ability to improve systems
thinking in students. Analysis should include changes in systems thinking capacity based

137
on activity, activity type, time requirement, topic, and if a combination of teaching styles
was given.
6.3 Conclusion
This thesis investigated several topics identified during the development of the
agricultural SEG, Agpocalypse 2050, including the integration of a scientific model into
SEG design, using a research instrument to measure undergraduate students’ capacity for
systems thinking, measuring learning outcomes from a game-based learning activity, and
future research for SEGs. The findings from this research bolster efforts for using serious
games in education, expand our current understanding of the FEW system, and set the
stage for a workforce capable of solving next generation problems.
6.4 Acknowledgements
The authors thank the National Science Foundation (NSF) for funding this project
within the Innovations in the Food, Energy, and Water Systems (INFEWS) program,
Award Number 1639478. The authors would also like to acknowledge Eesh Gupta for his
contribution on the project. His insight led to the research questions listed in the Future
Works section. The authors would also like to thank Professors Dr. Deepak Keshwani,
Dr. Jeyam Subbiah, and Dr. David Jones for allowing our research team to incorporate
the Preservation activity in their classes.

138
References
Adachi, P. J. C., & Willoughby, T. (2013). More than just fun and games: The
longitudinal relationships between strategic video games, self-reported problem
solving skills, and academic grades. Journal of Youth and Adolescence, 42(7),
1041–1052. https://doi.org/10.1007/s10964-013-9913-9
Dede, C. (2009). Immersive interfaces for engagement and learning. Science, 323(66),
66-69. doi:10.1126/science.1167311
Evagorou, M., Korfiatis, K., Nicolaou, C., & Constantinou, C. (2009). An investigation
of the potential of interactive simulations for developing system thinking skills in
elementary school: a case study with fifth‐graders and sixth‐graders. International
Journal of Science Education, 31(5), 655-674.
https://doi.org/10.1080/09500690701749313
Grund, C. K., & Meier, M. C. (2016). Towards game-based management decision
support: Using serious games to improve the decision process. In D. Stelzer, V.
Nissen, & S. Straßburger (Eds.), Proceedings of the Multikonferenz
Wirtschaftsinformatik (MKWI) 2016 (pp. 155–166).
Ke, F., Xie, K., & Xie, Y. (2016). Game-based learning engagement: A theory-and data-
driven exploration. British Journal of Educational Technology, 47(6), 1183-1201.
https://doi.org/10.1111/bjet.12314
Wouters, P., van Nimwegen, C., van Oostendorp, H., & van der Spek. (2013). A Meta-
Analysis of the Cognitive and Motivational Effects of Serious Games. Journal of
Educational Psychology, 105(2), 249-265. doi: 10.1037/a0031311

139
APPENDIX E: SUPPLEMENTAL INFORMATION
WRONG GAME, WRONG MESSAGE
Eesh Gupta1, Nathan Rice2, Jennifer Keshwani3, and Ashu Guru4
University of Nebraska – Lincoln
Lincoln, NE
Acknowledgements
The authors thank the National Science Foundation (NSF) Innovations at the Nexus of
Food, Energy and Water Systems (INFEWS) program for funding this work and other
related projects under Award Number 1639478. The authors also appreciate the
assistance of Capri Keeler and Alli Hauger in developing and designing Preservation.
(1) Eesh Gupta
Class of 2019
Edison High School
Edison, NJ
(2) Department of Biological Systems Engineering
(308) 631-5449
Chase Hall 14
Lincoln, NE 68583-0700
(3) Department of Biological Systems Engineering
(402) 472-9614
Chase Hall 249
Lincoln, NE 68583-0726
(4) Nebraska 4-H
(402) 472-4543
Ag Hall 114
Lincoln, NE 68583-0700
Submitted to Journal of Extension. Status: Under Review.

140
Wrong Game, Wrong Message
Abstract
Video games allow students to visually explore new worlds, and have been linked to
positive advances in problem solving, fact recall, and motivation. Choosing a game that
aligns with educational objectives can be challenging due to the host of games on the
market and the balance between education and entertainment. This paper uses a case
study to present guidelines for educators on how to evaluate if an educational game
accurately represents the learning concepts. Important factors include game imagery,
interactions, score, and game-play. Evaluating educational games is a critical step to
ensure that students are building the correct mindset.
Keywords: Game-based Learning, Extension, Video Games, Selection Guidelines, Case
Study
Introduction Gaming environments have a long history of being used in extension education (Bauer &
Ogg, 2011; Cason, Wenrich, & Lv, 2005; O’Neill, 2008; Rollins & Watson, 2017;
Weitzenkamp, Dam, & Chichester, 2015; Wittman, 2010). Grieshop (1987) argued that
extension should aggressively explore educational games as they have some advantages
over traditional teaching methods. For example, video games allow players to create
worlds and govern them by their decisions (Gee et al., 2003). Such autonomy allows
students to learn by experimenting (Waddington, 2015). In addition, students show more
engagement and enthusiasm about learning when interacting directly with a virtual reality
(Annetta, Minogue, Holmes, Cheng, 2009). Video games have been reported to improve
fact/recall processes and problem solving skills (Chuang & Chen, 2009), and previously
alienated students were also able to emotionally connect with video games (Squire,
2008).
More educators are searching the market for video games to supplement their curriculum
(Johnson, Becker, Estrada, & Freeman, 2014). However, educators are presented with a
large number of games from which to choose. The goal of this paper is to develop
guidelines to select a game-based learning environment that aligns with classroom
learning objectives and prevents content misconceptions. The guidelines include the
following constructs (i) imagery, (ii) game interactions, (iii) scoring system, and (iv)
game-play. Our assumption is that evaluating games with these constructs is critical for
successful implementation of game-based learning activities in the classroom.
An irrigation game will be used throughout this article as a case example. The game was
developed to help students understand the variables that impact irrigation practices
including soil type, wilting point, and field capacity.
Imagery Game imagery consists of a game’s graphical content. The graphical content enables
players to visualize complex concepts and impacts player engagement. The phrase, “A
picture is worth a thousand words,” stems from the effectiveness of images to explain a
topic, and the ability to remember information in picture form. However, when an image

141
displays incorrect information, these attributes can be detrimental to student learning. The
student will associate and visually recall the incorrect concepts. For example, an early
iteration of the irrigation game visually misrepresented how soil water saturation behaves
in the crop root zone (Figure 1).
Visual flaws can be detected by consulting an expert on the message the visuals impart; a
search engine may also be used to find images of the underlying concept within the .edu
domain. This is a method of crowdsourcing the opinion of thousands of people on how
the underlying concept has been visualized.
Figure 1. Imagery Misrepresentation
Caption: The blue pin marked the soil water as a percentage. However, the pin moved up
and down, making students think this represented a water table line; i.e. everything above
the pin is dry and everything below the pin is saturated. In reality, a percentage of the
pore space across the soil matrix is filled with water.
Game Interactions Game interactions consist of the decisions made by the player. Game interactions engage
a player by giving freedom to manipulate variables. A universal trend in gaming is to
exaggerate real life events to add entertainment or fit the game’s spatial/temporal
constraints. The key for an educator is to determine when these exaggerations are ok and
when they reinforce incorrect information. For example, the irrigation game originally
required applying water rapidly to maintain soil saturation (Figure 2). This led students to
severely overestimating the number of times during a growing season that farmers
irrigate their crops.
It is critical to evaluate the topic of the exaggeration when evaluating if it is acceptable.
When a topic is well known to the audience it won’t impact their understanding when
gameplay is exaggerated. For example, students in the Midwest are familiar with the
impacts and frequency of tornados. If the exaggerated topic in a game is focused on
tornados, the game players have a baseline understanding of tornadoes and the gameplay

142
exaggeration is inconsequential. However, if the exaggerated topic is more advanced or
unknown, such as a microbiological pathway, this could be the players’ first experience
with the interaction. Maintaining scientific authenticity then becomes essential.
Figure 2. Game Interaction Misrepresentation
Caption: To increase water saturation, a player presses the spacebar to add water to the
soil matrix. Rapidly pressing the spacebar was required to maintain the soil moisture
level. This led students without a background in farming to believe hundreds of irrigation
events were required for producing crops
Score
A distinguishing characteristic of games is that they contains an attribute that allows
game players to know if they won, usually seen as a score. The score gauges “success”,
and allows players to compare their actions with other players. For most individuals this
builds an intrinsic motivation to win. From an educator’s perspective, the score dictates a
large portion of the player’s motivation. Player behavior will trend towards the actions
that result in a favorable score. These actions will be emphasized by the game as the
“Correct” response and should be the actions educators want the students to perform.
Rewarding spacebar pressing speed is an example from the irrigation game of a player
action that was contrary to the desired learning outcomes (Figure 3). An alternative
scoring system must be developed or a different game needs to be chosen if the actions
that lead to the winning score are not the actions the educators would like the players to
perform.
Figure 3. Score Misrepresentation

143
Caption: The winning score for the irrigation game was the player who could rapidly
press the spacebar enough to maintain within the green zone for the longest period of
time. This encouraged gameplay with no regard to water usage or the energy requirement
for irrigating. Both significant factors for sustainable agriculture.
Play the Game An important way for an educator to assess the quality of a game for education is to play
it. By playing the game, the educator is able to assess what learning concepts are
achieved. Overall, it is a good check against potential flaws in all the other constructs that
we discussed above and the conceptual game content. If the game is not played by the
instructor prior to introducing it to students, the educator risks teaching material that may
be tangent to the learning objectives. Similarly, the educator can share the game with
non-experts and gain feedback on what they learned. This simulates the students’
experience and prevents internal bias from impacting the results. Always remember that
no matter how great or terrible a game looks on paper, it is the outcomes of playing that
matter.
Summary When correctly selected, video games are a visual and interactive tool which provide
enrichment to the classroom experience. However, choosing a game that aligns with the
desired learning objectives can be a challenge. The guidelines presented in this paper
identify game factors that have a significant influence on the learning outcomes students
receive. Taking the time to evaluate how games are designed is a critical step to ensure
information is not being misrepresented to students.
References
Annetta, L. A., Minogue, J., Holmes, S. Y., & Cheng, M. T. (2009). Investigating the
impact of video games on high school students’ engagement and learning about genetics.
Computers & Education, 53(1), 74-85.

144
Bauer, E., & Ogg, C. (2011). Pest private eye: Using an interactive role-playing video
game to teach about pests and integrated pest management. Journal of Extension, 49(1),
Article 1IAW4. Available at: https://joe.org/joe/2011february/iw4.php
Cason, W. L., Wenrish, T. R., & Lv, N. (2005). Nutrition Mission--A multimedia
educational tool for youth grades 4 – 6. Journal of Extension, 43(3). Article 3TOT5.
Available at: https://www.joe.org/joe/2005june/tt5.php
Chuang, T. Y., & Chen, W. F. (2007, March). Effect of computer-based video games on
children: An experimental study. In 2007 First IEEE International Workshop on Digital
Game and Intelligent Toy Enhanced Learning (DIGITEL'07)(pp. 114-118). IEEE.
Gee, J. P. (2003). What video games have to teach us about learning and literacy.
Computers in Entertainment (CIE), 1(1), 20-20.
Grieshop, J. I. (1987). Games: powerful tools for learning. Journal of Extension, 25(1),
1IAW2. Available at: https://www.joe.org/joe/1987spring/iw2.php
Johnson, L., Adams Becker, S., Estrada, V., & Freeman, A. The NMC Horizon Report:
2014 Higher Education Edition [Internet]. Austin (US): The New Media Consortium;
2014 [cited 2013 October 10].
O’Neill, B. (2008). Financial simulations for youth adults: Making the “Real world” real.
Journal of Extension, 46(6). Article 6TOT4. Available at:
https://joe.org/joe/2008december/tt4.php
Rollins, J., & Watson, S. L. (2017). A salamander tale: Effective Exhibits and attitude
change. Journal of Extension, 55(3), Article 3RIB2. Available at:
https://www.joe.org/joe/2017june/rb2.php
Squire, K. D. (2008). Video games and education: Designing learning systems for an
interactive age. Educational Technology, 17-26.
Waddington, D. I. (2015). Dewey and video games: From education through occupations
to education through simulations. Educational Theory, 65(1), 1-20.
Weitzenkamp, D., Dam, K., & Chichester, L. (2015). Developing a mobile extension
course for youth livestock producers. Journal of Extension, 53(2), Article 2IAW6.
Available at: https://www.joe.org/joe/2015april/iw6.php
Wittman, G. (2010). Video gaming increases physical activity. Journal of Extension,
48(2), Article 2TOT6. Available at: https://joe.org/joe/2010april/tt6.php

145
PRESERVATION BOARD GAME MATERIALS
Purchase Preservation at: https://www.thegamecrafter.com/games/preservation
Preservation board game top box image.
Preservation board game bottom box image.

146
Preservation Board Game Rule Book Pages

147

148

149

150

151
Preservation Board Game Tiles: Front

152

153
Preservation Board Game Hazard Card: Front

154

155

156

157

158

159

160
Preservation Board Game Advancement Cards: Front

161

162

163

164

165
Preservation Board Game Career Cards: Front

166
Preservation Board Game Card Backs
Advancements Back Hazards Back Game Cards Back
Game Tiles Back
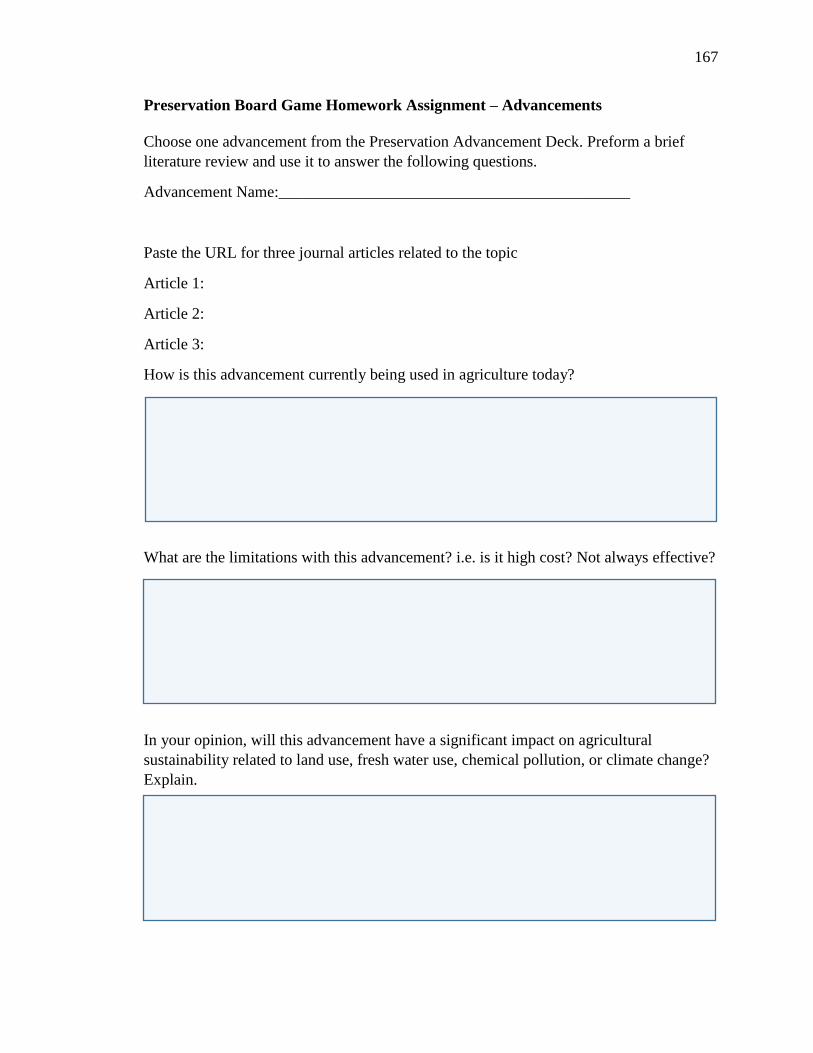
167
Preservation Board Game Homework Assignment – Advancements
Choose one advancement from the Preservation Advancement Deck. Preform a brief
literature review and use it to answer the following questions.
Advancement Name:____________________________________________
Paste the URL for three journal articles related to the topic
Article 1:
Article 2:
Article 3:
How is this advancement currently being used in agriculture today?
What are the limitations with this advancement? i.e. is it high cost? Not always effective?
In your opinion, will this advancement have a significant impact on agricultural
sustainability related to land use, fresh water use, chemical pollution, or climate change?
Explain.

168
Preservation Board Game Homework Assignment – Hazards
Choose one hazard from the Preservation Hazard Deck. Preform a brief literature review
and use it to answer the following questions.
Hazard Name:____________________________________________
Paste the URL for three journal articles related to the topic
Article 1:
Article 2:
Article 3:
How is this hazard currently impacting agriculture today?
What are some of the preventions mechanisms used to alleviate this hazard?

169
Beef or No Beef
Team Member Names:
_________________ _________________ __________________
_________________ _________________ __________________
Circle Argument Side: Beef OR No Beef
Beef or no beef is a group project where the class is split into two teams to debate
the sustainability of the beef industry in Nebraska. You will have 3 weeks to research and
collect evidence to defend your side. The final debate will occur in class on November
14. The purpose of this assignment is to bring together all of the concepts you learned
this semester to evaluate sustainability. Thus, your argument should consist of science
based evidence, LCA information, and a final sustainability score for Beef and No Beef.
This project will also test your ability to comminute information clear persuasive manner.
This document contains several questions that you must answer and turn in on
November 14. These questions are meant to guide your research and ensure you have all
the necessary components in your final debate. We understand that not all of you may
have a large background with the beef industry so we provided several hints on what to
research. This is not an exhaustive list. We will also be having a work day on November
7 to put the finishing touches on your arguments and to answer any questions.
Good Luck!

170
Life Cycle Assessment:
You are required in your final argument to provide evidence from an existing LCA on the
beef industry. You do not need to create this LCA. There are LCA’s online that have
already been developed.
What LCA did you use?
LCA’s Name:__________________________________________________________
Which side is this LCA bias to? Beef or No Beef? Explain.
Are there any significant elements left out of the LCA? List at least two. Would these
change the result?
With this bias, in the real world does this LCA provide value? Would you use it? Explain.

171
Sustainability Score: Based on your research and the LCA give a SScore for Beef and NO
Beef
Beef
Societal Justification:
Economic Justification
Environment Justification

172
No Beef
Societal Justification:
Economic Justification
Environment Justification

173
Hints
We understand that not all of you may have a large background with the beef industry so
we provided several hints on what to research. This is not an exhaustive list.
Beef - Positives
1. Quality protein
2. Taste
3. Manure for crops
4. Converts grass to edible food
5. Quality jobs not requiring college degree
6. Secondary products – there are many
7. Influence on Midwest economy
8. Pleasantly aesthetic grasslands
9. Microbiology added to grasslands and grazing to improve plant populations
10. Side products able to be as animal feed – example Distiller grains from ethanol
Beef - Negatives
1. Low feed conversion rate
2. High water usage
3. Greenhouse gases – methane
4. Feedlot runoff
5. Feedlot smell
6. Feedlot dust
7. Animal rights
8. Antibiotics and hormones
9. Land lost that could be used for human food
10. Long time to produce one beef

174
Debate Structure
Each side will present their case in the format listed below. Following round three, the
judges will discuss and award the winning team.
Round 1: Opening Arguments
Beef – 6 min
No Beef – 6 min
Round 2: Questioning
Beef Questions No Beef – 6 min
No Beef Questions Beef – 6 min
Round 3: Closing Arguments
Beef – 3 min
No Beef – 3 min
Panel Discussion: 5 min - Winner announced
Class Discussion: 10 min

175
Game Theory Lesson Plan
INFEWS Lesson Plan
Grade/ Grade Range: 9th-12th Name of Activity: GAME THEORY Time Needed: ~30 minutes
Brief Description: Our goal is to explain the concept of game theory, or choosing the option that is best for the entire group. This concept is explained through a series of two exercises that both relate to economy in agriculture. The first exercise involves selling corn a certain amount of days after harvest, but the trick is anticipating the people around you because the most profitable time to sell corn depends on when everyone else sells their corn. The second activity is the “Farmer’s Market Dilemma” which introduces the idea of cooperating or not cooperating to advertise for selling tomatoes at a farmer’s market. This activity explains that you must win as a team to win individually.
Performance Expectation(s) (What students should be able to do after instruction?): 1. Understand how to calculate 80% of the average. 2. Identify situations where it is necessary to win as a team to win individually. 3. Identify ways they can collaborate with their fellow peers to create the best outcomes.
Learner Outcome(s) (What will the children learn?): 1. How to predict and understand other’s thinking around them. Once practice is acquired in this game, students
will become more advanced and use critical thinking skills to make decisions based on the actions of others. 2. How to make decisions where both parties benefit from the outcome. 3. Teamwork is necessary to solve large issues that involve lots of people. Without collaboration only very few
people would ever “win”.
Possible Preconceptions/Misconceptions: 1. Game theory is not the easiest option, nor the safest. The parties involved which most likely pick the more
selfish of the two options in the grid, would benefit more from cooperation, but instead there is a median value that puts the person less at risk, which ensures the most safety, but also guarantees a loss in total revenue.
Learning Methods Utilized:
Experiential: Hands-on experiences that are highly social in nature. X Inquiry-based: Hands-on experiences that provide evidence about phenomena in the world. X Life Skills: Assist learners in functioning well in the environments in which they live focusing on:
X Thinking X Managing
Relating
Caring
Giving X Working
X Living
Being
Safety Precautions (if needed during program delivery): N/A
LESSON SECTIONS
ENGAGE:
How to generate interest & learner curiosity
How to connect with learner current understanding
How to encourage learner to raise their own question
How to encourage learner to share & compare ideas with others a. Discussion is encouraged during the first and second activity. When the students are choosing
numbers, it is a good idea to inquire about other students’ numbers in order to choose a number for yourself that you believe will win.
b. Class discussion is necessary for the participation and understanding of students during the

176
second activity with the Farmer’s Market Dilemma. Ask students to discuss their decisions whether to advertise or not advertise with the other students around them and why they made that decision. Everyone should have different thoughts and perspectives because when it comes to game theory, there is not one correct final answer.
EXPLORE:
List of interactions with materials and ideas that may be facilitated through group discussions among learners
Examples of different ways to solve a problem or frame a question
Observations, experiences, and outcomes for learners to notice and/or document
How to encourage learner to share & compare their observations, experiences, and outcomes with others a. Lead into a discussion about how game theory is based off the entire team winning instead of just
one person. This will be a crucial aspect of the game we play at the end of these lessons because they only way to win involves teamwork.
EXPLAIN:
Explain concepts and ideas
Important vocabulary, labels, terminology, and formal language o Game Theory: The idea of winning as a team in order to win as an individual.
ELABORATE:
List of other applications and extensions of learned concepts c. How do we make decisions? Are they based off other’s decisions or do we make our own based
solely on ourselves? How can we strive to make decisions that benefit humanity as a whole? This is a direct link into Systems Thinking.
EVALUATE/REFLECT: a. Questions (Questions to ask the children during and after the lesson. Be sure and include the answers.):
- What is the concept of Game Theory? The idea of winning as a team before winning as an individual. - What was the best decision for the group as a whole in the Farmer’s Market Dilemma? Advertising - Are humans raised and programmed to choose the best option for the group? No, this is why the concept of game theory is extremely important to learn and know.
b. Discussion Topics: - When playing “Eighty Percent of the Average”, how did you know what number to choose based off your peers? - In Farmer’s Market Dilemma, why are both options appealing? Discuss both perspectives: advertising and not advertising. - How does the concept of Game Theory relate to your life outside of this activity? Give a few examples. - When was the last time you did something that benefitted everyone around you instead of making the best decision for yourself? Can those sometimes be the same decision? (Yes) Can those sometimes be very different decisions? (Yes)
c. Projects/Activities (This could be paper activities like a coloring sheet, puzzle, songs, You Tube, etc.): 1. Eighty Percent of the Average Activity 2. Farmer’s Market Dilemma
REFERENCES & OTHER MATERIAL (Be sure and cite your references…i.e. 4-H project books, web sites, etc. Include books that can be read with children for this lesson.) https://www.youtube.com/watch?v=t9Lo2fgxWHw http://www.math.cornell.edu/~mec/2008-2009/Anema/games.html https://www.nais.org/magazine/independent-teacher/fall-2014/game-theory-in-math-class/ Supporting material: This website provides an excellent interactive explanation of Game Theory. If your class has access to a computer lab, it is highly suggested that this activity is completed along with the material presented above. http://ncase.me/trust/

177
GAME THEORY CURRICULUM
“Eighty Percent of the Average”
Teacher: This is a guide for a group activity/ discussion you will have with your
class. The following information should be shared with your students.
Set the Scene: You grow corn for a living. In the fall, you harvest your corn and
store it in silos located on your farm. You then choose how many days after
harvest to sell your corn to the local elevator. You may sell your corn any time
from one day after harvest is completed to 100 days after harvest is completed.
The price you receive for your corn will depend on when you sell and market
conditions at the time. Research has shown that the most profitable time to sell is
80 percent of the time that all farmers, on average, sell their corn. For example, if
there are four farmers and they sell 40, 50, 60 and 70 days after harvest, the
average time of sale is 55 days after harvest. The optimal time to sell is 0.8*55,
or 44 days after harvest.
The Activity: Each student should have a piece of paper. Tell each student to
choose a number between 0 and 100 to represent the number of days after
harvest they plan to sell. They can discuss with the people around them if they
want to, but this is not required. Write each of the numbers on a board or large
piece of paper and pick a volunteer to calculate the average and eighty percent
of the average. The student whose guess was closest “wins” and becomes the
most efficient famer that year. (If playing another round, this student can guess
two numbers in the next round.) After the first round, prompt the class or more
specifically the “winners” about their strategy. Play ~3 rounds so the students get
a full understanding.
Tying it all Together: The purpose of this exercise is to teach students that the
goal of game theory is to anticipate not only their own actions, but also the
actions of others as well. Similar to being “one step ahead of the game” it is
important to think not only about yourself, but base your actions off what others
will do.
“The Farmer’s Dilemma”
Teacher: Ask two students to come up to the front of the classroom space.
Student 1 and Student 2 can be known in this scenario as Bob and Sarah
(change names accordingly).
Set the Scene: Bob and Sarah are both farmers that sell their bushels of
tomatoes at the local farmer’s market. They each sell around 20 baskets every
Sunday for $5 a basket. As a way of getting more customers, they each decide to
consider advertising which costs $30 per week to pay for fliers and an online ad.

178
Their options for advertising and not advertising create the “Farmer’s Market
Dilemma” (below).
The Activity: Ask the two students at the front of the room to stand back to back.
On the count of three they either hold up a one or a two, but continue to stand
back to back. One finger represents no advertisements for their tomatoes at the
farmer’s market. Holding up two fingers represents advertising. Record the
“score” of each farmer on the board or a large poster. Repeat this process 5
times and tally up the final scores of each farmer. What was the number chosen
most frequently? Did the famers choose to advertise or not advertise based off
their knowledge of the cost and revenue?
Complete 2-3 rounds of this activity based on class participation and interest with
two different students each time. At the end of the three rounds, compare the
revenue of each farmer. Who had the highest revenue? What was their strategy?
Ask the students what strategies they used.
Tying it all Together: When looking at the chart, it is obvious to the viewer that
both farmers would benefit more from not advertising at all in a single week, but
there exists the temptation of increasing sales if there is just one advertising
farmer. If the same farmer advertises and the same farmer doesn’t advertise over
the course of various weeks or months, the increase in revenue for the
advertising farmer is substantial. Both farmers, like most businesses, want to
make more money, so they will most likely pick the advertisements option. This is
because there is a 50/50 chance that the other farmer will not advertise, and the
farmer advertising will increase their profit. This is where game theory comes into
play. The idea of game theory comes from picking the choice that is best for the
overall group. As human beings we are trained to think and act in the ways that
are most beneficial to us, therefore most farmers are going to pick the advertising
option. The best scenario for both farmers is no advertising at all, but if
advertising is the way most farmers will lean, the best option for the group as a
whole is to always advertise.
The purpose of this exercise is to relay that it is important to win as a whole
group in order to win individually as well. Game theory not only applies to games,
but to everyday situations as well. A farmer may have invented a great
technology to use on his farm, but it also creates a lot of waste and pollutes the
air. It may be beneficial to his farm but will negatively affect the neighboring
farms and the surrounding atmosphere. Do the benefits of the new technology
outweigh the negative consequences? The best solution is to make a decision
that benefits the greater good, and that is the main concept of game theory.

179
FARMER’S MARKET DILEMMA
This material is based upon work supported by the National Science
Foundation under Grant No. 1639478. Any opinions, findings, and
conclusions or recommendations expressed in this material are those of the
author(s) and do not necessarily reflect the views of the National Science
Foundation.