detecting groan sources in drum brakes of commercial...
TRANSCRIPT

*Corr. Author’s Address: University of Kocaeli, Faculty of Engineering, Industrial Engineering Department, Kocaeli, Turkey, [email protected] 375
Strojniški vestnik - Journal of Mechanical Engineering 59(2013)6, 375-386 Received for review: 2012-09-24© 2013 Journal of Mechanical Engineering. All rights reserved. Received revised form: 2013-03-13DOI:10.5545/sv-jme.2012.809 Original Scientific Paper Accepted for publication: 2013-03-15
0 INTRODUCTIONS
Automotive brake noise and vibration control have become increasingly important for the improvement of vehicle quietness and passenger comfort. Groan or creep groan is a high-intensity, low-frequency noise and vibration problem that affects road vehicles at very low speeds. It usually persists for short periods of time, but a skilled driver can deliberately make it last several seconds by tuning the force exerted on the brake pedal. The original cause is considered to be a self-induced vibration of the brake components, due to the friction material characteristics that make the system prone to a stick slip behaviour [1]. Groan and moan (100 to 500 Hz) are caused by vibrations due to the dynamic instability of the wheel-brake system, as is the “howl” but at higher frequencies (500 to 1000 Hz). Groan and moan are caused by stick–slip motion between the friction material and the disc surface. The superposition of several quasi-harmonic vibrations or unsteady vibration impulse sequences of different intensities are its main features. Therefore, this phenomenon is characterized by non-linear excitation and non-linear transfer mechanisms [2]. Groan (often called creep groan) generally occurs at low vehicle speed and also occurs with cold brakes and high humidity [3]. Creep groan (low frequency frictional vibration during braking at low vehicle speed) was studied by Jang and et al. by changing the relative amounts of ingredients in a brake friction
material containing 12 ingredients. Twenty-nine friction material specimens with different relative amounts of the ingredients were manufactured according to a constrained mixture design. The difference (μ) between kinetic (μk) and static (μs) coefficients of friction for each formulation was measured to investigate the creep groan propensity of each friction material since the creep groan is caused by stick–slip phenomena. Results showed that zircon (zirconium silicate), steel wool, and phenolic resin showed a tendency to increase μ [4]. The usual method for measuring the creep groan is based on a subjective test pilot evaluation carried out on different ramp inclinations. This method is not very precise and can generate different results associated with breaking noise for different pilots. An accelerometer was installed in the caliper brake system to capture the vibration intensity by Luciano et al. [5].
The tribological contact in automotive brakes involves dry sliding contact at high speeds and high contact forces. The commonly used organic binder-type brake pad friction materials are extremely inhomogeneous and exhibit very low bulk strengths. Despite the low strength, the specific contact surfaces that form during use give the pads very good friction and wear characteristics [6]. In an automotive disk brake system, when the disk shows thermo elastic instability (TEI) at speeds over the critical one, a hot spot forms on the disk surface and local contact friction is developed between the disk surface and
Detecting Groan Sources in Drum Brakes of Commercial Vehicles by TVA-FMEA: A Case Study
Karabay, S. – Baynal, K. – İğdeli, C.Sedat Karabay1 – Kasım Baynal2,* – Cengiz İğdeli2
1University of Kocaeli, Faculty of Engineering, Mechanical Engineering Department, Turkey 2University of Kocaeli, Faculty of Engineering, Industrial Engineering Department, Turkey
In this article, the strategy followed by an automobile company for detecting the root causes of groan complaints related to rear drum brakes in commercial vehicles is presented using data collected from the sold troubled vehicles and from new vehicles from the production line, as well as the drum-brake test rig at the laboratory. Drum brake groan is often very intense and can cause large numbers of customer complaints. During a groan noise event, vehicle structure and suspension components are excited by the brake system and result in a violent event that can be heard and felt during brake application. This paper condenses experimental studies on a low frequency drum brake groan problem that has caused high warranty costs. First, the environmental conditions causing the groan were identified and the groan was reproduced. Vehicle tests were performed both at the factory and in traffic. To conclude the planned study, TVA (Total Value Analysis) and FMEA (Failure Mode and Effects Analysis) methods were used effectively. A strategy to determine the root causes was planned and implemented systematically to eliminate the secondary and tertiary effects of brake groan problems. In order to ge to the root causes, vibration and groan measurements were executed and interpreted according to TVA and FMEA charts. The sensitivity of the lining material of the brake shoes to different environmental conditions was investigated. Finally, the groan mechanism of the drum brake system is discussed and the solution to the low frequency drum brake groan problem is evaluated in detail.Keywords: Drum brake, TVA, FMEA, NVH, Friction coefficient, Brake Groan, Brake lining

Strojniški vestnik - Journal of Mechanical Engineering 59(2013)6, 375-386
376 Karabay, S. – Baynal, K. – İğdeli, C.
the pad due to the hot spot. This non-uniform contact friction worsens the local heat concentration on the disk surface and has a direct effect on the disk pad, through which it affects the oil pressure supplier of the disk [7]. Brake creep-groan is studied via a friction coupled torsional model consisting of driveline and brake subsystems. The model captures the main torsional modes of interest, while a suitable reduction of the higher degree-of-freedom models allows the selection of appropriate parameters. Numerical simulations are programmed that capture groan response with stick-slip friction and transient brake pressure [8]. Detection and evaluation of “creep groan” noise has been a challenge for NVH test groups. First, this sound typically is not purely tonal like the more common brake squeal, although ultimately it may produce a tonal subjective impression. In this work the authors study different methods that may be applied to “creep groan” detection and evaluation [9]. In Yoon et al., creep groan noise was reproduced using a chassis dynamometer. Through vibration measurements and modal impact tests, the effects of the vehicle system on creep groan noise were analysed [10]. Jung and Chung studied brake creep groan noise using a dynamometer. Their simulation results were confirmed through dynamometer testing and the groan noise contribution factor analysis between chassis components was then presented using an experimental approach [11]. Many fundamental studies have been conducted to explain the occurrence of brake groan noise in disc and drum brake systems. The elimination of brake noise, however, still remains a challenging area of research. Here, a numerical modeling approach is developed for investigating the onset of brake groan noise in a drum brake system. The brake system model is based on the modal information extracted from finite element models for individual brake components [12] and [13]. A 5-DOF non-linear model is presented to simulate the vibration of a drum brake at low frequency in the course of applying the brake. One of the main issues was the movement of the pads over the rotor fins resulting in the dynamic groan type of noise. It was important to relate this to the customer complaints of grinding [14] and [15]. In recent years, the main focus on brake groan problems has shifted from fundamental theoretical research to more practical and problem-solving oriented efforts such as TVA and FMEA [16] to [18].
1 VALUE ANALYSIS
Value analysis (VA) or total value analysis (TVA) and value engineering can be defined as an organized
and systematic approach to providing the required function at the lowest cost consistent with specific performance, quality, and reliability. Value analysis is a functionally oriented scientific method to improve the product value from the customer’s point of view with reference to the elements of the product’s cost in order to accomplish the desired function at the cost of resources deployed to produce the product. The following steps are to be followed for the value analysis.• Collect data about cost function, customer needs,
history, and likely future developments related to the product and its use. Determine the function of the product.
• Develop alternative design. The selected alternatives should be able to fulfill the functional requirement of the product as detailed above.
• Ascertain the cost of the alternatives.• Evaluate the alternatives in all respects. The
alternative which fulfills all the basic or primary value considerations and maximum number of secondary value considerations is the ideal alternative, subject to the cost consideration, which should be minimized.
• Recommend and implement the best solution. Identify the control point and devise a plan for periodic measurement of the performance and correct the deviations if any.
2 DEFINITION OF PROBLEM
During analysis via the global warranty tracking database, it became clear that something had gone wrong in August 2005 as indicated in Fig. 1. According to the records, the drum casting supplier was changed in December 2004 and then the brake shoe lining process was given to a company working in the home market in Turkey in February 2005. The vehicles built after implementation of these changes had a lot of complaints related to NVH (noise, vibration, harshness) occurring during braking. The only repair method to deal with these complaints was to replace the affected parts under warranty, however this resulted in a considerable increase in warranty cost per month for the company. The collected complaints showed that the problematic unit of the light truck vehicle was the “drum brake system”. Therefore, the company organized a team to investigate the root cause of the drum brake low frequency NVH problem. In the literature, brake noises were classified according to frequency ranges [1]. Groan is the low frequency noise 100 to 500 Hz. Thus, for a better understanding of the problem, various NVH departments of the company

Strojniški vestnik - Journal of Mechanical Engineering 59(2013)6, 375-386
377Detecting Groan Sources in Drum Brakes of Commercial Vehicles by TVA-FMEA: A Case Study
were asked for vibration and noise measurements and also interpretations of the records. The prepared flow chart for the planned studies on the affected systems and components is shown in Fig. 2. According to the chart, design verifications of all affected systems and/or components (suspension system and rear brake & drum) will be reviewed in detail to understand if there were any other design changes that may have caused the problem. On the other hand, additional studies will be performed such as: receiving the complained about parts and assembling them into a master vehicle and checking if the noise is transferred to this vehicle, as well as communicating with as many customers as much as possible in order to understand the mechanism of the groan noise and trying to understand whether the source of the problem is unique to some specific markets or climates. It is clear that groan noise in brake systems is generated by vibrations. Thus, noise and vibration occur simultaneously in a problematic mechanical system. Harshness is a combination of vibration and noises. In other words, it is an adjective given by customers after subjective assessment of a defective system. The basic reasons for the low frequency brake noise can be categorized as indicated in Fig. 2.
Thus, basically four groups of studies were planned to determine the root cause of the NVH problem shown in Fig. 3. However, the problem contains a high level complexity. Thus, the main study diagram given in Fig. 3 was constructed to evaluate data simultaneously collected from different research areas. Customer explanations related to the complaints depended on subjective definitions.
Therefore, the company should construct a test rig at its laboratory to simulate the customer’s complaints. If the required performance is not taken from the test
rig at the laboratory, the working team must perform some measurements on the vehicle with groan noise under real working conditions in order to detect NVH sources. On the other hand, the components of the drum brake and its effect on other vehicle components must be technically checked according to a plan. This plan has been organized into a fishbone diagram as shown in Fig. 4.
Fig. 2. Basic reason of brake groan
Fig. 3. Basic studies planned by the company to evaluate data simultaneously to determine root cause
3 EXPERIMENTAL STUDIES
As indicated in the Fig. 3, test studies at the company were performed in four separate areas. Each subgroup within the company had a different interest and approach to the research. The data were collected and then interpreted by the leaders of the each subgroup. The first group was interested in tracking groan
Fig. 1. Warranty cost per affected units
Strojniški vestnik - Journal of Mechanical Engineering 59(2013)6, 375-386
378 Karabay, S. – Baynal, K. – İğdeli, C.
reasons using the fish bone diagram, while the second group researched customer complaints and contacted customers directly regarding groan complaints in vehicles. The third group collected noise data from the test rig at the company laboratory, i.e. noise (groan) heard by the customer from the vehicle. The fourth study group performed an NVH test regarding groan complaints for vehicles in a real environment (in traffic) and in the factory test area. In the tests, vehicles with different bodies, suspension, and brake systems were used. The vehicle’s features are reported using data obtained from each test. All of the vehicles used in the tests had drum brakes and the general specifications are as follows: short wheel base vehicles; long wheel base vehicles; ABS vehicles; non-ABS vehicles; vehicles with a single leaf spring and rear stabilizer bar; vehicles with a double leaf spring and rear stabilizer bar.
3.1 Listening to VOC and Market Survey
By contacting the customers through the service department, the source and mechanism of the groan was researched and test drives were performed using the affected vehicles with replaced parts, then the results and interpretations were recorded. Additionally, the vehicles sold in the largest 15 countries in Europe were studied to determine whether the drum–brake groan problem is related to different climates. As a result of statistical analysis, the groan brake problem is independent regarding the countries as indicated in Table 1.
Table 1. Groan complaint in vehicles for countries where the vehicle was sold [%]
Denm
ark
Norw
ay
Spai
n
Port
ugal
Germ
any
Irela
nd
Engl
and
Czec
h Re
publ
ic
Italy
Fran
ce
Neth
erla
nd
Aust
ria
Belg
ium
2 12 20 6 8 5 4 6 8 2 11 6 10
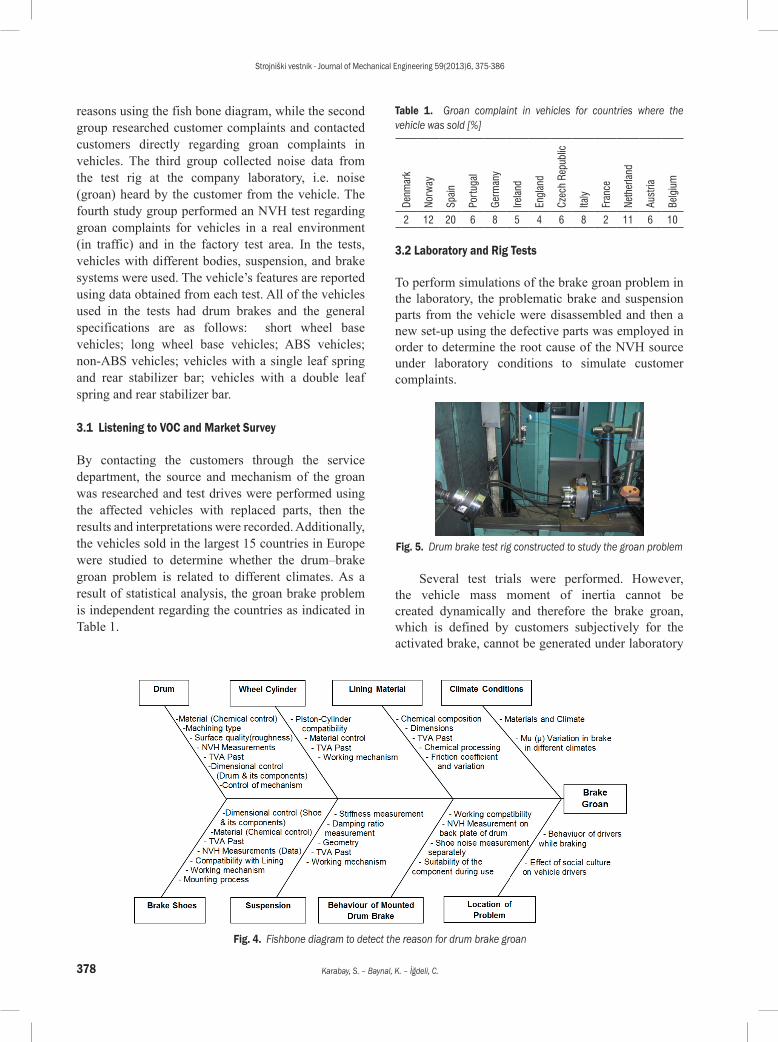
3.2 Laboratory and Rig Tests
To perform simulations of the brake groan problem in the laboratory, the problematic brake and suspension parts from the vehicle were disassembled and then a new set-up using the defective parts was employed in order to determine the root cause of the NVH source under laboratory conditions to simulate customer complaints.
Fig. 5. Drum brake test rig constructed to study the groan problem
Several test trials were performed. However, the vehicle mass moment of inertia cannot be created dynamically and therefore the brake groan, which is defined by customers subjectively for the activated brake, cannot be generated under laboratory
Fig. 4. Fishbone diagram to detect the reason for drum brake groan

Strojniški vestnik - Journal of Mechanical Engineering 59(2013)6, 375-386
379Detecting Groan Sources in Drum Brakes of Commercial Vehicles by TVA-FMEA: A Case Study
conditions. Therefore test rig studies were stopped and it was decided that all NVH measurements should be performed under real working conditions using the affected vehicles while driving on the road. The test rig constructed in the laboratory to measure drum-brake groan for commercial vehicles is shown in Fig. 5.
3.3 Determination of possible contributions to groan
All systems and components, as well as the quality of design and production processes, are reviewed within the fish bone diagram given in Fig. 4. The details of the tests performed on the systems and components are summarized below. In the fishbone diagram the most important item is the drum component of the rear brake system. Therefore, the drum was thoroughly investigated.
3.3.1 Drum
3.3.1.1 Dimensional Control of the Drum and Its Components
The main constructive parts of the rear drum brake are illustrated in Fig. 6. Here the second part of the left side is a wheel short shaft. The rear drum brake was studied in depth and some damaged surfaces on the brake table due to sharpness of corners of wheel short shaft were detected. A new technical drawing of the wheel short shaft was drafted providing a longer radius in order to decrease the sharpness of the corners. Machining of the new parts proceeded according to the modified drawing in order to eliminate contact scratches on the brake table. The more complex part in the drum brake mechanism is the brake table, which is shown in Fig. 8. 3D surface scanners were used in quality control for the machining of this part. Additionally an etalon was used for quality control of the mounting surfaces of the basic components.
Fig. 6. Drum brake and its componentsData collected for the numbered surfaces from 1 to
9 are summarized in Table 2. Here the most important machined surfaces are the surfaces coded as 7 and 8, which belong to the shoes and the wheel short-shaft. First, changes in the z axis were determined to be within acceptable limits after measuring the surfaces
as indicated in Table 2. Then controlling of the other items was started.
3.3.1.2 TVA Past
As indicated in Fig. 1 for December 2004, casting of the drum supplier was changed to optimize the total cost of the component. Thus, the item “brake drum” has a TVA past. However, the sub-contractor working with the vehicle company on machining of the drum parts was not changed. Therefore the brake components had to be checked in detail.
3.3.1.3 Chemical Content of Materials
Due to the TVA past of the drum, its chemical content was determined using spectral analysis. After checking the related parameters, it was determined that the chemical content of the material was the same as the proposed specifications of the company. Thus, this item was also eliminated as a potential root cause of the brake groan.
3.3.1.4 NVH Measurements
The natural frequencies of the former and new cast-manufactured drums were measured to see whether there were any changes in their frequency levels. The measured data are shown in Fig. 7. According to the specifications, the acceptable range of frequency characteristic function (FCF) for the drum is between 760 to 815 Hz. The new drum’s natural frequency level was 814 Hz. The natural frequency of the etalon sample is 791 Hz.
Fig. 7. Natural frequency measurementThus, the measured values of the former and new
drums are within the specified range, which means that chemical composition and natural frequency parameters can be eliminated as a potential source of the groan.

Strojniški vestnik - Journal of Mechanical Engineering 59(2013)6, 375-386
380 Karabay, S. – Baynal, K. – İğdeli, C.
3.3.1.5 Machining
Machining of the drum was performed according to the specifications shown in Fig. 9 up to the start of the research program on the brake groan problem. Fig. 9 shows that machining of surfaces A, C and E was being performed at high feed rates, while surfaces coded as B and D were machined at low feed rates. The rule defined in Fig. 9 was to eliminate axial movement of the brake shoes and its lining material from the surface of the drum when the brake was being activated. During the research program aimed at identifying the root cause of brake groan, a small change was made related to the machining procedure for the drum.
The surfaces of drum B and D were machined at high feed rates and A, C and E were machined at low feed rates as indicated in Table 3. Observations and measurements were made to determine whether there was any decrease in the number of troubled vehicles manufactured from the lines. It became obvious that the high feed rate contributes to high surface roughness.
Fig. 8. A drum brake table and its important surfaces coded with numbers for use in other component montages
A rough surface accommodates the lining material of the brake shoe to the drum very quickly. It also avoids axial displacements of the lining material with the brake shoes when the system is activated. Thus, it was understood from the same measurements that if high feeding rates are used in the machining of the middle regions, which are the contact surfaces of the lining material, then the brake groan problem decreases as shown in Table 3. However, the results did not satisfy the project team as they did not show complete elimination of the rear drum brake groan problem. The statistical measurements did not show strong correlation between drum machining and brake groan. Therefore, the drum machining method is a reason but not the basic root cause of the groan of the
Table 2. Data collected from the 3D surface scanner for the component given in Fig. 8.
SurfaceMeasured dimensions [mm] Etalon dimensions [mm] Variations [mm] Difference
[mm]x y z x y z x y z1 -66.805 81.201 -9.000 -66.805 81.201 -9.000 0.000 0.000 0.000 0.0002 -61.937 -84.693 -8.952 -61.937 -84.693 -9.000 0.000 0.000 -0.047 -0.0473 -104.661 0.822 -9.005 -104.661 0.822 -9.000 0.000 0.000 0.005 0.0054 60.842 -84.396 -8.856 60.842 -84.396 -9.000 0.000 0.000 -0.143 -0.1435 104.136 1.419 -8.883 104.136 1.419 -9.000 0.000 0.000 -0.116 -0.1166 66.948 81.497 -8.940 66.948 81.497 -9.000 0.000 0.000 -0.059 -0.0597 25.148 15.830 -2.353 25.148 15.830 -2.500 0.000 0.000 -0.146 -0.1468 -28.833 -17.116 -2.356 -28.833 -17.116 -2.500 0.000 0.000 -0.143 -0.1439 8.428 -79.032 -43.665 8.428 -79.032 -42.750 0.000 0.000 0.915 0.915
Table 3. Machining of the drums according to different feed rates and tested vehicles (Machining of B, D with high feed rates and others with small feed rates of the drum as defined in Fig. 9)
SurfaceFirst feed rate
[mm/rpm]Second feed rate
[mm/rpm]Number of vehicle
testedNumber of vehicle with brake groan
%Application
of feed rates1 0.13 0.12 1404 561 40 Small differences2 0.14 0.10 812 29 4 Small differences3 0.10 0.10 186 19 8 Constant feeding4 0.13 0.12 68 15 22 Small differences5 0.20 0.12 138 6 4 Big differences 6 0.08 0.14 219 5 2 Big differences

Strojniški vestnik - Journal of Mechanical Engineering 59(2013)6, 375-386
381Detecting Groan Sources in Drum Brakes of Commercial Vehicles by TVA-FMEA: A Case Study
brake. Thus, other possible causes were considered according to the research plan.
Fig. 9. Drum machining details
3.4 NVH Tests on Troubled Vehicles
With the help of vehicle engineering specialists, groan noise and vibration measurements in affected vehicles were performed to localize the sources of the problem and the occurrence of noise type. As described in the following sections, various kinds of NVH equipment and their accessories were used to carry out a detailed study.
The sound pressure level in-cab has been measured by mounting microphones in the ears of drivers and passengers. The location of the microphones was as shown in Fig. 10. Microphones were placed as close as possible to the ears of the passenger and driver. The type of microphones used in the measurements is the Brüel & Kjaer 4189–A–021.
Fig. 10. Microphone positioning in cabin onto driver head guard
When the vehicle was tested, all the windows were closed and the drivers and passengers were in a quiet environment. A Brüel & Kjaer microphone with type 2671 pre-amplifier was tested and calibrated up to values 93.8 dB - 1000 Hz. The NVH test of the vehicles were carried out in three stages: (1)
collecting data with accelerometers and microphones located at the outside of the backing plate, (2) taking measurements from both the leading and trailing brake shoes and (3) measurement of the leading shoe of a faulty drum brake unit. To begin with, double accelerometers were placed onto the backing plates of the left and right rear drum brakes as shown in Fig. 11. The accelerometers used were 4 mA – 100 mV/g and type 7254A–100 and 2258–100. In addition, optical readers were used to compare the collected data with the vehicle speed. Data collected for the cabin sound level and data for the backing plate acceleration were transferred to an FFT analyser for processing. Data were analysed using Head Acoustics Artemis and SQ Lab-ΙΙΙ via computer software. The vehicle used was a van type vehicle with 90 HP and steering on the right affected by brake groan. In the test, only selected vehicles with similar properties were compared. Therefore, trouble-free vehicles to be tested had the same properties as the troubled vehicle.
Fig. 11. Accelerometers mounted on the backing plate
Experiments have shown that the character of this type problem changes with time. For that reason, wavelet analysis was used to get reliable data about interpretation of the records of the brake system responses when it was activated. To get groan noise as heard by the customer, the hand brake of the vehicle was activated at the three tooth level and then in 1st gear, the vehicle was then accelerated up to 3000 rpm. Under these conditions, the groan noise was generated and recorded. The same test conditions using the same NVH equipments were applied to trouble free vehicles and the required tests were performed.
The second stage of the NVH measurement in the brake mechanism was to measure acceleration of the brake shoes. For this, accelerometers were mounted in the leading and trailing shoes as shown in Fig. 12. The color of the leading shoes is white and the trailing shoe yellow. However, records collected from the separated

Strojniški vestnik - Journal of Mechanical Engineering 59(2013)6, 375-386
382 Karabay, S. – Baynal, K. – İğdeli, C.
shoes did not yield important results. Therefore, a third trial was considered and the required set-up of the equipment was carried out. Accelerometers were mounted on the top and bottom portions of the leading (white color lining) brake shoe as shown in the Fig. 13. Then, test drives for generating brake groan noise were performed. Data collected from the last measurements show very interesting results.
Fig. 12. Accelerometers mounted on the leading and rear brake shoes
4 TEST RESULTS
Analysis of the data coming from the first and second measurements did not yield any clear conclusions. However, the third measurement study did help to explain the collected data very clearly and pointed the way to identifying root cause of the problem. In the third trial, brake groan was found to be due to an activated faulty brake, which is triggered by the front metal shoe (leading) on the both sides of the drum brake of the vehicle as shown in Fig. 13. This is why this experiment was performed with the help of two accelerometers mounted in front metal shoe (the shoe in driving direction) of the drum–brake vehicle. The recordings are presented in Fig. 14. In Fig. 14, the first row indicates the measurements of the accelerometers located in the rear drum brake shoes that are, RL-LT (rear left-leading top) measures groan noise frequencies in x, y, z directions and similarly RL-LB (rear left- leading bottom) in x, y, z directions. For the right tyre, the accelerometer measured frequencies at RR-LT in the x, y, z directions and RR-LB in the x, y and z directions. After having completed an analysis of the graphics, it can be seen that the left side of the vehicle does not have any serious problems. But on the right side, variability in the acceleration of
vibration can be clearly observed between 200 to 300 Hz. When we look at the charts for the right wheel of the vehicle, the x-axis of both top and bottom points shows the same variability. Moreover, on the y axis, the top portion includes more interaction, which hints that the source of the excessive vibration is near the brake lining. Finally all measurements performed in the tests point to something being wrong with the brake lining. In contrast to the other axes, records taken from the z axis show no big change. In the third test, the vehicle brake groan disappears spontaneously after applying the brake for a certain period of time (groan noise is completely eliminated after driving 5 km in traffic).
Fig. 13. Positioning the accelerometers in the top and bottom portions of the leading shoes
During the third trial, the frequency of the knocking groan noise occurrence at the drum brake was also measured and a continuous error mode has been detected. Although vehicle speeds and brake forces differ from each other, records show that the braking groan noise, which is heard as “knock” at each rotation of the wheel, repeats itself regularly. The knock occurs when the wheel speed was calculated to be 2.7 cycles per second, more specifically the knocking occurrence frequency is ~2.75 rotation per second. Thus, measurements show knocking at each rotation in the braking system as shown in Fig. 15. The groan noise recorded in the cabin is shown in Fig. 16. In Fig. 16, the blue line (R. Right - L. Bottom X) indicates groan noise magnitude collected from the lower portion of the brake metal shoe and the red line˝(R. Right - L. Top X) shows the data from the top portion of the same metal shoe. The green line (R. Right - Microphone) seen in Fig. 16 indicates the levels of braking groan noise measured in the cabin. Although the groan created during braking is actually very high pitched, we hear only a small portion of it due to the quite effective insulation applied to the cabin. A third trial, in addition to the studies described

Strojniški vestnik - Journal of Mechanical Engineering 59(2013)6, 375-386
383Detecting Groan Sources in Drum Brakes of Commercial Vehicles by TVA-FMEA: A Case Study
above, was performed to simulate the behavior of the brake lining and its pinned metal shoe during vibration of the braking unit. To do this, data collected using “Head Acoustics Artemis HEIM and software, 8.0” was loaded and run.
Fig. 15. Knocking period of the drum brake system
A model was established by means of “real-time operational data MeScope”. This study has attempted to understand how movement occurs between the brake lining and the metal parts. A simulation was performed with the help of data collected from the top and bottom portions of the brake metal shoe and the results have been summarized in Fig. 17. This allowed
brake lining movement in the range of 0.2 seconds to be observed.
Fig. 16. Brake groan heard in the cabin of the vehicle
According to the file describing this movement, when braking is triggered, the brake lining is trying to hold onto the drum surface due to the force applied by brake but gripping of the shoe lining to the drum surface is not occuring. The shoe lining tends to cause displacement of the pinned shoe surface. This can be described as a dynamically forced motion. Thus, after the braking force stops, the restoring forces on the
Fig. 14. Accelerometer records from the front metal shoes of a troubled vehicle

Strojniški vestnik - Journal of Mechanical Engineering 59(2013)6, 375-386
384 Karabay, S. – Baynal, K. – İğdeli, C.
braking shoe should displace the lining to its initial position. When this movement occurs, the friction coefficient between the drum metal and lining material decreases significantly and braking is performed only by pushing two different materials towards each other.
5 DISCUSSIONS OF RESULTS
According to the simulation of the behavior of the shoe and its brake lining, a new research strategy was determined for checking whether the chemical properties of the lining material changes during activation of a troubled drum brake on the vehicle. In this section, we report on the following: 1. taking a vehicle from the production line with a troubled drum brake, 2. lifting the vehicle and disassembling the troubled drum brake, 3. using two pieces of cloth and hot water to moisten the lining material on the shoes, 4. wrapping the cloth around the shoes for 5 minutes, 5. observing the surfaces of the lining material to see whether there are any changes, 6. mounting the disassembled brake parts quickly to prevent drying of the brake lining, 7. driving the vehicle under maximum control to determine whether the troubled brake makes noise and creates vibrations. Following the procedure explained above, three troubled vehicles were reserved from the production line and then driven in the test area. It has been noted and confirmed by the drive specialists that none of the vehicles makes groan noises or vibrations due to activated drum braking after moistening the shoe lining material. The chemical process parameters of the suppliers from foreign
and local markets were checked carefully before and after starting of the TVA. We finally realized that the curing process of the lining material does show some differences between the local and foreign (initial) suppliers. This curing difference creates chemical bonding changes in the material. Material cured by the local supplier is open to excessive heating and therefore overcuring occurs. This effect results in a decrease in the friction coefficients of the material and an occurrence of excessive vibration and groan noise in the brake unit. The curing parameters of the suppliers are given as a) foreign supplier: 200 seconds at 195 °C; b) local supplier: 390 seconds at 200 °C. From the analysis of the parameters applied by the suppliers, it can be clearly seen that the local supplier applies excessive heating comparing to the foreign supplier (5 °C higher heating temperature and 190 seconds longer). According to this finding, it has been decided to switch back to the original (foreign) supplier in order to keep service costs low and to keep a good brand image. The local supplier was also encouraged to correct their curing process in order to keep business in the future. General vehicle sales and customer complaints were then observed for a couple of months and these confirmed that warranty costs were decreased radically by changing the supplier. A schematic representation of all the testing and inspections are shown in Fig. 18a. The items framed with a green dotted line are within specifications. The items summarized in the boxes framed with a blue dotted line had no effect on determining the root cause of brake groan.
Fig. 17. Vibration and groan noise records of the shoe pad contact on the drum during activation

Strojniški vestnik - Journal of Mechanical Engineering 59(2013)6, 375-386
385Detecting Groan Sources in Drum Brakes of Commercial Vehicles by TVA-FMEA: A Case Study
a)
b)Fig. 18. a) Schematic view of the planned tests and b) bonding
process of lining material
The items presented in the red dotted line are important indicators in determining the root cause. Fig. 18b shows the shoe bonding process and the negative effects of process variability. The effect of the curing process timing was analysed under laboratory conditions by the brake lining supplier and confirmed that the variability in the curing timing has an important effect on groan noise generation. The friction coefficient (µ) of the brake lining has been indicated as µ = 2.0 to 2.5 in the supplier specifications. In order to understand how the friction coefficient varies between “groan noise” and “groan noise-free” brake linings, 3 sets from both vehicles were disassembled from the vehicles and shipped to the supplier for analysis. Measurements related to the friction coefficient are summarized in Figs. 19a and b for groan noise free and groan noise respectively.
According to test results, the friction coefficient µ of groan noise free brakes ranges between 2.09 and 2.52. On the other hand, the coefficient µ of the groan noise brakes shows fluctuations between 1.31 and 1.95. Because of the overcuring of the composite
material under heat, the surface of the lining material becomes excessively crystallized, which decreases braking efficiency. Due to a loss of braking effects upon contact with the drum’s internal surface, the lining works as a pressure applicator on the drum only and this results in vibration under dry friction. After having determined the root cause of the problem, the drum brakes of all vehicles in the production lines are manufactured using correctly cured lining materials.
a)
b)Fig. 19. Measurements (friction coefficient, temperature and
brake pressure) on a) groan noise-free and b) groan noise brake lining materials
As a result of this study, TVA and FMEA methods were employed to effectively determine the root cause of brake groan. The importance of these methods has been presented and shared with our suppliers in order to improve their plants and to help their business with other companies. The techniques used in this study also helped the suppliers to adopt a problem management approach and understand the solution flow chart.
6 CONCLUSIONS
Companies must track their production, selling, and purchasing activities regularly to identify potential and actual problems. The detection and solution of the problem can then be carried out using industrial engineering tools such as TVA and FMEA methods. These methods were used in this study to create an action plan for eliminating the groan noise generated by troubled drums in commercial light vehicles by

Strojniški vestnik - Journal of Mechanical Engineering 59(2013)6, 375-386
386 Karabay, S. – Baynal, K. – İğdeli, C.
determining the root cause. In our analysis, TVA showed something wrong in terms of warranty parts replacement and extra service costs. Then, using FMEA analysis, we could determine the root cause of the groan noise braking by elimination secondary and tertiary reasons. On the other hand, after performing the planned tests with the help of FMEA, the brake groan werer found to be generated by dynamic instability in the friction forces that act as non-conservative forces. In brake groan noise problems, displacements of the friction surfaces of the lining are caused by vibration due to frictional forces applied to deformed surfaces of the contact areas. Therefore, the amount of work by brake vibration structures often differs between the forward and backward vibration motions, resulting in dynamic instability of the system and some brake groan noise. In this study, the brake groan noise was found to depend on the magnitude of the friction coefficient and on the position of the contact areas between the friction material and the metal surface of the drum. Because of the overcuring of the composite material under heat, the surface of the lining material gets excessively crystallized, which decreases braking efficiency. Due to a loss of braking effects on contacting with drum’s internal surface, the lining works as pressure applicator to the drum only and this results in groan noise due to vibration under dry friction.
7 REFERENCES
[1] Cantoni, C., Cesarini, R., Mastinu, G., Rocca, G., Sicigliano, R. (2009) Brake Comfort: A Review. Vehicle System Dynamics, vol. 47, no. 8, p. 901-947, DOI:10.1080/00423110903100432.
[2] Betella, M., Harrison, F., Sharp, R.S. (2002). Investigation of automotive creep groan noise with distributed source excitation technique. Journal of Sound and Vibration, vol. 255, no. 3, p. 531-547, DOI:10.1006/jsvi.2001.4178.
[3] Brecht, J., Schiffner, K. (2001). Influence of Friction Law on Brake Creep-Groan. SAE Technical paper, paper no. 2001-01-3138.
[4] Jang, H., Lee, J.S., Fash, J.W. (2001). Compositional effects of the brake friction material on creep groan phenomena. Wear, vol. 251, p. 1477-1483, DOI:10.1016/S0043-1648(01)00786-4.
[5] Luciano, M.A., Madruga, O., Costa, C. (2005). A Method for Measuring Creep Groan Based on Brake
Inertial Dynamometer, SAE Technical Paper, paper no. 2005-01-4126, DOI:10.4271/2005-01-4126.
[6] Severin, D., Dörsch, S. (2001). Friction mechanism in industrial brakes. Wear, vol. 249, no. 9, p. 771-779, DOI:10.1016/S0043-1648(01)00806-7.
[7] Ahmed, I. (2006). Studying the Contact Analysis Behavior of Vehicle Drum Brake Using Finite Element Methods. SAE Technical Paper Series, paper no. 2006-01-3561, DOI:10.4271/2006-01-3561.
[8] Crowther, A.R., Yoon, J., Singh, R. (2007). An Explanation for Brake Groan Based on Coupled Brake-Driveline System Analysis. SAE International, paper no. 2007-01-2260, Noise and Vibration Conference and Exhibition, St. Charles, DOI:10.4271/2007-01-2260.
[9] Abdelhamid, M.K., Bray, W. (2009). Braking Systems Creep Groan Noise: Detection and Evaluation. SAE Technical Paper, paper no. 2009-01-2103. DOI:10.4271/2009-01-2103.
[10] Yoon, K.W., Lee, J.C., Cho, S.S. (2011). The Study of Vehicle Structural Characteristics for Creep Groan Noise. SAE International, paper no. 2011-01-2363.
[11] Jung, T., Chung, S. (2012). Research for Brake Creep Groan Noise with Dynamometer. SAE International Journal of Passenger, Cars – Mechanical Systems, vol. 5, no. 4, DOI:10.4271/2012-01-1824.
[12] Korunović, N., Trajanović, M., Stojković, M., Mišić, D., Milovanović, J. (2011). Finite Element Analysis of a Tire Steady Rolling on the Drum and Comparison with Experiment. Strojniški vestnik - Journal of Mechanical Engineering, vol. 57, no. 12, p. 888-897, DOI:10.5545/sv-jme.2011-124.
[13] Lovrec, D., Kastrevc, M. (2011). Modeling and Simulating a Controlled Press-Brake Supply System. International Journal of Simulation Modelling, vol. 10, no. 3, p.133-144, DOI:10.2507/IJSIMM10(3)3.184.
[14] Zhou, M., Wang, Y., Huang, Q. (2007). Study on the stability of drum brake non-linear low frequency vibration model. Archive of Applied Mechanics, vol. 77, no. 7, p.473-483, DOI:10.1007/s00419-006-0109-6.
[15] Ganguly, S., Pastor, K., Folta, G., Ianka, R., Karpenko, Y. (2011). Reduction of Groan and Grind Noise in Brake Systems. SAE International, paper no. 2011-01-2364, DOI:10.4271/2011-01-2364.
[16] Crow, K.A. (2002). Value analysis and Function Analysis System technique, from http://www.npd-solutions.com/va.html, accessed on 2013-01-01.
[17] AIAG (2008). Potential Failure Mode and Effects Analysis (FMEA). Automotive Industry Action Group (AIAG), 4th Ed., Southfielt
[18] Stamatis, D.H. (2003). Failure Mode and Effect Analysis: FMEA from Theory to Execution. 2nd Ed., revised and expanded. ASQC Quality Press, Milwaukee.