porous media characterization of breads baked using...
TRANSCRIPT
www.elsevier.com/locate/jfoodeng
Journal of Food Engineering 79 (2007) 106–116
Porous media characterization of breads bakedusing novel heating modes
Ashim K. Datta a,*, Serpil Sahin b, Gulum Sumnu b, S. Ozge Keskin b
a Department of Biological and Environmental Engineering, Cornell University, Riley-Robb Hall, Ithaca, NY 14853-5701, USAb Department of Food Engineering, Middle East Technical University, 06531 Ankara, Turkey
Received 24 September 2005; accepted 16 January 2006Available online 10 March 2006
Abstract
The nature of pore spaces in breads baked using various heating modes (microwave–infrared (MIR), microwave–jet impingement(MJET) and jet impingement (JET)) were characterized in terms of total porosity, fraction of closed, blind and flow-through pores,and pore size distributions using several novel and old techniques (liquid extrusion porosimetry, scanned image analysis, pycnometry,volume displacement method and scanning electron microscopy or SEM). For the breads studies here, a very significant pore size dis-tribution exists covering diameters of a few microns to several thousand microns. It appears that the pore size distribution is bimodal andonly a combination of techniques can provide comprehensive information, i.e., any one technique cannot cover the large range of poresize, total porosity and flow-through vs. closed pores. A significant fraction of the pores was found to be closed. Breads baked in JET hadthe highest total porosity followed by MJET and MIR. Other measurements on breads baked in JET also lay on one end of the spectrum(either smallest or largest), which is consistent with SEM pictures where JET baked breads looked quite different from the ones baked inother ovens.� 2006 Published by Elsevier Ltd.
Keywords: Pore size distribution; Image analysis; Microwave; Infrared; Combination; SEM
1. Introduction
Transport and other properties of foods that depend sig-nificantly on the porous structure of the food often criti-cally determine the final quality of a processed food(Datta, in press). Knowing the relationship between theformation of porous structure and the processing stepscan allow development of customized quality (Aguilera,2005; Rassis, Nussinovitch, & Saguy, 1997). The obviousfirst step in obtaining the relationships between the trans-port properties and the porous structure is to quantifythe nature of the pores. However, quantitative character-ization of food as a porous media has been rare (Karlsson,1985; Kassama & Ngadi, 2005; Rassis et al., 1997).
0260-8774/$ - see front matter � 2006 Published by Elsevier Ltd.
doi:10.1016/j.jfoodeng.2006.01.046
* Corresponding author. Tel.: +1 607 255 2482; fax: +1 607 255 4080.E-mail address: [email protected] (A.K. Datta).
Although there are many possible choices in foods to studyporous media, an economically relevant as well as scientif-ically challenging food system to study is the baking ofbread, where the structure of the food material changesprofoundly during processing.
Previous scanning electron microscopy (SEM) studieshave shown qualitative relationships between a bread’smechanical properties and the size and distribution of gascells in the crumb (Hayman, Hoseney, & Faubion, 1998;Zayas, 1993). Microstructure changes during baking ofbread as affected by composition has been studied (Ahmad,Morgan, & Okos, 2001; Brennan, Blake, Ellis, & Schofield,1996; Hayman et al., 1998; Pomeranz, Shogren, Finney,& Behtel, 1977; Rojas, Rosell, de Barber, Perez-Munuera,& Lluch, 2000) but the novel heating modes in this study(discussed later) have not been previously covered.
Pore size distribution in bread has been studied in thepast using mercury porosimetry (Hicsasmaz & Clayton,
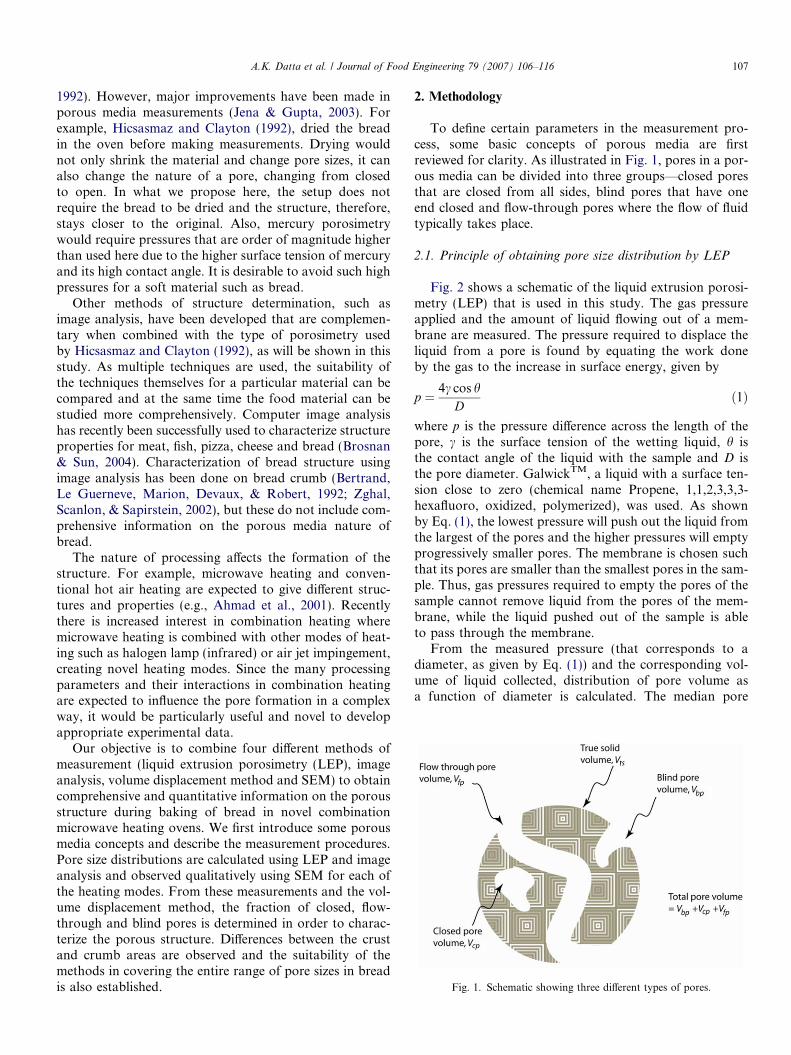
Fig. 1. Schematic showing three different types of pores.
A.K. Datta et al. / Journal of Food Engineering 79 (2007) 106–116 107
1992). However, major improvements have been made inporous media measurements (Jena & Gupta, 2003). Forexample, Hicsasmaz and Clayton (1992), dried the breadin the oven before making measurements. Drying wouldnot only shrink the material and change pore sizes, it canalso change the nature of a pore, changing from closedto open. In what we propose here, the setup does notrequire the bread to be dried and the structure, therefore,stays closer to the original. Also, mercury porosimetrywould require pressures that are order of magnitude higherthan used here due to the higher surface tension of mercuryand its high contact angle. It is desirable to avoid such highpressures for a soft material such as bread.
Other methods of structure determination, such asimage analysis, have been developed that are complemen-tary when combined with the type of porosimetry usedby Hicsasmaz and Clayton (1992), as will be shown in thisstudy. As multiple techniques are used, the suitability ofthe techniques themselves for a particular material can becompared and at the same time the food material can bestudied more comprehensively. Computer image analysishas recently been successfully used to characterize structureproperties for meat, fish, pizza, cheese and bread (Brosnan& Sun, 2004). Characterization of bread structure usingimage analysis has been done on bread crumb (Bertrand,Le Guerneve, Marion, Devaux, & Robert, 1992; Zghal,Scanlon, & Sapirstein, 2002), but these do not include com-prehensive information on the porous media nature ofbread.
The nature of processing affects the formation of thestructure. For example, microwave heating and conven-tional hot air heating are expected to give different struc-tures and properties (e.g., Ahmad et al., 2001). Recentlythere is increased interest in combination heating wheremicrowave heating is combined with other modes of heat-ing such as halogen lamp (infrared) or air jet impingement,creating novel heating modes. Since the many processingparameters and their interactions in combination heatingare expected to influence the pore formation in a complexway, it would be particularly useful and novel to developappropriate experimental data.
Our objective is to combine four different methods ofmeasurement (liquid extrusion porosimetry (LEP), imageanalysis, volume displacement method and SEM) to obtaincomprehensive and quantitative information on the porousstructure during baking of bread in novel combinationmicrowave heating ovens. We first introduce some porousmedia concepts and describe the measurement procedures.Pore size distributions are calculated using LEP and imageanalysis and observed qualitatively using SEM for each ofthe heating modes. From these measurements and the vol-ume displacement method, the fraction of closed, flow-through and blind pores is determined in order to charac-terize the porous structure. Differences between the crustand crumb areas are observed and the suitability of themethods in covering the entire range of pore sizes in breadis also established.
2. Methodology
To define certain parameters in the measurement pro-cess, some basic concepts of porous media are firstreviewed for clarity. As illustrated in Fig. 1, pores in a por-ous media can be divided into three groups—closed poresthat are closed from all sides, blind pores that have oneend closed and flow-through pores where the flow of fluidtypically takes place.
2.1. Principle of obtaining pore size distribution by LEP
Fig. 2 shows a schematic of the liquid extrusion porosi-metry (LEP) that is used in this study. The gas pressureapplied and the amount of liquid flowing out of a mem-brane are measured. The pressure required to displace theliquid from a pore is found by equating the work doneby the gas to the increase in surface energy, given by
p ¼ 4c cos hD
ð1Þ
where p is the pressure difference across the length of thepore, c is the surface tension of the wetting liquid, h isthe contact angle of the liquid with the sample and D isthe pore diameter. GalwickTM, a liquid with a surface ten-sion close to zero (chemical name Propene, 1,1,2,3,3,3-hexafluoro, oxidized, polymerized), was used. As shownby Eq. (1), the lowest pressure will push out the liquid fromthe largest of the pores and the higher pressures will emptyprogressively smaller pores. The membrane is chosen suchthat its pores are smaller than the smallest pores in the sam-ple. Thus, gas pressures required to empty the pores of thesample cannot remove liquid from the pores of the mem-brane, while the liquid pushed out of the sample is ableto pass through the membrane.
From the measured pressure (that corresponds to adiameter, as given by Eq. (1)) and the corresponding vol-ume of liquid collected, distribution of pore volume asa function of diameter is calculated. The median pore
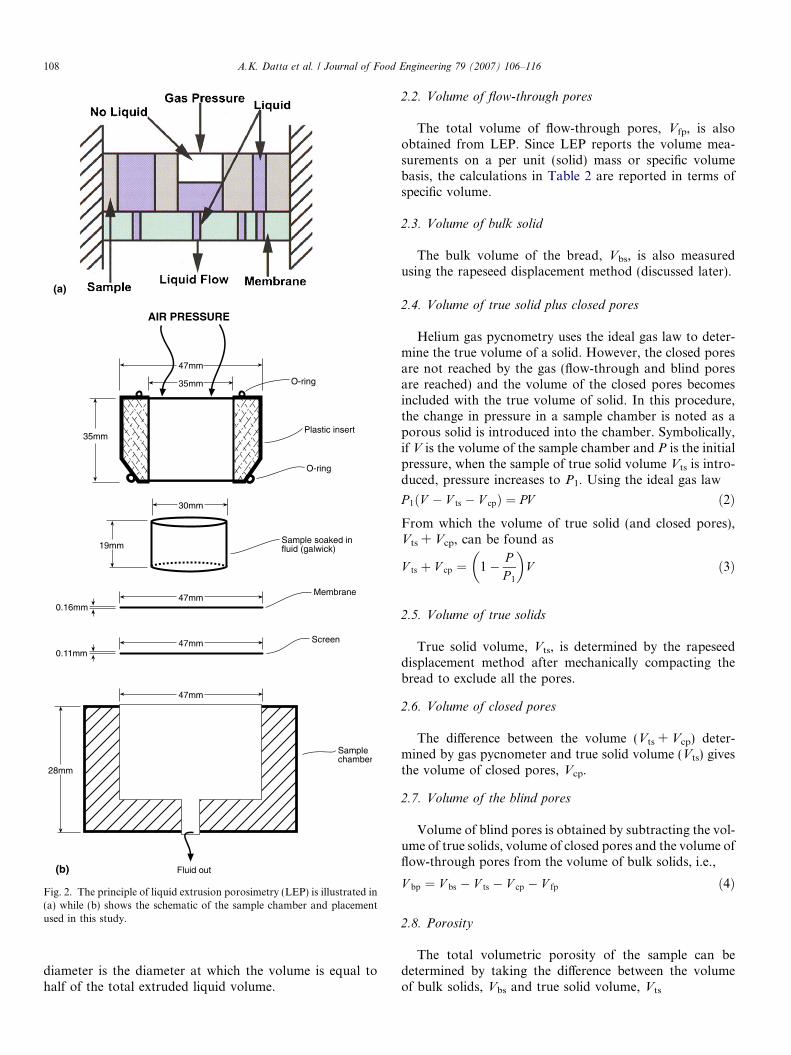
Fig. 2. The principle of liquid extrusion porosimetry (LEP) is illustrated in(a) while (b) shows the schematic of the sample chamber and placementused in this study.
108 A.K. Datta et al. / Journal of Food Engineering 79 (2007) 106–116
diameter is the diameter at which the volume is equal tohalf of the total extruded liquid volume.
2.2. Volume of flow-through pores
The total volume of flow-through pores, Vfp, is alsoobtained from LEP. Since LEP reports the volume mea-surements on a per unit (solid) mass or specific volumebasis, the calculations in Table 2 are reported in terms ofspecific volume.
2.3. Volume of bulk solid
The bulk volume of the bread, Vbs, is also measuredusing the rapeseed displacement method (discussed later).
2.4. Volume of true solid plus closed pores
Helium gas pycnometry uses the ideal gas law to deter-mine the true volume of a solid. However, the closed poresare not reached by the gas (flow-through and blind poresare reached) and the volume of the closed pores becomesincluded with the true volume of solid. In this procedure,the change in pressure in a sample chamber is noted as aporous solid is introduced into the chamber. Symbolically,if V is the volume of the sample chamber and P is the initialpressure, when the sample of true solid volume Vts is intro-duced, pressure increases to P1. Using the ideal gas law
P 1ðV � V ts � V cpÞ ¼ PV ð2ÞFrom which the volume of true solid (and closed pores),Vts + Vcp, can be found as
V ts þ V cp ¼ 1� PP 1
� �V ð3Þ
2.5. Volume of true solids
True solid volume, Vts, is determined by the rapeseeddisplacement method after mechanically compacting thebread to exclude all the pores.
2.6. Volume of closed pores
The difference between the volume (Vts + Vcp) deter-mined by gas pycnometer and true solid volume (Vts) givesthe volume of closed pores, Vcp.
2.7. Volume of the blind pores
Volume of blind pores is obtained by subtracting the vol-ume of true solids, volume of closed pores and the volume offlow-through pores from the volume of bulk solids, i.e.,
V bp ¼ V bs � V ts � V cp � V fp ð4Þ
2.8. Porosity
The total volumetric porosity of the sample can bedetermined by taking the difference between the volumeof bulk solids, Vbs and true solid volume, Vts
A.K. Datta et al. / Journal of Food Engineering 79 (2007) 106–116 109
Total porosity ¼ V bs � V ts
V bs
ð5Þ
2.9. Dough preparation
Bread flour containing 30% wet gluten, 10% moisture and0.57% ash was used in this study. The composition of theprepared dough was on flour weight basis (this compositioncorresponds roughly to the accepted recipe for hamburgerbread); 100% flour, 8% sugar, 6% milk powder, 2% salt,3% dry yeast, 8% margarine, 60% water. Dough containing500 g flour was prepared by using straight dough method.First the dry ingredients were mixed. Milk powder and dryyeast were dissolved in water at 24 ± 1 �C separately. Mar-garine was melted and added to the dry ingredients in liquidphase together with dissolved yeast and milk powder. All theingredients were mixed by a mixer (Kitchen Aid,KSM90WH, Greenville, OH, USA) for 3 min. After com-plete mixing of the dough, it was placed into the incubatorat 30 �C. The total duration of the fermentation was105 min. After the first 70 min, the dough was taken outof the incubator, punched (to obtain small and spatially uni-form gas distribution) and placed into the incubator again.A second punch took place at the end of the 105 min. Thedough was divided into 50 g pieces after fermentation. Eachpiece was shaped and placed into the incubator for proofingfor 20 min under the same incubation conditions.
2.10. Heating modes in baking
Three different heating modes of jet impingement bak-ing, microwave-impingement combination baking andmicrowave–infrared combination baking were used, withthe processing conditions listed in Table 1.
2.11. Jet impingement baking (JET)
JET baking was performed in Thermador Double JetDirectTM Convection Oven CJ302UB (Enersyst Develop-ment Center, Huntington Beach, CA, USA) by usinghigh-speed convection heat (see Table 1). The velocity ofair was 10 m/s. The oven was preheated to the set temper-ature before placing the dough samples into it. Four breadswere baked at a time.
2.12. Microwave–jet impingement combination baking
(MJET)
MJET baking combines the convection mode of the JETdescribed above and microwave mode (see Table 1). The
Table 1Processing conditions used in different heating modes
Modes ofheating
Bakingcondition
Baking time(min)
JET 200 �C 8MJET 200 �C + 20% microwave power 6.5MIR 70% IR + 20% microwave power 8
velocity of air was 10 m/s. Microwaves are introduced fromthe top and air jets are introduced from both the top andthe bottom. The oven was preheated to the set temperaturebefore placing the dough samples into it. Four breads werebaked at a time.
2.13. Microwave–infrared combination baking (MIR)
MIR baking, which combines microwave and infraredheating, was performed in an AdvantiumTM oven (GeneralElectric Company, Louisville, KY, USA). The rotary tablein the oven was used to improve the heating uniformity ofsamples. Halogen lamps at the top and bottom were oper-ated at the same power. Four breads were baked at theconditions shown in Table 1.
2.14. Temperature measurement
Fiber optic temperature probes (FISO Technologies,Inc., Quebec, Canada) were placed at the center of thebread and temperatures were obtained using a computer-based real time data acquisition system from the samecompany.
2.15. Volume measurement using rapeseed displacement
Rapeseed displacement (AACC, 1988) is a commonmethod for measuring volumes of irregular solids and hasbeen used for bread (Keskin, Sumnu, & Sahin, 2004).Rapeseeds have a diameter of approximately 1.7 mm. Inthe rapeseed method, first the tapped bulk density of rape-seeds is determined by filling a glass container of knownvolume uniformly with rapeseeds through tapping andsmoothing the surface with a ruler. Then, the sample andrapeseeds are placed together into the container. The con-tainer is again tapped and the surface is smoothed with aruler. Tapping and smoothing is continued until constantweight is reached between consecutive measurements. Thevolume of the sample is calculated as follows for volumeof bulk solids, Vbs:
mseeds ¼ mtotal � msample � mcontainer ð6Þ
V seeds ¼mseeds
qseeds
ð7Þ
V bs ¼ V container � V seeds ð8Þ
where m is mass and q is the density.
2.16. LEP measurement of bread porous structure
A schematic of the sample chamber in liquid extrusionporosimetry is shown in Fig. 2. The sample chamber, itsinsert, and container for the wetting liquid supported onthe weighing balance were cleaned and reassembled. Thewetting liquid GalwickTM was used for the test. The samplechamber was filled with the wetting liquid up to the levelof the membrane. The thin membrane was put in place.
110 A.K. Datta et al. / Journal of Food Engineering 79 (2007) 106–116
A clean and greased o-ring was placed on the membrane.The insert was placed on the o-ring. A cylindrical pieceof sample (with the approximate dimensions of 36.5 mmdiameter and 19 mm height) was punched from the breadavoiding areas that show very large pores visually. Thisbread sample was loaded in the sample chamber and thecap of the sample chamber (connected to the pressurizedgas supply) was attached. The program was instructed tostart the test. The test program recorded the initial differen-tial gas pressure and the initial reading of the weighing bal-ance, and increased the gas pressure in small steps,recording the differential gas pressures and readings ofthe balance. At the end of the test the report program auto-matically computed and displayed all the required results.The accuracy of the pressure measurement is about0.15% of the actual value, while the accuracy of the flowmeasurement is approximately 1% of the full scale.
2.17. Image analysis based measurement of bread porous
structure
Breads baked with different heating modes were cut intotwo halves vertically. The cut side of one of the halves wasplaced over the glass of a scanner (HP Scanjet 5470C,USA) having a resolution of 300 dpi. The scanned imagewas analyzed using the software Image J (http://rsb.info.nih.gov/ij/; Abramoff, Magelhaes, & Ram, 2004; Braad-baart & Van Bergen, 2005) that uses the contrast betweenthe two phases (pores and solid part) in the image. Thescanned color image is first converted to gray scale. Usingbars of known lengths, pixel values are converted into dis-tance units. The largest possible rectangular cross-section
100. 2050.
0.10.2 0.05
010
.20
.30
.40
.50
.60
.70
.80
.90
.10
0.
Cum
ulua
tive
pore
vol
ume
(%)
Gag
Por
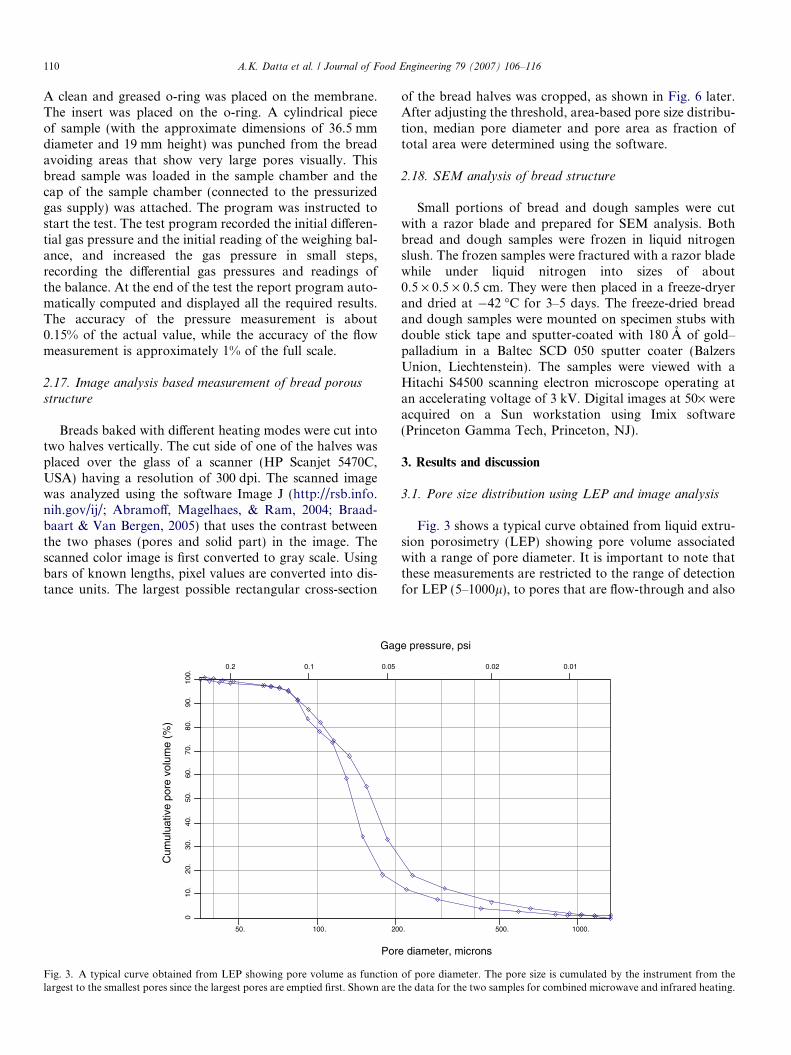
Fig. 3. A typical curve obtained from LEP showing pore volume as functionlargest to the smallest pores since the largest pores are emptied first. Shown are
of the bread halves was cropped, as shown in Fig. 6 later.After adjusting the threshold, area-based pore size distribu-tion, median pore diameter and pore area as fraction oftotal area were determined using the software.
2.18. SEM analysis of bread structure
Small portions of bread and dough samples were cutwith a razor blade and prepared for SEM analysis. Bothbread and dough samples were frozen in liquid nitrogenslush. The frozen samples were fractured with a razor bladewhile under liquid nitrogen into sizes of about0.5 · 0.5 · 0.5 cm. They were then placed in a freeze-dryerand dried at �42 �C for 3–5 days. The freeze-dried breadand dough samples were mounted on specimen stubs withdouble stick tape and sputter-coated with 180 A of gold–palladium in a Baltec SCD 050 sputter coater (BalzersUnion, Liechtenstein). The samples were viewed with aHitachi S4500 scanning electron microscope operating atan accelerating voltage of 3 kV. Digital images at 50· wereacquired on a Sun workstation using Imix software(Princeton Gamma Tech, Princeton, NJ).
3. Results and discussion
3.1. Pore size distribution using LEP and image analysis
Fig. 3 shows a typical curve obtained from liquid extru-sion porosimetry (LEP) showing pore volume associatedwith a range of pore diameter. It is important to note thatthese measurements are restricted to the range of detectionfor LEP (5–1000l), to pores that are flow-through and also
1000.0. 500.
0.010.02
e pressure, psi
e diameter, microns
of pore diameter. The pore size is cumulated by the instrument from thethe data for the two samples for combined microwave and infrared heating.
A.K. Datta et al. / Journal of Food Engineering 79 (2007) 106–116 111
to the two cylindrical samples (approximately 36.5 mmdiameter and 19 mm height) of the bread that has diameterup to 77 mm and height up to 55 mm. The samples werealso taken from regions that did not have visibly largepores and were away from the edge (crust). In this partic-ular curve for MIR at the power levels mentioned earlier,over 65% of the flow-through pores have diameter between100 and 200 lm.
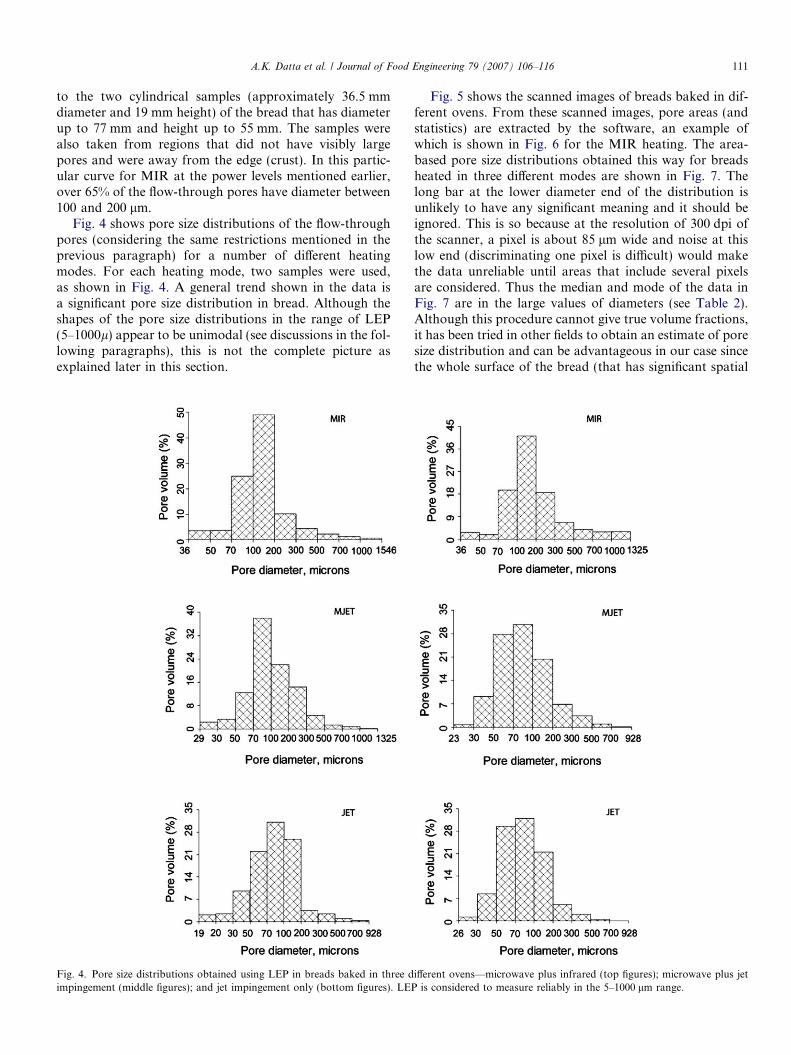
Fig. 4 shows pore size distributions of the flow-throughpores (considering the same restrictions mentioned in theprevious paragraph) for a number of different heatingmodes. For each heating mode, two samples were used,as shown in Fig. 4. A general trend shown in the data isa significant pore size distribution in bread. Although theshapes of the pore size distributions in the range of LEP(5–1000l) appear to be unimodal (see discussions in the fol-lowing paragraphs), this is not the complete picture asexplained later in this section.
Fig. 4. Pore size distributions obtained using LEP in breads baked in three dimpingement (middle figures); and jet impingement only (bottom figures). LEP
Fig. 5 shows the scanned images of breads baked in dif-ferent ovens. From these scanned images, pore areas (andstatistics) are extracted by the software, an example ofwhich is shown in Fig. 6 for the MIR heating. The area-based pore size distributions obtained this way for breadsheated in three different modes are shown in Fig. 7. Thelong bar at the lower diameter end of the distribution isunlikely to have any significant meaning and it should beignored. This is so because at the resolution of 300 dpi ofthe scanner, a pixel is about 85 lm wide and noise at thislow end (discriminating one pixel is difficult) would makethe data unreliable until areas that include several pixelsare considered. Thus the median and mode of the data inFig. 7 are in the large values of diameters (see Table 2).Although this procedure cannot give true volume fractions,it has been tried in other fields to obtain an estimate of poresize distribution and can be advantageous in our case sincethe whole surface of the bread (that has significant spatial
ifferent ovens—microwave plus infrared (top figures); microwave plus jetis considered to measure reliably in the 5–1000 lm range.
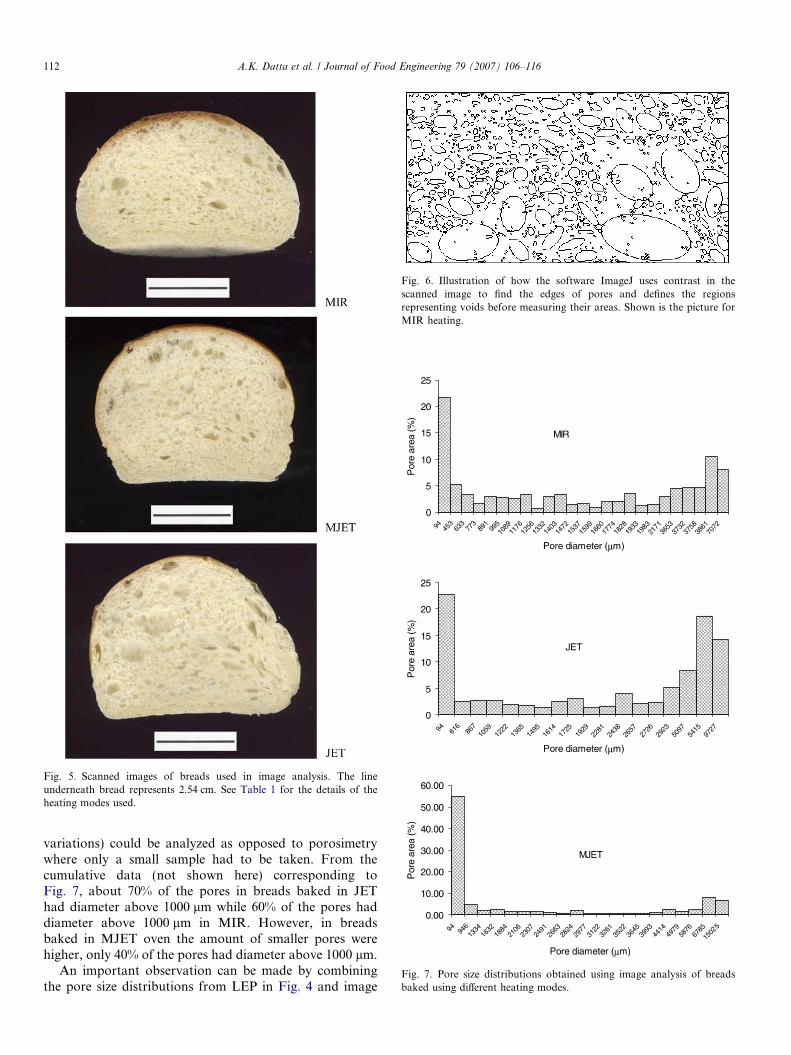
Fig. 5. Scanned images of breads used in image analysis. The lineunderneath bread represents 2.54 cm. See Table 1 for the details of theheating modes used.
Fig. 6. Illustration of how the software ImageJ uses contrast in thescanned image to find the edges of pores and defines the regionsrepresenting voids before measuring their areas. Shown is the picture forMIR heating.
Fig. 7. Pore size distributions obtained using image analysis of breadsbaked using different heating modes.
112 A.K. Datta et al. / Journal of Food Engineering 79 (2007) 106–116
variations) could be analyzed as opposed to porosimetrywhere only a small sample had to be taken. From thecumulative data (not shown here) corresponding toFig. 7, about 70% of the pores in breads baked in JEThad diameter above 1000 lm while 60% of the pores haddiameter above 1000 lm in MIR. However, in breadsbaked in MJET oven the amount of smaller pores werehigher, only 40% of the pores had diameter above 1000 lm.
An important observation can be made by combiningthe pore size distributions from LEP in Fig. 4 and image

Table 2Characterization of pore space in breads baked in different heating modes
MIR MJET JET
Median pore diameter (l) based on volume, for flow-throughpores by LEP, in the range 5–1000l
150.60 100.30 90.75
Standard deviation of pore diameter (l), from LEP, for two samples 49.8, 61.1 44.0, 32.7 35.1, 29.4Median pore diameter (l) based on area by image analysis 1400 900 2500[A] Specific volume of pores measured using LEP, flow thorough
pores in the range 5–1000l (cc/g)0.411 0.498 0.729
[B] Specific volume measured using gas pycnometry,true solid + closed pores (cc/g)
0.644 0.638 0.534
[C] Specific volume measured after compaction(using rapeseed method), true solid (cc/g)
0.185 0.180 0.065
[D] Specific volume of the bulk bread, measured using rapeseedmethod, true solid + blind pores + flow-through pores in the 5–1000lrange + closed pores + pores outside the 5–1000l range (cc/g)
2.25 2.40 2.50
[E] Specific volume of closed pores, [B] � [C] (cc/g) 0.460 0.458 0.471[F] Specific volume of blind pores and pores outside the 5–1000l
range, [D] � [B] � [A] (cc/g)1.196 1.264 1.236
Fraction of flow-through pores in the 5–1000l range,[A]/([A] + [E] + [F])
0.199 0.224 0.299
Fraction of closed pores, [E]/([A] + [E] + [F]) 0.222 0.206 0.193Fraction of blind pores and pores outside the 5–1000l
range, [F]/([A] + [E] + [F])0.579 0.569 0.507
Total porosity (fraction) calculated from the bulk and compactedbread data obtained using the rapeseed method, ([D] � [C])/[D]
0.918 0.925 0.974
Porosity obtained using pycnometry if closedpores are ignored, ([D] � [B])/[D]
0.714 0.734 0.786
Porosity based on area fraction obtained by image analysis 0.383 0.399 0.418Porosity of flow-through pores (in 5–1000l range) using
LEP data and bulk bread data from rapeseed method, ([A]/[D])0.182 0.207 0.292
Rows 1, 3 and 4 are arithmetic average for two samples.
JET
MJET
MIR
0
10
20
30
40
50
60
70
80
90
100
110
0 1 2 3 4 5 6 7
Time (min)
Tem
pera
ture
( ˚C
)
8
Fig. 8. Typical time–temperature history during baking.
A.K. Datta et al. / Journal of Food Engineering 79 (2007) 106–116 113
analysis in Fig. 7. Note that their ranges of operation arealmost non-overlapping. Thus, the combined pore size dis-tribution over the entire range of diameters would be bimo-
dal. Since the pores accounted for by LEP are in the smallerdiameter range and are only a fraction of the total pores(e.g., 0.182 for MIR in Table 2 as compared to a totalporosity of 0.918) while image analysis also picks up a con-siderable fraction of pores (0.383 for MIR) in the largerdiameter range, this further confirms the significant bimo-dality of the pore size distribution.
The median pore diameter values based on image anal-ysis of breads baked at different heating modes are shownin Table 2. The largest pores were observed in breads bakedin JET oven, with an area-based median pore size of2500 lm. Addition of microwaves to JET reduced the med-ian diameter to a much smaller value, 900 lm. The mediandiameter for MIR was 1400 lm. As can be seen in Fig. 5,these findings are somewhat consistent with visual observa-tions of the breads. Pore sizes should relate to a balancebetween rate of heating and the time needed for the outerregion of the dough to develop some rigidity so that sus-tained expansion can take place as opposed to the gas leav-ing the dough. It appears that as microwave heating (whichheats more volumetrically and faster, as shown in Fig. 8) isincluded, there is not enough time for the outer region tobecome rigid and the expansion is much less. This shouldlead to a small median pore size. The MIR heating, that
leads to a much faster heating than JET (see Fig. 8), alsoleads to reduced expansion which explains its lower mediandiameter.
The LEP findings, while different, are not inconsistentwith the results obtained from image analysis. As men-tioned, LEP measures pore sizes typically between 5 and1000 lm, uses a sample size that is small compared to theentire bread loaf and measures only flow-through pores(not the closed or blind pores). In contrast, image analysisconsiders pores larger than 1000 lm (which happens to bequite significant for the breads baked using the novel
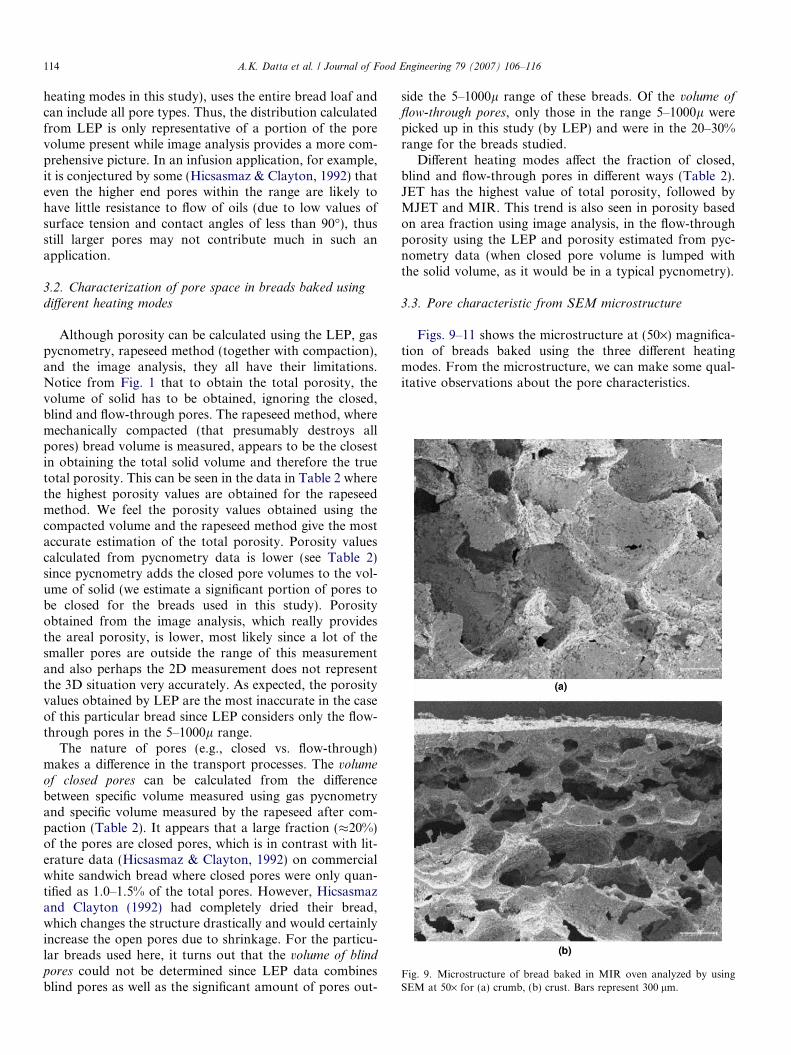
Fig. 9. Microstructure of bread baked in MIR oven analyzed by usingSEM at 50· for (a) crumb, (b) crust. Bars represent 300 lm.
114 A.K. Datta et al. / Journal of Food Engineering 79 (2007) 106–116
heating modes in this study), uses the entire bread loaf andcan include all pore types. Thus, the distribution calculatedfrom LEP is only representative of a portion of the porevolume present while image analysis provides a more com-prehensive picture. In an infusion application, for example,it is conjectured by some (Hicsasmaz & Clayton, 1992) thateven the higher end pores within the range are likely tohave little resistance to flow of oils (due to low values ofsurface tension and contact angles of less than 90�), thusstill larger pores may not contribute much in such anapplication.
3.2. Characterization of pore space in breads baked using
different heating modes
Although porosity can be calculated using the LEP, gaspycnometry, rapeseed method (together with compaction),and the image analysis, they all have their limitations.Notice from Fig. 1 that to obtain the total porosity, thevolume of solid has to be obtained, ignoring the closed,blind and flow-through pores. The rapeseed method, wheremechanically compacted (that presumably destroys allpores) bread volume is measured, appears to be the closestin obtaining the total solid volume and therefore the truetotal porosity. This can be seen in the data in Table 2 wherethe highest porosity values are obtained for the rapeseedmethod. We feel the porosity values obtained using thecompacted volume and the rapeseed method give the mostaccurate estimation of the total porosity. Porosity valuescalculated from pycnometry data is lower (see Table 2)since pycnometry adds the closed pore volumes to the vol-ume of solid (we estimate a significant portion of pores tobe closed for the breads used in this study). Porosityobtained from the image analysis, which really providesthe areal porosity, is lower, most likely since a lot of thesmaller pores are outside the range of this measurementand also perhaps the 2D measurement does not representthe 3D situation very accurately. As expected, the porosityvalues obtained by LEP are the most inaccurate in the caseof this particular bread since LEP considers only the flow-through pores in the 5–1000l range.
The nature of pores (e.g., closed vs. flow-through)makes a difference in the transport processes. The volume
of closed pores can be calculated from the differencebetween specific volume measured using gas pycnometryand specific volume measured by the rapeseed after com-paction (Table 2). It appears that a large fraction (�20%)of the pores are closed pores, which is in contrast with lit-erature data (Hicsasmaz & Clayton, 1992) on commercialwhite sandwich bread where closed pores were only quan-tified as 1.0–1.5% of the total pores. However, Hicsasmazand Clayton (1992) had completely dried their bread,which changes the structure drastically and would certainlyincrease the open pores due to shrinkage. For the particu-lar breads used here, it turns out that the volume of blind
pores could not be determined since LEP data combinesblind pores as well as the significant amount of pores out-
side the 5–1000l range of these breads. Of the volume of
flow-through pores, only those in the range 5–1000l werepicked up in this study (by LEP) and were in the 20–30%range for the breads studied.
Different heating modes affect the fraction of closed,blind and flow-through pores in different ways (Table 2).JET has the highest value of total porosity, followed byMJET and MIR. This trend is also seen in porosity basedon area fraction using image analysis, in the flow-throughporosity using the LEP and porosity estimated from pyc-nometry data (when closed pore volume is lumped withthe solid volume, as it would be in a typical pycnometry).
3.3. Pore characteristic from SEM microstructure
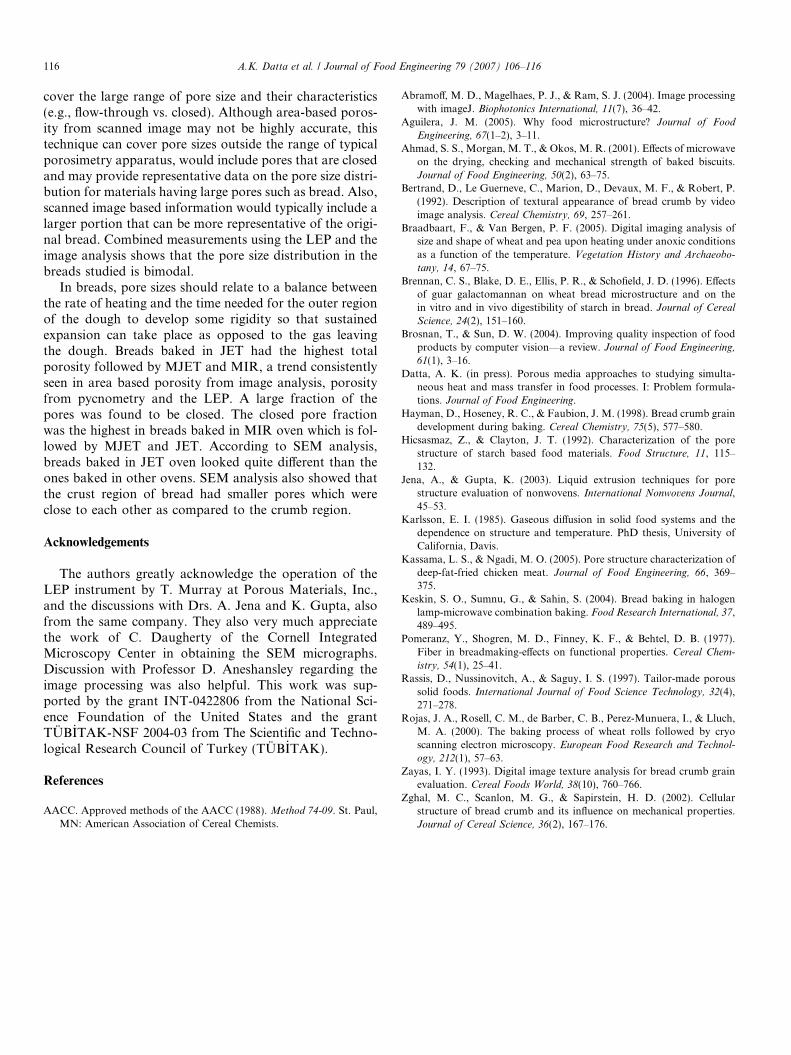
Figs. 9–11 shows the microstructure at (50·) magnifica-tion of breads baked using the three different heatingmodes. From the microstructure, we can make some qual-itative observations about the pore characteristics.
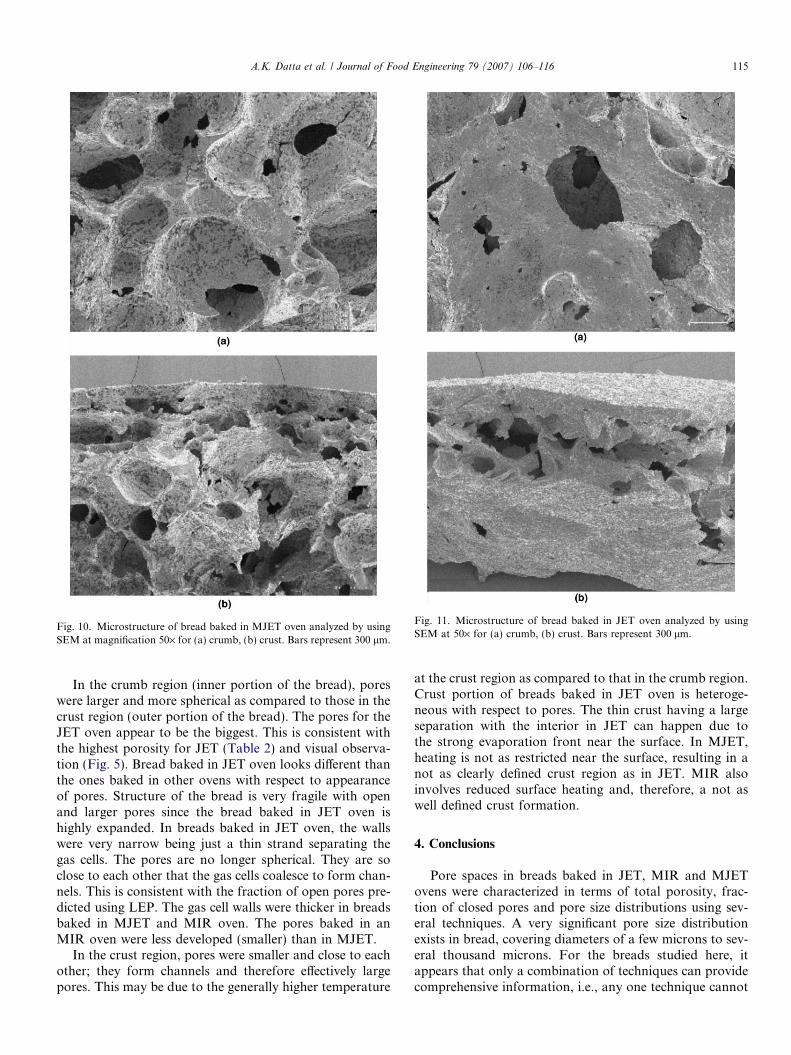
Fig. 11. Microstructure of bread baked in JET oven analyzed by usingSEM at 50· for (a) crumb, (b) crust. Bars represent 300 lm.
Fig. 10. Microstructure of bread baked in MJET oven analyzed by usingSEM at magnification 50· for (a) crumb, (b) crust. Bars represent 300 lm.
A.K. Datta et al. / Journal of Food Engineering 79 (2007) 106–116 115
In the crumb region (inner portion of the bread), poreswere larger and more spherical as compared to those in thecrust region (outer portion of the bread). The pores for theJET oven appear to be the biggest. This is consistent withthe highest porosity for JET (Table 2) and visual observa-tion (Fig. 5). Bread baked in JET oven looks different thanthe ones baked in other ovens with respect to appearanceof pores. Structure of the bread is very fragile with openand larger pores since the bread baked in JET oven ishighly expanded. In breads baked in JET oven, the wallswere very narrow being just a thin strand separating thegas cells. The pores are no longer spherical. They are soclose to each other that the gas cells coalesce to form chan-nels. This is consistent with the fraction of open pores pre-dicted using LEP. The gas cell walls were thicker in breadsbaked in MJET and MIR oven. The pores baked in anMIR oven were less developed (smaller) than in MJET.
In the crust region, pores were smaller and close to eachother; they form channels and therefore effectively largepores. This may be due to the generally higher temperature
at the crust region as compared to that in the crumb region.Crust portion of breads baked in JET oven is heteroge-neous with respect to pores. The thin crust having a largeseparation with the interior in JET can happen due tothe strong evaporation front near the surface. In MJET,heating is not as restricted near the surface, resulting in anot as clearly defined crust region as in JET. MIR alsoinvolves reduced surface heating and, therefore, a not aswell defined crust formation.
4. Conclusions
Pore spaces in breads baked in JET, MIR and MJETovens were characterized in terms of total porosity, frac-tion of closed pores and pore size distributions using sev-eral techniques. A very significant pore size distributionexists in bread, covering diameters of a few microns to sev-eral thousand microns. For the breads studied here, itappears that only a combination of techniques can providecomprehensive information, i.e., any one technique cannot
116 A.K. Datta et al. / Journal of Food Engineering 79 (2007) 106–116
cover the large range of pore size and their characteristics(e.g., flow-through vs. closed). Although area-based poros-ity from scanned image may not be highly accurate, thistechnique can cover pore sizes outside the range of typicalporosimetry apparatus, would include pores that are closedand may provide representative data on the pore size distri-bution for materials having large pores such as bread. Also,scanned image based information would typically include alarger portion that can be more representative of the origi-nal bread. Combined measurements using the LEP and theimage analysis shows that the pore size distribution in thebreads studied is bimodal.
In breads, pore sizes should relate to a balance betweenthe rate of heating and the time needed for the outer regionof the dough to develop some rigidity so that sustainedexpansion can take place as opposed to the gas leavingthe dough. Breads baked in JET had the highest totalporosity followed by MJET and MIR, a trend consistentlyseen in area based porosity from image analysis, porosityfrom pycnometry and the LEP. A large fraction of thepores was found to be closed. The closed pore fractionwas the highest in breads baked in MIR oven which is fol-lowed by MJET and JET. According to SEM analysis,breads baked in JET oven looked quite different than theones baked in other ovens. SEM analysis also showed thatthe crust region of bread had smaller pores which wereclose to each other as compared to the crumb region.
Acknowledgements
The authors greatly acknowledge the operation of theLEP instrument by T. Murray at Porous Materials, Inc.,and the discussions with Drs. A. Jena and K. Gupta, alsofrom the same company. They also very much appreciatethe work of C. Daugherty of the Cornell IntegratedMicroscopy Center in obtaining the SEM micrographs.Discussion with Professor D. Aneshansley regarding theimage processing was also helpful. This work was sup-ported by the grant INT-0422806 from the National Sci-ence Foundation of the United States and the grantTUB_ITAK-NSF 2004-03 from The Scientific and Techno-logical Research Council of Turkey (TUB_ITAK).
References
AACC. Approved methods of the AACC (1988). Method 74-09. St. Paul,MN: American Association of Cereal Chemists.
Abramoff, M. D., Magelhaes, P. J., & Ram, S. J. (2004). Image processingwith imageJ. Biophotonics International, 11(7), 36–42.
Aguilera, J. M. (2005). Why food microstructure? Journal of Food
Engineering, 67(1–2), 3–11.Ahmad, S. S., Morgan, M. T., & Okos, M. R. (2001). Effects of microwave
on the drying, checking and mechanical strength of baked biscuits.Journal of Food Engineering, 50(2), 63–75.
Bertrand, D., Le Guerneve, C., Marion, D., Devaux, M. F., & Robert, P.(1992). Description of textural appearance of bread crumb by videoimage analysis. Cereal Chemistry, 69, 257–261.
Braadbaart, F., & Van Bergen, P. F. (2005). Digital imaging analysis ofsize and shape of wheat and pea upon heating under anoxic conditionsas a function of the temperature. Vegetation History and Archaeobo-
tany, 14, 67–75.Brennan, C. S., Blake, D. E., Ellis, P. R., & Schofield, J. D. (1996). Effects
of guar galactomannan on wheat bread microstructure and on thein vitro and in vivo digestibility of starch in bread. Journal of Cereal
Science, 24(2), 151–160.Brosnan, T., & Sun, D. W. (2004). Improving quality inspection of food
products by computer vision—a review. Journal of Food Engineering,
61(1), 3–16.Datta, A. K. (in press). Porous media approaches to studying simulta-
neous heat and mass transfer in food processes. I: Problem formula-tions. Journal of Food Engineering.
Hayman, D., Hoseney, R. C., & Faubion, J. M. (1998). Bread crumb graindevelopment during baking. Cereal Chemistry, 75(5), 577–580.
Hicsasmaz, Z., & Clayton, J. T. (1992). Characterization of the porestructure of starch based food materials. Food Structure, 11, 115–132.
Jena, A., & Gupta, K. (2003). Liquid extrusion techniques for porestructure evaluation of nonwovens. International Nonwovens Journal,45–53.
Karlsson, E. I. (1985). Gaseous diffusion in solid food systems and thedependence on structure and temperature. PhD thesis, University ofCalifornia, Davis.
Kassama, L. S., & Ngadi, M. O. (2005). Pore structure characterization ofdeep-fat-fried chicken meat. Journal of Food Engineering, 66, 369–375.
Keskin, S. O., Sumnu, G., & Sahin, S. (2004). Bread baking in halogenlamp-microwave combination baking. Food Research International, 37,489–495.
Pomeranz, Y., Shogren, M. D., Finney, K. F., & Behtel, D. B. (1977).Fiber in breadmaking-effects on functional properties. Cereal Chem-
istry, 54(1), 25–41.Rassis, D., Nussinovitch, A., & Saguy, I. S. (1997). Tailor-made porous
solid foods. International Journal of Food Science Technology, 32(4),271–278.
Rojas, J. A., Rosell, C. M., de Barber, C. B., Perez-Munuera, I., & Lluch,M. A. (2000). The baking process of wheat rolls followed by cryoscanning electron microscopy. European Food Research and Technol-
ogy, 212(1), 57–63.Zayas, I. Y. (1993). Digital image texture analysis for bread crumb grain
evaluation. Cereal Foods World, 38(10), 760–766.Zghal, M. C., Scanlon, M. G., & Sapirstein, H. D. (2002). Cellular
structure of bread crumb and its influence on mechanical properties.Journal of Cereal Science, 36(2), 167–176.