department of the interior u.s. geological ...tanzania, uganda, zaire, congo, and the southern parts...
TRANSCRIPT
DEPARTMENT OF THE INTERIOR
U.S. GEOLOGICAL SURVEY
The Undiscovered Recoverable Petroleum Resources of Southern Africa
by
John Kingston
Open-File Report 88-223
1988
This report is preliminary and has not been reviewed for conformity with U.S. Geological Survey editorial standards and stratigraphic nomenclature.

CONTENTS
Page
Abstract ..................................................................1Introduction .............................................................. 1Atlant ic Marg in Bas ins .................................................... 4
Regional geology ....................................................... 7Nigeria bas in .......................................................... 7Douala bas in .......................................................... 24Gabon bas in ........................................................... 32Congo bas in ........................................................... 44Cuanza bas in ..........................................................60Orange bas in .......................................................... 69Agulhas bas in ......................................................... 80
Summary of Atlantic Margin Basins ................................ 91Interior Bas ins .......................................................... 91
Zaire basin ........................................................... 91Okawanga bas in ....................................................... 100Kalahari basin ....................................................... 104Karoo basin .......................................................... 110
Rift System Basins ...................................................... 115Karoo rift systems ................................................... 118East African rift system ............................................. 128
East Coast and Madagascar Bas ins ........................................ 136Mozambique basin ..................................................... 136Tanzania basin ....................................................... 145Morondava bas in ...................................................... 152Majunga basin ........................................................157
Conelus ions ............................................................. 158References Cited ........................................................ 164
ILLUSTRATIONS
Page
Figure 1. Map of the southern Africa area of study, regionalgeology, and marginal and interior sag basins .............. 2
2. Gulf of Guinea .............................................. 63. Schematic dip-section of the Nigeria basin .................. 84. Map showing megatectonic frame and stages of Tertiary
growth of the Niger delta ................................. 95. Structural map, Niger delta area ............................ 116. Structural cross-section of the northern, Cretaceous
part of the Nigeria basin ................................. 137. Axial cross-section of the northern, Cretaceous part
of the Nigeria basin ......................................138. Pre-delta stratigraphic column, Nigeria basin ............... 159. Finding-rate curve showing relation of Niger delta
discovered oil versus cumulative number of wildcats ....... 2210. Cumulative probability distribution of undiscovered
recoverable oil and gas in the Nigeria and Cameroonport ions of the Nigeria bas in .............................23
11. Douala basin index map ...................................... 2512. Douala geologic dip-section ................................. 2713. Cumulative probability distribution of undiscovered
recoverable oil and gas in the Douala basin ............... 3314. Map of tectonic elements, sub-crop geology, and
oil fields of Gabon basin ................................. 3415. Stratigraphic sections across the Gabon basin (from
(Vidal et al., 1975). Section A-A 1 through northernGabon basin and B-B 1 through southern Gabon basin ..........35
16. Gabon stratigraphic section ................................. 3717. Gabon basin finding curve showing relation of discovered
oil (in millions of barrels per 20 wildcats) to the number of post-salt wildcats drilled ...................... 43
18. Cumulative probability distribution of undiscoveredrecoverable oil and gas in the Gabon basin ................ 45
19. Tectonic element map of the Gabon and Congo basins ........... 4620. Index map of the Congo basin ................................ 4721. Diagrammatic stratigraphic cross sections, Congo
bas in ..................................................... 5022. Geologic dip-section, offshore Cabinda, Congo
basin; migrated seismic interpretation .................... 5123. Congo basin pre-salt finding curve showing the relation
of discovered oil (MMBO per 25 wildcats) to the number of wildcats drilled ................................ 58
24. Congo basin post-salt finding curve showing relation of discovered oil reserves (MMBO per 25 wildcats) to the number of wildcats drilled .......................... 59
25. Cumulative probability distribution of undiscovered recoverable oil and gas in the four countries (Angola, Congo, Gabon and Zaire) sharing the Congo basin ...............................................61
26. Cuanza basin index map ...................................... 6227. Diagrammatic cross-section, onshore Cuanza basin ............ 64
ii

Figure 28. Pre-Aptian paleogeologic map, Cuanza basin ..................6529. Seismic profile, continental slope off Cuanza basin .........6630. Cumulative probability distribution of undiscovered
recoverable oil and gas in the Cuanza basin ...............7231. Depth map of the top of the rift sequence, Horizon R,
Orange basin ..............................................7332. Diagrammatic geologic section across the Orange basin .......7433. Stratigraphic column, Orange basin ..........................7834. Cumulative probability distribution of undiscovered
recoverable oil and gas in the Orange basin ...............8335. Thickness map of Mesozoic sediments, showing
tectonic elements, Agulhas basin ..........................8436. Diagrammatic geologic cross-section, Agulhas basin ..........8537. Index map of key wells, Agulhas basin ....................... 8638. Stratigraphic column, Agulhas basin .........................8939. Cumulative probability distribution of undiscovered
recoverable oil and gas in the Agulhas basin ..............9240. Depth and index map of sag phase of the Zaire basin .........9541. Schematic geologic cross-section, Zaire basin ...............9742. Cumulative probability distribution of undiscovered
recoverable oil and gas in the Zaire and Congo portions of the Zaire basin ...............................99
43. Depth map of the sag phase of the Okawanga basinshowing the Etosha and Barotse subbasins ................. 101
44. Geologic section, south flank Etosha subbasin .............. 10245. Cumulative probability distribution of undiscovered
recoverable oil and gas in the three countries (Angola, Namibia, and Zambia) sharing the Okawanga bas in .................................................... 105
46. Depth map of the sag phase of the Kalahari basin ........... 10647. Depth map of the pre-sag phase of the Kalahari
bas in within Botswana .................................... 10748. Geologic sections from the Atlantic coast into the
Etosha subbasin and the southern Kalahari basin .......... 10949. Cumulative probability distribution of undiscovered
recoverable oil and gas in the Botswana and Namibia portions of the Kalahari basin ...................111
50. Depth to basement map, Karoo basin ......................... 11251. Regional south-to-north geologic cross-section,
Karoo basin .............................................. 11452. Cumulative probability distribution of undiscovered
recoverable oil and gas in the Karoo basin ............... 11653. Geologic map of southern Africa showing distribution
of Karoo rift basins ..................................... 11754. Comparison of Stratigraphic sections across the
Tanga (Selous) basin, Tanzania and the Majunga bas in, Madagascar ........................................121
55. Distribution of Karoo rocks in Zimbabwe andpart of Zambia, Botswana, and Mozambique ................. 122
56. Distribution of Karoo rocks in Zambia ...................... 12357. Karoo stratigraphy mid-Zambezi valley, Zambia .............. 12558. Cumulative probability distribution for undiscovered
recoverable oil and gas in Karoo rift basins of the Zambia region, southern Africa ....................... 129
iii
Figure 59. East African rift valleys .................................. 13060. Structural map, Lake Malawi, East Africa ................... 13261. Interpretation of a seismic profile across Lake
Malawi, East Africa ...................................... 13362. Cumulative probability distributions of the
undiscovered recoverable oil and gas of theEast African rift basins ................................. 135
63. Schematic structural framework map, Mozambique basin .......13764. West-east seismic profile across the continental
slope offshore Beira, Mozambique ......................... 14065. West-east seismic profile across the continental
shelf offshore Maputo, Mozambique, showing the "southern rift" .......................................... 141
66. Stratigraphic column, Mozambique basin ..................... 14267. Cumulative probability distribution of the undiscovered
recoverable oil and gas of the Mozambique basin .......... 14468. Geological and index map, Tanzania basin ................... 14669. Geologic cross-section A-A 1 through Mandawa 7 wildcat,
Tanzania basin ........................................... 14770. Geologic cross-section B-B 1 through Kisarawe and
Kimbiji structures, Tanzania basin ....................... 14871. Geologic cross-section C-C 1 , Ruvu valley,
Tanzania basin ........................................... 14972. Geologic cross-section D-D 1 across the Zanzibar
channel, Tanzania basin .................................. 15073. Cumulative probability distribution of undiscovered
recoverable oil and gas in the Tanzania basin plus Karoo rift basins within Tanzania ........................ 153
74. Tectonic sketch map of Madagascar .......................... 15475. Structural cross-sections: Majunga and Morondava
basins, Madagascar (from Whiteman, 1981); locationson fig. 74 ...............................................155
76. Cumulative probability distribution of undiscovered recoverable oil and gas in the Majunga and Morondava basins ......................................... 159
IV

TABLES
Page
Play analysis summaries of undiscovered petroleum Table 1. Deltaic sandstones, Nigeria basin ............................ 19
2. Slope diapirs, Nigeria basin ................................ 203. Cretaceous drapes, Nigeria basin ............................ 214. Draped Cretaceous sandstones, Douala basin .................. 295. Sandstones over salt diapirs, Douala basin .................. 306. Growth faults/rollovers, Douala basin ....................... 317. Pre-salt closures, Gabon basin .............................. 418. Salt diapirs, Gabon basin ................................... 429. Pre-salt plays, Congo basin ................................. 56
10. Post-salt plays, Congo basin ................................ 5711. Pre-salt plays, Cuanza basin ................................ 7012. Post-salt plays, Cuanza basin ............................... 7113. Early Cretaceous drapes/faults, Orange basin ................ 8114. Late Cretaceous deltaic sandstones, Orange basin ............ 8215. Cretaceous drapes, Agulhas basin ............................ 90
Summary of undiscovered recoverable petroleum16. West Coast marginal basins (including Agulhas basin) ........ 9317. Interior basins ............................................. 9418. Interior rift basins ........................................ 11919. East Coast marginal basins .................................. 138
Mean values of undiscovered petroleum20. Basin-by-basin summary of southern Africa ................... 16021. Country-by-country summary of southern Africa ............... 162
v

ABSTRACT
Undiscovered recoverable petroleum amounting to 18 billion barrels of oil and 275 trillion cu ft of gas is estimated to be in southern Africa. Preliminary estimates were made on the basis of play analysis for the productive, geologically better known, basins of the west coast. Other basins were assessed by comparison to petroleum yields of tectonically analogous basins. These preliminary estimates were reviewed by a panel from The World Energy Resources Program, and final assessments were made.
Three-fourths of the undiscovered oil and gas appears to be along the western petroleum-productive margin of southern Africa; most is in a single basin, the Nigeria basin, that contains almost half of the undiscovered oil and two-thirds of the gas.
Rift basins, including the rift phase of the continental margin basins and the interior basins, contain a fifth of the oil and gas. If the Niger delta is excluded, more than 40 percent of the oil and gas is in the rift basins.
Six Atlantic coast countries, Nigeria, Cameroon, Gabon, Congo, Zaire and Angola, and two countries adjoining the Indian Ocean, Tanzania and Madagascar, each have substantial undiscovered oil of more than 500 million barrels. These same countries, plus Mozambique and Zambia, contain substantial undiscovered gas of more than 3 trillion cu ft.
INTRODUCTION
Southern Africa, for this study, comprises the countries as far north as Tanzania, Uganda, Zaire, Congo, and the southern parts of Cameroon and Nigeria. Within this region are 15 large sedimentary basins, i.e. interior sags and marginal sags, including underlying rift subbasins (fig. 1), 17 major Karoo rift basins, and a number of younger aged East African rift basins. These basins are in five tectonic trends: 1) rifted and wrenched continental margins accompanying the opening of the Atlantic Ocean, 2) rifted and wrenched continental margins accompanying the opening of the Indian Ocean, 3) intracratonic or interior sags trending northward through central Africa, 4) Permian-Jurassic (Karoo) interior rifts trending northeastward through southern Africa from southern Namibia to the Kenya coast, and 5) a younger rift system with an eastern and western branch trending northward through eastern Africa.
Only the Atlantic continental margin trend has petroleum production, with the consequent availability of appreciable geologic data. These basins, i.e. Nigeria, Douala, Gabon, Congo, Cuanza, Orange (and the related wrenched basin, Agulhas) are assessed by play analysis. The other less explored non- producing basins, where adequate detailed data are not available, are assessed by discounted volumetric yield analogy to producing basins.
The play analysis method employed to assess the Atlantic margin basins is a modified volumetric method with each of the appropriate geologic factors considered separately (Roadifer, 1979). The analysis is built up of seven principal estimates, i.e., acres of untested trap, percent of untested trap area which is presumed to be productive, feet of average effective pay, percent of oil (versus gas) in petroleum mix, primary oil recovery in barrels per acre-foot (BBLS/AF) (a function of reservoir characteristics), gas recovery in thousands of cubic feet per acre foot (MCF/AF), and natural gas liquids (NGL) recovery in barrels per million cubic feet of gas (BBLS/MMCF). The estimates are made with ranges of values to indicate degree of

3(f-
North boundary area of study
International boundaries Marginal sag areas of basins
i Interior sag basins
30° 40"f" II j QuaternaryV///A Post Karoo
E**ffi Karoo
50
-30
e'o°Cap Series
yfl Precambrlan
+3 Crystalline rocks
Figure 1. Map of southern Africa showing area of study, regional geology, and marginal and interior sag basins (rift basins are shown on figures 53 and 59)
uncertainty. The most likely value for each estimated factor is multiplied together with the other factors to indicate a preliminary assessment of undiscovered petroleum for each play in the play-analysis summaries (tables 1- 15); table 16 totals the plays for the Atlantic margin. For brevity, only the most-likely case, or mode, of each range is used in the text discussion of the rationale for various estimates.
The estimates based on play analysis are compared with estimates based on discovery rate curves where sufficient data are available.
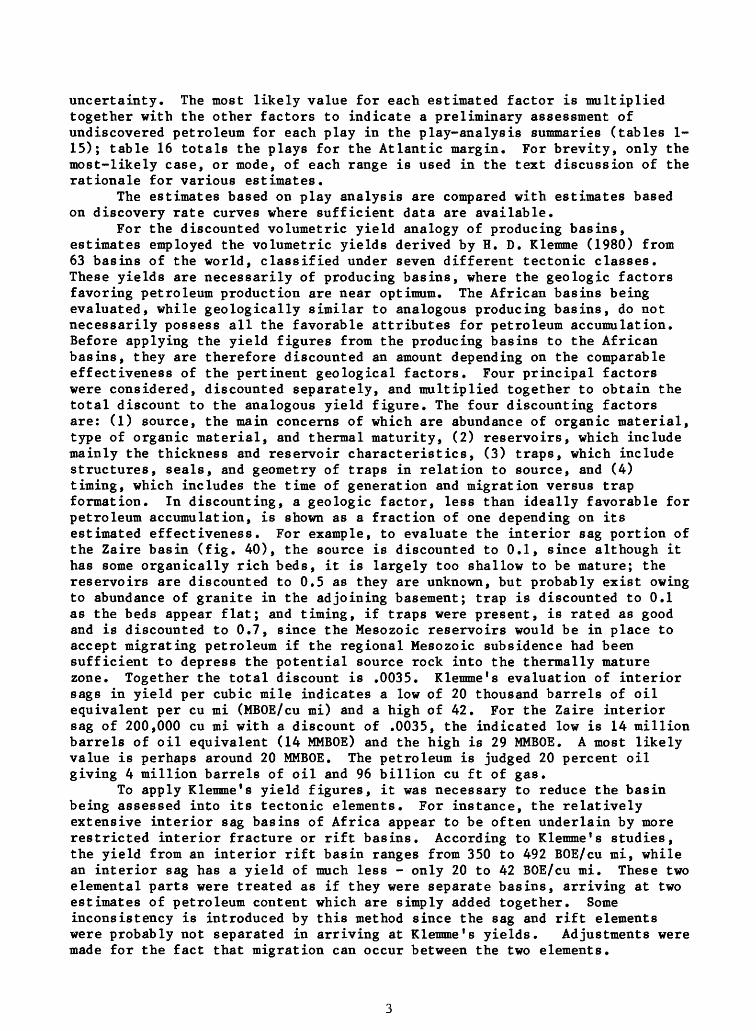
For the discounted volumetric yield analogy of producing basins, estimates employed the volumetric yields derived by H. D. Klemme (1980) from 63 basins of the world, classified under seven different tectonic classes. These yields are necessarily of producing basins, where the geologic factors favoring petroleum production are near optimum. The African basins being evaluated, while geologically similar to analogous producing basins, do not necessarily possess all the favorable attributes for petroleum accumulation. Before applying the yield figures from the producing basins to the African basins, they are therefore discounted an amount depending on the comparable effectiveness of the pertinent geological factors. Four principal factors were considered, discounted separately, and multiplied together to obtain the total discount to the analogous yield figure. The four discounting factors are: (1) source, the main concerns of which are abundance of organic material, type of organic material, and thermal maturity, (2) reservoirs, which include mainly the thickness and reservoir characteristics, (3) traps, which include structures, seals, and geometry of traps in relation to source, and (4) timing, which includes the time of generation and migration versus trap formation. In discounting, a geologic factor, less than ideally favorable for petroleum accumulation, is shown as a fraction of one depending on its estimated effectiveness. For example, to evaluate the interior sag portion of the Zaire basin (fig. 40), the source is discounted to 0.1, since although it has some organically rich beds, it is largely too shallow to be mature; the reservoirs are discounted to 0.5 as they are unknown, but probably exist owing to abundance of granite in the adjoining basement; trap is discounted to 0.1 as the beds appear flat; and timing, if traps were present, is rated as good and is discounted to 0.7, since the Mesozoic reservoirs would be in place to accept migrating petroleum if the regional Mesozoic subsidence had been sufficient to depress the potential source rock into the thermally mature zone. Together the total discount is .0035. Klemme's evaluation of interior sags in yield per cubic mile indicates a low of 20 thousand barrels of oil equivalent per cu mi (MBOE/cu mi) and a high of 42. For the Zaire interior sag of 200,000 cu mi with a discount of .0035, the indicated low is 14 million barrels of oil equivalent (14 MMBOE) and the high is 29 MMBOE. A most likely value is perhaps around 20 MMBOE. The petroleum is judged 20 percent oil giving 4 million barrels of oil and 96 billion cu ft of gas.
To apply Klemme's yield figures, it was necessary to reduce the basin being assessed into its tectonic elements. For instance, the relatively extensive interior sag basins of Africa appear to be often underlain by more restricted interior fracture or rift basins. According to Klemme's studies, the yield from an interior rift basin ranges from 350 to 492 BOE/cu mi, while an interior sag has a yield of much less - only 20 to 42 BOE/cu mi. These two elemental parts were treated as if they were separate basins, arriving at two estimates of petroleum content which are simply added together. Some inconsistency is introduced by this method since the sag and rift elements were probably not separated in arriving at Klemme's yields. Adjustments were made for the fact that migration can occur between the two elements.

The application of this discounted analogy method to the assessment of the various basins is summarized in tables 17-19. The rationale behind the quantitative estimates and analogies used are contained in the text.
The petroleum geology as expressed in this report, including the play analyses and discounted volumetric yield analogies, was presented to a board of geologists of The World Energy Resources Program who, after an in-depth discussion and deliberation from the perspective of individual experiences and a review and adjustment of the preliminary estimates and assumptions, arrived at a subjective consensus as to the amount of recoverable undiscovered petroleum in each basin or convenient group of basins. Because the unknown cannot be predicted with precision, a curve of probabilities better conveys the true nature of the estimate than does a single average value. Conditional upon recoverable resources being present, initial assessments are made for each of the assessed provinces as follows:
(1) A low resource estimate corresponding to a 95-percent probability of more than that amount; this estimate is the 95th fractile (F..).
(2) A high resource estimate corresponding to a 5-percent probability of more than that amount; this estimate is the 5th fractile (F_).
(3) A modal ("most likely") estimate of the quantity of resource associated with the greatest likelihood of occurrence.
The results of the final estimates are averaged, and those numbers are computer processed by using probabilistic methodology (Crovelli, 1981) to show graphically the resource values associated with a full range of probabilities and to determine the mean, as well as other statistical parameters.
The mean probability is an important objective of this study. It not only embodies with due emphasis the most likely quantities of the probability range, but, significantly, includes the appreciably higher but less likely quantities; that is, it takes into account the possibility of substantial "sleepers", e.g., subtle traps and unknown plays.
ATLANTIC MARGIN BASINS
Regional Geology Structure
The basins to be considered, the Nigeria, Douala, Gabon, Lower Congo, Cuanza, Orange, and Agulhas basins, owe their structural configuration and sedimentation patterns to the rifting, peripheral wrenching, and subsequent sagging that accompanied the opening of the south Atlantic in the Early Cretaceous.
This north-south trend of basins falls into four segments. The northern segment, the Guinea Gulf segment, includes the Niger Delta area (and the adjoining east-trending north coast of the Gulf of Guinea (the Guinea Gulf segment). It is strongly affected by sinistral wrenches and transform faults manifested in an array of deep trenches and ridges extending eastwards from the mid-Atlantic Ridge to impinge on the west African coast (fig. 2). This east-trending fault trend extends into the continental crust area in the form of the Cretaceous rift basins of Benue and Chad. The southern boundary of the Guinea Gulf Segment is the east-trending Guinea Ridge (associated with the Ascension Fault Zone) which curves northeastward at the African coast. At
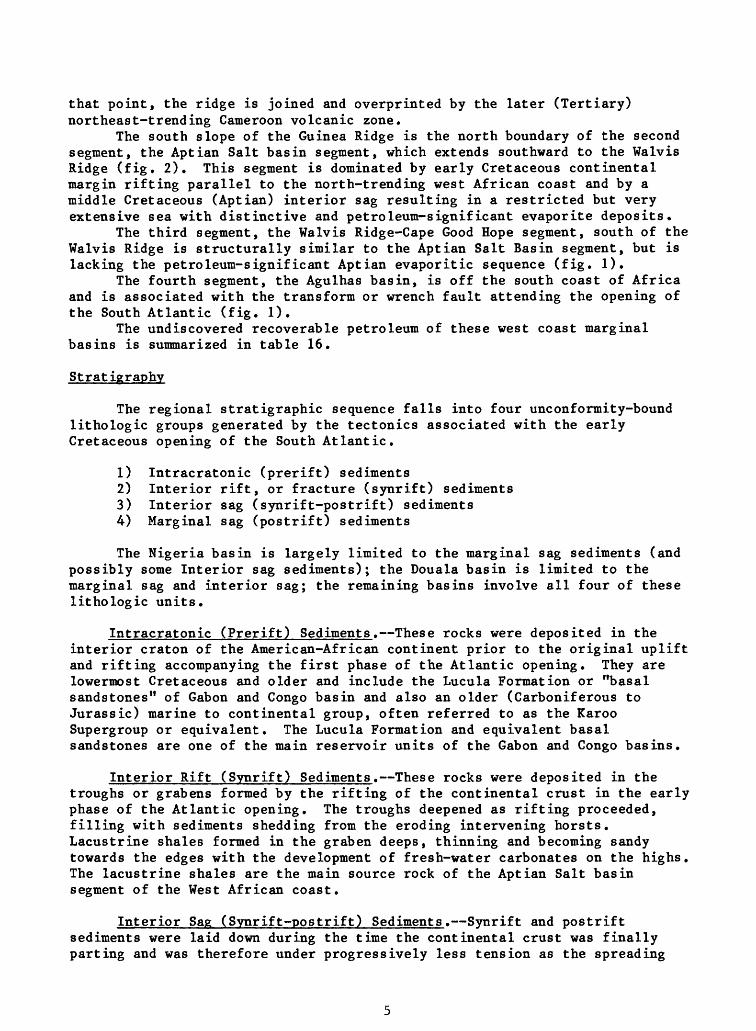
that point, the ridge is joined and overprinted by the later (Tertiary) northeast-trending Cameroon volcanic zone.
The south slope of the Guinea Ridge is the north boundary of the second segment, the Aptian Salt basin segment, which extends southward to the Walvis Ridge (fig. 2). This segment is dominated by early Cretaceous continental margin rifting parallel to the north-trending west African coast and by a middle Cretaceous (Aptian) interior sag resulting in a restricted but very extensive sea with distinctive and petroleum-significant evaporite deposits.
The third segment, the Walvis Ridge-Cape Good Hope segment, south of the Walvis Ridge is structurally similar to the Aptian Salt Basin segment, but is lacking the petroleum-significant Aptian evaporitic sequence (fig. 1).
The fourth segment, the Agulhas basin, is off the south coast of Africa and is associated with the transform or wrench fault attending the opening of the South Atlantic (fig. 1).
The undiscovered recoverable petroleum of these west coast marginal basins is summarized in table 16.
Stratigraphy
The regional stratigraphic sequence falls into four unconformity-bound lithologic groups generated by the tectonics associated with the early Cretaceous opening of the South Atlantic.
1) Intracratonic (prerift) sediments2) Interior rift, or fracture (synrift) sediments3) Interior sag (synrift-postrift) sediments4) Marginal sag (postrift) sediments
The Nigeria basin is largely limited to the marginal sag sediments (and possibly some Interior sag sediments); the Douala basin is limited to the marginal sag and interior sag; the remaining basins involve all four of these lithologic units.
Intracratonic (Prerift) Sediments. These rocks were deposited in the interior craton of the American-African continent prior to the original uplift and rifting accompanying the first phase of the Atlantic opening. They are lowermost Cretaceous and older and include the Lucula Formation or "basal sandstones" of Gabon and Congo basin and also an older (Carboniferous to Jurassic) marine to continental group, often referred to as the Karoo Supergroup or equivalent. The Lucula Formation and equivalent basal sandstones are one of the main reservoir units of the Gabon and Congo basins.
Interior Rift (Synrift) Sediments. These rocks were deposited in the troughs or grabens formed by the rifting of the continental crust in the early phase of the Atlantic opening. The troughs deepened as rifting proceeded, filling with sediments shedding from the eroding intervening horsts. Lacustrine shales formed in the graben deeps, thinning and becoming sandy towards the edges with the development of fresh-water carbonates on the highs. The lacustrine shales are the main source rock of the Aptian Salt basin segment of the West African coast.
Interior Sag (Synrift-postrift) Sediments. Synrift and postrift sediments were laid down during the time the continental crust was finally parting and was therefore under progressively less tension as the spreading
S.C
AP
E P
AL
MA
S
Ab
idja
n
"SC
AR
PM
EN
"
NIGER DELTA
DOUALA B.
GABON B.
-6° CONGO B.
-1CP CUANZA B.
Figu
re 2. Gulf of
Guinea (m
odif
ied
after
Emery
et al
., 1975), sh
owin
g location of
Atlantic
marg
inal
basins
betw
een
the
Atlantic ea
st-w
est
equatorial fr
actu
re zones
and
Walvis Ridge,

was taken up by the oceanic crust. The thermal effects on the continental crust were also abating as the distance from the center of the spreading to the continental crust increased. Thermal subsidence or sagging began, faulting and consequent horst- and graben-forming activity ceased, and erosion reduced the topography. The opening basin, however, was still restricted from the open oceans; a broad shallow basin of continental beds, occupying interior continental crust and some oceanic crust area. The continental beds graded-up into shallow evaporites including salt (Aptian Salt Basin) as sea water encroached into the interior sea.
Marginal Sag (Postrift) Sediments. Finally the transitional interior sag period was completed and the break between continents was so great as to allow the entry of open-marine seas. The continents had moved further from the hot, spreading center, and subsidence was relatively rapid with the consequent deposition of Upper Cretaceous to Neogene thick marine to deltaic sediments, e.g. the Niger, Ogooue, Congo, and Orange deltas.
Nigeria Basin Location and Size
Nigeria Basin covers approximately southern Nigeria, but extends eastward into Cameroon some eight percent (figs. 1,2,3,4). The western boundary is assumed to be at the edge of the present delta, approximately at Nigeria's western border; the southwestern boundary is near the base of the continental slope at about 6,600 ft (2,000 m) water depth (fig. 2); the eastern boundary is at the north-east trending line of volcanic centers (Cameroon Volcanic Zone) (fig. 2); and the northern boundary rather arbitrarily is placed at the east-west segment of the Benue River (arbitrarily, because the Nigeria basin merges with the northeast-trending Benue Trough which continues into Chad) (fig. 2). As so defined, the basin has an area of 92,000 sq mi and a volume of 400,000 cu mi.
The principal play of the basin is the Niger delta which has an area of some 46,000 sq mi (29.44 million acres) in less than 600 ft water depth. If one includes the more prospective part of the continental slope, the delta area altogether is 52,000 sq mi.
Exploration and Production History
The earliest oil exploration (1908-1914) was some 14 shallow dry holes drilled near surface seeps in the Cretaceous outcrop area. In the late thirties, comprehensive exploration began which, with an interruption for World War II, has continued to present. Beginning in 1947, geophysical and shallow drilling exploration was initiated, and the first deep test was drilled in 1951. Investigations switched from Cretaceous prospects to the Tertiary delta area, and in 1956 the first oil discovery was made. In 1958 the first giant oil field, Bomu, was discovered. The first offshore giant field, Okan, was discovered in 1964.
Up to the end of 1984, over 900 wildcats had been drilled resulting in the discovery of oil reserves amounting to some 26.4 billion barrels of oil (BBO). Gas has also been discovered, but not actively produced so that the reserves are not established to the same extent as oil. Exploration has been quite successful with a wildcat discovery rate of 40 percent.
7H
NF
O
F
CL
AY
D
IAP
IRIZ
M
[ZO
NE
O
F C
OLLA
P-j Z
ON
E
OF
F
AIR
LY
R
EG
UL
AR
Z
ON
E
OF
C
LA
Y
UIA
KIH
U.M
j
CR
ES
T
ST
RU
J. R
OLLO
VE
R
ST
RU
CT
UR
ES
jCT
UR
ES
A
ND
,
I fs
AC
K-T
O-B
AC
K
i F
AU
LT
ING
SS
W!
CO
AS
T
LIN
E
|N
NE
Ui
12000 -
H
74
00
0 -
j
76000
-J
^<
^>
/;-
1'D
EV
EL
OP
ME
NT
'^^f^
^^^'^
^'^
C'
VX-
'N\
_
rr^T
/j^'^
MV
/.-';r/l/-
x' ^J^\'l'r G
RA
NIT
IC C
RU
ST
>-l'>
'r^
^l^
:'?
' - -
'-/;
* N; -
'"''
'-"' 'X
M - '
\ -
^T
f^.^
vT
T
-fX
''/0
>/r
r*-'"
'7'-
''''
/.-jw
-*
1*' ~
-
^
.
/t j'-'tr
,. i
i A
..'
V
..
-i
r .
< * *^
JL
LllT
rNS
AS
XlL
r/C
C
ffL
/ST
DE
LT
A
;Vo
lca
nic
s
r~ ime str
atigra
phic
units
MA
NT
LE
^^ ^.
ZO
NE
O
F
CO
NT
AC
T
, B
ET
WE
EN
O
CE
AN
IC
Continenta
l slo
pe
ch
an
ne
l A
ND
C
ON
TIN
EN
TA
L
CR
US
T
fills
a
nd
tu
rbid
itic
fa
ns
in th
e A
ka
ta
Form
ation
100km
00
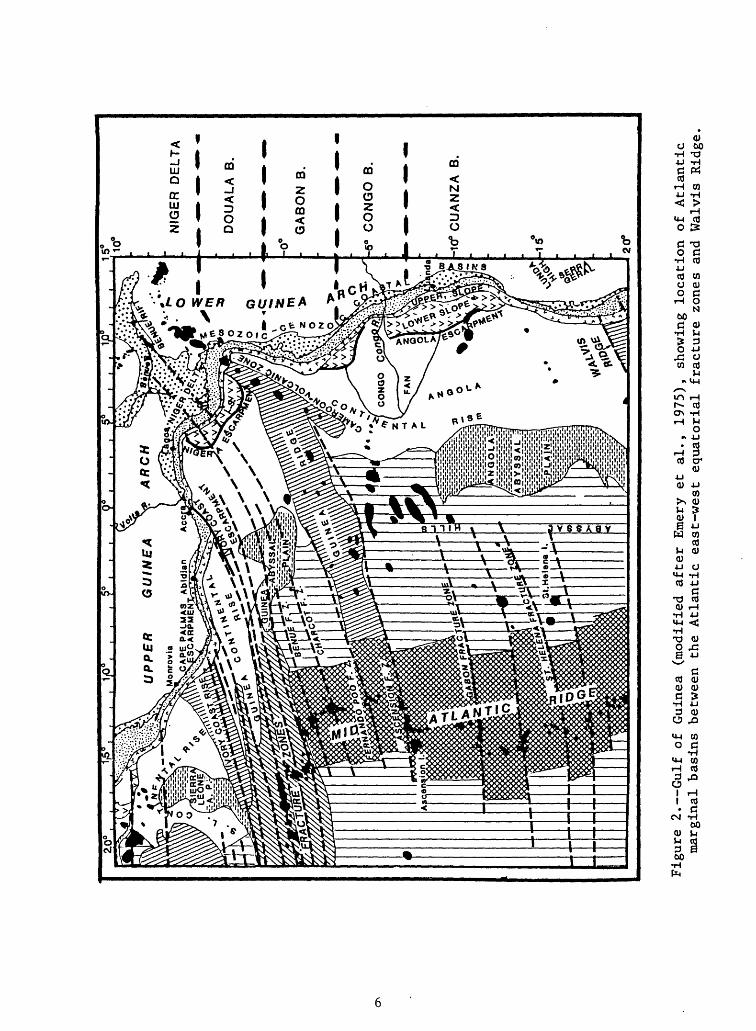
Fig
ure
3. S
chem
ati
c dip
-secti
on of
the
Nig
eria
bas
in
(aft
er
Kam
erli
ng
, fr
om W
eber
an
d D
auko
ru,
19
75
).
^ v^
ocen
e
* *
+ *
Pre
-Cre
taceo
us
\ \
4. b
asem
ent
ou
tcro
p
\ \
\
\O
utl
ine
of
\ \
bas
emen
t b
lock
s \
\
\\S
anto
nia
n o
rog
enic
bel
t \
*
/O,
FO
RT
^M
AR
CO
UR
T
**U
^
\ \ \\
axis
4
dir
ecti
on
of
clas
tic
sup
ply
Bou
guer
Iso
gam
s
--
-\
Lo
wer
Ter
tiar
y b
asin
Y
Ap
pro
xim
ate
coas
tlir
e p
osi
tio
n &
te
nta
tive
ear
ly
dra
inag
e p
atte
rn
of T
erti
ary
del
ta
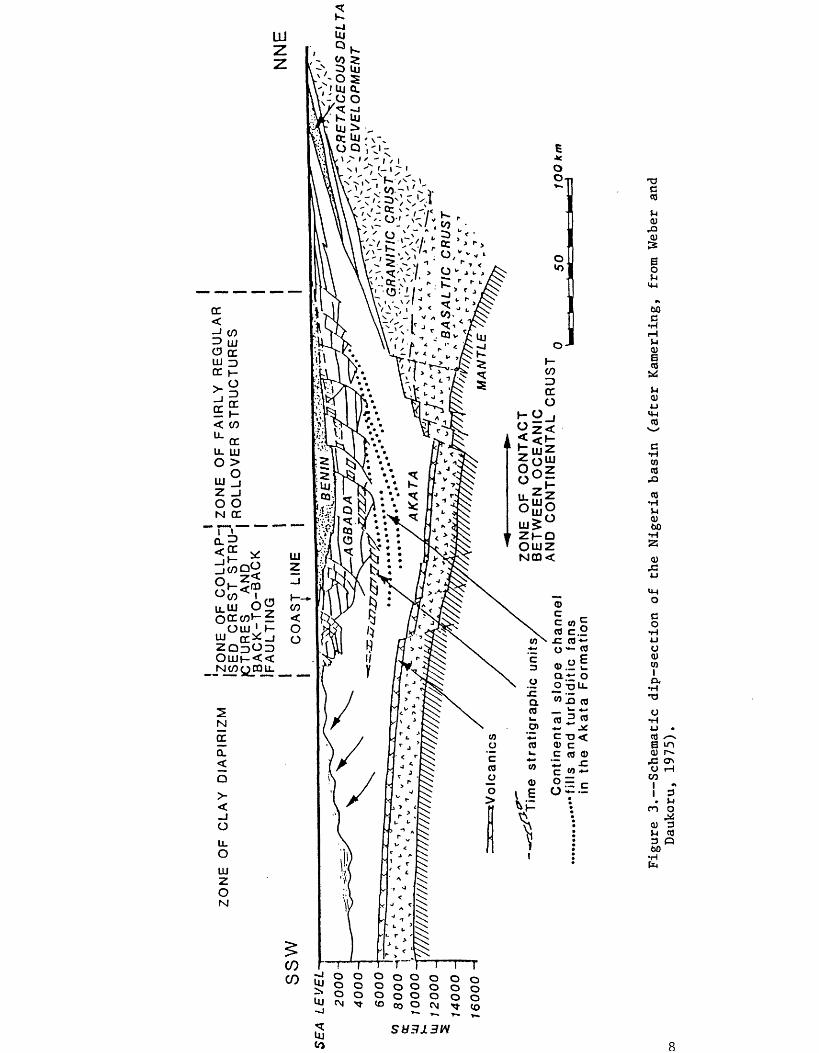
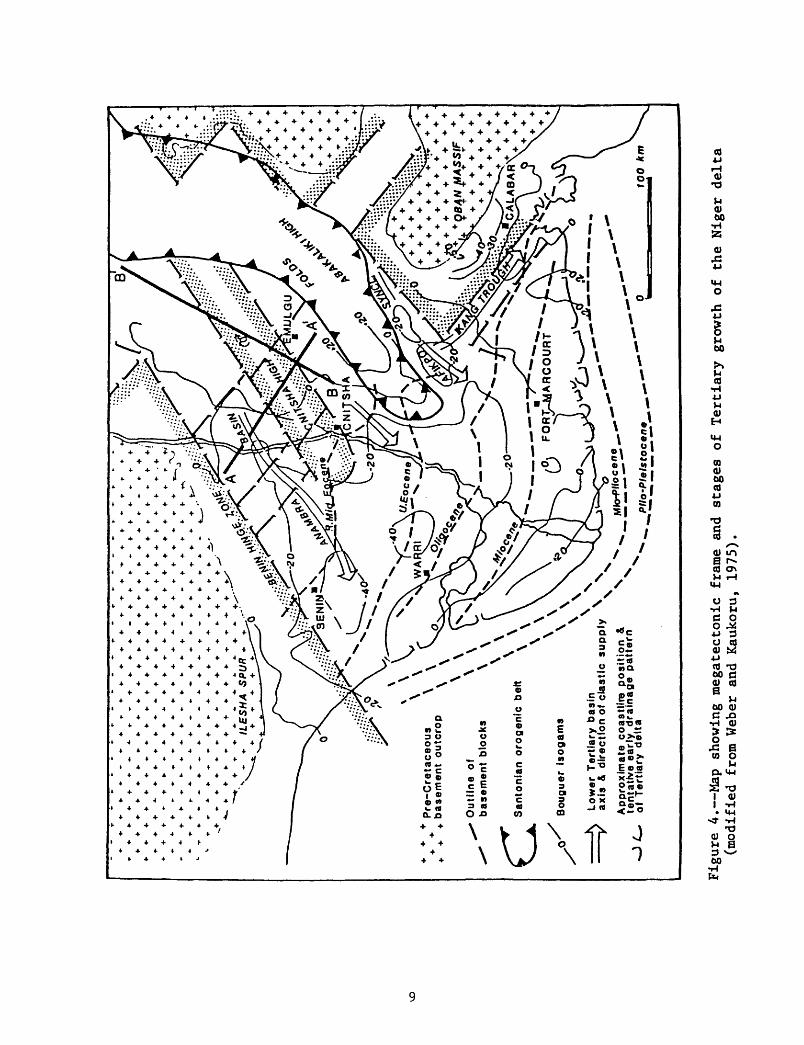
Figu
re 4. Map sh
owin
g megatectonic frame
and
stag
es of
Tertiary growth of
th
e Niger
delt
a (m
odif
ied
from
Weber
an
d Kaukoru, 19
75).

Structure
Regional Tectonics. The Nigeria basin, situated as it is, at the head of the Gulf of Guinea, occupies a zone where the east-trending equatorial oceanic fracture zones or transform faults between the North and South Atlantic intersects the African continental crust and appears to extend into the continent, forming the Cretaceous rifts of the Benue Trough and Chad (fig. 2). These transform zones appear to override the early Cretaceous rifting seen on the eastern continental edge of the South Atlantic, but are of approximately the same age. The ridges accompanying the transform features are truncated by Albian-Cenomanian marine beds, dating them as early Cretaceous and indicating a continental margin sag and invasion of the sea in early Late Cretaceous. During the Santonian, the Benue Trough, and probably the on-trend portion of the Niger delta area, was affected by folding due to wrenching or compression (fig. 4). This folding was accompanied by magmatic activity at least in the Benue Trough region. Renewed subsidence with major marine transgression occurred in Campanian-Maastrichtian period.
The Niger delta began in the early Tertiary, being at first confined to the subsiding, narrow western extension of the Benue Trough and then building out southwestward on to the continental shelf and finally out over the oceanic crust (figs. 2 and 3). The present cone-shaped front first developed in the Miocene and the delta's maximum growth occurred in late Tertiary (fig. 4). Projected gravity and magnetic data indicate that the present depth of the oceanic basement under the central delta reaches some 26,000 ft (8 km, Hospers, 1970).
Structural Traps. Four kinds of structural traps found in the Niger delta area are: (1) growth-fault and rollover features of the Tertiary delta, (2) diapirs (shale or salt-cored) of the deltaic continental slope, (3) horst and graben features, formed during Cretaceous rifting and wrenching, and (4) folds, compressional or drag, involving Cretaceous strata on the eastern side of the basin.
1) Growth-fault and rollover traps of the Tertiary delta. To date, the Tertiary growth-faults and rollover features of the Niger delta are the only petroleum-producing traps in the Nigeria area. We estimate from Evamy and others' map (fig. 5) that in 1978 some 608 sq mi of oil or gas fields of this play had been discovered. From a few published field maps and sections it is surmised that oil and gas fields occupy about 60 percent of their structural closures. This, together with the success rate of 40 percent, indicates that the fields occupy about 24 percent of the originally mapped and tested trap area which accordingly would have amounted to some 2,500 sq mi. However, at that time (1978), all the traps had not been discovered or tested.
The untested trap area of the Niger delta may be estimated by an adjusted comparison of its exploration history to that of the structurally analogous Gulf Coast basin of the United States which is of comparable size and has a parallel field-size distribution (except with a lower economic field-size cutoff). At the end of 1978 the Niger delta, of 46,000 sq mi, had been explored by 782 wildcats, testing 2,500 sq mi of trap. By analogy, when the wildcatting in the Gulf Coast (Federal Outer Continental Shelf) of some 58,000 sq mi had reached the same drilling density (one wildcat to 58.8 sq mi), 986 wildcats had been drilled and 55 percent of the 1978 Gulf Coast oil and gas reserves had been found (extrapolation from figure 4 in Drew and
10

ST
RU
CT
UR
AL
D
ATA
STR
UC
TUR
E B
UIL
WN
O F
AULT
S
CR
ESTA
L a F
LAN
K
FAU
LTS
AN
TITH
ETI
C F
AU
LTS
NO
RTH
WP
Pt«
a C
RES
TAL
AREA
S
,.
STR
UC
TUR
AL
FLA
NK
S W
ITH
/
MO
DERA
TE W
PS a
EXP
ANSI
ON
STR
UC
TUR
AL
FLA
NK
S W
ITH
ST
KJ»
WPS
a E
XPA
NSI
ON
UA
Mm
OR
OC
AA
eCN
KL
T!
. +MA
SS
1F-+
-
^.x-2^
FIE
LDS
FO
R W
HIC
H A
BO
VE R
ATIO
IS
UN
KN
OW
N
>
SO
FT.
AG
GRE
GAT
E W
Y
SU
SPEN
DED
-.
.,-
x ^
<
9Q
FT
AG
GRE
GAT
E PA
Y H
YDR
OC
AR
BO
NS
NO
T v
KN
OW
N
, >
£T
sO
Ft
AGG
REG
ATE
*Y
+ D
RY
a. A
BA
ND
ON
DED
4
«
< IS
O F
T A
flGR
ECA
TE K
Y
'-
Figu
re 5. Structural ma
p, Ni
ger
delt
a ar
ea (f
rom
Evam
y et
al
., 1978).
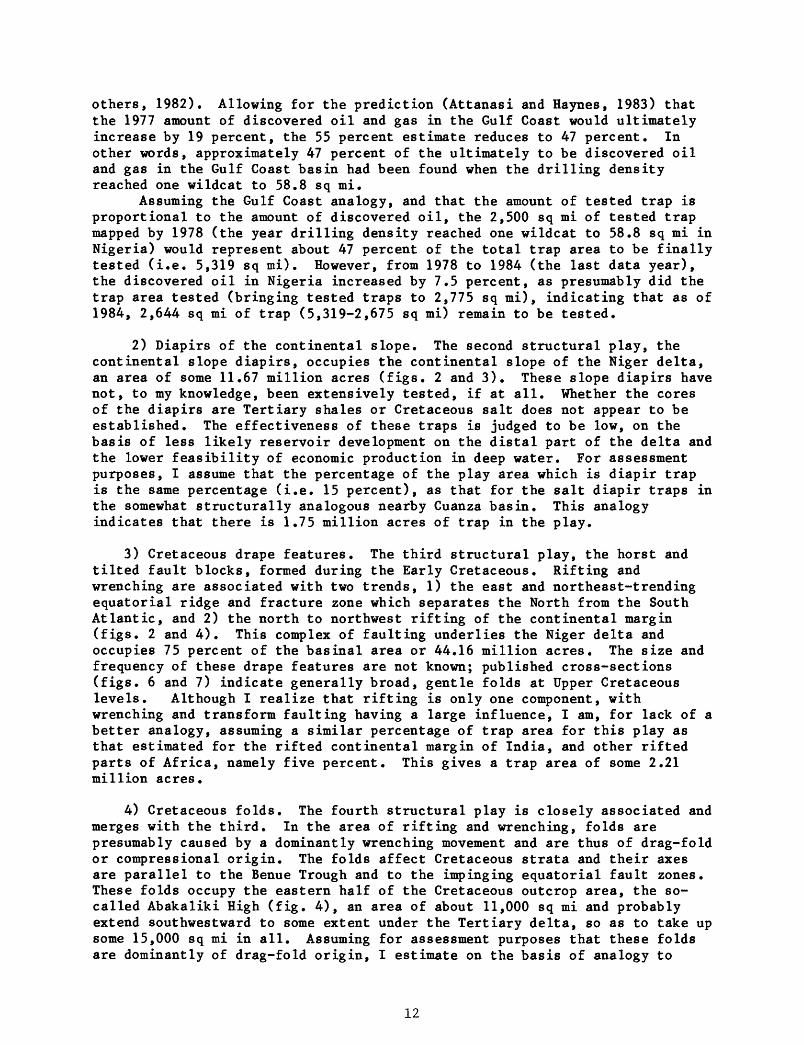
others, 1982). Allowing for the prediction (Attanasi and Haynes, 1983) that the 1977 amount of discovered oil and gas in the Gulf Coast would ultimately increase by 19 percent, the 55 percent estimate reduces to 47 percent. In other words, approximately 47 percent of the ultimately to be discovered oil and gas in the Gulf Coast basin had been found when the drilling density reached one wildcat to 58.8 sq mi.
Assuming the Gulf Coast analogy, and that the amount of tested trap is proportional to the amount of discovered oil, the 2,500 sq mi of tested trap mapped by 1978 (the year drilling density reached one wildcat to 58.8 sq mi in Nigeria) would represent about 47 percent of the total trap area to be finally tested (i.e. 5,319 sq mi). However, from 1978 to 1984 (the last data year), the discovered oil in Nigeria increased by 7.5 percent, as presumably did the trap area tested (bringing tested traps to 2,775 sq mi), indicating that as of 1984, 2,644 sq mi of trap (5,319-2,675 sq mi) remain to be tested.
2) Diapirs of the continental slope. The second structural play, the continental slope diapirs, occupies the continental slope of the Niger delta, an area of some 11.67 million acres (figs. 2 and 3). These slope diapirs have not, to my knowledge, been extensively tested, if at all. Whether the cores of the diapirs are Tertiary shales or Cretaceous salt does not appear to be established. The effectiveness of these traps is judged to be low, on the basis of less likely reservoir development on the distal part of the delta and the lower feasibility of economic production in deep water. For assessment purposes, I assume that the percentage of the play area which is diapir trap is the same percentage (i.e. 15 percent), as that for the salt diapir traps in the somewhat structurally analogous nearby Cuanza basin. This analogy indicates that there is 1.75 million acres of trap in the play.
3) Cretaceous drape features. The third structural play, the horst and tilted fault blocks, formed during the Early Cretaceous. Rifting and wrenching are associated with two trends, 1) the east and northeast-trending equatorial ridge and fracture zone which separates the North from the South Atlantic, and 2) the north to northwest rifting of the continental margin (figs. 2 and 4). This complex of faulting underlies the Niger delta and occupies 75 percent of the basinal area or 44.16 million acres. The size and frequency of these drape features are not known; published cross-sections (figs. 6 and 7) indicate generally broad, gentle folds at Upper Cretaceous levels. Although I realize that rifting is only one component, with wrenching and transform faulting having a large influence, I am, for lack of a better analogy, assuming a similar percentage of trap area for this play as that estimated for the rifted continental margin of India, and other rifted parts of Africa, namely five percent. This gives a trap area of some 2.21 million acres.
4) Cretaceous folds. The fourth structural play is closely associated and merges with the third. In the area of rifting and wrenching, folds are presumably caused by a dominantly wrenching movement and are thus of drag-fold or compressional origin. The folds affect Cretaceous strata and their axes are parallel to the Benue Trough and to the impinging equatorial fault zones. These folds occupy the eastern half of the Cretaceous outcrop area, the so- called Abakaliki High (fig. 4), an area of about 11,000 sq mi and probably extend southwestward to some extent under the Tertiary delta, so as to take up some 15,000 sq mi in all. Assuming for assessment purposes that these folds are dominantly of drag-fold origin, I estimate on the basis of analogy to
12

Str
uctu
ral
cros
s-se
ctio
n
A NW
A'
Eflol
l 1
TO 9
76 m
RIVE
R NJ
G R
Anam
bra
Balva
r 1
IA
mai
ulod
o 1
Eza
Aku
Axi
al c
ross
-sec
tion
Figure 6. Structural cr
oss-
sect
ion
of the northern Cr
etac
eous
part of
the
Nigeria ba
sin
(from Ak
po and
Olu, 1981).
Location on
fig. 4.
b
Akuk
wa 2
lhan
dlag
u 1
Adok
a 1
Ocha
ku R
iver
2 0
20
40km
TO 3
,655
m
Figure 7. Axial cr
oss-
sect
ion
of the no
rthe
rn
Cretaceous part of
the Ni
geri
a basin.
(fro
m Akpo an
d Olu, 19
81).
Lo
cati
on on
fi
g. 4

other wrenched basins (Central Sumatra, Los Angeles), that the trap area is 5.5 percent of the play area of 15,000 sq mi or 528 million acres. Lack of seal, however, causes these traps to be largely ineffective.
Stratigraphy
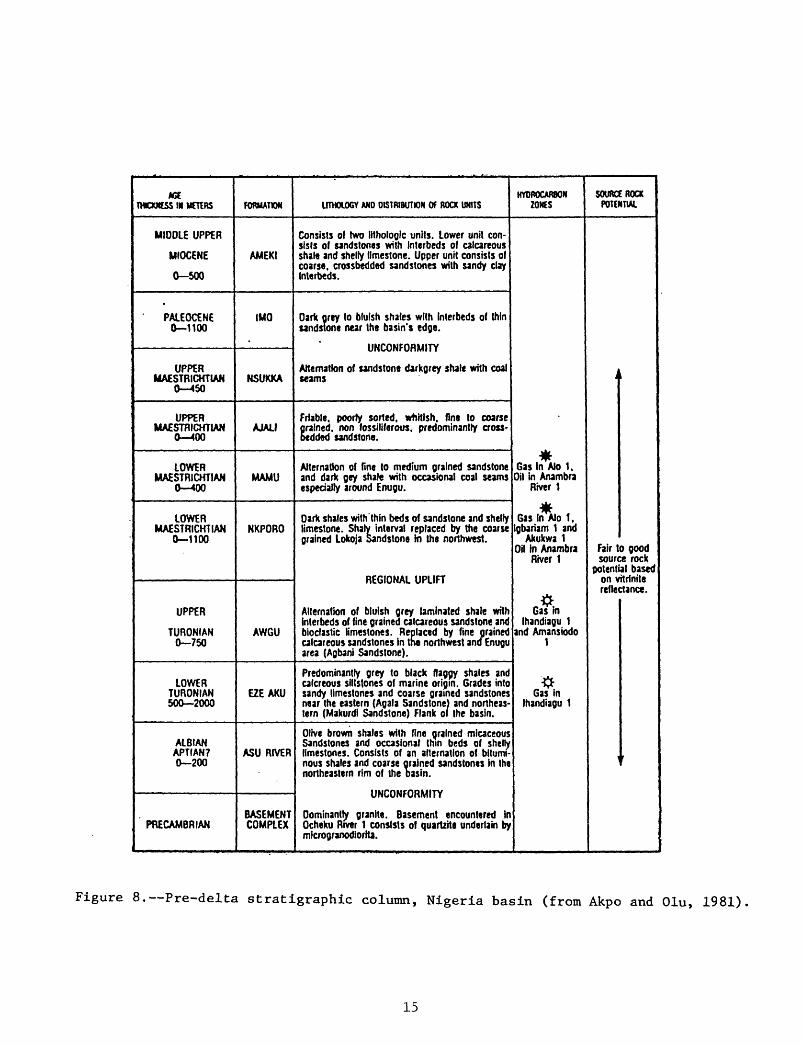
General Section. The stratigraphic section is in two sequences. The lower sequence is middle Cretaceous to Eocene marine sandstones and shales, which in the "Anambra Basin" (just north of the delta apex) can be divided into two groups: (1) a section of Albian to Upper Turonian shales with interbedded sandstones and shales, which is as much as 3,000-ft thick (fig. 8), and (2) a sequence of Maastrichtian to Miocene paralic sandstones and shales, as much as 2,400-ft thick, which was deposited after Upper Santonian- Lower Campanian folding and uplift.
The upper sequence is a 30,000-ft-thick wedge of the Tertiary delta and is divided into three time-transgressing regressive formations (fig. 3). The lower unit, the Akata Formation, is a thick section of shallow-marine shales with a few sands. This unit is well over 10,000 ft thick and is largely over- pressured. The Akata Formation has only negligible reservoirs, but is a good source rock.
Overlying and interfingering with the Akata Formation is the Agbada Formation which contains the primary reservoirs of the Niger basin. The thickness of this sandstone and shale sequence exceeds 12,000 ft in the central part of the basin. The upper part of the Agbada is about 75 percent sandstone and the lower part 50 percent.
The upper unit is the Benin Formation of continental sands and gravels with local shales. Its thickness ranges up to 6,000 ft. The general lack of seals limit petroleum occurrence to a few fields in this unit.
Reservoirs. For assessment purposes, reservoirs have been grouped into Cretaceous pre-delta sandstones and Tertiary Niger delta sandstones.
Sandstone reservoirs appear to be relatively abundant in the Cretaceous section, their thickness and distribution varying widely (figs. 6 and 7). The Lower Turonian Eze Aku Formation of the "Anambra Basin" in the north (fig. 8), for example, has 770 cumulative net feet of reservoir while the equivalent "Turonian Sandstone" on the west flank of the delta at the western Nigeria border is 1,600 ft thick and has two reservoirs containing oil-in-place exceeding 100 million barrels (the Seme Oil Field). The Lower Maastrichtian Nkpero Formation has net gas sands ranging from 100 to 233 ft. I estimate an average net reservoir thickness for the late Cretaceous of 150 ft. The only porosity data available indicates 15 to 18 percent in the Awgu Formation north of the delta and 20 percent in the Seme Oil Field west of the delta. I assume 18 percent porosity to be the average for the Cretaceous play.
The reservoir sandstones of the Tertiary Niger delta are confined to the Agbada Formation. They are discontinuous in nature, barrier bars, channel sands, and point bars associated with delta deposition. They are laterally extensive. Multiple reservoirs are common, yielding thick cumulative net pay; field area and reserve figures from some of the larger fields indicate cumulative net pays range from 250 to 500 ft. I estimate future smaller fields will average 300 ft of cumulative net pay. The deltaic reservoirs have porosities generally ranging from 25 to 35 percent; I assume an average of 25 percent and an oil recovery factor of 25 percent. Future wildcats will be deeper; I estimate the average depth of deltaic reservoirs will be 8,000 ft.
14
MX THOOttSS IN METERS
MIDDLE UPPER
MIOCENE
Q 500
PALEOCENE 0 1100
UPPER MAESTRICHTIAN
0 450
UPPER MAESTRICHTIAN
0-400
LOWER MAESTRICHTIAN
0 400
LOWER MAESTRICHTIAN
0 1100
UPPER
TURONIAN 0-750
LOWER TURONIAN 500 2000
ALBIAN APTIAN? 0 200
PRECAMBRIAN
FORMATION
AMEKI
IMO
NSUKKA
AJALI
MAMU
NKPORO
AWGU
EZEAKU
ASU RIVER
BASEMENT COMPLEX
UTHOtOGY AND DISTRIBUTION Of ROCK UNITS
Consists ol two llthologlc units. Lower unit con sists ol sandstones with Interbeds ol calcareous shale and shelly limestone. Upper unit consists ol coarse, crossbedded sandstones with sandy clay Interbeds.
Dark grey to bluish shales with Interbeds ol thin sandstone near the basin's edge.
UNCONFORMITY
Alternation of sandstone darkgrey shale with coal teams
Friable, poorly sorted, whitish, fine to coarse grained, non lossiliferous. predominantly cross- bedded sandstone.
Alternation of fine to medium grained sandstone and dark gey shale with occasional coal seams especially around Enugu.
Dark shales with thin beds of sandstone and shelly limestone. Shary interval replaced by the coarse grained Lokoja Sandstone hi the northwest.
REGIONAL UPLIFT
Alternation of bluish grey laminated shale with interbeds of line grained calcareous sandstone ant bioclastic limestones. Replaced by fine grained calcareous sandstones in the northwest and Enugu area (Agbani Sandstone).
Predominantly grey to black flaggy shales and calcreous siltstones of marine origin. Grades into sandy limestones and coarse grained sandstones near the eastern (Agala Sandstone) and northeas tern (Makurdi Sandstone) Flank ol the basin.
Olive brown shales with fine grained micaceous Sandstones and occasional thin beds of shelly limestones. Consists of an alternation of bitumi nous shales and coarse qrained sandstones in the northeastern rim of the basin.
UNCONFORMITY
Dominanlty granite. Basement encountered in Ocheku River 1 consists of quartzita underlain by mlcrogranodiortta.
HYDROCARBON ZONES
*Gas In Ato 1.
Oil in Anambra River 1
-# Gasln Alo 1.
Igbariam 1 and Akukwa 1
Oil in Anambra River 1
# Gas in
lhandiagu 1 and Amansiodo
1
'<*
Gas in lhandiagu 1
SOURCE ROCK POTENTIAL
t
FairtSOUK
potent! on v refle*
'
o good A rock al based ttrlnite :tance.
f
Figure 8. Pre-delta stratigraphic column, Nigeria basin (from Akpo and Olu, 1981)
15

Seals. Seals appear to be generally poor in the Cretaceous updip of the Tertiary delta. Only those Cretaceous-targeted wildcats in the deeper axial extension of the Benue Trough (Anambra basin) or more downdip, oceanwards, under the deeper parts of the delta have found gas and oil. Elsewhere in the basin, petroleum has been flushed from the Cretaceous reservoirs.
The Tertiary deltaic sands of the Agbada Formation are, in general, fairly well sealed by overlying and adjacent deltaic shales. Seals may be breached by growth faults extending upwards into the Benin Formation. Although it has good reservoirs, the Benin Formation is insufficiently sealed to accumulate hydrocarbon.
Source Section. In general, the Cretaceous sequence of the Nigeria Basin has fair to good source rock properties, as does the lower part of the overlying deltaic sediments, the Akata Formation. Thermal maturity also approximately limits source rocks to the lower delta and older sediments.
Petroleum Generation and Migration
Richness of Source. The pre-Niger delta sediments, from Albian to Eocene are considered to be of source richness, having an average organic content of more than 5 percent. Shales in the Eze Aku and Awgu Formations (fig. 8) are the richest, being up to 7.4 percent total organic carbon (TOG) (Fetters, 1982) and are characterized by abundant planktonic fossils and total absence of benthonic fossils suggesting anaerobic bottom conditions (Fetters and Ekweozor, 1982). The kerogens fall into the type II-III category indicating both marine and continental sources (Ekweozor and Gormly, 1983).
Evamy and others (1978) state that "..., not only was the organic content of the Tertiary deltaic sediments low, but it was of the humic and mixed types which are purported to be precursors for gas and light oil, respectively." Nwachukwa and Chukwura (1986), however, tested samples from Agbada shale in the western part of the delta and found poor to high amounts of organic matter, the range of TOG values (0.2 to 6.5 percent) comparing reasonably well with values of Ekweozor and Okoye (1980) for the Tertiary Niger delta as a whole. Nwachukwa and Chukwura (1986) found that although the kerogen is type III, the abundance of amorphous organic matter suggests oil source.
Depth and Volume of Source Rock. In the drilled sections of the Cretaceous "Anambra Basin" just updip from the apex of the Niger delta, vitrinite reflective values (0.7 reflectance, wildcat Akukwa-2) indicate the top of the thermally mature sediments to be at a depth of about 6,560 ft (Ekweozor and Gormly, 1983). This Cretaceous area, in line with the Benue Trough, has a thermal gradient of 2.0 to 3.0° F/100 ft. Oceanward in the more rapidly subsiding Tertiary delta and its flanks, the thermal gradient appears to be lower, i.e. 1.0 to 2.0° F/100 and consequently the top of the thermally mature sediments are somewhat deeper.
Various investigators have mapped the top of the oil generating window over the delta and indicate an average depth of about 10,000 to 13,000 ft. In general, the oil generating window appears to affect the upper part of the Akata Formation and the lower part of the Agbada Formation. The gas-producing zone falls largely in the Akata Formation and below.
I estimate the volume of mature and over-mature source rock to be some 300,000 cu mi.
16
Oil versus gas. While it appears from the geology and geochemistry discussed that the gas resources of the basin should be considerable, gas has been neglected in favor of the more easily produced and marketed oil and probably the true gas reserves for the Niger basin are not close to being established. The analogous Gulf Coast basin, which has been extensively exploited for gas, had reserves as of 1977 of 9.47 billion barrels of liquid hydrocarbon and 94.28 trillion cu ft of gas, and an average of 16 barrels of natural gas liquids per million cu ft of gas (Attanasi and Haynes, 1983). If the indicated natural gas liquids are subtracted from the total liquids, the remaining crude oil is, on an oil equivalent basis, about half the gas, i.e. 8 BBO to 15.7 BBOE of gas (natural gas liquids amounting to 1.5 BBOE). If there is a complete analogy of the Niger delta to the Gulf Coast basin, the petroleum mix of the Niger delta is about 33 percent crude oil to 67 percent gas. However, potential gas fields have probably been bypassed in favor of oil, so that the future ratio for new fields is estimated to be only 25 percent oil versus 75 percent gas.
Migration timing versus trap formation. Assuming thermal gradients and rates of subsidence were fairly constant through the Cretaceous and Tertiary, oil and gas generation would have commenced after some 10,000 ft of sediment had been deposited which would have been in the upper Cretaceous. Traps in the form of drapes over Cretaceous rift and transform ridges and tilted fault blocks will have formed in time to receive early accumulations. Subsequently, however, continued subsidence in the delta area would have lowered much of the Cretaceous accumulations into the over-mature zone cracking the oil molecules to methane. The thick cover of the massive, overpressured Tertiary deltaic shales should have prevented much of this gas from escaping.
As the Tertiary deltaic sediments subsided, the lower formation, the massive Akata shales, commenced generating oil and gas. Migration,.however, was perhaps inhibited by the over-pressuring of only moderately organic-rich massive shale, so perhaps that only the smaller gas molecules (C and smaller) were able, by diffusion, to move through the shale. Substantial primary oil migration probably could not take place until the sandy Agbada Formation had subsided into the petroleum-generating window. Depths to the base of the Agbada sands vary, as those sands were initially deposited from Oligocene (in lower parts of the delta) to Pleistocene, as the delta's progradation proceeded southwestward. In a large part of the delta, (mainly the eastern half) the base of the sand (i.e. the top of the continuous shale of the Akata formation) has yet to subside sufficiently to reach the oil window, and uninhibited primary oil migration from the overpressured Akata formation appears to depend, in part at least, on other paths, namely, growth faults.
Growth faults are not only important in the formation of traps but also of migration paths. Growth faults are perceived to initiate when relatively heavy sandy deposits (Agbada Formation) prograde over clays (Akata Formation) with low shear strength. This event is, therefore, also tied to the first deposition of the Agbada sands, i.e. ranging from Oligocene to Pliocene as progradation proceeded. In general, growth faults and accompanying rollover traps appear to have preceded the flood of oil, but not necessarily the gas. The importance of growth-fault migration is indicated by the occurrence of oil, particularly in the eastern part of the delta, where the presumed oil- generating zone is separated from oil-bearing reservoirs by 2,000 to 4,000 ft of over-pressured shale.
17

From the above discussion, four plays evolve. The most important by far are the deltaic sandstones of the Tertiary Niger delta. The sandstones are involved in growth faults and the accompanying rollover anticlines, an area of some 46,000 sq mi (figs. 3 and 5, table 1).
The second play is the slope diapirs which involve Tertiary sands. The diapirs are formed either by shale or salt intrusions. The play is confined to the continental slope of the delta; it has an area of some 18,230 sq mi (figs. 2 and 3, table 2).
The third play is the Cretaceous sandstones deposited on the flanks and over the tilted fault blocks associated with the continental margin rifting during the opening of the Atlantic. The play occupies about 75 percent of the basin (70,000 sq mi), excluding the folded area of Play Four and the area underlain by ocean crust (figs. 2 and 4, table 3).
The fourth play is the Late Cretaceous folds along eastern side of the basin, the Abakaliki High (fig. 4).
Conclusion - Basin Assessment
Of the four plays of the Niger basin, the fourth play, the Cretaceous folds, appears to be only marginal; the folds are poorly sealed and universally flushed. The first three plays, however, are more prospective and a play analysis has been made for each of them; see tables 1, 2, and 3. These tables summarize the individual estimated factors pertaining to petroleum accumulation discussed above. The results of these analyses are indicated by the product of the individual factors for each of the three plays as follows:
Play Oil(BBO) Gas(TCFG) NGL(BBNGL) BOE(BBOE)
Deltaic sandstones 6.137 87.61 1.402 22.144Slope diapirs .208 6.00 .097 1.3000Cretaceous drapes .223 6.95 .111 1.490Nigeria basin Total 6.568 100.560 1.610 24.934
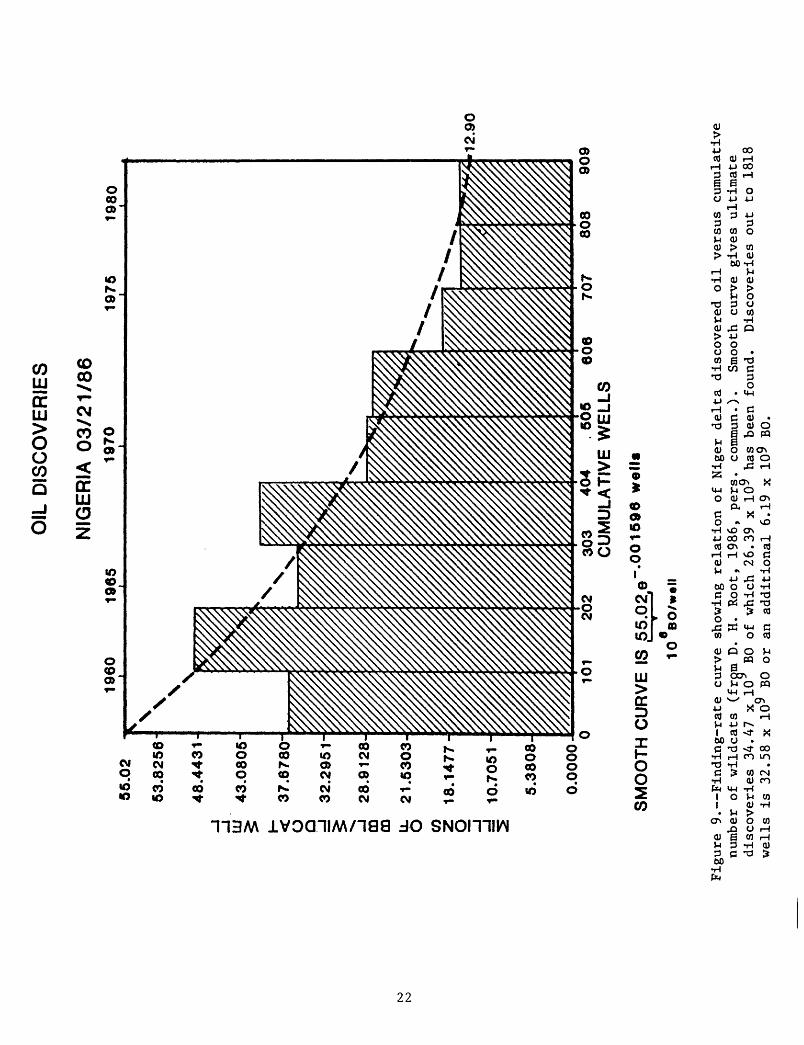
The assessment of the most important and only producing play, the Niger delta, has also been made by an oil-finding curve (lack of data prohibits a gas-finding curve). By plotting the number of Niger wildcats against millions of barrels of oil discovered per wildcat well, D. H. Root (pers. commun., 1986) arrived at an oil-finding curve which indicates that 34.47 BBO could be ultimately discovered (fig. 9). As of the end of 1984, 26.34 BBO have been found, leaving 8.08 BBO. To put a reasonable economic cutoff by arbitrarily assuming that double the number of present (end of 1984) wells will eventually be drilled, the amount of recoverable oil to be discovered becomes 6.19 BBO. Considering the difference in approach, the play analysis estimate of undiscovered oil in the Nigeria basin (6.57 BBO) is in agreement with the 6.19 BBO estimated from the oil-finding curve.
On reviewing the above geologic conditions and considering the play analysis, a consensus of geologists of The World Energy Resources Program indicated a range of undiscovered petroleum probabilities for the Nigeria basin, the mode or most likely of which were 7.0 BBO and 150 TCFG.
Cumulative probability distributions derived from this consensus, indicating the full range of possibilities, are shown in figure 10. These probability distributions include mean values of 7.60 BBO (Nigeria) plus .66
18

Table 1
BASIN ______ AREA OF BASIN
PLAY ANALYSIS SUMMARY OF UNDISCOVERED PETROLEUM
Nigeria_____No. , COUNTRY Nigeria 90%, PLAY Deltaic sandstonesAREA OF PLAY (MMA)
No. 192,000 Cameroon 10% 29.44
VOLUME OF BASIN (Mi3) 400,000ESTIMATE ORIGINAL RESERVES 26.4 BBO 20 TCFG
PLAY EST.ORIG. RESERVES 26.4 BBO TCFG
Rifted (and wrenched") continental marginTECTONIC CLASSIFICATION OF BASIN: DEFINITION AND AREA OF PLAY:Deltaic sandstones involved in growth faults and accompanying rollover anticlines of the TertiaryNiger delta, an area of 46,000 sq mi (figs. 3 and 5).
PROBABILITY DISTRIBUTION
MAJOR GEOLOGICAL/EXPLORATION FACTORS
A. UNTESTED TRAP AREA (MMA)
B. PERCENT UNTESTED TRAP AREA PRODUCTIVE (%)
C. AVERAGE EFFECTIVE PAY (feet)
D. PERCENT OIL VERSUS GAS IN PETROLEUM FILL (%)
E. OIL RECOVERY (BBLS/AF)
F. GAS RECOVERY (MCF/AF)
G. NGL RECOVERY (BBLS/MMCFG)
95%
.8
8
100
10
150
1,000
11
MOST LIKELY
1.69
18
300
25
269
1,280
16
5%
2.5
24
1,000
50
400
1,500
20
PRODUCT OF MOST LIKELY PROBABILITIES: OIL6.137BB, GAS,87.61 TCF, NGL JB, OR 22.144 BBOE
REMARKS
A. As of 1977, an estimated 608 sq mi of oil fields had been'discovered with 782 wildcats,assuming 60% fill and a 40% wildcat success rate, 2,500 sq mi of trap would have been tested. When the same wildcat density had been reached in the analogous Gulf Coast basin, 47% of the ultimately-to-be-found petroleum had been discovered (see text). Assuming this analogy and that of tested trap is proportional to discovered petroleum, the 2,500 sq mi of Nigerian 1977 tested trap represents 47% of ultimate trap area. This ultimate trap area (5,319 sq mi) less the trap area tested up to 1984, i.e. 2,675 sq mi (the 2,500 sq mi tested in 1977 plus 7.5% increase to bring it to 1984) indicates 2,644 sq mi (1.69 MMA) of untested trap remains.
B. About 24 percent of the tested trap area has been productive (60 percent fill times 40 percent wildcat success); however, future success probably averages lower, maybe 30 percent, indicating about 18 percent of the untested trap will be productive.
C. From the few net pay figures available plus inferred pays from field area and reserve figures, I estimate cumulative sand thicknesses from 200 to 500 ft, perhaps averaging 300 ft for new fields.
D. I assume by analogy to the Gulf Coast basin which has (in contrast to the Niger delta) beenextensively exploited for gas, that gas quantity on a BTU basis is twice that of oil. However, potential gas fields probably have been bypassed in favor of oil. I estimate that future potential will be only 25 percent oil.
E. Reservoirs appear excellent; porosity ranges from 25 to 30 percent. I assume an average of25 percent and an oil recovery factor of 25 percent.
F. Assumed an average thermal gradient of 1.25° F/100 ft and a pay depth of 8,000 ft. G. By analogy to the Gulf Coast, an average of 16 barrels NGL/MMCFG is assumed.
Undiscovered resources of all plays in basin: 6.568 BBO, 100.56 TCF, 1.610 BBNGL, 24.934 BBOE19
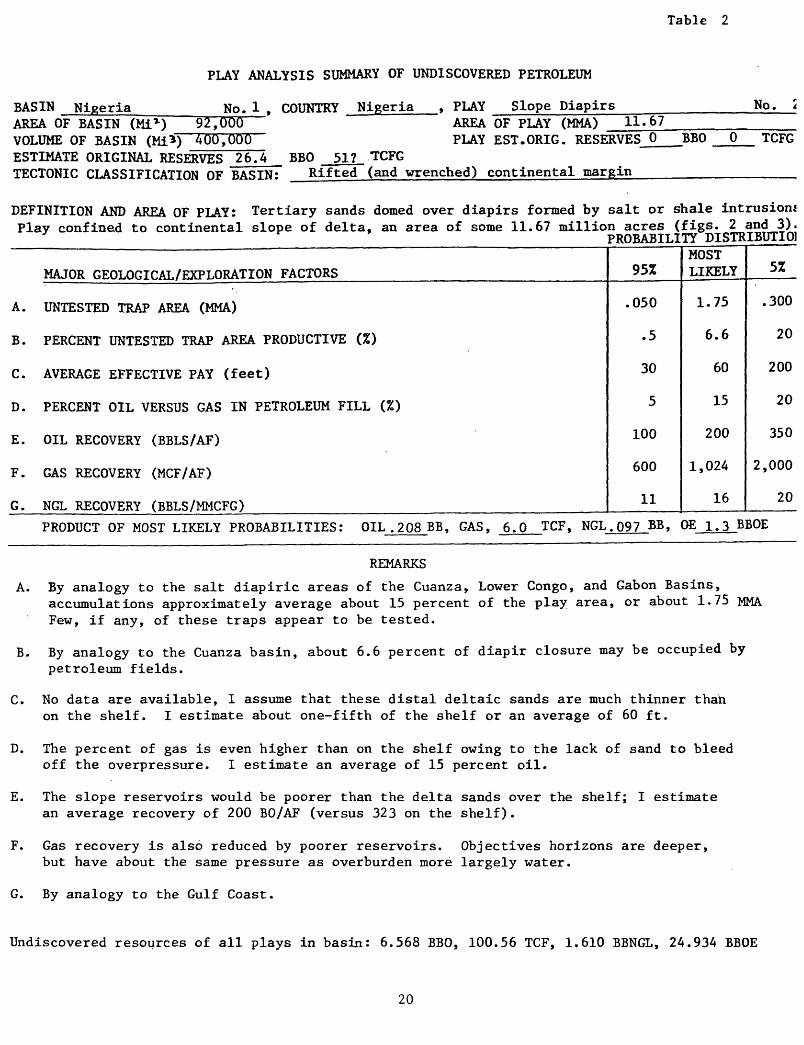
Table 2
PLAY ANALYSIS SUMMARY OF UNDISCOVERED PETROLEUM
BASIN Nigeria_________ AREA OF BASIN (Mi*) 92 > OOQ VOLUME OF BASIN (Mi*) 400,000
No. 1 , COUNTRY Nigeria , PLAY Slope Diapirs_____ AREA OF PLAY (MMA) 11.67
No. 2
PLAY EST.ORIG. RESERVES 0 BBO 0 TCFGESTIMATE ORIGINAL RESERVES 26.4 BBO 51 ?_TCFGTECTONIC CLASSIFICATION OF BASIN: Rifted (and wrenched) continental margin
DEFINITION AND AREA OF PLAY: Tertiary sands domed over diapirs formed by salt or shale intrusions.Play confined to continental slope of delta, an area of some 11.67 million acres (figs. 2 and13).
J PROBABILITY DISTRIBUTION
MAJOR GEOLOGICAL/EXPLORATION FACTORS
A. UNTESTED TRAP AREA (MMA)
B. PERCENT UNTESTED TRAP AREA PRODUCTIVE (%)
C. AVERAGE EFFECTIVE PAY (feet)
D. PERCENT OIL VERSUS GAS IN PETROLEUM FILL (%)
E. OIL RECOVERY (BBLS/AF)
F. GAS RECOVERY (MCF/AF)
G. NGL RECOVERY (BBLS/MMCFG)
95%
.050
.5
30
5
100
600
11
MOST LIKELY
1.75
6.6
60
15
200
1,024
16
5%
.300
20
200
20
350
2,000
20
PRODUCT OF MOST LIKELY PROBABILITIES: OIL .208 BB, GAS, 6.0 TCF, NGL.097 BB, 0£ 1.3 BBOE
REMARKS
A. By analogy to the salt diapiric areas of the Cuanza, Lower Congo, and Gabon Basins,accumulations approximately average about 15 percent of the play area, or about 1.75 MMA Few, if any, of these traps appear to be tested.
B. By analogy to the Cuanza basin, about 6.6 percent of diapir closure may be occupied by petroleum fields.
C. No data are available, I assume that these distal deltaic sands are much thinner than on the shelf. I estimate about one-fifth of the shelf or an average of 60 ft.
D. The percent of gas is even higher than on the shelf owing to the lack of sand to bleed off the overpressure. I estimate an average of 15 percent oil.
E. The slope reservoirs would be poorer than the delta sands over the shelf; I estimate an average recovery of 200 BO/AF (versus 323 on the shelf).
F. Gas recovery is also reduced by poorer reservoirs. Objectives horizons are deeper, but have about the same pressure as overburden more largely water.
G. By analogy to the Gulf Coast.
Undiscovered resources of all plays in basin: 6.568 BBO, 100.56 TCF, 1.610 BBNGL, 24.934 BBOE
20

Table 3
BASIN NigeriaAREA OF BASIN (MiT)92,000
PLAY ANALYSIS SUMMARY OF UNDISCOVERED PETROLEUM
No. 1 , COUNTRY Nigeria , PLAY Cretaceous Drapes No. 3AREA OF PLAY (MMA) 44.16
VOLUME OF BASIN (Mi3)400,000 PLAY EST.ORIG. RESERVES 0 BBO 0 TCFGESTIMATE ORIGINAL RESERVES 26.4 BBO 47? TCFGTECTONIC CLASSIFICATION OF BASIN: Wrenched, rifted continentalDEFINITION AND AREA OF PLAY: Cretaceous sands deposited on the flanks and over tilted fault blocks associated with the continental margin rifting and with the transform faults during the opening of the Atlantic. The play occupies 75% of the basin, i.e. 44.16 MMA (figs. 2 and 4).
PROBABILITY DISTRIBUTION
MAJOR GEOLOGICAL/EXPLORATION FACTORS
A. UNTESTED TRAP AREA (MMA)
B. PERCENT UNTESTED TRAP AREA PRODUCTIVE (%)
C. AVERAGE EFFECTIVE PAY (feet)
D. PERCENT OIL VERSUS GAS IN PETROLEUM FILL (%)
E. OIL RECOVERY (BBLS/AF)
F. GAS RECOVERY (MCF/AF)
G. NGL RECOVERY (BBLS/MMCFG)
95%
1.00
0.5
50
5
100
500
5
MOST LIKELY
2.21
2.5
150
15
178
978
16
5%
2.80
10.0
250
50
300
1,500
25
PRODUCT OF MOST LIKELY PROBABILITIES: OIL .223BB, GAS, 6.95 TCF, NGL .111BB, OE-1.49 BBOE
REMARKS
A. This play has been little explored and trap information is lacking. I estimate the trap area makes up about 5% of the play area in conformity with estimates in other rifted continental margins of India and Africa where drape structure is expected. Very little of this trap area has been tested.
B. Up to 1981, 21 wells were drilled in the Cretaceous area updip from the Tertiary delta. Of these, five encountered gas and one oil, although termed discoveries, none were put on production. A small (25 MMB) oil field was found on the west flank of the Niger delta (in a different basin). I estimate a wildcat success rate of 10%. No data is available concerning fill, but flushing and lack of seal appear to be a problem where sands are shallow enough to be within drilling depth. Average fill is deemed low, perhaps 25%, indicating that about 2.5% of the trap area may be productive.
C. Exploration wells have encountered net sand thicknesses from 80 to 230 ft. I estimate 150 ft to be about average.
D. The play appears gas prone from the wells completed in Cretaceous sands to north of the delta and from those in the once-connected Douala basin. Exceptions are the oil recovery north of the delta and the small oil field (25 million barrels) on the Benin border. Deeper drilling under the Tertiary delta would undoubtedly be gas. I estimate the play is 85% gas.
E. Little reservoir data are available; Senonian sands in one well, Ocheku River-1, had a porosity of 15-18%. 16.5% is taken as an average for the play in the future.
F. A high thermal gradient (ave. 2.5° F/100 1 ) and the necessity to go deep, perhaps sub- Tertiary delta, to avoid flushing and leaking, puts the average depth at 10,000 ft.
G. By analogy to the Gulf Coast
Undiscovered resources of all plays in basin: 6.568 BBO, 100.56 TCF, 1.610 BBNGL, 24.934 BBOE
21
NJ r-o
1960
55.0
2
53.8256-
48.4431
ttj
43.0805
<
37.6
780-
O O =J
32.2951-
^ 28.9128-
m ^ 21.5303-
CO Z 18.1477-
O ^ 10.7051
- b
5.3808-
0.0000
19
65
OIL
DIS
CO
VE
RIE
S
NIG
ER
IA 0
3/2
1/8
61970
1975
1980
12
.90
101
202
303
404
. 50
5
606
CU
MU
LA
TIV
E W
EL
LS
70
7808
909
SM
OO
TH
CU
RV
E I
S 5
5.0
2 e
"-0
01
59
8 w
elu
10 BO/wall
Figu
re 9. Finding-rate curve
show
ing
rela
tion
of Niger
delta
disc
over
ed oi
l ve
rsus
cumulative
number of wi
ldca
ts (f
rom
D. H.
Root,
1986
, pers.
comm
un.)
. Sm
ooth
curve
gives
ulti
mate
discoveries
34.47
x 10
BO of which
26.3
9 x
109 ha
s been found.
Disc
over
ies
out
to 1818
wells
is 32
.58
x 10
9 BO
or
an
additional 6.19 x
109
BO.

Tl H- OQ
25 C H- H
OQ fD fDft M H- O 03
IOJ I 3 O
o c03 M3 D)<D ftn H« o < O (D 3
X>TJ ft O O ft O4 ft 03H. cr o H-O I-4CO )->
ftO «<S
PROBABILITY OF MORE THAN0 02 0.4 04 04 |
./
PROBABILITY OF MORE THAN0 02 0.4 00 04 1
o4
ID O
(O N)
- 0 Ut
cr toCD ft
H- O4OQ C(D ft -{ H-H- O
C 3 Q- H- CO O O < tt> i-{ fD
fD O O
fD
03
H« fD
OH- l-1
03 3 &.
OQ
CO
H- 3
n fD
Q>CO
OF
PROBABILITY OF MORE THAN02 &4 04 04
PROBABILITY OF MORE THAN0 02 0.4 04 04 1
ft §
I I
oCo3 o n O O3
00
» f c c >o JT »
o ooooooo
zo m
CO>COz
Oto3
o o300
BBO (Cameroon), 8.26 BBO in all, and mean values of 173.97 TCFG (Nigeria) and 15.13 (Cameroon), 189.10 TCP in all.
The Douala Basin
Location and Size
The Douala basin occupies the eastern coastal sedimentary fringe of Cameroon (figs. 1 and 11). Its western boundary is the northeast-trending Cameroon Volcanic Zone represented ty a string of volcanic islands offshore and volcanic peaks onshore. Its northern and eastern boundaries are outcropping Precambrian rocks. Its southern boundary is taken arbitrarily near the Cameroon-Equitorial Guinea boundary, the Equitorial Guinea narrow shelf basin is presumably largely occupied by the Fang Fault Zone. The offshore boundary is taken to be the 3,280 ft (1,000 m) bathymetric contour. On this basis, the basin area is some 8,335 sq mi or 5.33 million acres. The volume of sediments is approximately 25,000 cu mi.
Exploration and Production History
Exploration began in 1947. The first wildcats were drilled in 1954 in the vicinity of oil and gas seeps and a minor gas discovery was made in 1955 (Logbada). This small field is presently supplying gas to the nearby town of Douala. Gas of substantial amounts with some oil/condensate, was discovered in 1980, Sanaga Sud, followed by further exploration success in the Kribi area immediately to the south. At least one substantial gas field (Kribi E) was discovered, reserves of 4 TCF are reported for the area. Gas of unknown commerciality was also discovered at North Matanda (just southeast of the Logbada Gas Field), and some oil along the east flank of the basin was found in recent years.
Structure
Regional Tectonics. The Douala basin appears to be part of the rifted continental margin of Africa facing the south Atlantic, offset from the Gabon segment of the margin to the south by the northeast-trending Fang Fault Zone (fig. 11). Its northern boundary is the early Cretaceous ridge or ridges accompanying the equatorial fracture zones or transform faults separating the openings of the North and South Atlantic which swing northeastward into the Nigeria region (fig. 2). Specifically, the eastern extension of the New Guinea Ridge, obscured by the northwest-trending, late Tertiary Cameroon Volcanic Zone, separates the largely extensional, rifted continental margin of southern Africa, including the Douala basin, from the largely translational margin to the equitorial east-trending African coast, including the Nigeria Basin.
The Douala basin though analogous to Gabon and other rifted continental margins to the south, has apparently been structurally higher. The early Cretaceous, i.e. pre-salt sediments, are missing or confined at depth to the southernmost part of the basin. The Aptian salt of the southern basins appears to extend over only about a southeastern fifth of the basin (fig. 11). In the northern part of the basin, late Cretaceous sediments lie directly on basement.
24

0 Dry O\\ Gas NoncommercialEdge of play
£. Edge of basin
<t//fr/$y GUINEA (RIO MUN«)|
Figure'11. Douala basin index map (from Petracca, 1986)
25
Structural Traps, The basin appears to have three types of traps: 1) postrift sandstones draping over late Cretaceous horsts and/or tilted fault blocks, 2) sandstones over diapiric salt structures, and 3) growth-fault- associated closures. Prerift and synrift traps of the more southern basin are probably not present in this shallow basin where the older sediments have lapped-out northward.
For the Gabon and other rifted marginal basins of western Africa, I have assumed that drape traps make up five percent of the play area (by analogy to estimates made for Indian continental margin basins). On this assumption, the Douala basin would have .267 million acres to trap, that is, five percent of the drape play area (which is assumed to be the whole basin, i.e. 5.33 million acres).
No data are available concerning the number or size of traps in the Cretaceous sands associated with the salt dome play. By analogy to a similar play in the nearby Cuanza basin (where flowage of Aptian salt into domes has caused closures in the overlying Cretaceous sandstone reservoirs) traps make up 15 percent of the play area. The play area, limited to the basin area underlain by salt, is assumed to be some 750,000 acres (see Stratigraphy and fig. 11), indicating a total trap area of some 112,500 acres. An estimated 40 percent of this trap area has been drilled.
The amount of structural trap produced by growth faults and associated rollovers in the Cretaceous section of the Douala basin is unknown. In the somewhat similar Tertiary delta play of the Nigeria basin, the trap area is estimated to be about 11.6 percent of the play area. The analogous Douala play areas is the entire basin minus the updip areas of thin sediments and the salt dome play area, or about 4 MM acres. This would indicate a total trap area of some .464 MM acres. Exploration is less mature than in the Niger delta. I estimate that about half the traps have been tested.
Stratigraphy
General. The stratigraphy of the Douala basin is akin to the Gabon and other basins to the south, however the interior rift (synrift) and intracratonic (prerift) sediments are missing but may exist at depth in the southernmost part of the basin. Only the interior sag and marginal sag (postrift) sediments, that is, the salt and post-salt strata are considered.
The salt, presumed to be correlative of the Aptian salt of the Gabon, Congo, and Cuanza basins, was reportedly penetrated in at least one well (Kribi 1). I assume the salt to underlie the Kribi offshore an area of some 75,000 acres in the southeastern corner of the Douala basin (fig. 11) and to provide the diapiric cores of traps in that area.
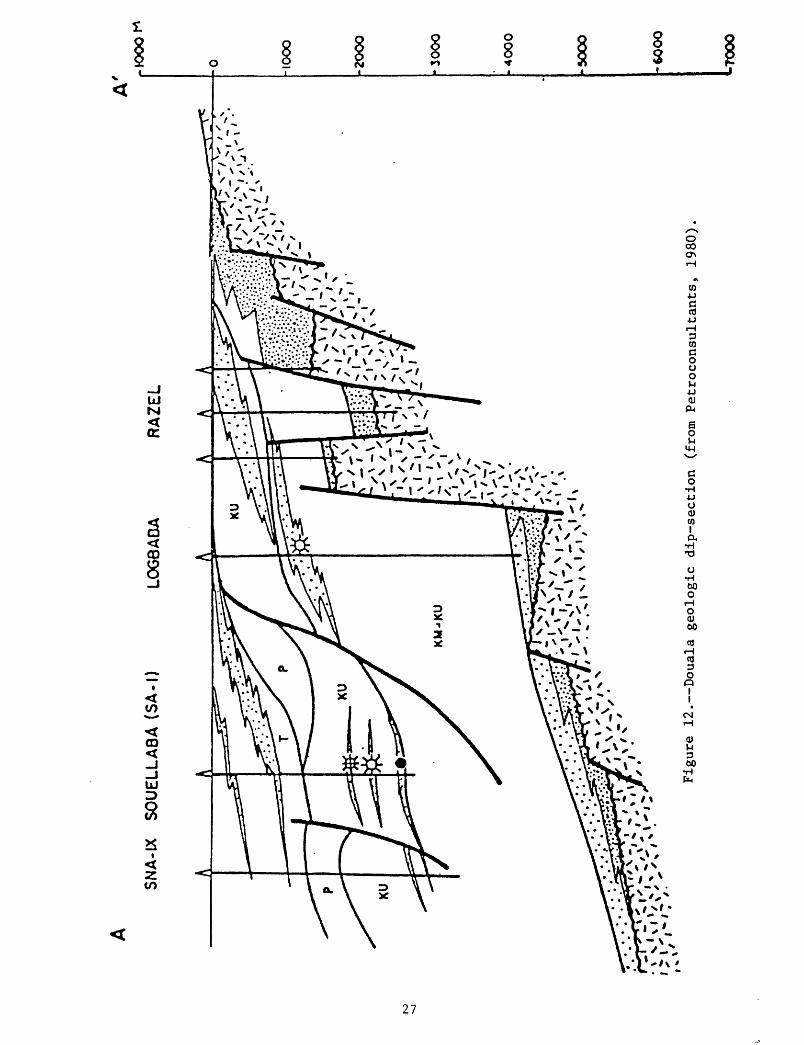
The post-Aptian section, i.e. the Middle and Upper Cretaceous sedimentary rocks, appear to be deltaic and essentially composed of silty, micaceous clays with interbedded sandy lenses of limited extent. An estimated 20 percent of the section is sand or silt concentrated in the upper Cretaceous and near the base of the middle Cretaceous section (fig. 12). Sandstones or siltstones also make up a similar small percentage of Paleocene and the rest of the Tertiary section.
Reservoirs. By analogy to the Cretaceous of the adjoining Nigeria Basin, I estimate an average accumulative Cretaceous pay of 150 ft. This would include reservoir sandstones of the drape structures and of the presumed salt dome features of the Kribi area.
26
SN
A-I
X
SO
UE
LLA
BA
(S
A-1
)LO
G8A
DA
RA
ZE
L
ICXX
D
-2000
30O
O
4O
OO
5O
OO
-60O
O
Fig
ure
1
2.
Do
uala
geo
logic
dip
-secti
on
(fro
m P
etr
oconsu
ltants
, 19
80)
l-TO
OO
I assume also a pay of 150 ft for the Upper Cretaceous and Tertiary sandstones involved with growth faults.
Reservoir characteristics are also judged analogous to the Cretaceous sandstones of the Nigeria basin which are of only fair quality with porosities from 15 to 18 percent.
Seals. In the shaley deltaic Douala section, seals are not a significant problem.
Source Section. The Cretaceous and Tertiary shales below 6,500 ft (about 2 km) are considered the source rock of the basin (see below).
Petroleum Generation and Migration
Richness of source. Thirty eight rock samples taken at intervals to the total depth of the Logbada well (fig. 12) indicate a fair to average TOC richness of 1.45 percent for the entire, i.e., Upper Cretaceous, section (Albrecht and others, 1976). The kerogen is largely type III and II.
Depth and volume of source rock. Albrecht and others (1976), show that oil generation begins at a depth of 5,577 ft (1,700 m); however, the top of the peak oil production is about 6,500 ft (200 m), the same approximate depth as in the up-dip Cretaceous area of the Nigeria basin. The volume of source rock is estimated to be 4,000 cu mi.
Gas versus oil. Only gas has been produced from the basin. I attribute this to the great predominance of shale in the section, which is probably overpressured, without the same amount of growth fault development of the Nigeria basin to allow oil migration. I estimate that oil makes up 15 percent of the petroleum mix.
Migration timing versus trap formation. If thermal gradients and subsidence rates had remained constant through the Cretaceous to recent time, it appears that oil generation and migration would have started in the early Late Cretaceous (or perhaps somewhat earlier assuming higher temperatures). At that time, the basal sandstones (as drapes over basement blocks or over salt features) would be available to receive migrating petroleum. The younger growth structures and sandstone development would be late to receive much of the petroleum (i.e. gas) but still in time to receive an appreciable amount.
The Douala basin appears to have three principal plays: 1) Upper Cretaceous sandstones draped over Cretaceous fault blocks, 2) Upper Cretaceous sandstones folded by salt tectonics, and 3) Upper Cretaceous and Tertiary sandstones in growth faults and rollovers.
Conclusions - Basin Assessment
The three principal plays are summarized in tables 4, 5 and 6. These summaries show the products of the quantified geologic factors which are pertinent to petroleum accumulation. The assessed resources of these three plays are combined for the Douala basin below.
28
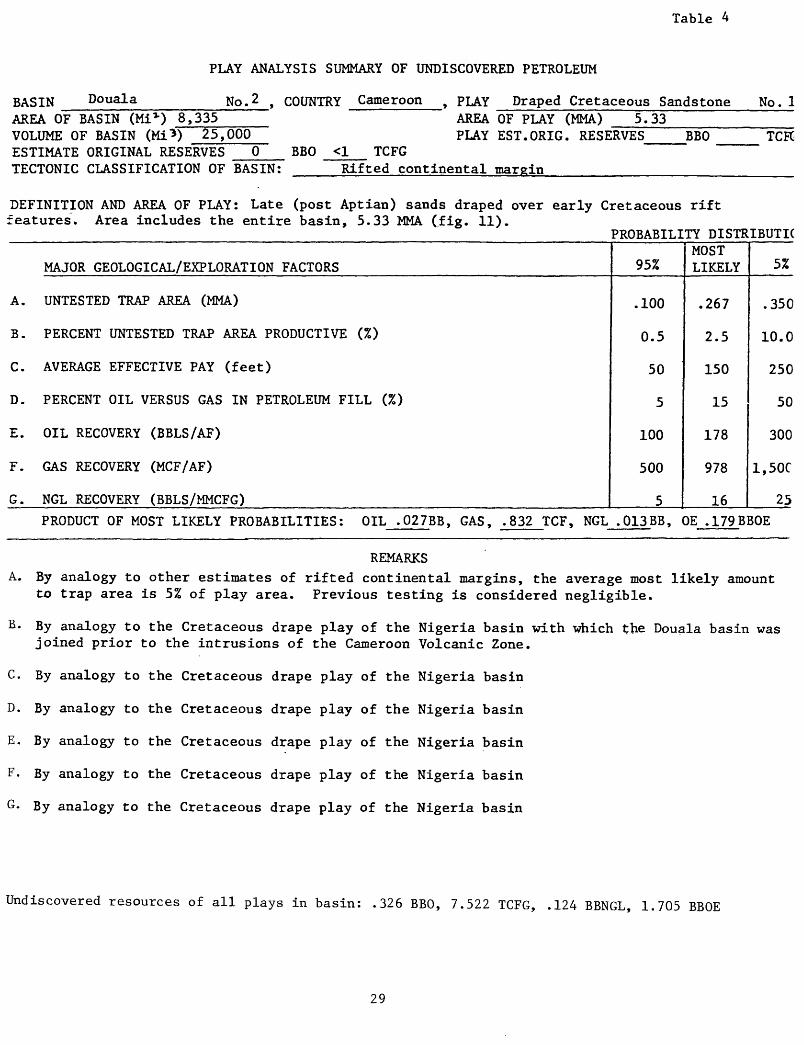
BASIN Douala________ AREA OF BASIN (Mi*) 8,335VOLUME OF BASIN (Mi"*) 25,000ESTIMATE ORIGINAL RESERVES 0TECTONIC CLASSIFICATION OF BASIN:
Table A
PLAY ANALYSIS SUMMARY OF UNDISCOVERED PETROLEUM
No.2 , COUNTRY Cameroon , PLAY Draped Cretaceous Sandstone No. 1AREA OF PLAY (MMA) 5.33____________ PLAY EST.ORIG. RESERVES____BBO ____ TCFG
BBO <1 TCFG____Rifted continental margin _______________
DEFINITION AND AREA OF PLAY: Late (post Aptian) sands draped over early Cretaceous rift features. Area includes the entire basin, 5.33 MMA (fig. 11).
PROBABILITY DISTRIBUTION
MAJOR GEOLOGICAL/EXPLORATION FACTORS
A. UNTESTED TRAP AREA (MMA)
B. PERCENT UNTESTED TRAP AREA PRODUCTIVE (%)
C. AVERAGE EFFECTIVE PAY (feet)
D. PERCENT OIL VERSUS GAS IN PETROLEUM FILL (%)
E. OIL RECOVERY (BBLS/AF)
F. GAS RECOVERY (MCF/AF)
G. NGL RECOVERY (BBLS/MMCFG)
95%
.100
0.5
50
5
100
500
5
MOST LIKELY
.267
2.5
150
15
178
978
16
5%
.350
10.0
250
50
300
1,50C
25
PRODUCT OF MOST LIKELY PROBABILITIES: OIL .027BB, GAS, .832 TCF, NGL .013BB, QE .179BBQE
REMARKSA. By analogy to other estimates of rifted continental margins, the average most likely amount
to trap area is 5% of play area. Previous testing is considered negligible.
B. By analogy to the Cretaceous drape play of the Nigeria basin with which the Douala basin was joined prior to the intrusions of the Cameroon Volcanic Zone.
C. By analogy to the Cretaceous drape play of the Nigeria basin
D. By analogy to the Cretaceous drape play of the Nigeria basin
E. By analogy to the Cretaceous drape play of the Nigeria basin
F. By analogy to the Cretaceous drape play of the Nigeria basin
G. By analogy to the Cretaceous drape play of the Nigeria basin
Undiscovered resources of all plays in basin: .326 BBO, 7.522 TCFG, .124 BBNGL, 1.705 BBOE
29

Table 5
PLAY ANALYSIS SUMMARY OF UNDISCOVERED PETROLEUM
BASIN Pouala______ NO. 2 ^ COUNTRY Cameroon 9 PLAY Sandstones over salt diapirs No. 2
AREA OF BASIN (Mi % ) 8,335 AREA OF PLAY (MMA) .75______________VOLUME OF BASIN (Mi"*) 25,000ESTIMATE ORIGINAL RESERVES 0 BBOTECTONIC CLASSIFICATION OF BASIN: Rifted continental margin
PLAY EST.ORIG. RESERVES <1 BBO <1 TCFG +4 TCFG (Kribi)
TCFG
DEFINITION AND AREA OF PLAY: Accumulations in Cretaceous sands draped over salt-flow structures. The salt is the northern extension of the Aptian Salt Basin and is restricted to the southeastern 14% of the basin area, i.e. 750.000 acres (fig, in. PROBABILITY DISTRIBUTION
MAJOR GEOLOGICAL/EXPLORATION FACTORS
A. UNTESTED TRAP AREA (MMA)
B. PERCENT UNTESTED TRAP AREA PRODUCTIVE (%)
C. AVERAGE EFFECTIVE PAY (feet)
D. PERCENT OIL VERSUS GAS IN PETROLEUM FILL'(%)
E. OIL RECOVERY (BBLS/AF)
F. GAS RECOVERY (MCF/AF)
G. NGL RECOVERY (BBLS/MMCFG)
<.95%
.050
5
40
5
150
500
5
MOST LIKELY
.0675
40
150
15
270
1,200
16
>5Z
.150
50
300
45
350
2,000
25PRODUCT OF MOST LIKELY PROBABILITIES: OIL. 164 BB, GAS, 4.13 TCF, NGL .07 BB, OE .92 BBOE
REMARKS
A. By analogy to the salt diapiric areas of the Cuanza, about 15% of the play area is trap, orsome 112,500 acres. An estimated 40% of this trap area has been'tested leaving some 67,500acres.
B. Success rate appears to be very high, about 70% so far. Fill is assumed to be about the sameas the Niger Delta or 60%, indicating that about 40% mapped trap area would be productive.
C. By analogy to Cretaceous sands in adjoining Nigeria, an average pay thickness of 150 ftis assumed.
D. Available test information indicates area to be gas prone. Analogous Cretaceous sands inNigeria have been judged to be 85% gas.
E. Average reservoir parameters are assumed. F. Assuming an average depth of 8,000 ft, an average temperature gradient of 1.5°F/100 ft,
and average reservoir parameters. G. By analogy to the adjoining Niger delta.
Undiscovered resources of all plays in basin: .326 BBO, 7.522 TCFG, .124 BBNGL, 1.705 BBOE
-This does not include an estimated 4 TCFG reportedly discovered, but not established as reserves.
30
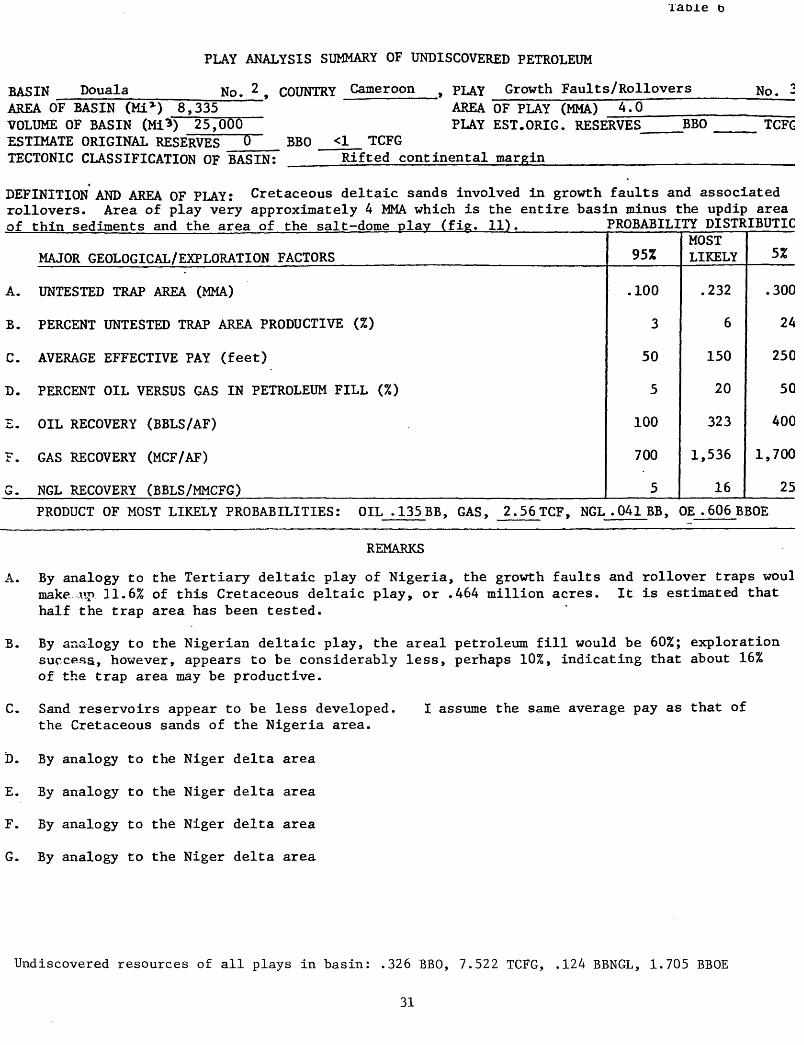
TaDie o
BASIN Douala________ AREA OF BASIN (Mi*) 8,335"
PLAY ANALYSIS SUMMARY OF UNDISCOVERED PETROLEUM
No. 2 f COUNTRY Cameroon t PLAY Growth Faults/Rollovers No. 3AREA OF PLAY (MMA) 4.0
VOLUME OF BASIN (Mi*) 25,000ESTIMATE ORIGINAL RESERVES D TECTONIC CLASSIFICATION OF BASIN:
BBOPLAY EST.ORIG. RESERVES
1 TCFG Rifted continental margin_______________
BBO TCFG
DEFINITION AND AREA OF PLAY: Cretaceous deltaic sands involved in growth faults and associated rollovers. Area of play very approximately 4 MMA which is the entire basin minus the updip area of thin sediments and the area of the salt-dome play (fig. 11). PROBABILITY DISTRIBUTION
MAJOR GEOLOGICAL/EXPLORATION FACTORS
A. UNTESTED TRAP AREA (MMA)
B. PERCENT UNTESTED TRAP AREA PRODUCTIVE (%)
C. AVERAGE EFFECTIVE PAY (feet)
D. PERCENT OIL VERSUS GAS IN PETROLEUM FILL (%)
E. OIL RECOVERY (BBLS/AF)
?. GAS RECOVERY (MCF/AF)
G. NGL RECOVERY (BBLS/MMCFG)
95%
.100
3
50
5
100
700
5
MOST LIKELY
.232
6
150
20
323
1,536
16
5%
.300
24
250
50
400
1,700
25
PRODUCT OF MOST LIKELY PROBABILITIES: OIL .135 BE, GAS, 2.56TCF, NGL .041BB, OE . 606 BBOE
REMARKS
A. By analogy to the Tertiary deltaic play of Nigeria, the growth faults and rollover traps would make .up. 11.6% of this Cretaceous deltaic play, or .464 million acres. It is estimated that half the trap area has been tested.
B. By analogy to the Nigerian deltaic play, the areal petroleum fill would be 60%; exploration success, however, appears to be considerably less, perhaps 10%, indicating that about 16% of the trap area may be productive.
C. Sand reservoirs appear to be less developed. I assume the same average pay as that of the Cretaceous sands of the Nigeria area.
D. By analogy to the Niger delta area
E. By analogy to the Niger delta area
F. By analogy to the Niger delta area
G. By analogy to the Niger delta area
Undiscovered resources of all plays in basin: .326 BBO, 7.522 TCFG, .124 BBNGL, 1.705 BBOE
31

Play Oil(BBOE) Gas(TCFG) NGL(BBNGL) BOE(BBOE)
Draped Cretaceous sandstone .027 .832 .013 .179Sandstones over salt diapirs .164 4.13 .070 .920Growth fault/rollovers .135 2.56 .041 .606Douala basin Total .330 7.56 .124 1.710
A consensus of geologists of The World Energy Resources Program, based on the above estimates, indicate a range of undiscovered petroleum probabilities for the Douala basin, the mode, or most likely of which are 0.4 BBO and 10 TCFG. The cumulative probability curves, derived from the consensus, indicate the full range of probabilities for undiscovered oil and gas in the Douala basin (fig. 13). The curves include the mean values of .52 BBO and 13.34 TCFG.
Gabon Basin
Location and Size
The Gabon basin is a segment of the so-called Aptian salt basin which extends southward from the Guinea Ridge opposite Cameroon to the Walvis Ridge of Namibia and westward from the African craton to near the 3-km water depth of the Atlantic (figs. 1, 2 and 14). The northern boundary of the Gabon basin is placed at the Equitorial Guinea (Rio Muni) boundary where the Fang Fault zone intersects the continental margin (fig. 11). To conform with previous usage, the southern boundary of the Gabon basin is placed at Mayumba (Lat. 3°30 f S.) a west-plunging basement ridge (fig. 14). (However, a more proper geologic boundary might be further north so that the Gabon basin would only include the depressed delta area of the Ogooue River.) Although the Aptian salt basin extends much further seaward, the western boundary of the Gabon basin is taken at the 1,000 m (3,280 ft) water depth. This approximately coincides with the western limit of the high relief rifted continental margin with consequent trap formation and organically rich graben lows. It also approximates the west limit of a sufficiently thick sedimentary pile to insure thermal maturity, the west limit of the better reservoir development, and the west limit to shallow water depths with tolerable production economics (fig. 15).
Within these boundaries the Gabon basin has an area of about 33,800 sq mi and a volume of some 105,000 cu mi.
Exploration and Production History
The first surface investigations began in 1928, attracted by bitumen seepages and asphalt deposits. The first wildcats were drilled in 1936. Many onshore wildcats were subsequently drilled with little encouragement until 1956 when Ozouri was discovered (fig. 14). Between 1956 and 1959, the onshore fields, Pointe Clairette, M. 'Bega, Cap Lopez, Alewano, Anembo, and Chengue, were found resulting in production of almost 6 million barrels a year. The first offshore discovery was in 1962, Anguille. Subsequently, 20 more fields have been discovered bringing the reserves to approximately 1.71 BBO with an unknown amount of gas. Production of 86.25 MMBO/yr peaked in 1977. The wildcat success rate appears to have been 12.5 percent through 1984.
32

DOUALA BASINCameroon 100%
Recoverable Oil Assessment Date : Oct. 23,1066
§ m :£* 1~ :52 d
feis-» «
gO e^.o: o cu
Kx^ ^-^
^- -
ESTIMATES Mean « 0.52 Median = 0.48 Mode = 0.40 F95 - 0.20 F75 - 0.34 F50 -' 0.48 F25 - 0.66 F05 - 1.00 S.O. - 0.25
02 0.4 0.6 0.8 1 12 IABILLION BARRELS RECOVERABLE OIL
L6 L8
Cameroon 100%Recoverable Gas Assessment Date : Oct. 23,1986
ESTIMATESMean =Median =*Mode =F95 =F75 =F50 =F25 =F05 =S.O. =
13.3912.1510.006.009.0712.1516.3125.006.15
5 10 15 20 26 30 35 4O 45
TRILLION CUBIC FEET RECOVERABLE GAS50
Figure 13. Cumulative probability distribution of undiscovered recoverable oil and gas in the Douala basin.
33
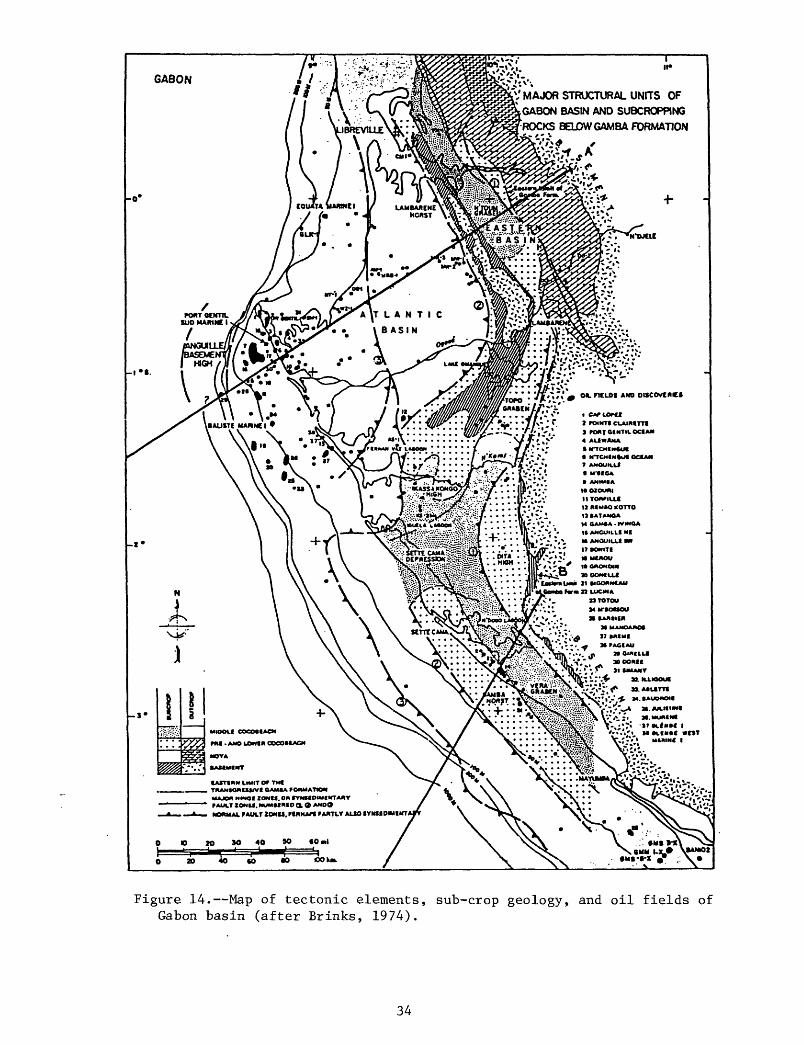
TR**'* 9 OIL FICLOS AND OISCOvCMCI" £»
GMABCN //?r> . . . VJf,« » e**LOrtl^" " "7A" - " * rOlMTI CLAMtTTf
^I/i'IlV. 3 FO«T»««TILOCIA«
4 ALiWAMA
NTCMtN4Uf MTCMlNtUI OCSAM 7 AMOUILLf
M-MOA
MJUOH MmOI ZONU. ON tTMMOIMIMTAMVFAULT ZONU. MUMMNtO a 9 AMOO
NOMMAl FAULT ZONU. FtKNAfl FAMTLT ALSO f YMf OIMtMT
Figure 14. Map of tectonic elements, sub-crop geology, and oil fields of Gabon basin (after Brinks, 1974).
34

A
BA
SS
IN
AT
LA
NT
IO
UE
A
SS
IN
I N
T
CH
IEU
R
GA
BO
N
: C
OU
PE
I
(NO
RD
)
lilU
rou
i IU
<ti
4lo
t
Alk
lfH
)
h* It'll
F«ti
l«
d»»ri
ll«»««
4t
I* "
Fo
ldtt
* -
[V.
b.
I
rl
«
dt
N'0
«*k0 -
i'
-I
§*tl
t O
ct'
an
l<»« . - - -
S«
«lt
C
vH
lUvn
lil -
-- I*
*
1
|<
» ]
_ i i
'
F»tl
J»
»4U
«l4
M<
*
Co
c4
ft«
I ___
r«c
l«(
titt
Ma
m .
f4
ntn
ltn
. P
*t«
'*c
4n
a . C
oc
lno
I'.
-'.-
'.-li
F««U
»
»4I«
«I«
«**
«*IH
|T
.r*m
»ii
) ts
-d
F««ii*
lillara
ui
Atl
lf
I T
.rcn
l**) ti'i'il
F«cl|
i r«
n*l
n«
nlo
ut
Mo
dii
l* .
Lo
»«l
S4
n«
nlt
«.
f«U
*ctn
« .!
« «
GA
BO
N
: C
OU
PE
H
(S
UD
)
M
M - .
Fo
rmati
on
d
t U
ilo
nlo
-
'«r4
«
d«
Bo
it
dt
!'
U-«
«llf If
t
S*c
la
Or4
*nl4
«i -- - -
iw
* i
c
li
C«
nll
n«
ftl«
l - -
[
» 1
Uc
dlt
U
: F
««l«
* L
lllt
roM
i fj
T,1!,
;
Ua
dlt
lo
: F
««
l«i
L*g
v«
alr
t<
Mo
dlila
:
F«
«li
* C
«n
lln
t«l*
ui --
EC
HE
LL
E
GR
AP
HIO
UC
H
OR
IZO
NT
AL
C
0 (0
W
SO
«p
SO
KM
._J
Figu
re 15. Stratigraphic se
ctio
ns ac
ross
the
Gabo
n ba
sin
(fro
m Vi
dal
et al
., 19
75).
Section
A-A
1 th
roug
h no
rthe
rn Ga
bon
basin
and
B-B
1 th
roug
h so
uthe
rn Gabon
basi
n.

Exploration has indicated two principal plays: (1) a pre-salt play of drapes and fault-traps affecting early Cretaceous reservoirs, and (2) a post- salt play of salt-flowage structure affecting the overlying late Cretaceous and Tertiary reservoirs.
Structure
Regional Tectonics. The Gabon basin is essentially part of the rifted continental margin that extends along the west coast of Africa. The initial rifting began in late Jurassic or early Cretaceous and continued vigorously through Neocomian resulting in deep graben lakes and interlake horsts and tilted fault blocks (fig. 15). This rifting was followed by the mid- Cretaceous interior sag filled with continental elastics grading upwards into salt and evaporites of Aptian age. At about the end of the Aptian, Africa and America had parted to such an extent that open-marine sediments appeared and thermal subsidence accelerated as the spreading center gradually moved westward in respect to the continental margin of Africa.
Structural Traps. Traps fall into two groups: Those associated with the rifting and those associated with the Aptian salt flowage.
The traps associated with the rifting are prerift sediments in fault closures, synrift truncations and stratigraphic traps, and synrift and postrift drapes (fig. 15). These traps are partially obscured from the seismograph, since in most cases, they underlie the relatively high-velocity, flow-distorted salt, and evaporite layers. Many more of these traps may be found; I estimate that only 40 percent of the traps have been tested. With the small amount of data at hand, I can only lump all these plays into one play and call it the pre-salt play.
Assuming this play is analogous to other rifted continental margin basins of Africa and Asia, where I have estimated that the trap area makes up 5 percent of the play area, there is 1.08 million acres of trap area.
The post-salt trap closures are largely formed by salt tectonics (fig. 15). In the absence of any other data, I assume that the play is analogous to the Cuanza basin's salt diapir play where traps make up about 15 percent of play area. The area appears to be rather thoroughly explored at this level and the seismic data are good; I estimate that only 20 percent of the traps remain untested. The play area is limited to a zone where overburden is thick enough to cause flowage; that is all the western part of the basin (exclusive of the shallower foreland), an area of some 11.37 million acres.
Stratigraphy
General. The stratigraphy is obscured by a multiplicity of local formation names (35) and rapid east-west facies changes from continental red beds to marine shales and carbonates (fig. 16). The formations are best described within the framework of the tectonic-lithologic groupings.
Intracratonic (Prerift) Sediments
Scattered outcrops of Jurassic, Triassic, and Permo-carboniferous (probably Karoo equivalent) are reported. Overlying these strata is a sequence of coarse elastics, variously designated pre-Cocobeach, N 'Dombo, Gres de base, Lucula, of lowermost Cretaceous which were evidently deposited in an intracontinental largely fluviatile, but also lacustrine, environment.
36

Figu
re 16. Gabon st
rati
grap
hic
section
(modifie
d fr
om B
rinks, 1974)

The sandstones have some oil shows (and in the Congo are a prolific oil reservoir, i.e. the Lucula Formation). Thickness of this basal sandstone unit may attain 1,300 ft.
Interior Rift (Synrift) Sediments
In the Gabon basin, this sequence is referred to as Lover, Middle and Upper Cocobeach or by some 14 separate formation names. In essence, the sequence is alternating lacustrine shales and sandstones. The shales are mostly dark gray to black and largely of a lacustrine facies deposited in deep graben lakes. They are organically rich and in places, bituminous. The sandstones are fine-to-coarse grained and represent fans and turbidites deposited on the perimeter of the graben lakes. The total thickness of the sequence ranges up to 20,000 ft. The lacustrine shales are the principal source rock of the basin.
Interior Sag (Synrift and Postrift)
These rocks were deposited in the broad basin, formed after the cessation of rifting, after the highs were reduced by erosion, and after subsidence began as the hot spreading center separated from the continental crust. The lower part of the sequence, the Gamba Formation, is lacustrine and fluviatile becoming more marine upward as marine waters entered the interior basin (fig. 16). The marine incursion resulted in a thick section of evaporites including salt. The lower section, Gambia Formation, is probably a few thousand feet thick; the salt was perhaps a thousand feet thick prior to distortion by flowage.
Marginal Sag (Postrift) Sediments
Thermal subsidence after the continental crust separated from the hot spreading center resulted in a thick marginal sag or postrift marine sequence often referred to as the post-salt sequence. Maximum subsidence was in the northern Gabon coastal area or Ogooue delta area (fig. 14). Accompanying the subsidence was further encroachment of the sea and establishment of open-ocean circulation. The sediments range in age from Albian to Miocene. The Albian strata just above the Aptian salt are characterized by a thick carbonate sequence, the Madiela Formation, the equivalent of which is a principal reservoir in the Congo basin (fig. 16). Above this is a section of interbedded shales, sandstones, and carbonates, designated by 24 formation names.
Reservoirs. The two principal and largest fields producing from pre- salt interior sag reservoirs, are the Gamba and Ivinga (fig. 14). They have average pay thickness of 121 and 72 feet respectively at the base of the interior sag sequence (Gamba Formation). I estimate that pay thickness in smaller fields yet to be discovered will average less, perhaps only 70 ft in any one place. Reservoir characteristics appear favorable, porosity averaging 27 percent at Ivenga. I estimate an average porosity of 25 percent for these pre-salt reservoirs.
Although some pre-salt, interior rift reservoirs exist, they apparently have not produced and are not described; I lump these minor reservoirs with those of the interior sag reservoirs.
38

Post-salt reservoirs vary in thickness and characteristics, the principal reservoir being the Batanga Sandstone (Port Gentil, fig. 16) which, at the largest field, Grondin (fig. 14), has a cumulative thickness ranging from 80 ft to 260 ft, probably averaging 200 ft. The cumulative thickness of this sandstone in the Batanga Field appears to range from 75 to 250 ft, perhaps averaging 150 ft; the thickness in Anguille Field averages about 100 ft and in other fields, less. I estimate an average pay thickness of 100 ft for new fields, which would include other minor reservoirs besides the Batanga sands.
Seals. With the large quantity of shale in the section and the lenticularity of the sands, leakage or flushing would not appear to be a limiting factor in petroleum accumulation.
Source Section. As will be discussed below, the principal potential source sections are the Early Cretaceous interior rift lacustrine shales (Cocobeach group) and the marginal sag shales of the Ogooue delta area (principally the Azile Formation).
Petroleum Generation and Migration
Richness of Source. No specific data concerning the richness of source strata are available. However, the interior rift part of the section appears to contain Neocomian organically rich, graben-fill, lacustrine shales that are equivalent to the organic shales in Cabinda, which have as much as 20 percent organic matter (Brice and others, 1982). These organically rich shales are in the Lower and Middle Cocobeach Formations shown on fig. 16.
In the post-salt section, the principal source rock is in a shaley zone corresponding to the Azile Formation that reportedly has pyrobitumins (Vidal and others, 1975) and "organic-rich" shales; it is stated to be the source rock of the Grondin Field (Vidal, 1979), the richest of the post-salt fields.
Depth and Volume of Source Rock. No thermal data is available concerning the Gabon basin. Assuming a thermal gradient of 1.5° F/100 ft, which appears about average for rifted continental margins, and taking the subsidence rate to be about 115 ft per million years, the top of the mature zone appears to be at a depth of about 8,000 ft. This compares to some extent with vitrinite reflectance values which, with some anomalous values, indicate mature rock (i.e. reflectance values greater than 0.7 percent) to be between 8,000 and 9,000 ft (Cassan et al., 1981). On this basis, mature source rock is confined to the pre-salt section, except in the Ogooue delta area, basinward of the number 3 hinge line (fig. 14, or flexure Atlantique of fig. 15), where the post-salt sediments are deeper than 9,000 ft. The volume of mature or over-mature source rock is approximately 25,000 cu mi.
Oil Versus Gas. Although gas production is not mentioned in the literature, the largest field, Grondin, a post-salt accumulation, has a gas cap that is regarded as small but of sufficient size so as to be programmed for gas-lifting where water drive fails. I estimate the post-salt petroleum accumulations to be about 15 percent gas and 85 percent oil. Although there is no mention of pre-salt gas production, and because of depth and good sealing, I estimate that the deeper, basinward accumulations would be 50 percent gas.
39

Migration Timing Versus Trap Formation. Assuming the temperature gradient and subsidence rates to be constant, petroleum would have begun generating about Aptian time when the basal Neocomian beds reached a depth of 8,000 to 9,000 ft, but the flood only commenced in the upper Cretaceous, when the Neocomian black source shales reached maturity. Continued subsidence in the Ogooue delta area finally depressed the post-salt section into petroleum- generating depth in the Miocene.
The role of the Aptian salt as a barrier to migration is not clear. The richer and more abundant source shales are below the salt. Although investigators of the adjoining Congo basin believe all the petroleum was generated below the salt, I believe the petroleum of the Ogooue delta area was derived mostly from post-salt shales, e.g. the Azile Formation, which began generation in the Miocene.
The two main plays have traps of distinctly different ages. The drapes and fault traps formed during the interior rift (synrift) stage of Neocomian age, definitely before major generation and migration of petroleum. Therefore, potential reservoirs were exposed to diagenetic damage before receiving petroleum. According to Casson et al. (1981), these pre-salt sandstones were indeed transformed after deposition by a strong diagenesis which, from place to place, determines the quality of the reservoir rock.
The post-salt petroleum generation in the Azile shales was much later, about Miocene. This is about the same time or perhaps a little later than the salt-dome formation which probably started in the Tertiary when the critical weight of overloading was reached. Timing of migration for the post-salt accumulation appears to have been ideal.
There are a number of plays in the basin. There are, for example, probably prerift reservoirs in fault traps, synrift sedimentary traps, e.g. fans or turbidites off local horsts and carbonate development on horsts, synrift and postrift drapes and salt structures. Data, however, are few, and all plays have not been recognized. Accordingly, I have lumped the various plays into two major plays: Pre-salt closures and salt diapirs.
Conclusions - Basin Assessment
Play analysis, summarized in tables 7 and 8, indicates that as of 1984, undiscovered recoverable oil to be .307 BBO for the pre-salt play and .513 BBO for the post-salt, .820 BBO in all. Gas is 1.336 and .332 TCF for the same plays, 1.668 TCF in all. Total oil and gas in oil equivalence is .551 BBOE for the pre-salt and .572 for the post-salt amounting to 1.27 BBOE in all.
A projected discovery rate curve for post-salt oil indicates that if exploration continues to the point where discoveries decline to 4.6 million barrels per 20 wildcats (i.e. with 23 percent discovery rate, 1 million barrels per discovery), .490 BBO additional oil will be discovered from 420 additional wildcats (fig. 17). This compares with .820 BBO indicated by play analysis. Gas data is too incomplete for a gas or oil-equivalent curve. The pre-salt play has too few discoveries for curve construction.
On the basis of volumetric yield analogies, Klemme (pers. commun.) arrived at the much lower number of .15 BBO for the basin.
40

Table
BASIN GabQ"______ AREA OF BASIN (Mi%) 33,788 VOLUME OF BASIN (Mi"*)
PLAY ANALYSIS SUMMARY OF UNDISCOVERED PETROLEUM
No.13, COUNTRY Gabon , PLAY Pre-salt closures No.AREA OF PLAY (MMA) 21.62PLAY EST.ORIG. RESERVES .310BBO - TCFG
ESTIMATE ORIGINAL RESERVES 1.71 BBO - TCFGTECTONIC CLASSIFICATION OF BASIN: Rifted continental margin
DEFINITION AND AREA OF PLAY: Accumulations trapped in pre-Aptian sands which are truncated by faults, wedged against older fault blocks, or draped over fault blocks. The play occupies the whole basin area (figs. 14 and 15^._______________________________PROBABILITY T)ISTRIBUTION
MAJOR GEOLOGICAL/EXPLORATION FACTORS
A. UNTESTED TRAP AREA (MMA)
B. PERCENT UNTESTED TRAP AREA PRODUCTIVE (%)
C. AVERAGE EFFECTIVE PAY (feet)
D. PERCENT OIL VERSUS GAS IN PETROLEUM FILL (%)
E. OIL RECOVERY (BBLS/AF)
F. GAS RECOVERY (MCF/AF)
G. NGL RECOVERY (BBLS/MMCFG)
95%
.20
2
40
30
100
700
11
MOST LIKELY
.65
5
70
50
270
1,175
16
5%
1.00
10
120
80
350
1,300
20
PRODUCT OF MOST LIKELY PROBABILITIES: OIL. 307 BB, GAS, 1.336TCF, NGL -021BB, QE.551 BBOE
REMARKS
A. By analogy to other estimates of trap areas in rifted continental margin basins, I assume trap constitute 5/0 of the play area. I estimate that probably only 40% of the traps have been tested under the seismic-obscuring effects of the overlying Aptian salt, leaving .65 million acres of untested trap.
B. The success rate through 1984 appears to be about 12.5%. Closures appear fairly close to being filled, analogous to this same play in the Congo where I ha^ve estimated 40% fill. This indicates about 5% of untested traps would be productive.
C. The two largest fields have net pays of 121 and 72 ft. I estimate 70 ft as an average for future discoveries.
D. Present fields appear to have a fairly small gas cap. The estimated average oil content for the Congo is 75/0 . It appears that future discoveries will be further down-dip with a higher gas content. I estimate 50% oil.
E. Reservoir porosities appear good ranging from 22 to 29% in the larger fields. Assuming average reservoir parameters, I estimate a production rate of 270 barrels per acre foot.
F " * pl?:Salt depths avera8e 5 >° ft but new discoveries would probably average some ft which with a thermal gradient of 1° F/100 ft, would yield 1,175 MCF/AF.
G. Analogous to Nigerian assumption.
Undiscovered resources of all plays of basin: .820 BBO, 1.668 TCFG .025 BBNGL, 1.123 BBOE
41
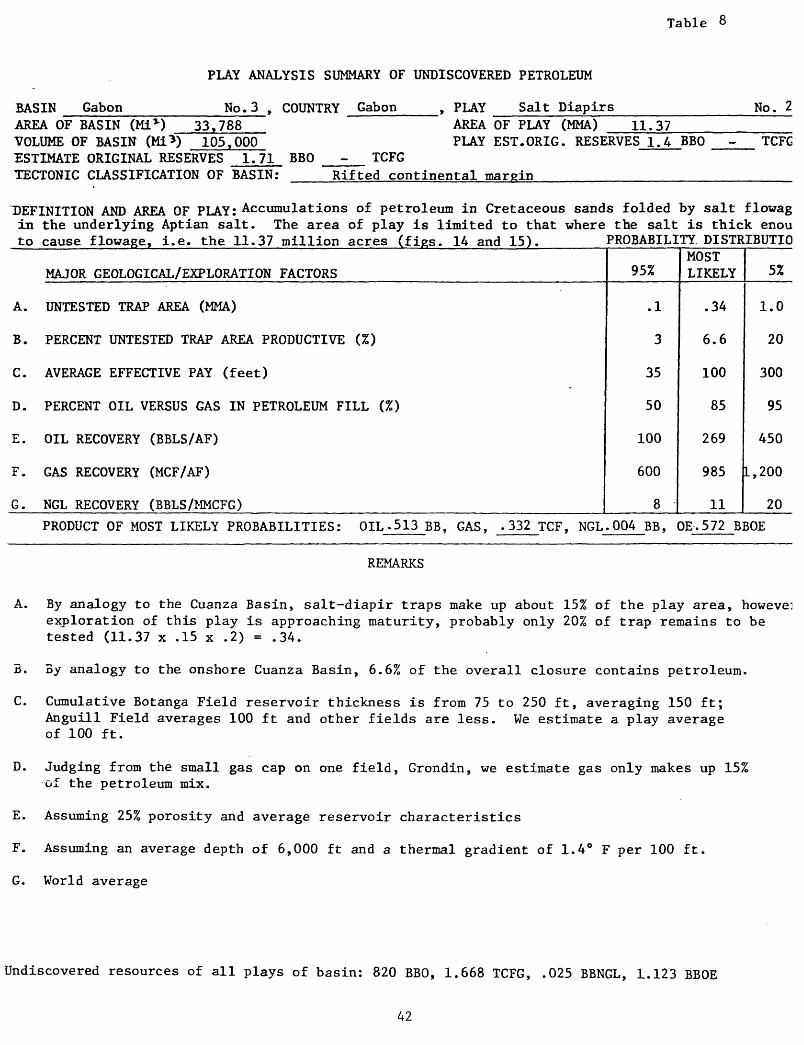
Table 8
PLAY ANALYSIS SUMMARY OF UNDISCOVERED PETROLEUM
BASIN Gabon No.3 , COUNTRY Gabon , PLAY Salt Diapirs No. 2AREA OF BASIN (Mi*) 33,788 VOLUME OF BASIN (Mi*) 105,000 ESTIMATE ORIGINAL RESERVES 1.71 BBO TECTONIC CLASSIFICATION OF BASIN:
AREA OF PLAY (MMA) 11.37PLAY EST.ORIG. RESERVES 1.4 BBO TCFG
TCFGRifted continental margin
DEFINITION AND AREA OF PLAY: Accumulations of petroleum in Cretaceous sands folded by salt flowage in the underlying Aptian salt. The area of play is limited to that where the salt is thick enough to cause flowage, i.e. the 11.37 million acres (figs. 14 and 15). PROBABILITY DISTRIBUTION
MAJOR GEOLOGICAL/EXPLORATION FACTORS
A. UNTESTED TRAP AREA (MMA)
B. PERCENT UNTESTED TRAP AREA PRODUCTIVE (%)
C. AVERAGE EFFECTIVE PAY (feet)
D. PERCENT OIL VERSUS GAS IN PETROLEUM FILL (%)
E. OIL RECOVERY (BBLS/AF)
F. GAS RECOVERY (MCF/AF)
G. NGL RECOVERY (BBLS/MMCFG)
95%
.1
3
35
50
100
600
8
MOST LIKELY
.34
6.6
100
85
269
985
11
5%
1.0
20
300
95
450
1,200
20
PRODUCT OF MOST LIKELY PROBABILITIES: OIL.513 BB, GAS, .332 TCF, NGL. 004 BB, OE.572 BBOE
REMARKS
A. By analogy to the Cuanza Basin, salt-diapir traps make up about 15% of the play area, however, exploration of this play is approaching maturity, probably only 20% of trap remains to be tested (11.37 x .15 x .2) = .34.
B. By analogy to the onshore Cuanza Basin, 6.6% of the overall closure contains petroleum.
C. Cumulative Botanga Field reservoir thickness is from 75 to 250 ft, averaging 150 ft; Anguill Field averages 100 ft and other fields are less. We estimate a play average of 100 ft.
D. Judging from the small gas cap on one field, Grondin, we estimate gas only makes up 15% of the petroleum mix.
E. Assuming 25% porosity and average reservoir characteristics
F. Assuming an average depth of 6,000 ft and a thermal gradient of 1.4° F per 100 ft.
G. World average
Undiscovered resources of all plays of basin: 820 BBO, 1.668 TCFG, .025 BBNGL, 1.123 BBOE
42
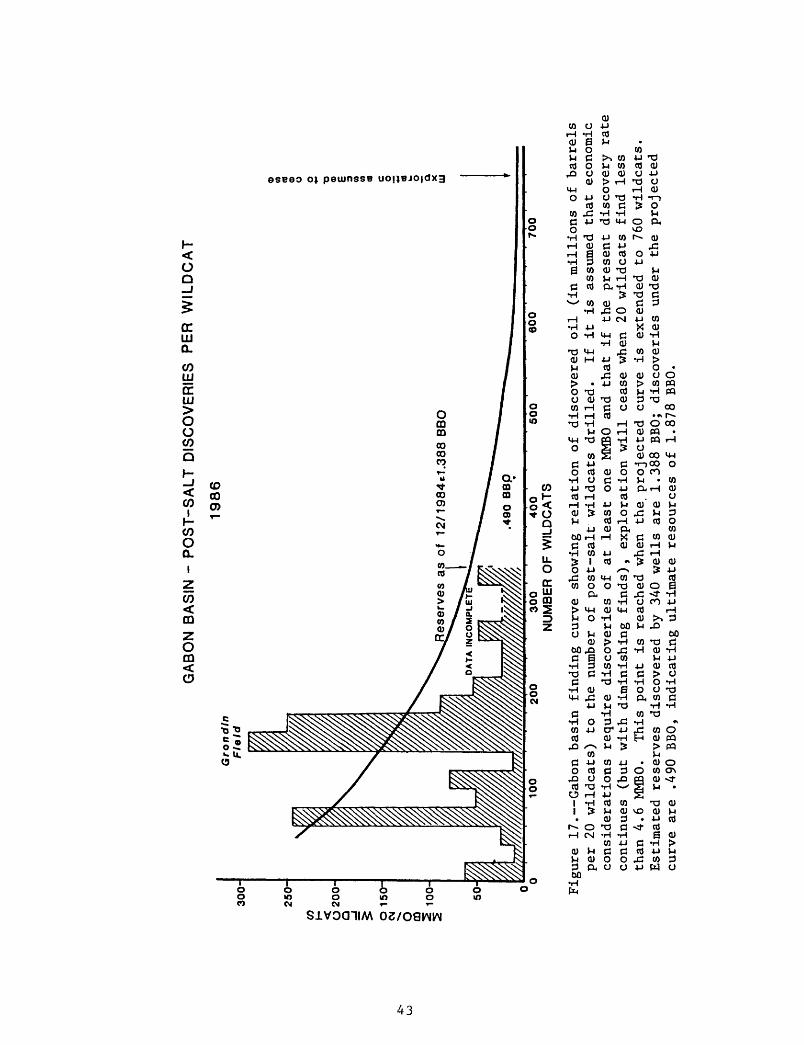
GA
BO
N B
AS
IN -
PO
ST
-SA
LT
DIS
CO
VE
RIE
S
PE
R
WIL
DC
AT
CO
300-
Gro
nd
/n
Fie
ld
1986
100
200
300
400
NU
MB
ER
OF
WIL
DC
AT
S500
600
700
Figu
re 17. Gabon b
asin finding
curv
e sh
owin
g re
lati
on of
di
scov
ered
oi
l (in mi
llio
ns of
ba
rrel
s pe
r 20
wildcats)
to th
e number of
po
st-s
alt
wild
cats
drilled.
If it
is
as
sume
d th
at economic
cons
ider
atio
ns re
quir
e di
scov
erie
s of
at le
ast
one
MMBO an
d th
at if
th
e present
discovery
rate
continues
(but
wi
th diminishing
finds),
exploration
will
cease
when 20
wil
dcat
s fi
nd le
ss
than 4.6
MMBO.
This po
int
is re
ache
d when th
e pr
ojec
ted
curv
e is extended to
76
0 wi
ldca
ts.
Esti
mate
d re
serv
es discovered by 34
0 wells
are
1.38
8 BBO; discoveries
under
the
proj
ecte
d cu
rve
are
.490
BB
O, in
dica
ting
ul
tima
te re
sour
ces
of 1.
878
BBO.

With the above estimates under consideration, the consensus of The World-Energy-Resources-Program geologists settled on a range of estimates for the undiscovered petroleum resources of which the modes, most likely, were 1.1 BBO and 1 TCFG. The full range of probabilities, derived from the consensus, are shown in the cumulative probability curves for undiscovered oil and gas in the Gabon basin (fig. 18). The curves include the mean values of 1.38 BBO and 1.16 TCFG.
Congo Basin Location and Size
The Congo basin (sometimes referred to as the Lower Congo basin), as here defined, is a depressed segment of the rifted continental margin of west Africa centered about the mouth of the Congo River (figs. 1, 19 and 20). It comprises the coastal and offshore areas of southernmost Gabon, Congo, Zaire, and northern Angola including Cabinda (Angola and Cabinda, 58%, Congo, 24%, Gabon, 12%, and Zaire, 7%). The northern boundary with the Gabon basin is taken to be at a west-plunging basement nose at Mayumba, Gabon (Lat. 3°30' S.). The southern boundary with the Cuanza basin is rather arbitrarily placed at Ambriz, Angola (Lat. 7°45' S.). The basin is part of a much more extensive evaporite basin of Aptian time which extends southward from the east side of the Douala basin in Cameroon to the Walvis Ridge in Namibia and westward some 200 miles into the Atlantic (to a depth of some 10,000 ft), an area of some 180,000 sq mi (fig. 2). However, some 90 percent of the petroleum prospects appear to be on the continental shelf, largely in less than 200 m (600 ft) of water, but certainly within 1,000 m water depth contour which is assumed as the west boundary of the basin. As will be discussed, this boundary approximately coincides with the western boundary of the high- relief rifting (with consequent trap formation and organically rich shales in graben lakes) which was most active within the continent prior to the final pull-apart. It also is the approximate western limit of sufficiently thick sedimentary cover to insure thermal maturity, and is the approximate western edge of the better reservoir development. Incidentally, it appears to approximate the edge of economic drilling and production depths. Thus defined, the Congo basin has an area of some 30,000 sq mi and a sedimentary volume of 80,000 cu mi.
Exploration and Production History
Petroleum exploration has been continuous for the past 50 years along this part of the African coast, but has been concentrated mainly in the Gabon and Cuanza basins, which are largely onshore. In 1957, the first oil field was found in the Congo basin at Point Indienne, Congo. Exploration in this part of Africa went offshore in 1960; the first offshore discovery in the Congo basin was Malongo in 1966, a giant complex of fields which contains almost half the reserves of the basin. Over 400 wildcats have been drilled, discovering an estimated 2.6 billion barrels of oil. Gas has been discovered, but apparently not produced commercially. The discovery rate, as of the end of 1984 is about 29 percent, however, the size of discoveries is declining since the first giant discovery (Malongo, 1966, fig. 20). Although exploration is perhaps approaching early maturity, there are yet-to-be- overcome exploration obstacles which suggest that considerable petroleum is yet to be discovered. The pre-salt play is hampered by the unpredictability of the fluviatile sand channels which form the principal reservoir, e.g. the
44
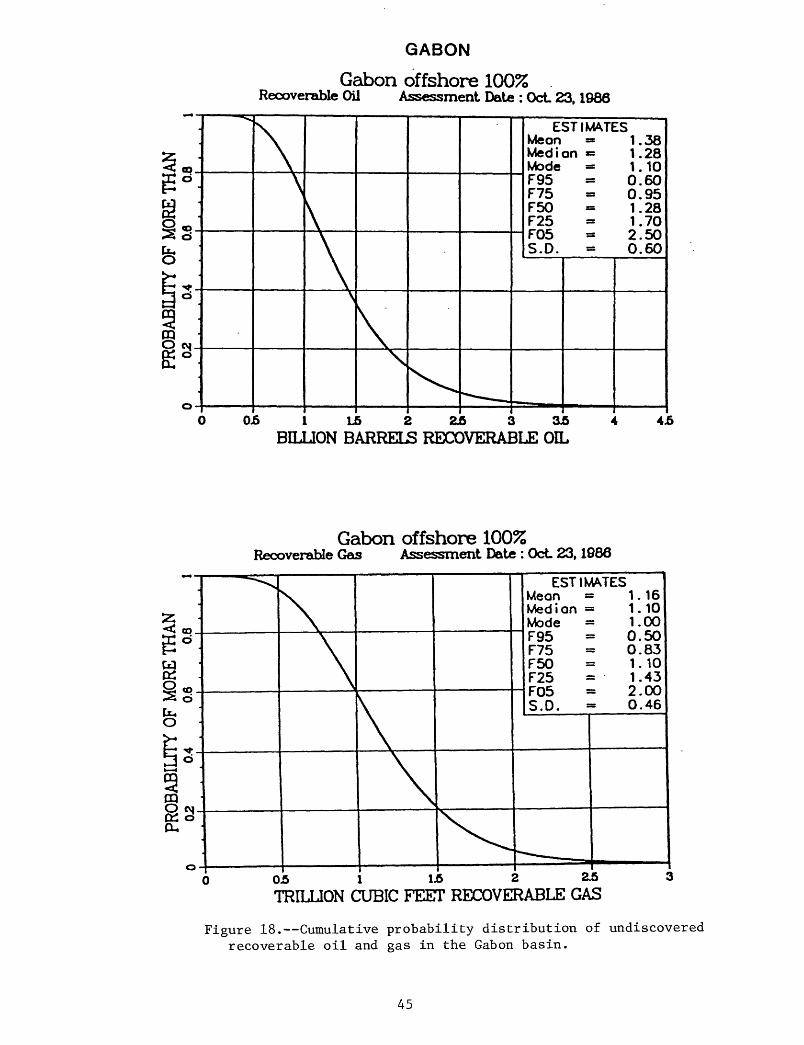
GABON
Gabon offshore 100%Recoverable Oil Assessment Dale : Oct 23,1986
\\
V
\
k\^^
ESTIMATES Mean « 1.38 Median = 1 .28 Mode - 1 . 10 F95 = 0.60 F75 » 0.95 F50 « 1.28 F25 - 1.70 F05 - 2.50 S.D. = 0.60
^ imi
11
0.5 1 L5 2 2£ 3 3£BILLION BARRELS RECOVERABLE OIL
4J5
Gabon offshore 100%Recoverable Gas Assessment Date : Oct 23,1986
<J eo_e dwKQ«. ^ 0
tau O
Z3 °*1 4
9aO cvj.&. o CU
^^
\
HV.
ESTIMATES Mean = 1 . 16 Median » 1.10 Mode = 1.00F95 = 0.50 F75 = 0.83 F50 = 1.10 F25 = 1.43F05 = 2.00 S.D. = 0.46
^- . Mil^iWi^
0 05 1 1.6 2 25 aTRILLION CUBIC FEET RECOVERABLE GAS
Figure 18. Cumulative probability distribution of undiscovered recoverable oil and gas in the Gabon basin.
45

GABON OIL FIELD
-2"
-4°
GABON BASIN
N LOWER CONGO BASIN
CONGO BASIN OIL FIELDS
Principal oil fields
Principal pre-salt highsBoundary between salt domes on the east and growth faults on west
Figure 19. Tectonic element map of the Gabon and Congo basins (modified from Reyre, 1984).
46

GABON''"
^TCHIBALA jf ^ M'B
LIVUITE* MIBAif y % LMWEND/I
- KINKASI
CONGO BASIN
^^ Oil Held
Discoveries
j/I'jTi' B«««m«nt
QO "*^^ Edge continental shell
Figure 20. Index map of the Congo basin (modified from Petracca, 1986).
47

Lucula or equivalent formation. The distortion of the seismic sub-salt reflections by the irregular configuration and thickness of the salt impede finding closures and especially fresh-water carbonate reefs; the pre-salt discovery rate is about 18 percent. The post-salt exploration is hindered by the irregular shape and lack of good reflections at the top-salt interface.
Structure
Regional Tectonics. The basin is essentially a segment of the rifted continental margin of west Africa. The initial rifting of African-American craton accompanied by uplift and block faulting occurred at the end of the Jurassic or earliest Cretaceous, resulting in a series of grabens and horsts which formed deep lakes and intra-lake highs. The highs become prominent southward at the expense of the pre-salt sedimentary section so that south of the Congo River, the pre-salt section is relatively thin or missing (fig. 19).
In the Aptian, the continental crust ruptured with consequent abatement of the tensional rifting within the continental area. The fault structures were leveled by erosion and land-fill, and an interior sag formed as the hot, spreading-center separated from the continental crust. Into this restricted depression were deposited widespread continental shallow elastics grading upward into evaporites including salt originating from limited incursion of marine waters. Seaward tilt occurred at the time of final widespread decoupling of the two continents allowing the open sea to transgress from the southwest. With the subsidence came sediments ranging from redbeds onshore to deep-water shales offshore. This sedimentary load caused the beginning of salt tectonics in two forms: one was salt pillows and diapirs. The other, on the steeper continental slopes, was listric faulting caused by down-dip ductile salt flow combined with brittle fracture of the overlying carbonates, the fault planes flattening downward into the seaward-dipping basal salt bedding plane (fig. 19).
The continental margin of the Congo, as well as the Gabon basin, can be divided into three zones from east to west: 1) the relatively undisturbed continental shelf, 2) a zone of extension characterized by high-relief horst and graben faulting. The blocks tilted generally eastwards, 3) a zone of attenuated continental crust with less relief and less tilted blocks (fig. 15).
Structural Traps. The extension zone of high-relief horst and grabens is where most of the traps are concentrated. Coincidentally, the outer margin of this extension zone is about at the edge of the present shelf, which I have taken as the boundary of the basin. I assume this extension or horst and graben zone covers all of the Congo basin as I have defined it.
This horst and graben zone contains four plays: 1) The pre-rift reservoirs cut and tilted in the faulting, 2) synrift reservoirs, i.e. sands and turbidites moving from the eroding horsts and depositing on the flanks and in the adjoining shale-filled grabens, 3) synrift freshwater carbonates on the horst highs, and 4) drapes in the postrift interior sag sediments over the highs. It is assumed that these plays cover the entire basin as here defined. Owing to lack of sufficient information concerning these plays, they are lumped into one group referred to as pre-salt play.
The amount of faulted trap area is unknown to me; from an available cross-section it appears that it could be large, depending on the fault seals. However, by analogy to the geological estimates for somewhat similar
48

continental margins of India, about 5 percent of the play area is thought to be under closure, or about 960,000 acres.
A second set of plays concerns the traps formed by the effects of salt flowage on the post-salt reservoirs. The limit of these plays would theoretically extend over the whole Aptian salt basin where the over-burden exceeds about 3,300 ft, the approximate thickness required to induce halokinesis, and where the original salt thickness exceeds 1,500-2,000 ft. However, the lack of source rock (to be discussed), lack of sufficient reservoir development, and poor drilling and production economics in deep water limit the area of consideration to the shelf, that is, water less than 3,000 ft (1,000 m). Within this shelf, the salt kinetics is in three modes: 1) undisturbed, 2) flowage, pillows, and diapirs, and 3) listric faulting where the sole of the curved fault surface converges with the seaward-dipping basal bedding planes of the salt. The undisturbed area, some 7.25 million acres, appears to be confined largely to the onshore portion of the basin, though it does extend offshore in the northern part. The area of diapiric flowage, 1.3 million acres, is largely the inner shelf (less then 600 ft of water in the northern part of the basin). The area of listric faulting, some 10.7 million acres, comprises the rest of basin as here defined, that is, the continental shelf down to 3,000 ft water-depth excepting the undisturbed areas. It should be noted that there is a large, 33,500-sq-mi, area of salt- tectonically induced closures oceanward of the effective petroleum basin; the closures have a total area of perhaps 3.2 million acres.
Stratigraphy
General. The stratigraphic units of the Congo basin are similar and in fact largely continuous with those of Gabon and the other marginal basins of West Africa, but do have some local differences. The stratigraphy does not follow layer-cake geometry and the relationships of the different units are best shown by a schematic cross section (fig. 21) and by an interpretation of a regional seismic section (fig. 22).
Intracratonic (Prerift) Sediments
Some upper Paleozoic to Jurassic sedimentary rocks are reported, but these appear to be of minor importance for petroleum. The prerift lower Neocomian Lucula Formation (equivalent to Vandji, N'Dombo, Gres de base Formations) is an important reservoir. It is a sandy fluvio-lacustrine sequence deposited in and around a broad shallow lake system in a gently subsiding Africa-America intracratonic basin. Large areas of non-deposition appear to be separated by lakes and fluviatile channels into which thick Lucula sandstones are concentrated.
Interior Rift (Synrift) Sediments
With the beginning of active faulting in the Early Cretaceous, deep- graben-lake systems formed. They were filled by lacustrine turbidites (Erva Formation) that grade laterally and upwards into organically rich, deep- lacustrine dolomitic shale (Brice et al., 1983), the Bucomazi Formation (equivalent to the Melania, Pointe Noire, Djeno, Mornes Noir and Mayanga(?) Formations). These dolomitic shales were deposited in an anoxic lake basin, which is apparently 50 mi wide and extends from Angola to northern Gabon (Brice et al., 1983). In the shallower parts of the lakes, the deep-water
49
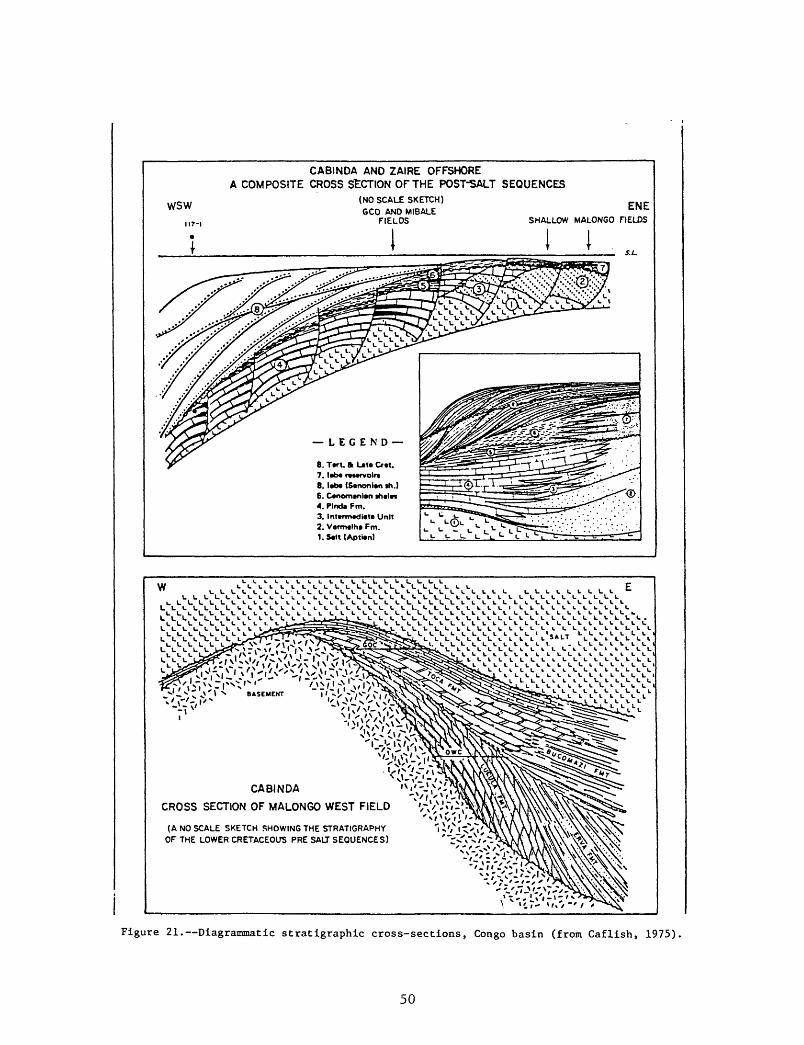
CABINDA AND ZAIRE OFFSHORE A COMPOSITE CROSS SECTION OP THE POST-SALT SEQUENCES
WSW
nr-
(NO SCALE SKETCH)
GCO AND MIBALE FIELDS
ENESHALLOW MALONGO FIELDS
I I
8. Ttrt. ft Ut» Crtt.7. lab* fM«rvolri8. l*b* <S«noni*n ih.) 6. C*oom»nl»n ihaln 4. Plncta Fm. 3. lnl»rm*di«t» Unit 2. V«rm«lh» Fm. 1. S«lt (Aptian)
Wl.LLl.Ll.l-1.
CABINDA
CROSS SECTION OF MALONGO WEST FIELD
(A NO SCALE SKETCH SHOWING THE STRATIGRAPHY
OF THE LOWER CRETACEOUS PRE SAU SEQUENCES)
Figure 21. Diagrammatic stratigraphic cross-sections, Congo basin (from Caflish, 1975)
50

MA
LO
NG
O W
ES
T
sw
44*44
4-
+
4
4-
+
4>
+ »
,+
4-
4-
+
44 4-444*44*
44
-t ft
15a.
EX
PLAN
ATIO
N
B R
EG. S
UB.,
m P
OSTR
IFT.
15
SYNR
IFT
II (E
VAPO
RITE
S)
D S
YNRI
FT I
I. @
SYN
RIFT
I. (
3 PR
ERIF
T. t
ii BA
SEM
ENT
SW
15b.
^
REG.
SUB
., D
SY
NRIF
T II.
EXPL
ANAT
ION
POST
RIFT
. Q S
YNRI
FT II
(EV
APOR
ITES
) SY
NRIF
T I.
Q P
RERI
FT.E
J BA
SEM
ENT
Figure 22. -Geologic dip-
sect
ion,
of
fsho
re Cabinda, Co
ngo
basi
n; migrated se
ismi
c interpretation
(from
Bric
e et al
., 1982).

shales grade into shallow lacustrine shales and carbonates. Dolomitized algal biostromes or coquina banks formed on the high-standing horst blocks. These interbedded and bank carbonates are the Toca Formation, an important reservoir of the Congo basin.
Interior Sag (Svnrift and Postrift) Sediment
Most faulting ceased after the first rupturing of the continental crust and there was a period of erosion, leveling the rift zone. This was followed by a post-rift sag that was filled with continental beds consisting of lacustrine shales, carbonates, sandstones, and alluvial elastics, which grade upward into an evaporite sequence. The pre-evaporite sediments are 1,600 ft of shallow carbonates and sandstones which thin shoreward to a uniform 150 foot thick sandstone and shale alluvial plane deposit, the Chela or Gamba Formation (equivalent to the upper Cocobeach).
Evaporite deposition began towards the end of the interior sag period with a marine incursion from the south. The incursion was initially confined to individual graben subbasins, but towards the end of the Aptian, covered the entire basin with an evaporite, predominantly salt, sequence (as much as 3,000 ft thick in Cabinda) (Brice et al., 1983).
Marginal Sag (Postrift) Sediments
Following the decoupling of Africa and America in the Albian and the separation of the active spreading-center from the continental margin, there was a cooling and gentle, regional thermal subsidence or oceanward tilting. The initial transgression of marine waters was from the southwest and eventually reached a maximum extension on to land in the Campanian. During the initial transgression, the onshore and eastern offshore basin received a continuous deposit of continental red beds, the Vermelha Formation. Westward, the facies changed to a narrow zone of littoral sandstones and limestones (Intermediate Unit, fig. 21) Further west, a shallow marine formation made up of limestone with shale and siltstone was deposited, the Pinda Formation (equivalent to the Madiela, Sendji and Mavuma(?) Formations). The Pinda limestones are the reservoir rocks of the GCO and Mibale fields in Zaire (Caflish, 1975). Up to 6,000 ft of sediment were deposited during this transgressive phase. A regressive cycle followed which continued through the Paleogene. At the end of the Paleogene, a renewed regional marginal subsidence ensued which continues to the present. Sedimentation resulted in a shaley clastic sequence. Deep-water shales and turbidites grade upward and shoreward to nearshore sandstones and shales, followed by an alluvial sand section. This sequence is up to 20,000 ft thick. The nearshore sandstones provide good shallow reservoirs (Labe Formation).
Reservoirs. Four principal reservoir zones in the basin are: Lucula sandstones and Toca carbonates in the pre-salt reservoirs and the Pinda carbonates and Vermelha-Labe sandstones in the post-salt reservoirs.
1) Lucula Formation. Lucula and equivalent sandstones are the main pays in the largest pre-salt fields: Malongo West, 600 ft thick, and Malongo North and South, 200 ft thick. The Malongo West pay, however, includes an unknown amount of Toca carbonates. The few pay data of other similar fields indicate an average of 92 ft. I estimate 100 ft as an average pay thickness for the basin. The Lucula reservoirs are reportedly massive, clean, well-sorted
52

sandstones and massive siltstone. The porosity ranges from 15 to 18 percent (in Gabon). Lateral distribution and thickness of the Lucula are difficult to determine; its composition appears to be mainly fluvial channels, which are absent from large areas (Caflish, 1975).
2) Toca Carbonates. Little data are available concerning thickness and reservoir characteristics. Carbonates are in two areas: 1) reefs and banks on fault-block islands or shoals within the Neocomian lakes, and 2) a belt trending NNW-SSE 25 to 30 miles off the present coast (Caflish, 1975). Stratigraphic reef traps are estimated to make up 1 percent of the play area.
3) Pinda Carbonates (equivalent to the Sindji carbonates in northwestern Congo, Madiela carbonates in Gabon). This unit immediately overlies the salt and is the main post-salt reservoir of Zaire, Angola, and, in general, the southern part of the basin. Salt-soled listric faults, contemporaneous with the carbonate deposition, caused the carbonate reservoirs on the tilted upthrown block (figs. 21 and 22) to remain longer as a topographic high on the sea floor, becoming a locus for porous, high-energy carbonate deposition.
4) Labe (Likouala) Sandstones. The Labe sandstones are units of the Labe Formation of Cabinda. The formation appears to be a catch-all for a Cenomanian to Eocene sequence of sandstones, siltstones and shales with some carbonates; it ranges from 1,500 to 12,000 ft in thickness. The sandstones constitute the principal reservoirs of the post-salt plays. In the Congo, equivalent sandstones are in the Likouala Formation; in northern Angola, the basal part of a Labe-equivalent section is referred to as the Kin Kasi Formation. For evaluation purposes, I lump the Vermilha Formation sandstones (shoreward facies of the Pinda Formation of which I have little data) with the Labe sandstones. These Labe sandstones appear thickest in the offshore area of the Congo which, as the Likouala Formation, they are important reservoirs. At the Emeraude field, the net interval thickness of the reservoirs is 470 ft; at the Laongo Marine field, 166 ft; and at Likoula, 139 ft. There are Labe- equivalent reservoirs of unknown thickness in the nearby giant Malongo fields of Cabinda. In other parts of the basin, these reservoirs are presumably thinner, though no net thickness data are available (gross thickness of 400 to 500 ft are reported). I estimate an average net pay thickness of 100 ft for future discoveries.
Where best explored, in the Emeraude field, the reservoir formation is described as very complex, being made up of alternating facies of dolomite, limestone, sandstone, siltstone, and shale in beds ranging in thickness from 0.3 to 3.3 ft (Petroconsultants, 1982). The recovery factor averages only 3 percent, but this is due largely to shallow depths of the reservoir (average less than 1,000 ft, too shallow for economical directional drilling from a few central platforms), high viscosity of the oil (degraded), and water flushing through fracture channels. The porosity averages about 25 percent in this and neighboring fields and I estimate 25 percent as an average for post-salt reservoirs.
Seals. The lower Cretaceous reservoirs appear to be sealed in part by the Aptian salt. It seems, however, that primary migration of petroleum must have gone through the salt because two investigators (Brice, 1982, and Reyre, 1984) have established by finger-printing and other means that the source for the post-salt oil is mainly the pre-salt Bucomazi or equivalent organic lacustrine shales. Figure 22 shows that the salt seal is not continuously
53

thick, especially in the areas down-dip from Malongo. Growth faults may supply an avenue for migration.
The post-salt reservoirs appear to be sufficiently sealed by thick shale sections. The presence of bituminous sandstones all along the outcrop belt indicates some updip leakage, however.
Source Section. The principal source rocks are the dark, lacustrine, dolomitic, richly organic Bucomazi Formation or equivalent shales of Early Cretaceous age.
Petroleum Generation and Migration
Richness of Source. The principle source formation, Bucomazi Formation, or equivalent, is a dark, organically rich deep lacustrine, dolomitic shale that was deposited in an anoxic lake system. The dolomitic shales have low- density, low- seismic-velocity layers which have as much as 20 percent organic matter. The formation is up to 3,000 ft thick, 50 mi wide, and extends from northern Gabon to Angola (Brice and others, 1982). An indication of the richness may be the petroleum fill of the traps. I estimate from available maps that petroleum fill of the Emeraude field is about 50 percent. This single sample compares favorably with the estimated average fill of 55 percent for Gabon. I estimate an average fill for the traps of the Congo basin as 55 percent.
Depth and Volume of Source Rock. The Emeraude field has an average thermal gradient of 1.2° F/100 ft, and Pointe Indienne has 1.6° F/100 ft; I assume 1.4° F/100 ft as an average for the basin. At Malongo field the rate of subsidence appears to be 59 ft/million years, which indicates the top of the mature zone to be at a depth of about 9,300 ft. Onshore at Liawenda, the top of the mature zone is estimated to be at a depth of 6,400 ft. At these depths, the thermally mature source rock is well below the Aptian salt indicating that indeed the only source of the post-salt, as well as the pre- salt oil, is the pre-salt Bucomazi Formation. This may explain further why no appreciable oil has been found onshore where most of the Bucomazi Formation or equivalent (synrift 1) appears to be too shallow to be mature (fig. 22). The volume of source is approximately that of the lacustrine shale, approximately 4,300 cu mi calculated from a width of 50 mi, an estimated average thickness of 1,500 ft, and a length equal to that of the basin.
Oil Versus Gas. Apparently no appreciable amounts of gas have been produced in the Congo basin. It is noted, however, that the giant Malongo field has a strong gas drive. Gas has been tested from a number of wildcats. I estimate that the petroleum mix is about 75 percent oil.
Migration Timing Versus Trap Formation. If one assumes the thermal gradient and subsidence rates were roughly constant since the Cretaceous, one must conclude that oil generation and migration only began recently because the source shale, the Bucomazi Formation, would not have subsided to the oil window at about 8,000 ft (2,500 m or 2.0 seconds, fig. 22) until Oligocene or later. Of course the thermal and subsidence rates were greater in the past, which would have placed the oil window at a perhaps shallower depth but would not, in any case, alter the main fact that oil migration is late.
54
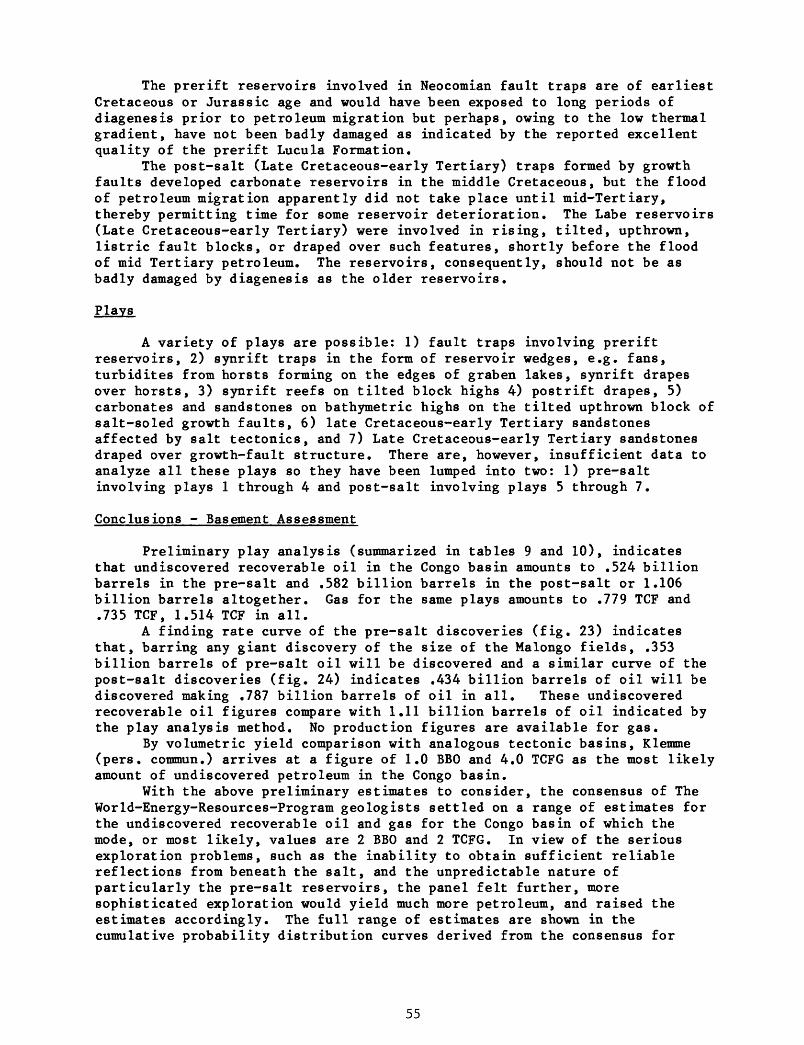
The prerift reservoirs involved in Neocomian fault traps are of earliest Cretaceous or Jurassic age and would have been exposed to long periods of diagenesis prior to petroleum migration but perhaps, owing to the low thermal gradient, have not been badly damaged as indicated by the reported excellent quality of the prerift Lucula Formation.
The post-salt (Late Cretaceous-early Tertiary) traps formed by growth faults developed carbonate reservoirs in the middle Cretaceous, but the flood of petroleum migration apparently did not take place until mid-Tertiary, thereby permitting time for some reservoir deterioration. The Labe reservoirs (Late Cretaceous-early Tertiary) were involved in rising, tilted, upthrown, listric fault blocks, or draped over such features, shortly before the flood of mid Tertiary petroleum. The reservoirs, consequently, should not be as badly damaged by diagenesis as the older reservoirs.
A variety of plays are possible: 1) fault traps involving prerift reservoirs, 2) synrift traps in the form of reservoir wedges, e.g. fans, turbidites from horsts forming on the edges of graben lakes, synrift drapes over horsts, 3) synrift reefs on tilted block highs 4) postrift drapes, 5) carbonates and sandstones on bathymetric highs on the tilted upthrown block of salt-soled growth faults, 6) late Cretaceous-early Tertiary sandstones affected by salt tectonics, and 7) Late Cretaceous-early Tertiary sandstones draped over growth-fault structure. There are, however, insufficient data to analyze all these plays so they have been lumped into two: 1) pre-salt involving plays 1 through 4 and post-salt involving plays 5 through 7.
Conclusions - Basement Assessment
Preliminary play analysis (summarized in tables 9 and 10), indicates that undiscovered recoverable oil in the Congo basin amounts to .524 billion barrels in the pre-salt and .582 billion barrels in the post-salt or 1.106 billion barrels altogether. Gas for the same plays amounts to .779 TCF and .735 TCF, 1.514 TCF in all.
A finding rate curve of the pre-salt discoveries (fig. 23) indicates that, barring any giant discovery of the size of the Malongo fields, .353 billion barrels of pre-salt oil will be discovered and a similar curve of the post-salt discoveries (fig. 24) indicates .434 billion barrels of oil will be discovered making .787 billion barrels of oil in all. These undiscovered recoverable oil figures compare with 1.11 billion barrels of oil indicated by the play analysis method. No production figures are available for gas.
By volumetric yield comparison with analogous tectonic basins, Klemme (pers. commun.) arrives at a figure of 1.0 BBO and 4.0 TCFG as the most likely amount of undiscovered petroleum in the Congo basin.
With the above preliminary estimates to consider, the consensus of The World-Energy-Resources-Program geologists settled on a range of estimates for the undiscovered recoverable oil and gas for the Congo basin of which the mode, or most likely, values are 2 BBO and 2 TCFG. In view of the serious exploration problems, such as the inability to obtain sufficient reliable reflections from beneath the salt, and the unpredictable nature of particularly the pre-salt reservoirs, the panel felt further, more sophisticated exploration would yield much more petroleum, and raised the estimates accordingly. The full range of estimates are shown in the cumulative probability distribution curves derived from the consensus for
55

Table 9
No.BASIN CongoAREA OF BASIN (Mi^) 30,000VOLUME OF BASIN (Mi3) 80,000
PLAY ANALYSIS SUMMARY OF UNDISCOVERED PETROLEUM Gabon-12% , Congo-24% , Angola-58%
COUNTRY Zaire-7% , PLAY Pre-salt Plays No.AREA OF PLAY (MMA) 19.2 PLAY EST.ORIG. RESERVES BBO TCFG
- TCFGESTIMATE ORIGINAL RESERVES 2.6 BBOTECTONIC CLASSIFICATION OF BASIN: Rifted continental marginDEFINITION AND AREA OF PLAY: Accumulations formed in early Cretaceous rifting, either as fault trapped (pre-rift sands) or sedimentary wedges against fault blocks (synrift) or drape closure over older fault blocks (post-rift). Play area occupies entire basin (figs. 19 and 20).
PROBABILITY DISTRIBUTION
MAJOR GEOLOGICAL/EXPLORATION FACTORS
A. UNTESTED TRAP AREA (MMA)
B. PERCENT UNTESTED TRAP AREA PRODUCTIVE (%)
C. AVERAGE EFFECTIVE PAY (feet)
D. PERCENT OIL VERSUS GAS IN PETROLEUM "FILL (%)
E. OIL RECOVERY (BBLS/AF)
F. GAS RECOVERY (MCF/AF)
G. NGL RECOVERY (BBLS/MMCFG)
95%
.10
5
25
25
150
600
5
MOST LIKELY
.452
7.2
100
75
215
957
11
5%
1.00
15
6.00
90
400
1,100
20
PRODUCT OF MOST LIKELY PROBABILITIES: OIL .524 BE, GAS, .779 TCF, NGL .009 BB, OE_662_BBOE
REMARKSA. Analogous to estimates for rifted continental margins elsewhere, I estimate sandstone traps
associated with the rifting make up 5% of the play area. In addition, I estimate another 1% of trap in fresh water carbonate buildups indicating a total trap area of 1.152 MMA. Of this, some 280 wildcats have tested an estimated 0.7 million acres, leaving .452 MMA of untested trap.
B. The discovery rate for this play appears to be about 17%. The average areal fill is estimated to be some 40% (W. Malongo estimated to be 60% and Lucina Marine 30%). This indicates a productive area of 7.2% of the untested trap area.
C. The pay of Malongo West is reportedly 600 ft, Malongo North and South 200 ft, but additional large fields such as these are not likely to be discovered. An average of the reservoirs of a few other available fields appear to be about 92 ft. I assume 100 ft is an average pay thickness for new discoveries.
D. The Malongo fields (only examples available) reportedly have an oil-gas mix of 75-25%.
E. Assuming 20% porosity (Lucula)-15 to 18, Lucina-25 (and others-22 to 25), and usual reservoir parameters, I estimate an average of 215 barrels/acre ft.
F. Assuming an average depth of 8,000 ft, especially for the gas fields, and a thermal gradient of 1.8° F/100 ft, 957 MCFG/AF is estimated.
G. Worldwide average.
Undiscovered resources of all plays of basin: 1.11 BBO, 1.514 TCFG, .017 BBNGL, 1.375 BBOE
56
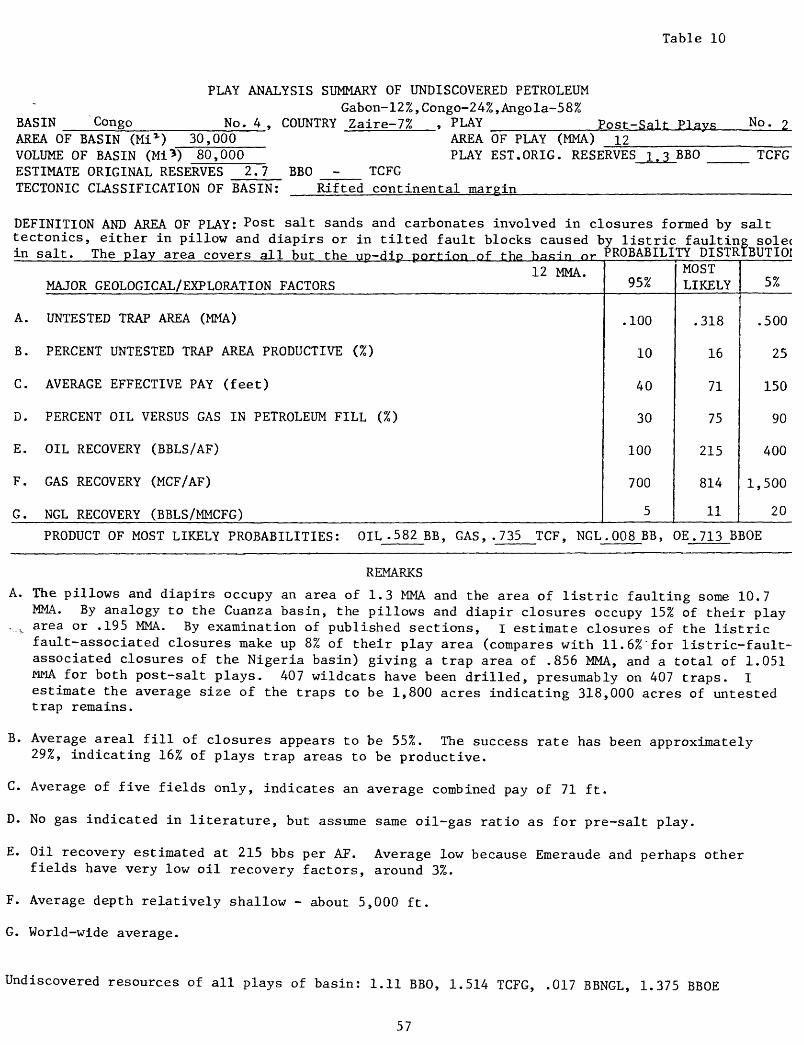
Table 10
BASIN Congo_______AREA OF BASIN (MiT) 30,000
PLAY ANALYSIS SUMMARY OF UNDISCOVERED PETROLEUMGabon-12%,Congo-24%,Angola-58%
No. 4 , COUNTRY Zaire-7% , PLAY __________ Post-Salt Plavs No. 2AREA OF PLAY (MMA) 12
VOLUME OF BASIN (Mi"5) 80,000 PLAY EST.ORIG. RESERVES BBO TCFGESTIMATE ORIGINAL RESERVES 2.7 BBO - TCFGTECTONIC CLASSIFICATION OF BASIN: Rifted continental margin
DEFINITION AND AREA OF PLAY: Post salt sands and carbonates involved in closures formed by salt tectonics, either in pillow and diapirs or in tilted fault blocks caused by listric faulting soled in salt. The play area covers all but the up-dip portion of the has-in or PROBABILITY DISTRIBUTION
12 MMA. MAJOR GEOLOGICAL/ EXPLORATION FACTORS
A. UNTESTED TRAP AREA (MMA)
B. PERCENT UNTESTED TRAP AREA PRODUCTIVE (%)
C. AVERAGE EFFECTIVE PAY (feet)
D. PERCENT OIL VERSUS GAS IN PETROLEUM FILL (%)
E. OIL RECOVERY (BBLS/AF)
F. GAS RECOVERY (MCF/AF)
G. NGL RECOVERY (BBLS/MMCFG)
95%
.100
10
40
30
100
700
5
MOST LIKELY
.318
16
71
75
215
814
11
5%
.500
25
150
90
400
1,500
20
PRODUCT OF MOST LIKELY PROBABILITIES: OIL .582 BB, GAS, .735 TCF, NGL. 008 BB, OE . 713 BBQE
REMARKS
A. The pillows and diapirs occupy an area of 1.3 MMA and the area of listric faulting some 10.7 MMA. By analogy to the Cuanza basin, the pillows and diapir closures occupy 15% of their play
-~.-i. area or .195 MMA. By examination of published sections, I estimate closures of the listric fault-associated closures make up 8% of their play area (compares with 11.6%"for listric-fault- associated closures of the Nigeria basin) giving a trap area of .856 MMA, and a total of 1.051 MMA for both post-salt plays. 407 wildcats have been drilled, presumably on 407 traps. I estimate the average size of the traps to be 1,800 acres indicating 318,000 acres of untested trap remains.
B. Average areal fill of closures appears to be 55%. The success rate has been approximately 29%, indicating 16% of plays trap areas to be productive.
C. Average of five fields only, indicates an average combined pay of 71 ft.
D. No gas indicated in literature, but assume same oil-gas ratio as for pre-salt play.
E. Oil recovery estimated at 215 bbs per AF. Average low because Emeraude and perhaps other fields have very low oil recovery factors, around 3%.
F. Average depth relatively shallow - about 5,000 ft.
G. World-wide average.
Undiscovered resources of all plays of basin: 1.11 BBO, 1.514 TCFG, .017 BBNGL, 1.375 BBOE
57

to
Ul
00
CO
NG
O B
AS
IN -
PR
E-S
AL
T D
ISC
OV
ER
IES
P
ER
W
ILD
CA
T
1986
Wo
st
Ma
lon
go
Po
ss
ible
9q
ulv
al9
tit
an
oth
er
West
Malo
ng
o?
276
300
325
36
0
3/5
400
150
175
Jz5o
2
25
2
50
NU
MB
ER
OF
WIL
DC
AT
WE
LL
S
10
-77
1
1-7
89-6
8
10
-89
Res
erve
s -1
.1
54
BB
O
Figu
re 23, Co
ngo
basi
n pr
e-sa
lt f
indi
ng curve
showing
the
relation o
f discovered o
il (MMBO per
25 wil
dcat
s) to
the
number o
f wildcats drilled,.Assuming
econ
omic
co
nsid
erat
ions
req
uire
at
least
one MM
BO p
er d
iscovery a
nd t
hat
the
pres
ent
estimated
discovery rate of 18
per
cent
continues
("bu
t with di
mini
shin
g fi
nds)
, exploration
will
cease
when 2
5 wi
ldca
ts di
scov
er l
ess
than 5 MMBO,
This
poi
nt i
s reached
when ^2
5 wi
ldca
ts ar
e drilled, Es
tima
ted
rese
rves
of
1.15^ BBO
were
discovered /by 175
well
sj fu
rthe
r discoveries
unde
r the
projected
curve
are
.353
BBO
, in
dica
ting
ul
tima
te resources
of 1.
507
BBO.
The
possibility
of a
West-Malongo-sized
discovery
is suggested by t
he d
ashe
d hu
mp
in th
e curve
at 30
0 we
lls
(indicating
an a
ddit
iona
l re
sour
ce of
.8
50 B
BO).

DISCOVERED OIL RESERVES (MMBO/25 WILDCATS)
(D
O O-
CO
H« 3* fl) 3(- (D O.QQ
(D
O 01OB
CO CO O
8*003 o) petunsBB uo|iBJO|dx3
G) O O< m 3mC/3TJ m
oO

undiscovered oil and gas for each of the countries within the basin (fig. 25). Included in the distribution curves are mean values as follows:
Oil Gas
AngolaCongoGabonZaireTotal
Cuanza Basin
Location and Size
The Cuanza basin, as here defined (figs. 1 and 26), lies entirely in Angola. It extends southward along the west African coast from Ambiz at the mouth of the lage River (which is rather arbitrarily selected as the boundary with the Lower Congo basin to the north) to the south border of Angola (which approximates the north flank of the Walvis Ridge) at about lat. 17° S., thus including, besides the largely onshore Cuanza area and its offshore extension, a narrow coastal zone to the south, sometimes referred to as the Benguela basin (4,400 sq mi) and further south, the so-called Macamedes basin (4,000 sq mi). The basin, as defined, extends westwards from the Precambrian outcrops to the base of the continental slope. Not included is the large area of the Aptian Salt basin which extends some 150 mi into the Atlantic. Thusly defined, the Cuanza basin has an area of some 22,500 sq mi (of which 8,000 sq mi is the onshore Cuanza basin per se as described by Braginon and Venier, 1966). The volume of sediments of the Cuanza basin is approximately 48,000 cu mi.
Exploration and Production History
Serious exploration for petroleum apparently did not start until after World War II. In the late forties and early fifties, there was exploration for asphalt and pyrobitumen which occurred in the outcrop belt at the north end of the basin. Starting in 1952, preliminary geologic and geophysical surveys were initiated and by year-end, the first wildcat had been spudded. The first discovery (Benifica Field) was made in 1955. Subsequently (through 1984), drilling of some 140 wildcats had resulted in 16 discoveries, giving a discovery rate of 12 percent. Reserves of some 110 million barrels of oil and unknown but minor amounts of gas were established. Discoveries have all been onshore. In the early eighties, wildcats (15 as of 1984) have been drilled offshore with no success.
Structure
Regional Tectonics. The Cuanza basin is one of a string of rifted continental margin basins extending along the west coast of Africa from the Guinea Ridge to the Walvis Ridge and southwards. These basins are characterized by a series of north-trending, early Cretaceous horsts and grabens. As seen in the Congo basin (figs. 19, 21, and 22), the basement horsts or highs are becoming more pronounced, occupying more volume, southwards at the expense of the pre-salt sedimentary section, indicating
60
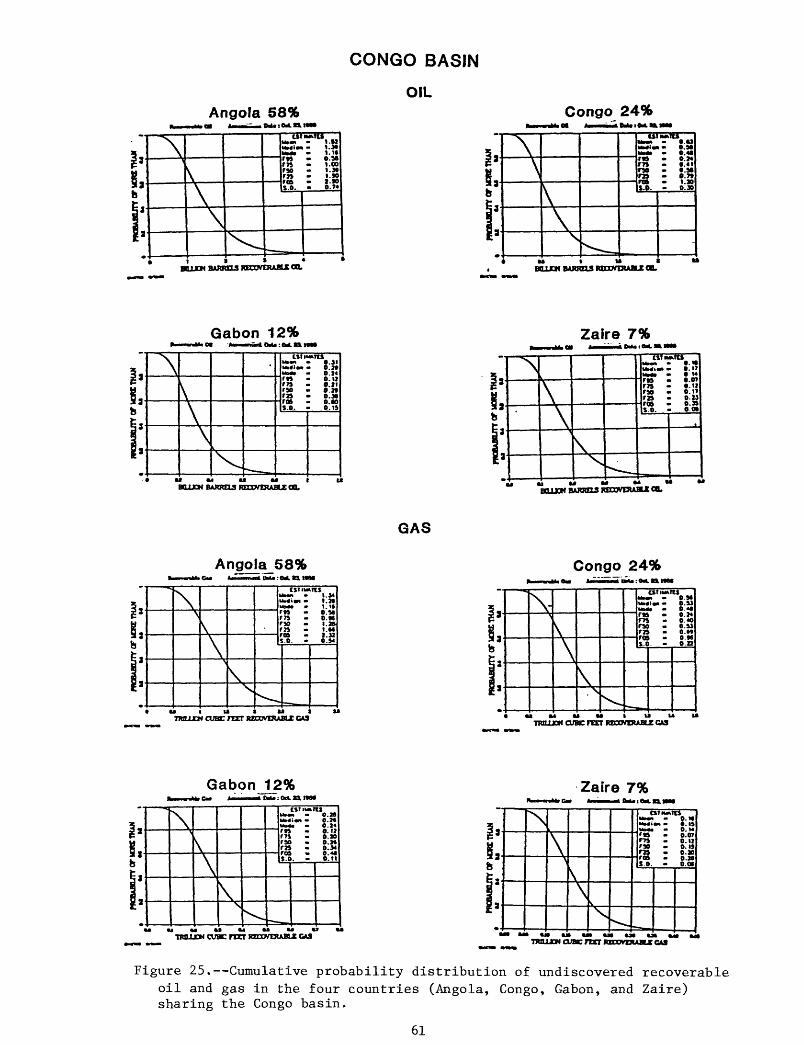
CONGO BASIN
OILAngola 58%
I3
3bi*
ij
NV
^
UMI
r»s.o.
"*l .82 .3*
.M
0.74
Congo 24%
|asa abI a
|a
N\\\\^
uJ?"?"1*. uifMiOT O.M*M» - o.a r» - O.M m - o.«i no - ».M r» - e.n ro» - 1.30S.0. - 0.30
^ ^^ ___M»__
BUJCN BA»au RtoovauBUco. BO1XH BARKOS lODDVBUBLE CO.
Gabon 12% Zaire 7%
|a
S,bi*
|a
\V
\jV ^ -
UtlU»«nU>4I«HUo«l
in rso r»s.o.
MTU
8:ii0.14
0.11 0.2*O.M
0.15
BUJQN BARRELS KECOVtRABCC 00,
|aeS3bi2
|a
N
iV\xj
^-
-T5T5I4MH WbtfXM >
r» rso ras.o.
*«v« .»> M
t.U 0.1>o.u00»
,
BOXEN BARRELS R&OOVDUBLC CO.
GAS
Angola 58% Congo 24%1 MarO*.«. MM
1 si,bI s
|a
\\
\
\
\V ^^
CSI»«TU UMH 1.34 kMign I.M MxM I.It rM O.Mrn O.M r» i.2ft r» I.M roa 2.32S.O. O.S4
T-
\\\\
\ ^. «^
MM »te«UM
rr riT21
s.i
OBB
UtllMfn)4f>
to
1.
UOM
o.u0.410.240.40O.U O.M
0.22
TTOLUCH CUBE mT RBCDVnUBLC GAS nOLLEN CUBE FEET RBOOVDUBLE GAS
Gabon 12% Zaire 7%
|a BSjbi*
I 3
\\\\
N ^
u>«U>4 UM
fT!rsa rrs.c
(ttiutrn
.
"OM
0 M 0 J«
0 » 0 M 0 34
0 II
UttLLEN CUBE nZT RCXVDUBUC GAS
|a
S,bi s|a
& u
N
\^
k^
>S>^.
UPMtto«i U»M- m rn rso r»s.o.
IT IMS rdo.H .ISO.M0.07 O.IIo.u0.10o.u0.0*
TMLUDN CUBE TTCt RXO3VDUBLX GAS
Figure 25. Cumulative probability distribution of undiscovered recoverable oil and gas in the four countries (Angola, Congo, Gabon, and Zaire) sharing the Congo basin.
61

Blo
ck '
6*
wild
cats
bot
tom
ed i
n 'p
resa
lf
or b
asem
ent
exc
ep
t C
egon
ha-1
bot
tom
ed i
n sa
lt, t
est
ed
150
BO
D.
Dep
ths
7000'
to
14,0
00'.
MA
SS
IVE
SA
LT
OF
AP
T1A
N S
EA
11
Blo
ck '
0*
wild
cats
bot
tom
ed a
t 1
1,0
00
' to
14,0
00'
In L
ower
Cre
tace
ous
volc
an
ics
or b
asem
ent,
show
s.
12
A>~
~ "
£ 0 «
«M
ULE
NV
OS
C
EN
TR
O;1.
';.
ftj^
iENv£
*\ ^
S>-
%
l^Q
UE
N'fe
uE
LA
N
^\^
\£
''X
W'.
0-Q
UE
NG
UE
LA
S
., .
0
J0\°
c C
UA
NZ
AG
AL
IND
A
BA
CA
X1
-1JC
\ 0
1 0
MA
BO
QU
K-1
Fig
ure
26.
Cua
nza
baB
ln I
ndex
nap
(m
odif
ied
from
McG
rew
, 19
8*0

deeper post-rift erosion. Further south in the onshore portion of the Cuanza basin, the pre-salt section is relatively thin and the only indication of the north-trending rifting are low-relief ridges and the distribution of the meager pre-Aptian units (figs. 27 and 28).
The active rifting of the continental crust of the African west coast abated with the final rupturing of the continental crust in early Aptian and erosion set in (forming an extensive unconformity). Sagging followed with the deposition of interior continental beds grading upwards to evaporites as marine waters encroached into the area. The Cuanza onshore area appears to have been higher during early Cretaceous time and more deeply eroded during the early Aptian unconformity than the basins to the north or to the offshore portion of the Cuanza basin. Onshore the interior sag sediments, including the evaporite, average not over 4,000 ft thick and are thinning westward toward the ridge which appears to approximately coincide with the coast line (fig. 27). Further offshore, the Aptian sag was presumably deeper. The Tertiary marginal sag, so evident in the other marginal rift basins, is not present over most of the onshore basin but is just evident at the shoreline (fig. 27) and is presumed to deepen appreciably offshore.
Offshore, the basin is limited to the south by the Walvis Ridge. This ridge, formed by a combination of transform faulting and volcanic action, apparently was rising during early Cretaceous (Siesser, 1975). The ridge apparently remained high until late Cretaceous or early Tertiary restricting the sedimentary environment of the northern basin from the open sea environment to the south (van Andel et al., 1977).
Structural Traps - Pre-salt. As the rift structures becomes less prominent southward from the Congo basin into the Cuanza basin, the presence of rift-associated traps also becomes less. In the Congo basin, rift- associated traps are assumed to make up to 5 percent of the play area. In the Cuanza basin, these traps are estimated to make up only half that, or 2.5 percent. The area of play in the Cuanza basin is limited to the outer continental shelf and slope, an area of some four million acres. On this basis, the rift-associated trap area is 100,000 acres. An estimated 20,000 acres were tested leaving some 80,000 acres of untested trap.
Post-salt. The maturely explored onshore area appears to have salt-dome traps making up about 15 percent of the trap area. The onshore play appears to diminish seaward as the salt thins, being thin or absent at the shoreline (fig. 27). However, the existence of salt in at least one offshore well and the very large Angola Diapir Field in the South Atlantic beyond the continental slope (Von Herzen et al., 1972) indicates that salt domes must occur to some extent on the outer continental shelf and slope (fig. 29). The absent or thin salt section at the shoreline and the lack of post-salt discoveries in the offshore drilling suggest that salt domes, though possibly present, are for one reason or another not as effective in the offshore shelf and slope area; I estimate that the percentage of trap in the play area is only about a third that of the onshore area, or 5 percent.
The salt dome play extends over most of the basin, but the onshore portion has been maturely explored, leaving the offshore shelf and slope of some 9 million acres (MMA) for further exploration. On this basis, the offshore traps amount to some 450,000 acres of untested trap. Some 15 offshore wells have tested an estimated 50,000 acres leaving 400,000 acres of untested trap.
63

Fig
ure
2?.
Dia
gram
mat
ic
cro
ss se
cti
on,
onsh
ore
Gua
nza
"bas
in
(fro
m B
rogi
non
and
Ver
rier
, 19
66).
L
oca
tio
n of
lin
e fi
gure
26.

51
PRE-APTIAN
PALEOGEOLOGY
Control point
UPPER CUVO
LOWER COVO
IGNEOUS ROCKS
PRECW» 2RIAN. BASEMENT COMPLEX
I ________________
AFTIAN
Fint end COOTM sandstone
COOTM Knd.lu-i end conglomtrott
DoJerltt.totott, phonofilt
GrMlst, mfco-cfr.?, quorbltt
Grenltt I
Figure 28. Pre-Aptian paleogeologic map, Cuanza basin (from Broginon and Verrier, 1966).
65
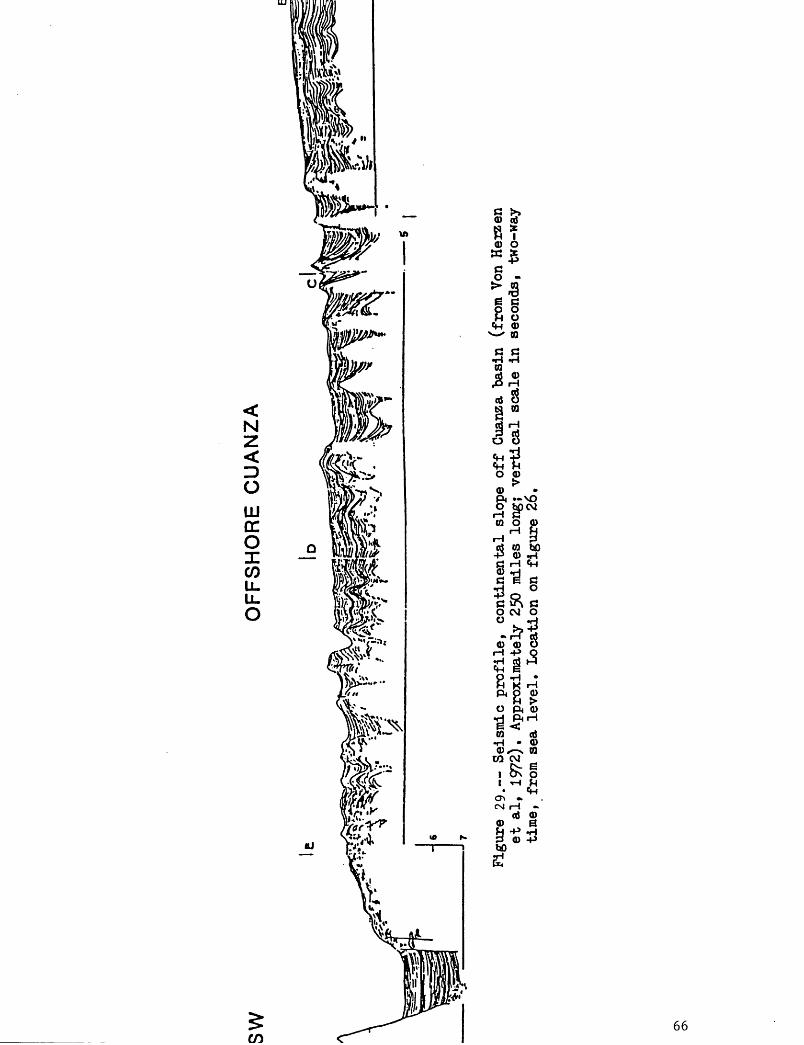
swO
FF
SH
OR
E
CU
AN
ZA J
^
\:
\ A
*
" '
T
Fig
ure
29.-
- S
eism
ic p
rofi
le,
con
tin
enta
l sl
ope
off
Gua
nza
bas
in
(fro
m Y
on H
erze
n et
al,
19
72).
A
ppro
xim
atel
y 25
0 m
iles
lo
ng;
vert
ical
scal
e in
se
cond
s,
two-
way
ti
me,
fr
om s
ea le
vel
. L
ocat
ion
on f
igu
re 2
6.

Stratigraphy
General. The stratigraphy, like that of the other marginal basins, can be divided into groups, largely on a tectonic basis, i.e. intracratonic, interior rift, interior sag, and marginal sag sequences. Only the upper part of the sedimentary section, i.e. interior sag and marginal sag sediments occur on land and apparently in the immediate offshore (fig. 27).
The offshore intracratonic and interior rift sedimentation can only be surmised. From analogy to the marginal basins to the north, such strata probably extend into the area, possibly underlying the continental slope. However, these rift basin sediments are probably not as well developed or preserved as they are to the north, so the analogy must be somewhat discounted.
Details of the onshore interior and marginal sag sediments are shown in figure 27. The pre-salt interior sag sediments, the Cavo Formation, appears to be a thin veneer overlying basement with a profound conformity (fig. 27). The overlying Lower Cretaceous section is continental on the east (Dondo Formation), evaporitic to lagoonal in the center ("Massive Salt", Bing, and Tuenza Formation), carbonate (Catumbela) on the west, and open marine further west. The distribution of the salt (which affects post-salt traps) is variable and discontinuous. These formations were probably laid down in the interior sag basin which was gradually encroached upon by marine waters. The onshore Upper Cretaceous and Faleogene sediments, the Cabo Ledo, Itombe, N'golome, Teba, Rio Dande, Gratidao, and Cunga Formations, are largely shale and sandstone becoming shaley basinwards. The Miocene and younger beds are shale and sandstone, seem to thicken offshore, and were probably laid down in the marginal sag period as is supported by their correlation with marginal sag sediments of the Congo basin.
Reservoirs. Because the pre-salt intracratonic and interior rift reservoirs have apparently not been observed, for assessment purposes, I assume a cumulative thickness of 100 ft, which is about the average of the equivalent reservoir thickness in the analogous Gabon and Congo basins.
Reservoirs consist of fractured carbonates and shales, volcanics, reefs, and deltaic sandstones in the post-salt sediments. Their effective thickness in the onshore Cuanza basin reservoirs ranges from 16 to 150 ft, perhaps averaging 70 ft for future fields of the play. The principal reservoir is the Binga Formation, which is highly fractured oolitic sandy limestone and fine crystalline limestone. The matrix porosity ranges from 4 to 12 percent and the fracture porosity is an unknown higher amount. A basin average of 15 percent porosity for all reservoirs has been estimated.
Seals. The seals observed to date are shales, which make up a good part of the post-salt and anhydrite beds that overlie the major part of the production (i.e. the Binga Formation). The importance of the anhydrite seals is attested to by the fact that the Binga reservoirs are potentially productive only within the areal limits of the anhydrite (Brognon and Verrier, 1966). Brognon and Verrier (1966) believe that salt piercement "...caused numerous salt structures...to reach a final stage of evolution approaching complete destruction". The fact that the traps are only 6.6 percent filled with petroleum may be attributed mainly to leakage.
Source Section. Onshore petroleum occurrence is known in almost all the formations from the volcanics below the interior sag sediments to Miocene
67

sandstones. Source beds are mentioned in regard to almost every sedimentary formation. Source rocks in the interior sag sequence are dark bituminous shales, argillaceous dolomites, and fine crystalline limestones interbedded with the evaporites in the onshore portion of the Cuanza basin. In the overlying marginal sag sediments, dark shales and marls, containing oil-filled foraminifera, occur in a sequence that is deemed to be euxinic (Brognon and Verrier, 1966).
All these source rock indications are found onshore. Offshore the very rich interior rift Neocomian graben-fill lacustrine shales, seen in the offshore shelves of the basins to the north, are not reported, but may occur under the continental slope, seaward of a shoreline ridge.
Petroleum Generation and Migration
Richness of Source. No data as to the specific percentage of organic matter in the sediments or any other geochemical information are available. It would appear, however, that the onshore dark bituminous shales and carbonates in a euxinic, isolated sub-basin would have a relatively rich organic content. The fact that the traps appear to be only 6.6 percent filled with petroleum probably does not indicate inadequate source but rather leakage. The quality of the source rock of the intracratonic sag and interior rift sequences, if they exist, is not known, but by analogy to the other marginal basins the interior rift shales would be rich.
Depth and Volume of Source Rock. Assuming a constant rate of subsidence and thermal gradient (assumed to be 1.4° F/100 ft) through the Neogene, the top of the thermally mature source rock appears to be around 7,000 ft (2,000 m). This places a large part of the interior sag (i.e. Aptian-Albian) sediments of the onshore basin in the oil window (fig. 27). Offshore, most of the late Cretaceous to Tertiary sediments would also be within the oil window. The volume of mature, or over mature, source rock is estimated to be some 14,000 cu mi.
Oil Versus Gas. Only gas and condensate are indicated as minor discoveries, in the pre-salt strata. The pre-salt in the adjacent Congo basin, however, are estimated to generate 75 percent oil; on the basis of occurrence, we estimate the oil-gas mix of the pre-salt play of the Cuanza to more gassy or about 30 percent oil.
There is no mention of gas in the petroleum produced from post-salt reservoirs, and it is deemed of small amount. In the adjacent, more productive, Congo basin, oil is estimated to make up 75 percent of the petroleum mix and we judge the mix of the Cuanza post-salt petroleum to be about the same.
Migration Timing Versus Trap Formation. Assuming a relatively constant subsidence rate and thermal gradient through the Tertiary and Cretaceous, it appears that the subsiding onshore portion of the Cuanza basin did not reach sufficient depth (i.e. 8,000 ft or 2,500 m) to begin generation and migration until late Cretaceous or early Tertiary with the maximum migration in the Tertiary. Some of the interior sag (Aptian-Albian) source sediments are yet to subside into the oil window and generation and migration are continuing. The onshore salt movement, which probably began when the overburden reached 3,000 ft in the Tertiary, continues to present so that traps are young, and it would appear that the timing was near optimum.
68

Concerning the offshore, the interior rift, Neocomian lucustrine source rocks, which we postulate may occur in some quantity under the Cuanza continental slope, would by analogy to the Congo basin, reach the period of maximum generation and migration in mid-Tertiary. Adjoining, presumed rift- originated traps, formed in early Cretaceous, might be too early to avoid some reservoir deterioration. At least part of this oil could reach post-salt reservoirs as it apparently did in the Congo basin.
As is the case in the Congo basin, the Cuanza basin may have as many as seven separate plays, but insufficient data limits consideration to two, the post- and pre-salt plays. The post-salt play involves late Cretaceous and Tertiary sandstones and carbonates overlying or abutting salt diapirs or other flow structure. The onshore exploration being quite mature, the play is mainly limited to the offshore area of some 9 MMA. The pre-salt play, which is only presumed to exist, involves sandstone and carbonate reservoirs associated with the horst and graben structures of early Cretaceous rifting. The play is assumed to occupy part of the continental slope, an area of about 4 MMA.
Conclusions - Basement Assessment
Preliminary play analysis, summarized in tables 11 and 12, indicate that the undiscovered recoverable oil of the Cuanza basin is .032 BBO in the pre- salt reservoirs and .298 BBO in the post-salt, totaling .330 BBO for the basin. Gas amounts to .361 TCF in the pre-salt and .376 in post-salt, making .737 TCF in all.
Because of the small number of discoveries (13), a finding rate curve would not be meaningful.
With the above estimates to consider, the consensus of The World-Energy- Resources-Program geologists settled on a range of estimates for the undiscovered recoverable petroleum resources of which the mode, or most likely, is .2 BBO and .7 TCG. The full range of probabilities is shown in the cumulative probability distribution curves, derived from the consensus for the oil and gas in the Cuanza basin (fig. 30). The curve includes mean values of .22 BBO and .80 TCFG.
Orange Basin Location and Size
The Orange basin lies offshore of the Orange River mouth at the boundary of Namibia (formerly Southwest Africa) and South Africa. Approximately half the basin is in Namibia and half in South Africa. It is here defined by the extent of the interior sag sediments and approximately coincides with the structural trough at the top of the interior rift sequence (figs. 1, 31 and 32). The basin extends southwards from about lat. 20° to 34° S. It has an area of 50,000 sq mi and a sedimentary volume of 145,000 cu mi.
69
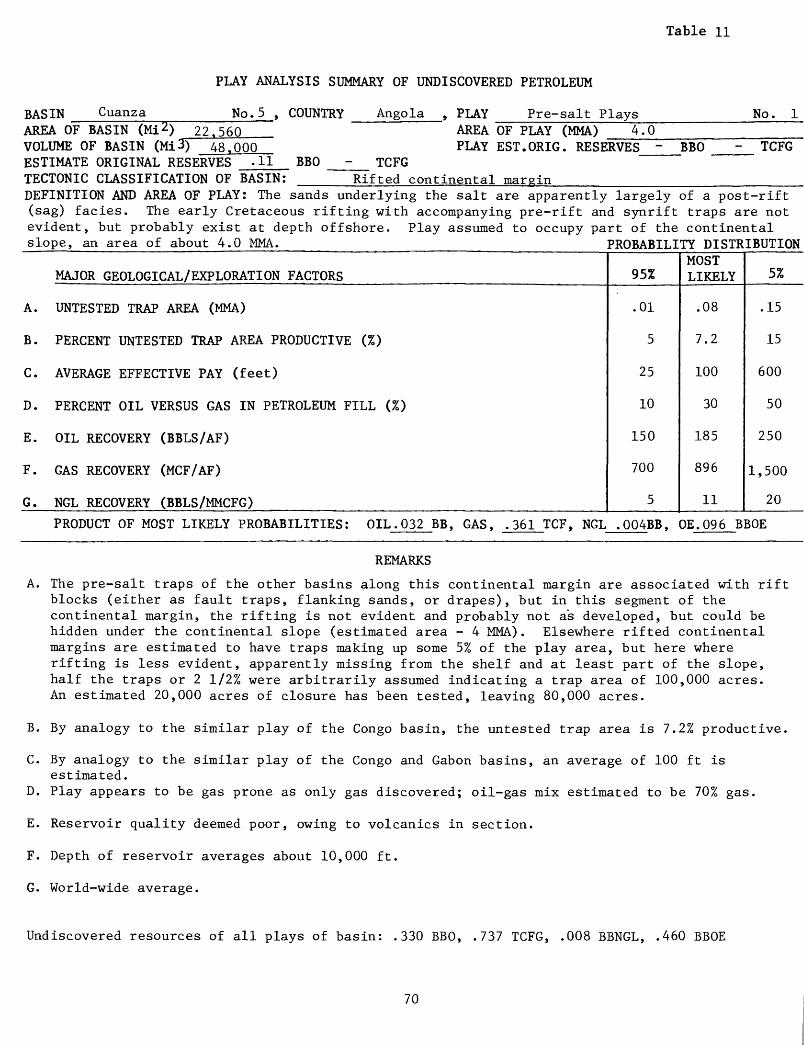
Table 11
PLAY ANALYSIS SUMMARY OF UNDISCOVERED PETROLEUM
CuanzaBASINAREA OF BASINVOLUME OF BASIN (Mi 3) 48.000ESTIMATE ORIGINAL RESERVES .11
No.5 , COUNTRY Angola , PLAY Pre-salt Plays No. 122560 AREA OF PLAY (MMA) 4.0
PLAY EST.ORIG. RESERVES - BBO - TCFGBBO TCFG
Rifted continental marginTECTONIC CLASSIFICATION OF BASIN: __ DEFINITION AND AREA OF PLAY: The sands underlying the salt are apparently largely of a post-rift (sag) facies. The early Cretaceous rifting with accompanying pre-rift and synrift traps are not evident, but probably exist at depth offshore. Play assumed to occupy part of the continental slope, an area of about 4.0 MMA. PROBABILITY DISTRIBUTION
MAJOR GEOLOGICAL/EXPLORATION FACTORS
A. UNTESTED TRAP AREA (MMA)
B. PERCENT UNTESTED TRAP AREA PRODUCTIVE (%)
C. AVERAGE EFFECTIVE PAY (feet)
D. PERCENT OIL VERSUS GAS IN PETROLEUM FILL (%)
E. OIL RECOVERY (BBLS/AF)
F. GAS RECOVERY (MCF/AF)
G. NGL RECOVERY (BBLS/MMCFG)
95%
.01
5
25
10
150
700
5
MOST LIKELY
.08
7.2
100
30
185
896
11
5%
.15
15
600
50
250
1,500
20
PRODUCT OF MOST LIKELY PROBABILITIES: OIL.032 BB, GAS, .361 TCF, NGL .QQ4BB, OE.Q96 BBOE
REMARKS
A. The pre-salt traps of the other basins along this continental margin are associated with rift blocks (either as fault traps, flanking sands, or drapes), but in this segment of the continental margin, the rifting is not evident and probably not as developed, but could be hidden under the continental slope (estimated area - 4 MMA). Elsewhere rifted continental margins are estimated to have traps making up some 5% of the play area, but here where rifting is less evident, apparently missing from the shelf and at least part of the slope, half the traps or 2 1/2% were arbitrarily assumed indicating a trap area of 100,000 acres. An estimated 20,000 acres of closure has been tested, leaving 80,000 acres.
B. By analogy to the similar play of the Congo basin, the untested trap area is 7.2% productive.
C. By analogy to the similar play of the Congo and Gabon basins, an average of 100 ft isestimated.
D. Play appears to be gas prone as only gas discovered; oil-gas mix estimated to be 70% gas.
E. Reservoir quality deemed poor, owing to volcanics in section.
F. Depth of reservoir averages about 10,000 ft.
G. World-wide average.
Undiscovered resources of all plays of basin: .330 BBO, .737 TCFG, .008 BBNGL, .460 BBOE
70
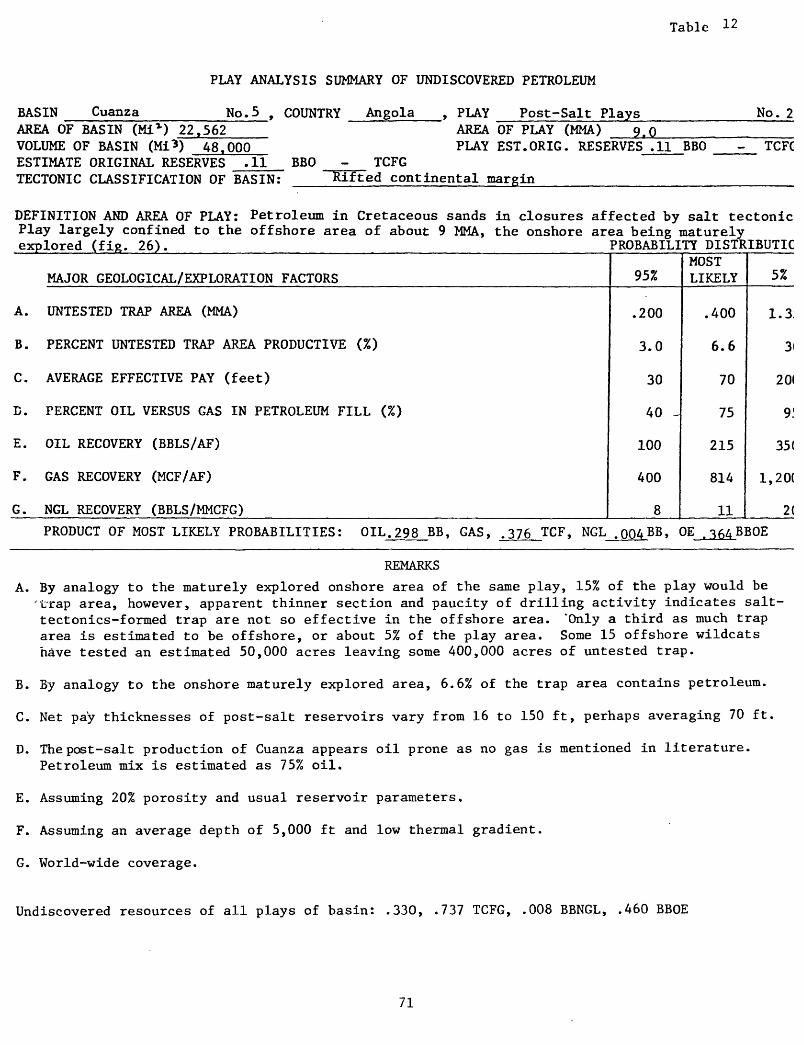
Table
BASIN Cuanza_____ AREA OF BASIN (Mi*) 22,562 VOLUME OF BASIN (Mi"*) 48,000 ESTIMATE ORIGINAL RESERVES .11 BBO TECTONIC CLASSIFICATION OF BASIN:
PLAY ANALYSIS SUMMARY OF UNDISCOVERED PETROLEUM
No.5 , COUNTRY Angola , PLAY Post-Salt Plays No. 2AREA OF PLAY (MMA) 9.QPLAY EST.ORIG. RESERVES . 11 BBO
_ TCFG :ted continental margin_________________
- TCFG
DEFINITION AND AREA OF PLAY: Petroleum in Cretaceous sands in closures affected by salt tectonics.Play largely confined to the offshore area of about 9 MMA, the onshore area being maturelyexplored (fig. 26). PROBABILITY DISTRIBUTION
MAJOR GEOLOGICAL/EXPLORATION FACTORS
A. UNTESTED TRAP AREA (MMA)
B. PERCENT UNTESTED TRAP AREA PRODUCTIVE (%)
C. AVERAGE EFFECTIVE PAY (feet)
D. PERCENT OIL VERSUS GAS IN PETROLEUM FILL (%)
E. OIL RECOVERY (BBLS/AF)
F. GAS RECOVERY (MCF/AF)
G. NGL RECOVERY (BBLS/MMCFG)
95%
.200
3.0
30
40 -
100
400
8
MOST LIKELY
.400
6.6
70
75
215
814
11
5%
1.35
30
200
95
350
1,200
20
PRODUCT OF MOST LIKELY PROBABILITIES: OIL. 298 BB, GAS, .376 TCF, NGL .QQ4BB, OE BBOE
REMARKS
A. By analogy to the maturely explored onshore area of the same play, 15% of the play would be 'trap area, however, apparent thinner section and paucity of drilling activity indicates salt- tectonics-formed trap are not so effective in the offshore area. "Only a third as much trap area is estimated to be offshore, or about 5% of the play area. Some 15 offshore wildcats have tested an estimated 50,000 acres leaving some 400,000 acres of untested trap.
B. By analogy to the onshore maturely explored area, 6.6% of the trap area contains petroleum.
C. Net pay thicknesses of post-salt reservoirs vary from 16 to 150 ft, perhaps averaging 70 ft.
D. The post-salt production of Cuanza appears oil prone as no gas is mentioned in literature. Petroleum mix is estimated as 75% oil.
E. Assuming 20% porosity and usual reservoir parameters.
F. Assuming an average depth of 5,000 ft and low thermal gradient.
G. World-wide coverage.
Undiscovered resources of all plays of basin: .330, .737 TCFG, .008 BBNGL, .460 BBOE
71
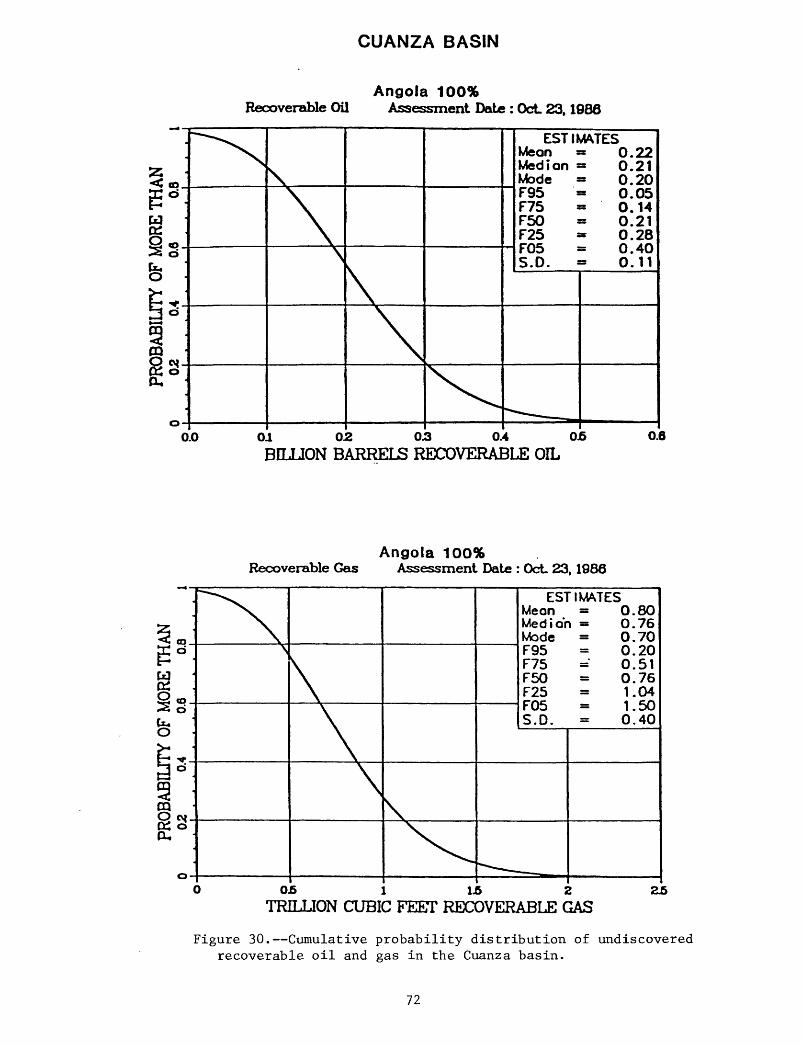
Recoverable Oil
CUANZA BASIN
Angola 100% Assessment Date : Oct 23,1086
:
o
,
o
o- 0
~~^
.0 0.
\\\
1 0-
\\Z 0.
X3 0.
ESTIMATES Mean » 0.22 Median = 0.21 Mode - 0.20 F95 » 0.05 F75 = 0.14 F50 = 0.21 F25 - 0.28F05 = 0.40 S.D. - 0.11
^-
4 OJ ^M^>««M^ __
5 O.I
BILLION BARRELS RECOVERABLE OIL
Recoverable GasAngola 100%
Assessment Date : Oct 23,1986
0£ 1 1.5 2 2£TRILLION CUBIC FEE7T RECOVERABLE GAS
Figure 30. Cumulative probability distribution of undiscovered recoverable oil and gas in the Cuanza basin.
72

0»Tt MOV rMO
COMTOU* tnrt»vat. «X»- CMTUM »V»M M(«M If* ItVCl
Figure 31. Depth map of the top of the rift sequence. Horizon R, Orange Basin (modified from Gerrard and Smith, 1982).
73

Figure 32. Diagrammatic geologic se
ctio
n across the
Orange basin, ©lettered regionally mappable seismic
reflectors.
Location shown
on figure 31;
seismic
markers on
figure 33 (modified
from Gerrard an
d Sm
ith,
19
82).
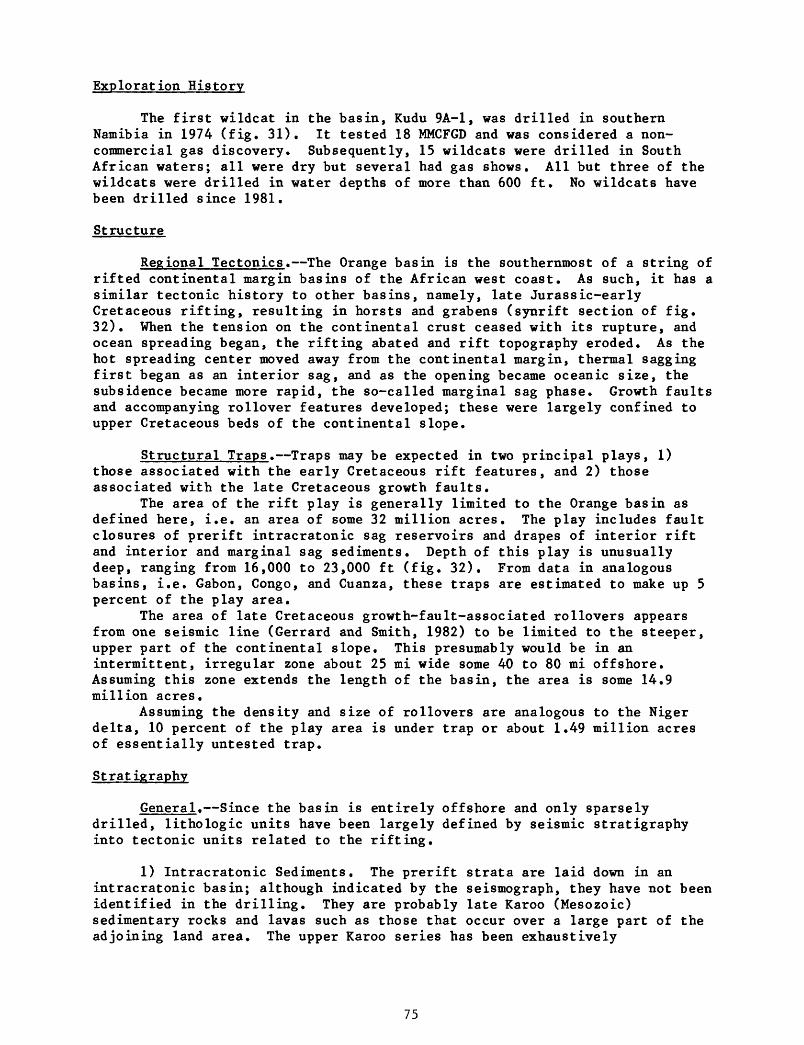
Exploration History
The first wildcat in the basin, Kudu 9A-1, was drilled in southern Namibia in 1974 (fig. 31). It tested 18 MMCFGD and was considered a non commercial gas discovery. Subsequently, 15 wildcats were drilled in South African waters; all were dry but several had gas shows. All but three of the wildcats were drilled in water depths of more than 600 ft. No wildcats have been drilled since 1981.
Structure
Regional Tectonics. The Orange basin is the southernmost of a string of rifted continental margin basins of the African west coast. As such, it has a similar tectonic history to other basins, namely, late Jurassic-early Cretaceous rifting, resulting in horsts and grabens (synrift section of fig. 32). When the tension on the continental crust ceased with its rupture, and ocean spreading began, the rifting abated and rift topography eroded. As the hot spreading center moved away from the continental margin, thermal sagging first began as an interior sag, and as the opening became oceanic size, the subsidence became more rapid, the so-called marginal sag phase. Growth faults and accompanying rollover features developed; these were largely confined to upper Cretaceous beds of the continental slope.
Structural Traps. Traps may be expected in two principal plays, 1) those associated with the early Cretaceous rift features, and 2) those associated with the late Cretaceous growth faults.
The area of the rift play is generally limited to the Orange basin as defined here, i.e. an area of some 32 million acres. The play includes fault closures of prerift intracratonic sag reservoirs and drapes of interior rift and interior and marginal sag sediments. Depth of this play is unusually deep, ranging from 16,000 to 23,000 ft (fig. 32). From data in analogous basins, i.e. Gabon, Congo, and Cuanza, these traps are estimated to make up 5 percent of the play area.
The area of late Cretaceous growth-fault-associated rollovers appears from one seismic line (Gerrard and Smith, 1982) to be limited to the steeper, upper part of the continental slope. This presumably would be in an intermittent, irregular zone about 25 mi wide some 40 to 80 mi offshore. Assuming this zone extends the length of the basin, the area is some 14.9 million acres.
Assuming the density and size of rollovers are analogous to the Niger delta, 10 percent of the play area is under trap or about 1.49 million acres of essentially untested trap.
Stratigraphy
General. Since the basin is entirely offshore and only sparsely drilled, lithologic units have been largely defined by seismic stratigraphy into tectonic units related to the rifting.
1) Intracratonic Sediments. The prerift strata are laid down in an intracratonic basin; although indicated by the seismograph, they have not been identified in the drilling. They are probably late Karoo (Mesozoic) sedimentary rocks and lavas such as those that occur over a large part of the adjoining land area. The upper Karoo series has been exhaustively
75
investigated in southern Africa and are a predominantly continental series of sandstone and shales interbedded and topped by lavas and tuffs.
2) Interior Rift Sediments. The sediments deposited in the grabens during the period of rifting would be derived mainly from the intervening horsts. In analogous basins to the north (i.e. Cuanza, Congo, Gabon), these graben deposits are sandstones, shales and carbonates; some of the sandstones and carbonates are of good reservoir quality; the shales are of rich organic content preserved in restricted-circulation lakes. The analogous, synrift sediments of the Orange basin are of unknown thickness and may be less favorable than their northern analogues. Only one well (A-C1) penetrated this sequence (near the up-dip pinchout) and found it to consist of 2,263 ft of basic and acid alkaline volcanics and pyroclastics. It would be logical, however, to suppose that by analogy, at least some sandstones and shales are present in this sequence and that the shales may be organically rich in the indicated graben areas.
3) Interior Sag Sediments. At the end of the rifting of the continental margin when lithospheric extension began to be taken up in oceanic spreading, there was a period of continental erosion of the rift features followed by subsidence resulting in a longitudinal shallow, interior basin or sag in which non-marine to marine Aptian sediments were deposited. By analogy to the Cuanza, Congo, and Gabon basins, this sequence relates to the pre-Aptian to early Aptian Formations, the lower elastics of which vary from red continental to dolomitic sandstones and shales followed by evaporites which represent the first incursion of the sea; in these analogous basins, the interior sag sequence has good reservoirs. The Orange basin sequence has an apparent thickness of up to 2,500 ft. It has been drilled in several wildcats as far north as Kudu 9A opposite the Orange River mouth where the upper part of the sequence was penetrated. It consists of mainly marine shales over gas-bearing sandstone which elastics are interbedded with and partly overlie at least 425 ft of basaltic lavas. To the south, where penetrated, this interval is mainly continental red beds with minor amounts of lava. In DSDP well 361, south of the Orange basin (fig. 31), the upper part of this interval is represented by organically rich sapropelic shales interbedded with siltstones and sandstones (turbidites). Significantly, no evaporites were encountered in this region south of the Walvis ridge. This interior sag sequence would be one of the principal drilling objectives of the basin.
4) Marginal Sag Sediments. This sequence consists of a wedge mainly of deltaic to open-marine grey shales and sandstones, ranging in age from late Aptian to Maastrichtian and Paleocene, building out over the continental shelf. The rather steep outer edge of the sedimentary wedge is the locus for growth faults (fig. 32). The thickness of the sequence is as much as 16,000 ft. In the DSDP well 361, the rocks have significantly less organic matter than the underlying interior sag sediments. They are intruded sporadically by Tertiary intrusives. The outer slope of this wedge where the growth faults and associated rollover anticlines occur would be the second principal focus of drilling.
5) Tertiary Sequence. The Tertiary sequence is relatively thin and insignificant as relating to petroleum resources, being deposited generally seaward of the upper Cretaceous (fig. 32). Oligocene and later rocks are
76
unusually rich in organic matter, generated by upwelling along the continental slope.
Reservoirs. The three principal reservoir zones appear to be 1) the interior rift (rift valley sequence) (fig. 33) sandstones postulated by analogy to the northern rifted continental margin basins to be deposited either as drapes over, or as wedges on the flanks of rift-generated grabens, 2) interior sag sandstones (early drift sequence), and 3) marginal sag (drift sequence) late Cretaceous sandstones involved in growth faults and associated roll-over anticlines (fig. 33).
The interior rift reservoirs have not been mapped or drilled. For assessment purposes, these postulated sands are assumed to be analogous, but less developed, than sands of the northern basins, 140 ft in the Congo basin and 75 ft in the Gabon. The presence of thick volcanics, however, would discount this analogy by at least half so that the average reservoir thickness would appear to be reduced to around 40 ft, and the porosity would also be reduced, perhaps to an average of 15 percent.
The interior sag sandstones have been penetrated by one well, Kudu 9A, where they were found to be gas bearing, implying at least some reservoir capability. No thickness or reservoir characteristics have been reported. The reservoir's close association with volcanics would reduce its potential as compared to analogous interior sag reservoirs in the rifted continental margin basins to the north (75 ft in the Gabon, not distinguishable in the Congo, and negligible in the Cuanza). A thickness of 30 ft and porosities around 15 percent are estimated.
The marginal sag upper Cretaceous sandstones involved in growth faults and associated roll-overs, are comparable to similar sandstones of the analogous basins to the north with thickness of about 70 ft and average porosities of about 25 percent.
Seals. The Orange basin lacks the salt and evaporites which seal the interior rift and sag accumulations of the rifted continental margin basins north of the Walvis Ridge, and any analogy to those plays must be discounted accordingly.
Source Section. From projection of the stratigraphy of hole DSDP 361 and from analogies with the rifted continental margin basins to the north, three principal organically rich zones may be interpreted: 1) latest Jurassic to Valanginian interior rift shales, 2) Valanginian to Aptian interior sag carbonaceous shales, and 3) organically rich post Oligocene shales (fig. 33).
Petroleum Generation and Migration
Richness of source. By analogy to rifted continental margin basins to the north, the interior rift sequence latest Jurassic-early Cretaceous, should have organically rich lacustrine beds. Where penetrated in one test, however, this interval was predominantly volcanics indicating reduced source capability.
Aptian and Albian shales were found to be anoxic and very carbonaceous (5 percent TOC) in the DSDP 361 hole to the south of the Orange basin (fig. 31). At least some of these rich shales are presumed to extend into the Orange basin. This carbonaceous matter is type II and type III; the type III, i.e. gas prone type, predominantly. Tissot and others, 1980, indicate that the lower part of these shales to have the very good potential of 30,000 to
77

00C
u>I I tn rt
^0) rt H-
00
t)3*
03
oo ft)crw H-3
o
o ro
03 M CL
§CL
CO3
ooN)
V" 'I ""|""T""IS S 2 =
150,000 BOB per acre foot. Results from the DSDP 361 hole indicate that the kerogen-protecting anoxic conditions ended by Cenomanian so that only poor source rock can be expected in the late Cretaceous, approximately the period of the marginal sag.
The post-Oligocene sediments are organically rich. Present day sediments have a high organic carbon concentration ranging from 5 to 24 percent particularly north of the Orange River mouth (Demaison and Moore, 1980). This richness is ascribed to the effects of upwelling by the Benguela Current.
Depth and Volume of Source. No thermal gradient or thermal maturation indicators are available. Assuming, however, an average of 1.5° F/100 ft thermal gradient, analogous to the other rifted margin basins to the north, and using a subsidence rate of 170 ft per million years interpreted from figure 32, the top of the thermally mature sediments is at a depth of about 7,000 ft (2.1 km). This indicates a volume of 100,000 cu mi of mature and over-mature rocks. The top of the over-mature strata appears to be at a depth of about 17,000 ft (4.52 km), indicating that any rich early Cretaceous organic shales are now generating only gas.
The organically rich Oligocene to recent sediments, derived from upwelling of the Benguela Current, are too shallow for petroleum generation.
Oil Versus Gas. All indications are that the Orange basin is gas prone. The predominance of terrestrial kerogen, as measured at DSDP 361 indicates gas. The present depth of the organically rich section i.e., lower Cretaceous, indicates it is over-mature and generating only gas, and all the shows to date indicate only gas. The gas tested at Kudu 9A is very dry, containing 98 percent methane. Gas pressure in excess of 8,000 psi was found at a depth of 14,600 ft (versus 6,330 psi hydrostatic pressure) indicating over-pressuring. Over-pressure inhibits the primary migration of oil versus gas, another factor indicating the gas-proneness of the basin.
Oil, however, cannot be ruled out because some terrestrial (type III) kerogen does generate oil, marine type II kerogen does occur in the Aptian- Albian part of the section, and over-pressure may not exist over all of the basin. Gas is estimated to make up to 80 percent of the petroleum mix.
Migration Timing Versus Trap Formation. Assuming the thermal gradient and the subsidence rate were about constant through the Tertiary and Mesozoic, generation and migration would have begun in the early Cretaceous, i.e. approximately during the interior sag sedimentation. However, the flood of petroleum (gas) probably was in about mid Cretaceous when the interior sag sediments entered the oil window.
Trap formation in the interior rift phase, i.e. tilted horst blocks and attendant flank sandstones and drape closures, was early, having formed before the onset of most of the petroleum generation and migration, and therefore the associated reservoirs were subject to some diagenetic deterioration. Except for the flanks of the basin, these traps are now in the over-mature zone and could only contain gas.
The growth fault and accompanying rollover features were formed in the Late Cretaceous and should have been able to accept oil and gas migrating from the early Cretaceous source rock. Provided that primary migration was not blocked by over-pressured shale, these traps could contain some oil.
79

There appear to be two principal plays: 1) sandstones involved in early Cretaceous rifting, either as synrift wedges, or synrift or postrift drape closure which occur throughout the basin. 2) Late Cretaceous deltaic sandstones involved in growth faults and associated rollover anticlines that which are concentrated along the upper continental slope, an area of some 14.9 million acres.
Conclusions - Basin Assessment
Preliminary play analysis as summarized in tables 13 and 14, indicates that undiscovered recoverable oil of the Orange basin amounts to .110 BBO and 5 TCFG in the early Cretaceous fault and drape traps and .141 BBO and 2.3 TCFG in the Late Cretaceous deltaic sandstones involved in growth-fault and rollover traps. In all, the resources amount to .250 BBO and 7.4 TCFG.
With the above estimates to consider, the consensus of The World- Energy-Resources-Program geologists settled on a range of estimates for the undiscovered recoverable petroleum of which the mode, or most-likely, is .2 BBO and .7 TCF. The full range of probabilities are shown in the probability distribution curves derived from the consensus for the oil and gas in the Orange basin (fig. 34). These curves include the mean values of .24 BBO and 8.26 TCFG.
Agulhas Basin Location and Size
The Agulhas basin is on the south tip of Africa and lies entirely within South Africa. It is largely offshore, lying northeast of the Agulhas Arch, a southeast-plunging nose, extending some 80 miles to sea, and lying northwest of the northeast-trending Agulhas Marginal Fracture (figs. 1, 35, and 36). It has an area of some 37,000 sq mi and an approximate volume of some 50,000 cu mi.
Exploration History
Since 1969, some 87 offshore wells have been drilled. Of these, 15 were drilled by the oil industry and the rest by the South African government, indicating the marginal prospectiveness of the area. Of the 87 wells, 10 have yielded "potentially commercial" quantities of gas representing a possible success rate of about 11 percent. One small gas field, Mossel Bay, appears to be considered feasible for production; it includes two, and possibly three, separate structures (fig. 37). The reserves of the basin on the Mossel Bay field (proven plus estimated additional reserves) is about one TCF of gas plus about .04 BBO.
Structure
Regional Tectonics. The Agulhas basin is a faulted continental margin basin bounded and transected by a number of southeast-trending faults (figs. 35 and 36). The controlling tectonic element appears to be the northeast- trending Agulhas Fracture Zone which bounds the basin to the south and is the site of a major regional dextral wrench fault attendant to the opening of the South Atlantic in the early Cretaceous. The southeast-trending faults appear
80
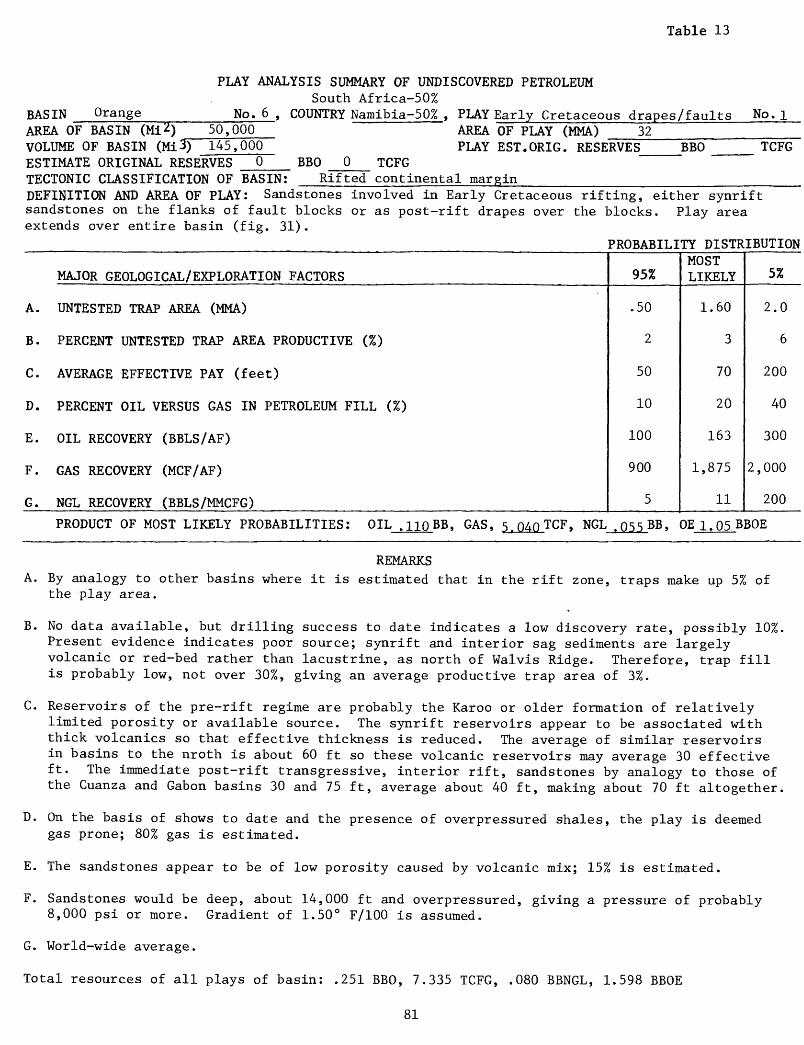
Table 13
PLAY ANALYSIS SUMMARY OF UNDISCOVERED PETROLEUMSouth Africa-50%
BASIN Orange No. 6 , COUNTRY Namibia-50% , PLAY Early Cretaceous drapes/faults No. 1 AREA OF BASIN (Ml 2) 50,000 ~ AREA OF PLAY (MMA) __32 ____________VOLUME OF BASIN (Mi3) 145,000 ESTIMATE ORIGINAL RESERVES 0
PLAY EST.ORIG. RESERVES BBO TCFGBBO 0 TCFG
Rifted continental marginTECTONIC CLASSIFICATION OF BASIN: DEFINITION AND AREA OF PLAY: Sandstones involved in Early Cretaceous rifting, either synrift sandstones on the flanks of fault blocks or as post-rift drapes over the blocks. Play area extends over entire basin (fig. 31).
PROBABILITY DISTRIBUTION
MAJOR GEOLOGICAL/EXPLORATION FACTORS
A. UNTESTED TRAP AREA (MMA)
B. PERCENT UNTESTED TRAP AREA PRODUCTIVE (%)
C. AVERAGE EFFECTIVE PAY (feet)
D. PERCENT OIL VERSUS GAS IN PETROLEUM FILL (%)
E. OIL RECOVERY (BBLS/AF)
F. GAS RECOVERY (MCF/AF)
G. NGL RECOVERY (BBLS/MMCFG)
95%
.50
2
50
10
100
900
5
MOST LIKELY
1.60
3
70
20
163
1,875
11
5%
2.0
6
200
40
300
2,000
200
PRODUCT OF MOST LIKELY PROBABILITIES: OIL .HQBB, GAS, 5.Q4QTCF, NGL .Q55BB, OE 1.Q5BBOE
REMARKSA. By analogy to other basins where it is estimated that in the rift zone, traps make up 5% of
the play area.
B. No data available, but drilling success to date indicates a low discovery rate, possibly 10%. Present evidence indicates poor source; synrift and interior sag sediments are largely volcanic or red-bed rather than lacustrine, as north of Walvis Ridge. Therefore, trap fill is probably low, not over 30%, giving an average productive trap area of 3%.
C. Reservoirs of the pre-rift regime are probably the Karoo or older formation of relatively limited porosity or available source. The synrift reservoirs appear to be associated with thick volcanics so that effective thickness is reduced. The average of similar reservoirs in basins to the nroth is about 60 ft so these volcanic reservoirs may average 30 effective ft. The immediate post-rift transgressive, interior rift, sandstones by analogy to those of the Cuanza and Gabon basins 30 and 75 ft, average about 40 ft, making about 70 ft altogether.
D. On the basis of shows to date and the presence of overpressured shales, the play is deemed gas prone; 80% gas is estimated.
E. The sandstones appear to be of low porosity caused by volcanic mix; 15% is estimated.
F. Sandstones would be deep, about 14,000 ft and overpressured, giving a pressure of probably 8,000 psi or more. Gradient of 1.50° F/100 is assumed.
G. World-wide average.
Total resources of all plays of basin: .251 BBO, 7.335 TCFG, .080 BBNGL, 1.598 BBOE
81

Table 14
BASIN Orange___
AREA OF BASIN (Mi 2) 5U,UOO
PLAY ANALYSIS SUMMARY OF UNDISCOVERED PETROLEUM
No. 6, COUNTRY Namibia t PLAY Cretaceous deltaic sandstone No. 2___
VOLUME OF BASIN (Mi3) 145,000 ESTIMATE ORIGINAL RESERVES 0
PLAY EST.ORIG. RESERVES BBO 0 TCFGBBO 0 TCFG
Rifted continental marginTECTONIC CLASSIFICATION OF BASIN:DEFINITION AND AREA OF PLAY:Late Cretaceous deltaic sandstones involved in growth faults and associated rollovers. Play areaappears to be in a zone about 25 mi wide some 40 to 80 mi offshore with an area of some14.9 million acres. PROBABILITY DISTRIBUTION
MAJOR GEOLOGICAL/EXPLORATION FACTORS
A. UNTESTED TRAP AREA (MMA)
B. PERCENT UNTESTED TRAP AREA PRODUCTIVE (%)
C. AVERAGE EFFECTIVE PAY (feet)
D. PERCENT OIL VERSUS GAS IN PETROLEUM FILL (%)
E. OIL RECOVERY (BBLS/AF)
F. GAS RECOVERY (MCF/AF)
G. NGL RECOVERY (BBLS/MMCFG)
95%
.40
2.0
50
10
100
800
5
MOST LIKELY
1.49
2.5
70
20
270
1,100
11
5%
2.00
50
200
50
350
1,600
20
PRODUCT OF MOST LIKELY PROBABILITIES: OIL -141BB, GAS, 2.295TCF, NGL .025BB, OE .548BBOE
REMARKS
By analogy to the Niger basin, the growth faults and associated rollover traps make up 10% of the play area.
To the north, DSDP tests indicate organically rich Early and Late Cretaceous anoxic shales, but near the Orange basin (i.e. south of the Walvis Ridge) Late Cretaceous anoxic conditions do not appear to exist and the Early Cretaceous appears to be represented largely by volcanics (at least in the rifted zone). Consequently, the amount of petroleum fill in the traps would be low, 25% estimated and the success rate also would be low for the same reason, 10% estimated, giving a productive trap area of 2.5%.
Reservoirs of the Late Cretaceous appear to be comparable to the post-salt sandstones of basins north of Walvis Ridge, therefore, an average pay of 70 ft with an average porosity of 25% are estimated.
All indications, gas occurrence, kerogen type, depth of reservoirs, and overpressured shale, are that the basin is gas prone; estimated 80% gas.
Little data are available; an average sandstone is assumed.
An average depth of 7,000 ft, and a thermal gradient of 1.5° F/100 ft are assumed.
World-wide average.
Total resources of all plays of basin: 251 BBO, 7.335 TCFG, 080 BBNGL, 1.598 BBOE
82

OrangeRecoverable Oil Assessment Date : Oct 23,1986
0.0
DOCTDCS V2VB6
ESTIMATESMeanMedianModeF95F75F50F25F05S.D.
230.220.200.010.130.220.330.500.15
01 02 03 0.4 0£ OJ3 BILLION BARRELS RECOVERABLE OIL
OrangeRecoverable Gas Assessment Date : Oct 23,1986
6 10 16 20TRILLION CUBIC FEET RECOVERABLE GAS
BttCtoS V2VB6
Figure 34. Cumulative probability distribution of undiscovered recoverable oil and gas in the Orange basin.
83

00 -P-
Meso
zoic
<
2-5
km
thic
k
pre
-Me
so
zo
ic
sp
ot
Me
sozo
ic
thic
knesses i
n k
m
Figure 35. Thickness map
of Me
sozo
ic se
dime
nts
showing
tect
onic
el
emen
ts,
Agul
has
basin
(fro
m Di
ngle
, 19
73).

300
Km
.
AG
UL
HA
S
BA
SIN
mar
gin
alfr
actu
reri
dg
e
300
Km
.
(INTE
RIO
R
SAC
;)
Jur.
-Neo
com
lan
200
Figu
re 36. Diagrammatic ge
olog
ic cr
oss-
sect
ion,
Ag
ulha
s basin.
Loca
tion
on fi
gure
35
(f
rom
Dingle,
1973
).
oo

00
ON
CA
PE
A
GU
LH
AS
I J
INF
AN
TA
E
MB
AY
ME
NT
SAS
AR
EA
0
SO
UT
H
AF
RIC
AA
GU
LHA
S B
AN
K D
ET
AIL
OIL
WE
LL
O G
AS
WE
LL
0
DR
Y A
ND
AB
D.
ft
SH
OW
OF
OIL
Fig
ure
37. In
dex m
ap
of
key
well
s,
Agulh
as basi
n
(Petr
acca et
al.
, 1986).

to be genetically related to the Agulhas Fracture Zone wrench fault, either as second order shears or normal faults caused by local extension on one side of the wrench. The southeast-trending faults bound a number of southeast- plunging horsts and grabens or half grabens having the dominant boundary fault on the northern side. The faults have had diminishing activity through the Cretaceous, though some are still active; throws are as much as 20,000 ft. The Agulhas Fracture Zone and attendant ridges reportedly act as dams to the Mesozoic and Cenozoic sediments moving southward from the African continent (figs. 35 and 36).
Structural Traps. The principal structures are the horsts and grabens; traps would be formed by reservoirs either abutting or draping over the horsts. No data are available concerning the size and frequency of such traps, but by analogy to other faulted continental margin basins. Traps would make up some five percent of the play area (which in this case comprises the entire basin of some 23.55 million acres) or 1.18 million acres of trap. Perhaps 40 percent of this trap has been tested leaving some .71 million acres untested.
Stratigraphy
General. The post-Paleozoic section can be divided into four tectonic groups: 1) the Jurassic-Neocomian sediments laid down in an interior rift environment, 2) Valanginian to Albian largely interior sag sediments, 3) late Cretaceous interior or marginal sag, and 4) Tertiary marginal sag sediments (figs. 36 and 38).
Earliest sediments are Jurassic-Neocomian, synrift coarse fluviatile elastics shed from adjoining horsts, locally interbedded with lavas and tuffs and distally with marine claystones and sandstones of probable upper Jurassic age (Infanta Formation). Organically rich shales (Colchester Member) are deposited locally. This synrift unit reaches a thickness of 8,000 ft.
The overlying largely interior sag unit (Sunday River Formation) of Valanginian to Albian age consists of prograding deltaic sandstones and muddy sandstones interfingering distally with prodelta marine shales deposited under somewhat restricted conditions and containing abundant plant remains. The thickness of this unit ranges up to 13,000 ft.
The upper Cretaceous sediments transgressed across the interior sag unit and intervening ridges coalescing into a broad continental shelf or marginal sag consisting of some 6,000 ft of sandstones and shales.
Cenozoic sedimentation forms a thin cover over the offshore shelf reaching a maximum thickness of 3,000 ft on the outer shelf. It consists of marine claystones, sandstones, and some carbonates. These rocks are involved in massive slumping along the shelf edge except where dammed behind the Agulhas Fracture Zone.
Reservoirs. The well-sorted sandstones of the Sunday River Formation appear to be the thickest and have the best characteristics to be potential reservoirs. Details about the reservoirs are not available, but for assessment purposes they are assumed to be of average quality and have a cumulative thickness of approximately 100 ft.
Seals. The late Cretaceous and Tertiary section is predominantly shale and seals are assumed not to be a limiting factor in the accumulation of petroleum.
87

Source Section. The source section appears to be limited to the lower part of the section, i.e. the synrift units, the Colchester Member of the Enon, and Infanta Formations and to some shale in the overlying Sunday River Formation (fig. 38).
Petroleum Generation and Migration
Richness of Source. No detailed information concerning the richness of source rock is available other than the statement (Dingle, 1980) that potential source rocks are confined to the Colchester Member, with less promising horizons in the Sunday River and Infanta Formations. The Colchester Member has a maximum thickness of 500 ft. Although the richness of the source rock is not known, the relatively small volume of only moderately rich source rock that is indicated appears to be a limiting factor to petroleum accumulation.
Depth and Volume of Source. Adequate thermal and subsidence information is not available, but by analogy to the other continental margin basins of the west coast, the top of the mature window would appear to be about 8,000 or 9,000 ft deep, which limits the thermally mature source to synrift, Jurassic to Neocomian, rocks (i.e. the Colchester and Infanta units) and in the deeper grabens, the Sunday River shales.
Oil Versus Gas. The basin is obviously gas prone as all the appreciable shows are gas. However, there were small oil shows and the respectable condensate quantity, 40 barrels per million cu ft of gas, would indicate that the gas formation was probably in the oil window, so that some oil may be expected. Gas is estimated to make up 90 percent of the petroleum mix.
Migration Timing Versus Trap Formation. By analogy to adjoining marginal basins, petroleum generation and migration began in late Cretaceous when subsidence had reached 8,000 or 9,000 ft. The active formation of fault traps and attendant drape features began in early Cretaceous and continued in diminishing effectiveness until upper Aptian time. Timing of the migration appears to have been such that traps were already in place allowing some reservoir deterioration between trap formation and petroleum occupation.
From the data at hand, it appears there is one viable play. That is sandstones, mainly of the Sunday River Formation, draping over or abutting early Cretaceous fault blocks (see table 15). A second play might be Sunday River sandstones in growth fault situations, but such a play has not been indicated.
Conclusions - Agulhas Basin Assessment
Analysis of the single play of the basin, summarized in table 15, indicates recoverable petroleum resources of .046 BBO and 2.3 TCFG amounting to .521 BBOE. By volumetric analogy to tectonically similar producing basins, discounted according to play attributes, approximately .25 BBOE was estimated.
With the above estimates to consider, the consensus of The World-Energy- Resources-Program geologists settled on a range of estimates for the undiscovered recoverable petroleum. The mode, or most likely, estimates were
88

cr LU H co D
O LU
O < H
UJ cc
o o CO
CO < cr D
Plio
cen
e
Mio
cen
e
Olig
oce
ne
Eo
cen
e
Pal
eoce
ne
Maastr
ich
tian
Cam
pan
ian
San
ton
ian
Con
iaci
an
Tu
ron
ian
Cen
om
ania
n
Alb
ian
Ap
tian
Bar
rem
ian
Hau
teri
via
n
Val
ang
inia
n
Berr
iasia
n
Po
rtla
nd
ian
Kim
mer
idg
ian
Oxf
ord
ian
Cal
lovi
an
Bat
ho
nia
n
-u.-
-13-
-eo-
- 5-
1
A ftw
I
MA
RG
INA
L
SA
G
Org
an
ic-r
ich
s
ha
les
Sh
allo
w
sh
ale
s,
carb
on
ate
s
Sh
allo
w
san
ds
No
n-m
ari
ne
ela
sti
cs
Hia
tus
PO
ST
RIF
T
INT
ER
IOR
SA
G
SY
NR
IFT
-
INT
ER
IOR
FR
AC
TU
RE
Figure 38. Stratigraphic column,
Agulhas ba
sin.
Abbreviations: E=Enon Fin.,
K=Kirkwood Fm.,
S=Swartkops Mm,
C=Colchester Mm
., an
d I=Infanta Fm.
(mod
ifie
d from Dingle,
1980
).
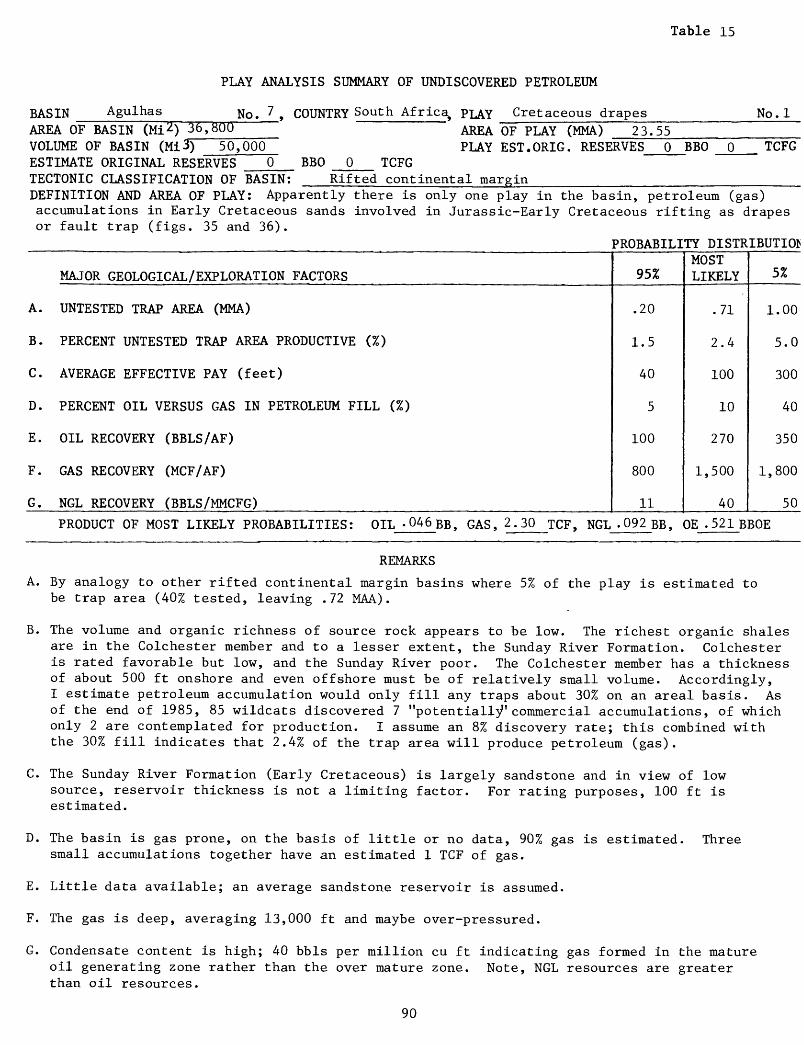
Table 15
BASIN AgulhasAREA OF BASIN (Mi^) 36,800
PLAY ANALYSIS SUMMARY OF UNDISCOVERED PETROLEUM
No. 7 , COUNTRY South Africa> PLAY Cretaceous drapes No.lAREA OF PLAY (MMA) 23.55
VOLUME OF BASIN (Mi3)50,000 PLAY EST.ORIG. RESERVES 0 BBO 0 TCFG0 BBO 0 TCFG
Rifted continental marginESTIMATE ORIGINAL RESERVES _____ TECTONIC CLASSIFICATION OF BASIN: DEFINITION AND AREA OF PLAY: Apparently there is only one play in the basin, petroleum (gas)accumulations in Early Cretaceous sands involved in Jurassic-Early Cretaceous rifting as drapesor fault trap (figs. 35 and 36).
PROBABILITY DISTRIBUTION
MAJOR GEOLOGICAL/ EXPLORATION FACTORS
A. UNTESTED TRAP AREA (MMA)
B. PERCENT UNTESTED TRAP AREA PRODUCTIVE (%)
C. AVERAGE EFFECTIVE PAY (feet)
D. PERCENT OIL VERSUS GAS IN PETROLEUM FILL (%)
E. OIL RECOVERY (BBLS/AF)
F. GAS RECOVERY (MCF/AF)
G. NGL RECOVERY (BBLS/MMCFG)
95%
.20
1.5
40
5
100
800
11
MOST LIKELY
.71
2.4
100
10
270
1,500
40
5%
1.00
5.0
300
40
350
1,800
50
PRODUCT OF MOST LIKELY PROBABILITIES: OIL -Q46BB, GAS, 2.30 TCF, NGL .092 BB, OE .521BBOE
REMARKS
A. By analogy to other rifted continental margin basins where 5% of the play is estimated to be trap area (40% tested, leaving .72 MAA).
B. The volume and organic richness of source rock appears to be low. The richest organic shales are in the Colchester member and to a lesser extent, the Sunday River Formation. Colchester is rated favorable but low, and the Sunday River poor. The Colchester member has a thickness of about 500 ft onshore and even offshore must be of relatively small volume. Accordingly, I estimate petroleum accumulation would only fill any traps about 30% on an areal basis. As of the end of 1985, 85 wildcats discovered 7 "potentially commercial accumulations, of which only 2 are contemplated for production. I assume an 8% discovery rate; this combined with the 30% fill indicates that 2.4% of the trap area will produce petroleum (gas).
C. The Sunday River Formation (Early Cretaceous) is largely sandstone and in view of low source, reservoir thickness is not a limiting factor. For rating purposes, 100 ft is estimated.
D. The basin is gas prone, on the basis of little or no data, 90% gas is estimated. Three small accumulations together have an estimated 1 TCF of gas.
E. Little data available; an average sandstone reservoir is assumed.
F. The gas is deep, averaging 13,000 ft and maybe over-pressured.
G. Condensate content is high; 40 bbls per million cu ft indicating gas formed in the mature oil generating zone rather than the over mature zone. Note, NGL resources are greater than oil resources.
90

.050 BBO and 4 TCFG, amounting to BBOE of .710. The full range of probabilities are shown in the cumulative probability distribution curves of the oil and gas as derived from the consensus (fig. 39). The curves include mean values of .14 BBO and 4.63 TCFG.
Summary of Atlantic Margin Basins
To summarize the undiscovered recoverable petroleum resources of the Atlantic margin basins, the various geologic factors and gas and oil resources are tabulated in table 16.
INTERIOR BASINS
The interior basins of southern Africa, as defined here, are the Zaire, Okavanga, Kalahari, and Karoo basins (fig. 1). The perimeters of these basins are outlined on the basis of their latest phase of development, the interior sag; the size and configuration of the earlier underlying rifted subbasins are conjectural from the data at hand.
Because of the paucity of data in these unproductive basins, the play analysis method, employed for the west African basins, cannot be used. Instead, discounted yields from analogous producing basins have been used to make basin assessments (see Introduction for method). These analyses are summarized in table 17.
Zaire Basin
Location and Size
The Zaire (Upper Congo) basin occupies the upper reaches and drainage area of the Congo River (figs. 1 and 40). It lies about 80 percent in Zaire and 20 percent in the Congo. The contours of figure 40 are from a published map (Ministry of Geology of USSR, 1977), and, in the absence of any other data, we accept it as an indication of the size of the interior sag basin. An area of some 250,000 sq mi and a sedimentary volume of some 200,000 cu mi are indicated. I believe, however, that the demarked basin is probably underlain by a rifted subbasin which has a very approximate volume of 75,000 cu mi (see Structure) making 275,000 cu mi for the entire basin.
Exploration and History
In 1973, Shell and Texaco were granted an exploration permit covering 212,500 sq mi, almost the entire basin. Some 17 party months of seismic/gravity and probably airborne magnetometer work, plus two drilled holes, were completed by 1975 when the permit was reduced to 38,511 sq mi. With Esso replacing Shell as operator, two more deep wildcats were drilled, Mbandaka and Gilson of 14,273 and 15,305 ft respectively, both bottoming in Infra-Cambrian (Riphean or Sinian) without encountering any shows. Esso and Texaco relinquished their permit in 1983, and activity ceased in this basin.
Structure
The Zaire (Upper Congo) basin is an interior sag or cratonic basin underlain by one or more deeper subbasins. The shallow cratonic basin is indicated by the contours of figure 40. The key question is the location and
91
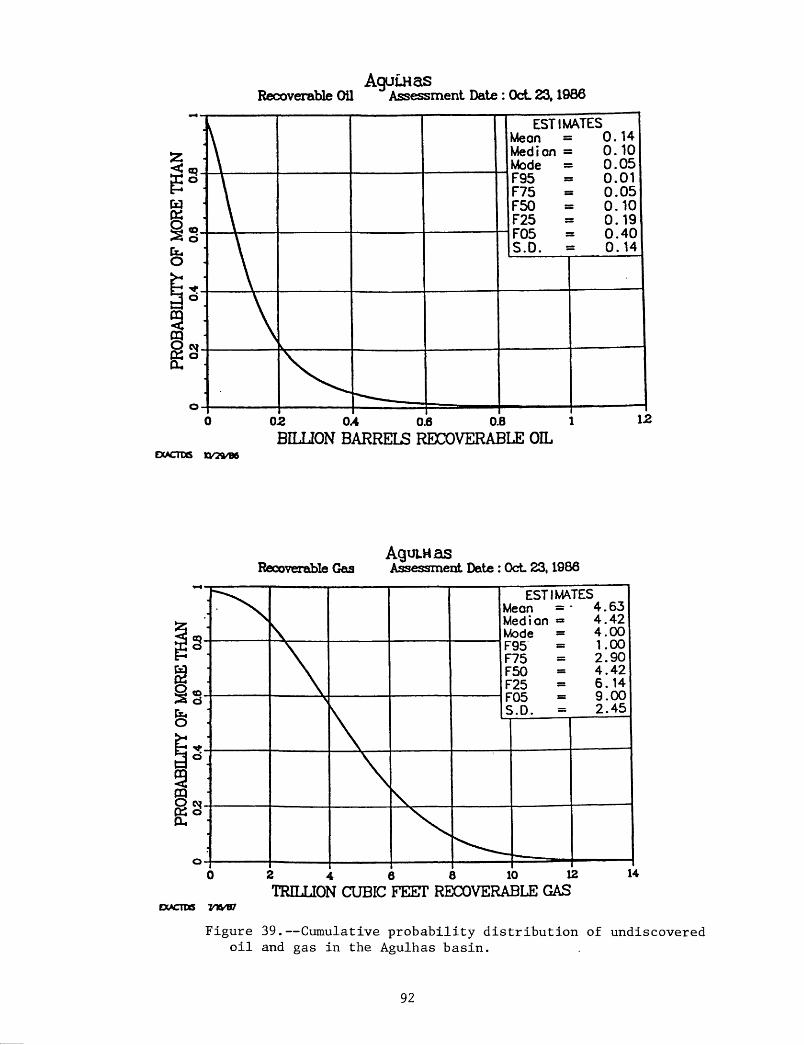
Recoverable OilAouLHas
Assessment Date : Oct 23,1986
ESTIMATES Mean = Median = Mode = F95 F75 F50 F25
0.140.100.050.010.050.100.190.400.14
02 0.4 0.6 O.B 1BILLION BARRELS RECOVERABLE OIL
EXACTOS
Recoverable GasAguiHasAssessment Date : Oct 23,1986^x
\\\
\\
M M M F F F F F S
^^
ESTIM* eon = edion =» ode =95 75 50 25OS \j*j .D. =
TES 4.63 4.42 4.00 1.00 2.90 4.42 6.14 9.00 2.45
MMMH
24 6 8 10 12TRILLION CUBIC FEET RECOVERABLE GAS
EXACTOS Y&8J
14
Figure 39. Cumulative probability distribution of undiscovered oil and gas in the Agulhas basin.
92
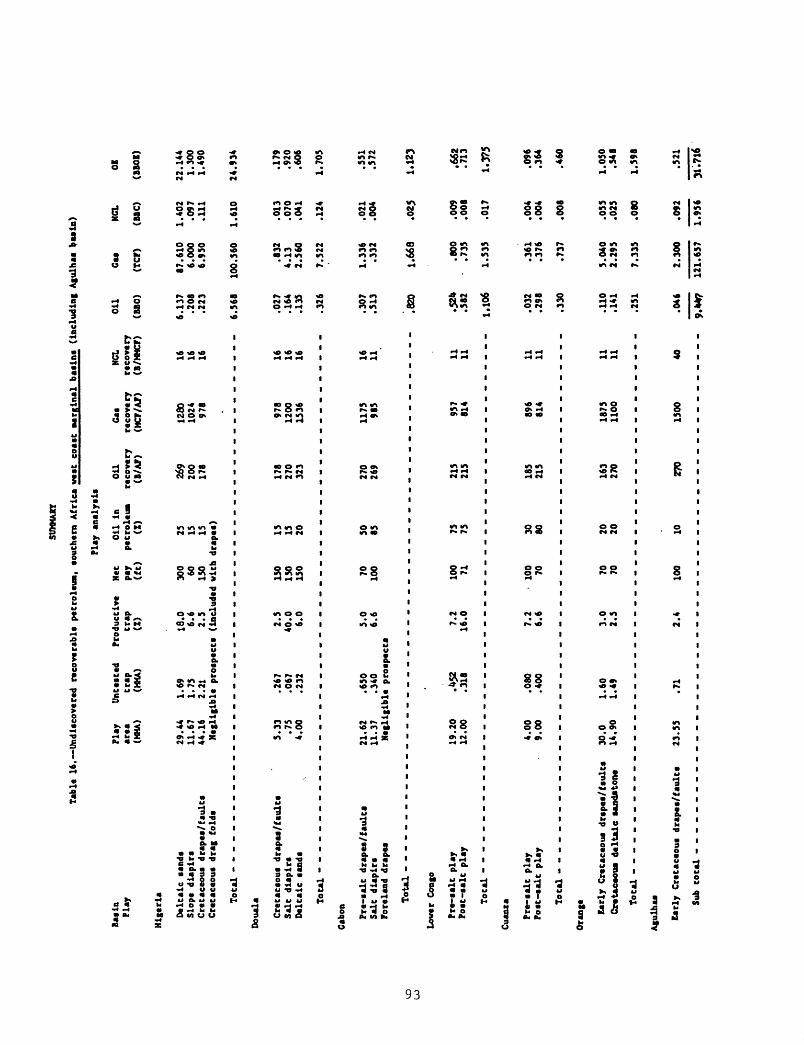
VD
U)
SUM
MAR
Y
Tab
le 1
6.
Un
dis
cov
ered
re
cove
rab
le
pet
role
um
, so
uth
ern
Afr
ica
wes
t co
ast
mar
gin
al
bas
ins
(in
clu
din
g A
gulh
as b
asin
)
Oil
G
as
NCL
(BBO
) (T
CF)
(B
BC)
Basi
nPl
ay
Nige
ria
Delt
aic
sand
s Sl
ope
dlap
lrs
Cretaceous
dr
apes
/ fa
ults
Cretaceous
drag Co
lds
Doua
la
Cret
acso
us drapes/faults
Salt di
aplr
s De
ltai
c sa
nds
Gabon
Pre-
salt
drapes/faults
Salt dl
aplr
s Fo
rela
nd d
rape
a
Total ------------
Lowe
r Congo
Pre-
salt
play
Post-salt
play
Tota
l ------------
Cuan
za
Pre-
salt
play
Post-salt
play
Tota
l ------------
Oran
ge Early
Cretaceous dr
spes
/fsu
lts
Cret
aceo
us d
elta
ic undctoiw
Aful
hu
Earl
y Cr
etac
eous
dr
apes
/fau
lts
Play
area
(MHA)
Unte
sted
Pr
oduc
tive
trap
trap
(HMA)
(Z)
29.44
1.69
11.67
1.75
44.16
2.21
Negligible pr
ospe
cts
5.33
.7
5 4.
00
.267
.0
67
.232
21.6
2 .6
50
11.37
.340
Negligible prospects
19.2
0 12.00
4.00
9.00
30.0
14.90
23.55
.k$2
.3
18
.080
.4
00
1.60
1.
49 .71
18.0
6.6
2.5
(Included
2.5
40.0
6.0
5.0
6.6
7.2
16.0 7.2
6.6
3.0
2.5
2.4
Net
p«y
(ft)
300 60
150
with
150
150
150 70
100
100 71 100 70 70
70
100
Play a
naly
sis
Oil
in
petroleum
(Z)
25
15
15
drap
es)
15
15
20 50
85 75
75 30
80 20
20 10
Oil
reco
very
(B
/AF)
269
200
178
178
270
323
270
269
215
215
185
215
163
270
270
Gas
reco
very
(M
CT/A
F)
1280
1024
97
8
978
1200
15
36
1175
985
957
814
896
814
1875
1100
1500
NGL
reco
very
(B
/HHCF)
16
16
16 16
16
16 16
11 11
11 11
11 11
11 40
6.13
7.2
08.2
23
.027
.164
.135
.326
.52*
.5
82
.032
.298
.330
.110
.141
.251
87.6
10
1.40
26.
000
.097
6.95
0 .1
11
.832
4.13
2.56
0
.013
.070
.041
7.52
2 .1
24
.307
1.
336
.513
.3
32.0
21.0
04
.800
.735
1.10
6 1.
535
.361
.376
.737
5.04
02.
295
7.33
5
.009
.008
.017
.004
.004
.008
.055
.025
.080
.046
2.
300
.092
9.4*
7 12
1.65
7 1.
956
OB
(BBO
B)
22.1
441.
300
1.49
0
6.56
8 10
0.56
0 1.
610
24.9
34
.179
.920
.606
1.70
5
.551
.572
.820
1.
668
.025
1*
123
.662
.713
1.37
5
.096
.364
.460
1.05
0.5
48
1.59
8

SUMM
ARY
Tabl
e 17.
Undi
scov
ered
recoverabla
petroleum, southern A
fric
aIn
teri
or b
asin
s Discounted v
olum
etri
c yi
eld
anal
ogy
Co pr
oduc
ing
besina
Bas
ins
Subb
aaln
a
Zai
re Inte
rior
Sag
2 S
ubba
aina
Plu
vang
o-E
tosh
s
Inte
rior
Sag
Nam
ibia
Rif
t O
kaw
ango
R
ift
Kal
ahar
i
Inte
rior
Sag
Paa
aarg
e R
ift
Mco
jane
Rif
t M
oaop
R
ift
Kar
oo Inte
rior
Sag
/ C
rato
n M
argi
n
Aga
Me s
o zo
ic
pra-
C. -
Kar
oo
Kar
oo
-Ter
tiar
y
E.
Pal
aozo
lc
E.
Pal
eozo
ic
Kar
oo-T
erti
ary
E.
Pal
eozo
ic
Kar
oo
Are
a(i
nai
de
3000
' (M
Mi2
)
200 39
170 50
50 70 84 85
Vol
ume
cont
our)
(M
M!3
)
200 75
130
100
100 60 90 126
Ris
k o
r S
ourc
e (X
)
.1
.2 .1
.2
.2 .1 .1 .2
disc
ount
to
R
eser
voir
(X
)
.5
.3 .3
.3
.3 .3 .3 .3
prod
ucti
ve
Tra
p (X
)
.1
.6 .1
.3
.3 .1 .4 .3
anal
og*
Tim
ing
(X)
.7
J .3
.4
.4 .7 .5 .6
To
tal
disc
ount
(X
)
.003
5 .0
18
.001
.0
07
.007
.004
.006
.011
Dis
coun
ted
anal
og
Vol
ume
x an
alog
x
Low
.014
.4
72
.002
.2
45
.245
.004
.189
.101
(BBO
E)
disc
ount
H
igh
.029
.6
63
.005
.3
44
.344
.009
.266
.167
Moa
t li
kel
y
(BBO
E)
.020
.6
00
.300
.3
00 _
.230
.135
Oil
to
ga
a ra
tio
(X o
il)
20
20 20
20 - 20 30
on (BBO
)
.004
.1
20.1
24
.060
.0
60.1
20 _
.046
.046
.041
.3
31
Caa
(TC
TC)
.096
2.
880
2.97
6
1.44
0 1.
440
2.88
0
_
1.10
01.
100
.567
77
52T
Klemme'a
volu
metric yi
eld
analogies
to p
roducing
basins
(.In
thouaande
BOE/
mf)
Low
High
1. Interior Sa
g 20
42
2. Interior Rift
350
492
3. Marginal Sa
g 48
96
4. Cr
aton
Margin
126
200
5. In
teri
or Sag/Craton Margin
73
121
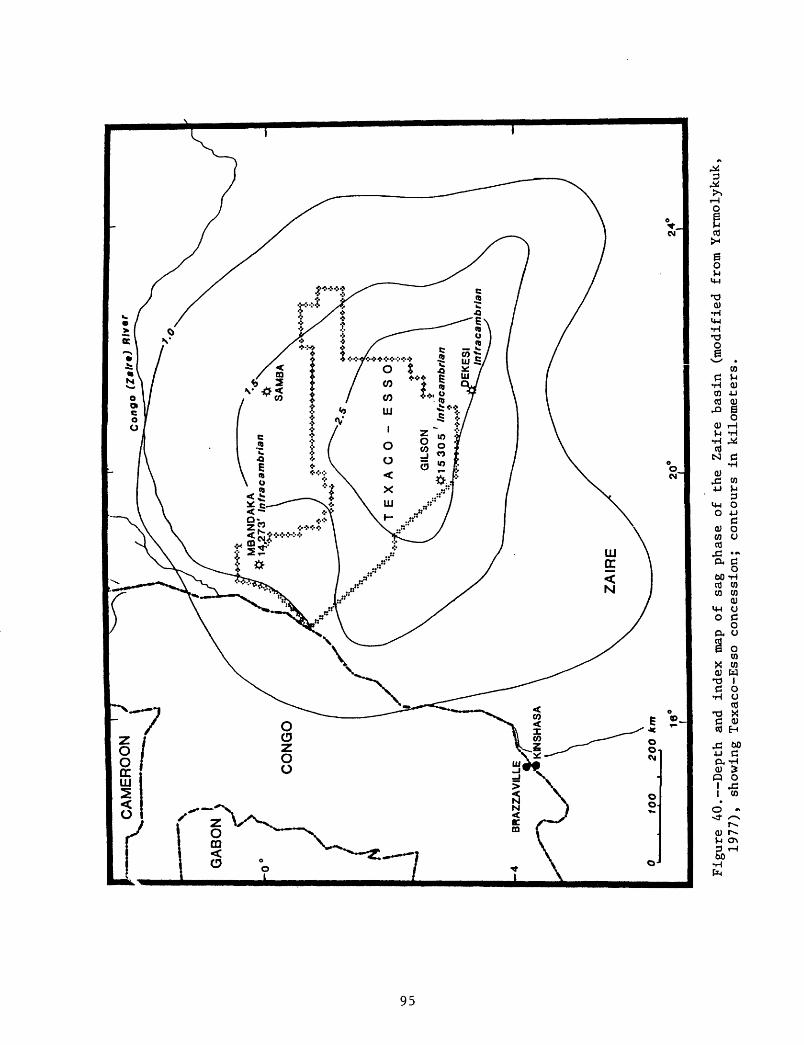
P . CAMEROON -\\
Con
go f
Z.l
r.M
2r
#1
4,2
73
' In
fra
ca
mb
ria
n
Figu
re 40. Depth an
d index
map
of sag
phase
of th
e Za
ire
basin
(mod
ifie
d from Yar
moly
kuk,
1977), showing
Texa
co-E
sso
concession;
contours in kilometers.

size of the deeper subbasin or subbasins. The shape of the subbasinal area may be inferred from the exploration permit selected by Texaco-Esso, i.e. 38,511 sq mi (fig. 40). The depth is indicated to be approximately 15,000 ft as suggested by the wildcat depths and by the schematic cross section of Clifford (1984) (fig. 41), giving a very approximate volume of 75,000 cu mi for the deeper subbasins. The basinal area appears to represent two northwest-trending subbasins separated by a northwest-trending basement arch. The two basins are reportedly of disparate geology. One (depicted by fig. 41) has "...large structures, possibly caused by infra-Cambrian salt movements...and high-angle normal faulting is present (possible evidence of an earlier interior fracture cycle)..." according to Clifford (1984). The rifting, affecting the Infra Cambrian sediments, ceased prior to Karoo time, i.e. prior to late Paleozoic. Mesozoic strata younger than Triassic have little or no structural closure (fig. 41).
Stratigraphy
The stratigraphy of the shallow sag is known from outcrops to be no older than Mesozoic. The section is largely non-marine sandstones and shales with two marine horizons, one in Late Jurassic and the other in Late Cretaceous. The fossil content indicates the sediments are completely unrelated to the Atlantic 200 mi to the west, but have Indian Ocean affinities. Several zones of very rich organic lacustrine shales have TOC's up to 35 percent. Reservoirs of cross-bedded, soft, fine to coarse-grained sandstones are described.
All that is known of the pre-sag stratigraphy is shown in figure 41. Clifford, 1984, mentions "...Permian-Carboniferous (Karoo) varved lake shales with TOCs up to 1.8 percent and woody-coaly organic matter."
Oil Versus Gas Occurrence
The thermal maturity of the Infra-Cambrian is either mature or more likely, over-mature. Oil is estimated to make up only 20 percent of the petroleum mix.
Principal Play Attributes
Source. At least some organically rich strata exist in the sag phase of the basin. No seeps, however, are evident and no shows were reported in the two wildcats.
With an assumed thermal gradient of 1° F/100 ft and with an estimated subsidence rate of 26 ft per million years (base Cambrian, 570 million years at 15,000 ft) the top of the thermally mature window appears to be below 8,000 ft deep, and generally below the Karoo-Infra Cambrian unconformity. The unconformity, however, is profound, representing a long time span, and the Infra-Cambrian section may be thermally over-mature rather than mature. In any case, the mature or over-mature strata are below the base of the sag and largely below the Karoo rocks according to figure 41. So generation, if any, must have taken place largely in the Infra Cambrian strata. The Infra Cambrian is an extensive shelf deposit, overlying the basement, which extended far beyond the present limits of the Zaire basin. No seeps or other indications have been reported anywhere in the region. This, along with the lack of shows in the two wildcats is downgrading even though the exploration of the basin is immature. I think the existence of some thermally mature
96

sN
Figu
re 41. Schematic geologic cr
oss-
sect
ion,
Za
ire
basi
n (f
rom
Clifford,
1984).
source rock is likely in this huge basin, but little or no evidence supports the availability of a sufficient volume of rich source. I discount the thermally immature sag phase to 0.1 (10 percent) of source adequacy and the older subbasin to 0.2 (20 percent) of adequacy.
Reservoir. From gross lithologic descriptions, reservoirs of unknown quality apparently exist down to at least the base of the Jurassic. Considering 100 ft of sandstone to be adequate, I would discount the reservoir factor to 0.5 of adequacy in the sag. The chances for adequate reservoirs in the older section are completely unknown but are likely to be less than for the younger sag sediments, and I guess only half as many of the reservoirs would survive diagenesis; therefore, the reservoir factor is discounted to 0.3.
Trap. The upper sag portion of the basin appears to be flat with little trap possibility. At least one of the two subbasins has "large structures" possibly caused by salt movement (fig. 41). High angle normal faults suggest the subbasin to be an interior rift basin. Traps may be expected, but how many have closure is unknown. I discount the trap factor in the flat-lying sag to only 0.1 and in the underlying subbasin, to 0.6.
Migration Timing Versus Trap Formation. Assuming a constant rate of subsidence and thermal gradient, migration may have begun in the Infra- Cambrian when it first reached a depth of 8,000 ft. Any fault closures associated with the rifting of the subbasin would become traps by the end of the Infra Cambrian when faulting evidently almost ceased (fig. 41); drapes could be much younger. Salt structures probably also came into effect before the end of the Infra-Cambrian (assuming that a burial depth of 3,300 ft (1 km) is enough to initiate salt flowage). Continued salt flowage and drapes caused traps affecting Karoo reservoirs. Petroleum, sourced from the upper Infra- Cambrian section, might have migrated into these Karoo traps. I believe the timing is adequate so that traps would catch part of any oil and gas generated in the Infra Cambrian rocks, thus, timing is discounted to 0.7 for the interior sags and to less, 0.5, for the older section.
Conclusion
Table 17 summarizes the estimates and calculations leading to the estimate of oil and gas in the basin. The recoverable petroleum is estimated to be 124 million barrels of oil and about 3 trillion cu ft of gas, all concentrated in the deeper subbasins. This is an almost negligible amount for a basin with such a large surface expression.
On the basis of these estimates, and especially considering the large size, a panel of The World-Energy-Resources-Program geologists concluded that the mode, or most likely, values for the amount of undiscovered recoverable oil and gas in the Zaire basin were 500 million barrels of oil and 10 trillion cu ft of gas. Cumulative probability distribution curves (fig. 42) based on the consensus, convey the precision in these estimates. The curves include mean values for oil of .65 BBO (Zaire) and .16 BBO (Congo), .81 BBO in all, and mean values for gas of 9.52 TCFG (Zaire) and 2.38 TCFG (Congo), 11.90 TCFG in all.
98

66
H- OQ C
rocr CO IH- o-si
H- rt H H-
Oo cr O 032 cr OQ H- O H*
COrt
PROBABILITY OF MORE THAN0 02 0.4 04 OB 1
PROBABILITY OF MORE THAN0 02 0.4 04 04 |
5m p i/i
o ooooooo
N
OBO
crcrtN
§a H- CO Oo (t)
0> CO
mCD>COz
03cr
oH-
OQ
CO
H-P
rt
PROBABILITY OF MORE THAN 02 - cu a* oj
PROBABIUTY OF MORE THAN0 02 O4 04
A
s «
U>CrfK> OKtKtM
oo a(QOroo

Okavanga Basin
Location and Size
The Okavanga basin (fig. 1) as outlined by the 3,000 ft (1 km) isopach contour (fig. 43) includes a widespread interior sag basin with a thin (5,000 ft) stratigraphic section that is underlain by at least two deeper subbasins of unknown extent. So defined, the Okawanga basin occupies the southeastern third of Angola and extends into western Zambia and northern Namibia (Angola 80%, Namibia 10%, and Zambia 10%). The basin has an area of 170,000 sq. mi. The contours of figure 43 (Ministry of Geology, USSR, 1977) are apparently based on few data and are largely conceptual. The contours indicate only the shallow, sag part of the basin that would, accordingly, have a volume of some 130,000 cu mi. The configuration and volume of the deeper subbasins of the Okawanga basin are unknown, but are estimated to have an additional volume of 200,000 cu mi making 330,000 cu mi in all (see Structure).
Exploration History
Exploration until recently has been limited to the Namibia portion of the basin. The presence of greater basinal depths was established there by gravity survey in 1949. Exploration in Namibia (Etosha subbasin) began in 1962 with an airborne magnetometer survey followed by gravity, outcrop, seismic, and chemical surveys in selected areas, and one core hole in 1964. Three wildcats, 5-1A, 2-1, 1-1, were drilled in 1969 and 1970 (fig. 44). Since 1970, little direct exploration has been performed. Exploration in the eastern Okawanga basin (Barotse subbasin) is expected with the recent acquisition of exploration concessions in areas of western Zambia (fig. 43).
Structure
The Okawanga basin as shown in figure 43 depicts only the shallowest element of the basin and may be considered a very approximate map of the interior sag portion of the basin. An east-trending elongate subbasin extends along the south border of the Okawanga basin principally in Namibia (fig. 43). Another such basinal feature reportedly trends along the east side of the basin in Zambia, bordered on the east by a major fault upthrown to the east. A few other subbasins are reported but no data for them is available. These indicated subbasins are elongate and are presumed to be rift basins similar to those in neighboring parts of Africa. The age of the Etosha subbasin subsidence as well as its stratigraphic units is conjectural, but probably the major movement was after the folded Mulden (Cambrian? or pre-Cambrian) and before the flat-lying Karoo strata (late Paleozoic).
The last major tectonic events were in the regionally extensional period of southern Africa in the Jurassic and early Cretaceous, which resulted in the south and east parts of the basin being intruded by great volumes of dolorite in the form of dikes and sills. For this study, the Otavi Group (pre- Cambrian) is considered as economic basement (fig. 43). Although these rocks are sedimentary, they are well indurated and exposed over large areas of Africa with no reported evidence of petroleum, or petroleum attributes. On this basis, and considering the fact that the abundant intrusives on the west and east side of the Etosha subbasin (Mompers, 1982), the prospective area appears limited to 30,000 sq mi (Mompers, 1982) and the subbasin volume of effective rock is estimated to be approximately 100,000 cu mi. Assuming, very
100
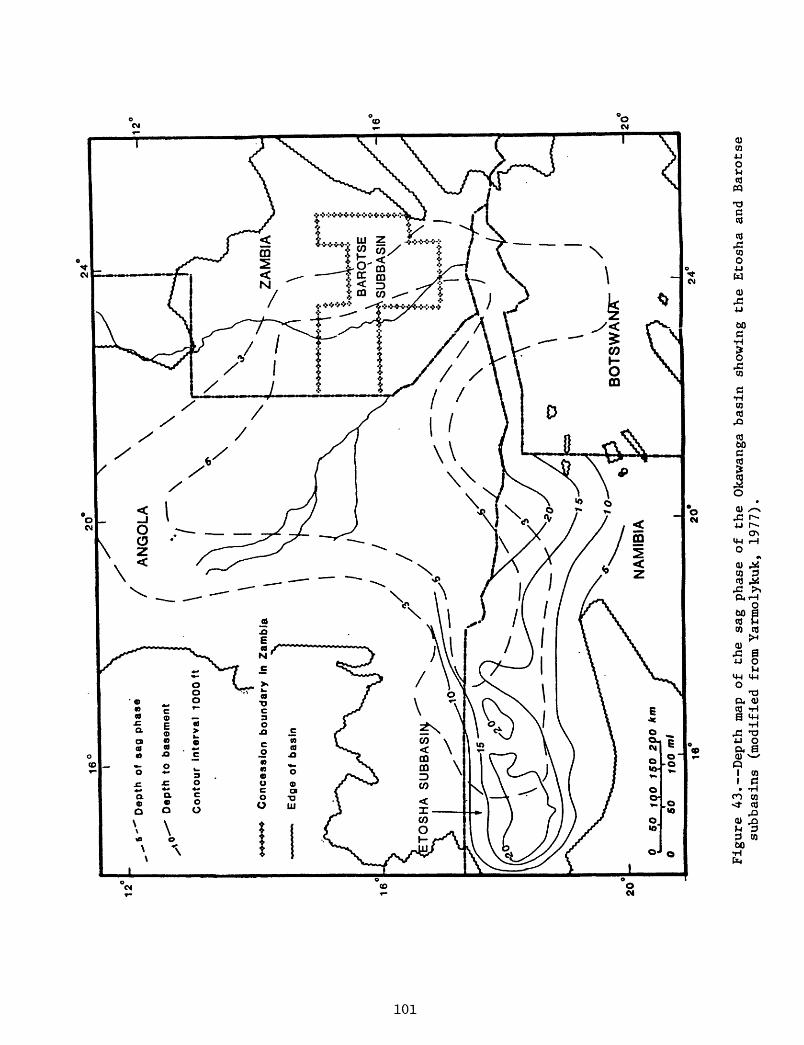
X
/
AN
GO
LA6
- D
epth
of
sag
ph
ase
Dep
th t
o b
asem
ent
Co
nto
ur
inte
rval
1000ft
****
**
Co
nce
ssio
n
bo
un
dar
y in
Zam
bia
Ed
ge
of
bas
in
TO
SH
A
SU
BB
AS
IN,
BO
TS
WA
N7T
0 5.
0 1Q
O
1S
02fO
km
0 SO
10
0 m
l
20 -
Figure 43. Depth map of
th
e sag
phase
of th
e Ok
awan
ga basin showing
the
Etosha and
Barotse
subbasins
(mod
ifie
d fr
om Yarmolykuk, 1977).

o K)
WE
ST
1000
FEE
T 0
MG
L
DA
TUM IS
WE
STE
RN
E
TO
SH
A
BA
SIN
IDE
ALI
ZE
D
ST
RA
TIG
RA
PH
IC
CR
OSS
S
EC
TIO
NE
AS
T
KARO
O SU
PERG
ROUP
E3
OW
AM
BO
F
M.
- I_
I
MU
LDE
N
GR
OU
P
0
TS
CH
UD
I F
M,
HU
TT
EN
BE
RG
F
M.
AB
EN
AB
S
UB
GR
OU
P
AU
R03
FM
. G
AU
SS
F
N.
BE
RO
A
UK
AS
TS
UM
EB
SU
BGR
OU
P
13"
E N
o.91
24
'n O
luko
ndo
^-<
^
^-- *^_
\tT
9
LIN
ED
F S
EC
TIO
N -H
xx'
1 ./
l-l ^
'"V
s^
\
VN
a9074 /
s&
No
nt!
*
+ ' 5
-IA
I W
^
^*i^
*'
' «..
* «.
**
y- > 9
- O
UTC
RO
P-r
-s-X
\ ^>
\\
.Cor
chol
t
No.
9563
X>
""
""*"
" --
^H
*3Z
K
W»r
.w«l
i B7°
B«
lMb
Pan
0
SOM
ILE
S
1x
*x
|
P-C
IGN
EO
US
-M
ET
AM
OR
PH
IC
LIT
HO
LO
6Y
m
CO
NT
INE
NT
AL
SS
, C
LY.,C
ALI
CH
E
CO
NTI
NE
NTA
L T
ILL
.,S
H,S
3
CO
NT.
/MA
RIN
E M
KE
O
MA
RIN
EO
OL
., 3
H,L
3,M
AR
L
E
MA
RIN
E
TIL
LIT
E
CO
NTI
NE
NTA
LC
CN
T.M
AR
INE
MX
E
gC
RY
W., S
S,A
RK
.,C
Afl
BO
NA
TE
,SH
«
"
CR
YW
., S
ILT
S,
3H
CO
NT
INE
NT
AL
CO
AR
SE
C
LA
ST
ICS
.SH
Figure 44
,-^-
Geol
ogic
se
ction
of south
flank
of Etosha su
bbas
in (modified
from Mompers,
1982).
generally, that the reported elongate deeper subbasin along the east side in Zambia plus a few other subbasins would amount to a similar volume, the total volume of the basin including the interior sag would be approximately 330,000 cu mi.
On a map by Mompers (1982) and as might be inferred from the map by Yarmolykuk, 1977 (fig. 43), the Etosha subbasin is shown to have individual, rather randomly oriented, basement highs based on somewhat sketchy geophysical and geological data. Although faults are not shown, the configuration suggests an east-west trending interior rift basin. Such a setting would suggest horst and tilted fault-block closures.
Stratigraphy
The lithologic units of the Okawanga basin are only poorly known. Figure 44 shows the section under the Etosha subbasin as deduced by Mompers (1982) and presumably a similar section may be found in other parts of the basin. The ages of the pre-Karoo sediments are conjectural; Mompers is inclined to place the Otavi and Mulden Groups in the Paleozoic. From the Stratigraphy of South Africa, compiled by L. E. Kent (1980), these groups appear to be older, the Otavi Group being pre-Cambrian and the Mulden Group either Cambrian or pre-Cambrian. In this report, the Otavi Group is regarded as part of the economic basement.
The Mulden Group is made up mainly of continental elastics, ranging from coarse elastics to graywackes to shales. The upper part, the Owambo Formation, contains some marine beds of graywacke, arkose, carbonate, and shale.
Above the Mulden Group, and separated by distinct disconformity, is the Karoo Supergroup (Permian to Jurassic) sandstones and shales. Above the Karoo Supergroup is the Kalahari Formation of Cenozoic age.
Oil Versus Gas Occurrence
Significant oil seeps are not known in the basin. Minor gas shows and a dubious oil show were encountered in the bore holes of the Namibia part of the basin. The petroleum mix is estimated at 80 percent gas.
Principal Play Attributes
Source. On the basis of the observations of the Etosha subbasin (Mompers, 1982), it appears that little over-mature source rock is present. The Karoo and upper part of the Mulden Formation appear immature. The Mulden below 5,000 ft may be thermally mature. The Otavi Group (considered part of the economic basement) appears to be very old and probably over-mature.
The presence of source rock of sufficient richness within the thermally mature interval has not been found. The lack of significant, reliable shows or seeps indicates that source rock may be insufficient or missing. The source attribute is discounted to 0.1 for the sag portion and 0.2 for the deeper portion of the basin.
Reservoirs. Evidence for reservoirs is sparse, 130 ft of upper Muldin sandstone with porosities up to 20 percent are reported in the corehole of 1964 (fig. 44). Carbonate samples with matrix porosities of 8 to 15 percent, and, by fracturing raised it to 20 or 25 percent, are reported from hole 5-14 at the top of the Otavi section (Mompers, 1982). Lost circulation is reported
103

near the bottom of the 1964 corehole. No reservoirs are reported in holes 2-1 and 1-1. The reservoirs are regarded as considerably less than adequate, discounted to about 0.3.
Trapp ins. . If the Etosha subbasin is representative of the basin as a whole, and if Mompers 1 structure map (1982), though very sketchy, is reasonably correct, some closures may exist. The Mulden Formation is a section of predominantly coarse elastics - graywackes and arkoses - with few shales, and traps may not be effective. The shales of the overlying Karoo Supergroup provide seals but are generally flat-lying. Traps are believed to be weak and are discounted to 0.1 for the featureless sag portion, and 0.3 for the deeper subbasins.
Timing of Migration and Trap Formation. In the Etosha subbasin, most folding took place after deposition of the Mulden Formation (Cambrian?) and prior to that of the Karoo Supergroup. Assuming a constant thermal gradient and subsidence rate, generation and migration would have commenced during Mulden (Cambrian?) time. As trap formation appears to have been somewhat later (i.e. early to middle Paleozoic), the timing can be considered fair to poor and is discounted to 0.4 for the deeper subdivisions and only 0.3 for the sag portion of the basin.
Conclusions
The estimates and calculations leading to an oil and gas assessment are summarized in table 17. Approximately 120 million barrels of oil and about 3 trillion cu ft of gas are estimated: all assumed to be in the vaguely defined rifted subbasin. These amounts are very small for a basin with such a large surface area.
On the basis of these estimates, a panel of The World-Energy-Resources- Program geologists formed a consensus estimate on the amount of undiscovered recoverable oil and gas in the Okawanga basin of which the mode, i.e. most likely, is 100 million barrels of oil and 3 trillion cu ft of gas. The cumulative probability distribution curves expressing this consensus are shown in figure 45. Included on the curve are mean values for oil of .11 BBO (Angola), .01 BBO (Namibia), and .01 BBO (Zambia), making .13 BBO altogether; for gas, the mean values are 3.64 TCFG (Angola), .45 TCFG (Namibia), .45 TCFG (Zambia), totaling 4.55 TCFG.
Kalahari Basin
Location and Size
The Kalahari basin occupies the Kalahari Desert which covers most of Botswana and extends into Namibia (Botswana 85 percent, Namibia 15 percent). It is elongate northeastwardly direction and has an area of 84,000 sq mi and a sedimentary volume of 170,000 cu mi (figs. 1, 46, and 47).
Exploration History
Exploration for petroleum which included some gravity work, surface geology, and two stratigraphic holes, was done for a few years in the early sixties.
104

Recoverable OilOkawanga
Assessment Date :0ct 23,1986
s
\\\\
^-^
ESTIMMES Mean » 0.13 Median - 0.12 Mode » 0.10 F95 » 0.01 F75 » 0.07 F50 - 0. 12 F25 - 0.19 F05 - 0.30 S.D. - 0.09
0.0
DUCTDB VZVOO
01 02 03 O4 Oj6BILLION BARRELS RECOVERABLE OIL
0.6
Recoverable CosOkawanga
Assessment Date : OcL 23,1986
§-
o
0
;g<
\
x\
V
^^^^_
ESI Mean Medlar Mode F95 F75 F50 F25 F05 S.D.
nwttEss
1 «
-
=
5 4.55 3.98 3.00 1.00 2.50 3.98 5.96
10.00 2.89
468 10 12 14 16 IBTRILLION CUBIC FEET RECOVERABLE GAS
20
EXACTOS
Figure 45. Cumulative probability distribution of undiscovered recoverable oil and gas in the three countries, Angola, Namibia, and Zambia, sharing the Okawanga basin.
105

/ SOUTH
AFRICA
Figu
re 46. Depth map of th
e sa
g phase
of th
e Ka
laha
ri b
asin
(f
rom Ya
rmol
yuk,
19
77).

\T 26
\
\ \
^ \ X.
/
v I
\(^c
oja
ne
S
ubbasi
n
VR
ED
A
i "\
/ /
i\
Noso
p S
ub
ba
siti
.-
/
/ !
i
20
%
20
"1
/^P
ass
arg
e S
ubbasi
n
BO
TS
WA
NA
f2
4-
GA
BO
RO
NE
* '
20
0 k
m
i___________
1
Figure 47. Depth map of
the
pre-sag phase of
the
Kalahari basin within Botswana
(fro
m Reimann, 19
86).

Structure
The Kalahari basin, as mapped, is a shallow interior sag basin (fig*46). Reportedly, however, a hidden normal fault with a 10,000-foot throw, down to the southeast, trends along the northwest side of the basin making it half-graben (fig. 47). The age of the fault is unknown; the down-thrown strata reportedly are Karoo or older. That the basin may be dominantly a rift basin is suggested by its position and trend in line with a northeast-trending zone of Karoo rifts. The volume of the sag phase is approximately 60,000 cu mi. Below the sag are three subbasins, Fassarge, Ncojane, and Nosop (fig.47), with a combined sedimentary volume of approximately 90,000 cu mi, giving the Kalahari basin a total volume of 150,000 cu mi. About 10 percent of the rift fill is estimated to be Karoo rocks.
Stratigraphy
The 3,000 ft of pre-Karoo penetrated in the lower part of the borehole in the Nosop (or Nossab) subbasin at Vreda (figs. 47 and 48) are arenaceous rocks correlated with the Fish River Formation of probable Cambrian age. The Fish River Formation is predominantly a continental red-bed facies. For evaluation purposes, the subbasins indicated in figure 47 are assumed to be filled, probably with Fish River or a similar lithology.
Overlying the Fish River and older rocks unconformably is the Karoo Supergroup. The same four divisions of the Supergroup are recognized in the Kalahari basin as they are in the Karoo basin (see description under that heading): the Dwyka, Ecca, Beaufort, and Stromberg Groups. The Dwyka is essentially a glacial deposit, marine in the lower part and possibly lacustrine above. At the Vreda borehole, the Dwyka is approximately 2,500 ft thick (fig. 48), is conspicuously carbonaceous, and has some sandstones of reservoir quality. The Ecca Group lacustrine, possibly marine, sandstones and shales with some coals, shows thickness of up to 2,000 ft in outcrop. The Beaufort Group, 2,000 or more feet of continental red beds overlies the Ecca, and in turn, is overlain by the Stromberg volcanics and red beds.
Oil Versus Gas Occurrence
No seeps of oil or gas are reported. On the basis of analogy to the Okawanga and other interior basins, the petroleum mix is estimated to be 80 percent gas.
Principal Play Attributes
Source. The fill of the subbasins appears to be either Cambrian redbeds or partially metamorphosed pre-Cambrian sedimentary rocks and therefore of negligible source potential.
The overlying Dwyka and Ecca Groups of the Karoo Supergroup are carbonaceous and similar to equivalent strata in the Karoo basin, which are considered to have a fair source potential though generally immature.
Assuming a thermal gradient of 1° F/100 ft and that the average base of the Karoo Supergroup has subsided about 6,500 ft (2 km), the top of the oil window is calculated to be approximately 8,000 ft deep, indicating that most of the Karoo strata are generally immature. Some Karoo strata, perhaps 10 percent of the rift fill, along the down-thrown side of the fault on the
108
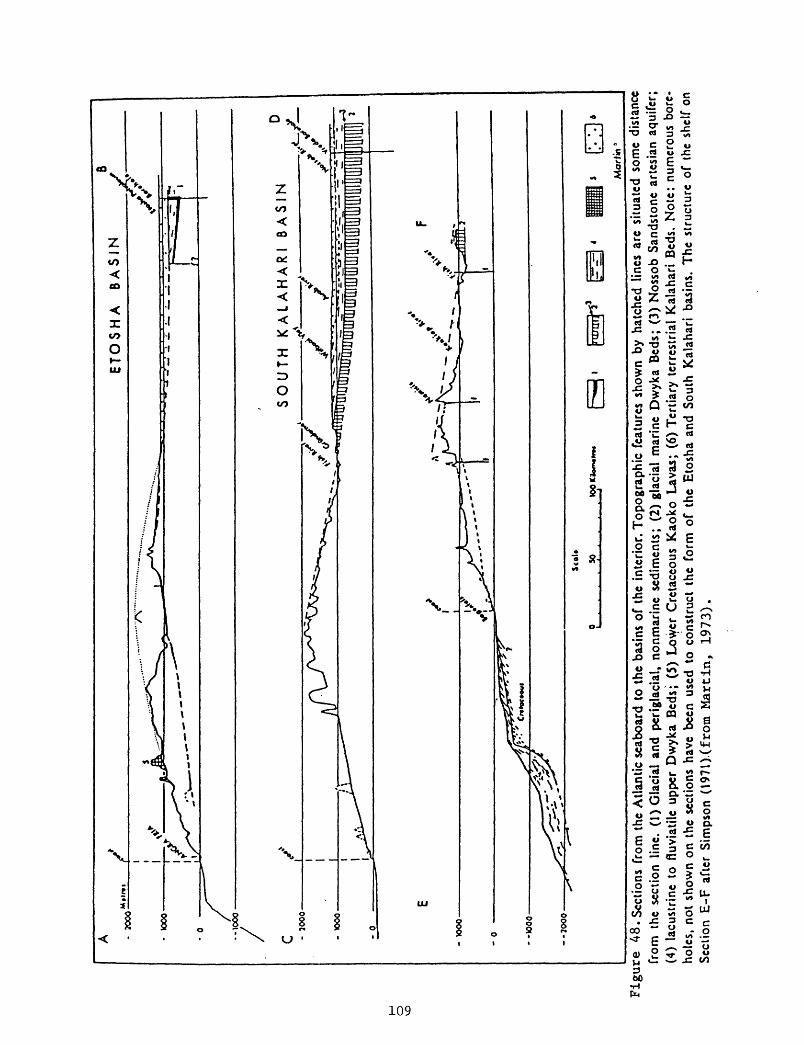
- 20
00It
tni
*E
TO
SH
A
BA
SIN
KX
X>
1000
c - 50
00-
- W
OO
-
- 0
- W
OO
- 0
--w
oo
--7
00
0
jUL
SO
UT
H
KA
LA
HA
RI
BA
SIN
Ma
rtin
Fig
ure
48
. Sec
tions
fro
m t
he A
tlant
ic s
eabo
ard
to t
he b
asin
s of
the
int
erio
r. T
opog
raph
ic f
eatu
res
show
n by
hat
ched
lin
es a
re s
ituat
ed s
ome
dist
ance
fr
om t
he s
ectio
n lin
e. (
1) G
laci
al a
nd p
erig
laci
al,
nonm
arin
e se
dim
ents
; (2
) gl
acia
l m
arin
e D
wyk
a B
eds;
(3)
Nos
sob
Sand
ston
e ar
tesi
an a
quif
er;
(4)
lacu
stri
ne t
o flu
viat
ile u
pper
Dw
yka
Bed
s; (
5) L
ower
Cre
tace
ous
Kao
ko L
avas
; (6
) T
ertia
ry t
erre
stri
al K
alah
ari
Bed
s. N
ote:
num
erou
s bo
re
hole
s, n
ot s
how
n on
the
sec
tions
hav
e be
en u
sed
to c
onst
ruct
the
for
m o
f th
e E
tosh
a an
d So
uth
Kal
ahar
i ba
sins
. T
he s
truc
ture
of
the
shel
f on
Se
ctio
n E
-F a
fter
Sim
pson
(19
71).
(fro
m M
arti
n,
1973
).

northwest side of the basin may be deep enough to generate some petroleum. The source potential of the Kalahari basin is discounted to about 0.1.
Reservoirs. Probably good quality sandstone reservoirs are present in the subbasins (possibly Fish River Formation), but in the absence of source rock are of little value.
No precise reservoir measurements have been made, but sandstones occur in the Karoo section. Reportedly, the Karoo sandstones are not very porous or permeable, but at least one Dvyka sandstone (The Nossab, fig* 48) is an artesian aquifer. The reservoirs are discounted to about 0.5 for the Karoo section and 0.3 for underlying subbasins.
Trap. The pre-Karoo strata appear to be mainly coarse elastics so that effective cover rock may be lacking. The Karoo beds appear to be flat with little possibility of fold closures. However, fault traps and drapes near the reported northwest-trending fault are possibilities. The trap possibilities for the Karoo strata of this basin are discounted to 0.1 and for the older rock to 0.4.
Migration Timing Versus Trap Formation. Generation and migration could have occurred if the northwest-boundary fault was post-Karoo, thus depressing a zone of early Karoo sediments into the oil window; however, age of the faulting is not known. Fault traps and drapes, in the case that faulting was post-Karoo, would have formed at about the same time that the Karoo source shales would begin generating petroleum. Migration timing is discounted to about 0.7 for the interior sag sediments and 0.5 for the older portion of the basin.
Conclusions
Estimates and calculations leading to an assessment are summarized in table 17. Conclusions are that any petroleum must come from the rifted subbasins and that the amount would be small, namely 46 million barrels of oil and about 1 trillion cu ft of gas.
Upon presentation of these data to a panel of geologists from The World- Energy-Resources-Program, a consensus established the mode, i. e. most likely, estimate for undiscovered recoverable oil at 50 million barrels and gas at 1 trillion cu ft. Cumulative probability distribution curves showing the full range of estimates for oil and gas in the Kalahari basin are shown in figure 49. Included on the curve are mean values for oil of .05 BBO (Botswana) and .01 BBO (Namibia), making .06 BBO in all. Mean values for gas are .98 TCFG (Botswana) and .17 TCFG (Namibia), making 1.15 TCFG in all.
Karoo Basin
Location and Size
The Karoo basin occupies a major part of the Republic of South Africa (fig. 1). The basin is separated from the south and southwest margins of Africa by the Cape Series (fig. 50). Following the example of earlier studies, we have not included the early Paleozoic Cape Series in the Karoo basin. So defined, the basin has an area of approximately 85,000 sq mi (within the 3,300 ft (1 km) isopach contour) and a volume of 126,000 cu mi.
110

Bot
swan
a 85
%R
ecov
erab
b OU
KA
LA
HA
RI
BA
SIN
OIL
: Oct
23.
I96
0
2- § 5- 3- n^ no
oi\
\
S
OI\ \ M
OU
\ M
OuQ
CS
Tlk
Ueo
n U
edio
n
Uxl
eF9
5 F7
5 F
50
F25 S.O
.
^-^
e QJ
4MES
0.0
5
0.0
4
0.0
4
0.0
1
0.0
3
0.0
4
0.0
6
0.0
8
0.0
2
«
_
__
0
OJ
Nam
ibia
15%
Rao
over
abte
OU
Aaa
oavm
mL
DaU
: O
ct 2
a 19
68
OOOO
BILL
ION
BARR
ELS
RECO
VER
ABL
E OI
L
ooof
i om
o oo
is BI
LLIO
N BA
RREL
S RE
COVE
RABL
E OI
L<xoa
o
Bot
swan
a 85
%R
ecov
erab
le C
os
Asa
eaam
ent
Dat
a: O
ct 2
3.19
68
3.,
£s
u ^ O
fe is" <
N
> o
\ \ \
ft
\ \ 1 V
^^
B a
ES
TU
Mea
n U
edio
n U
Dd«
' F9
5 F
75
F50
F2
5
S.O
.
X
MTC
S 0.9
8
0.9
4
0.6
5
0.4
3
0.7
0
0.9
4
1.21
1
.70
0.3
9
ft a
TRIL
LION
CU
BE
FEET
REC
OVER
ABLE
GAS
GA
SR
ecov
erab
le G
asN
amib
ia 1
5%A
sses
smen
t D
ate:
Oct
23.
1968
OOO
oio
oift
py>
036
OJQ
TRIL
IJON
CUBC
FEE
T RE
COVE
RABL
E GA
S03
5 04
0 0
*
Figu
re 49. Cumulative pr
obab
ilit
y di
stri
buti
on of
undiscovered recoverable
oil
and
gas
in
the
Bots
wana
an
d Na
mibi
a po
rtio
ns of the
Kala
hari
basin.
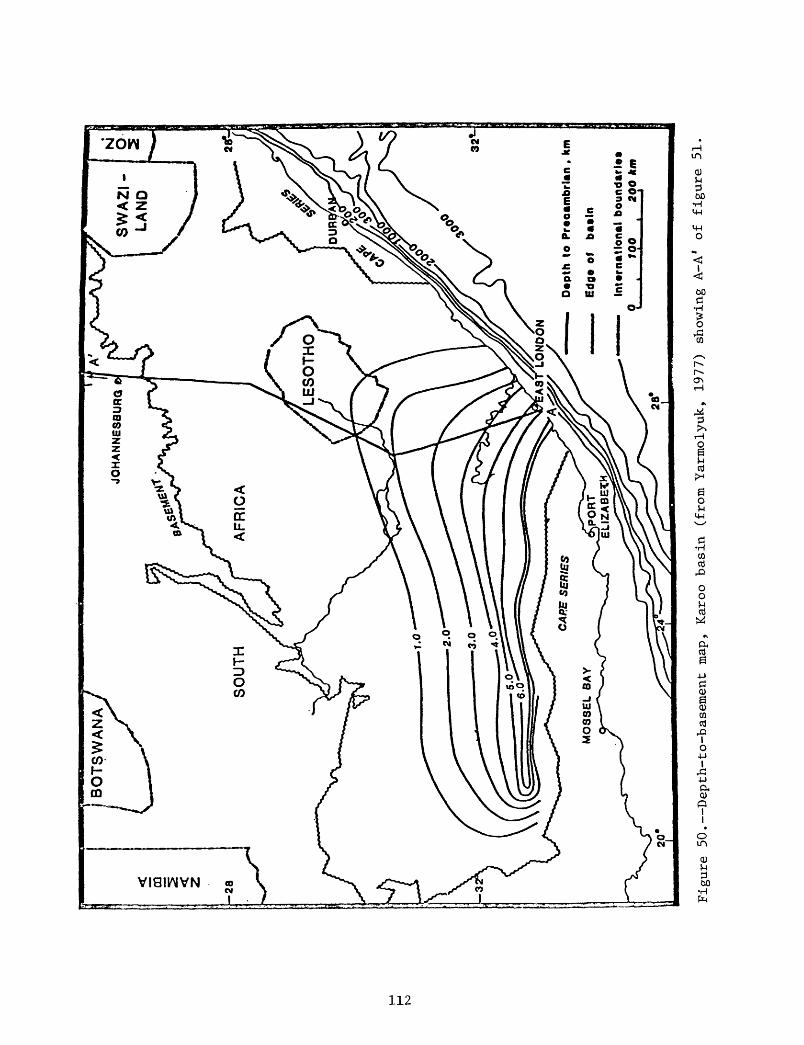
ZTT
OQ C
II
O CD
T3 rtET
rt O
(D3 rt
hh H O
g-
VO
CO
O
H-
OQ
OHi HiH-
OQC

Exploration History
Over 150 wildcats have been drilled in the Karoo Basin, but only a small percentage probably had any evaluation significance. All the wildcats were dry, though some shows of oil were found near dikes. Given the nature of the geology, i.e. extensive stratigraphic continuity, and lack of structural complication, the basin is considered rather maturely explored.
Structure
The Karoo basin is principally a platform covering some 275,000 sq mi, however, only that portion of the basin, some 84,000 sq mi, where the sedimentary thickness exceeds 3,300 ft (1 km) is considered to have any appreciable petroleum potential (fig. 50). This deeper portion of the basin is essentially a foreland, dipping gently southwards into a narrow foredeep in front of the east-trending folded mountains of the Cape Series (figs. 50 and 51). The Dwyka and Ecca strata are involved in minor foothill folds. The age of the folding and basin formation is Triassic, i.e. post Ecca Group and pre- Beaufort Group (rocks derived from sediments that appear to be in part shed from the folded Cape Series). In the Jurassic, the Karoo basin, and in fact all of southern Africa, was subjected to a tensional regime resulting in much normal faulting, the intrusion of an enormous quantity of dolorite (diabase) (fig. 51), and the outflow of thick (up to 4,500 ft) basalt layers.
Stratigraphy
A stratigraphic section of the Karoo basin is shown in figure 51. The Cape Series is considered part of the economic basement; the sandstones are metaquartzites and in many areas attain a low grade green schist facies; the shales in many places are metamorphosed to bona fide slates (Whiteman, 1981). The Karoo Supergroup lithologic units can be recognized in many basins of southern Africa, indicating that the Karoo lithology stretched as a continuous platform deposit over a very extensive area (including parts of Antarctica, South America, and India). Each of the groups is lithologically distinctive; in ascending order they are the Dwyka Group of tillite and shales, the Ecca Group of sandstones, dark shales, and coal, the Beaufort Group of red-beds, and the Stromberg Group of red-beds and volcanics.
Oil Versus Gas Occurrence
Oil occurs where the shales have been heated by dolerite intrusions. Gas emanates from fractured shales. The source rock contains much coal. The basin is believed to be gas prone; gas is estimated to make up 70 percent of the petroleum mix.
Principal Play Attributes
Source. Dwyka and Ecca shales are rich in organic matter, including coal, though no precise organic content measurements are available. The basin appears to be mainly immature as evidenced by the presence of 1) oil shales, 2) vein bitumens, and 3) localized small oil seeps where the shales have been heated by the intrusive dolerites. The vein bitumens (asphaltite) are concentrated in an 8,800 sq mi area in deepest parts of the foredeep and are of enormous quantity (Woodward, 1964). Such veins occur in the Uinta basin of
113
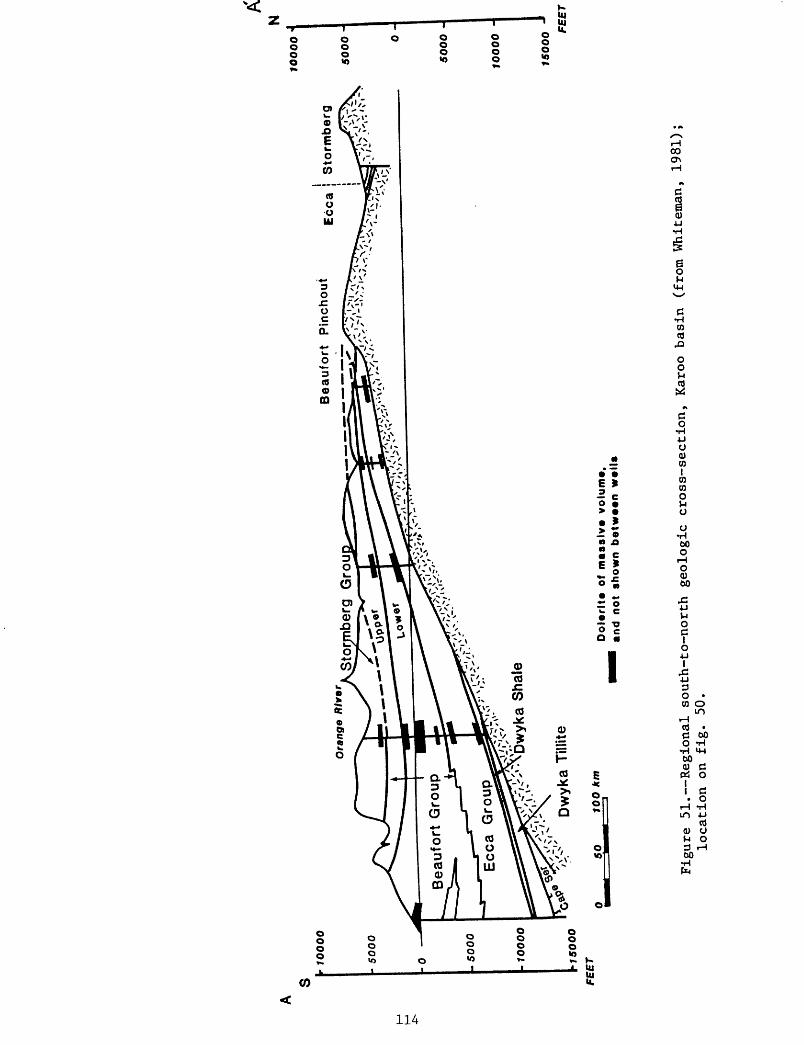
N
Do
lari
ta o
f m
as
slv
* vo
lum
e,
and
not
show
n b
etw
een
w»l
l»
10
00
0 1
50
00
H
50
00
10000
15000 F
EE
T
Fig
ure
5
1.
Reg
ion
al
south
-to-n
ort
h
geo
log
ic cro
ss-s
ecti
on
, K
aroo
b
asi
n
(fro
m W
hite
man
, 1981);
locati
on
on fi
g.
50.

the western United States where they are regarded as the product of migration of organic matter not thermally matured to oil (Jones, 1981). The source factor is discounted to 0.2, owing largely to the basin's immaturity.
Reservoirs. No very porous reservoir rock has been found in the Dwyka Group. Reservoirs of sufficient quality to contain recoverable petroleum are the Middle Ecca sandstones, confined to the northern third of the Karoo basin. These sandstones, however, are not uniformly porous and permeable. The overlying Beaufort and Stromberg Groups have some good quality reservoir sandstones, but they are lacking sufficient shale cover to be effective as traps. Reservoirs are discounted to a factor of 0.3.
Traps. Except for a few, small folds at the foot of the fold belt of the Cape Series and minor tilted fault blocks, apparently few traps have been recognized. The ubiquitous dolorite dikes and sills make meaningful seismic mapping difficult or impossible. Traps are discounted to 0.3.
Migration Timing Versus Trap Formation. The few recognized traps must have formed in the Triassic, which is about the time the foredeep reached its present depth. So, theoretically, the timing is favorable, but the lack of evidence for sufficient thermal maturity may indicate that generation and migration is yet to start. Timing is discounted to about 0.6.
Conclusions
The estimates and calculations leading to an assessment are summarized in table 17. The basin is considered in part a foreland (or craton margin) as well as a sag; therefore, Klemme's yields have been averaged for these two types of basins (see No. 5 in footnote on table 17). On this basis, the Karoo basin is estimated to have 40 million barrels of oil and .6 trillion cu ft of gas, very small amounts for such a large basin.
On the basis of the data presented, a panel of geologists from The World Energy Resources Program reached a consensus that the mode, most likely value, for undiscovered recoverable petroleum in the basin was 40 million barrels of oil and .6 trillion cu ft of gas. The precision of this consensus is indicated by the cumulative probability distribution curves of figure 52. These curves show mean values for oil of .05 billion barrels and for gas 0.60 trillion cu ft.
RIFT SYSTEM BASINS
Introduction
A system of Karoo rift basins occurs along a northeast-trending zone across southern Africa from Botswana to Tanzania and Kenya, and along the west coast of Madagascar (fig. 53). To the southwest along the northeast-trending zone, the rifting extends under the interior sag sediments of the Kalahari basin and to the northeast under the marginal sag sediments in basins of Tanzania and Kenya. Divergent rift trends are north-northwest along the south coast of Tanzania (Mandawa) and transverse along the Zambesi River valley.
A second younger system of rifts extends southward from Sudan and Ethopia in two trends through eastern Africa; the western trend apparently extends into the offshore of southern Mozambique and the eastern trend dies
115
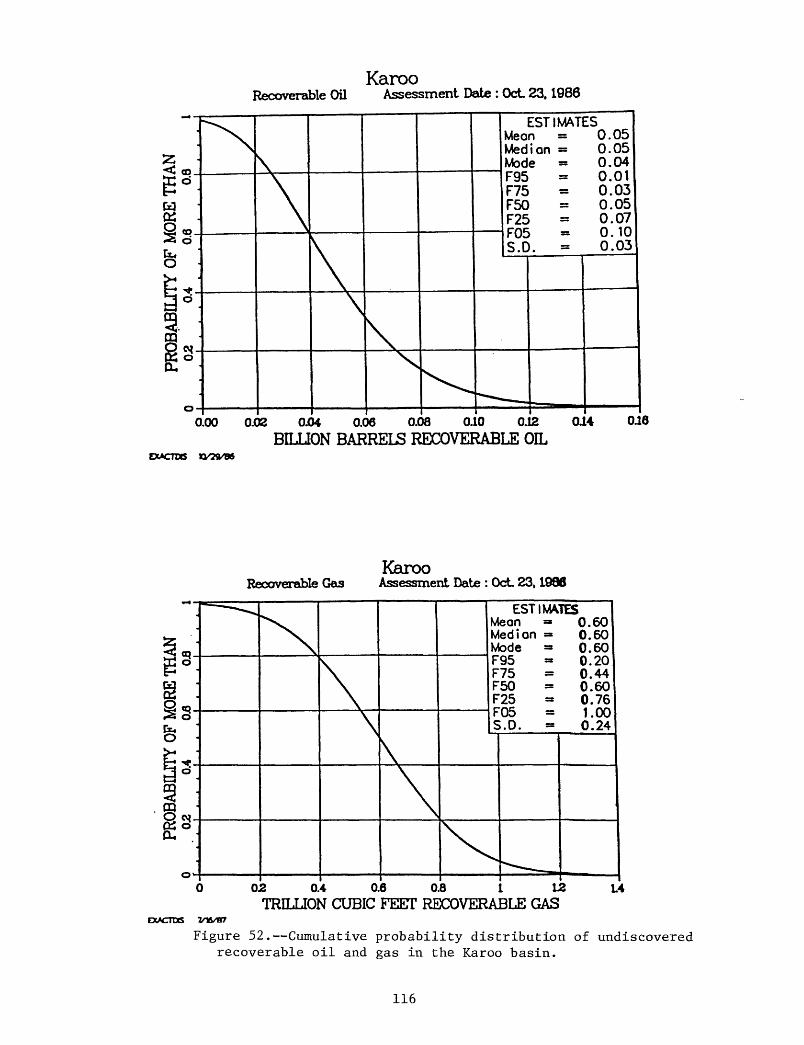
Recoverable OilKaroo
Assessment Dale : Oct 23.1986
< <n. \
0.00
\
ESTIMATES Meon = Medion = Mode = F95 » F75 = F50 = F25 = F05 - S.D. =
0.050.050.040.010.030.050.070.100.03
0.02 0.04 0.06 0.08 0.10 0.12BILLION BARRELS RECOVERABLE OIL
014 016
EXACTOS
Recoverable GasKarooAssessment Date : Oct 23,1986
^j (Q
^T\ O
Q «?-So
& :6 "<-3 °iO e\i_05 oo*
"^^^
X,\
\\
\
M M M F F F F F S
V.
ESTIMV eon =» edion = ode =» 95 75 50 25OS >.D. -
^
TES0.60 0.60 0.60 0.20 0.44 0.60 0.76 1.00 0.24
« _02 0.4 0.6 0.8 1 12
TRILLION CUBIC FEOT RECOVERABLE GASi.4
Figure 52. Cumulative probability distribution of undiscovered recoverable oil and gas in the Karoo basin.
116

CENTRAL AFRICA 4" >V V MW '^fcf * A. ^_ J.
N«og«n«
Marginal sag
Karoo rift
KARIBA - Karoo rift baaln
Figure 53. Geologic map of southern Africa showing distribution of Karoo rift basins
(modified from Blant, 1972).
117
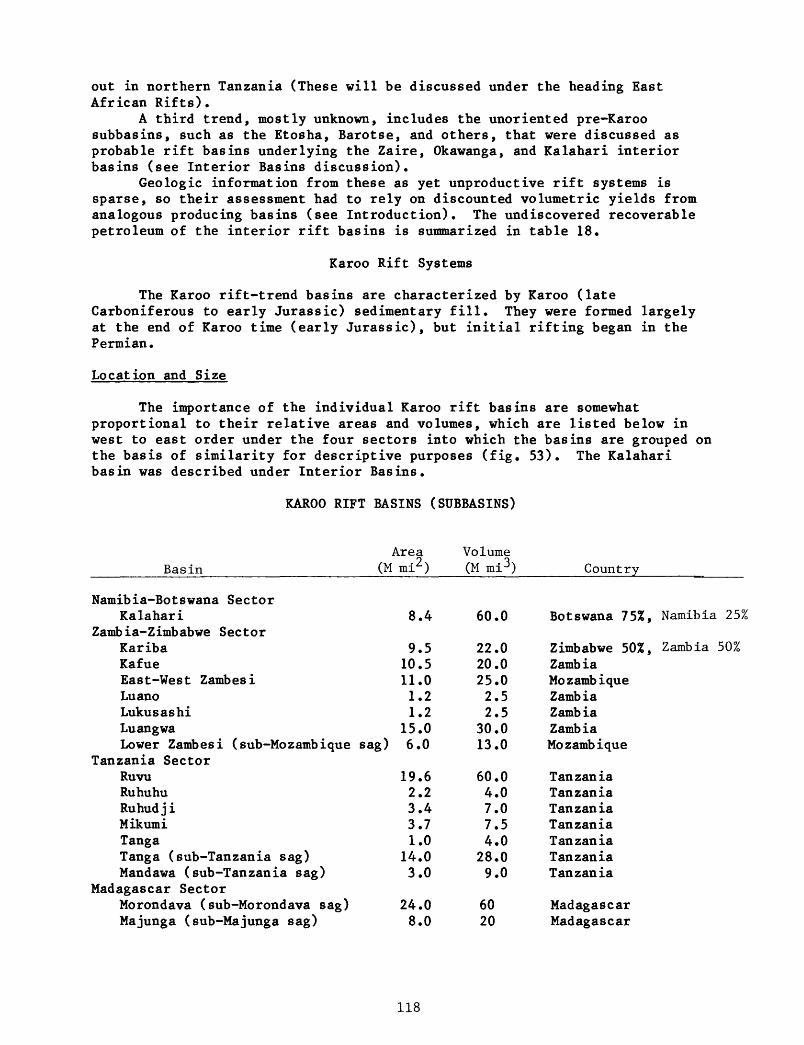
out in northern Tanzania (These will be discussed under the heading East African Rifts).
A third trend, mostly unknown, includes the unoriented pre-Karoo subbasins, such as the Etosha, Barotse, and others, that were discussed as probable rift basins underlying the Zaire, Okawanga, and Kalahari interior basins (see Interior Basins discussion).
Geologic information from these as yet unproductive rift systems is sparse, so their assessment had to rely on discounted volumetric yields from analogous producing basins (see Introduction). The undiscovered recoverable petroleum of the interior rift basins is summarized in table 18.
Karoo Rift Systems
The Karoo rift-trend basins are characterized by Karoo (late Carboniferous to early Jurassic) sedimentary fill. They were formed largely at the end of Karoo time (early Jurassic), but initial rifting began in the Permian.
Location and Size
The importance of the individual Karoo rift basins are somewhat proportional to their relative areas and volumes, which are listed below in west to east order under the four sectors into which the basins are grouped on the basis of similarity for descriptive purposes (fig. 53). The Kalahari basin was described under Interior Basins.
KAROO RIFT BASINS (SUBBASINS)
BasinArea
(M mi2 )Volume (M mi3 ) Country
Namibia-Botswana SectorKalahari 8.4 60.0
Zambia-Zimbabwe SectorKariba 9.5 22.0 Kafue 10.5 20.0 East-West Zambesi 11.0 25.0 Luano 1.2 2.5 Lukusashi 1.2 2.5 Luangwa 15.0 30.0 Lower Zambesi (sub-Mozambique sag) 6.0 13.0
Tanzania SectorRuvu 19.6 60.0 Ruhuhu 2.2 4.0 Ruhudji 3.4 7.0 Mikumi 3.7 7.5 Tanga 1.0 4.0 Tanga (sub-Tanzania sag) 14.0 28.0 Mandawa (sub-Tanzania sag) 3.0 9.0
Madagascar SectorMorondava (sub-Morondava sag) 24.0 60 Majunga (sub-Majunga sag) 8.0 20
Botswana 75%, Namibia 25%
Zimbabwe 50%, Zambia 50%Zamb iaMozambiqueZamb iaZambiaZamb iaMozambique
Tanzania Tanzania Tanzania Tanzania Tanzania Tanzania Tanzania
Madagascar Madagascar
118

Tab
le
18.
Und
isco
vere
d re
cove
rab
le p
etro
leu
m,
sou
ther
n A
fric
a-I
nte
rior
Rif
t b
asin
s D
isco
un
ted
vol
um
etri
c yie
ld a
nal
ogy
to p
rod
uci
ng
bas
ins
Reg
ion
Rif
t b
asin
and
su
bb
asin
si'
Area
Volume
(inside
3000'
isop
ach)
(MMi
2)
(MMi
3)
Discount or
risk to
pr
oduc
tive
analogs/
Tota
lSo
urce
Reservoir
Trap
Timing
Discount
(Z)
(Z)
(Z)
(Z)
(Z)
Disc
ount
ed analog (B
BOE)
Volume x Ana
log x Dis
coun
tLow
High
Most
Like
ly
(BBO
E)
Oil
togas
rati
o(Z
oi
l)
Oil
Gas
(BBO)
(TCF
G)
Nami
bia.
Bo
tswa
na,
Angola
Okawango Rifts
Etos
ha (under Okawango Interior Sag)
Okawan
go/Barotse (under Ok
awan
go In
t. Sag)
Kalahari Ri
fts
Ncojan
eNo
sop
Fassar
ge
50.0
50.0
84.0
151.0
100.0
100.
0
90.0
290.0
Pre-Karoo
(Proterozoic-
E. Pa
leoz
oic)
rift fill
.3
.3 .3
.3
.3 .4
.4
.4 .5
.007
.007
.006
.245
.245
.189
.344
.344 .266
.300
.300
.230
20 20 20
.060
.060
1.44
01.
440
.046
1.10
0
7166
17980
Zamb
ia-Z
imba
wa-M
ozam
biqu
e
Kariba
Kafue
Lukasash
iLu
ano
Luangva
East-Wes
t Zambesi
Lower
Zambesi
(und
er Mozambique M
.Sag)
22.0
20.0 2.5
2.5
30.0
25.0
13.0
115.
0
Karoo
(Permian -
E. Ju
rass
ic)
rift fi
ll
.5
.4
.030
1.
071
.5 .5.5
.4.0
30
.136
1.505
1-25
0 20
.191
-160
20
.250
6.
000
.032
.282
.768
6.76
8
i
Tanz
ania
Ruhuhu
Ruhad
Mlku
miRuvu
Tang
aTo
nga
(under Tanzania Ma
rgin
al Sag)
Mandawa
(under Tanzania Ma
rgin
al Sag)
Madagascar
Morondava
(und
er Mo
rond
ava
Marg
inal
Sag)
Majunga
(under Majunga Ma
rginal Sag)
4.0
7.0
8.0
60.0 4.0
28.0 9.0
120.0
60.0
20.0
80.0
.029
.029
.029
.050
.058
.043
.802
.040
.284
.157
1.21
8.3
01
1.12
7
.057
.399
.221
1.71
2.423
1.000
.050
.350
.175
1.50
0.360
20 15 10 15 60 60
.200
4.800
.008
.2
55.035
1.890
.026
.892
.269
7.83
7
3.60
0___
.864
1.116
4.464
.900
.216
East African
Rift
s
Mobutu-Ure
maMobutu-Ure
ma (u
nder
Mozamb
ique Ma
rgin
al Sag)
(Eastern Tertiary Ri
ft)
15Z
in ar
ea of
st
udy
45.0
21.0
(2
1.0)
3.
0 69
.0
26.0
15.0
(15.
0)2.0
43.0
East
Af
rica
n ri
fts
(Cre
tace
ous(
?) - Te
rtia
ry fi
ll)
.3
.6
.5
.6
.054
.491
.4
.5
.5
.6
.060
.315
.1
.5
.5
.6
.015
.079
I/Rift
su
bbas
ins
under
sag
are
comb
ined
with
the basins of
ta
ble
172/Klem
»e's vo
lume
tric
yield
anal
ogie
s to producing basins (i
n thousands
BOE/
mi3)
Low
High
1. In
teri
or Sa
g 20
422.
In
teri
or Ri
ft
350
492
3. Ma
rgin
al Sa
g 48
964.
Cr
aton
Mar
gin
126
200
5. In
teri
or Sag/Craton Margin
73
121
Tota
l of
al
l ri
ft basins includin
g those
unde
r sa
gs.691
.4
43
.111
tab
le
.600
60
. 3
50
30
.090
30
15
per
cent
17 b
asin
su
mm
arie
s)
- -
.360
1.
440
.105
1.
470
(.027)
(.378)
.004
.0
57
.469
2.
967
2.30
2 26
.016
.818
16
.724

The total volume of the Karoo rift basins is 312,000 cu mi. In the following discussion, the basins will be described under the above sectors.
Exploration and History
The Karoo rift basins are frontier areas. Less than a dozen holes have been drilled on the African mainland. A considerable number, over 60 holes, however, have been drilled near the tar and oil sands (equivalent to four billion barrels of oil) of the Morondava basin in Madagascar.
Exploration (of the mainland basins) has been inhibited by the initial unfavorable impression deduced by the continental nature of the Karoo sediments, the high percentage of volcanics, and the lack of seeps or shows. On Madagascar, however, exploration has been fairly intense, but unsuccessful.
Structure
The basins are elongate, generally northeast-trending, and bounded by faults. An exception to this trend is the basins along the Zambesi river (i.e. the East-West Zambesi and Lower Zambesi) and the Mandawa subbasin (fig. 53). The basins are generally asymmetric with the steeper flanks and main boundary faults on the northwestern side; exceptions are the Morondava and Tanga basins which may be affected by wrenching (figs. 53 and 54). The Karoo rifting took place largely at the end of the Karoo period, i.e., early Jurassic, but with some faulting initiating in the Permian. In some basins, however, either faulting began earlier than Karoo time, or the Karoo faulting follows earlier lines of weakness. In other cases, faulting movements continue into the Cretaceous (e.g. the Lower Zambesi basin).
The depths of the rift basins are known in only a few cases; enough cases, however, so that general estimates of basins sedimentary volume can be made (see above). Depth estimates are discussed for each of three sectors omitting the Namibia-Botswana sector described previously.
1) Zambia-Zimbabwe Sector. The Kariba basin (Lake Kariba, fig. 55, Mid-Zambesi trough, fig. 56), which is the most explored and documented owing to coal exploration, has a stratigraphic fill with maximum thickness of 11,800 ft. The adjoining East-West Zambesi basin (Zambesi River, fig. 55) has depths to basement ranging from 9,800 to 16,400 ft; Luangwa basin has a similar depth and Lukasasha and Luano basins are about the "same"; Kafue is "fairly deep" (fig. 56); and the Lower Zambesi basin is shallower (Reimann, 1986).
2) Tanzania Sector. In southern Tanzania, the Mandawa rift basin is as deep as 15,000 ft in some parts (Kent, 1965) (fig. 53). The large Ruvu basin, as indicated by magnetics, has a depth "...probably much exceeding 10,000 ft..." (Kent, 1965); the Ruvu basin extension under the Tanzania marginal sag was depressed to at least twice that depth.
3) Madagascar Sector. Depths of the Madagascar rifts are more easily estimated than those in the other sectors, because they have been more intensely explored. The depth of the Morandava basin is at least 23,000 ft and probably deeper (Whiteman, 1981). The Majunga basin is shallower, probably less than 20,000 ft (see East Coast and Madagascar Basins).
The Morondava and Majunga basins appear to be only one side of the original rift basins, the other side being along the Tanzania-Kenya coast some
120
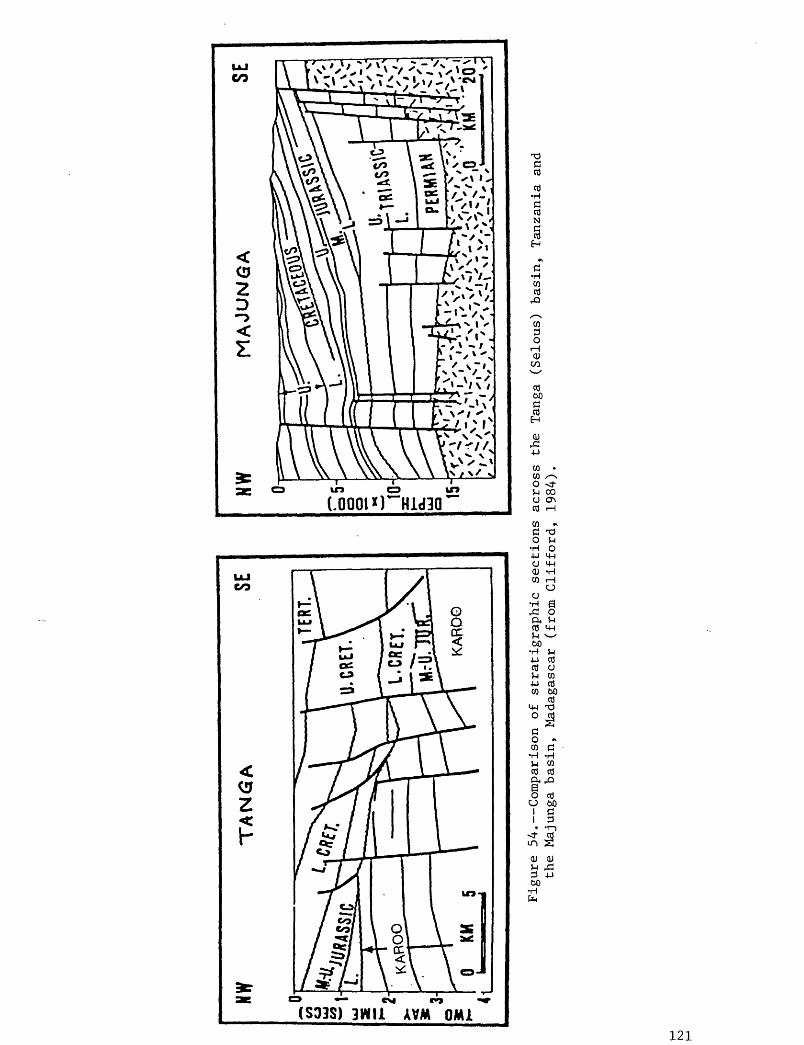
NWTANGA
SE
Figure 54. Comparison of st
rati
grap
hic
sect
ions
ac
ross
the
Tanga
(Selous) basin, Tanzania an
d the
Majunga
basi
n, Ma
daga
scar
(from
Clifford,
1984
).
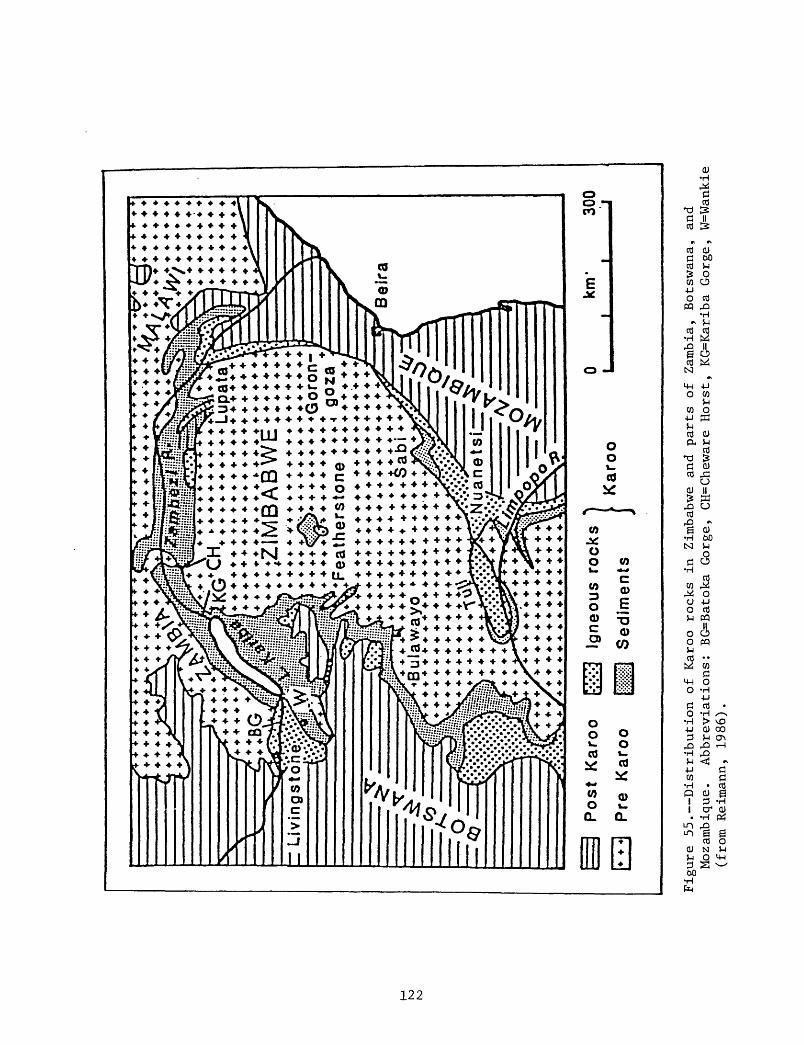
!**
**
* +
******
* *
***** *
_*y>
- ********
* * t
><
*F
-">\ *
*
* *
*v_
**********
* * *
"IP
* *
* *
^^S
KhF
J
^5-
_y** *
* *
* *
7** *
* *
* V
:*\
*^7
^ *
*******
t-rifJ
l-*
**
**
**
*-rT
- ,..,.-'
.
i V*
1 ***
****
****
*Lupata
********************
/!-':
!5A?r;
!:jJ ^ ^
-r****'*
***** *
******** »
fli
-liei
ysljj
sl *
**
**
**
**
**
* *
***********
^li/
iPV
* * *
Z1M
B A
B W
E *
* * *
* *K
$##!
:#i^
/»b\
* *
*
11 vi
u r
\u »
» i-
^.4
,***
*
^Dl:: ?A
***************
**************
******* *
Qo
ron
- r»
********* n
nya
* -
Teath
ers
tone ^
^
9
^ /
*^* *
****
***
^'l
fy** *** *
*
********
* *
* *
^-*
*^*^
-/
****
****
:*** *
* *
****
****
****
****
***
****
****
****
****
****
****
****
****
****
****
****
****
+***
**+*
*+**
******** *
***S
ab
i *
* B
ula
wayo
«
»
**
» *
****
* ******** *
***********
********************
********* *
********
********* *^i
* *
* *
Bei
ra
p^*
**.,.
+ *«
.^o>
L*»-
^.'T
::?*\
. _»
. A
. ^.
A.
j. j.
j_^^^
^^S
itei-x
-:-:v
.:-M
t*
* *
**
* *
^R
/S^-
*f*
.'«
*S
^ ^
'N
ua
ne
tsin
r^,
* *
* *
* *
****
****
**
** *****^*****
r**
*************
Po
st
Ka
roo
pre
K
aro
o
Ign
eo
us
rock
s
Se
dim
en
ts
km*
300
Karo
o
Fig
ure
55. D
istr
ibuti
on
of
Kar
oo
ro
ck
s in
Z
imba
bwe
and p
art
s
of
Zam
bia
, B
ots
wan
a,
and
Moz
ambi
que.
A
bbre
via
tions:
B
G=
Bat
oka
Gorg
e,
CH
=C
hew
are
Hors
t,
KG
=K
arib
a G
org
e,
W=W
anki
e (f
rom
R
eim
ann,
19
86
).

KA
RO
O B
AS
INS
AN
D
TR
OU
GH
S
IN Z
AM
BIA
LU
AN
GW
A
TR
OU
GH
LU
KU
SA
SH
IT
RO
UG
H
.LU
AN
O
TR
OU
GH
.KA
FU
E
TR
OU
GH
BA
RO
TS
E B
AS
IN
ZA
MB
EZ
I T
RO
UG
Hy
T-S
C
MU
16
°-
V7
/\
MA
IN
SE
DIM
EN
TAR
Y A
RE
AS
I|
BA
SE
ME
NT
C
OM
PLE
X
200
400
KM
Figu
re 56. Distribution of Karoo ro
cks
in Zambia.
Abbreviations: G=Gwembe,
KC=Kandabwe
coal
field, M=
Mule
zi,
MU=Mulungwa area,
NN=Nega Ne
ga,
SC=Scankondobo coal fi
eld,
Z=Zambezi (f
rom
Reim
ann,
1986).

1,500 mi to the north. The separation apparently occurred along a dextral wrench indicated by a north-northwest trending ridge system (Davie Ridge) just west of southern Madagascar, aligning with the African coast in northern Mozambique and southern Tanzania (fig. 53). This concept is supported by paleomagnetic and deep seismic data and by geologic and geographic fit. Figure 54 shows the close structural and stratigraphic similarity between the African coast rift trend and the rift basins of Madagascar.
If this separation is indeed the case, it indicates that source beds, of sufficient quantity to have supplied the enormous amount of tar and oil (equivalent to four billion barrels of oil) in the Morondava basin, may occur in the vicinity of the Tanzania-Kenya coast and perhaps other Karoo basins on the same southwest-northeast trend.
Stratigraphy
The principal fill of the rift basins is Karoo strata. However, in the rifted Kalahari basin, for instance, the Karoo is underlain by early Paleozoic and Proterozoic rocks that were prerift platform sediments. Similarly, the other Karoo basins along the northeast-trending rift zone may be underlain by older strata faulted into the grabens at the same time as the Karoo beds. In general, the Karoo appears to be lithologically correlatable with the type sections of the Karoo basin, i.e. carboniferous glacial beds (Dwyka Series or Group), early Permian carbonaceous sandstones and shales (Ecca Series), late Permian and late Triassic, predominantly continental red beds (Beaufort Series), and the late Triassic-early Jurassic Stromberg Series of red beds and basalts. This stratigraphic continuity indicates that although some rifting may have started in the Permian, the Karoo sedimentation is largely pre-rift and probably extended as a continuous platform cover over southern Africa (and probably parts of South America, Antarctica and India as well). Consequently, the lateral facies changes are regional in nature and not related to the later rifting. Northeastward along the rift trend, the Karoo sediments, as exemplified by the mid-Zambezi valley section (fig. 57), appear to become progressively more marine and contain more evaporites. Reportedly, the Luangwa basin of Zambia contains Karoo-equivalent or younger (Jurassic) marine strata. One percent of the strata in the Ruvu basin of central Tanzania is marine (Kreuser, 1984). In the Mandawa basin of coastal Tanzania, the equivalent strata (Triassic and early Jurassic) are mainly evaporites (8,600 ft of halite and 4,000 ft of evaporites and elastics). Further north, near the Kenya-Tanzania border, the Karoo equivalent section also has considerable thickness of evaporites. The Karoo section in the Morondava basin is stratigraphically similar to that in the Manjunga basin (fig. 54), and presumably both were once on trend with the rifts in Tanzania; they have a number of marine and lagoonal intervals up to 300 ft thick, and scattered marine fossils indicating that a much greater part of the section may be marine.
The Karoo section apparently becomes increasingly volcanic southwestward from the northeast-trending zone of interior rift basins; the Karoo sag areas of southern Zimbabwe have a relatively thin Karoo clastic section overlain by up to 8,000 ft of volcanics (fig. 54). Further southeast under the Cretaceous marginal sag of Mozambique, the Karoo has generally been considered economic basement. However, DeBuyl and Flores (1985) believe "...new seismic data indicate the local existence of possible marine or lacustrine sequences within as well as above the Karoo..." or in the Mozambique basin.
124

Ui
r ,_
f
Eur
opea
n I
Equ
ival
ents
" L
ower
Jura
ssic
Upp
er
Trl
assl
c
Upp
er
Per
mia
n
Low
er
Per
mia
n
Car
bonif
erous
I
'
|v v
1 B
asal
ts
vir
l M
uds t
on
H--
C
oal
Sei
RvSy
l S
ands
toi
K*V
| C
ongl
on
Sys
tem
MM
M^"*^""
§ (A
<
X
OS E D- P LOWE
R
_ "
... -
Ser
ies
==
==
==
==
==
==
==
==
==
==
STO
RM
BE
RG
UPP
ER
B
EA
UFO
RT
LO
WE
R
BE
AU
FOR
T
EC
CA
'
DW
YK
A
For
mat
ion
=
Bat
oka
Bas
alts
Red
San
dsto
nes
San
dsto
nes
Inte
rbed
ded
Mud
s to
nee
Esc
arpm
ent
Gri
t
Mad
umab
lsa
Mud
ston
e F
orm
atio
n
Gw
embe
Coa
l F
orm
atio
n_~
L
ower
Wan
kle
San
dsto
ne
Gla
cial
Bed
s
Thi
ckne
ss
In m 30
0
1950 40
0
700
100
150
Llt
ho-
logy
V V
V V
V
V V
Y,,,y,,
,y,,Y,
v.v:
VV
V:\\
:"v
'J-V
-ri-
r-vrT
Ty
".o
Vef
o.'b
'o/
*o*
.b"*
b" O
-QO
.'O'.O
-O
-0
°X
^=/^
O^T
lt>
^£p ^
^~
""*"
""'*
* '
* *
3£H
?£3£
r^^^^=
§£
. j 1
. . _
_ ^
1
?"^
c^.
-A'-A
-A-A
'2i
^ A
-A'A
-A-
LAVS
HC
HS
SS
r£7
] T
llll
te
~~
. U
ncon
form
ity,
dl
scon
form
lty
LOS
*r^+
rim
s in
car
bona
ceou
s sh
ales
U
WS
Upp
er W
ankl
e Sa
ndB
lone
im
B
MC
M
ain
Coa
l S
eam
ae
s M
S M
amba
San
dsto
neSS
S
lank
ondo
bo S
ands
tone
le
rate
s an
d gri
ts
Figu
re 57. Karoo stratigraphy mi
d-Za
mbez
i va
lley
, Za
mbia
(f
rom
Reimann, 19
86).

Oil Versus Gas Occurrence
In the absence of any production, it is difficult to judge the amount of gas and oil in the petroleum mix. On the basis of gas occurrences in the overlying marginal sag basin in Tanzania and Mozambique and the coaly character of the suspected source rock, the Karoo rift basins are believed to be gas-prone. The gas is estimated to make up about 80 percent of petroleum mix over most of the region, ranging up to 90 percent in deeper subbasins, such as the Tanga rift basin, under the Tanzania marginal sag. In the basins of the Madagascar sector, where the seals are poor and where large oil seeps occur, the gas is judged to make up only 40 percent of the mix.
Principal Play Attributes
Source. 1) Zambia-Zimbabwe Sector. Some source rocks are present in the lower part of the Karoo type sections (Dwyka and Ecca Groups of the Karoo basin). In the Kariba basin, and presumably adjacent Zimbabwe and Zambia basins, the equivalent Gwembe Formation and lower portions of the Mudumabisa Mudstone consist mainly of coal seams and carbonaceous mudstone indicating a high total organic content (fig. 57). Because this material is exclusively higher plant forms, a type III kerogen may be expected. Some algal limestones indicate possible type I kerogen. Assuming a thermal gradient of 1.6° F/100 ft and a subsidence rate of 140 ft per million years, the top of the Kariba basin oil window is close to the depth of the basin limiting the volume of source rock. The source factor for this sector was discounted to 0.3.
2) Tanzania Sector. Further northeast in Tanzania, the Mandawa well found excellent source beds (Kajato, 1982), presumably the shales interbedded with the evaporites. Dark shales some 2,000 ft thick are reported in the Mikumi basin, presumably lacustrine (fig. 53). About 1 percent of the Mikumi section is marine. In the adjoining Ruvu basin, 300 ft of dark deltaic swamps or flood plain shales are reported. Source rock studies of the principal Karoo rift basins of Tanzania showed total organic carbon from selected outcrop samples ranging from 0.2 to 2.4 percent and averaging about 0.85 percent (Kreuser, 1984). One would expect better source richness in Tanzania judging by the evaporites and marine influence, but Kreuser*s report indicates otherwise. Based on the low ratio of exsudatinite to micronite in outcrop samples, Karoo strata of the Tanzania rifts were judged over-mature, but admittedly this low ratio may be in part the effects of weathering (Kreuser, 1984). Largely on the basis of Kreuser's report, the Tanzania Karoo source factor is discounted to about 0.3. The single exception is the Mandawa basin, where oil occurs and good source rock are reported, which is discounted only to 0.7.
3) Madagascar Sector. No source measurements are available from the Madagascar basins, but the presence of tar and oil sands equivalent to 2 BBO assures the presence of substantial quantities of source rock. There is some concern that the source may now be largely depleted. The source at Morondava basin is discounted to 0.8 and the shallower Majunga to 0.6.
Reservoir. 1) Zambia-Zimbabwe Sector. Very little precise information concerning Karoo reservoirs is available. In the type section, i. e. Karoo basin, the reservoirs are generally poor to fair. The existence of at least
126
one aquifer sandstone in the Kalahari indicates some reservoirs probably exist. Within the definite interior rift, such as the Kariba basin (fig. 57), "some excellent reservoir rocks" are reported (Reimann, 1986). The east-west trending Zambezi basin has "a similar sequence with source and reservoir rock" (Reimann, 1986). The Luangua, and presumably adjoining basins, has "suitable reservoir rocks", i. e. sands of the Luwumbu Formation. Considering only those reservoirs in the lower part of the Karoo section (Ecca and Dwyka Formations) where there is sufficient seal, and excluding the continental coarse elastics of the upper Karoo, the reservoirs are believed to be only fair and are discounted to about 0.5.
2) Tanzania Sector. Aside from the observation that "the sequence began with conglomerates and sandstones, siltstones and shales" (Kajato, 1982) little mention is made of reservoir quality in central Tanzania. The sedimentary section in north central Tanzania (Mikumi basin) is indicated to have many sandstones ranging from unsorted conglomerate basal sandstones to a coarse deltaic clastic more than 4,000 ft thick, with only minor finer grained intercalations. Similar sandstones are reported in the adjacent Ruvu basin. These sandstones, however, appear to be mainly of the continental Beaufort Group of the upper Karoo Supergroup with little connection with the lower Karoo source strata; further they have little cover. It appears that effective reservoirs of the Tanzania region must be rated somewhat less than in the Karoo and Zambia/Zimbabwe basins. The reservoir factor is discounted to 0.4 for the Tanzania rift basins, except for Mandawa rift where the reservoirs are apparently even poorer, perhaps 0.3.
3) Madagascar Sector. For Madagascar, no detailed reservoir information is available. Whiteman (1981) states that "potential reservoir sands occur in all formations from the Permian to the Paleogene". Probably they are somewhat better than the fair to poor quality sandstones of the Karoo type section; the reservoir factor is discounted to about 0.6.
Traps. No information is available, but it is assumed that the principal traps would be fault and drape closures associated with the horst and graben features usually predominant in rifted basins. Such traps are not as effective as closed anticlines because they depend on fault seals and, in the case of drapes, often on low amplitude closures. An average discount of about 0.5 is estimated in the Zambia/Zimbabwe region. The traps are judged to be somewhat better in Tanzania where thicker shales and more evaporites are better seals to the lower Karoo reservoirs; these traps are discounted to 0.6. In Madagascar, the shales are less developed and there appears to have been substantial flushing; traps are discounted to 0.3.
Migration Timing Versus Trap Formation. In the usual situation, in all the Karoo basins, rift-associated faulting, subsidence, and trap formation were more or less contemporaneous. They began in the late Carboniferous, reached a culmination in the early Jurassic, and largely ceased soon afterwards. Heat gradients were usually moderate so that a subsidence of some 10,000 ft was required before potential source rock reached thermal maturity. This depth in most cases was attained at the end of the period of maximum subsidence (early Jurassic). Owing to the delay between initial trap formation (late Carboniferous) and initial petroleum generation/migration (early Jurassic), reservoir deterioration probably occurred. I believe the timing is generally poor and have rated it, with few exceptions, at 0.4.
127

Conclusions
The estimates and calculations to arrive at an assessment of the oil and gas in the Karoo rift basins are shown in table 18. Note that if the rifts under the marginal sags of Mozambique, Tanzania, and Madagascar are included, undiscovered petroleum resources amount to 1.67 billion barrels of oil and 19.07 trillion cu ft of gas in these Karoo rift basins.
On the basis of the data and estimates presented, a panel of geologists from The World Energy Resources Program reached by consensus an assessment on the undiscovered, recoverable oil and gas in the Karoo rift basins. This assessment covered separately the two principal areas of rifting, Zambia, and Tanzania.
The Zambia assessment, as indicated by the resulting cumulative probability distribution curves (fig. 58), shows modal, most likely, values of .30 billion barrels of oil and 6.00 trillion cu ft of gas and mean values of .39 billion barrels of oil and 8.14 trillion cu ft of gas.
The Tanzania assessment included the estimated oil and gas for the whole country including the large Tanzania basin as well as the rift basins (see discussion for Tanzania Basin, p. 145-152. If the Tanzania basin is subtracted out, the Tanzania rift basins have approximate mean values of .34 billion barrels and 9 trillion cu ft of gas. This gives the combined Karoo rift system (exclusive of the Karoo subbasins beneath the Mozambique, Tanzania, and Madagascar marginal sag basins) mean values of .73 billion barrels and 17.14 trillion cu ft.
East African Rift System
Location and Size
The so-called East African Rifts are in two north-south trending systems of rifting; their position north of Mozambique is indicated by the lake distribution (fig. 59). The western trend (the Mobutu-Urema Trend) extends southward from Lake Mobutu (Edward) down the line of lakes along the length of the east boundary of Zaire, along the southwestern boundary of Tanzania, with an offset to the east, along the eastern side of Malawi, and joins the Urema Rift of the Mozambique basin. The trend continues, bifurcating somewhat through the length of Mozambique and out onto the offshore continental shelf near Maputo in southernmost Mozambique (see discussion and map, figure 63, in the Mozambique basin). The area of the trend is approximately distributed as follows: Zaire 27%, Uganda 12%, Tanzania 32%, Rwanda 2%, Burundi 2%, Malawi 20%, and Mozambique 5%. The eastern trend extends southward from the Afar triangle and Rift Valley of central Ethiopia through western Kenya into Tanzania where it bifurcates and dissipates (fig. 59).
The eastern rift system is young, volcanic, shallow, and extends only a little way (5%) into Tanzania and the area of study, i. e. southern Africa. Its potential in the area of study is regarded as negligible.
Structure
The western trend, the Mobutu-Urema Trend, however, does have potential. It has an estimated area of 45,000 sq mi and a sedimentary volume of 26,000 cu mi (excluding that segment which underlies and is combined with the Mozambique
128

n «
B 3
oo?»
ft
:r
o I
to 3-
»
MI
iM
B
n§
rt
B
g3-0
* O
Bn
n c
cH
<»
<
ft
MP
- H
B
3"
»
Ml
(B
<D
ftft
B
H
* 3
P
-O
C
3
<
ft c i
»H
H
-0
>
SO
U
MlT
3n
o. »
-* H
Ha.
o
i p-
o«:
oo
-O
P
- 00
»
»
MI ft
n a*
3-
>- ^ p
-ft
»<
f M
3-
ft
C
P-
»
31
P-
S
ft(B
3
3 X
PH
H
?
O.
g-
S
S ?
£
p
- N
N
ft
S
S £p
.rl
M
. I*
»
O
*.
n b
b
3 C
oo
» ft
P. a
- ^-
P-
o it
a
o 3
B n
p 3
H-
re
CIB
7f
Ml
P-
Ml
C
OM
l <~
. P
-
Hft
M
i 00
tt
P-
C
B
Cp
-OQ
H
3"
S
fi
S
n p.
a.
B
H
P-
p. n
01
B
3
O p
O
B
-J
** b
O
U>
M
l <
r
P
- O
*o
c»
ft
i- a
Pri
- E
- Z
8B
R
o* q
B n
» 3
o B
- n
o n
B
MB
B
B
It
It
O*
ft
S
3
O*
p- p
. s
a. M
3 B
rt
nn
S M
a. f
t o
a o
t:n
3 B
a.
O w
oo
00
B
0»
PROB
ABIL
ITY
OF M
ORE
THAN
0o-
01
-
Q-
bi-
1
«
02
0.4 f-
1 o y i )
»-
V- -
^S
o.e
^
> U
.C
^
\ i
t/) -n
-rn
~n
-n 5
; s: 2
:
o to
ai -
vj to
6^ «
a
Ou
itn
oin
cn
aa
o
« 3
m
o in
3
H
II II
II II
11 II
II 11
II ^ -H r
-*
tooj O
HO v
j en
-tk a
> xi
ODo
ovjtrJ
an
OQ
OJ-'
MO
OJC
JO
4O
OU
-N
$ i- -ff ? \ n 3- y ff S co CO OS
H
O*
Ml
tt
It
BB
rt
P
- 3"
S
B
A
B
3"
P-
p-
rt
p.
n s
MI
3- »
g-f
t n
PROB
ABIL
ITY
OF M
ORE
THAN
02
0.4
0.6
0.8
33
O
O 2
n
H CD > CO z CO
N 33 m
o o z

ETHIOPIA
SUDAN «--v
/L.ABAYA
NLSTEFANIE
I N Dl AN
OCEANTANZANIA
WL.RUKWA
EAST AFRICAN RIFT VALLEYS
4-
0 KILOMETERS SOO I I I II
Figure 59. East African rift valleys (from McGrew, 1983).
130
basin). This southward extension into the Mozambique basin adds a volume of 15,000 cu mi.
The Mobutu-Urema trend appears to be partly of Cretaceous age or at least follows a Cretaceous rift trend, in the south, i.e. in Mozambique. Initial work indicates that north of Mozambique, the trend is largely Tertiary, but exploration is very immature, i.e. few wells have been drilled, and perhaps older and deeper strata may underlie the Tertiary in the northern part of the trend as well. Two grabens older than the Mobutu-Urema Trend intersect the Lake Malwai trough at an oblique angle. The nature of the faulting is indicated by a structural map and cross-section of the Lake Malawi trough (figs. 60, 61).
Stratigraphy
The cross section of Lake Malawi (fig. 61) may be considered typical, especially of the rift grabens of the trend north of Mozambique. In this section the strata reach a thickness of about 4,000 ft. More than 10,000 ft occur in the northern part of Lake Tanganyika, there the basal beds are considered early Miocene or older on the basis of accumulation and compaction studies (Degens et al., 1971 in Rosendahl and Livingstone, 1983). The Urema Graben to the south in Mozambique appears to be a continuation of the rift system southwards where it extends under the Quaternary cover of the Mozambique basin (see discussion on p. 136 including figures). The age of the strata accompanying the rifting becomes progressively older southward under the Mozambique sag. Faulting of the Urema Graben in Mozambique is judged to have been active from Upper Cretaceous to late Tertiary (DeBuyl and Flores, 1986). The more southern on-trend Pungue-Chessenga Graben is considered a mid-Cretaceous feature and further south the faulting bounding the on-trend "Southern Rift" is obviously of mid-Cretaceous age and ceased all activity by late Cretaceous (fig. 65). The lithology of these Cretaceous beds are surmised from seismic data to be largely sandstones and shales.
The Tertiary strata, as can be determined from outcrops, piston cores of lake beds, and seismic interpretation, also appear to be sandstones and shales. The sandstones, in the form of deltaic sandstones, subaqueous fans, and turbidites, are good reflectors, but the highly organic sediments (oozes at shallow depths becoming stratified with depth) are relatively acoustically transparent (fig. 61).
Oil Versus Gas Occurrence
Gas seeps are active around the rift lakes resulting in methane-charged lake-beds. However, the rich organic lacustrine shales, which seem to be the main potential source rock, would indicate Type I kerogen and I believe the petroleum would be mostly oil, perhaps about 60 percent. The deeper part of the trend, beneath the Mozambique marginal sag, would be more gassy, maybe 30 percent oil.
Principal Play Attributes
Source. In most of the area, i. e. north of Mozambique, the Tertiary shales are extremely rich, such that they affect the quality of seismic reflections, and some strata are described as biogenic oozes. The lake bottom sediments of Lake Kivu (600 sq mi), according to Petroconsultants, are methane saturated amounting to reserves of 2 TCF, presumably of biogenic origin. The
131

STRUCTURAL GEOLOGY OF LAKE MALAWI
BOUNDARY FAULTS
v\ MODERN FAULTS
"\ BURIED FAULTS
"^ »CAR ZONES
\ CENOZO« FAULTS
% UEJOZOtC FAULTS
MONOCUNES
Figure 60. Structural map, Lake Malawi, East Africa (from Rosendahl and Livingstone, 1983).
132

UN
CO
NF
OR
MIT
Y
-2
I [M
ALA
WI
GR
OU
P
0 K
ilom
eter
s 5
i _
__
_i
m NYASA GROUP
I | NYANJA GROUP
>:.. :
2-
Figure 61. Interpretation of
a
seis
mic
prof
ile
across La
ke Ma
lawi
, East Africa (f
rom
Rose
ndah
l and
Livingstone) sh
owin
g position of
line of
fi
g. 60
.
00
OJ

limiting factor, for oil at least, is the amount of organically rich shales that are thermally mature. The thermal gradient in the northern, Miocene to recent, rift system is not known but is presumed to be very high, probably causing strata to be thermally mature as shallow as 5,000 ft. In this case, those parts of the rift system in which source beds have subsided to that depth could be petroleum bearing. From data presently at hand, the northern Lake Tanganyika, with over 10,000 ft of sediment, qualifies; and other grabens, as yet unexplored, may also qualify. Largely because of the apparent shallowness of the trend north of Mozambique I discount the source at 0.3. In the Mozambique area, the rift system is deeper and older but the excellent source richness of the northern trend has not been reported. I discount the source in the grabens of this area to about 0.4.
Reservoirs. Reportedly there are potential reservoirs in the form of delta sandstones, submarine fans, and turbidites. However, no measurements of reservoir characteristics are available and I assume, for assessment purposes, that though probably not ideal, they may be adequate and discount them to 0.6 and perhaps 0.5 under the Mozambique marginal sag.
Traps. Traps are probably present though apparently no closures have been mapped as yet. Closures are largely in the form of fault traps or drapes (fig. 60). This form of trap is not as efficient as folds, but may suffice. I discount the traps to 0.5.
Migration Timing Versus Trap Formation. North of Mozambique, traps began to form with the faulting of early Miocene in the Mobutu-Urema trend. Subsidence to 5,000 ft, the estimated depth to the oil window (assuming a constant thermal gradient and subsidence rate), must have occurred in the Pliocene or Pleistocene. In Mozambique, traps began forming in the Cretaceous but potential source rock probably did not reach maturation depths until about the end of the Cretaceous. In both cases the traps were in place before migration, perhaps allowing time for reservoir deterioration. I discount migration timing to 0.6.
Conclusions
The estimates and calculations used in arriving at an assessment of the East African Rift are summarized in table 18. The total of the estimated undiscovered oil and gas for this trend is .5 billion barrels of oil and 2.0 trillion cu ft of gas.
On the basis of the above data and estimates, a panel of geologists from The World Energy Resources Program reached a consensus of the amount of undiscovered recoverable oil and gas in the East African rift basins. The modal, or most likely, estimate of the consensus was .5 billion barrels of oil and 2.0 trillion cu ft of gas. Derived from the consensus, cumulative probability distribution curves were drawn (fig. 62) which show mean values for undiscovered oil and gas of the East African rifts distributed as follows:
134
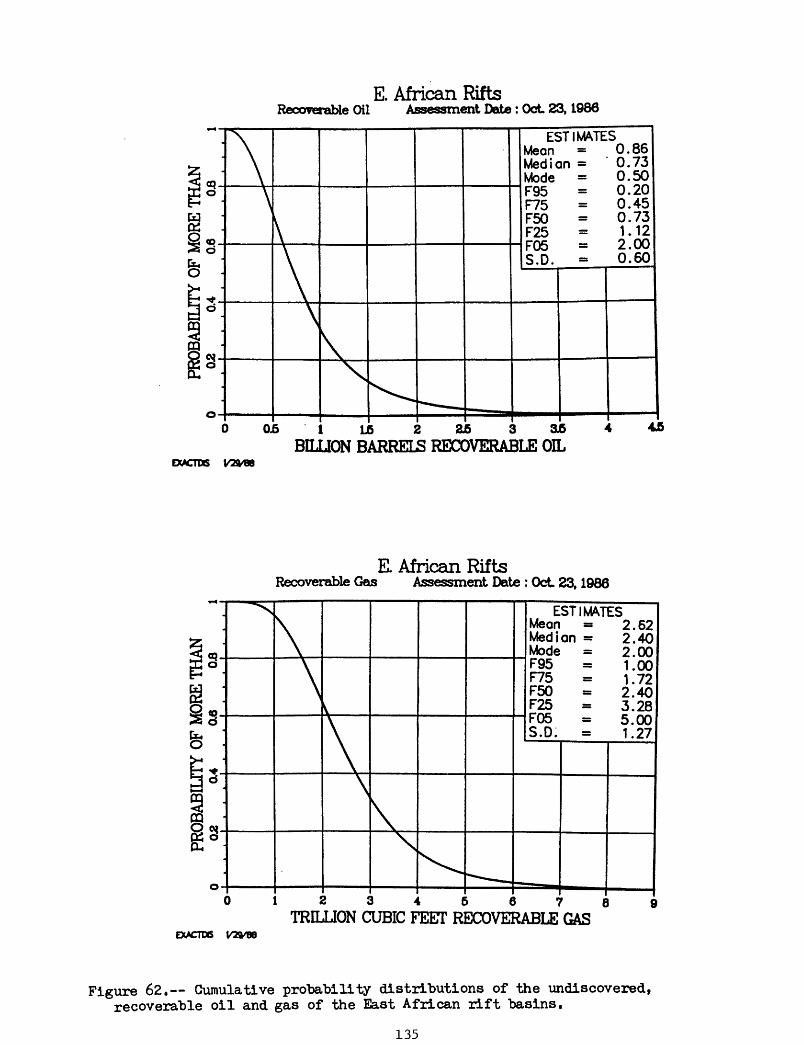
E. African RiftsRecoverable Oil Assessment Date: Oct 23,1986
\^
V
\\\
"
ESTIMATES Mean = 0.86 Median = 0.73 Mode = 0.50 F95 = 0.20 F75 = 0.45 F50 = 0.73 F25 = 1 . 12 F05 = 2.00 S.D. = 0.60
MB
0.5 1 L6 2 2J5 3 a6BILLION BARRELS RECOVERABLE OIL
45
Querns
E. African RiftsRecoverable Gas Assessment Date : Oct 23,1986
§- o
d
o-
\\
X\x^^- .
ESTIMATES Mean « 2.62 Median - 2.40 Mode = 2.00 F95 m 1.00 F75 « 1.72 F50 - 2.40 F25 . 3.28 F05 = 5.00 S.D. = 1.27
==3 BHB^^__
1234567TRILLION CUBIC FEET RECOVERABLE GAS
Figure 62. Cumulative probability distributions of the undiscovered, recoverable oil and gas of the East African rift basins.
135
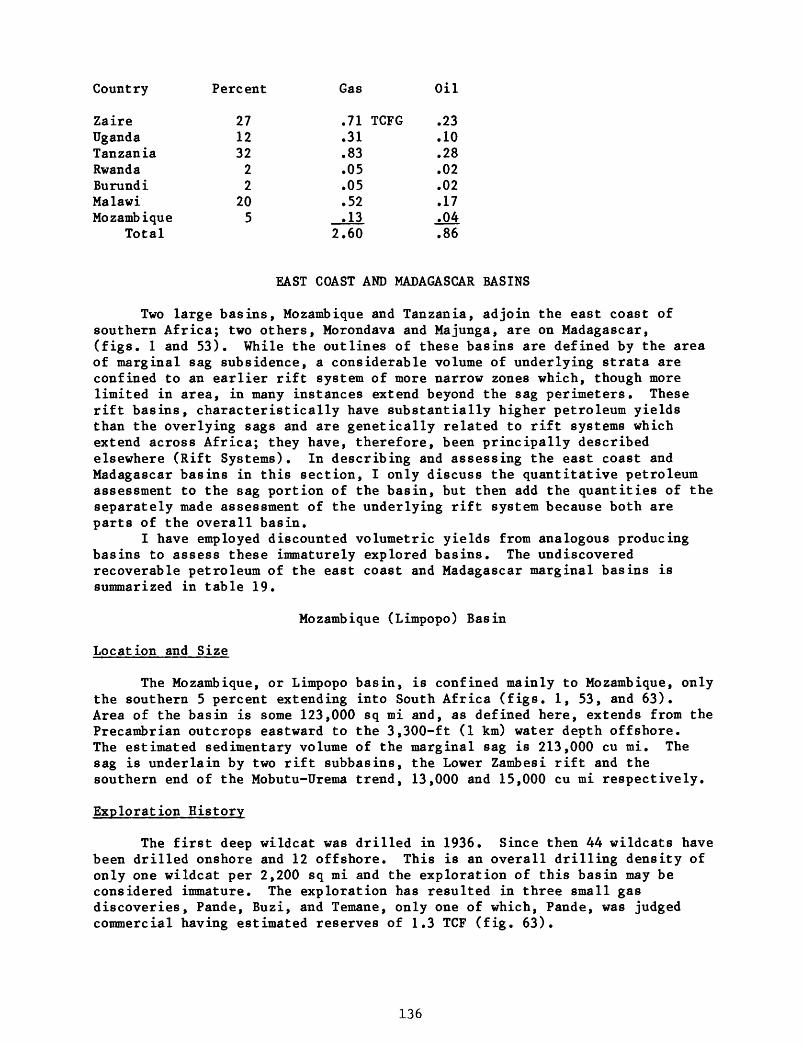
Country Percent Gas Oil
Zaire 27 .71 TCFG .23Uganda 12 .31 .10Tanzania 32 .83 .28Rwanda 2 .05 .02Burundi 2 .05 .02Malawi 20 .52 .17Mozambique 5 .13 .04
Total 2.60 .86
EAST COAST AND MADAGASCAR BASINS
Two large basins, Mozambique and Tanzania, adjoin the east coast of southern Africa; two others, Morondava and Majunga, are on Madagascar, (figs. 1 and 53). While the outlines of these basins are defined by the area of marginal sag subsidence, a considerable volume of underlying strata are confined to an earlier rift system of more narrow zones which, though more limited in area, in many instances extend beyond the sag perimeters. These rift basins, characteristically have substantially higher petroleum yields than the overlying sags and are genetically related to rift systems which extend across Africa; they have, therefore, been principally described elsewhere (Rift Systems). In describing and assessing the east coast and Madagascar basins in this section, I only discuss the quantitative petroleum assessment to the sag portion of the basin, but then add the quantities of the separately made assessment of the underlying rift system because both are parts of the overall basin.
I have employed discounted volumetric yields from analogous producing basins to assess these immaturely explored basins. The undiscovered recoverable petroleum of the east coast and Madagascar marginal basins is summarized in table 19.
Mozambique (Limpopo) Basin
Location and Size
The Mozambique, or Limpopo basin, is confined mainly to Mozambique, only the southern 5 percent extending into South Africa (figs. 1, 53, and 63). Area of the basin is some 123,000 sq mi and, as defined here, extends from the Precambrian outcrops eastward to the 3,300-ft (1 km) water depth offshore. The estimated sedimentary volume of the marginal sag is 213,000 cu mi. The sag is underlain by two rift subbasins, the Lower Zambesi rift and the southern end of the Mobutu-Urema trend, 13,000 and 15,000 cu mi respectively.
Exploration History
The first deep wildcat was drilled in 1936. Since then 44 wildcats have been drilled onshore and 12 offshore. This is an overall drilling density of only one wildcat per 2,200 sq mi and the exploration of this basin may be considered immature. The exploration has resulted in three small gas discoveries, Pande, Buzi, and Temane, only one of which, Pande, was judged commercial having estimated reserves of 1.3 TCF (fig. 63).
136

SUMMARY
Table
19.
Undiscovered recoverable
petr
oleu
m, so
uthe
rn A
frica
east
coaat
Marginal baaing (i
nclu
ding
un
derl
ying
ri
fts)
Discounted vo
lume
tric
yield
anal
ogy
to producing
basins!/
Basi
n Subbaain
Age
Area
Volu
me
Discount or
riak to p
roductive
anal
og(i
naid
e 30
00'
isopachT
(MMi
2)Source
(*)
Reservoir
(I)
Mota
mbiq
ue (L
impo
po)
Marginal Sag
Lowe
r Zambesi
Rift
Mobuto-Urema Rift
Tanzania
Marg
inal Sag
Tanga
Rift
Mand
awa
Rift
Morondava
Marg
inal Sag
Rift
Maju
nga
Marginal Sag
Rift
E. Cr
et. -T
erti
ary
123.
0Karoo
Cret. -Tertiary
E. Jur. -Tertiary
Karo
oKaroo
E. Jur. -Te
rtia
ryKa
roo
E. Ju
r. -Te
rtia
ryKa
roo
^/Klemme ' s volumetric
yie
ld an
alog
iea
to
1. Interior
2. Interior
3. Marginal
Low
Sag
20Rift
350
Sag
A84. Craton Mar
tin
126
5. Interior
Sag/
Crat
on M
argi
n 73
6.0
21.0
43.0
1A.O 3.0
66.0
2A.O
20.0 8.0
prod
ucin
g
High A2 492 96
200
121
213.0
13.0
15.0
120.0
28.0 9.0
169.0
60.0
49.0
20.0
basi
ns (in
.4 .3 .4 .7 .3 .7 .4 .8 .3 .6
thousand
.6 .5 .5 .4 .4 .3 .5 .6 .5 .6
BOE/
Mi3)
Trap
(t) .3
.5
.5 .5
.6 .6
Timi
ng
(t) .6
.4
.6 .7
.4
.A
Total
Discount
(I)
.OA3
.0
30
.060
.098
.029
.050
.016
.058
.012
.043
Disc
ount
ed an
alog
(B
BOE)
Volu
me x An
alog
x
Disc
ount
Low
High
.A39
.136
.315
.565
.284
.157
.130
1.21
8
.028
.301
.879
.191
.443
1.128
.399
.221
.260
1.71
2
.056
.A23
Most
li
kely
(BBOE)
.650
.160
.350
.750
.350
.175
.190
1.500
.OA5
.3
60
Oil
togas
ratio
(t oil)
20 20 30 20 10 15 60 60 60 60
Tota
l
Oil
Gas
(BBO)
(TCF
G)
.130
3.
120
.032
.7
68.1
05
1.47
0.2
67
' 5.
358
.150
3.600
.035
1.89
0.026
.892
.211
6.38
2
.11A
.456
.900
3.60
01.
014
A.05
6
16.7
68
Co
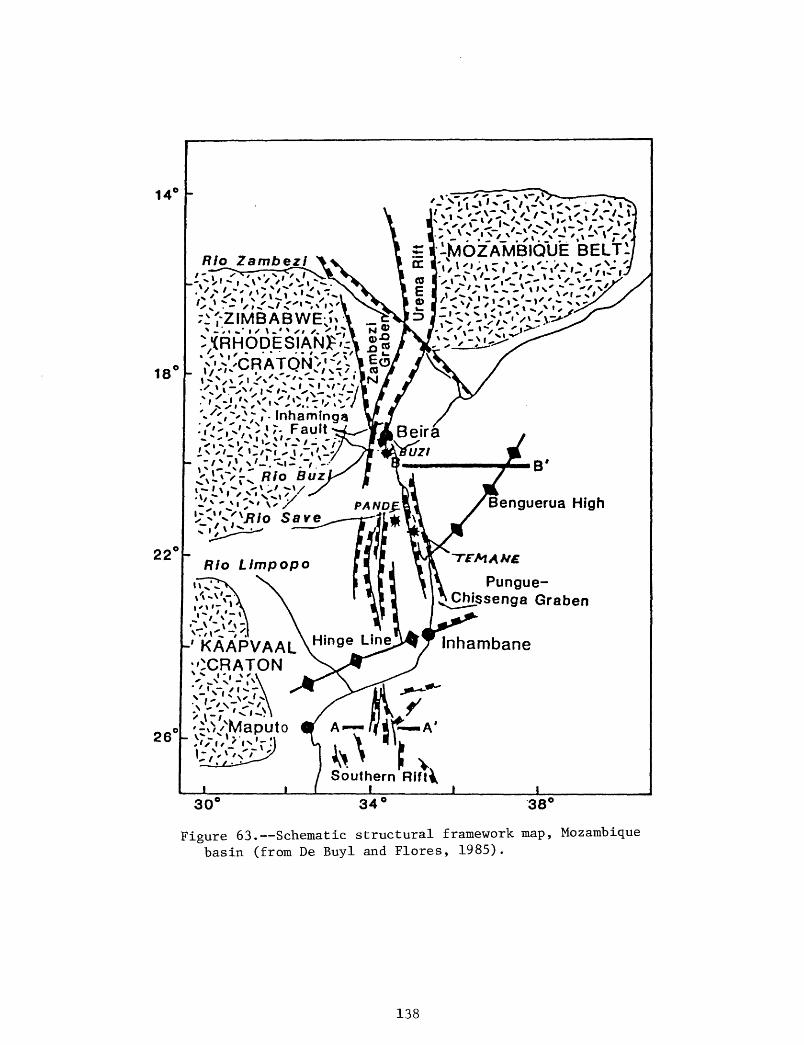
14'
18
22'
26'
IMOZAMBIQUE BELTl
ZIMBABWE
» 'i^'*/" |V ' 'nhamlnga
Benguerua High
Rio Limpopo
-'kAAPVAAL\HJn9eL1 InhambaneCRATON
Pungue- Ch]_ssenga Graben
Southern Rifti ___I_______i
30° 34 38°
Figure 63. Schematic structural framework map, Mozambique basin (from De Buyl and Flores, 1985).
138
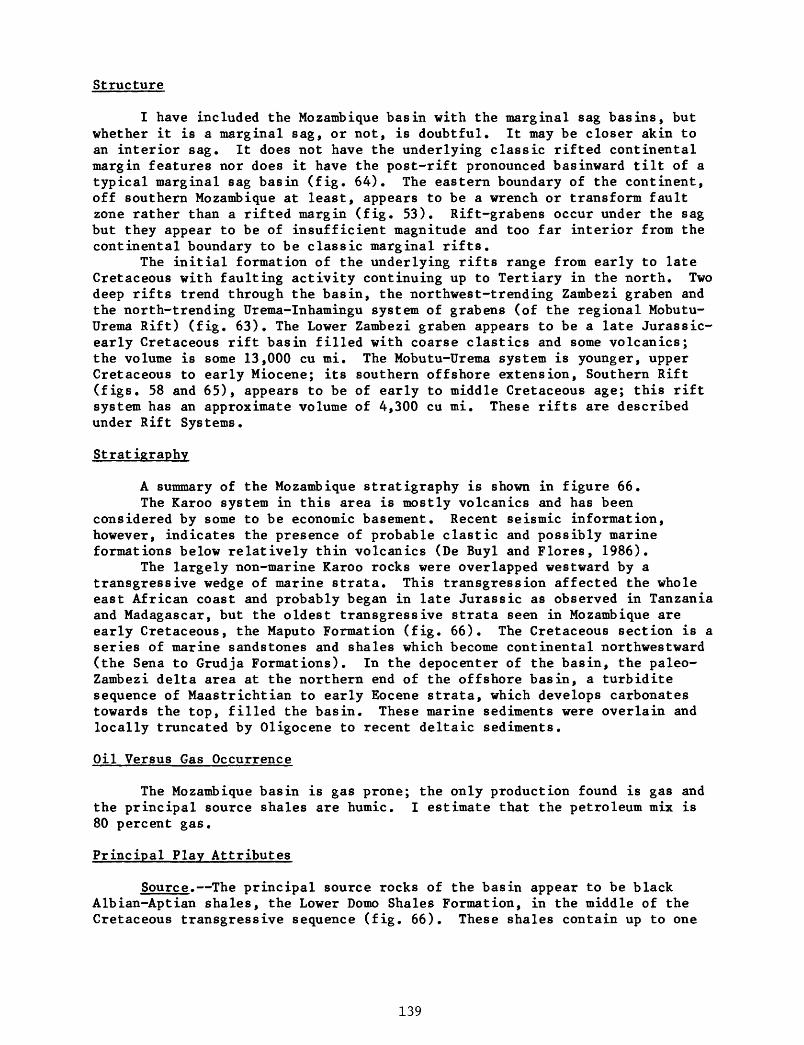
Structure
I have included the Mozambique basin with the marginal sag basins, but whether it is a marginal sag, or not, is doubtful. It may be closer akin to an interior sag. It does not have the underlying classic rifted continental margin features nor does it have the post-rift pronounced basinward tilt of a typical marginal sag basin (fig. 64). The eastern boundary of the continent, off southern Mozambique at least, appears to be a wrench or transform fault zone rather than a rifted margin (fig. 53). Rift-grabens occur under the sag but they appear to be of insufficient magnitude and too far interior from the continental boundary to be classic marginal rifts.
The initial formation of the underlying rifts range from early to late Cretaceous with faulting activity continuing up to Tertiary in the north. Two deep rifts trend through the basin, the northwest-trending Zambezi graben and the north-trending Urema-Inhamingu system of grabens (of the regional Mobutu- Urema Rift) (fig. 63). The Lower Zambezi graben appears to be a late Jurassic- early Cretaceous rift basin filled with coarse elastics and some volcanics; the volume is some 13,000 cu mi. The Mobutu-TJrema system is younger, upper Cretaceous to early Miocene; its southern offshore extension, Southern Rift (figs. 58 and 65), appears to be of early to middle Cretaceous age; this rift system has an approximate volume of 4,300 cu mi. These rifts are described under Rift Systems.
Stratigraphy
A summary of the Mozambique stratigraphy is shown in figure 66.The Karoo system in this area is mostly volcanics and has been
considered by some to be economic basement. Recent seismic information, however, indicates the presence of probable clastic and possibly marine formations below relatively thin volcanics (De Buyl and Flores, 1986).
The largely non-marine Karoo rocks were overlapped westward by a transgressive wedge of marine strata. This transgression affected the whole east African coast and probably began in late Jurassic as observed in Tanzania and Madagascar, but the oldest transgressive strata seen in Mozambique are early Cretaceous, the Maputo Formation (fig. 66). The Cretaceous section is a series of marine sandstones and shales which become continental northwestward (the Sena to Grudja Formations). In the depocenter of the basin, the paleo- Zambezi delta area at the northern end of the offshore basin, a turbidite sequence of Maastrichtian to early Eocene strata, which develops carbonates towards the top, filled the basin. These marine sediments were overlain and locally truncated by Oligocene to recent deltaic sediments.
Oil Versus Gas Occurrence
The Mozambique basin is gas prone; the only production found is gas and the principal source shales are humic. I estimate that the petroleum mix is 80 percent gas.
Principal Play Attributes
Source. The principal source rocks of the basin appear to be black Albian-Aptian shales, the Lower Domo Shales Formation, in the middle of the Cretaceous transgressive sequence (fig. 66). These shales contain up to one
139
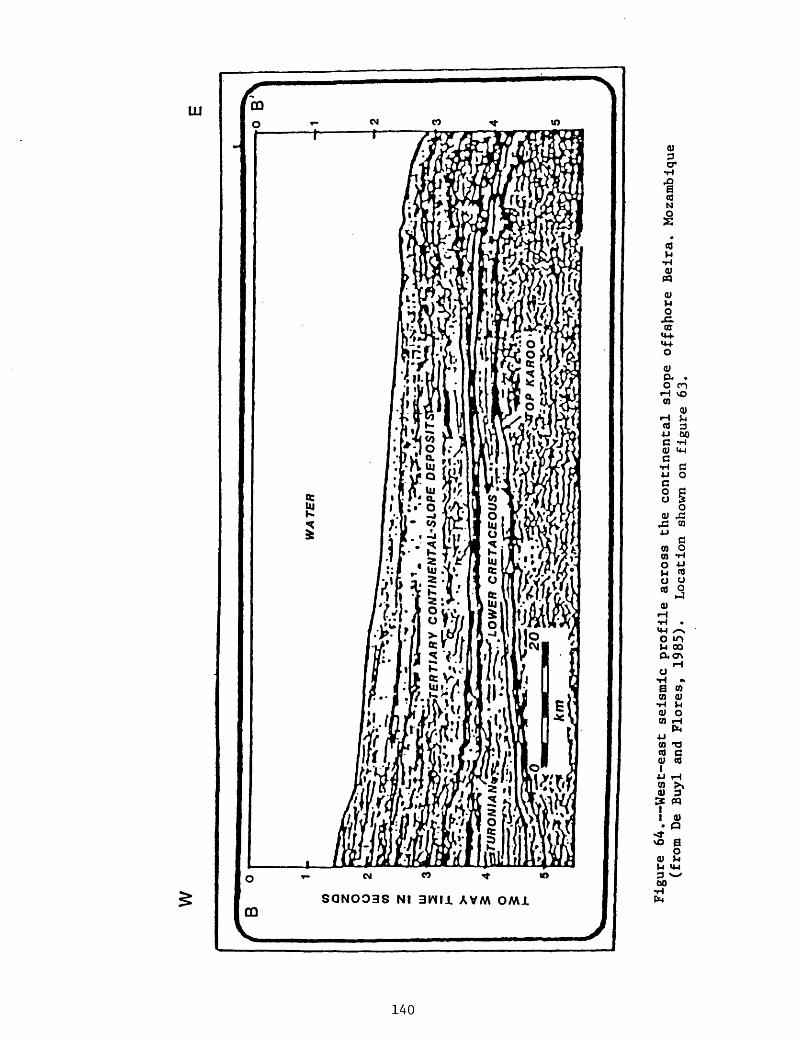
*1H- OQ
x-s C »-h Hn n> o 8 o\ *» o
M ft I
pi fl> D 0) D. (0
ft
I-* 0) O fl> H H- fl> (0 0) 8 « p.
O
00 ^ In O'-' Hi
(D
Pg o o05 ^ft O H* (0 O (0 9
rr CD 3* V fl> O
§o oD
O ft S H-
0 Mi fl>H- D
OQ rt C CD K M (D
(0
n>o HI
-H> ao M n>tn n>
N P)§-H-
^QC (D
TWO WAY TIME IN SECONDS
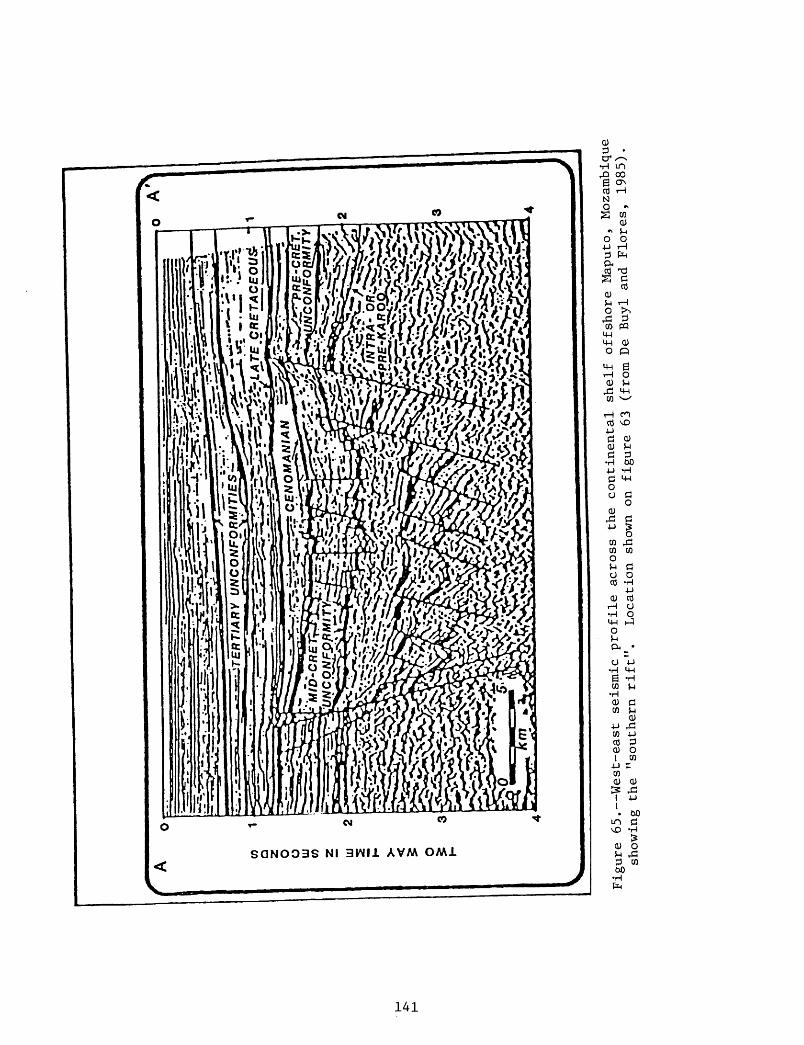
TWO WAY TIME IN SECONDS

Age FormationsQuaternary
Pliocene
Miocene
2 Oligocene
£ Eocene
Jofane Fm. Temane Fm.
Deltaic Complex
Cheringoma & Inhamme Fm.
Maastr.
Camp.
Sant.
o Coniac.oJJ Turon.
£ Cenom. O
Albian
Aptian
Neocom.
Jurassic And Older
V v IfTvo/.y,-^;-,i~* 17~ ii i 3m _t f
Grudja Fm.
Upper Domo Shales Fm.
Domo Sands Fm
COc0)
CO
Lower Domo Shales Fm.
Maputo Fm.
Karoo System
Figure 66. Stratigraphic column, Mozambique basin (modified from De Buyl and Flores, 1985).
142
percent organic carbon of humic origin (De Buyl and Flores), which is of fairly low potential.
Based on the rate of subsidence and thermal gradient, it would appear that the depth to the top of the thermally mature source rock is between 10,000 and 12,000 ft. This indicates most of the post-Karoo relatively thin section of strata of the onshore and southern offshore basin to be mainly immature and limits the better petroleum prospects to the basin depocenter in the northern offshore Zambesi delta area (west end line B-B 1 , fig. 64). Vitrinite reflectance of 0.6 percent has been measured on samples from Lower Domo black shales taken from onshore wildcats (DeBuyl and Flores, 1986) indicating not quite enough depth for thermal maturity (assuming Ro 0.7 is the top of the oil window). I discount the source factor for the whole basin as about 0.4.
Reservoirs. Effective reservoir sandstones to a maximum combined thickness of some 400 ft are mentioned in the literature. Some 10 separate sandstone bodies are identified in the Grudja Formation (fig. 66). Nothing of reservoir quality is known. The absence of good effective reservoirs is reported to be a detracting factor in this basin. From the descriptions available to me, however, it appears that the reservoirs may be fair; I discount the reservoirs to 0.6.
Traps. Traps are fault-associated in the tensional regime of this basin. Faults, however, are not plentiful and are grouped around the rifts (fig. 58). The basin is of rather low relief; traps would be minor, low drapes or low-amplitude fault traps. For instance, the gas discoveries to date are apparently drapes over the lip of the Pungue-Chissenga graben (fig. 63). Growth faults are limited to the small area within grabens (fig. 65). For the marginal sag portion of the basin, the potential for traps appear low; I discount this factor to 0.3.
Timing of Migration Versus Trap Formation. Potential source rock probably did not reach maturation depths until about the end of the Cretaceous. Traps were formed about the time of the major faulting in middle Cretaceous(?), and some faults have been active through the Tertiary. It would appear that the timing was fairly opportune. I discount this factor to 0.6.
Conclusions
A summary of the estimates and calculations leading to an assessment of the Mozambique basin is shown in table 19. The marginal sag, discussed above, is indicated to have .130 billion barrels of oil and 3.12 trillion cu ft of gas. When the oil and gas of the associated rifts (assessed under Rift Systems) are added, the oil and gas amount to .27 billion barrels and 5.4 trillion cu ft.
After considering the above data and estimates, the geologists of The World Energy Resources Program arrived at a consensus as to the undiscovered recoverable oil and gas in the Mozambique (Limpopo) basin. The consensus is shown in cumulative probability distribution curves (fig. 67), the modal, or most likely values of which are .10 billion barrels of oil and 3.6 trillion cu ft of gas. The mean values are .19 billion barrels of oil and 4.79 trillion cu ft of gas.
143

MOZAMBIQUE BASIN
Mozambique 95% * Recoverable Oil Assessment Date : Oct 23.1066*v
^_
ESTIMMES Mean = 0.19 Median = 0. 16 Mode « 0.10 F95 = 0.01 F75 « 0.08 F50 « 0.16 F25 - 0.27 F05 = 0.50 S.O. « 0.16
02 0.4 0.6 0.8 1BILLION BARRELS RECOVERABLE OIL
*.Mozambique 95%
Recoverable Gas Assessment Date : Oct 23.1986
N\\
\\\X^ -^--^
ESTIMMES Mean = 4.79 Median = 4.38 Mode = 3.60 F95 = 1.00 F75 = 2.78 F50 = 4.38 F25 = 6.34 F05 = 10.00 S.D. = 2.82
-4 6 8 10 12 14 16
TRILLION CUBIC FEET RECOVERABLE GAS18
* 5 percent
In South Africa
Figure 67. Cumulative probability distribution of the undiscovered recoverable oil and gas of the Mozambique basin.
144

Tanzania Basin
Location and Size
The Tanzania basin extends northward along the east coast of Africa from northern Mozambique (20%) through Tanzania (80%) into Kenya (figs. 1, 53, and 68). The area of the basin, as defined by the mid-Jurassic marginal sag perimeter and the 1-km (3,280 ft) water depth, is some 43,000 sq mi. More than 50 percent of this marginal sag area is underlain by Karoo rift subbasins. The sedimentary volume of the sag area, as defined, is estimated to be 120,000 cu mi. The volume of the underlying rift subbasins is some 37,000 cu mi, giving a total basin volume of about 157,000 cu mi. If one includes the contiguous Karoo rift basin, the Ruvu basin, the volume would be 217,000 cu mi. This assessment is limited to the marginal sag; the rift subbasins are assessed under Rift Systems.
Exploration History
From 1952 through the early 1960 f s, some 52, largely stratigraphic, holes were drilled by a BP-Shell Group. Since 1973, at least 9 wildcats have been drilled. The results of this drilling are three gas discoveries: Songo Songo with estimated reserves of 1 trillion cu ft, Kimbiji with 4.5 trillion cu ft and M'Nazi Bay with "big" reserves (fig. 68). The wildcat success rate is about 27 percent. Exploration is regarded as immature.
Structure
The structure of the Tanzania Basin is displayed in geologic cross sections (figs. 69, 70, 71 and 72). These sections (along with the map, fig. 68) show that prior to the mid-Jurassic sag, the major Karoo graben system of southern Africa extended northeastward from Zambia into and across Tanzania and along the coast of northern Tanzania into Kenya. A second, narrower, and covered trend, the Mandawa subbasin, extends south-southeastward along the southern Tanzanian coast (through Mandawa No. 7, fig. 68). This narrower trend may be of wrench rather than rift origin, as it parallels the wrench postulated between southern Madagascar and the Tanzanian coast (fig. 53). More details and an evaluation of these rifts may be found under Rift Systems.
The sag phase of the basin began in the mid-Jurassic with a broad marine transgression (figs. 69 and 71). This marginal sag continued through the Tertiary, lowering the Karoo to depths exceeding 16,000 ft and putting most of the post Karoo strata into the oil window. The sag occurred in a number of large down-to-basin normal faults which appear to be listric at depth causing tilted fault blocks, e.g. Latham Island (fig. 70), Zanzibar Island (fig. 72). These large faults are augmented by smaller growth fault structures.
Stratigraphy
Little information is available concerning the lower unit, i.e. the Karoo Super Group found mainly in downfaulted subbasins. As discussed under Rift Systems, the Karoo strata become more marine and contain more evaporites northward from the Karoo basin of South Africa, so that in Tanzania there are considerable amounts of evaporites and at least one percent of the section is marine. The Karoo of the Mandawa subbasin (fig. 69), though incompletely penetrated by a deep test, has 13,336 ft of evaporites and shales of which
145

PEMBA ISLAND
ZANZIBAR ISLAND
INDIAN
OCEAN
AR-ES-SALAAM
MAFIA ISLAND
Quaternary alluvlunt & dune sand
Non-marina Naogana
Marina Neogene
Pal«ofl«na
RTRI Cr«laceou»
Jurassic
Karoo
Basement
Fault
Fault Inferred
International boundary
Significant wildcats
Coral reef
M NAZI BAY
WARA
Figure 68. Geological and index map, Tanzania basin (from Kent and Perry, 1972) showing location of cross-sections, figures 69, 70, 71, and 72.
146

AA
Kis
wer
eIn
dian
O
cean
Met
rei
3.00
0P
IND
IRO
r
MA
NO
AW
A
7
IS.O
OO
-J*
10 1
030
SO70
80
KIL
OM
ETR
ES
NE
OC
EN
E
PA
LA
EO
GE
NE
U.
CR
ET
AC
EO
US
L
CR
ET
AC
EO
US
JUR
AS
SIC
KA
RO
O
BA
SE
ME
NTE
vapo
rite
s
Figu
re 69. Geologic cr
oss-
sect
ion A-A
1 through Mandawa
7 wi
ldca
t, Tanzania basin (f
rom
Kent
, 1965); location on
fi
g. 68
.

.p- 00
ISO
KIL
OM
ET
EK
SCX
>J
Figure 70. Geologic cross-section
B-B
1 th
roug
h Ki
sara
we an
d Ki
mbij
i structures,
Tanzania
basi
n (from
Kajato,
1982); lo
cati
on on
fi
g. 68.

A
TH
ON
IAN
CA
ltO
VIA
H
t-r^
r
r'
Ruvu v
alle
y, Ta
nzan
ia b
asin (from Ka
jato
, 19
82)
Figu
re 71. Geologic cross-section
C-C
, Ruvu v
a±J.ey,
loca
tion
on fig. 68.

Cro
ss s
ect
ion
acr
oss
the Z
anzi
bar
Cha
nnel
On
O
MS
I
SOO
Om
1000
0 m
KO
MA
-ZA
NZ
IBA
R
TR
EN
D
SON
GO
S
O*
GO
-r£
MB
A
TR
CN
O
I i
50km
K>0
kmIS
O k
mtil 20
0k
m2.
60k
m
Fig
ure
72. G
eolo
gic
cro
ss-s
ecti
on
D
-D1
acro
ss
the
Zan
zib
ar
chan
nel
, T
anza
nia
bas
in
(fro
m K
ajat
o,
19
82
);
locati
on
on
fi
g.
68.
some 7,364 ft was massive salt. The shales are carbonaceous and of source quality. In northern Tanzania evaporites are well developed in the Permian and Triassic parts of the Karoo section (fig. 71).
In mid Jurassic, the area was peneplaned and tilted eastward to receive a major marine transgression. The basal transgressive limestone is well distributed over Tanzania. Local restrictive conditions are indicated by evaporites in continental beds. The transgressive phase prevailed through the Jurassic. Sandstones, shales, and carbonates make up the Cretaceous through Paleogene section. The Neogene, beginning with a major unconformity at the base of the Miocene, is represented by a thickness (over 10,000 ft) of elastics.
Oil Versus Gas Occurrence
As indicated by the discovery of only gas, the basin is gas prone. A few oil seeps and tar sands occur. I estimate that the petroleum mix is 80 percent gas.
Principal Play Attributes
Source. No precise source data are available. The dark Karoo shales interbedded with evaporites, such as encountered at Mandawa, would appear to be rich source rock. There are abundant shales throughout the overlying marine section, some of which were laid down in a restrictive environment, so some source rock of reasonable richness probably exists.
Assuming a thermal gradient of 1.7° F/100 ft (average of wells to date) and a constant subsidence rate of 220 ft/million years, the top of the oil window is about 10,400 ft (3,170 m).
This basin is more favorable for petroleum generation than other east African basins in that the Neogene offshore subsidence is so great that the whole section up through a major part of the Neogene is within the oil window (fig. 72). I rate the source potential at 0.7. Some minor oil seeps and shows occur and exploration to date resulted in three gas fields with some accompanying condensate or oil.
Reservoirs. Reservoir rocks do not appear especially well developed in the Tanzania Basin section. Although sandstones are mentioned as part of all the formations, only two sandstone reservoirs and one limestone reservoir are specifically mentioned, but without descriptions of thickness and reservoir characteristics. 1) The Songo Songo gas field produces from a "major deltaic sand body capped by shales of Upper Albian Age"; 2) "The Upper Cretaceous sandstones of Campanian and Maastrichtian age are reservoir rocks for the Mafia Channel structures" (Kajato, 1982), and 3) about 500 ft of Eocene limestone was encountered at Songo Songo but how much of this is reservoir is not known. I rate reservoirs to be on the poor side, about 0.4.
Trap. Cross sections (figs. 69, 70, 71, and 72) indicate the presence of plentiful traps; mostly fault traps, drapes and growth faults. Some diapirs may be trap-formers in the rather limited areas of thick halite. Large scale faulting may cause leakage. I rate trapping at only about 0.5, mainly on the basis of its possible excessive fault dependency.
Migration Timing Versus Trap Formation. Trap formation is dependant on faulting, and faulting was most active during two periods: 1) Permian to early
151

Jurassic faulting that formed the Karoo rift basins of the region, and 2) younger faults that, according to geologic sections (figs. 70 and 72), were particularly active in the Paleogene and Neogene accompanying the continental marginal sag.
Assuming the top of the oil window has remained around 10,000 ft (3,300 m) in the offshore areas, migration from the Karoo shales would have started in the Cretaceous, from Mesozoic shales at the end of the Paleogene and from Tertiary shales in Quaternary. It would appear that the timing was rather favorable, as traps were being formed approximately during periods of generation and migration. We discount timing to about 0.7.
Conclusions
The estimates and calculations used to assess the basin are summarized in table 19. The petroleum in the marginal sag of the Tanzania basin is estimated to be .15 billion barrels of recoverable oil and 3.6 trillion cubic feet of gas. If the oil and gas of the underlying rift grabens are added, the petroleum amounts to .21 billion barrels of oil and 6.4 trillion cu ft of gas.
On the basis of the above information, a panel of geologists from The World Energy Resources Program arrived at a consensus as to the amount of undiscovered recoverable oil and gas in the country of Tanzania. Cumulative probability curves representing this consensus (fig. 73) show mean values of .77 BBO and 16.97 TCFG. The estimated mean values for the Tanzania basin alone, after subtracting the rift values, are .43 BBO and 7.97 TCFG.
Morondava Basin
Location and Size
The Morondava basin is on the west coast of the island of Madagascar and occupies some 24,000 sq mi (figs. 1 and 74). The basin has essentially two phases; an older interior rift phase of Karoo age (late Carboniferous to early Jurassic) and a marginal sag phase (mid-Jurassic through Tertiary). That part of the basin formed during the interior rift phase is the more prospective part of the basin and because of its close genetic relation to the Karoo Rift System of Africa, has been discussed principally under that section. Of the total basin volume of 229,000 cu mi, the volume of the sag sediments are some 169,000 cu mi and the interior rift sediments 60,000 cu mi.
The sag phase began with a mid-Jurassic largely marine transgression of carbonates, shales, and sandstones similar to the transgressive strata of the Tanzania marginal sag (fig. 54).
Exploration History
By 1975 some 60 wells were drilled, mainly in the vicinity of seeps and tar sands. In 1985 five deep tests were drilled; four onshore and one offshore. The offshore well was abandoned in the Jurassic, reportedly having encountered over-mature sediments before reaching the Karoo.
Structure
As seen in section C-C across the southern Morondava basin (fig. 75) there are several ages of faulting: 1) faulting of the basement prior to Karoo
152

TANZANIA BASIN & KAROO RIFT BASINS IN TANZANIA
Tanzania 100% Recoverable Oil Assessment Date : Oct. 23,1986
0.5 1 15 2 2£ 3 35
BILLION BARRELS RECOVERABLE OIL4.5
Tanzania 100%
Recoverable Gas Assessment Date : Oct 23,1986
^ ao_go
CJa: Q«.« * O
Cx.0
t-> *_3 ^
1O w.& d CL.
NA
\
\NV
u N ^FF F FF c
.
ESTIMA eon = edion = lode 95 75 50 25OS s\J*J ^
,.D.
Ma
TES 16.97 14.88 11. 4O 6.00
10.35 14.88 21.21 35.00 9.53
10 20 30 40 50 60TRILLION CUBIC FEET RECOVERABLE GAS
70
Figure 73. Cumulative probability distribution of undiscovered recoverable oil andgas in the Tanzania basin plus Karoo rift basins within Tanzania. The estimated mean of the assessments of the Tanzania basin are .43 BBO and 7.97 TCFG. The Karoo rift basins, Ruvu, Ruhuhu, Ruhudgi, Mikumi, and Tanga have estimated mean assessments of .34 BBO and 9.0 trillion cu ft of gas.

LEGtNDt
t>'%3 CIMXO*** C<MtaK»lM.
[ j i»»c» c«C'«cm rt cti«raou(t
CD
IS. . - i / S I\.',; -. (// KAROO- v.. ,. / ^/.
^.nntxm
ESOUISSE TECTONIOUE 0 MADAGASCAR
Figure 74. Tectonic sketch map of Madagascar (from Whiteman, 1981)
154

Ln
Ln
Mon
ombo
R.
(i
proj
ectio
n B
RN
-I)
LEG
EN
OE
R1
CA
LCA
IRE
llxfl
DO
LOM
IEFV
T C
ALC
. A
RG
ILE
UX
ET3
AR
GIL
EFTT CA
LC. GRESEUX
CH GRES
(^
GR
ES A
RG
ILE
UX
S3
AR
GIL
E G
RE
SE
US
E.S
ILT
PS
a M
AR
NE
E±M
EP
AN
CH
EM
EN
T V
OL
CA
NIO
UE
C3
SO
CLE
CD
RO
CH
ES E
XTR
US
IVE
S
(CA
RTE
J
INO
ICE
OE
PE
TR
OL
E*
INO
ICE
O
E G
AZ
A
AS
PH
ALT
E E
T 8I
TU
ME
-I L
W-2
C*
"**M
M.t
l ~
j/ tf.
. /
//;.
.'.-«
tMA
M.
Mil
j-
t
T 'J
i->
- '
' «
^^
r ~
- Sa
nCH
'"*'.
*^
'
'' /
K u
"*"Mr-
XM
"?*S
Om
.10
0020
0030
0040
0050
0060
0070
00
Figure 75
. Structural cross-sections: Majunga and
Morondava basins,
Madagascar.
on fi
gure
74
(from Wh
item
an,
1981)
.Locations shown

deposition, 2) Karoo faulting, pre-Isalo II (of mid Jurassic age), and 3) recent faulting cutting Tertiary beds. The earlier faulting would control Karoo structure and may to some extent cause drapes in the sag formations, e.g. the VHD and other folds along section C-C 1 (fig. 75). The young faults may cause fault traps in the sag formations. Some of these young faults (Manombo River area, section C-C 1 ) may be wrenches, and drag closure may be expected.
Stratigraphy
The best available representation of the stratigraphy is afforded by sections B-B 1 and C-C 1 (fig. 75). The post-Karoo or sag facies is shown to be mostly shale with carbonates and sandstones; the sandstone apparently occurring mainly on, or just offshore of, the west coast. The unconformity at the base of the mid-Jurassic transgression and beginning of the sag is clearly illustrated on section C-C 1 . No detailed comprehensive description of the post Karoo strata is available. Whiteman (1981) states that potential reservoirs occur in all formations from the Permian to the Paleogene. Carbonate reservoir rock occurs in Jurassic-Tertiary strata. Adequate shale seals exist, but some reservoirs appear to be flushed.
Oil Versus Gas Occurrence
Massive oil seeps occur in the underlying rift basin. Gas shows are reported in wells. I estimate that the petroleum mix is 60 percent oil.
Principal Play Attributes
Source. The organic richness of the post-Karoo shales have not been reported. No dark shales are mentioned and probably these predominantly open- ocean deposits are organically poor. It appears that only in the downdip portion alongshore or offshore to the west would the post-Karoo be sufficiently deep for thermal maturity; the source potential is therefore discounted to 0.4, but the source of the underlying rifted section of Karoo strata (with the equivalent of 2 billion barrels of oil in tar sands and seeps) is highly rated, even though much of the petroleum may now be dissipated; it is discounted to 0.8.
Reservoirs. Only general statements that reservoirs exist are available concerning the post-Karoo section. I, therefore, cannot rate the reservoirs highly, perhaps 0.5.
As may be seen under the Karoo Rift System, I have rated the reservoirs of the underlying rifted section as 0.6.
Traps. Trap formation is all related to faulting. As may be seen in the cross sections (fig. 75), in comparison to the underlying Karoo rifted section, faults and fault block structures are not prevalent in the post-Karoo strata. Probably the main traps are drape folds. I rate the trap potential of the sag sediments as low, discounting it to about 0.2. The much-faulted, leaking traps of the underlying Karoo interior rift section is discounted to 0.3.
Migration Timing Versus Trap Formation. Trap formation in the sag sediments is concentrated in two periods: 1) in the Mesozoic when the beds
156

drape over raised Karoo fault blocks, or over the topography reflecting faulted highs, and 2) relatively recent traps caused by closures along young faults, or perhaps drag features on wrench faults.
Petroleum sourced from the sag formations begin migration about the Cretaceous, which is late for older fault and drape features, but available for the young fault closures. I discount timing for sag formation petroleum rather heavily. Because the sag traps and reservoirs are in a position to receive late migrating petroleum from the underlying rift sediments, I discount timing to about 0.4.
Timing for the migration in the rift sediments is discounted to 0.4 because of the delay between trap formation and migration.
Conclusions
Table 19 summarizes the estimates and calculations made to evaluate the basin. The sag sediments are estimated to have some .1 billion barrels of oil and .5 billion cu ft of gas. However, when the oil and gas of the much higher potential Karoo rift subbasin is added, the total undiscovered, recoverable oil and gas are 1.0 billion barrels of oil and 4 trillion cu ft of gas.
For assessment consensus by The World-Energy-Resources-Program geologists, this and the Majunga basins were grouped together (see Majunga Basin conelus ions).
Majunga Basin
Location and Size
The Majunga basin is on the northwest coast of Madagascar, adjoining the Morondava basin and occupies approximately 20,000 sq mi (figs. 1 and 74).
Geology Similarity to the Morondava Basin
The Majunga basin is comparable to the Morondave basin, except for its smaller size and depth (49,000 versus 169,000 cu mi) and for the probable absence of wrench faulting as postulated on the west side of Madagascar Island. The effects of these differences are negligible considering the lack of precision of the method, and for assessment purposes, the basins are considered similar.
The structure and stratigraphy of the two basins are almost identical. The accumulation factors are also the same except that because the Morondava basin has the large seeps and is deeper, the source factor is discounted more for the Majunga basin both at the rift and sag levels (0.6 and 0.3) than for the Morondava basin (0.8 and 0.4).
Conclusions
Table 19 summarizes the estimates and calculations for assessment of the Majunga Basin. Except for the differences noted, the factors are very similar for the two parts of the basin. The oil and gas for the sag part of the basin is estimated to be .03 billion barrels of oil and .1 trillion cu ft of gas. When the oil and gas of the much higher potential rift part is added, the oil and gas of the basin amount to .25 billion barrels of oil and 1.0 trillion cu ft of gas.
157

On the basis of the information from both the Morondava and Majunga basins, a consensus from geologists of The World Energy Resources Program for the undiscovered recoverable oil and gas in the combined basins has a mode, most likely, value of 1.3 billion barrels of oil and 4 trillion cu ft of gas, indicated by cumulative probability curves (fig. 76). The mean values are 1.46 billion barrels of oil and 4.32 trillion cu ft of gas.
CONCLUSIONS
The total undiscovered petroleum resources of southern Africa, as here defined, amounts to some 18 billion barrels of oil and 275 trillion cu ft of gas, distributed in 17 basins or basin systems (table 20).
The bulk of the undiscovered petroleum resources appears to be in the Atlantic marginal basins, amounting to some 13.4 billion barrels of oil and 220 trillion cu ft of gas, most of which is in the Nigeria basin (8.3 billion barrels of oil and 190 trillion cu ft of gas). In contrast, the interior basins have estimated petroleum resources of only 1 billion barrels of oil and 18 trillion cu ft of gas. The resources of the east coast marginal basins are likewise relatively low with estimated undiscovered petroleum amounting to 2 billion barrels of oil and 17 trillion cu ft of gas.
The rift basins are estimated to contain some 1.6 billion barrels of oil and 20 trillion cu ft of gas. However, if one includes the initial rift phase of the major marginal and interior basins along with these rifts, the rift basins or plays of southern Africa contain over a fifth of the gas and oil; and if one excludes the rather anomalous Niger delta, the rifts contain over 40 percent of the oil and gas.
Table 21 lists the amounts of undiscovered recoverable petroleum in southern Africa on a country-by-country basis. The major amounts of undiscovered recoverable oil (over 500 million barrels each) appear to be in the countries of the central Atlantic coast, Nigeria, Cameroon, Gabon, Congo, Zaire and Angola, plus Tanzania and Madagascar adjoining the Indian Ocean. Major amounts of undiscovered gas (over 3 trillion cu ft each) appear to be in these same countries plus Mozambique and Zambia.
158

MAJUNGA/MORONDAVA
Madagascar Recoverable Oil Assessment Date: OcL 23,1986
"^ CO_
go
w Di . S<n*& o
fe :M o
SsJa,
-\
\N\
\
s
ESTIMATES Mean *» 1 .46 Median = 1.41 Mode = 1.30 F95 - 0.10 F75 = 0.84 F50 = 1.41 F25 - 2.02 F05 = 3.00 S.D. - 0.89
-^ ^ M^BMM
0.5 1 L5 2 2& 3 35BILLION BARRELS RECOVERABLE OIL
4J5
Madagascar Recoverable Gas Assessment Date : Oct 23; 1986
x5< <Q.g s8 :Q<n ^ oU. 0
3 °i :O CN|_02 o 0,
~~"\
\
^
\V.
ESTIMATES Mean = 4.32 Median = 4.21 Mode = 4.00 F95 = 1.00 F75 = 2.83 F50 - 4.21 F25 = 5.69 F05 = 8.00 S.D. = 2.13
*»-^_
* * 6 8 10TRILLION CUBIC FEET RECOVERABLE GAS
12
Figure 76. Cumulative probability distribution of undiscovered recoverable oil and gas in the Majunga and Morondava basins.
159

Table 20. Mean values of estimates of recoverable petroleum of southern Africa
Basin by-basin summary
Basin
Nigeria
Total ------
Douala
Gabon
Congo
Total ------
Cuanza
Orange
Total
Agulhas
Zaire
Total
Okawanga
Total ------
Kalahari
Total ------
Karoo
Karoo Rift System Luangwa Rift Luano Rift Lukusashi Rift Kafue Rift Kariba Rift Kariba Rift E-W Zambezi Rift
Country
Nigeria Cameroon
Cameroon
Gabon
Angola Congo Gabon Zaire
Angola
Namib ia South Africa
South Africa
Zaire Congo
Angola Namib ia Zambia
Botswana Namib ia
South Africa
Zambia Zambia Zambia Zambia Zambia Zimbabwe Mozambique
Percent of Basin
92 8
100
100
58 24 12 7
100
50 50
100
80 20
80 10 10
85 15
100
100 100 100 100 50 50
100
Oil BBO
7.60 .66
8 0 &
.52
1.38
1.52 .63 .31 .18
2 f / .64
.22
.12
.12
.14
.65
.16
.81
.11
.01
.0113. X-J
.05
.01
.06
.05
.39
Gas TCFG
173.97 15.13
1 QQ 1 fi
13.39
1.16
1.34 .56 .28 .16
2 34* *J "
.80
4.13
4.63
9.52 2.38
11.90
3.64 .45 .45
K cc
.98
.171.15
.60
8.14
160

Table 20. Continued
Basin Country
Karoo Rift SystemRuvu Rift Tanzania Ruhuhu Rift Tanzania Ruhudji Rift Tanzania Mikumi Rift Tanzania Tanga Rift
Total -----------
East Africa Rift SystemZaireUgandaTanzaniaRwandaBurundiMalawiMozambique
Total
Mozambique
Tanzania
Morondava/Maj unga
Mozambique
Tanzania
Madagascar
Percent
100100100100100
27123222
205
100
100
100
Oil BBO
(.34)
.73
,23 ,10 ,27 ,02 ,02 ,17 ,04 ,85
.19
.43
1.46
Gas TCFG
(9.0)I/
17.14
.71
.31
.83
.05
.05
.52
.13 2.60
4.79
7.97
4.32
^.'Because cumulative probability distribution curve (fig. 73) combined all basins in Tanzania, mean values for the Tanzania rift basins and the Tanzania marginal sag basin are only estimated allocations.
161

Table 21. Mean values of estimates of recoverable petroleum of southern Africa
Country-by-country summary
Country
Nigeria
Cameroon
Total - -
Gabon
Total - -
Congo
Total
Zaire
Total - -
Angola
Total - -
Namibia
Total - -
South Africa
T*^* *- ** 1local.
Botswana
Zimbabwe^-'
2/Zambia Region
Tr»t--i1 _
Basin
Nigeria
NigeriaDouala
GabonCongo
CongoZaire
CongoZaireE. African Rift
CongoCuanzaOkawanga
OkawangaKalahariOrange
OrangeKarooAgulhas
Kalahari
Kariba
KaribaKafueLukasashiLuanaLuangwaOkawanga
Percentof Basin
92
8100
10012
2420
78027
5810080
101550
50 -100100
85
50
50 "110010010010010 J
OilBBO
7.60
.66
.521 1 ft
1.38.31
1 AO. D7
.63
.16
.79
.18
.65
.231.06
1.52.22.11
1 8^. OD
.01
.01
.121 h.
.12
.05O 4
.05
.04
.27
.01Oft
GasTCFG
173.97
15.1313.3928 52
1.16.28
1.44
.562.382.94
.169.52.71
10 39Aw . jy
1.34.80
3.645 7ft. / o
ILC
Il74.134.75
.60fr.63Q *%£)
.98
.88
5.26
.**5«;_71
162
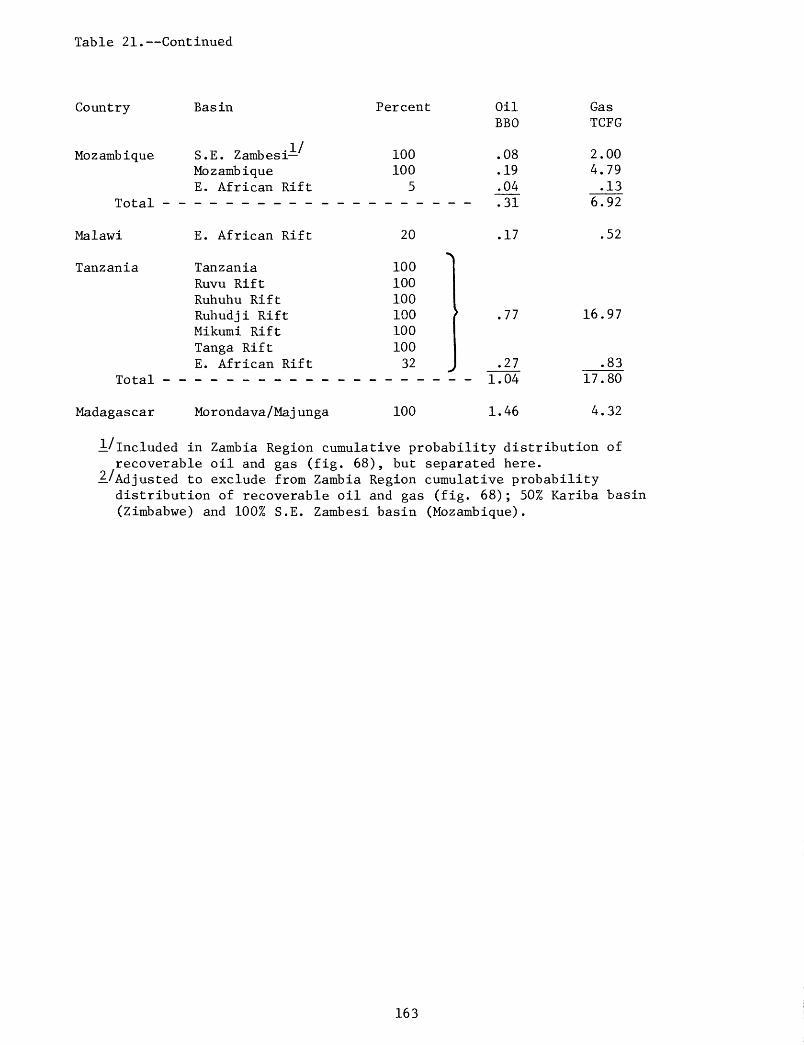
Table 21. Continued
Country
Mozambique
Total
Malawi
Tanzania
Basin
E. African Rift
Tanzania Ruvu Rift Ruhuhu Rift Ruhudji Rift Mikumi Rift Tanga Rift E. African Rift
Percent
S.E. Zambesi- Mozambique E. African Rift
100 100
5
20
10010010010010010032
Oil BBO
.08
.19
.04
.31
.17
.77
.27Total -------------------- 1.04
Madagascar Morondava/Majunga 100 1.46
Gas TCFG
2.004.79.13
6.92
.52
16.97
.8317.80
4.32
JL/Included in Zambia Region cumulative probability distribution of recoverable oil and gas (fig. 68), but separated here.
UAdjusted to exclude from Zambia Region cumulative probabilitydistribution of recoverable oil and gas (fig. 68); 50% Kariba basin (Zimbabwe) and 100% S.E. Zambesi basin (Mozambique).
163

REFERENCES CITED
Akpo, A. A., and Olu, A., 1981, Petroleum prospects of southern Nigeria'sAnambra basin: Oil and Gas Journal, May 4, p. 334-347.
Attanasi, E. D., and Haynes, J. L., 1983, Future supply of oil and gas fromthe Gulf of Mexico: U.S. Geological Survey Professional Paper 1292,Washington, D.C., p. 1-21.
Austin, H. A., and Uchupi, E., 1982, Continental-oceanic crustal transitionoff Southern Africa: American Association Petroleum Geologists Bulletin,v. 66/9, p. 1328-1347.
Blont, G., 1972, Enumeration des bass ins sedimentaires cotiers du Sud et 1'Estde 1'Afrique, in Sedimentary Basins of the African coasts, 2nd PartSouth and East Coast: Association of African Geological Surveys, Paris,p. 16.
Brice, S. E., Cochran, M. D., Pardo, G., and Edwards, A. D., 1982, J. S.Watkins and C. L. Drake, eds., Studies in Continental Margin Geology:American Association Petroleum Geologists Memoir 34, p. 5-18.
Brink, A. H., 1974, Petroleum geology of Gabon basin: American AssociationPetroleum Geologists Bulletin, v. 58, no. 2, p. 216-235.
Broginon, G. P., and Verrier, G. R., 1966, Oil and gas in Cuanza basin ofAngola: American Association Petroleum Geologists Bulletin, v. 50/1, p.108-158.
Caflish, L., 1975, Comments to the paper "L 1 exploration petroliere au Gabonet au Congo": Proceedings, Ninth World Petroleum Congress, v. 3, p. 199-200.
Cassan, J. P., Garcia, Palacios, M. D. C., Fritz, B., and Tardy, Y., 1981,Diagenesis of sandstone reservoirs as shown by petrographical andgeochemical analysis of oil bearing formations in the Gabon basin: Soc.Nat. Elf Aquitaine (Production) F-64018, Pau, France, p. 1-135.
Clifford, A. C., 1984, African oil-past, present and future, .in. M. T.Halbouty, ed., Proceedings of the Wallace E. Pratt Memorial Conference,Phoenix, December 1984, p. 339-372.
DeBuyl, M., and Flores, G., 1985, The southern Mozambique basin: The mostpromising hydrocarbon province offshore east Africa in M. T. Halbouty,ed., Future Petroleum Provinces of the World: American AssociationPetroleum Geologists Memoir 40, p. 399425.
Demaison, G. J., and Moore, G. T., 1980, Anoxic environments and oil source,genesis: American Association Petroleum Geologists Bulletin, v. 64/8, p.1179-1209.
Dingle, R. V., 1973, Post-Paleozoic stratigraphy of the eastern Agulhas Bank,south African continental margin: Marine Geology, v. 15, p. 1-23.
Dingle, R. V., 1980, Sedimentary basins on the continental margins of southernAfrica, Erdol and Kohle-Erdgas-Petrochemie: v. 33, no. 10, p. 457-463.
Drew, L. J., Schuenemeyer, J. H., and Bawiec, W. J., 1982, Estimation of thefuture rates of oil and gas discoveries in the western Gulf of Mexico:U.S. Geological Survey Professional Paper 1252, Washington, D.C., p. 1-26.
Emery, K. 0., Uchupi, E., Phillips, J., Bowin, C., and Mascle, J., 1975,Continental margin off western Africa: Angola to Sierra Leone, AmericanAssociation Petroleum Geologists Bulletin, v. 59, p. 2209-2265.
Elvsborg, A. and Dalode, J., 1985, Benin hydrocarbon potential lookspromising: Oil and Gas Journal, Feb. 11, 1985, p. 126-131.
164

Evamy, D. D., Harembowre, J., Kamerling, P., Knaap, W .A., Molloy, F. A., andRowlands, P. H., 1978, Hydrocarbon habitat of Tertiary Niger delta:American Association Petroleum Geologists Bulletin, v. 62/1, p. 1-39.
Evans, R., 1978, Origin and significance of evaporites in basins aroundAtlantic margin: American Association Petroleum Geologists Bulletin, v.62/2, p. 223-234.
Gerrard, I., and Smith, G. C., 1982, J. S. Watkins and C. L. Drake, eds., inStudies in Continental Margin Geology: American Association PetroleumGeologists Memoir 34, p. 49-74.
Jones, R. W., 1981, Some mass balance and geological constraints on migrationmechanisms: American Association Petroleum Geologists Bulletin, v. 65-1,p. 103-122.
Kajato, H. K., 1982, Gas strike spurs search for oil in Tanzania: Oil and GasJournal, March 15, p. 123-131.
Kent, P. E., 1965, An evaporite basin in southern Tanzania in Salt BasinsAround Africa: The Institute of Petroleum, London, p. 41-54.
Kent, P. E., and Perry, J. T. O'B., 1972, The development of the Indian Oceanmargin in Tanzania jLn_ Blant Ged., Sedimentary Basins of the AfricanCoasts, 2nd Part, South and East Coast: Association of AfricanGeological Surveys, Paris, p. 113-131.
Kent, L. E. (compiler), 1980, Stratigraphy of South Africa, Handbook 8, part1, by South African Committee for Stratigraphy, Government Printer,Pretoria, p. 1-683.
Kihle, R., 1983, Recent surveys outline new potential for offshore Mozambique:Oil and Gas Journal, Feb. 28, 1983, p. 126-134.
Kreuser, T., 1984, Source rock analysis in two Karoo basins of coastalTanzania, Journal of Petroleum Geology, v. 7/1, p. 47-54.
Lehner, P., and DeRuiter, PAC, 1977, Structural history of Atlantic margin ofAfrica: American Association Petroleum Geologists Bulletin, v. 61/7, p.961-981.
Martin, H., 1973, The Atlantic margin of southern Africa between latitude 17south and the Cape of Good Hope, in Nairn, A. E. M. and Stehli, F. G.,The Ocean Basins and Margins, v. 1, The South Atlantic, p. 277-300.
Mompers, J. A., 1982, The Etosha basin reexamined: Oil and Gas Journal, April5, p. 262-287.
Petracca, A. N., Armstrong, A. C., McGrew, H. J., 1980 through 1986, Oil andgas developments in central and southern Africa: American AssociationPetroleum Geologists Bulletin, v. 65-71.
Petroconsultants Ltd., 1980-1985, Foreign scouting service reports andresumes.
Petters, S. W., and Ekweozor, C. M., 1982, Petroleum geology of Benue troughand southeastern Chad basin, American Association Petroleum GeologistsBulletin, v. 66/8, p. 1141-1151.
Reimann, K. U., 1986, Prospects for oil and gas in Zimbabwe, Zambia andBotswanu: Episodes, v. 9, no. 2, p. 95-101.
Reyre, D., 1984, Petroleum characteristics and geologic evolution of a passivemargin. Example of the lower Congo-Gabon basin: Soc. Nat. Elf-Aquitaine(Production), v. 8/2, p. 303-332.
Rosendahl, B. R., and Livingstone, D. A., 1983, Rift lakes of East Africa: Newseismic data and implications for future research: Episodes, v. 1, p.14-19.
Seisser, W. G., 1975, Leg 40 results in relation to Continental shelf andonshore geology no. 80 Initial Reports Deep Sea Drilling Project 75,Washington (U.S. Government Printing Office), p. 965-979.
165
Tissot, B. } Demaison, G., Masson, P., Delteil, J. R., Combaz, A., 1980,Paleoenvironment and petroleum potential of Middle Cretaceous shales inAtlantic basins: American Association Petroleum Geologists Bulletin, v.64/11, p. 20512063.
van Andel, T. H., Theide, J., Sclater, J. C., and Hay, W. H., 1977,Depositional history of the South Atlantic Ocean during the last 125million years: Journal of Geology, v. 85, p. 651-698.
Vidal, J., Joyes, R., and Van Veen, J., 1975, L'exploration petroliere auGabon et au Congo: Proceedings, Ninth World Petroleum Congress, v. 3, p.149-165.
Vidal, J., 1979, Geology of Grondin Field, in Giant Oil and Gas Fields of theDecade: 1968-1978, p. 577-589.
Von Herzen, R. P., Hoskins, H. and van Andel, T. H., 1972, Geophysical Studiesin Angola Diapir Field: Geological Society of America Bulletin, v. 83,p. 1901-1910.
Weber, K. J., and Daukoru, E., 1975, Petroleum geology of the Niger delta:Proceedings, Ninth World Petroleum Congress, v. 2, p. 209-221.
Whiteman, A., 1981, East African basins: reserve, resources, and prospects, inPetroleum Exploration Strategies in Developing Countries: Proceedings ofUnited Nations, the Hague, p. 51-99.
Woodward, J. E., 1966, Stratigraphy and oil occurrences in the Karoo basin,South Africa, Eighth Commonwealth Mining and Metallurgical CongressProceedings - Petroleum, Melbourne, p. 45-54.
Yarmolyuk, V. A. Ed., 1977, Geologic map of Africa, Ministry of Geology of theUSSR, Moscow.
166