deloitte. - mass
TRANSCRIPT


(
Deloitte.
INDEPENDENT AUDITORS' REPORT
To the Board of Directors of NSTARElectric Company
· Berlin, Connecticut
Deloitte & Touche LLP City Place 1, 33rd Floor 185 Asylum Street Hartford, CT 06103-3402 USA
Tel: +1 860 725 3000 Fax: +1 860 725 3500 www.deloitte.com
We have audited theaccompanying financial statements ofNSTAR Electric Company (the "Company"), which comprise the balance sheet- regulatory basis as of December 31, 2015, and the related statements of incomeregulatory basis, retained earnings- regulatory basis; and cash flows- regulatmy basis for the year then ended, included on pagesl10 through 123 of the accompanying Federal Energy Regulatory Commission Form 1, and the related notes to the financial statements.
Management's Responsibility for the Financial Statements
Management is responsible for the preparation and fair presentation of these financial statements in accordance with the accounting requirements of the Federal Energy Regulatory Commission as set forth in its applicable Uniform System of Accounts and published accounting releases; this includes the design, implementation, and maintenance of internal control relevant to the preparation and fair presentation of financial statements that are free from material misstatement, whether due to fraud or error.
Auditors' Responsibility
Our responsibility is to express an opiriion on these financial statementsbase4 on our audit. We conducted our audit in accordance with auditing standards generally accepted in the United States of America. Those standards require that we plan and perform the audit to obtain reasonable assurance about whether the financial sta'tements are free from material misstatement.
An audit involves performing procedures to obtain audit evidence about the amounts and disclosures in the financial statements. The procedures selected dep~nd on the auditor's judgment~ including the assessment of the· risks of material misstatement of the financial statements, whether due to fraud or error. In making those risk assessments, the auditor considers internal control relevant to the Company's preparation and fair presentation of the financial statements in order to design audit procedures that are appropriate in the circumstances, but not for the purpose of expressirig an opinion on the ef(ectiveness of the Company's internal control. Accordingly, we express no such Opinion. An audit also includes evaluating the appropriateness of accounting poliCies used -and the reasonableness of significant accow1ting estimates made by management, as well as evaluating the overall presentation of the financial statements.
We believe that the audit evidence we have obtained is sufficient and appropriate to provide a basis for our audit opinion.
Opinion
In our opinion, the regulatory basis financial statements referred to above present fairly, in all material respects, the assets, liabilities, and proprietary capital ofNSTAR Electric Company as of December 3!, 2015, and the results of its operations and its cash flows for the year then ended in accordance with the accounting requirements ofthe Federal Energy Regulatmy Commission as set forth in its applicable Uniform System of Accounts and published accounting releases.
Member of Deloitte Touche Tohmatsu

l,
Page2
Basis of Accounting
As discussed in page 123.1 to the firiancial statem_ents, these financial statements were prepared in accordance with the accounting requirements of the Federal Energy Regulatmy Commission as set forth in its applicable Uniform System of Accounts and published accounting releases, which is a basis of accounting other than accounting principles generally accepted in the United States of America. Our opinion is not modified with respect to this matter.
Restricted Use
This report is intended solely for the information and use of the board of directors and management of the Company and for filing with the Federal Energy Regulatory Commission and is not intended to be and should not be used by anyone other than these specified parties.
Aprill5; 2016

INSTRUCTIONS FOR FILING FERC FORM NOS. 1 and 3-Q
j GENERAL INFORMATION
!r· I .. I. Purpose
l ' I . I
i l 1 i '
(
FERC Form No. 1 (FERC Form 1) is an annual regulatory requirement for Major electric utilities, licensees and others (18 C.F.R. § 141.1). FERC Form No. 3-Q ( FERC Form 3-Q)is a quarterly regulatory requirement which supplements the annual financial reporting requirement (18 C.F. R. § 141.400). These reports are designed to collect financial and operational information from electric utilities, licensees and others subject to the jurisdiction of the Federal Energy
Regulatory Commission. These reports are also considered to be non-confidential public use forms.
II. Who Must Submit
Each Major electric utility, licensee, or other, as classified in the Commission's Uniform System of Accounts Prescribed for Public Utilities and Licensees Subject To the Provisions ofThe Federal Power Act (18 C.F.R. Part 101), must submit FERC Form 1 (18 C.F.R. § 141.1), and FERC Form 3-Q (18 C.F.R. § 141.400).
Note: Major means having, in each of the three previous calendar years, sales or transmission service that exceeds one of the following:
(1) one million megawatt hours of total annual sales, (2) 100 megawatt hours of annual sales for resale, (3) 500 megawatt hours of annual power exchanges delivered, or (4) 500 megawatt hours of annual wheeling for others (deliveries plus losses).
Ill. What and Where to Submit
(a) Submit FERC Forms 1 and 3-Q electronically through the forms submission softWare. Retain one copy of each report for your files. Any electronic submission must be created by using the forms submission software provided free by the
Commission at its web site: http://www.ferc.gov/docs-filing/eforms/form-1/elec-subm-soft.asp. The software is used to submit the electronic filing to the Commission via the Internet.
(b) The Corporate Officer Certification must be submitted electronically as part of the FERC Forms 1 and 3-Q filings.
(c) Submit immediately upon publication, by either eFiling or mail, two (2) copies to the Secretary of the Commission, the latest Annual Report to Stockholders. Unless eFiling the Annual Report to Stockholders, mail the stockholders report to the Secretary of the Commission at:
Secretary Federal Energy Regulatory Commission 888 First Street, NE Washington, DC 20426
(d) For the CPA Certification Statement, submit within 30 days after filing the FERC Form 1, a letter or report (not applicable to filers classified as Class Cor Class D prior to January 1, 1984). The CPA Certification Statement can be either eFiled or mailed to the Secretary of the Commission at the address above.·
FERC FORM 1 & 3-Q (ED. 03-07)

(
(
The CPA Certification Statement should:
a)
b)
Attest to the conformity, in all material aspects, of the below listed (schedules and pages) with the Commission's applicable Uniform System of Accounts (including applicable notes relating thereto and the Chief Accountant's published accounting releases), and
Be signed by independent certified public accountants or an independent licensed public accountant certified or licensed by a regulatory authority of a State or other political subdivision of the U.S. (See 18 C.F.R. §§ 41.10-41.12 for specific qualifications.)
Reference Schedules
Comparative Balance Sheet Statement of Income Statement of Retained Earnings Statement of Cash Flows Notes to Financial Statements
110-113 114-117 118-119 120-121 122-123
e) The following format must be used for the CPA Certification Statement unless unusual circumstances or conditions, explained in the letter or report, demand that it be varied. Insert parenthetical phrases only when exceptions are reported.
"In connection with our regular examination of the financial statements of __ for the year ended on which we have reported separately under date of , we have also reviewed schedules
--:--:-:-:---::---:--:-:of FERC Form No. 1 for the year filed with the Federal Energy Regulatory Commission, for conformity in all material respects with the requirements of the Federal Energy Regulatory Commission as set forth in its applicable Uniform System of Accounts and published accounting releases. Our review for thispurpose included such tests of the accounting records and such other auditing procedures as we considered necessary in the circumstances.
Based on our review, in our opinion the accompanying schedules identified in the preceding paragraph (except as noted below) conform in all material respects with the accounting requirements of the Federal Energy Regulatory Commission as set forth in its applicable Uniform System of Accounts and published accounting releases."
The letter or report must state which, if any, of the pages above do not conform to the Commission's requirements. Describe the discrepancies that exist.
(f) Filers are encouraged to file their Annual Report to Stockholders, and the CPA Certification Statement using eFiling. To further that effort, new selections, "Annual Report to Stockholders," and "CPA Certification Statement" have been added to the dropdown "pick list" from which companies must choose when eFiling. Further instructions are found on the
Commission's website at http://www.ferc.gov/help/how-to.asp.
(g) Federal, State and Local Governments and other authorized users may obtain additional blank copies of FERC Form 1 and 3-Q free of charge from http://www.ferc.gov/docs-filing/eforms/form-1/form-1.pdf and
http://www.ferc.gov/docs-filing/eforms.asp#3Q-gas.
IV. When to Submit:
FERC Forms 1 and 3-Q must be filed by the following schedule:
FERC FORM 1 & 3-Q (ED. 03-07) ii

I lr I I I I I
I I
l ' I l I '
j : j
I ~
' ( l '
' I -1
I I
a) FERC Form 1 for each year ending December 31 must be filed by April 18th of the following year (18 CFR § 141.1), and
b) FERC Form 3-Q for each calendar quarter must be filed within 60 days after the reporting quarter (18 C.F.R. § 141.400).
V. Where to Send Comments on Public Reporting Burden.
The public reporting burden for the FERC Form 1 collection of information is estimated to average 1,144 hours per response, including the time for reviewing instructions, searching existing data sources, gathering and maintaining the data-needed, and completing and reviewing the collection of information. The public reporting burden for the FERC Form 3-Q collection of information is estimated to average 150 hours per response.
Send comments regarding these burden estimates or any aspect of these collections of information, including suggestions for reducing burden, to the Federal Energy Regulatory Commission, 888 First Street NE, Washington, DC 20426 (Attention: Information Clearance Officer); and to the Office of Information and Regulatory Affairs, Office of Management and Budget, Washington, DC 20503 (Attention: Desk Officer for the Federal Energy Regulatory Commission). No person shall be subject to any penalty if any collection of information does not display a valid control number (44 U.S.C. § 3512 (a)).
(__/ FERC FORM 1 & 3-Q (ED. 03-07) iii

I
1 !
,. I
(
GENERAL INSTRUCTIONS
I. Prepare this report in conformity with the Uniform System of Accounts (18 CFR Part 101) (USofA). Interpret all accounting words and phrases in accordance with the USofA.
II. Enter in whole numbers (dollars or MWH) only, except where otherwise noted. (Enter cents for averages and figures per unit where cents are important. The truncating of cents is allowed except on the four basic financial statements where rounding is required.) The amounts shown on all supporting pages must agree with the amounts entered on the statements that they support. When applying thresholds to determine significance for reporting purposes, use for balanceo sheet accounts the balances at the end of the current reporting period, and use for statement of income accounts the
·current year's year to date amounts.
Ill Complete each question fully and accurately, even if it has been answered in a previous report. Enter the word "None" where it truly and completely states the fact.
IV. For any page(s) that is not applicable to the respondent, omit the page(s) and enter ':NA," "NONE," or "Not Applicable" in column (d) on the List of Schedules, pages 2 and 3.
V. Enter the month, day, and year for all dates. Use customary abbreviations. The "Date of Report" included in the header of each page is to be completed only for resubmissions (see VII. below).
VI. Generally, except for certain schedules, all numbers, whether they are expected to be debits or credits, must be reported as positive. Numbers having a sign that is different from the expected sign must be reported by enclosing the numbers in parentheses.
VII For any resubmissions, submit the electronic filing using the form submission software only. Please explain the reason for the resubmission in a footnote to the data field.
VIII. Do not make references to reports of previous periods/years or to other reports in lieu of required entries, except as specifically authorized.
IX. Wherever (schedule) pages refer to figures from a previous period/year, the figures reported must be based upon those shown by the report of the previous period/year, or an appropriate explanation given as to why the different figures were used.
Definitions for statistical classifications used for completing schedules for transmission system reporting are as follows:
FNS -Firm Network Transmission Service for Self. "Firm" means service that can not be interrupted for economic reasons and is intended to remain reliable even under adverse conditions. "Network Service" is Network Transmission Service as described in Order No. 888 and the Open Access Transmission Tariff. "Self' means the respondent.
FNO - Firm Network Service for Others. "Firm" means that service cannot be interrupted for economic reasons and is intended to remain reliable even under adverse conditions. "Network Service" is Network Transmission Service as described in Order No. 888 and the Open Access Transmission Tariff.
LFP- for Long-Term Firm Point-to-Point Transmission Reservations. "Long-Term" means one year or longer and" firm" means that service cannot be interrupted for economic reasons and is intended to remain reliable even under adverse conditions. "Point-to-Point Transmission Reservations" are described in Order No. 888 and the Open Access Transmission Tariff. For all transactions identified as LFP, provide in a footnote the
FERC FORM 1 & 3-Q (ED. 03-07) iv
l/·

termination date of the contract defined as the earliest date either buyer or seller can unilaterally cancel the contract.
OLF- Other Long-Term Firm Transmission Service. Report service provided under contracts which do not conform to the · terms of the Open Access Transmission Tariff. "Long-Term" means one year or longer and "firm" means that service
( • cannot be interrupted for economic reasons and is intended to remain reliable even under adverse conditions. For all tr;ensactions identified as OLF, provide in a footnote the termination date of the contract defined as the earliest date either buyer or seller can unilaterally get out of the contract.
(
SfP- Short-Term Firm Point-to-Point Transmission Reservations. Use this classification for all firm point-to-point transmission reservations, where the duration of each period of reservation is less than one-year.
NF- Non-Firm Transmission Service, where firm means that service cannot be interrupted for economic reasons and is intended to remain reliable even under adverse conditions.
OS- Other Transmission Service. Use this classification only for those services which can not be placed in the above-mentioned classifications, such as all other service regardless of the length of the contract and service FERC Form. Describe the type of service in a footnote for each entry.
AD- Out-of-Period Adjustments. Use this code for any accounting adjustments or "true-ups" for service provided in prior reporting periods. Provide an explanation in a footnote for each adjustment.
DEFINITIONS I. Commission Authorization (Comm. Auth.) --The authorization of the Federal Energy Regulatory Commission, or any pther Commission. Name the commission whose authorization was obtained and give date of the authorization.
II. Respondent-- The person, corporation, licensee, agency, authority, or other Legal entity or instrumentality in whose behalf the report is made.
~FERC FORM 1 & 3-Q (ED. 03-07) v

EXCERPTS FROM THE LAW
Federal Power Act, 16 U.S.C. § 791a-825r
(- · Sec. 3. The words defined in this section shall have the following meanings for purposes of this Act, to with:
(
(3) 'Corporation' means any corporation, joint-stock company, partnership, association, business trust, organized group of persons, whether incorporated or not, or a receiver or receivers, trustee or trustees of any of the foregoing. It shall not include 'municipalities, as hereinafter defined;
(4) 'Person' means an individual or a corporation;
(5) 'Licensee, means any person, State, or municipality Licensed under the provisions of section 4 of this Act, and any assignee or successor in interest thereof;
(7) 'municipality means a city, county, irrigation district, drainage district, or other political subdivision or agency of a State competent under the Laws thereof to carry and the business of developin'g, transmitting, unitizing, or distributing power; ......
(11) "project' means. a complete unit of improvement or development, consisting of a power house, all water conduits, all dams and appurtenant works and structures (including navigation structures) which are a part of said unit, and all storage, diverting, or fore bay reservoirs directly connected therewith, the primary line or lines transmitting power there · from to the point of junction with the distribution system or with the interconnected primary transmission system, all miscellaneous structures used and useful in connection with said unit or any part thereof, and all water rights, rights-of-way, ditches, dams, reservoirs, Lands, or interest in Lands the use and occupancy of which are necessary or appropriate in the maintenance and operation of such unit;
"Sec. 4. The Commission is hereby authorized and empowered
(a) To make investigations and to collect and record data concerning the utilization of the water 'resources of any region to be developed, the water-power industry and its relation to other industries and to interstate or foreign commerce, and concerning the location, capacity, development -costs, and relation to markets of power sites; ... to the extent the Commission may deem necessary or useful for the purposes of this Act"
"Sec. 304. (a) Every Licensee and every public utility shall file with the Commission such annual and other periodic or special* reports as the Commission may be rules and regulations or other prescribe as necessary or appropriate to assist the Commission in the -proper administration of this Act The Commission may prescribe the manner and FERC Form in which such reports salt be made, and require from such persons specific answers to all questions upon which the Commission may need information. The Commission may require that such reports shall include, among other things, full information as to assets and Liabilities, capitalization, net investment, and reduction thereof, gross receipts, interest due and paid, depreciation, and other reserves, cost of project and other facilities, cost of maintenance and operation of the project and other facilities, cost of renewals and replacement of the project works and other facilities, depreciation, generation, transmission, distribution, delivery, use, and sale of electric energy. The Commission may require any such person to make adequate provision for currently determining such costs and other facts. Such reports shall be made under oath unless the Commission otherwise specifies*.1 0
FERC FORM 1 & 3-Q (ED. 03-07) vi

(
"Sec. 309. The Commission shall have power to perform any and all acts, and to prescribe, issue, make, and rescind such orders, rules and regulations as it may find necessary or appropriate to carry out the provisions of this Act. Among other things, such rules and regulations may define accounting, technical, and trade terms used in this Act; and may prescribe the FERC Form or FERC Forms of all statements, declarations, applications, and reports to be filed with the Commission, the information which they shall contain, and the time within which they shall be field ... "
General Penalties
The Commission may assess up to $1 million per day per violation of its rules and regulations. See FPA § 316(a) (2005), 16 U.S.C. § 825o(a).
FERC FORM 1 & 3-Q (ED. 03-07) vii

FERC FORM NO. 1/3-Q: REPORT OF MAJOR ELECTRIC UTILITIES LICENSEES AND OTHER
IDENTIFICATION 01 Exact Legal Name of Respondent 02 Year/Period of Report
NST AR Electric Company End of 2015/04
Jl-~ Previous Name and Date of Change (if name changed during year) I I
04 Address of Principal Office at End of Period (Street, City, State, Zip Code)
800 Boylston Street, Boston, Massachusetts 02199
05 Name of Contact Person 06 Title of Contact Person Carla J. Dacey Manager-Rev & Reg Accounting
07 Address of Contact Person (Street, City, State, Zip Code) One NSTAR Way, SUM NE-150, Westwood, Massachusetts 02090-9230
08 Telephone of Contact Person ,Including 09 This Report Is 1 0 Date of Report Area Code (1) lXI An Original (2) D A Resubmission (Mo, Da, Yr)
(781) 441-8816 04/15/2016
ANNUAL CORPORATE OFFICER CERTIFICATION
The undersigned officer certifies that:
I have examined this report and to the best of my knowledge, information, and belief all statements of fact contained in this report are correct statements of the business affairs of the respondent and the financial statements, and other financial information contained in this report, conform in all material respects to the Uniform System of Accounts.
!
'
01 Name 03Signatu~-- 04 Date Signed JayS. Buth (Mo, Da, Yr)
02 Title Vice President, Controller and GAO JayS. uth 04/15/2016
Title 18, U.S.C. 1001 makes it a crime for any person to knowingly and willingly to make to any Agency or Department of the United States any false, fictitious or fraudulent statements as to any matter within its jurisdiction.
-
(~/
FERC FORM No.1/3-Q (REV. 02-04) Page 1

Name of Respondent This [!]art Is: Date of Report Year/Period of Report
NSTAR Electric Company (1) An Original (Mo, Da, Yr) End of 2015104 (2) EJ A Resubmission I I
LIST OF SCHEDULES (Electric Utility)
Enter in column (c) the terms "none," "not applicable," or "NA," as appropriate, where no information or amounts have been reported for
certain pages. Omit pages where the respondents are "none," 1100t applicable," or "NA".
( -
'
Line Title of Schedule Reference Remarks
No. Page No. .
(a) (b) (c)
1 General Information 101
2 Control Over Respondent 102
3 Corporations Controlled by Respondent 103
4 Officers 104
5 Directors 105
6 Information on Formula Rates 106(a)(b)
7 Important Changes During the Year 108-109
8 Comparative Balance Sheet 110-113 .
9 Statement of Income for the Year 114-117
10 Statement of Retained Earnings for the Year 118-119
11 Statement of Cash Flows 120-121
12 Notes to Financial Statements 122-123
13 Statement of Accum Camp Income, Camp Income, and Hedging Activities 122(a)(b)
14 Summary of Utility Plant & Accumulated Provisions for Dep, Amort & Dep 200-201
15 Nuclear Fuel Materials 202-203 Not Applicable
16 Electric Plant in Service 204-207
17 Electric Plant Leased to Others 213 Not Applicable
18 Electric Plant Held for Future Use 214
19 Construction Work in Progress-Electric 216
20 Accumulated Provision for Depreciation of Electric Utility Plant 219
21 Investment of Subsidiary Companies 224-225
22 Materials and Supplies 227
23 Allowances 228(ab)-229(ab) None
24 Extraordinary Property Losses 230 Not Applicable
25 Unrecovered Plant and Regulatory Study Costs 230 Not Applicable
26 Transmission Service and Generation Interconnection Study Costs 231
27 Other Regulatory Assets 232
28 Miscellaneous Deferred Debits 233
29 Accumulated Deferred Income Taxes 234
30 Capital Stock 250-251
31 Other Paid-in Capital 253
32 Capital Stock Expense 254 Not Applicable
33 Long-Term Debt 256-257
34 Reconciliation of Reported Net Income with Taxable Inc for Fed Inc Tax 261
35 Taxes Accrued, Prepaid and Charged During the Year 262-263
36 Accumulated Deferred Investment Tax Credits 266-267
' / l
FERC FORM NO.1 (ED. 12-96) Page 2

IV<:IIIIo;;" VI 1""\.C;:ot-JUIIUC:IIl I ..... ~~""" .,_ I
UCI.lt:: Ul t"i.t:fJO/l
I r earn--enoa oT r;.eport
NSTAR Electric Company (1) ~An Original (Mo, Da, Yr)
End of 20151Q4 (2) EJA Resubmission I I
LIST OF SCHEDULES (Electric Utility) (continued)
Enter in column (c) the terms "none," "not applicable," or "NA," as appropriate, where no information or amounts have been reported for
certain pages. Omit pages where the respondents are "none," "not applicable-," or "NA".
r ' Line Title of Schedule Reference Remarks No. Page No.
(a) (b) (c)
37 Other Deferred Credits 269
38 Accumulated Deferred Income Taxes~Accelerated Amortization· Property 272-273 Not Applicable
39 Accumulated Deferred Income Taxes-Other Property 274-275
40 Accumulated Deferred Income Taxes-Other 276-277
41 Other Regulatory Liabilities 278
42 Electric Operating Revenues 300-301
43 Regional Transmission Service Revenues (Account 457.1) 302 Not Applicable
44 Sales of Electricity by Rate Schedules 304
45 Sales for Resale 310-311
46 Electric Operation and Maintenance Expenses 320-323
47 Purchased Power 326-327
48 Transmission of Electricity for Others 328-330
49 Transmission of Electricity by ISO/RTOs 331 Not Applicable
50 Transmission of Electricity by Others 332
51 Miscellaneous General Expenses-Electric 335
52 Depreciation and Amortization of Electric Plant 336-337
53 Regulatory Commission Expenses 350-351
54 Research, Development and Demonstration Activities 352-353 Not Applicable (
55 Distribution of Salaries and Wages 354-355
56 Common Utility Plant and Expenses 356 Not Applicable
57 Amounts included in ISO/RTO Settlement Statements 397
58 Purchase and Sale of Ancillary Services 398
59 Monthly Transmission System Peak Load 400
60 Monthly ISO/RTO Transmission System Peak Load 400a Not Applicable
61 Electric Energy Account 401
62 Monthly Peaks and Output 401
63 Steam Electric Generating Plant Statistics 402-403 Not Applicable
64 Hydroelectric Generating Plant Statistics 406-407 Not Applicable
65 Pumped Storage Generating Plant Statistics 408-409 Not Applicable
66 Generating Plant Statistics Pages 410-411 Not Applicable
l ./
FERC FORM NO. 1 (ED. 12-96) Page 3

I'J<:IIIIt: Ul f'\~:::if..IUIJUt::!fll rms~ort1s: uate at Kepon Year/1-'enod ot Report
NSTAR Electric Company (1) An Original (Mo, Da, Yr) End of 2015/04 (2) EJA Resubmission I I
LIST OF SCHEDULES (Electric Utility) (continued)
Enter in column (c) the terms "none," ,not applicable," or "NA," as appropriate, where no information or amounts have been reported for
certain pages. Omit pages where the respondents are "none," 11not applicable," or "NA".
( -
' Line Title of Schedule Reference Remarks No. " Page No.
(a) (b) (c)
67 Transmission line Statistics Pages 422-423
68 Transmission lines Added During the Year 424-425
69 Substations 426-427
70 Transactions with Associated (Affiliated) Companies 429
71 Footnote Data 450
Stockholders' Reports Check appropriate box: 0 Two copies will be submitted
lK] No annual report to stockholders is prepared
(
' /
FERC FORM N0.1 (ED. 12-96) Page 4

Name of Respondent
N~TAR Electric Company
This Report Is:
(1) lXI An Original (2) D A Resubmission
GENERAL INFORMATION
Date of Report (Mo, Da, Yr)
I I
Year/Period of Report
End of 2015104
( / ' 1. Provide name and title of officer having custody of the general corporate books of account and address of
(
office where the general corporate books are kept, and address of office where any other corporate books of account are kept, if different from that where the general corporate books are kept.
Jay s'. Buth, Vice President, ControD.er and Chief Accounting Officer
NSTAR Electric Company
107 Selden Street
Berlin, CT 06037
2. Provide the name of the State under the laws of which respondent is incorporated, and date of incorporation. If incorporated under a special law, give reference to such law. If not incorporated, state that fact and give the type of organization and the date organized.
Incorporated ~Massachusetts in January, 1886.
3. If at any time during the year the property of respondent was held by a receiver or trustee, give (a) name of receiver or trustee, (b) date such receiver or trustee took possession, (c) the authority by which the receivership or trusteeship was created, and {d) date when possession by receiver or trustee ceased.
N/A
4. State the classes or utility and other services furnished by respondent during the year in each State in which the respondent operated.
Electric utility service in Massachusetts
5. Have you engaged as the principal accountant to audit your financial statements an accountant who is not the principal accountant for your previous year's certified financial statements?
· ') D Yes ... Enter the date when such independent accountant was initially engaged:
I'-·-"') IX] No
FERC FORM No.1 (ED.12-87) PAGE 101

Name of Respondent
NSTAR Electric Company
This Report Is: Date of Report (Mo, Da, Yr)
Year/Period of Report
(1) 00 An Original (2) D A Resubmission I I End of
CONTROL OVER RESPONDENT
( ~ · 1. If any corporation, business trust, or similar organization or a combination of such organizations jointly held
.. antral over the repondent at the end of the year, state name of controlling corporation or organization, manner in .· whiclj control was held, and extent of control. If control was in a holding company organization, show the chain
of ownership or control to the main parent company or organization. If control was held by a trustee(s), state name of trustee(s), name of beneficiary or beneficiearies for whom trust was maintained, and purpose of the trust.
2015/04
Name of Controlling Organization: Eversource Energy, a Massachusetts business trust and voluntary association headquartered in
Boston, Massachusetts and Hartford, Connecticut, is a public utility holding company subject to regulation by the FERC under the
Public Utility Company Holding Act of 2005, which wholly and directly owns the respondent.
Manner in Which Control was Held: Ownership of Common Stock
Extent of Control: 100%
FERC FORM NO. 1 (ED. 12-96) Page 102

Name of Respondent This [!}art Is: Date of Report Year/Period of Report
NSTAR Electric Company (1) An Original (Mo, Da, Yr) End of 2015104 (2) OA Resubmission I I
CORPORATIONS CONTROLLED BY R SPONDENT
1. Report below the names of all corporations, business trusts, and similar organizations, controlled directly or indirectly by respondent at any time during the year. If control ceased prior to end of year, give particulars (details) in a footnote.
r'~ ". If control was by other means than a direct holding of voting rights, state in a footnote the manner in which control was held, naming 1 .ny intermediaries involved.
3. If control was held jointly with one or more other interests, state the fact in a footnote and name the other interests. ,
Definitions 1. See the Uniform System of Accounts for a definition of control. -2. Direct control is that which is exercised without interposition of an intermediary. 3. Indirect control is that which is exercised by the interposition of an intermediary which exercises direct control. 4. Joint control is that in which neither interest can effectively control or direct action without the consent of the other, as where the voting control is equally divided between two holders, or each party holds a veto power over the other. Joint control may exist by mutual agreement or understanding between two or more parties who together have control within the meaning of the definition of control in the Uniform System of Accounts, regardless of the relative voting rights of each party.
Line Name of Company Controlled Kind of Business Percent Voting Footnote No. Stock Owned Ref.
(a) (b) (c) (d)
1 Harbor Electric Energy Company Electric utility 100%
2
3 Yankee Atomic Electric Company Nuclear electric generation 14%
4 (unit permanently closed)
5
6 Connecticut Yankee Atomic Power Company Nuclear electric generation 14%
7 (unit permanently closed)
8
( 9 Maine Yankee Atomic Power Company Nuclear electric generation 4% .
10 (unit permanently closed)
11
12 New England Hydro-Transmission Elec., Co., Inc Electric transmission (1)
13
14 New England Hydro-Transmission Corporation Electric transmission (1)
15
16
17
18
19 (1) The Company owns 14.47% of the common
20 stock with a 7.9% voting interest.
21
22
23
24 .
25
26
27
'
FERC FORM NO. 1 (ED. 12-96) Page 103

OH .. OoO .... '-'1 '""''~t"VII\.IVIIL
1 · .... r~r· ""· uate or Keporr Yeartl-'enod ot H.eport
NSTAR Electric Company (1) An Original (Mo, Da, Yr) End of 2015104 (2) Ej A Resubmission I I
OFFICERS
1. Report below the name, title and salary for each executive officer whose salary is $50,000 or more. An "executive officer" of a respondent includes its president, secretary, treasurer, and vice president in charge of a principal business unit, division or function (such as sales, administration or finance), and any other person who performs similar policy making functions.
(-.,<. If a change was made during the year in the incumbent of any position, show name and total remuneration of the previous .ncumbent, and the date the change in incumbency was made.
Line Title Name of Ottlcer •-~~ary for Year No. (a) (b) (c) 1 Chairman Thomas J. May
' 2 · Chief Executive Officer Werner J. Schweiger
3 President and Chief Operating Officer Craig A. Hallstrom
4 Executive Vice President and Chief Financial Officer James J. Judge
5 Senior Vice President and General Counsel Gregory B. Butler
6 Senior Vice President-Transmission James A. Muntz .
7 Vice President-Supply Chain, Environmental Affairs and Ellen K. Angley
8 Property Management
9 Vice President, Controller and Chief Accounting Officer JayS. Buth
10 Vice President-Energy Supply James G. Daly
11 Vice President-Electric Field Operations Douglas W. Foley 210,050
12 Vice President-Electric System Operations Michael F. Hayhurst 191 ,301
13 Vice President and Treasurer Philip J. Lembo
14 Vice President-Engineering Paul R. Renaud 206,000
15 Secretary and Clerk Richard J. Morrison
16
17 All salaries disclosed are paid by the respondent.
18 Those salaries not disclosed are paid by Eversource
19 Energy Service Company.
( 'O
21
22
23
24
25
26
27
28
29
30
31
32
33
34
35
36
37
38
39
40
41
42 .
'-...../ 44
FERC FORM NO. 1 (ED. 12-96) Paae 104

Name of Respondent This f!Jort Is: Date of Report Year/Period of Report
NSTAR Electric Company (1) An Original (Mo, Da, Yr) End of 2015104 (2) F1 A Resubmission I I
DIRECTORS
1. Report below the information called for concerning each director of the respondent who held office at any time during the year. Include in column (a), abbreviated titles of the directors who are officers of the respondent.
( " '~. Designate members of the Executive Committee by a triple asterisk and the Chairman of the Executive Committee by a double asterisk. I -rne Name (and Title) of Director Principal Business Ada ress No. (a) (b)
1 Gregory B. Butler (Senior Vice President and General 56 Prospect Street, Hartford, CT 06103
2 Counsel)
3 . 4 James J. Judge (Executive Vice President and Chief 800 Boylston Street, Boston, MA 02199
5 Financial Officer)
6
7 Thomas J. May (Chainman) 800 Boylston Street, Boston, MA 02199
8
9 Werner J. Schweiger (Chief Executive Officer) 107 Selden Street, Berlin, CT 06037
10
11 The Company does not have an Executive Committee.
12
13 .
14
15
16
17
18
19
20
21
( 22
~3
24
25
26
27
28
29 .
30
31
32
33
34
35
36
37
38 .
39
40
41
42
43
44
45
'6
'-.-./J
48
FERC FORM N0.1 (ED. 12-95) Page 105

: r· ; I
(
Name of Respondent This ~art Is: Date of RepOrt - ·---·
Year/Period of Report
NSTAR Electric Company (1) An Original (Mo, Da, Yr) End of 2015/04 (2)0 A Resubmission I I
INFORMATION ON FORMULA RA ES FERC Rate Scheduleffariff Number FERC Proceeding
Does the respondent have formula rates? [2g Yes
D No
1. _,Please list the Commission accepted formula rates including FERC Rate Schedule or Tariff Number and FERC proceeding (i.e. Docket No) ·accepting the rate(s) or changes in the accepted rate.
Line No. FERC Rate Schedule or Tariff Number FERC Proceeding
1 ISO New England Inc. Transmission, Markets and EL11-66, ER07-549, EL07-71, EC06-126
2 Services Tariff, Section II, Schedule 21-NSTAR
3
4 ISO New England Inc. Transmission, Markets and ER05-754
5 Services Tariff, Section II, Schedule 20A-NSTAR
6
7 ISO New England Inc. Transmission, Markets and EL11-66, ER15-1629, ER11-3269
8 Services Tariff, Attachment F .
9
10 NSTAR Electric Company, Rate Schedule No. FERC 210 ER07-548
11 (MATEP LLC - Brighton Station #329)
12
13 NSTAR Electric Company, Rate Schedule No. FERC 220 ER12-956
14 (MATEP LLC- Colburn Station #350)
15
16 NSTAR Electric Company, Rate Schedule No. FERC 205 ER10-568
17 (Massachusetts Port Authority)
18
19 NSTAR Electric Company (f/k/a Boston Edison ER07-595
20 Company), Rate Schedule FERC No. 200
21 (Massachusetts Bay Transportation Authority)
22
23 NSTAR Electric Company, Rate Schedule FERC ER11-96
24 No. 270 (Town of Belmont TSA)
25
26 NSTAR Electric Company (f/k/a Boston Edison ER91-149, ER86-562, ER87-232
27 Company), Rate Schedule FERC No. 169
28 (Concord Municipal Light Plant) c 29
30 NSTAR Electric Company (f/kla Boston Edison ER99-2598
31 Company), Rate Schedule FERC No. 196 (ANP
32 Blackstone Energy Company -Annual
33 Facilities Charge)
34
35 NSTAR Electric Company (f/kla Commonwealth ER03-1348
36 Electric Company), Service Agreement No. 27
37 under ISO New England Inc. Transmission,
38 Markets and Services Tariff, Section II, Schedule
39 21-NSTAR (Entergy Nuclear Generation Company
40 RFA Barnstable Capacitor Bank)
41
FERC FORM NO. 1 (NEW. 12-08) Page 106

1'\lame or K.esponaem I niS ~Orr IS: I uare or c<epon
I T earlt""'enoa or r<::tliJUfl
NSTAR Electric Company (1) An Original (Mo, Da, Yr) End of 2015104 (2)0 A Resubmission I I
INFORMATION ON FORMULA RATES (continued) FERC Rate Schedule!Tariff Number FERC Proceeding
Does the respondent have formula rates? Jl\1 Yes
( D No
1. Please list the Commission accepted formula rates including FERC Rate Schedule or Tariff Number and FERC proceeding (i.e. Docket No) accepting the rate(s) or changes in the accepted rate. .
Line No. FERC Rate Schedule or Tariff Number FERC Proceeding
" 1 ISO New England Inc. Transmission, Markets and ER01-523
2 Services Tariff, Section II, Schedule 22 -
3 LGIA, Original Service Agreement No.
4 LGIA -ISONE I NSTAR-15-01
5 (Calpine Fore River Energy Center, LLC-
6 Annual Facilities Charge)
7 .
8 NSTAR Electric Company (f/I<Ja Boston Edison ER01-3138
9 Company), Service Agreement No. 73 under ISO
10 New England Inc. Transmission, Markets and
11 Services Tariff, Section II, Schedule 21-NSTAR
12 (Granite Ridge (AES Londonderry) -Annual
13 Facilities Charge)
14
15 NSTAR Electric Company (f/k/a Boston Edison ER98-4332
16 Company), Rate Schedule FERC No. 193
17 (Millennium Power Partners, LP. -Annual
( 18 Facilities Charge)
19
20 ISO New England Inc. Transmission, Markets and ER02-167
21 Services Tariff, Section II, Schedule 22- LGIA,
22 Original Service Agreement No.
23 LGIA-ISONEI NSTAR-12-01
24 (Kendall Green Energy LLC-
25 Annual Facilities Charge)
26
27 NSTAR Electric Company (f/kla Boston Edison ER06-145
28 Company), Service Agreement No. 30 under ISO
29 New England Inc. Transmission, Markets and
30 Services Tariff, Section II, Schedule 21-NSTAR
31 (New England Power (Nantucket- Merchant's
32 Way lA) -Annual Facilities Charge)
33 .
34 NSTAR Electric Company (f/kla Boston Edison ER06-423
35 Company), Service Agreement No. 85 under ISO -
36 New England Inc. Transmission, Markets and
37 Services Tariff, Section II, Schedule 21-NSTAR
38 (New England Power- Dewar Street lA)
39
~ I 40
41
FERC FORM NO. 1 (NEW. 12-08) Page 106.1

I'IICO.lll<;;:" VI J\<;;;;)j.JVJJU!;:JIL /'"'s~onos: uate at Kepon Year/Period at Report
NSTAR Electric Company (1) An Original (Mo, Da, Yr) End of 2015104 (2) 0 A Resubmission I I
INFORMATION ON FORMULA RA ES (continued) FERC Rate Scheduleffariff Number FERC Proceeding
Does the respondent have formula rates? I2SI Yes
c -- D No
1. Please list the Commission accepted formula rates including FERC Rate Schedule or Tariff Number and FERC proceeding (i.e. Docket No) accepting the rate(s) or changes in the accepted rate.
1 Line No. FERC Rate Schedule or Tariff Number FERC Proceeding ..
1 NSTAR Electric Company (flkla Boston Edison ER89-612
2 Company), Rate Schedule FERC No. 152 (BECO
3 HQ AC Support Agreement)
4
5 NSTAR Electric Company (Ilk/a Boston Edison Filed 3/31180
6 Company), Rate Schedule FPC No. [] (New
7 England Power- Lines 255-2337 and 255-2338)
8
9 ISO New England Inc. Transmission, Markets and ER14-2596
10 Services Tariff, Section II, Schedule 21-NSTAR,
11 Original Service Agreement No. TSA-NSTAR-001
12 (MBTA LSA- Direct Assignment Charge)
13 .
14 ISO New England Inc. Transmission, Markets and Reported on JSO-NE Electric Quarterly Report
15 Services Tariff, Section II, Schedule 22- LGIA,
16 First Revised Service Agreement No. LGIA-JSONE/
17 NSTAR-08-01 (Cape Wind lA- Annual Facilities
( 18 Charge)
19 .
20 NSTAR Electric Company ER15-260
21 Rate Schedule FERC No. 262
22 (NSTAR- HQUS Transfer Agreement)
23
24 NSTAR Electric Company ER15-1383
25 Rate Schedule FERC No. 280
26 (NSTAR- HQUS Transfer Agreement-
27 CMEEC Use Rights)
28
29
30
31 .
32
33
34
35
36
37
38
19
~!0
41
FERC FORM NO.1 (NEW. 12-08) Page 106.2

Name of Respondent This 'f!Jort Is: Date of Report Year/Period of Report
NSTAR Electric Company (1) An Original (Mo, Da, Yr) End of 2015104 (2) 0 A Resubmission I I
INFORMATION ON FORMULA RATES FERC Rate Schedulerrariff Number FERC Proceeding
( Does the respondent file with the Commission annual (or more frequent) [2g Yes
---~- filings containing the inputs to the formula rate(s)? D No
2. If yes, provide a listing of such filings as contained on the Commission's elibrary website 0
Document Formula Rate FERC Rate Line Date Schedule Number or No. Accession No. I Filed Date Docket No. Description Tariff Number •.
1 20140731-5068 071311201 4 RT04-2-000 Annual New England Participatin ISO New England Inc. Transmission,
2 071311201 4 ER09-1532-000 Transmission Owners Administrativ Markets and Services Tariff,
3 Regional Network Sel"'!ic Attachment F
4 Information Filin
5
6 20150105-5208 011051201 5 RT04-2-000 Supplement to July 31, 201 ISO New England Inc. Transmission,
7 011051201 5 ER09-1532-000 Annual New England Participatin Markets and Services Tariff,
8 Transmission Owners Administrativ Attachment F
9 Regional Network Servic
10 Information Filin
11
12 20150601-5440 0610112015 ER09-1243-000 Annual Informational Filin ISO New England Inc. Transmission,
13 0610112015 ER07 -549-000 of NSTAR Electric Com pan Markets and Services Tariff, Section ll,
14 Schedule 21- NSTAR
15
16 20150630-5464 0613012015 ER09-1243-000 Annual Informational Filin ISO New England Inc. Transmission,
17 20150630-5465 0613012015 ER07-549-000 CWIP Supplement of NSTA Markets and Services Tariff, Section II,
18 Electric Compan Schedule 21- NSTAR
19
20 20150731-5109 0713112015 RT04-2-000 Annual New England Participatin ISO New England Inc. Transmission, ( 21 07131/2015 ER09-1532-000 Transmission Owners Administrativ Markets and Services Tariff,
22 Regional Network Servic Attachment F
23 Information Filin
24
25 20150814-5172 0811412015 ER09-1243-000 Revision to June 1, 201 ISO New England Inc. Transmission,
26 08/1412015 ER07 -549-000 Annual Informational Fllin Markets and ServiCes Tariff, Section II,
27 of NSTAR Electric Compan Schedule 21- NSTAR
28
29
30
31
32
33
34
35
36
37
38
39
40
41
42
43
,/44
45
46
FERC FORM NO.1 INEW. 12-0Sl Paae 106a
l'lli:tlllt:# Ul 1"\t::::SjJUIJUI;lf!L 1 n1s ~!]orr 1s: uate or Kepon veam-'enod or Keport
NSTAR Electric Company (1) An Original (Mo, Da, Yr) End of 2015104 (2)0 A Resubmission I I
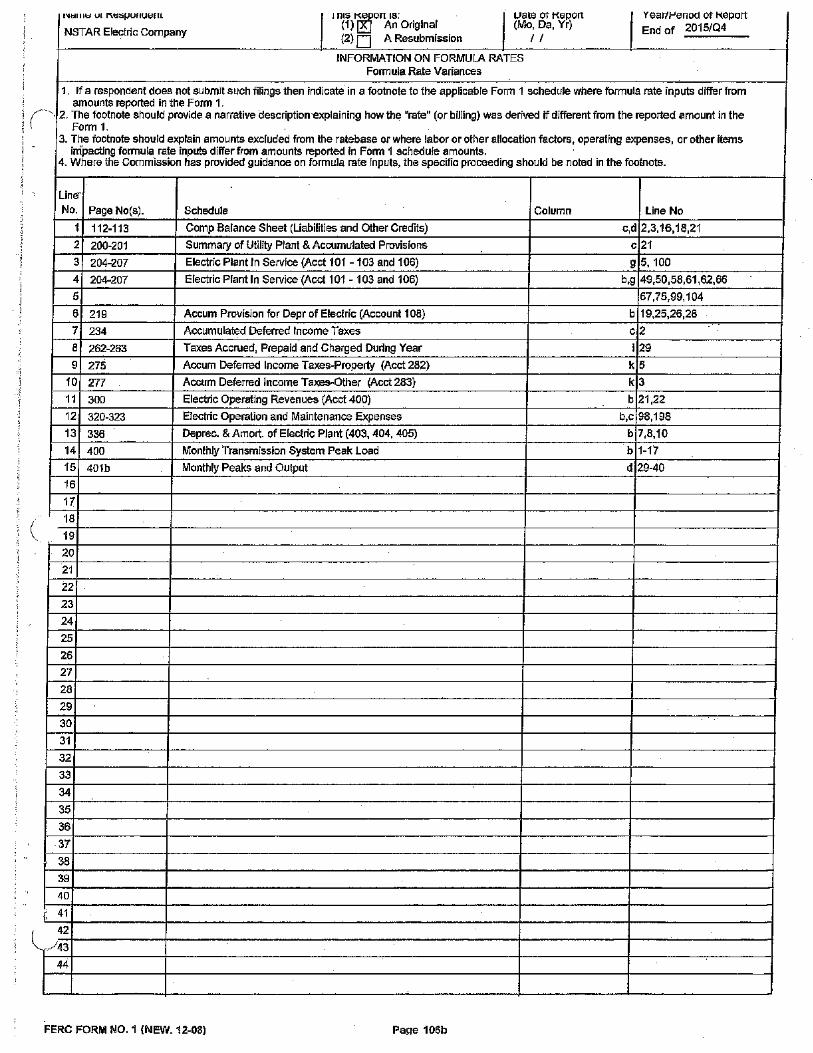
INFORMATION ON FORMULA RATES Formula Rate Variances
1. If a respondent does not submit such filings then indicate in a footnote to the applicable Form 1 schedule where formula rate inputs differ from amounts reported in the Form 1.
', 2. The footnote should provide a narrative description·explaining how the "rate" (or billing) was derived if different from the reported amount in the Form 1. (
3. The footnote should explain amounts excluded from the ratebase or where labor or other allocation factors, operating expenses, or other items irri'pacting formula rate inputs differ from amounts reported in Form 1 schedule amounts.
4. Where the Commission has provided guidance on formula rate inputs, the specific proceeding should be noted in the footnote.
Limf No. Page No(s). Schedule Column line No
1 112-113 Comp Balance Sheet (Liabilities and Other Credits) c,d 2,3,16,18,21
2 200-201 Summary of Utility Plant & Accumulated Provisions c 21
3 204-207 Electric Plant In Service (Acct 101 -103 and 106) g 5, 100
4 204-207 Electric Plant In Service (Acct 101 -103 and 106) b,g 49,50,58,61 ,62,66
5 67,75,99,104
6 219 Accum Provision for Depr of Electric (Account 1 08) b 19,25,26,28
7 234 Accumulated Deferred Income Taxes c2
8 262-263 Taxes Accrued, Prepaid and Charged During Year i 29
9 275 Accum Deferred Income Taxes-Property (Acct 282) k 5
10 277 Accum Deferred Income Taxes-Other (Acct 283) k 3
11 300 Electric Operating Revenues (Acct 400) b 21,22
12 320-323 Electric Operation and Maintenance Expenses b,c 98,198
13 336 Depree. & Amort. of Electric Plant (403, 404, 405) b 7,8, 10
14 400 Monthly Transmission System Peak Load b 1-17
15 401b Monthly Peaks and Output d 29-40
16
17
( 18
19
20
21
22
23
24
25
26
27
28
29
30
31
32
33
34
35
36
37
38
39
40
i 41
42
/43
44
FERC FORM NO. 1 (NEW. 12-08) Pa11e 106b

Name of Respondent NSTAR Electric Company
This Report Is: (1) (29 An Original (2) 0 A Resubmission
Date of Report
I I
IMPORTANT CHANGES DURING THE QUARTER/YEAR
Year/Period of Report End of 2015/04
Give particulars (details) concerning the matters indicated below. Make the statements explicit and precise, and number them in ,~ccordance with the inquiries. Each inquiry should be answered. Enter "none," "not applicable," or "NA" where applicable. If 1 formation which answers an inquiry is given elsewhere in the report, make a reference to the schedule in which it appears.
1. Changes in and important additions to franchise rights: Describe the actual consideration given therefore and state from whom the • franchise rights were acquired. If acquired without the payment of consideration, state that fact. 2. Acquisition of ownership in other companies by reorganization, merger, or consolidation with other companies: Give names of companies involved, particulars concerning the transactions, name of the Commission authorizing the transaction, and reference to Commission authorization. 3. Purchase or sale of an operating unit or system: Give a brief description of the property, and of the transactions relating thereto, and reference to Commission authorization, if any was required. Give date journal entries called for by the Uniform System of Accounts were submitted to the Commission. 4. Important leaseholds (other than leaseholds for natural gas lands) that have been acquired or given, assigned or surrendered: Give effective dates, lengths of terms, names of parties, rents, and other condition. State name of Commission authorizing lease and give reference to such authorization. 5. Important extension or reduction of transmission or distribution system: State territory added or relinquished and date operations began or ceased and give reference to Commission authorization, if any was required .. State also the approximate number of customers added or lost and approximate annual revenues of each class of service. Each natural gas company must also state major new continuing sources of gas made available to it from purchases, development, purchase contract or otherwise, giving location and approximate total gas volumes available, period of contracts, and other parties to any such arrangements, etc. 6. Obligations incurred as a result of issuance of securities or assumption of liabilities or guarantees including issuance of short-term debt and commercial paper having a maturity of one year or less. Give reference to FERC or State Commission authorization, as appropriate, and the amount of obligation or guarantee. 7. Changes in articles of incorporation or amendments to charter: Explain the nature and purpose of such changes or amendments. 8. State the estimated annual effect and nature of any important wage scale changes during the year. 9. State briefly the status of any materially important legal proceedings pending at the end of the year, and the results of any such proceedings culminated during the year. 1 D. Describe briefly any materially important transactions of the respondent not disclosed elsewhere in this report in which an officer, director, security holder reported on Page 104 or 105 of the Annual Report Form No. 1, voting trustee, associated company or known associate of any of these persons was a party or in which any such person had a material interest.
(Reserved.) •""- If the important changes during the year relating to the respondent company appearing in the annual report to stockholders are
applicable in every respect and furnish the data required by Instructions 1 to 11 above, such notes may be included on this page. 13. Describe fully any changes in officers, directors, major security holders and voting powers of the respondent that may have occurred during the reporting period. 14. In the event that the respondent participates in a cash management program(s) and its proprietary capital ratio is less than 30 percent please describe the significant events or transactions causing the proprietary capital ratio to be less than 30 percent, and the extent to which the respondent has amounts loaned or money advanced to its parent, subsidiary, or affiliated companies through a cash management program(s). Additionally, please describe plans, if any to regain at least a 30 percent proprietary ratio.
PAGE 108 INTENTIONALLY LEFT BLANK SEE PAGE 109 FOR REQUIRED INFORMATION.
FERC FORM NO. 1 (ED. 12-96) Page 108

(
Name of Respondent This Report is: Date of Report Year/Period of Report (1) ~An Original (Mo, Da, Yr)
NSTAR Electric Company (2) A Resubmission I I 20151Q4·
IMPORTANT CHANGES DURING THE QUARTER/YEAR (Continued)
1. None
2. Nor;Le
3. None
4. On December 15, 2015, NSTAR Electric acquired a 1.27-acre property with 39,640 square foot building at 32 Fremont Street in Needham·, Massachusetts for the purpose of construction of a new substation. NSTAR Electric will be retaining the several tenants at the existing building and property for the present. All are tenants in the offices of the building with the exception of Steelco Chainlink Fence Company,. which leases a portion of the parking area for materials storage. The tenants are as follows:
Clariant Corporation: $6,079.50/month ($72,954/year) Mahoney Publishing Company: $500/month ($6,000/year) Chestnut Design, Inc.: $600/month ($7,200/year) Thirty Two Fremont Company: $850/month ($10,200/year) Steelco Chainlink Fence Company: $2,000/month ($24,000/year)
NSTAR Electric will be collecting prorated rents for the period of December 15 through December 31, 2015, totaling $4,589.75.
5. None
6. The amount of short-term borrowings that may be incurred by NSTAR Electric is subject to periodic approval by the FERC. On June 11, 2014, the FERC granted authorization to allow NSTAR Electric to issue total short-term debt securities in an aggregate principal amount· not to exceed $·655 million outstanding at· any one time, effective October 24, 2014 through October 23, 2016.
On October 26, 2015, NSTAR Electric amended and restated its five-year $450 million revolving credit facility and extended the termination date to September 4, 2020. This facility serves to backstop NSTAR Electric's $450 million commercial paper program. As of December 31, 2015, NSTAR Electric had no borrowings outstanding under this facility.
As of December 31, 2015, NSTAR Electric had $62.5 million in borrowings outstanding under its commercial paper program.
On November 18, 2015, NSTAR Electric issued $250 million of 3.25 percent debentures due to mature in 2025. The proceeds, net of issuance costs 1 were used to repay short-term borrowings and fund capital expenditures and working capital.
7. None
Rsti01ated Almual Ef feet i>nd. lfature <>·f Imp<>rtru>t \•/age Scale Cha11ges
D.
l-.-----/ For a discussion of materially important legal proceedings, see Page 123, Notes to Financial Statements, Note 11, Commitments and Contingencies.
/FERC FORM NO.1 {ED. 12-!16) Page 109.1

(
Name of Respondent This Report is: Date of Report Year/Period of Report (1) K An Original (Mo, Da, Yr)
NSTAR Electric Company (2) A Resubmission I I 2015/Q4
IMPORTANT CHANGES DURING THE QUARTER/YEAR (Continued)
10. None
11. (Reserved)
12- None
13. There were There were during the
no changes no changes period.
in in
the the
Directors or Officers during the period. majority security holders and voting powers
14. NSTAR Electric Company proprietary capital ratio is greater than 30 percent.
I FERC FORM NO. 1 (ED. 12-96) Page 109.2

i '
BlANK PAGE
(

Name of Respondent This Report Is:
NSTAR Electric Company An Original A Resubmission
COMPARATIVE BALANCE SHEET
FIERC FORI\IJ NO.1 (REV. 12-03) Page 110
Date of Report (Mo, Da, Yr)
I I
Year/Period of Report
2015104

Name or Kesponaent
NSTAR Electric Company
This Report Is:
COMPARATIVE BALANCE SHEET
Line
Title of Account
FERG FORM NO.1 (REV. 12-03) Page 111
Date of Report (Mo, Da, Yr)
I I
Ref. Page No.
Year/Period of Report
End of 2015104

(
Name of Respondent This Report is: Date of Report Year/Period of Report (1) ~An Original (Mo, Da, Yr)
NSTAR Electric Company (2) A Resubmission I I 2015104
FOOTNOTE DATA
/Schedule Page: 110 Line No.: 52 Column: c '] Represents the value of Renewable Energy Certificates (RECs) that NSTAR Electric Company uses to meet the Commonwealth of Massachusetts' Renewable Portfolio Standards requirements. These RECs are recorded in Account 158.3. !Schedule Page: 110 Line No.: 72 Column: c I For Form 1 reporting purposes, the following reclassification of debit or credit balance accounts at December 31, 2015 are being included with Account 182.3 - Other Regulatory Assets. The balances are as follows:
Balance in Account 182.3
Reclass of balances from Account 254: Deferred Energy Efficiency
Reclass of balances to Account 254: Transition Reconciliation -Cambridge Electric Company
Reclass of balances to Account 254: Deferred Smart Grid costs
Reclass of balances to Account 254: CPSL costs
Account 182.3 Being Reported
/Schedule Page: 110 Line No.: 72 Column: d
$1,310,140,707 Dr.
136,934,424 Dr.
792 917 Dr.
581 455 Dr.
1 906 640 Dr.
$1,450,356,143 Dr.
For Form 1 reporting purposes, the following reclassification of debit or credit balance accounts at December 31, 2014 are being included with Account 182.3 - Other Regulatory Assets. The balances are as follows:
Balance in Account 182.3 $1,283,582,220 Dr.
Reclass of balances from Account 254: Deferred Energy Efficiency 62,384,765 Dr.
Reclass of balances to Account 254: Transition Reconciliation - Boston Edison 2,750,926 Dr.
Reclass of. balances to Account 254: Transition Reconciliation - Commonwealth Electric Company 11,395,071 Dr.
Reclass of balances to Account 254: Transition Reconciliation - Cambridge Electric Company 688,439 Dr.
Reclass of balances to Account 254: Long term renewable contract adjustment 3, 178, 77 7 Dr.
Account 182.3 Being Reported $1,363,980,198 Dr.
I FERC FORM NO. 1 (ED. 12-87) Page 450.1

·' .. .~
BLANK PAGE
(

Name of Respondent
NSTAR Electric Company
line
! FERC FORM NO.1 {rev. 12-03)
Title of Account (a)
Page 112
Date of Report (mo, da, yr)
I I
LJTIESAND OTHER
Ref. Page No.
(b) Balance
(c)
Year/Period of Report
end of 2015104
End Balance 12131
(d)

NSTAR Electric Company I (1) [K] An Original I (mo, da, yr) I (2) D A Resubmission I I end of 2015104
COMPARATIVE BALANCE SHEET (LIABILITIES AND OTHER CREDIT(S9ntinued)
Line Current Year PriorY ear
No. Ref. End of QuarterlY ear End Balance
- Title of Account Page No. Balance 12/31
' (a) (b) (c) (d) : 46 Matured Interest (240) 0 0 •. 47 Tax Collections Payable (241) 1,558,317 1,398,011
48 Miscellaneous Current and Accrued Liabilities (242) 197,890,385 148,177,045
49 Obligations Under Capital Leases-Current (243) 0 0
50 Derivative Instrument liabilities (244) 1,424,592 4,593,898
51 (Less) Long-Term Portion of Derivative Instrument Liabilities 912,954 3,083,945
52 Derivative Instrument liabilities- Hedges (245) 0 0
53 (Less) Long-Term Portion of Derivative Instrument Liabilities-Hedges 0 0
54 Total Current and Accrued Liabilities (lines 37 through 53) 562,387,931 768,749,553
55 DEFERRED CREDITS
56 Customer Advances for Construction (252) 33,136,469 29,35_7,026
57 Accumulated Deferred Investment Tax Credits (255) 266-267 5,421,672" • 6,714,278
58 Deferred Gains from Disposition of Utility Plant (256) 0 0
59 Other Deferred Credits (253) 269 13,437,084 19,789,675
Other Regulatory Liabilities (254) .,_,"
··~cJs:~.w:!l®tJr;~'"'!'lol:l~~:~~ 60 278 ~>·:-.-·.: ,_.,,.
61 Unamortized Gain on Reaquired Debt (257) 0 0
62 Accum. Defer~d Income Taxes-AcceL Amort.(281) 272-277 0 0
63 Accum. Deferred Income Taxes-O~her Property (282) 1,235,875,363 1 '143,462, 163
64 Accum. Deferred Income Taxes-OUter (283) 563,276,261 506,588,448
65 Total Deferred Credits (lines 56 through 64) 1,864,624,538 1 '732,375,929
66 TOTAL LIABILITIES AND STOCKHOLDER EQUITY (lines 16, 24, 35, 54 and 65) 7,402,790,737 7,137,970,354
(
\.
I
l_.,
FERC FORM NO. 1 jrev. 12-03) Page 113

Name of Respondent This Report is: Date of Report Year/Period of Report (1) 2$, An Original (Mo, Da, Yr)
NSTAR Electric Company (2) A Resubmission I I 2015/04
FOOTNOTE DATA
!Schedule Page: 112 Line No.: 2 Column: c Information on Formula Rates:
Page 106.2 lines 1 Amount stipulated per contract. !Schedule Page: 112 Line No.: 2 Column: d Information on Formula Rates:
Page 106.2 lines 1 Amount stipulated per contract. !Schedule Page: 112 Line No.: 3 Column: c Information on Formula Rates:
Page 106 lines 16, 19 and 23 Amount stipulated per contract.
Page 106.2 lines 1, 5 Amount stipulated per contract. !Schedule Page: 112 Line No.: 3 Column: d Information on Formula Rates:
Page 106 lines 16, 19 and 23 Amount stipulated per contract.
( chedule Page: 112 Line No.: 16 Page 106.2 lines 1, 5 Amount stipulated per contract.
Column:c Information on Formula Rates:
Page 1 06.2 lines 1, 5 Amount stipulated per contract. !Schedule Page: 112 Line No.: 16 Column: d Information on Formula Rates:
Page 106.2 lines 1, 5 Amount stipulated per contract. !Schedule Page: 112 Line No.: 18 Column: c Information on Formula Rates:
Page 1 06.2 lines 1, 5 Amount stipulated per contract.
I~S~ch~e~d~u~re~P~a~g~e~:i1~12~~L=i~ne~N~o~.:~1~8--~C~ol~u~m~n~:~d~------------------------------------------~l·. Information on Formula Rates:
Page 106.2 lines 1, 5 Amount stipulated per contract. !Schedule Page: 112 Line No.: 21 Column: c Information on Formula Rates:
Page 1 06 lines 16, 19 and 23 Amount stipulated per contract.
Page 1 06.2 lines 1, 5 Amount stipulated per contract. !Schedule Page: 112 Line No.: 21 Column:d Information on Formo.n!a Rates:
LJe 1061ines 16, 19 and 23 Amount stipulated per contract.
\FERC FORM NO.1 (ED.12-87) Page 450.1

Name of Respondent This Report is: Date of Report Year/Period of Report (1) ~An Original (Mo, Da, Yr)
NSTAR Electric Company (21 A Resubmission II 2015/Q4
FOOTNOTE DATA
f,,~, Page 106.2 lines 1, 5 Amount stipulated per contract. \ /Schedule Page: 112 Line Nci.: 60 Column: c
Forv Form 1 reporting purposes, the following reclassification or debit or credit bal-ance accounts at December 31, 2015 are being included with Account 254 - Other Regulatory Liabilities. the balances are as follows:
Bafance in Account 254 Reclass of balances from Account 182.3:
Deferred Energy Efficiency Reclass of balances to Account 182.3:
Transition Reconciliation - Cambridge Electric Company Reclass of balances to Account 182.3:
Deferred Smart Grid costs Reclass of balances to Account 182.3:
CPSL costs
Account 254 Being Reported /Schedule Page: 112 Line No.: 60 Column: d
$126,737' 747 Dr.
136,934,424 Cr.
792,917 Cr.
581,455 Cr.
1, 906,640 Cr.
$13,477' 689 Cr.
For Form 1 reporting .purposes, the following reclassification of debit or credit balance accounts at December 31, 2014 are being included with Account 254 - Other Regulatory Liabilities. The balances are a-s follows:
Balance in Account 254
Reclass of balances to Account 182: Deferred Energy Efficiency
Reclass of balances from Account 182: Transition Reconciliation - Boston Edison
~eclass of balances from Account 182: ( Transition Reconciliation - Commonwealth Electric Company
.C'i.eclass of balances frOm Account 182: Transition Reconciliation - Cambridge Electric Company
Reclass of balances from Account 182: Long term renewable contract adjustment
Account 254 Being Reported
IFERC FORM NO.1 (ED.12-87) Page450.2
$ 53,933,639 Dr.
62,384,765 Cr.
2, 750,926 Cr.
11,395,071 Cr.
688,439 Cr.
3,178,777 Cr.
$ 26,464,339 Cr.
...

Name of Respondent
NSTAR Electric Company
This (1) (2)
Date of Report (Mo, Da, Yr) I I
Year/Period of Report End of 2015104
. Report in column (c) the current year to date balance. Column (c) equals the total of adding the data in column (g) plus the data in column (i) plus the in column (k). Report in column (d) similar data for the previous year. This information is reported in the annual filing only.
/~,r ..••• in column (e) the balance for the reporting quarter and in column (f) ~he balance for the same three month period for the prior year. A:eport in column (g) the quarter to date amounts for electric utility function; in column (i) the quarter to date amounts for gas utility, and in column (k) quarter to date amounts for other utility function for the current year quarter.
Report in column (h) the quarter to date amounts for electric utility function; in column G) the quarter to date amounts for gas utility, and in column (J) quarter to date amounts for other utility function for the prior year quarter .
. If additional columns are needed, place them in a footnote.
or Quarterly if applicable 5. Do not report fourth quarter data in columns (e) and <n
Report amounts for accounts 412 and 413, Revenues and Expenses from Utility Plant leased to Others, in another utility column in a similar manner to utility department. Spread the amount(s} over lines 2 thru 26 as appropriate. Include these amounts in columns (c) and (d) totals .
. Report amounts in account 414, Other Utility Operating Income, in the same manner as accounts 412 and 413 above.
line No.
'ERC FORM NO. 113-Q !REV. 02-04) Paqe 114
CurrentYearto PriorY ear to Ended Date Balance for Date Balance for Quarterly Only
No 4th Quarter (e)

,(
(
I'>ICUIIC VI I~C;:of-'VII\.ICIIL 1111;:, ~~~1_': 1~. L.J<=llt::' UJ 1""\t::'fJUIL
(1) ~I"" Original (Mo, Da, Yr) (2) F'A R&ouu,.•ioolu" I I I
I t::al/lt::IIVU VI I \CjJVIL
NSTAR E;lectric Company End of 2015/04
;, 1 \1 IOJVJ"" f OF ' rUK I H< YloAK I
R Use page 122 for important notes regarding the statement of income for any account thereof. 10. Give concise explanations concerning unsettled rate proceedings where a contingency exists such that refunds of a material amount may need to be
I made' to the utility's customers or which may result in material refund to the utility with respect to power or gas purchases. State for each year effected . the gross revenues or costs to which the contingency relates and the tax effects together with an explan·ation of the major factors which affect the rights of the utility to retain such revenues or recover amounts paid with respect to power or gas purchases. 11 Give concise explanations concerning significant amounts of any refunds made or received during the ·year resulting from settlement of any rate proce'Sding affecting revenues received or costs incurred for power or gas purches, and a summary of the adjustments made to balance sheet, income, and expense accounts. 12. If any notes appearing in the report to stokholders are applicable to the Statement of Income, such notes may be included at page 122. 13. Enter on page 122 a concise explanation of only those changes in accounting methods made during the year which had an effect on net income, ,,,_.IJdir.:=' the basis of allocations and apportionments from those used in the preceding year. Also, give the appropriate dollar effect of such changes. 14. Explain in a footnote if the previous year's/quarter's figures are different from that reported in prior reports. 15. If the columns are insufficient for reporting additional utility departments, supply the appropriate account titles report the information in a footnote to this schedule.
ELECTkiC UTILITY GAS UTILITY OTHER UTILITY
GcCufriurr~;;;i.nt i\v'Sai'earrtfcio,~ Datei>T~~~Y'Sai' earr ttOo•DatE. Daterl-cur: c;urrrentemV. rr e;artiar· wJ1, , D~ateTr~i~YV.r.eiaiarrTo1 to> DlateateiCuii ""'"''imi'i ""'''e.Ji ""'"u'lEl 'u~atef~ en~ """~iuu ;'s,.,\'e, • eBr•u,lOuJDate' uate----J Line (in dollars) · (in dollars) (in dollars) (in dollars) (in dollar.;) (in dollars) No.
~~9 1~ ~ 4
45,517,650 o ,uoo,o~u 5
•31 1R?,nne '"' 6
1n,R",374 7,804,177
oou,u~~ 130,369
133 0?4 128 134,775,571
34304 68,557,516
19,319,261 18,414,917
'"""",;en 1QR,RRR 04R
-1.?0?,ROR -1,310,106
2,4R1 ROR,m1
FERC FORM NO. 1 (EO. '12-96) Page 115
I
8
9
10
11
12
13
14
15
16
17
18
19
20
21
22
23
24
25
26

NSTAR Electric Company
Line No.
Title of Account
FORM NO. 1/3-Q (REV. 02-04)
(Ref.) Quarterly Only Page No. Current Year Previous Year No 4th Quarter
Page 117
Quarterly Only No 4th Quarter

i (
·-·
Name of Respondent This Report is: (1) ~An Original
NSTAR Electric Company ·----------- (2) A Resubmission
FOOTNOTE DATA
/Schedule Page: 114 Line No.: 49 Column: c Note that for the year ended December 31, 2015, the total ex enses in Account 426.5 includes a transmission related Schedule Page: 114 Line No.: 49 Column: d Note that for the year ended December 31, 2014, the total expenses in Account 426.5 includes a transmission related
I FERC FORI\II NO. "I (ED. 12-87) Page 450.1
. -Date of Report Year/Period of Report
(Mo, Da, Yr) II 2015/04
amount of Public Education component of $0.
amount of Public Education component of $0.

1 Name of I oe mis ~~~-~nginal
Date of Report I of f<~P.".'! NSTAR Electric Company
(Mo, Da, Yr) End of ~u '~'"'~
I I
~. """" 1- OF 'CAl """'~ 1. Do not report Lines 49-53 on the quarterly version. 2. Report all changes in appropriated retained earnings, unappropriated retained earnings, year to date, and unappropriated
( ., •u•ou luJt8d subsidiary earnings for the year. J. Each credit and debit during the year should be identified as to the retained earnings account in which recorded (Accounts 433, 436 -439 inclusive). Show the contra primary account affected in column (b) I' 4. State the purpose and amount of each reservation or appropriation of retained earnings. 5. List first account 439, Adjustments to Retained Earnings, refiecting adjustments to the opening balance of retained earnings. Follow by credit, then debit items in that order.
' 6. Show dividends for each class and series of capital stock. 7. Show separately the State and Federal income tax effect of items shown in account 439, Adjustments to Retained Earnings. 8. Explain in a footnote the basis for determining the amount reserved or appropriated. If such reservation or appropriation is to be r~r• rm>ot, state the number and annual amounts to be reserved or appropriated as well as the totals eventually to be accumulated. 9. If any notes appearing in the report to stockholders are applicable to this statement, include them on pages 122-123.
Current Previous ·au~rter/Year Quarter/Year
Cont": :~:;~::;. Year to Date Year to Date
line Item Balance Balance
No. (a)
~ I L I rcu "crAINED 1216)
1 of Period f:h"nne< .
3 ; to t 439) ' ' ··. ' ' '·' . ' .\as:4Bs 4 5 .
6
7 1
( S TOTAL Credits to i ; (Acct. 439) 405,485 10
11 '
12 1:
14 15 I TOTAL Debits to ;(Acct. 439) 16 T1 t from Income (Account 433 less t418.1) ,147 17 ; of, i ; (Acct. 436) .• ·~·u·::·'•·..-;:•·.'"·< >'-.TX. .:··_. .··'i':•.i: ;::;<•."·.···+· . 11 ..
19
2C I 21
22 TOTAL ; ofi ; (Acct. 436) 23 .n I I Stocl< 1437) l::.JS:C''''•·_.. :• .,.:;· •.:· " '·. . .. ... I> ' ' ' :;: . , .. ,·;:o•·; 24 14.25% I Stock 238 I 25 14.78% f:umul"th• I Stock 238 -1,195,000 ( 1,195,000)
26
27 28
29 TOTAL I Stock (Acct. 437) -1. ( 1.960.000
30 i .n 1-"' 1 Stock lA, 1438) ,·: .. ··: ._·:.···.·. ....•.. _., ::.·,;• .. :·:··: ;·.:· , . . . . ;c:·~· 31 100 Shares C I i ; to Parent 238 I 32
32
34
<.:<l' 3€ TOTAL i j non Stocl< (Acct. 438) -198 nnn nnn I 37 ;frCJIIl_Acct216.1, L II '"'' 'dk I i i 38 I Balance- End of Period (Total1,9, 15, 1R ?? 7)
1cu I Dl : 215) I< < : ·.·· .• : . • • • •• .. • . . ...•. . • • >
FERC FORM N0.113-Q (REV. 02-04) Page 1·18

(
NSTAR Electric Company
UdLt: Ul r'\t:IJJUil
(Mo, Da, Yr)
I I End of I t:dl/lt::IIUU Ul f\t:IIJUit
2015104 ~~~111\..o VI 1\\..o.:>JJVIIUVII<
1. Do not report Lines 49-53 on the quarterly version. 2. Report all changes in appropriated retained earnings, unappropriated retained earnings, year to date, and unappropriated undistributed subsidiary earnings for the year.
Each credit and debit during the year should be identified as to the retained earnings account in which recorded (Accounts 433, 436 - 439 inclusive). Show the contra primary account affected in column (b) 4. State the purpose and amount of each reservation or appropriation of retained earnings. 5. List first account 439, Adjustments to Retained Earnings, reflecting adjustments to the opening balance of retained earnings. Follow by credit, then debit items in that order.
Show dividends for each class and series of capital stock. 7. Show separately the State and Federal income tax effect of items shown in account 439, Adjustments to Retained Earnings, 8. Explain in a footnote the basis for determining the amount reserved or appropriated. If such reservation or appropriation is to be recurrent, state the number and annual amounts to be reserved or appropriated as well as the totals eventually to be accumulated. 9. If any notes appearing in the report to stockholders are applicable to this statement, include them on pages 122-123.
Current Previous QuarterNear QuarterN ear
Contra Primary Year to Date Year to Date Line Item Affected Balance Balance
No. (a) (b) (c) (d)
FERC FORM NO. '1/3-Q (REV, 02-04) Page 119

(
NSTAR Electric Company End of 2015/04
(1) Codes to be used:(a) Net Proceeds or Payments;(b)Bonds, debentures and other long-term debt; (c) Include commercial paper; and (d) Identify separately such items as Investments, fixed assets, intangibles, etc.
Information about noncash investing and financing activities must be provided in the Notes to the Financial statements. Also provide a reconciliation between "Cash and Cash at End of Period" with related amounts on the Balance Sheet.
(3) oPerating Activities- Other: Include gains and losses pertaining to operating activities only. Gains and losses pertaining to investing and financing activities should be in those activities. Show in. the Notes to the Financia!s the amounts of interest paid (net of amount capitalized) and income taxes paid. (4) Investing Activities: Include at Other (line 31) net cash outflow to acquire other companies. Provide a reconciliation of assets acquired with liabilities assumed in the Notes to the Financial Statements. Do not include on this statement the dollar amount of leases capitalized per the USofA Generallnstruction 20; instead provide a reconciliation of the do!Jar amount of leases capitalized with the plant cost.
Description (See Instruction No. 1 for Explanation of Codes) QuarterNear QuarterNear
FERC FORM NO. "I (ED. 12-96) Page 120

(
··~···~ ~· ·-~~!-'"''"·""'"
NSTAR Electric Company. '-'"''"' .... , '""'JJ'-''' (Mo, Da, Yr) I I
I Veil II- C:IIUU Ul 1'\C:!JUI ~
End of 20151Q4
(1) Codes to be used:(a) Net Proceeds or Payments;(b)Bonds, debentures and other long-term debt; (c) Include commercial paper; and (d) Identify separately such items as investments, fixed assets, intangibles, etc. (2) Information about noncash investing and financing activities must be provided in the Notes to the Financial statements. Also provide a reconciliation betw-een "Cash and Cash Equivalents at End of Period" with related amounts on the Balance Sheet. (3) Operating Activities. Other: Include gains and losses pertaining to operating activities only. Gains and losses pertaining to investing and financing activities should be reported in those activities. Show in the Notes to the Financials the amounts of interest paid (net of amount capitalized) and income taxes paid.
ln~sting Activities: Include at Other {line 31) net cash outflow to acquire other companies. Provide a reconciliation of assets acquired with liabilities assumed in the Notes to ltt1e l'inoamoiel Statements. Do not include on this statement the dollar amount of leases capitalized per the USofA General Instruction 20; instead provide a reconciliation of the
capitalized with the plant cost.
Line No.
Description {See Instruction No. 1 for Explanation of Codes)
FERC FORM NO. 1 (ED. 12-98} Page "121

Name of Respondent
NSTAR Electric Company This Report Is: (1) [29 An Original (2) D A Resubmission
NOTES TO FINANCIAL STATEMENTS
Date of Report Year/Period of Report
IJ. End of 2015/04
1. Use the space below for important notes regarding the Balance Sheet, Statement of Income for the year, Statement of Retained Earnings for the year, and Statement of Cash Flows, or any account thereof. Classify the notes according to each basic statement,
( '-roviding a subheading for each statement except where a note is applicable to more than one statement. . 2.. Furnish particulars (details) as to any significant contingent assets or liabilities existing at end of year, including a brief explanation of _
any action initiated by the Internal Revenue Service involving possible assessment of additional income taxes of material amount, or of a claim for refund of income taxes of a material amount initiated by the utility. Give also a brief explanation of any dividends in arrears on cumulative preferred stock. 3. For Account 116, Utility Plant Adjustments, explain the origin of such amount, debits and credits during the year, and plan of disposition contemplated, giving references to Cormmission orders or other authorizations respecting classification of amounts as plant adjustments and requirements as to disposition thereof. 4. Where Accounts 189, Unamortized Loss on Reacquired Debt, and 257, Unamortized Gain on Reacquired Debt, are not used, give an explanation, providing the rate treatment given these items. See General Instruction 17 of the Uniform System of Accounts. 5. Give a concise explanation of any retained earnings restrictions and state the amount of retained earnings affected by such restrictions. 6. If the notes to financial statements relating to the respondent company appearing in the annual report to the stockholders are applicable and furnish the data required by instructions above and on pages 114-121, such notes may be included herein. 7. For the 30 disclosures, respondent must provide in the notes sufficient disclosures so as to make the interim information not misleading. Disclosures which would substantially duplicate the disclosures contained in the most recent FERC Annual Report may be omitted. 8. For the 30 disclosures, the disclosures shall be provided where events subsequent to the end of the most recent year have occurred which have a material effect on the respondent. Respondent must include in the notes significant changes since the most recently completed year in such items as: accounting principles and practices; estimates inherent in the preparation of the financial statements; status of long-term contracts; capitalization including significant new borrowings or modifications of existing financing agreements; and changes resulting from business combinations or dispositions. However were material contingencies exist, the disclosure of such matters shall be provided even though a significant change since year end may not have occurred. 9. Finally, if the notes to the financial statements relating to the respondent appearing in the annual report to the stockholders are applicable and furnish the data required by the above instructions, such notes may be included herein.
PAGE 122 INTENTIONALLY LEFT BLANK ( SEE PAGE 123 FOR REQUIRED INFORMATION.
FERC FORM NO. 1 (ED. 12-96) Page ·122

.r
Name of Respondent This Report is: Date of Report Year/Period of Report (1) 2S An Original (Mo, Da, Yr)
NSTAR Electric Company (2) A Resubmission I I 2015104
NOTES TO FINANCIAL STATEMENTS (Continued)
The :fmancial statements have been prepared in accordance with the accounting requirements of the PERC as set forth in its applicable Uniform · SYstem of Accounts and published accounting releases, which is a comprehensive basis of accounting other than GAAP. NSTAR Electric's
Combined Notes to Financial Statements relate to all ofEversource Energy's subsidiaries, including CL&P, PSNH and WNIECO, and are prepared in conformity with GAAP. Accordingly, certain footnotes are not reflective ofNSTAR Electric's fmancial statements contained herein. Refer to the Glossary of Terms for abbreviations and acronyms used throughout the Combined Notes to Financial Statements. The following areas represent the significant differences between the Uniform System of Accounts and GAAP:
Investments in subsidiaries are unconsolidated and are reported on the equity basis in PERC account 123.1 on page 110 in the PERC Ponn 1 in accordance with the Unifonn System of Accounts prescribed by the PERC. Other general purpose fmancial statements are prepared on a consolidated basis in accordance with GAAP.
Certain regulatory assets and liabilities are reported on a gross basis in FERC accounts !82 and 254 on pages 111 and 113 in the FERC Fonn I and are reported on a net basis and separated into their current and long-tenn portions in other general purpose financial statements prepared in accordance with GAAP.
Certain amounts recorded as materials and supplies in FERC account I 54 are reported in aggregate as a current asset on page 110 in the FERC Form I and are separated into their current and long-term portions in other general purpose financial statements prepared in accordance with GAAP.
Unamortized debt expenses recorded in PERC account I8I are reported as a long-term asset on page 11 I in theFERC Form I and are reported as a direct deduction from the carrying amount of long-term debt in other general purpose financial statements prepared in accordance with GAAP. See Note IC, 11Summary of Significant Accounting Policies- Accounting Standards," for further infonnation.
Certain miscellaneous assets and liabilities in FERC accounts 186, 229 and 242 on pages Ill, 112 and I 13 in the FERC Fonn I are reported as regulatory assets or liabilities in other general purpose financial statements prepared in accordance with GAAP.
Cost of removal obligations are included in the accumulated provision for depreciation in PERC account 108 on page 110 in the FERC Form 1 and are reported as a regulatory liability in other general purpose financial statements prepared in accordance with GAAP.
( Certain amounts recorded in miscellaneous current and accrued liabilities reported in PERC account 242 on page 113 in the FERC Fonn 1 are reported in other long-term liabilities in other general purpose financial statements.prepared in accordance with GAAP.
\. ..
Certain amounts recorded in other deferred credits in FERC account 253 on page 113 in the FERC Form 1 are reported as other current liabilities in other general purpose fmancial statements prepared in accordance with GAAP.
Accumulated deferred income taxes are reported on a gross basis in FERC accounts 190,282 and 283 on pages 11 I and 113 in the PERC Form 1. In 2014, accumulated deferred income taxes were reported on a net basis and were separated into their current and long-term portions in other general purpose financial statements prepared in accordance with GAAP. In 2015, in accordance with the adoption of new accounting guidance, accumulated deferred income taxes are reported on a net basis and are all presented as long-tenn in other general purpose fmancial statements prepared in accordance with GAAP. See Note IC, "Summary of Significant Accounting Policies- Accounting Standards," for further infom1ation.
Taxes receivable and payable are reported on a gross basis in PERC accounts I43 and 236 on pages 110 and 112 in the PERC Form 1 and tax prepayments are reported in FERC account 165 on page Ill in the FERC Form I. These amounts are shown on a net basis by taxingjufisdiction as a current asset or liability in other general purpose financial. statements prepared in accordance with GAAP.
Long-term debt is reported in aggregate in the PERC Form 1 and is segregated between current and long-term in other general purpose financial statements prepared in accordance with GAAP.
Proprietary capital is reported per final filed accounting entries ofNSTAR Electric Company related to the merger ofEversource Energy (fonnerly Northeast Utilities) and NSTAR under ACI3-4 et aL Docket No. EC11-35 in FERC accounts 207,211, 214, and 216 on pages 112 and 118 in the PERC Fonn 1 and is not reclassed in other general purpose financial statements prepared in accordance with GAAP.
Certain revenue and expense items are reported on a gross basis in FERC accounts 400, 401, 402, 403, 407,409,410 and 411 on pages 114 and 117 in the FERC P onn 1 and are reported on a net basis in other general purpose financial statements prepared in accordance with GAAP.
Certain items that are recorded in other income and deductions in PERC accounts 408.2, 417, 418, 421 and 426 and in interest expense in PERC account 431 on page 117 in the PERC Form 1 are reported in oper.ating expenses in other general purpose financial statements prepared in accordance with GAAP.
GAAP requires that public entities report certain infonnation about operating segments in complete sets offmancial statements of the entity and
IFERC FORM NO.1 (ED. 12-88) Page 123.1

(
Name of Respondent This Report is: Date of Report Year/Period of Report (1) 2S. An Original (Mo, Da, Yr)
NSTAR Electric Company I (2) A Resubmission I I 2015104
NOTES TO FINANCIAL STATEMENTS (Continued)
certain information about their products and services. GAAP requires disclosure of a measure of segment profit or loss, certain specific revenue and expense items, and segment assets along with reconciliations of amounts disclosed for segments to corresponding amounts in the entity's general purpose financial statements. These ~sclosures are not required for FERC reporting purposes.
NSTAR Electric has evaluated events subsequent to December 31, 2015 through the issuance of the GAAP financial statements on F ebruazy 26, 2016, and has updated such evaluation for disclosure purposes through April15, 2016. These financial statements include all necessary disclosures resulting from this evaluation. See subsequent events discussed below for further information.
FERC ROE Complaints: On March 22, 2016, the PERC ALJ issued an initial decision on the second and third PERC ROE complaints. For the second complaint period, the FERC ALJ recommended a zone of reasonableness of7.12 percent to 10.42 percent and a base ROE o£9.59 percent, which is halfway between the midpoint and the upper end of the zone of reasonableness. For the third complaint period, the FERC ALJ recommended a zone of reasonableness of 7.04 percent to 12.19 percent and a base ROE of 10.90 percent, which is halfway between the midpoint and the upper end of the zone of reasonableness. The FERC ALJ also affmned that the FERC established that the maximum ROE for transmission incentive projects should be the top of the zone of reasonableness, which is 10.42 percent for the second complaint and 12.19 percent for the third complaint. See Note liE, "Commitments and Contingencies- FERC ROE Complaints," for further information regarding the second and third FERC ROE complaints.
Spent Nuclear Fuel Litigation- DOE Phase III Damages: In August 2013, the Yankee Companies each filed subsequent lawsuits against the DOE seeking recovery of actual damages incurred in the years 2009 through 2012. The DOE Phase lli trial concluded on July 1, 2015, with a post-trial bdefing tl>at concluded on October 14, 2015. On March 25, 2016, the court issued its decision, awarding CYAPC, YAEC, and MYAPC $32.6 million, $19.6 million and $24.6 million, respectively, in damages. In total, the Yankee Companies were awarded $76.8 million of the $77.9 million in damages sought by the Yankee Companies in Phase III. The parties have 60 days following the fmai judgment date to appeai.
The Combined Notes to Financial Statements below are consistent with those published in the 2015 Annual Report on Form 10-K for CL&P, NSTARE!ectric, PSNH and WMECO, filed on February 26, 2016 with the SEC. See "Index to the Combined Notes to Financiai Statements" for a listing of applicable notes for NSTAR Electric.
Index to the Conibined Notes to Financial Statements The notes to the fmancial statements that follow are a combined presentation. The following list indicates the registrants to which the footnotes apply:
Registrant Applicable Notes 1 (A-E, G-K, M-Q), 2, 3, 4, 6, 7, 8, 9, 10, 11 (A-E, I), 12, 13, 14, 15, 16, 17, 22,
The Connecticut Light and Power Company 23 NST AR Electric Company 1 (A- K, M, N, P, Q), 2, 3, 4, 6, 7, 8, 9, 10, II (A- G, I), 12, 13, 15, 16, 17, 22, 23 Public Service Company ofNew Hampshire 1 (A- H, J- N, P, Q), 2, 3, 6, 7, 8, 9, 10, 11 (A- E, H, I), 12, 13, 14, 15, 16, 23 Western Massachusetts Electric Company 1 (A- E, H, J, K, M, N, P, Q), 2, 3, 5, 6, 7, 8, 9, 10, 11 (A- E, I), 12, 13, 14, 15, 16, 23
IFERC FORM NO.1 (ED. 12-88) Page 123.2

(
(
Name of Respondent
NSTAR Electric Company
This Report is: Date of Report (1) 2$; An Original (Mo, Da, Yr) (2) A Resubmission
NOTES TO FINANCIAL STATEMENTS (Continued)
EVERSOURCE ENERGY AND SUBSIDIARIES TJIE CONNECTICUT LIGHT AND POWER COMPANY
NSTAR ELECTRIC COMPANY AND SUBSIDIARY
I I
PUBLIC SERVICE COMPANY OF NEW HAMPSHIRE AND SUBSIDIARY WESTERN MASSACHUSETTS ELECTRIC COMPANY
COMBINED NOTES TO FINANCIAL STATEMENTS
Year/Period of Report
20151Q4
Refer to the Glossary of Terms included in this combined Annual Report on Form 10-K for abbreviations and acronyms used throughout the combined notes to the financial statements.
1. SUMMARY OF SIGNIFICANT ACCOUNTING POLICIES
A. About Eversource, CL&P, NSTAR Electric, PSNH and WMECO Eversource Energy: Eversource Energy is a public utility holding company primarily engaged, through its wholly owned regulated utility subsidiaries, in the energy delivery business. Eversource Energy's wholly owned regulated utility subsidiaries consist of CL&P, NST AR Electric, PSNH, "WMECO, Yankee Gas and NSTAR Gas. Eversource provides energy delivery service to approximately 3.6 million electric and natural gas customers through these six regulated utilities in CoiUlecticut, Massachusetts and New Hampshire.
On April30, 2015, the Company's legal name was changed from Northeast Utilities to Eversource Energy. CL&P, NSTAR Electric, PSNH and WMECO are each doing business as Eversource Energy.
Eversource, CL&P, NSTAR Electric, PSNH and WJviECO are reporting companies under the Securities Exchange Act of 1934. Eversource Energy is a public utility holding company under the Public Utility Holding Company Act of 2005. Arrangements among the regulated electric companies and other Eversource companies, outside agencies and other utilities covering interconnections, interchange of electric power and sales of utility property are subject to regulation by the FERC. The Regulated companies are subject to regulation of rates, accounting and other matters by the FERC and/or applicable state regulatory conunissions (tbe PURA for CL&P and Yankee Gas, the DPU for NSTARElectric, WMECO and NSTAR Gas, and the NHPUC for PSNH).
Regulated Companies: CL&P, NSTAR Electric, PSNH and WMECO furnish franchised retail electric service in Connecticut, Massachusetts and New Hampshire. Yankee Gas and NSTAR Gas are engaged in the distribution and sale of natural gas to customers within Connecticut ahd Massachusetts, respectively. CL&P, NST AR Electric, PSNH and WMECO's results include the operations of their respective distribution and transmission businesses. PSNH and WMECO's distribution results include the operations of their respective generation businesses. Eversource also has a regulated subsidiary, NPT, which was formed to construct, own and operate the Northern Pass line, a HVDC transmission line from Quebec to New Hampshire under development that will intercoiUlect with a new HVDC transmission line being developed by a transmission subsidiary ofHQ.
Other: Eversource Service, Eversource's service company, Rocky River Realty Company, a wholly-owned real estate subsidiary ofEversource, Renewable Properties, Inc., an indirect, wholly-owned subsidiary ofEversource, and Properties, Inc., a wholly-owned subsidiary ofPSNH, provide support services to Eversource, including its Regulated companies. Eversource· Gas Transmission LLC, an indirect, wholly-owned subsidiary of Eversource, holds an equity interest in the Access Northeast project.
B. Basis of Presentation The consolidated financial statements ofEversource, NSTAR Electric and PSNH include the accounts of each of their respective subsidiaries. Intercompany transactions have been eliminated in consolidation. The accompanying consolidated financial statements ofEversource, NSTAR Electric and PSNH and the financial statements of CL&P and WMECO are herein collectively referred to as the 11financial statements."
The preparation of the fmancial statements in conformity with GAAP requires management to make estimates and assumptions that affect the reported amounts of assets and liabilities and the disclosure of contingent liabilities as of the date of the financial statements and the reported amounts of revenues and expenses during the reporting period. Actual results could differ from those estimates.
Eversource consolidates CYAPC andY AEC because CL&P's, NSTAR Electric's, PSNH's and WMECO's combined ownership interest in each of these entities is greater than 50 percent. Intercompany transactions between CL&P, NSTAR Electric, PSNH and \VMECO and the CY APC and Y AEC companies have been eliminated in consolidation of the Eversource financial statements .
.. JFERC FOR!\11 NO.1 (ED. 12-88) Page 123.3

(
Name of Respondent This Report is: Date of Report Year/Period of Report (1) X An Original (Mo, Da, Yr)
NSTAR Electric Company (2) A Resubmission I I 2015104
NOTES TO FINANCIAL STATEMENTS (Continued)
Eversource's utility subsidiaries' distribution (including generation) and transmission businesses are subject to rate-regulation that is based on cost recovery and meets the criteria for application of accounting guidance for entities with rate-regulated operations, which considers the effect of regulation on the differences in the timing of the recognition of certain revenues and expenses from those of other businesses and industries. See Note 2, "Regulatory Accounting," for further information.
Certain reclassifications of prior year data were made in the accompanying financial statements to conform to the current year presentation and as a result of the adoption of new accounting guidance. See Note I C, 11 Summazy of Significant Acc01mting Policies- Accounting Standards," for further information.
In accordance with accounting guidance on noncontrolling interests in consolidated financial statements, the Preferred Stock of CL&P and the Preferred Stock ofNSTAR Electric, which are not owned by Eversource or its consolidated subsidiaries and are not subject to mandatory redemption, have been presented as noncontrolling interests in the fmancial statements of Eversource. The Preferred Stock of CL&P and the Preferred Stock ofNSTAR Electric are considered to be temporary equity and have been classified between liabilities and permanent shareholders' equity on the balance sheets ofEversource, CL&P and NSTAR Electric due to a provision in the preferred stock agreements of both CL&P and NSTARElectric that grant preferred stockholders the right to elect a majority of the CL&P and NSTARElectric Boards of Directors, respectively, should certain conditions exist, such as if preferred dividends are in arrears for a specified amount of time. The Net Income reported in the statements of income and cash flows represents net income prior to apportionment to noncontrolling interests, which is represented by dividends on preferred stock of CL&P and NSTAR Electric.
As of December 31, 2015 and 2014, Eversource's carrying amount of goodwill was approximately $3.5 billion. Eversource performs an assessment for possible impairment of its goodwill at least annually. Eversource completed its annual goodwill impainnent test for each of its reporting units as of October 1, 2015 and detemined that no impairment exists. See Note 21, "Goodwill," for fut1her information.
C. Accounting Standards Accounting Standards Issued but not Yet Effective: In May 2014, the Financial Accounting Standards Board (FASB) issued an Accounting Standards Update (ASU) 2014-09, Revenue from Contracts with Customers, which amends existing revenue recognition guidance and is required to be applied retrospectively (either to each reporting period presented or cumulatively at the date of initial application). In August 2015, the FASB issued ASU 2015-14, Revenue from Contracts with Customers -Deferral of the Effective Date, which defers the effective date of ASU 2014-09 to the first quarter of 2018, with 2017 application permitted. The Company is reviewing the requirements of ASU 2014-09 and will implement the standard in the first quarter of2018. The ASU is not expected to have a material impact on the financial statements ofEversource, CL&P, NSTAR Electric, PSNH or WMECO.
In January 2016, the FASB issued ASU 2016-01, Financial Instruments-Overall: Recognition and Measurement of Financial Assets and Liabilities, which is required to be implemented in the frrst quarter of2018. The Company is reviewing the requirements of the ASU. The ASU will remove the available-for-sale designation for equity securities, whereby changes in fair value are recorded in other comprehensive income in shareholders' equity, and will require changes in fair value of all equity securities to be recorded in earnings beginning on January 1, 2018, with the unrealized gain or loss on available-for-sale equity securities as of that date reclassified to retained earnings as a cumulative effect of adoption. The fair value of available-for-sale equity securities subject to this guidance as of December 31, 2015 was approximately $52 million. The remaining available-for-sale equity securities included in marketable securities on the balance sheet are hefd in nuclear decommissioning trusts and are subject to regulatory accounting treatment and will not be impacted by this guidance. Implementation of the ASU for other fmancial instruments is not expected to have a material impact on the financial statements ofEversource, CL&P, NSTAR Electric, PS:NH or WMECO~
On February 25, 2016, the FASB issued ASU 2016-02, Leases, which changes existing lease accounting guidance and is required to be i'ipplied in the first quarter of2019, with earlier application permitted. The ASU is required to be implemented for leases beginning on the date of initial application. For prior periods presented, leases are required to be recognized and measured using a modified retrospective approach. The Company is reviewing the requirements of ASU 2016-02.
Recently Adopted Accounting Standards: In April2015, the FASB issued ASU 2015~03, SimplifjJing the Presentation of Debt Issuance Costs, that changed the balance sheet presentation of debt issuance costs. Under the ASU, issuance costs related to debt are presented on the balance sheet as a direct deduction from the carrying amount of the debt liability rather than as a deferred cost. The new accounting guidance is effective for interim and annual periods beginning in the first quarter of 2016 with early adoption permitted and is required to be applied retrospectively. On December 31, 2015, the Company adopted the new accounting guidance and applied it retrospectively to aU prior periods presented in the financial statements. The adoption of this ASU did not have a material effect on the balance sheets and had no impact on the results of operations or cash flows ofEversource, CL&P, NSTAR Electric, PSNH or WMECO. See Note 8, "Long-Tenn Debt," for the prior year amounts that have been retrospectively adjusted.
IFERC FORM NO.1 (ED. 12-88) Page 123.4

'(· .
(
Name of Respondent This Report is: Date of Report Year/Period of Report (1) 2S, An Original (Mo, Da, Yr)
NSTAR Electric Company (2) A Resubmission I I . 2015104
NOTES TO FINANCIAL STATEMENTS (Continued)
On November 20, 2015, the F ASB issued ASU 2015-17, Balance Sheet Classification of Deferred Taxes, that required all deferred tax liabilities and aSsets, along with any related valuation alloWance, be classified as noncurrent on the balance sheet. This new accounting guidance is effective for interhn and annual periods beginning in the first quarter of 2017 with early adoption permitted and may be applied either prospectively or retrospectively. On December 31, 2015, the Company adopted the new accounting guidance and applied it prospectively. The adoption of this ASU did not have a material effect on the balance sheets and had no impact on the results of operations or cash flows ofEversource, CL&P, NSTAR Electric, PSNH or VlMECO. The current portion of Accumulated Deferred Income Taxes as of December 31, 2014, which was included in Total
· Current Liabilities on the balance sheets, was $160.3 million for Eversource, $34.1 million for CL&P, $55.1 million for NSTAR Electric, $36.2 million for PSNH, and $18.1 million for WMECO.
D. Cash and Cash Equivalents Cash and cash equivalents include cash on hand and short-tenn cash investments that are highly liquid in nature and have original maturities of three months or less. At the end of each reporting period, any overdraft amounts are reclassified from Cash and Cash Equivalents to Accounts Payable on the balance sheets.
E. Provision for Uncollectible Accounts Eversource, including CL&P, NSTAR Electric~ PSNH and WMECO, presents its receivables at estimated net realizable value by maintaining a provision for uncollectible accounts. This provision is detennined based upon a variety of judgments and factors, including the application of an estimated uncollectible percentage to each receivable aging category. The estimate is based upon historical collection and write-off experience and management's assessment of collectability from customers. Management continuously assesses the collectability of receivables and adjusts collectability estimates based on actual experience. Receivable balances are written off against the provision for uncollectible accounts when the customer accounts are terminated and these balances are deemed to be uncollectible.
The PURA allows CL&P andY ankee Gas to accelerate the recovery of accounts receivable balances attributablt? to qualified customers under fmancial or medical duress (uncollectible hardship accounts receivable) outstanding for greater than 180 days and 90 days, respectively. The DPU allows WiviECO and NSTAR Gas to also recover in rates amounts associated with certain uncollectible hardship accounts receivable. Certain of NSTAR Electric's uncollectible hardship accounts receivable are expected to be recovered in future rates, similar to WMECO and NSTAR Gas. Uncollectible customer account balances, which are expectyd to be recovered in rates, are included in Regulatory Assets or Other Long-Term Assets on the balance sheets.
TI1e total provision for uncollectible accounts and for uncollectible hardship accounts, which is included in the total provision, are included in Receivables, Net on the balance sheets, and were as follows:
(Millions of Dollars) Eversource CL&P NSTAR Electric PSNH WMECO
$
Total Provision for Uncollectible Accounts
As of December 31,
2015 2014
190.7 $ 79.5 52.6
8.7 14.0
175.3 84.3 40.7
7.7 9.9
F. Fuel, Materials and Supplies and Allowance Inventory
Uncollectible Hardship
As ofDecember31,
2015 2014
$ 118.5 $ 68.1 25.3
91.5 74.0
6.2
Fuel, Materials and Supplies include natural gas, coal, biomass and oil inventories as well as materials purchased primarily for construction or operation and maintenance purposes. Natural gas, coal, biomass and oil inventories are valued at their respective weighted average cost. Materials and supplies are valued at the loWer of average cost or market.
Fuel, Materials and Supplies also include Renewable Energy Certificates (RECs), which are purchased from suppliers of renewable sources of generation. RECs are used to meet state mandated Renewable Portfolio Standards requirements.
IFERC FORM N0.1 (ED. 12-88) Page 123.5

(
Name of Respondent This Report is: Date of Report Year/Period of Report (1) 2$; An Original (Mo, Da, Yr)
NSTAR Electric Company (2) A Resubmission I I 2015104
NOTES TO FINANCIAL STATEMENTS (Continued)
PSNH is subject to federal and state laws and regulations that regulate emissions of air pollutants, including S02, COz, and NOx related to its
regulated generation units, and uses SOz, COz, and NOx emissions allowances. At the end of each compliance period, PSNH is required to
relinquish SOz, COz, and NOx emissions allowances corresponding to the actual respective emissions emitted by its generating units over the compliance period. SOz and NOx emissions allowances are obtained through an annual allocation from the federal and state regulators that are granted at no cost and through purchases from third parties. COz emissions allowances are obtained through an annual allocation from the state
regUlator that are granted at no cost and are acquired through auctions and through purchases from third parties. S02, C02, and NOx emissions
allowances are charged to expense based on their weighted average cost as they are utilized against emissions volumes at PSNH's generating units. ~02, C02, and NOx emissions allowances are recorded within Fuel, Materials and Supplies on the balance sheet and are classified as short-term or
long-term depending on the period in which they are expected to be utilized against actual emissions. Current S02 and C02 emissions allowances
were classified as Fuel, Materials and Supplies on the balance sheets and long-term S02 and C02 emissions allowances were classified as Other
Long-Term Assets on the balance sheets.
The carrying amount of fuel, materials and supplies, RECs, and emission allowances were as follows:
As of December 31,
2015 2014
NSTAR NSTAR (lvfillions of Dollars) Eversource Electric PSNH Eversource Electric PSNH
Current: Fuel $ 152.5 $ $ 103.4 $ 164.3 $ $ 95.1 Materials and Supplies 131.2 32.2 44.6 159.5 49.1 52.2 RECs 50.9 43.3 7.0 25.8 25.1 0.7 Emission Allowances 1.9 1.9 0.1 0.1
Long~ Term: Emission Allowances 17.5 17.5 20.1 20.1
G. Deposits As of December 31, 2015, Eversource, CL&P, NSTAR Electric and PSNH had $17.1 million, $0.7 million, $8.5 million and $1.5 million, respectively, of cash collateral posted not subject to master netting agreements, with ISO-NE related to energy purchase transactions, which was included in Prepayments and Other Current Assets on the balance sheets. As of December 31, 2014, these amounts were $9.9 million, $1.2 million and $2.5 million for Eversource, CL&P and PSNH, respectively.
H. Fair Value Measurements Fair value measurement guidance is applied to derivative contracts that are not elected or deSignated as "nonnal purchases or normal sales" (normal) and to the marketable securities held in trusts. Fair value measurement guidance is also applied to valuations of the investments used to calculate the funded status of pension and PBOP plans, the nonrecurring fair value measurements of nonfinancial assets such as goodwill and AROs, and the estimated fair value of preferred stock and long-tenn debt.
Fair Value Hierarchy: In measuring fair value, Eversource uses observable market data when available in order to minimize the use of unobservable inputs. Inputs used in fair value measurements are categorized into three fair value hierarchy levels for disclosure purposes. The entire fair value measurement is categorized based on the lowest level of input that is significant to the fair value measurement. Eversource evaluates the classification of assets and liabilities measured at fair value on a quarterly basis, and Eversource's policy is to recognize transfers between levels of the fair value hierarchy as of the end of the reporting period. The three levels of the fair value hierarchy are described below:
Levell- Inputs are quoted prices (unadjusted) in active markets for identical assets or liabilities as of the reporting date. Active markets are those in which transactions for the asset or liability occur in sufficient frequency and volume to provide pricing infonnation on an ongoing basis.
~evel2 -Inputs are quoted prices for similar instruments in active markets, quoted prices for identical or similar instruments in markets that are not active, and model-derived valuations in which ail significant inputs are observable.
Level 3 -Quoted market prices are not available. Fair value is derived from valuation techniques in which one or more significant inputs or assumptions are unobservable. \Vhere possible, valuation techniques incorporate observable market inputs that can be validated to external sources such as industry exchanges, including prices of energy and energy-related products.
lFERC FORM NO. 1 (ED. 12-88) Page 123.6

(
Name of Respondent This Report is: Date of Report Year/Period of Report (1) 2$, An Original (Mo, Da, Yr)
NSTAR Electric Company (2) A Resubmission I I 2015104
NOTES TO FINANCIAL STATEMENTS (Continued) .
Determination of Fair Value: The valuation teclmiques and inputs used in Eversource's fair value measurements are described in Note 4, "Derivative Instruments," Note 5, "Marketable Securities," Note 6, rrAsset Retirement Obligations," Note 9A, "Employee Benefits- Pension Benefits and Postretirement Benefits Other Than Pensions," and Note 13, "Fair Value of Financial Instruments" to the financial statements.
I. Derivative Accounting Many of the Regulated companies' contracts for the purchase and sale of energy or energy-related products are derivatives. The accounting treatment for energy contracts entered into varies and depends on the intended use of the particular contract and on whether or not the contract is a derivative. For the Regulated companies, regulatory assets or regulatory liabilities are recorded to offset the fair values of derivative contracts, as contract settlements are recovered from, or refunded to, customers in future rates.
The application-of derivative accounting is complex and requires management judgment in the following respects: identification of derivatives and embedded ~edvatives, election and designation of a contract as normal, and detennination of the fair value of derivative contracts. All of these judgments can have a significant impact on the fmancial statements.
The judgment applied in the election of a contract as normal (and resulting accrual accounting) includes the conclusion that it is probable at the inception of the contract and throughout its term that it will result in physical delivery of the underlying product and that the quantities will be used or sold by the business in the normal course of business. If facts and circumstances change and management can no longer support this conclusion, then a contract cannot be considered nonnal and accrual accounting is terminated, and fair value accounting is applied prospectively.
The fair value of derivative contracts is based upon the contract tenus and conditions and the underlying market price or fair value per unit. When quantities are not specified in the contract, the Company determines whether the contract has a determinable quantity by using amouilts referenced in default provisions and other relevant sections of the contract. The fair value of derivative assets and liabilities with the same counterparty are offset and recorded as a net derivative asset or liability on the balance sheets.
All changes in the fair value of derivative contracts are recorded as regulatory assets or liabilities and do not impact net income.
For further infonnation regarding derivative contracts, see Note 4, uDerivative Instruments," to the financial statements.
J. Equity Method Investments Equity investments are included in Other Long-Term Assets on the balance sheets and net earnings related to these equity investments are included in Other Income, Net on the statements of income.
Regional Decommissioned Nuclear Companies: CL&P, NSTAR Electric, PSNH and Wl\.1ECO own common stock in three regional nuclear generation companies (CY APC, Y AEC and MY APC, collectively referred to aS the Yankee Companies), each of which owned a single nuclear generating facility that has been decommissioned. For CL&P, NSTAR Electric, PSNH and W1v1ECO, the respective investments in CYAPC, YAEC and MY APC are accounted for under the equity method. Eversource consolidates CYAPC andY AEC because CL&P's, NSTAR Electric's, PSNH's and WMECO's combined ownership interest in each of these entities is greater than 50 percent. Intercompany transactions between CL&P, NSTAR Electric, PSNH and WMECO and the CY APC andY ABC companies have been eliminated in consolidation of the Eversource financial statements.
CL&P's, NSTAR Electric's, PSNH's and WlviECO's ownership interests in the Yankee Companies and the total carrying values, which were included in Other Long-Term Assets on their respective balance sheets, were as follows:
Ownership Interests (percent) Carrying Amount (in millions)
As of December 31, 2015 and 2014 As of December 31,
CYAPC YAEC MYAPC 2015 2014
CL&P 34.5% 24.5% 12.0% $ 1.2 $ 1.2 NSTAR Electric 14.0 14.0 4.0 0.5 0.5 PSNH 5.0 7.0 5.0 0.3 0.3 WMECO 9.5 7.0 3.0 0.3 0.3
For further infonnation on the Yankee Companies, see Note 11 C, "Commitments and Contingencies - Contractual Obligations-Yankee Companies," to the financial statements.
\FERC FORM MO. 1 (ED.12-88) Page 123.7

(
Name of Respondent This Report is: Date of Report Year/Period of Report (1) 2S An Original (Mo, Da, Yr)
NSTAR Electric Company (2) A Resubmission I I 2015104
NOTES TO FINANCIAL STATEMENTS (Continued)
Infi·astructure and Other Investments: As of December 31, 2015 and 2014, Eversource had an equity ownership interest in an energy investment fund of $30.3 million and $17.8 million, respectively. Eversource had a 40 percent equity ownership interest in the Algonquin Gas Transmission, ~ LLC (legal entity that owns Access Northeast assets) of$10.7 million as of December 31, 2015.
K. Revenues Regulated Companies' Retail Revenues: The Regulated companies' retail revenues are based on rates approved by their respective state regulatory commissions. In general, rates can only be changed through formal proceedings with the state regulatory commissions. The Regulated companies' rates are designed to recover the costs to provide service to their customers, and include a return on investment. The Regulated companies also utilize regulatory cornrnission~approved tracking mechanisms to recover certain costs on a fully-reconciling basis. These tracking mechanisms require rates to be changed periodically to ensure recovery of actual costs incurred.
CL&P (effective December I, 2014), WMECO, and NSTAR Gas (effective January I, 2016), each have a regulatory commission approved revenue decoupling mechanism. Distribution revenues are decoupled from customer sales volumes, which breaks the relationship between sales volumes and revenues recognized. CL&P and WMECO reconcile their annual base distribution rate recovery to pre-established levels of baseline distribution delivery service revenues. Any difference between the allowed level of distribution revenue and the actual amount incurred during a 12-month period is adjusted through rates in the following period.
A significant portion of the Regulated companies1 retail revenues relate to the recovery of costs incurred for the sale of electricity and natural gas purchased on behalf of customers. These energy supply costs are recovered from customers in rates through cost tracking mechanisms. Energy purchases are recorded in Purchased Power, Fuel and Transmission, and the sales of energy associated with these purchases are recorded in Operating Revenues.
Regulated Companies' Unbilled Revenues: Because customers are billed throughout the month based on pre-determined cycles rather than on a calendar month basis, an estimate of electricity or natural gas delivered to customers for which the customers have not yet been billed is calculated as of the balance sheet date. Unbilled revenues are included in Operating Revenues on the statements of income and in Current Assets on the balance sheets. Actual amounts billed to customers when meter readings become available may vary from the estimated amount
The Regulated companies estimate unbilled sales monthly using the daily load cycle method. The daily load cycle method allocates billed sales to the current calendar month based on the daily load for each billing cycle. The billed sales are subtracted from total month load, net of delivery losses, to estimate unbilled sales. Unbilled revenues are estimated by first allocating unbilled sales to the respective customer classes, then applying an estimated rate by customer class to those sales. The estimate ofunbilled revenues can significantly impact the amount of revenues recorded at NSTAR Electric and PSNH because they do not have a revenue decoupling mechanism. CL&P and W}.I[ECO record a regulatory deferral to reflect the actual allowed amount of revenue for decoupling.
Regulated Companies' Transmission Revenues- Wholesale Rates: Wholesale transmission revenues are recovered through PERC approved fonnula rates. Wholesale transmission revenues for CL&P, NSTAR Electric, PSNH, and WMECO are collected through a combination of regional and local rates, both of which are under the ISO New England Transmission, Markets and Services Tariff(ISO-NE Tariff). The ISO-NE Tariff includes Regional Network Service (RNS), Schedule 21 ~ ES rate schedules, which recoVer the costs of transmission and other transmission-related services for CL&P, PSNH and WMECO, and Schedule 21 - NSTAR rate schedules, which recover costs of transmission and other transmission-related services forNSTAR Electric. The RNS rate, administered by !SO-NE and billed to all New England transmission load, including CL&P, NSTAR Electric, PSNH and WMEC01s distribution buSinesses, is reset on June 1st of.each year and recovers the revenue requirements associated with Pool Transmission Facilities (PTF) that benefit the entire New England region. The Schedule 21-ES rate and Schedule 21- NSTAR rate are administered by Eversource and recover any PTF costs not recovered under RNS rates, as well as the cost of transmission facilities associated with the respective utility1S local system. The Schedule 21 - ES rate is reset on January 1st and June 1st of each year, while the Schedule 21 -·NSTAR rate is reset on June 1st of each year. The Schedule 21-ES rate and Schedule 21 - NSTARrate calculations recover total transmission revenue requirements net of revenues received from other sources (i.e., RNS, rentals, etc.), thereby ensuring that Eversource recovers all of CL&P's, NSTAR Electric's, PSNH's and WMEC01S regional and local transmission revenue requirements in accordance with the ISO-NE Tariff. The RNS, Schedule 21 - ES rate and Schedule 21 - NSTAR rate provide for the annual reconciliation and recovery or refund of estimated costs to actual costs. The financial impacts of differences between actual and estimated costs are deferred for future recovery from, or refunded to, transmission customers. See Note liE, ~~commitments and Contingencies- FERC ROE Complaints," for complaints filed at the FERC relating to Eversource1s ROE.
Regulated Companies·' Transmission Revenues- Retail Rates: A significant portion ofthe Eversource transmission segment revenue comes from ISO-NE charges to the distribution businesses of CL&P, NSTAR Electric, PSNH and WMECO, each of which recovers these costs through rates charged to their retail customers. CL&P, NST AR Electric, PSNH and WMECO each have a retail transmission cost tracking mechanism as part of their rates, which allows the electric distribution companies to charge their retail customers for transmission costs on a timely basis.
JFERC FORM NO.1 (ED. 12-88) Page 123.8

(
Name of Respondent This Report is: Date of Report Year/Period of Report (1) X An Original (Mo, Da, Yr)
NSTAR Electric Company (2) A Resubmission I I 2015104
NOTES TO FINANCIAL STATEMENTS (Continued)
L. Operating Expenses COsts related to fuel and natural gas included irt Purchased Power, Fuel and Transmission on the statements of income were as follows:
{Millions of Dollars)
Eversource -Natural Gas and Fuel
PSNH-Fuel
2015
$
For the Years Ended December 31,
516.7 $
85.4
2014
599.4 $
113.4
M. Allowance for Funds Used During Construction
2013
466.5
104.8
AFUDC represents the cost of borrowed and equity funds used to finance construction and is included in the cost of the Regulated companies1 utility plant on the balance sheet. The portion of AFUDC attributable to borrowed funds is recorded as a reduction of Other Interest Expense, and the AFUDC related to equity funds is recorded as Other Income, Net on the statements of income. AFUDC costs are recovered from customers over the service life of the related plant in the form of increased revenue collected as a result of higher depreciation expense.
The Regulated companies' average AFUDC rate is based on a PERC-prescribed formula using the cost of a company's short-term fmancings and capitalization (preferred stock, long-term debt and common equity), as appropriate. The average rate is applied to average eligible CWIP amounts to calculate AFUDC.
AFUDC costs and the weighted-average AFUDC rates were as follows:
Eversource For the Years Ended December 31,
(Jv.fillions of Dollars, except percentages) 2015 2014 2013
Borrowed Funds $ 7.2 $ 5.8 $ 4.1 Equity Funds 18.8 13.7 7.1
TotalAFUDC $ 26.0 $ 19.5 $ 11.2
Average AFUDC Rate 3.9% 3.4% 2.7%
For the Years Ended December31,
2015 2014 2013
(Jv.fillions of DOllars, NSTAR NSTAR NSTAR except percentages) CL&P Electric PSNH WMECO CL&P Electric PSNH WMECO CL&P Electric PSNH WMECO ---Borrowed Funds $ 2.6 $ 2.0 $ LO $ LO $ L9 $ 2.0 $ 0.6 $ 0.9 $ 2.2 $ 0.5 $ 05 $ 0.5
Equity Funds 5.2 4.3 L2 L7 2.9 3.8 0.6 L7 2.9 0.2 LO
TotaiAFUDC $ 7.8 $ 63 $ 2.2 $ 2.7 $ 4.8 $ 5.8 $ L2 $ 2.6 $ 5.1 $ 0.5 $ 0.7 $ 1.5 ---Average AFUDC Rate 5.5% 3.2% 1.8% 4.4% 3.4% 2.5% 1.8% 5.6% 3.7% 0.5% 1.1% 6.1%
N. Other Income, Net Items included within Other Income, Net on the statements of income primarily consist of investment income/(loss), interest income, AFUDC related to equity funds, and equity in earnings of equity method investees. Investment income/(loss) primarily relates to debt and equity securities held in trust. For further information, see Note 5, "Marketable Securities, 11 to the financial statements. For further information on AFUDC related to equity funds, see Note 1M, "Summary of Significant Accounting Policies- Allowance for Funds Used During Construction," to the financial statements.
0. Other Taxes Gross receipts taxes levied by the state of Connecticut are collected by CL&P and Yankee Gas from their respective customers. These gross receipts taxes are shown separately with collections in Operating Revenues and with payments in Taxes Other Than Income Taxes on the statements of income as follows:
(Millions of Dollars) Eversource CL&P
$ 2015
For the Years Ended December 31,
147.2 $ 128.5
2014
148.2 $ !27.9
/FERC FORM NO.1 (ED. 12-88)
2013
Page 123.9
144.1 128.2

I \
Name of Respondent This Report is: Date of Report Year/Period of Report (1) X An Original (Mo, Da, Yr)
NSTAR Electric Company (2) A Resubmission I I 2015104
NOTES TO FINANCIAL STATEMENTS (Continued)
As agents for state and local governments, Eversource's companies that serve customers in Connecticut and Massachusetts collect certain sales taxes that are recorded on a net basis with no impact on the statements of income.
P. Supplemental Cash Flow Information
Eversource
(Millions of Dollars) Cash Paid During the Year for:
Interest, Net of Amounts Capitalized Income Taxes
Non-Cash Investing Activities: Plant Additions Included _in Accounts Payable (As of)
$
2015
NSTAR
As of and For the Years Ended December 31,
2015 2014 2013
365.9 $ 10.3
216.6
349.6 $ 334.2
181.9
343.3 50.0
193.1
As of and For the Years Ended December 31,
2014
NSTAR
2013
NSTAR
(Millions of Dollars) ~ ~ PSNH WMECO CL&P Electric 2.§!:!!!_ ~ CL&P ~ 2.§!:!!!_ ~ Cash Paid/(Received) During the Year for:
Interest, Net of Amounts Capitalized $ 144.4 $ 75.7 $ 42.3 $ 26.7 $ 144.1 $ 75.3 $ 41.1 $ 25.9 $ 131.6 $ 75.8 $ 43.3 $ 25.8 Income Taxes 55.2 (19.8) 14.4 14.7 135.4 217.1 2.3 25.1 55.0 163.4 (30.1) (69.0)
Non~Cash Investing Activities: Plant Additions Included in
Accounts Payable (As of) 76.0 23.5 46.5 27.0 63.5 34.6 39.3 14.2 51.4 57.0 34.9 19.5
The 2015 cash paid for interest excludes interest payments made by CL&P and WMECO in connection with the full satisfaction of their respective obligations to the DOE for the disposal of spent nuclear fuel and high-level radioactive waste. For further information, see Note 8, "Long-Term Debt," to the financial statements .
.Jn 2014, as a result of damages awarded to the Yankee-Gompanies for spent nuclear fuel lawsuits against the DOE described in Note I lC, "Commitments and Contingencies- Contractual Obligations- Yankee Companies," Eversource received total proceeds of$132.1 million, which were net of $80.6 million in proceeds CY APC andY AEC returned to non-affiliated member companies.
Q. Related Parties Eversource Service, Eversource's service company, provides centralized accounting, administrative, engineering, financial, information technology,~ legal, operational, planning, purchasing, and other services to Eversource's companies. The Rocky River Realty Company, Renewable Properties, Inc. and Properties, Inc., three other Eversource subsidiaries, construct, acquire or lease some of the property and facilities used by Eversource's companies.
As of both December 31, 2015 and 2014, CL&P, PSNH and WMECO had long-term receivables from Eversource Service in the amounts of$25 million, $3.8 million and $5.5 million, respectively, which were included in Other Long-Term Assets on the balance sheets. These amounts related to the funding of investments held in trust by Eversource Service in connection with certain postretirement benefits for CL&P, PSNH and Wiv.lECO employees and have been eliminated in consolidation on the Eversource financial statements.
Included in the CL&P, NSTAR Electric, PSNH and WMECO balance sheets as of December 31, 2015 and 2014 were Accounts Receivable from Affiliated Companies and Accounts Payable to Affiliated Companies relating to transactions between CL&P, NSTAR Electric, PSNH and Wl\tlECO and other subsidiaries that are wholly-owned by Eversource. These amounts have been eliminated in consolidation on the Eversource financial statements.
R. Severance Benefits For the years ended December 31, 2015, 2014 and 2013, Eversource recorded severance benefit expense of$4.7 million, $15 million and $9.7 million, respectively, in connection with organizational and cost saving initiatives, and, in 2014, the partial outsourcing ofinfmmation technology functions. As of December 31,2015 and 2014, the severance accrual totaled $9.3 million and $10.4 million, respectively, and was included in Other Current Liabilities on the balance sheets.
IFERC FORI\II NO.1 (ED. 12-88) Page 123.10

(
Name of Respondent This Report is: Date of Report Year/Period of Report (1) ~An Original (Mo, Da, Yr)
NSTAR Electric Company (2j . A Resubmission I I 2015104
NOTES TO FINANCIAL STATEMENTS (Continued)
2. REGULATORY ACCOUNTING
Eversource's Regulated companies are subject to rate-regulation that is based on cost recovery and meets the criteria for application of accounting guidance for rate-regulated operations, which considers the effect of regulation on the timing of the recognition of certain revenues and expenses. The Regulated companies' fmancial statements reflect the effects of the rate-making prOcess. The rates charged to the customers of Eversource's Regulated companies are designed to collect each company's costs to provide service, including a return on investment.
Management believes it is probable that each of the Regulated companies will recover their respective investments in long-lived assets, including regulatory assets. If management were to determine that it could no longer apply the accounting guidance applicable to rate-regulated enterprises to any of the Regulated companies' operations, or if management could not conclude it is probable that costs would be recovered from customers in future rates, the costs would be charged to net income in the period in which the determination is made.
Regulatory Assets: The components of regulatory assets were as follows:
Eversource As ofDecember 31,
(lvfillions of Dollars) 2015 2014
Benefit Costs $ 1,828.2 $ 2,016.0 Derivative Liabilities 388.0 425.5 h1come Ta-xes, Net 650.9 635.3 Stom1 Restoration Costs 436.9 502.8 Goodwill-related 484.9 505.4 Regulatory Tracker Mechanisms 526.5 350.5 Contractual Obligations - Yankee Companies 134.4 123.8 Other Regulatory Assets 134.0 167.3 Total Regulatory Assets 4,583.8 4,726.6 Less: Current Portion 845.8 672.5 Total Long-Term Regulatory Assets $ 3,738.0 $ 4,054.1
As of December 31,
2015 2014
NSTAR NSTAR (Millions of Dollars) CL&P Electric PSNH WMECO CL&P Electric PSNH WMECO
Benefit Costs $ 413.6 $ 479.9 $ 164.2 $ 84.9 $ 445.4 $ 515.9 $ 174.3 $ 85.0 Derivative Liabilities 380.8 1.3 410.9 4.5 Income Taxes, Net 444.4 85.7 34.5 31.8 437.7 83.7 38.0 35.5 Stom1 RestoratiOn Costs 271.4 110.9 31.5 23.1 319.6 103.7 47.7 31.8 Goodwill-related 416.3 433.9 Regulatory Tracker Mechanisms 45.1 311.0 101.2 40.1 16.1 141.4 103.5 33.0 Other Regulatory Assets 82.0 56.3 31.5 11.3 66.1 94.7 41.3 12.9 Total Regulatory Assets 1,637.3 1,461.4 362.9 191.2 1,695.8 1,377.8 404.8 198.2 Less: Current Portion 268.3 348.4 105.0 56.2 220.3 198.7 111.7 51.9 Total Long-Term Regulatory Assets $ 1,369.0 $ 1,113.0 $ 257.9 $ 135.0 $ 1,475.5 $ 1,179.1 $ 293.1 $ 146.3
Benefit Costs: Eversource's Pension, SERP and PBOP Plans are accounted for in accordance with accounting guidance on defined benefit pension and other PBOP plans. The liability recorded by the Regulated companies to recognize the funded status of their retiree benefit plans is offSet by a regulatory asset in lieu of a charge to Accumulated Other Comprehensive Income/(Loss ), reflecting ultimate recovery from customers through rates. The regulatory asset is amortized as the actuarial gains and losses and prior service cost are amortized to net periodic benefit cost for the pension and PBOP plans. All amounts are remeasured annually. Regulatory accounting is also applied to the portions ofEversource's service company costs that support the Regulated companies, as these amounts are also recoverable. As these regulatory assets do not represent a cash outlay for the Regulated companies, no carrying charge is recovered from customers.
CL&P, NSTAR Electric, PSNH and WMECO recover benefit costs related to their distribution and transmission operations from customers in rates as allowed by their applicable regulatory commissions. NSTAR Electric and WMECO each recover their qualified pension and PBOP expenses related to distribution operations through rate reconciling mechanisms that fully track the change in net pension and PBOP expenses each year.
Derivative Liabilities: Regulatory assets are recorded as an offset to derivative liabilities and relate to the fair value of contracts used to purchase energy and energy-related products that will be recovered from customers in future rates. These assets are excluded from rate base and are being recovered as the actual settlements occur over the duration of the contracts. See Note 4, "Derivative Instruments," to the financial statements for
l_, / further infonnation on these contracts.
IFERC FORM NO.1 (ED.12-88) Page 123.11

(
(
Name of Respondent This Report is: Date of Report Year/Period of Report (1) X An Original (Mo, Da, Yr)
NSTAR Electric Company (2\ A Resubmission I I 2015104
NOTES TO FINANCIAL STATEMENTS (Continued)
Income Taxes. Net: The tax effect of temporary book~ tax differences (differences between the periods in which transactions affect income in the fmancial statements and the periods in which they affect the determination of taxable income, including those differences relating to uncertain tax positions) is accounted for in accordance with the rate-making treatment of the applicable regulatory commissions and accounting guidance for income taxes. Differences in income taxes between the accounting guidance and the rate-making treatment of the applicable regulatory conunissions are recorded as regulatory assets. As these assets are offset by deferred income tax liabilities, no carrying charge is collected. The amortization period-ofthese assets varies depending on the nature and/or remaining life of the underlying assets and liabilities. For further information regarding income taxes, see Note 10, 11lncome Taxes, u to the financial statements.
Storm Restoration Costs: The storm restoration cost deferrals relate to costs incurred for major storm events at CL&P, NSTAR Electric, PSNH and WNIECO that each company expects to recover from customers. A storm must meet certain criteria to qualify as a major storm with the criteria specific to each state jurisdiction and utility company. Once a storm qualifies as a major storm, all qualifYing expenses incurred during storm restoration efforts are deferred and recovered from customers. In addition to storm restoration costs, CL&P and PSNH are each allowed to recover pre-staging storm costs. Of the total deferred storm restoration costs, $197 million is pending regulatory approval (including $106 million atNSTAR Electric, $61 :ffiillion at PSNH, and $30 million at WlvfECO). Management believes the stonn restoration costs were prudent and meet the criteria for specific cost recovery in Connecticut, Massachusetts and New Hampshire, and that recovery from customers is probable through the applicable regulatory recovery process. Each electric utility has sought, or is seeking, recovery of its deferred stonn restoration costs through its applicable regulatory recovery process. Each electric utility company earns a return on its deferred stoim restoration cost regulatory asset balance.
Goodwill-related: The goodwill regulatory asset originated from a 1999 merger transaction and the DPU allowed its recovery in NSTAR Electric and NSTAR Gas rates. This regulatory asset is currently being amortized and recovered from customers in rates without a canying charge over a 40-year period, and, as of December 31, 2015, there were 24 years of amortization remaining.
Regulatory Tracker Mechanisms: The Regulated companies' approved rates are designed to recover their costs incurred to provide service to customers. The Regulated companies recover certain of their costs on a fully-reconciling basis through regulatory commission-approved tracking mechanisms. The differences between the costs incurred (or the rate recovery allowed) and the actual revenues are recorded as regulatory assets (for undercollections) or as regulatory liabilities (for overcollections) to be included in future customer rates each year. Carrying charges are recorded on all material regulatory tracker mechanisms.
CL&P, NSTAR Electric, PSNH and WMECO each recover, on a fully reconciling basis, the costs associated with the procurement of energy, transmission related costs from PERC-approved transmission tariffs, energy efficiency progran1s (including LBR at NSTAR Electric), low income assistance programs, certain uncollectible accounts receivable for hardship customers, and restructuring and stranded costs as a result of deregulation. Energy procurement costs at PSNH include the costs related to its generating stations and at WMECO include the costs related to its solar generation.
CL&P (effective December 1, 2014) and WMECO each have a regulatory commission approved revenue decoupling mechanism. Distribution revenues are decoupled from customer sales volumes, which breaks the relationship between sales volumes and revenues recognized. CL&P and WMECO reconcile their annual base distribution rate recovery to pre-established levels of baseline distribution delivery service revenues. Any difference between the allowed level of distribution revenue and the a~tual amount received during a 12-month period is adjusted through rates in the following period CL&P and WMEC01S revenue decoupling mechanisms permit recovery of an annual base amount of distribution revenues of $1.059 billion and $132.4 million, respectively.
Contractual Obligations- Yankee Companies: CL&P, NSTAR Electric, PSNH and VV1'v1ECO are responsible for their proportionate share ofthe remaining costs of the CY APC, Y AEC and MY APC nuclear facilities, including nuclear fuel storage. A portion of these costs was recorded as a regulatory asset. Amounts for CL&P are earning a return and are being recovered through the CTA. Amounts for NSTAR Electric and WMECO are being recovered without a return through the transition charge. Amounts for PSNH were fully recovered in 2006. As a result ofEversource1S
consolidation of CY APC andY AEC, Eversource1S regulatory asset balance also includes the regulatory assets of CY APC andY AEC, which totaled $110.9 million and $97.8 million as of December 31, 2015 and 2014, respectively. Intercompany transactions between CL&P, NSTAR Electric, PSNH and WMECO and the CYAPC and YAEC companies have been eliminated in consolidation of the Eversource financial statements.
Other Regulatory Assets: Other Regulatory Assets primarily include asset retirement Obligations, environmental remediation costs, losses associated with the reacquisition or redemption of long-term debt, purchase power contract termination costs and various other items.
IFERC FORM NO.1 (ED. 12-88) Page 123.12

(
(
Name of Respondent This Report is: Date of Report Year/Period of Report (1) X An Original (Mo, Da, Yr)
NSTAR Electric Company (2) A Resubmission I I 2015104
NOTES TO FINANCIAL STATEMENTS (Continued)
Regulatmy Costs in Other Long-Term Assets: The Regulated companies had $75.3 million (including $3.1 million for CL&P, $35.4 million for N"STAR Electric, $4.8 million for PSNH and $16.7 million for WMECO) and $60.5 million (including $1.3 million for CL&P, $33.2 million for NSTARElectric, $0.9 million for PSNH, and $11 million for WMECO) of additional regulatory costs as of December 31, 2015 and 2014, respectively, that were included in Other LongRTenn Assets on the balance sheets. These amounts represent incurred costs for which recovety has net yet been specifically approved by the applicable regulatory agency. However, based on regulatory policies or past precedent on similar costs, management believes it is probable that these costs will ultimately be approved and recovered from customers in rates. The NSTAR Electric balance as of December 31, 2015 and 2014 primarily related to the deferral of certain bad debt costs expected to be recovered in future rates.
Equity Return on Regulat01y Assets: For rate-making purposes, the Regulated companies recover the carrying costs related to their regulatory assets. For certain regulatory assets, the carrying cost recovered includes an equity return component. This equity return, which is not recorded on the balance sheets, totaled $1.5 million and $1.7 million for CL&P as of December 31,2015 and 2014, respectively. These carrying costs will be recovered from customers in future rates.
As of December 31, 2015 and 2014, this equity return, which is not recorded on the balance sheets, totaled $48.3 million and $43.3 million, respectively, for PSNH. These amounts include $25 million of equity retum on the Clean Air Project costs that PSNH has agreed not to bill customers pending NHPUC approval of a generation divestiture settlement agreement. For further information on the divestiture, see Note llH, "Commitments and Contingencies- PSNH Generation Restructuring."
Regulatory Liabilities: The components of regulatory liabilities were as follows:
Eversource
(Millions of Dollars) Cost of Removal Regulatory Tracker Mechanisms AFUDC- Transmission Other Regulatory Liabilities Total Regulatory Liabilities Less: Current Portion Total Long-Tenn Regulatory Liabilities
(Millions of Dollars) Cost of Removal Regulatory Tracker Mechanisms AFUDC - Tr.ansmission Other Regulatory Liabilities Total Regulatory Liabilities Less: CurrentPortion Total Long~ Term Regulatory Liabilities
CL&P
$ 24.1 $ 56.2 51.5 4.2
136.0 61.2
$ 74.8 $
2015
$
$
2015
NSTAR Electric PSNH
257.4 $ 47.2 $ 3.3 3.4 5.7 1.3 4.2
267.7 54.8 3.3 6.9
264.4 $ 47.9 $
As of December 31,
2014
437.1 $ 439.9 99.7 192.3 66.1 67.1 18.5 50.8
621.4 750.1 107.8 235.0 513.6 $ 515.1
As of December 31,
2014
NSTAR WMECO CL&P Electric PSNH WMECO
2.8 $ 19.7 $ 258.3 $ 50.3 $ 1.1 12.9 122.6 20.7 14.2 22.3 8.9 53.6 4.4 9.1 0.1 10.1 28.9 2.9 0.8
24.7 206.0 312.3 67.4 33.3 13.1 124.7 49.6 16.0 22.5 11.6 $ 81.3 $ 262.7 $ 51.4 $ 10.8
Cost of Removal: Eversource1s Regulated companies currently recover amounts in rates for future costs of removal of plant assets over the lives of the assets. The estimated cost to remove utility assets from service is recognized as a component of depreciation expense and the cumulative amount collected from customers but not yet expended is recognized as a regulatory liability. Expended costs that exceed amounts collected from customers are recognized as regulatory assets, as they are probable of recovery in future rates.
AFUDC- Transmission: Regulatory liabilities were recorded by CL&P and WMECO for AFUDC accrued on certain reliability-related transmission projects to reflect local rate base recovery as a result of a PERC-approved transmission tariff. A regulatory liability was recorded by NSTAR Electric for AFUDC accmed on certain reliability-related transmission projects through December 31, 2015 to reflect local rate base recovery. These regulatory liabilities for CL&P, NSTARElectric and WMECO will be amortized over the depreciable life of the related transmission assets.
jFERC FORM NO.1 (ED.12-88) Page 123.13

( '
(
Name of Respondent This Report is: Date of Report Year/Period of Report (1) 2S An Original (Mo, Da, Yr)
NSTAR Electric Company (2) A Resubmission I I 2015/04
NOTES TO FINANCIAL STATEMENTS (Continued)
2015 Regulatory Developments: PERC ROE Complaints: As a result of the actions taken by the PERC and other developments in the pending ROE complaint proceedings describ;S'd in Note liE, "Commitments and Contingencies- PERC ROE Complaints," Eversource recorded reserves for the first and second ROE complaints,
· which were recorded as a regulatory liability and as a reduction to operating revenues. The cumulative pre-tax reserves (excluding interest) as of December 31, 2015, which include the impact of refunds given to customers, totaled $39.1 million for Eversource (including-$21.4 million for CL&P, $8.5 million for NSTAR Electric, $3.I million for PSNH, and $6. I million for WMECO).
NSTAR Electric and NSTAR Gas Comprehensive Settlement Agreement: On March 2, 2015, the DPU approved the comprehensive settlement agreement between NSTAR Electric, NSTAR Gas and the Massachusetts Attorney General (the "Settlement") as filed with the DPU on December 3I, 20I4. The Settlement resolved the outstanding NSTARElectric CPSL program filings for 2006 through 2011, the NSTAR Electric and NSTAR Gas PAM and energy efficiency-related customer billing adjustments reported in 2012, and the recovery of LBR related to NST AR Electric's energy efficiency programs for 2009 through 20I I (II dockets in total). In 20I5, as a result of the DPU order, NSTAR Electric and NSTAR Gas commenced refunding a combined $44.7 million to customers, which was recorded as a regulatory liability. Refunds to customers will continue through December 2016. As a result of the Settlement, NSTAR Electric increased its operating revenues and decreased its amortization expense in 2015, resulting in the recognition of a $21.7 million pre-tax benefit in 2015.
NSTARElectric Basic Service Bad Debt Adder: On January 7, 20I5, the DPU issued an order concluding that NSTAR Electric had removed energy-related bad debt costs from base distribution rates effective January C 2006. As a result of the DPU order, in the first quarter of 2015, NSTAR Electric increased its regulatory assets and reduced its operations and maintenance expense by an under recovered amount of$24.2 million for energy-related bad debt costs through 2014, resulting in a pre-tax benefit in 2015. NSTAR Electric filed for recovery of the energy-related bad debt costs regulatory asset from customers and on November 20, 2015 the DPU approved NSTAR Electric's proposed rate increase to recover these costs over a 12-month period, effective January I, 2016.
CL&P Distribution Rates: On July 2, 2015, PURA issued a final order that approved a settlement agreement filed on May I9, 2015, which allows for an increase to rate base of approximately $163 million associated with ADIT, including a regulatory asset to recover the incremental revenue requirement for the period December 1, 2014 through November 30, 2015 over a subsequent 24-month period. The rate base increase provided an increase to total allowed annual revenue requirements of $18.4 million begiDlling December I, 20 I 4. As part of the settlement agreement, the $18.4 million for the period December 1, 2014 through November 30, 2015 was recorded as a regulatory asset with a corresponding increase in Operating Revenues, and is being collected from customers in rates over a 24~month period beginning December 1, 2015.
NSTAR Gas Distribution Rates: On October 30,2015, the DPU issued its order in the NSTAR Gas distribution rate case, which approved an annualized base rate increase of$15.8 million, plus other increases of approximately $11.5 million, mostly relating to recovery of pension and PBOP expenses and the Hopkinton GSA, effective January 1, 2016. In the order, the DPU also approved an authorized regulatory ROE of9.8 percent, the establishment of a revenue decoupling mechanism, the recovery of certain bad debt expenses, and a 52. I percent equity component of its capital structure. On November 19, 2015, NSTAR Gas filed a motion for reconsideration of the order with the DPU seeking the correction of mathematical errors and other plant and cost of service items.
As a result of this order, Eversource recorded regulatory deferrals for costs that have be' en approved for recovery or are expected to be approved for recovery in future rate proceedings, which resulted in the recognition of a $17.2 million pre-tax benefit in 2015. Included in this amount is a $10.5 million pre-: tax benefit recorded at NSTAR Electric for certain uncollectible hardship accounts receivable that are expected to be recovered in future rates given the allowed recoveries of uncollectible hardship accounts receivable by WMECO and NSTAR Gas.
IFERC FORM N0.1 (ED.12-88) Page 123.14

Name of Respondent This Report is: Date of Report Year/Period of Report (1) 6 An Original (Me, Da, Yr)
NSTAR Electric Company (2) A Resubmission I I 20151Q4
NOTES TO FINANCIAL STATEMENTS (Continued)
3. PROPERTY, PLANT AND EQUIPMENT AND ACCUMULATED DEPRECIATION
Utility property, plant and equipment is recorded at original cost. Original cost includes materials, labor, construction overhead and AFUDC for regulated property. The cost of repairs and maintenance, including planned major maintenance activities, is charged to Operating Expenses as itlcurred.
The following tables summarize the investments in utility property,.plant and equipment by asset category:
Eversource As of December 31,
(Millions of Dollars) 2015 2014
Distribution - Electric $ 13,054.8 $ 12,495.2
Distribution - Natural Gas 2,727.2 2,595.4
Transmission - Electric 7,691.9 6,930.7
Generation 1,194.1 1,170.9
Electric and Natural Gas Utility 24,668.0 23,192.2
Other (1) 558.6 551.3
Property, Plant and Equipment, Gross 25,226.6 23,743.5
Less: Accumulated Depreciation Electric and Natural Gas Utility (6,14l.l) (5, 777.8)
Other (255.6) (231.8)
Total Accumulated Depreciation (6,396. 7) (6,009.6)
Property, Plant and Equipment, Net 18,829.9 17,733.9
Construction Work in Progress 1,062.5 913.1
Total Property, Plant and Equipment, Net $ 19,892.4 $ 18,647.0
( (1) These assets are primarily comprised of building improvements, computer software, hardware and equipment at E:versource Service.
As of December 31,
2015 2014
NSTAR NSTAR (Millions of Dollars) CL&P Electric PSNH WMECO CL&P Electric PSNH WMECO Distribution $ 5,377.2 $ 5,100.5 $ 1,804.8 $ 812.3 $ 5,158.8 $ 4,895.5 $ 1,696.7 $ 784.2 Transmission 3,618.0 2,131.3 928.2 964.9 3,274.0 1,928.5 789.7 891.0 Generation 1,158.1 36.0 1,136.5 34.4 Property, Plant and Equipment, Gross 8,995.2 7,231.8 3,89l.l 1,813.2 8,432.8 6,824.0 3,622.9 1,709.6
Less: Acc_umulated Depreciation (2,041.9) (1,886.8) (1,171.0) (307.0) (1,928.0) (1,761.4) (1,090.0) (297.4) Property, Plant and Equipment, Net 6,953.3 5,345.0 2,720.1 1,506.2 6,504.8 5,062.6 2,532.9 1,412.2 Construction Work in Progress 203.5 310.5 135.3 69.1 304.9 272.8 102.9 49.1 Total Property, Plant and Equipment, Net $ 7,156.8 $ 5,655.5 $ 2,855.4 $ 1,575.3 $ 6,809.7 $ 5,335.4 $ 2,635$ $ 1,461.3
As of December 31, 2015, PSNH had $1.2 billion in gross generation utility plant assets and related Accumulated Depreciation of$522.4 million. These generation assets are the subject of a divestiture agreement entered into on June 10,2015 between Eversource, PSNH and key New Hampshire officials whereby, among other resolutions, PSNH has agreed to divest these generation assets upon NHPUC approval. Upon completion of the divestiture process, remaining costs not recovered by the sale of these assets (stranded costs) will be recovered via bonds that will be secured by a non-bypassable charge or other recovery mechanisms in rates billed to PSNH's customers. See Note llH, "Commitments and ContingenciesPSNH Generation Restructuring," for further infonnation.
Depreciation of utility assets is calculated on a straight-line basis using composite rates based on the estimated remaining useful lives ofthe various classes of property (estimated useful life for PSNH distribution). The composite rates, which are subject to approval by the appropriate state regulatory agency, include a cost of removal component (other than PSNH Generation), which is cOllected from customers over the lives· of the plant assets and is recognized as a regulatory liability. Depreciation rates are applied to property from the time it is placed in service.
I FERC FORI\Il NO.1 (ED. 12-88) Page 123.15

(
Name of Respondent This Report is: Date of Report Year/Period of Report (1) ~An Original (Mo, Da, Yr)
NSTAR Electric Company iz) A Resubmission I I 2015104
NOTES TO FINANCIAL STATEMENTS (Continued)
Upon retirement from service, the cost of the utility asset is charged to the accumulated provision for depreciation. The actual incurred removal costs are applied against the related regulatory liability.
The depreciation rates for the various classes of utility property, plant and equipment aggregate to composite rates as follows:
{Percent) 2015 2014 2013
Eversource 2.9% 3.0% 2.8% CL&P 2.7% 2.7% 2.5% NSTAR Electric 3.0% 3.0% 2.9% PSNH 3.2% 3.0% 3.0% WMECO 2.7% 3.3% 2.9%
The following table summarizes average remaining useful lives of depreciable assets:
(Years) Distribution Transmission Generation Other
Eversource
34.8 41.6 30.7 14.1
4. DERIVATIVEINSTRUMENTS
As of December 31, 2015
CL&P 37.3 38.7
NST AR Electric
31.9 43.8
PSNH
31.3 41.6 30.9
WMECO
30.5 50.0 25.0
The Regulated companies purchase and procure energy and energy-related products, which are subject to price volatility, for their customers. The costs associated with supplying energy to customers are recoverable from customers in future rates. The Regulated companies manage the risks associated with the price volatility of energy and energy-related· products through the use of derivative and nonderivative contracts.
Many of the derivative contracts meet the definition of, and are designated as, nonnal and qualifY for accrual accounting under the applicable accounting guidance. The costs and benefits of derivative contracts that meet the definition ofnonnal are recognized in Operating Expenses or Operating Revenues on the statements of income, as applicable, as electricity or natural gas is delivered.
Derivative contracts that are not designated as normal are recorded at fair value as current or long-term Derivative Assets or Derivative Liabilities on the balance sheets. For the Regulated companies, regulatory assets or regulatory liabilities are recorded.to offset the fair values of derivatives, as contract settlement amounts are recovered from, or refunded to, customers in their respective energy supply rates.
IFERC FORM f\10.1 (ED. 12-88) Page 123.16

Name of Respondent This Report is: Date of Report Year/Period of Report (1) ~An Original (Mo, Da, Yr)
NSTAR Electric Company (2) A Resubmission I I 2015104
NOTES TO FINANCIAL STATEMENTS (Continued)
The gross fair values of derivative assets and liabilities with the same counterparty are offset and reported as net Derivative Assets or Derivative Liabilities, with current and long-tenn portions, on the balance sheets. The following table presents the gross fair values of contracts, categorized by risk type, and _the net amounts recorded as current or long-term derivative assets or liabilities:
(Millions of Dollars) Current Derivative Assets: Level3:
Eversource CL&P NSTAR Electric
Long-Term Derivative Assets: Lcvel2:
Eversource Level3:
Eversource CL&P NST AR Electric
Current Derivative Liabilities: 'Level2:
Eversource Level3:
Eversource CL&P NSTAR Electric
$
$
$
Long-Term Derivative Liabilities: Level2:
Eversource Level3:
Eversource CL&P NSTAR Electric
$
Commodity Supply and Price Risk
Management
16.7 $ 16.7
0.1 $
62.0 60.7
1.3
(5.8) $
(92.3) (91.8) (0.5)
(337.1) (336.2)
(0.9)
$
2015
Netting (1)
(10.9) $ (10.9)
(19.3) (19.3)
$
$
$
As of December 31,
Net Amount Recorded as
a Derivative
5.8 5.8
0.1
42.7 41.4
1.3
$
$
(5.8) $
(92.3) (91.8) (0.5)
(337.1) (336.2)
(0.9)
$
Commodi(y Supply and Price rusk
Management
16.2 $ 16.1 0.1
93.5 93.5
$
(9.8) $
(90.0) (88.5)
(1.5)
(0.3) $
(409.3) (406.2)
(3.1)
2014
Neffino (1)
(6.6) $ (6.6)
(19.2) (19.2)
$
$
$
Net Amount Recorded as
a Derivative
9.6 9.5 0.1
74.3 74.3
(9.8)
(90.0) (88.5)
(1.5)
(0.3)
(409.3) (406.2)
(3.1)
(1) Amounts represent derivative assets and liabilities that Eversource elected to record net on the balance sheets. These amounts are subject to master netting agreements or similar agreements for which the right of offset exists.
The business activities that result in the recognition of derivative assets also create exposure to various counterparties. As of December 31, 2015, Eversource's and CL&P's derivative assets were exposed to counterparty credit risk. OfEversource's and CL&P's derivative assets, approximately $4 7 million was contracted with investment grade entities.
For further information on the fair value of derivative contracts, see Note ll-I, "Summary of Significant Accounting Policies- Fair Value Measurements," and Nate 11, "Summary of Significant Accounting Policies - Derivative Accounting," to the financial statements.
Derivative Contracts At Fair Value with Offsetting Regulatory Amounts Commodity Supply and Price Risk Management: As required by regulation, CL&P, along with UI, has capacity-related contracts with generation facilities. CL&P has a sharing agreement with UI, with 80 percent of the costs or benefits Of each contract borne by or allocated to CL&P and 20 percent borne by or allocated to UI. The combined capacity of these contracts is 787 MW. The capacity contracts extend through 2026 and obligate both CL&P and ur to make or receive payments on a monthly basis to or from the generation facilities based on the difference between a set capacity price and the capacity market price received in the ISO-NE capacity markets. In addition, CL&P has a contract to purchase 0.1 million MWh of energy per year through 2020.
IFERC FORM N0.1 (ED.12-88) Page 123.17

(
I \
l/
Name of Respondent This Report is: Date of Report Year/Period of Report (1) D; An Original (Mo, Da, Yr)
NSTAR Electric Company (2) A Resubmission I I 2015104
NOTES TO FINANCIAL STATEMENTS (Continued)
· NSTAR Electric has a renewable energy contract to purchase 0. I million MWh of energy per year through 2018 and a capacity-related contract to purchase up to 35 MW per year through 2019.
As of December 31, 2015 and 2014, Eversource had NYMEX financial contracts for natural gas futures in order to reduce variability associated with the purchase price of approximately 9.1 million and 8.8 million :M:MBtu of natural gas, respectively.
For the years ended December 31,2015, 2014 and 2013, there were losses of$60.2 million and gains of$134.4 million and $160.6 million, respectively, deferred as regulatory costs, which reflect the change in fair value associated with Eversource's derivative contracts.
Credit Risk Certain ofEversource's derivative contracts contain credit risk contingent provisions. These provisions require Eversource to maintain investment grade credit ratings from the major rating agencies and to post collateral for contracts in a net liability position over specified credit limits. As of December 31, 2015 and 2014, Eversource had $5.8 million and $10 million, respectively, of derivative contracts in a net liability position that were subject to credit risk contingent provisions and would have been required to post additional collateral of $5.8 million and $10 miliion, respectively, if Eversource parent1s unsecured debt credit ratings had been downgraded to below investment grade.
Fair Value Measurements of Derivative Instruments Derivative contracts classified as Level2 in the fair value hierarchy relate to the financial contracts for natural gas futures. Prices are obtained from broker quotes and are based on actual market activity. The contracts are valued using NYMEX natural gas prices. Valuations of these contracts also incorporate discount rates using the yield curve approach.
The fair value of derivative contracts classified as Level 3 utilizes significant unobservable inputs. The fair value is modeled using income techniques, such as discounted cash flow valuations adjusted for assumptions relating to exit price. Significant observable inputs for valuations of these contracts include energy and energy-related product prices in future years for which quoted prices in an active market exist. Fair value measurements categorized in Level 3 of the fair value hierarchy are prepared by individuals with expertise in valuation techniques, pricing of energy and energy-related products, and accounting requirements. The future power and capacity prices for periods that are not quoted in an active market or established at auction are based on available market data and are escalated based on estimates of inflation in order to address the full time period of the contract.
Valuations of derivative contracts using a discounted cash flow methodology include assumptions regarding the timing and likelihood of scheduled payments and also reflect non-perfonnance risk, including credit, using the default probability approach based on the counterparty1s credit rating for assets and the Company's credit rating for liabilities. Valuations incorporate estimates of premiums or discounts that would be required by a market participant to arrive at an exit price, using historical market transactions adjusted for the terms of the contract.
The following is a summary ofEversource's, including CL&P's and NSTARElectric's, Level3 derivative contracts and the range of the significant unobservable inputs utilized in their respective valuations over the duration of the contracts:
As of December 31,
2015 2014
Range Period Covered Range Period Covered
Capacitv Prices: Eversource $ 10.81 - 15.82 per kW-Month 2016-2026 $ 5.30 - 12.98 per kW-Month 2016-2026 CL&P $ 10.81 - 12.60 per kW-Month 2019-2026 $ I LOS - 12.98 per kW-Month 2018-2026 NSTAR Electric $ 10.81 - 15.82 per kW-Month 2016-2019 $ 5.30 - I LID per kW-Month 2016-2019
Forward Reserve: Eversource, CL&P $ 2.00 per kW-Month 2016-2024 $ 5.80 - 9.50 per kW-Month 20!5 -2024
REC Prices: Eversource, NSTAR Electric $ 45 -51 perREC 20!6-2018 $ 38 -56 perREC 2015-2018
Exit price premiums of 5 percent to 22 percent are also applied on these contracts and reflect the uncertainty and illiquidity premiums that would be required based on the most recent market activity available for similar type contracts.
[FERC FORM NO.1 (ED. 12-88) Page 123.18

Name of Respondent This Report is: Date of Report Year/Period of Report (1) 2$, An Original (Mo, Da, Yr)
NSTAR Electric Company (2) A Resubmission I I 20151Q4
NOTES TO FINANCIAL STATEMENTS (Continued)
Valuations using significant unobservable inputs: The following table presents changes in the Level3 category of derivative assets and derivative liabilities measured at fair value on a reclllTing basis. The derivative assets and liabilities are presented on a net basis.
(Millions of Dollars) Eversource CL&P NSTAR Electric
Derivatives Net: Fair Value as of January I, 2014 $ (635.2) $ (630.6) $ (7.3) Net Realized/Unrealized Gains Included in
Regulatory Assets and Liabilities 141.3 139.7 4.3 Settlements 78.5 80.0 (1.5)
Fair Value as of December 31, 2014 $ (415.4) $ (410.9) $ (4.5) Net Realized/Unrealized Losses Included in
Regulatory Assets and Liabilities (52.!) (51.3) (0.8) Settlements 86.6 81.4 5.2
Fair Value as ofDecember 31,2015 $ (380.9) $ (380.8) $ (0.1)
Significant increases or decreases in future energy or capacity prices in isolation would decrease or increase, respectively, the fair value of the derivative liability. Any increases in risk premiums would increase the fair value of the derivative liability. Changes in these fair values are recorded as a regulatory asset or liability and do not impact net income.
5. MARKETABLE SECURITIES
Eversource maintains trusts that hold marketable securities to fund certain non-qualified executive benefits. These trusts are not subject to regulatory oversight by state or federal agencies. CYAPC and YAEC maintain legally restricted trusts, each of which holds markett;~.ble securities, to fund the decommissioning and spent nuclear fuel removal obligations of their nuclear fuel storage facilities.
Wl'vffiCO maintained a spent nuclear fuel trust to fund WMEC01s pre-1983 spent nuclear fuel obligation. In late 2015, this trust was liquidated to satisfY the spent nuclear fuel obligation with the DOE. For further infonnation, see Note 8, 11Long-Term Debt. 11
f Trading Securities: Eversource has elected to record certain equity securities as trading securities, with the changes in fair values recorded in Other \ Income, Net on the statements of income. As of December 31, 2015 and 2014, these securities were classified as Levell in the fair value hierarchy
and totaled $14.2 million and $85.1 million, respectively. For the years ended December 31, 2015, 2014 and 2013, net gains on these securities of $2 million, $1.9 million and $10.2 million, respectively, were recorded in Other Income, Net on the statements of income. Dividend income is recorded in Other Income, Net when dividends are declared. In 2015, certain of the securities classified as trading securities were sold and the proceeds were re-invested in equity securities designated as available-for-sale securities.
Available-for-Sale Securities: The following is a summary of available-for-sale securities, which are recorded at fair value and are included in current and long-tenn Marketable Securities on the balance sheets.
As of December 31,
2015 2014
Pre-Tax Pre-Tax Pre-Tax Pre-Tax Amortized Unrealized Unrealized Amortized Unrealized Unrealized
(Millions of Dollars) Cost Gains Losses Fair Value Cost Gains Losses Fair Value
Eversource Debt Securities (1) (2) $ 256.5 $ 4.5 $ (0.6) $ 260A $ 313.0 $ 7.5 $ (0.3) $ 320.2
Equity Securities (1) 215.3 59.2 (3.4) 271.1 160.6 73.3 233.9 WMECO
Debt Securities (2) 58.2 (0.1) 58.1
(1) Amounts include CY APCs andY ABC's marketable securities held in nuclear decommissioning trusts of $436.9 million and $450.8 million as of December 31, 2015 and 2014, respectively. Unrealized gains and losses for the nuclear deconunissioi1ing trusts are reco'rded in Marketable Securities with the corresponding offset to Other Long-Term Liabilities on the balance sheets, with no impact on the statements of income.
(2) Unrealized gains and losses on debt securities held by WMECO were recorded in Marketable Securities with the corresponding offset to Other Long-TennAssets on the balance sheets.
IFERC FORM NO.1 (ED. 12-88) Page 123.19

(
Name of Respondent This Report is: Date of Report Year/Period of Report (1) 2$, An Original (Mo, Da, Yr)
NSTAR Electric Company (2) A Resubmission I I 2015104
NOTES TO FINANCIAL STATEMENTS (Continued)
Unrealized Losses and Other-than-Temporary Impairment: There have been no significant unrealized losses, other-than-temporary impairments or credit losses in 2015 or 2014. Factors considered in detennining whether a credit loss exists include the duration and severity of the impairment, adverse conditions specifically affecting the issuer, and the payment history, ratings and rating changes of the security. For asset-backed debt securities, underlying collateral and expected future cash flows are also evaluated.
Realized Gains and Losses: Realized gains and losses on available-for-sale securities are recorded in Other Income, Net for Eversource's benefit trust and are offset in Other Long-Term Liabilities for CYAPC andY ABC. Eversource utilizes the specific identification basis method for the Eversource benefit trust ·and the average cost basis method for the CY APC and Y AEC nuclear decommissioning trusts to compute the realized gains and losses on the sale of available-for-sale securities.
Contractual Maturities: As of December 31, 2015, the contractual maturities of available-for-sale debt securities were as follows:
Eversource
(Millions ofDollars)
Less than one year (I) One to five years Six to ten years Greater tl1an ten years Total Debt Securities
$
$
Amortized Cost
33.3 50.2 56.6
116.4 256.5
Fair Value
$ 33.2 50.7 57.2
119.3 $ 26D.4
(1) Amounts in the Less than one year category include securities in the CY APC andY AEC nuclear decommissioning trusts, which are restricted and are classified in long-term Marketable Securities on the balance sheets.
Fair Value Measurements: The following table presents the marketable securities recorded at fair value on a recurring basis by the level in which they are classified within the fair value hierarchy:
Eversource
(Millions ofDollars) Levell:
As of December 31,
Mutual Funds and Equities Money Market Funds
$
2015
285.3 26.9
312.2 Total Levell $ Level2: -'-----=-'-
U.S. Government Issued Debt Securities (Agency and Treasury) $
Corporate Debt Securities Asset-Backed Debt Securities Municipal Bonds Other Fixed Income Securities
46.6 43.9 20.0
11!.4 1!.6
233.5 545.7
Total Level2 $ Total Marketable Securities :;$-----'~:.;;.
$
$
$
$ $
2014
319.0 24.9
343.9
5!.3 49.1 54.!
II6.3 24.5
295.3 639.2
As of December 31, 2014, the \iVMECO spent nuclear fuel trust included investments in money market funds of $4.3 million classified as Level 1 in the fair value hierarchy, and $14.7 million of corporate debt securities, $14.5 million of asset-backed debt securities, $13 million of muniCipal bonds and $11.6 million of other fixed iricome securities classified as Level2 in the fair value hierarchy. The trust was liquidated in late 2015.
U.S. government issued debt securities are valued using market approaches that incorporate transactions for the same or similar bonds and adjustments for yields and maturity dates. Corporate debt securities are valued using a market approach, utilizing recent trades of the same or similar instrument and also incorporating yield curves. credit spreads and specific bond terms and conditions. Asset-backed debt securities include collateralized mortgage obligations, commercial mortgage backed securities, and securities collateralized by auto loans. credit card loans or receivables. Asset-backed debt securities are valued using recent trades of similar instruments, prepayment assumptions, yield curves, issuance and
. maturity dates, and tranche infonnation. Municipal bonds are valued using a market approach that incorporates reported trades and benchmark yields. Other fixed income securities are valued using pricing models, quoted prices of securities with similar characteristics, and discounted cash flows.
L, IFERC FORM N0.1 (ED.12-88) Page 123.20

( '
( \
Name of Respondent This Report is: Date of Report Year/Period of Report (1) X An Original (Mo, Da, Yr)
NSTAR Electric Company (2) A Resubmission I I 2015104
NOTES TO FINANCIAL STATEMENTS (Continued)
6. ASSET RETIREMENT OBLIGATIONS
Eversource, including CL&P, NSTAR Electric, PSNH and WMECO, recognizes a liability for 1he fair value of an ARO on 1he obligation date if the liability's fair value can be reasonably estimated and is conditional on a future event. Settlement dates and future costs are reasonably estimated when sufficient information becomes available. Management has identified various categories of .AROs, primarily certain assets containing asbestos and hazardous contamination, and has performed fair value calculations reflecting expected probabilities for settlement scenarios.
The fair value of an ARO is recorded as a liability in Other Long-Term Liabilities with a corresponding amount included in Property, Plant and Equipment, Net on the balance sheets. The ARO assets are depreciated, and the ARO liabilities are accreted over the estimated life of the obligation with corresponding credits recorded as accumulated depreciation and ARO liabilities, respectively. As the Regulated companies are rate-regulated on a cost-of-service basis, these companies apply regulatory accounting guidance and both the depreciation and accretion costs associated with the Regulated companies' AROs are recorded as increases to Regulatory Assets on the balance sheets_
A reconciliation of the beginning and ending carrying amounts of ARO liabilities are as follows:
Eversource As of December 31, (.Millions of Dollars) 2015 2014
Balance as of Beginning of Year $ 426.3 $ 424.9
Liabilities Incurred During the Year 6.6 1.3
Liabilities Settled During the Year (18.2) (19.5)
Accretion 26.5 25.1
Revisions in Estimated Cash Flows (11.1) (5.5)
Balance as of End of Year $ 430.1 $ 426.3
As of December 31,
2015 2014
NSTAR NSTAR {Millions of Dollars) CL&P Electric PSNH WMECO CL&P Electric PSNH WMECO
Balance as of Beginning of Year $ 35.3 $ 34.3 $ 20.6 $ 5.9 $ 35.0 $ 32.8 $ 19.5 $ 4.5 Liabilities Incurred During the Year 6.2 0.4 1.1 Liabilities Settled During the Year (1.5) (0.1) (1.1) Accretion 2.2 1.8 1.3 0.4 1.9 1.5 l.l 0.3 Revisions in Estimated Cash Flows (3.7) (5.5) (0.7) (0.5) (0.5)
Balance as of End of Year $ 33.8 $ 35.3 $ 21.6 $ 5.7 $ 35.3 $ 34.3 $ 20.6 $ 5.9
Eversource's amounts include CYAPC and YAEC's AROs of$319.1 million and $317.3 million as of December 31,2015 and 2014, respectively. The fair value of the ARO for CYAPC and YAEC includes uncertainties of the fuel off-load dates related to the DOE's timing of performance regarding its obligation to dispose of the spent nuclear fuel and high level waste_ The incremental asset recorded as an offset to the ARO liability was fully depreciated since the plants have no remaining useful life_ Any changes in the assumptions used to calculate the fair value of the ARO liability are recorded with a corresponding offset to the related regulatory asset_ The assets held in the CY APC andY AEC nuclear decorrrinissioning trusts are restricted for settling the ARO and all other decorrunissioning obligations. For further information on the assets held in the nuclear decommissioning trusts, see Note 5, "Marketable Securities," to the fmancial statements.
/FERC FORiiil NO.1 (ED. 12-88) Page 123.21

(
(
Name of Respondent This Report is: Date of Report Year/Period of Report (1) X An Original (Mo, Da, Yr)
NSTAR Electric Company (2) A Resubmission I I 2015104
NOTES TO FINANCIAL STATEMENTS (Continued)
7. SHORT-TERMDEBT
Short-Term Borrowing Limits: The amount of short-term borrowings that may be incurred by CL&P, NSTAR Electric and W1'v1ECO is subject to periodic approval by the FERC. As a result of the NHPUC having jurisdiction over PSNH's short-term debt, PSNH is not currently required to obtain FERC approval for its short-term borrowings. On June 16, 2015, the FERC granted authorization that allows CL&P and WMECO to incur ., total short-term borrowings up to a maximum of$600 million and $300 million, respectively, effective January I, 2016 through December 31,2017. On June 11, 2014, the FERC granted authorization to allow NSTAR Electric to issue total short-term debt securities in an aggregate principal amount not to exceed $655 million outstanding at any one time, effective October 24, 2014 through October 23, 2016.
PSNH is authorized by regulation of the NHPUC to incur short-term borrowings up to 10 percent of net fixed plant plus an additional $60 million until further ordered by the NHPUC. As of December 31, 2015, PSNHs short-term debt authorization under the 10 percent of net fixed plant test plus $60 million totaled approximately $325 million.
CL&P's certificate of incorporation contains preferred stock provisions restricting the amount of unsecured debt that CL&P may incur, including limiting unsecured indebtedness with a maturity of less than 10 years to I 0 percent of total capitalization. As of December 31, 2015, CL&P had $327.3 million of unsecured debt capacity available under this authorization.
Yankee Gas and NSTAR Gas are not required to obtain approval from any state or federal authority to incur short-term debt.
Credit Agreements and Commercial Paper Programs: Eversource parent, CL&P, PSNH, \VJv!ECO, NSTAR Gas and Yankee Gas are parties to a five-year $1.45 billion revolving credit facility. On October 26, 2015, this revolving credit facility was amended and restated and the termination date was extended to September 4, 2020. Under the revolving credit facility, CL&P has a borrowing sub limit of $600 million, and PSNH and WMECO each have borrowing sub limits of$300 million. The revolving credit facility serves to backstop Eversource parent's $1.45 billion commercial paper program. The commercial paper program allows Eversource parent to issue conunercial paper as a form of short-term debt. As of December 31, 2015 and 2014, EverSource parent had approximately $1.1 billion in short-term borrowings outstanding on each date under the Eversource parent commercial paper program, leaving $351.5 million and $348.9 million of available borrowing capacity as of December 31,2015 and 2014, respectively. The weighted-average interest rate on these borrowings as of December 31, 2015 and 2014 was 0.72 percent and 0.43 percent, respectively. As of December 31, 2015, there were intercompany loans from Eversource parent of $277.4 million to CL&P, $231.3 million to PSNH and $143.4 million to WMECO. As of December 31, 2014, there were intercompany loans from Eversource parent of$133.4 million to CL&P, $90.5 million to PSNH and $21.4 million to WMECO.
NSTAR Electric has afive~year $450 million revolving credit facility. On October 26, 2015, this revolving credit facility was amended and restated and the termination date was extended to September 4, 2020. The facility serves to backstop NSTAR Electric's $450 million commercial paper program. As of December 31, 2015 and 2014, NSTAR Electric had $62.5 million and $302 million, respectively, in short-tenn borrowings outstanding under its commercial paper program, leaving $387.5 million and $148 million of available borrowing capacity as of December 31,2015 Gmd 2014, respectively. The weighted-average interest rate on these borrowings as of December 31, 2015 and 2014 was 0.40 percent and 0.27 percent, respectively.
Except as described below, amounts outstanding under the commercial paper programs are included in Notes Payable for Eversource and NSTAR Electric and are classified in current liabilities on the balance sheets as all borrowings are outstanding for no more than 364 days at one time. Intercompany loans from Eversource parent to CL&P, PSNH and WNtECO are included in Notes Payable to Eversource Parent and are classified in current liabilities on their respective balance sheets. Intercompany loans from Eversource to CL&P, PSNH and WMECO are eliminated in consolidation on Eversource's balance sheets.
On January 15, 2015, Eversource parent issued $150 million of 1.60 percent Series G Senior Notes due to mature in 2018 and $300 million of3.15 percent Series H Senior Notes, due to mature in 2025. The proceeds, net of issuance costs, were used to repay short-term borrowings outstanding under the Eversource parent commercial paper program. As the debt proceeds, net of issuance costs, refinanced short-tenn debt, the short-term debt was classified as Long-Tenn Debt as of December 31, 2014. See Note 8, "Long-Term Debt/' for further information on these debt issuances.
Under the credit facilities described above, Eversource and its subsidiaries must comply with certain financial and non-financial covenants, including a consolidated debt to total capitalization ratio. As of December 31, 2015 and 2014, Eversource and its subsidiaries were in compliance with these covenants. IfEversource or its subsidiaries were not in compliance with these covenants, an event of default would occur requiring all outstanding borrowings by such borrower to be repaid and additional borrowings by such borrower would not be permitted under its respective credit facility.
\FERC FORM NO.1 (ED. 12-88) Page 123.22

Name of Respondent This Report is: Date of Report (1) 2S An Original (Mo, Da, Yr)
NSTAR Electric Company (2) A Resubmission I I
NOTES TO FINANCIAL STATEMENTS (Continued)
8. LONG-TERM DEBT
Details oflong-term debt outstanding are as foliows:
Cb&P As of December 31,
(Millions of Dollars)
First Mortgage Bonds: 7.875% 1994 Series D due 2024 5. 750%2004 Series B due 2034
5.000%2005 Series A due 2015
5.625%2005 Series B due 2035
6.350% 2006 Series A due 2036
5.375%2007 Series A due 2017
5. 750% 2007 Series B due 2037 5. 750%2007 Series C due 2017 6.375% 2007 Series D due 2037 5.650%2008 Series A due 2018
5.500% 2009 Series A due 2019 2.500%2013 Series A due 2023
4.300%2014 Series A due 2044
4.150% 2015 Series A due 2045
Total First Mortgage Bonds
Pollution Control Revenue Bonds: 4.375% Fixed Rate Tax Exempt due 2028
1.550% Fixed Rate TaxExemptdue2031
Total Pollution Control Revenue Bonds
Pre-1983 Spent Nuclear Fuel Obligation
Less Amounts due Within One Year
Unamortized Premiums and Discounts, Net Unamortized Debt Issuance CostsCl)
CL&P Long-Term DebtCl)
NSTAR Electric
(A.Ji/lions of Dollars)
Debentures:
5.750% due 2036
5.625% due 2017 5.500% due 2040 2.375% due 2022 Variable Rate due 2016 (0.6036% and 0.4721% as of December 31,2015 and 2014)
4.400% due 2044
3.250% due 2025
·Total Debentures
Bonds: 7.375% Tax Exempt Sewage Facility Revenue Bonds, due2015
Less Amounts due Within One Year Unamortized Premiums and Discounts, Net
Unamortized Debt Issuance Costs( I)
NSTAR Electric Long-Tenn Debt(l)
$
$
$
$
. IFERC FORM NO.1 (ED.12-88) Page 123.23
2015
139.8 $
130.0
100.0
250.0
150.0
150.0
100.0
100.0
300.0
250.0
400.0
250.0
350.0
2,669.8
120.5
120.5
(10.7)
(15.9)
2,763.7 $
As of December 31,
2015
200.0 $
400.0
300.0
400.0
200.0
300.0
250.0
2,050.0
(200.0) (8.5)
(11.7)
1,829.8 $
2014
139.8
130.0
100.0
100.0
250.0
150.0
150.0
100.0
100.0
300.0
250.0
400.0
250.0
2,419.8
120.5
62.0
182.5
244.5
(162.0)
(4.8)
(15.8)
2,664.2
2014
200.0
400.0
300.0
400.0
200.0
300.0
1,800.0
4.7
(4.7) (7.3)
(11.2)
1,781.5
Year/Period of Report
2015104

Name of Respondent This Report is: Date of Report Year/Period of Report (1) ~An Original (Mo, Da, Yr)
NSTAR Electric Company (2) A Resubmission I I 2015104
NOTES TO FINANCIAL STATEMENTS (Continued)
PSNH As of December 31,
{Millions of Dollars) 2015 2014
First Mortgage Bonds: 5.60% Series M due 2035 $ 50.0 $ 50.0
6.15% Series N due 2017 70.0 70.0
6.00% Series 0 due2018 110.0 110.0
4.50% Series P due 2019 150.0 150.0
4.05% Series Q due 2021 122.0 122.0
3.20% Series R due 2021 160.0 160.0
3.50% Series S due 2023 325.0 325.0
Total First Mortgage Bonds 987.0 987.0
Pollution Control Revenue Bonds:
Adjustable Rate Tax Exempt Series A due 2021 (0.193% and 0.175% as of December 31, 2015 and 2014) 89.3 89.3
Unamortized Premiums and Discounts, Net 0.1
Unamortized Debt Issuance Costs( I) (5.4) (6.3)
PSNH Long-Tenn Debt(!) $ 1,071.0 $ 1,070.0
WMECO As of December 31,
(Millions of Dollars) 2015 2014
Notes:
5.90% Senior Notes Series B, due 2034 $ 50.0 $ 50.0
5.24% Senior Notes Series C, due 2015 50.0
( 6.70% Senior Notes Series D, due 2037 40.0 40.0
5.10% Senior Notes Series E, due 2020 95.0 95.0
3.50% Senior Notes Series F, due 2021 250.0 250.0
3.88% Senior Notes Series G, due 2023 80.0 80.0
Total Notes 515.0 565.0
Pre-1983 Spent Nuclear Fuel Obligation 57.4
Less Amounts due Within One Year (50.0) Unamortized Premiums and Discounts, Net 5.2 6.1
Unamortized Debt Issuance Costs (1) (2.9) (3.3)
vrMECO Long-Tenn Debt (1) $ 517.3 $ 575.2
oTHER As of December 31,
(Millions of Dollars) 2015 2014
Yankee Gas- First Mortgage Bonds:
8.48% Series B due 2022 $ 20.0 $ 20.0
5.26% Series H due 2019 50.0 50.0
5.35% Series I due 2035 50.0 50.0
6.90% Series J due 2018 100.0 100.0
4.87% Series K due 2020 50.0 50.0
4.82% Series L due 2044 100.0 100.0
3.35% Series M due2025 75.0
Total First Mortgage Bonds 445.0 370.0
Unamortized Premium 0.4 0.6
Unamortized Debt Issuance Costs (1) (1.7) (1.5)
Yankee Gas Long-Term Debt (1) 443.7 369.1
l, I FERC FORM NO. 1 (Ell. 12-88) Page 123.24

~··
I \
(
Name of Respondent This Report is: Date of Report Year/Period of Report (1) 2$_ An Original (Mo, Da, Yr)
NSTAR Electric Company (2) A Resubmission I I 2015104
NOTES TO FINANCIAL STATEMENTS (Continued)
As of Decembea· 31,
{Millions of Dollars) 2015 2014
N~STAR Gas -First Mortgage Bonds:
9.95% Series 1 due 2020 25.0 25.0
7.11% Series K due 2033 35.0 35.0
7.04% Series M due 2017 25.0 25.0
4.46% Series N due 2020 125.0 125.0
4.35% Series 0 due 2045 100.0
Total First Mortgage Bonds 310.0 210.0
Unamortized Debt Issuance Costs (I) (0.8) (0.6)
NSTAR Gas Long-Tenn Debt (1) 309.2 209.4
Eversource Parent- Notes and Debentures:
4.50% Debentures due 2019 350.0 350.0
1.45% Senior Notes Series E due 2018 300.0 300.0
2.80% Senior Notes Series F due 2023 450.0 450.0
1.60% Senior Notes Series G due 2018 150.0
3.15% Senior Notes Series H due 2025 300.0
Eversource Parent Commercial Paper Borrowings 446.3
Total Eversource Parent Notes and Debentures 1,550.0 1,546.3
Pre-1983 Spent Nuclear Fuel Obligation (CYAPC) 179.5 179.4
Fair Value Adjustment (2) 173.5 202.3
Less Fair Value Adjustment- Current Portion (2) (28.9) (28.9)
Unamortized Premiums and Discounts, Net (1.3) (1.2)
Unamortized Debt Issuance Costs (1) (1.9) 1.1
Total Other Long-Tem1 Debt (I) $ 2,623.8 $ 2,477.5
Total Eversource Long-Tem1 Debt (1) $ 8,805.6 $ 8,568.4
(1) Effective December 31, 2015, the carrying amount ofLong-Tenn Debt includes unamortized debt issuance costs presented as a direct reduction from the carrying amount of the debt liability, in accordance with new accounting guidance. The December 31, 2014 carrying amount of Long-Term Debt was retrospectively adjusted to conform to the current year presentation. See Note IC, "Summary of Significant Accounting Policies- Accounting Standards, 11 for further information.
(2) The fair value adjustment amount is the purchase price adjustment, net of amortization, required to record the NSTAR long-term debt at fair value on the date of the merger.
Long-Term Debt Issuances: On January 15, 2015, Evers'ource parent issued $150 million of 1.60 percent Series G Senior Notes, due to mature in 2018, and $300 million of3.15 percent Series H Senior-Notes, due to mature in 2025. As the debt proceeds, pet of issuance costs, refinanced short-term debt, the short-term debt was classified as Long-Term Debt as of December 31, 2014. On May 20,2015 and December I, 2015, CL&P issued $300 million and $50 million, respectively, of 4.15 percent 2015 Series A First and Refunding Mortgage Bonds due to mature in 2045. On September 10, 2015, Yankee Gas issued $75 million of3.35 percent 2015 Series M First Mortgage Bonds due to mature in 2025. On November 18, 2015, NSTAR Electric issued $250 million of3.25 percent debentures, due to mature in 2025. On December 8, 2015, NSTAR Gas issued $100 million of 4.35 percent Series 0 First Mortgage Bonds due to mature in 2045. The proceeds of all debt issuances, net of issuance costs, were used to repay short-term borrowings and fund capital expenditures and working capital.
Long-Term Debt Repayments: On April!, 2015, CL&P repaid at maturity the $100 million 5.00 percent 2005 Series A First and Refunding Mortgage Bonds and also redeemed the $62 million 1996A Series 1.55 percent PCRBs that were subject to mandatory tender using short-term borrowings. On August 3, 2015, WMECO repaid at maturity the $50 million 5.24 percent Series C Senior Notes, using short-te1m borrowings.
I FERC FORM NO. 1 (ED. 12-88) Page 123.25

(
l~,'
Name of Respondent This Report is: Date of Report Year/Period of Report ( 1) X An Original (Mo, Da, Yr)
NSTAR Electric Company (2) A Resubmission I I 2015104
NOTES TO FINANCIAL STATEMENTS (Continued)
Long-Term Debt Issuance Authorizations: On November 25, 2015, PURA approved Yankee Gas' request to extend the authorization period for issuance of up to $125 million in long-tenm debt from December 31, 2015 to December 31, 2016. On December 4, 2015, the DPU authorized WMECO to issue up to $100 million in long-term debt for the period through December 31, 2016. On December 4, 2015, the DPU approved NSTARElectric's request to extend the authorization period for issuance of up to $250 million in long-term debt from December 31, 2015 to December 31,2016.
Long-Term Debt Provisions: The utility plant ofCL&P, PSNH, Yankee Gas and NSTAR Gas is subject to the lien of each company's respective first mortgage bond indenture. The Eversource parent, NSTAR Electric and WMECO debt is unsecured. Additionally, the long-term debt agreements provide that Eversource and certain of its subsidiaries must comply with certain covenants as are customarily included in such agreements, including a minimum equity requirement for NSTAR Gas. Under the minimum equity requirement, the outstanding long-tenn debt ofNSTAR Gas must not exceed equity.
CL&P's obligation to repay the PCRBs is secured by frrst mortgage bonds. The first mortgage bonds contain similar tenns and provisions as the applicable series ofPCRBs. IfCL&P fails to meet its obligations under the frrst mortgage bonds, then the holder of the first mortgage bonds (the issuer of the PCRBs) would have rights under the first mortgage bonds. CL&P's $120.5 million tax-exempt PCRBs will be subject to redemption at par on or after September 1, 2021. All other long-term debt securities are subject to make-whole provisions.
PSNH's obligation to repay the PCRBs is secured by flrst mortgage bonds and bond insurance. The first mortgage bonds contain similar tenns and provisions as the PCRBs. IfPSNH fails to meet its obligations under the first mortgage bonds, then the holder of the first mortgage bonds (the issuer of the PCRBs) would have rights under the first mortgage bonds. The PSNH Series A tax-exempt PCRBs are currently callable at 100 percent of par. The PCRBs bear interest at a rate that is periodically set pursuant to auctions. PSNH is not obligated to purchase these PCRBs, which mature in 2021, from the remarketing agent.
Yankee Gas has certain long-term debt agreements that contain cross-default provisions. No other debt issuances contain cross-default provisions as of December 31,2015.
Pre-1983 Spent Nuclear Fuel Obligation: Under the Nuclear Waste Policy Act of1982, CL&P and WMECO were obligated to pay tl1e DOE for the costs of disposal of pre-1983 spent nuclear fuel and high-level radioactive waste for the period prior to the sale of their ownership shares in the Millstone nuclear power stations, which were sold in March 2001. The DOE is responsible for the selection and development of repositories for, and the disposal of, spent nuclear fuel and high-level radioactive waste. After the sale of the Millstone nuclear power stations in March 2001, CL&P and WMECO remained responsible for their share of the disposal costs for nuclear fuel used to generate electricity prior to April 7, 1983 (pre-1983 Spent Nuclear Fuel) and recorded an accrual for the full liability thereof to the DOE. This liability accrued interest costs at the 3-month Treasury bill yield rate. As of December 31, 2014, CL&P and WMECO's pre-1983 Spent Nuclear Fuel obligation was $244.5 million and $57.4 million, respectively, which included accumulated interest costs of $178 million for CL&P and $41.8 million for WMECO.
In late 2015, CL&P and WMECO made payments of $244.6 million and $57.4 million, respectively, to fully satisfY their pre-1983 Spent Nuclear Fuel obligations to the DOE, which included accumulated interest of$178 million and $41.8 million, respectively. CL&P issued debt to fund its payment while WMECO liquidated its spent nuclear fuel trust.
In addition, as a result of consolidating CYAPC, Eversource has consolidated $179.5 million and $179.4 million, respectively, in additional pre-1983 spent nuclear fuel obligations to the DOE, which include accumulated interest costs of $130.7 million and $130.6 million as of December 31, 2015 and 2014, respectively. CYAPC maintains a trust to fund amounts due to the DOE for the disposal ofpre-1983 spent nuclear :fuel. For further information, see Note 5, "Marketable Securities," to the fmancial statements.
Long-Term Debt Maturities: Long-term debt maturities on debt outstanding for the years 2016 through 2020 and thereafter are shown below. These amounts exclude the CY APC pre-1983 spent nuclear fuel obligation, net unamortized premiums, discounts and debt issuance costs, and other fair value adjustments as ofDecember 31,2015:
(Millions of Dollars) Eversource CL&P 2016 $ 200.0 $ 2017 745.0 250.0 2018 960.0 300.0 2019 800.0 250.0 2020 295.0 Thereafter 5,736.6 1,990.3 Total $ 8,736.6 $ 2, 790.3
NSTAR Electric
$ 200.0 $ 400.0
1,450.0
$ 2,050.0 $
PSNH
70.0 110.0 150.0
746.3
1,076.3
$ WMECO
95.0 420.0
$ 515.0
·JFERC FORM NO.1 (ED. 12-88) Page 123.26

(
(
Name of Respondent This Report is: Date of Report Year/Period of Report ( 1) 2S An Original (Mo, Da, Yr)
NSTAR Electric Compa,ny (2) A Resubmission I I 2015/04
NOTES TO FINANCIAL STATEMENTS (Continued)
9. EMPLOYEE BENEFITS
A. Pension Benefits and Postretirement Benefits Other Than Pensions As of December 31, 20 I 4, Eversource Service sponsored two defined benefit retirement plans that covered eligible employees, including, among others, employees ofCL&P, NSTAR Electric, PSNH and WMECO. Effective January I, 2015, these two pension plans were merged into one plan, sponsored by Eversource Service (Pension Plan). The Pension Plan is subject to the provisions of ERISA, as amended by the PPA of2006. Eversource's policy is to annually fund the Pension Plan in an amount at least equal to an amount that will satisfy all federal funding requirements. In addition to the Pension Plan, Eversource maintains non-qualified defmed benefit retirement plans sponsored by Eversource Service (herein collectively referred to as the SERP Plans), which provide benefits in excess oflnternal Revenue Code limitations to eligible current and retired participants.
As of December 31, 2014, Eversource Service also sponsored defmed benefit postretirement plans that provided certain retiree benefits, primarily medical, dental and life insurance, to retired employees that met certain age and service eligibility requirements; including, among others, employees ofCL&P, NSTARElectric, PSNH and WMECO. Effective January I, 2015, these postretirement plans were merged into one plan, sponsored by Eversource Service (PBOP Plan). Under certain circumstances, eligible retirees are required to contribute to the costs of postretirement benefits. The benefits provided under the PBOP Plan are not vested and the Company has the right to modifY any benefit provision subject to applicable laws at that time. Eversource annually funds postretirement costs through tax deductible contributions to external trusts.
Because the Regulated companies recover the retiree b~nefit costs from customers through rates, regulatory assets are recorded in lieu of recording an adjustment to Accumulated Other Comprehensive Jncomei(Loss) for the funded status of the Pension, SERP and PBOP Plans. Regulatory accounting is also applied to the portions of the Eversource Service costs that support the Regulated companies, as these costs are also recovered from customers. Adjustments to the Pension and PBOP Plans funded status for the unregulated companies are recorded on an after-tax basis to Accumulated Other Comprehensive Income/(Loss). For further information, see Note 2, "Regulatory Accounting, 11 and Note 14, 11Accumulated Other Comprehensive Income/(Loss ), " to the fmancial statements.
For the year ended December 31, 2015, the difference between the actual return and calculated expected return on plan assets for the Pension and PBOP Plans are reflected as a component of unrecognized actuarial gains or losses, which are recorded in Regulatory Assets or Accumulated Other Comprehensive Income/(Loss). Umecognized actuarial gains or losses are amortized as a component of pension and PBOP expense over the estimated average future employee service period.
Pension and SERP Plans: On January 1, 2014, NSTARElectric & Gas was merged into Eversource Service (service company merger) and, concurrently, all employees were transferred to the company they predominantly provide services for: Eversource Service, NSTAR Electric or NST AR Gas. As a result of these employee transfers, the pension and SERP assets and liabilities ofNST AR Electric & Gas were attributed by participant and transferred to the applicable operating company's balance sheets. This change had no impact on the income statement or net assets of NSTAR Electric or Eversource.
I FERC FOR.I\Ii NO.1 (ED. 12-88) Page 123.27

(
Name of Respondent This Report is: Date of Report Year/Period of Report (1) 2S An Original (Mo, Da, Yr)
NSTAR Electric Company (2) A Resubmission I I 20151Q4
NOTES TO FINANCIAL STATEMENTS (Continued)
The Pension and SERP Plans are accounted for under the multiple-employer approach, with each operating company's balance sheet reflecting its share of the funded status of the plans. Although Eversource maintains marketable securities in a benefit trust, the SERF Plans do not contain any_") assets. For further information, see Note 5, "Mrirketable Securities," to the financial statements. The following tables provide information on the Pension and SERP Plan benefit obligations, fair values of Pension Plan assets, and funded status:
Eversource (Millions of Dollars) Change in Benefit Obligation Benefit Obligation as of Beginning of Year Service Cost Interest Cost Actuarial Gain/(Loss) Benefits Paid - Pension Benefits Paid - Lump Sum Benefits Paid - SERP Benefit Obligation as of End of Year Change in Pension Pian Assets Fair Value of Pension Pian Assets as of Beginning of Year Employer Contributions Actual Return on Pension Plan Assets Benefits Paid Benefits Paid - Lump Sum Fair Value of Pension Plan Assets as of End of Year
Funded Status as of December 31st
(Millions of Dollars) Change in Benefit Obligation Benefit Obligation as of Beginning of Year Change due to transfer of employees Service Cost htterest Cost Actuarial Gain/(Loss) Benefits Paid -Pension Benefits Paid- Lump Sum Benefits Paid- SERP
CL&P
$ (1,230.1) (4.6)
(24.7) (51.1) 77.8 60.2 14.5 0.4
$
Benefit Obligation as of End of Year $ (1,157.6) $ Change in Pension Plan Assets Fair Value of Pension Plan Assets as of Beginning of Year $ Change due to transfer of employees Employer Contributions Actual Return on Pension Plan Assets Benefits Paid Benefits Paid ·Lump Stun
980.8 $ 4.6
2.8 (60.2) (14.5)
913.5 $
$
$
$
$
$
Pension and SERP
As of December 31,
2015 2014
(5,486.2) $ (91.4)
(227.0) 331.5 238.5 149.5
(4,676.5) (79.9)
(225.7) (739.6) 230.3
5.0 5.2
( 5, 080 .I) -'-$ _ _,_( 5"-, 4'-'8-'-'6.2'-')
4,126.5 $ 154.6 12.3
(238.5) (149.5)
3,985.9 171.6 199.3
(230.3)
3,905.4 ::$ _ ___:4cc:,l.::26'"."-5
(1,174.7) '-$--'('-"1,3'-'5'-'9.'-'-7)
Pension and SERP
As of December 31, 2015
NSTAR Electric PSNH WMECO CL&P
(982.6) $ (580.7) $ (249.4) $ (1,083.4) $ 6.2 (1.9) (1.3) 26.4
(14.9) (12.1) (4.3) (20.2) (40.2) (24.3) (10.4) (50.5) 34.1 38.9 12.6 (16!.0) 47.6 23.2 12.7 58.3
9.1 2.5 0.1 0.2 0.3
(949.7) $ (547.6) $ (237.6) $ (1,230.1) $
879.0 $ 498.4 $ 234.0 $ 1,016.3 $ (6.2) 1.9 1.3 (26.4) 5.0 1.0 2.7 1.5 0.7 49.2
(47.6) (23.2) (12.7) (58.3) (9.1) (2.5)
832.9 $ 470.5 $ 220.8 $ 980.8 $
(244.1) $ (116.8) $ (77.1) $ (16.8)
Fair Value of Pension Plan Assets as of End of Year ::.1 ---;;~:':
Funded Status as of December 31st ,_$ ---"""'-' ~---"="'- =---"--"'-' "----'==< $ (249.3) $
As of December 31,2014
NSTAR Electric PSNH WMECO
(1,353.3) $ (529.0) $ (223.9) 479.9 32.2 6.2 (13.6) (9.7) (3.5) (41.3) (23.8) (10.3)
(107.0) (73.3) (29.8) 52.4 22.8 11.9
0.3 0.1
(982.6) $ (580.7) $ (249.4)
1,235.3 $ 528.6 $ 240.4 (441.4) (32.2) (6.2) 101.0 36.5 24.8 11.7
(52.4) (22.8) (11.9)
879.0 $ 498.4 $ 234.0
(103.6) $ (82.3) $ (15.4)
In August 2015, Eversource made a total lump-sum payout of$149.5 million, which reduced the projected benefit obligation and Pension Plan assets by a corresponding amount. Therefore, the lump-sum payment had no impact on the net Accrued Pension Liability reflected on the Eversource, CL&P, PSNH and WMECO balance sheets as ofDecember 31,2015.
During 2014, the Society of Actuaries released a series of updated mortality tables resulting from stu~ies that measured mortality rates for various groups of individuals. The updated mortality tables released in 2014 increased the life expectancy of plan participants by three to five years and had the effect of increasing the estimated benefits to be provided to plan participants. The impact of adopting the updated mortality tables on Eversource's liability as of December 31, 2014 was an increase of approximately $340 million. In 2015, a revised scale for the mortality table was released having the effect of decreasing the estimate of benefits to be provided to plan participants. The impact of the adoption of the new mortality scale resulted in a decrease of $48 million on Eversource's liability as of December 31, 2015.
IFERC FORM NO.1 (ED. 12-88) Page 123.28

(
(
Name of Respondent This Report is: Date of Report Year/Period of Report (1) 6 An Original (Mo, Da, Yr)
NSTAR Electric Company (2) A Resubmission I I 2015104
NOTES TO Fl NANCIAL STATEMENTS (Continued)
Tile increase in the discount rate used to calculate the funded status resulted in a decrease on Eversource's liability of approximately $267 million as of December 31, 2015. Decreases in the discount rates resulted in an increase on Eversource's liability of approximately $530 million as of December 31,2014.
The pension and SERP Plans' funded status includes the current portion of the SERP liability, which is included in Other Current Liabilities on the accompanying balance sheets.
As of December 31, 2015 and 2014, the accumulated benefit_ obligation for the Pension and SERP Plans is as follows:
(Millions of Dollars)
2015 2014
Eversource
$ 4,733.2 $ 5,000.1
CL&P
1,062.7 1,101.4
NSTAR Electric
$ 888.8 $ 910.4
PSNH
506.4 $ 524.5
WMECO
222.3 226.4
The following actuarial assumptions were used in calculating the Pension and SERP Plans' year end funded status:
Discount Rate Compensation/Progression Rate
Pension and SERP
As ofDecember31,
2015
4.21 % - 4.60 % 3.50%
2014
4.20-% 3.50%
Pension and SERP Expense: Eversource charges net periodic pension expense to its subsidiaries based on the actual participant demographic data for each subsidiary's participants. The actual investment return in the trust is allocated to each of the subsidiaries annually in proportion to the investment return expected to be earned during the year. For the year ended December 31, 2013 (prior to the service company merger), the net periodic pension expense recorded at NSTAR Electric represented the full cost of the plan with a portion of the costs allocated to affiliated companies based on participant demographic data.
The components of net periodic benefit expense for the Pension and SERP Plans are shown below. The net periodic benefit expense and the intercompany allocations less the capitalized portion of pension and SERF amounts are included in Operations and Maintenance expense on the statements of income. Capitalized pension amounts relate to employees working on capital projects and are included in Property, Plant and Equipment, Net on the balance sheets. Pension and SERF expense reflected in the statements of cash flows for CL&P, NSTARElectric, PSNH and WlvlECO does not include the intercompany allocations or the corresponding capitalized portion, as these amounts are cash settled on a sh01t-term . basis.
Pension and SERP
For the Year Ended December 31, 2015
NSTAR
{Millions of Dollars) Eversource (1) CL&P Electric PSNH (!) WMECO
Service Cost $ 9!.4 $ 24.7 $ 14.9 $ 12.1 $ 4.3 Interest Cost 227.0 51.1 40.2 24.3 10.4 Expected Return on Pension Plan Assets (335.9) (78.9) (70.0) (40.4) (18.9) Actuarial Loss 148.5 32.2 35.8 1!.6 6.4 Prior Service Cost/( Credit) 3.7 !.5 (0.1) 0.5 0.3 Total Net Periodic Benefit Expense $ 134.7 $ 30.6 $ 20.8 $ 8.1 $ 2.5 Intercompany Allocations NIA $ 22.5 $ 13.6 $ 6.7 $ 4.4 Capitalized Pension Expense $ 4!.0 $ 18.8 $ 1!.4 $ 3.5 $ !.9
IFERC FORM NO.1 (ED.12-88) Page 123.29

( \
(
Name of Respondent This Report is: Date of Report Year/Period of Report (1) X An Original (Mo, Da, Yr)
NSTAR Electric Company (2) A Resubmission I I 2015104
NOTES TO FINANCIAL STATEMENTS (Continued)
Pension and SERP For the Year Ended December 31, 2014
NSTAR (Millions of Dollars) · Eversource CL&P Electric PSNH WMECO Service Cost $ 79.9 $ 20.2 $ !3.6 $ 9.7 $ 3.5 Interest Cost 225.7 50.5 41.3 23.8 10.3 Expected Return on Pension Plan Assets (310.8) (75.4) (63.0) (38.1) (17.9) Actuarial Loss 128.4 33.7 23.5 11.6 6.9 Prior Service Cost 4.4 1.8 0.7 0.4 Total Net Periodic Benefit Expense $ 127.6 $ 30.8 $ 15.4 $ 7.7 $ 3.2 Intercompany Allocations NIA $ 26.7 $ I 0.4 $ 7.6 $ 5.1 Capitalized Pension Expense $ 35.2 $ 17.6 $ 7.9 $ 3.0 $ 2.4
Pension and SERP
For the Year Ended December31, 2013
NSTAR (Millions of Dollars) Eversource CL&P Electric (2) PSNH WMECO Service Cost $ 102.3 $ 24.9 $ 33.1 $ 13.1 $ 4.7 Interest Cost 206.7 48.3 58.0 23.6 10.0 Expected Return on Pension Plan Assets (278.1) (73.8) (84.4) (35.4) (I 7.4) Actuarial Loss 210.5 55.9 58.1 21.6 11.8 Prior Service Cost/( Credit) 4.0 1.8 (0.3) 0.7 0.4 Total Net Periodic Benefit Expense $ 245.4 $ 57.1 $ 64.5 $ 23.6 $ 9.5 Intercompany Allocations N/A $ 44.9 $ (8.4) $ 10.5 $ 8.0
Capitalized Pension Expense $ 73.2 $ 28.0 $ 28.9 $ 7.3 $ 5.2
(1) Amounts exclude $3.2 million for the year ended December 31, 2015 that represent amounts included in other deferred debits.
(2) NSTARE!ectric's allocated expense associated with the NSTAR SERF was $3.2 million for the year ended December 31, 2013 and was not included in the NSTARElectric amounts in the table above. For the years ended December 31, 2015 and 2014, the SERP amount is now allocated to NSTAR Electric due to the service company merger.
The following actuarial assumptions were used to calculate Pension and SERP expense amounts:
Discount Rate Expected Long-Term Rate of Return Compensation/Progression Rate
2015
4.20% 8.25% 3.50%
Pension and SERP
For the Years Ended December 31,
2014
4.85% - 5.03% 8.25%
3.50% - 4.00%
2013
4.13% - 4.24% 8.25%
3.50% - 4.00%
The following is a summary of the changes in plan assets and benefit obligations recognized in Regulatory Assets and Other Comprehensive Income
(OCI) as well as amounts in Regulatory Assets and OCI that were reclassified as net periodic benefit expense during the years presented:
(Millions of Dollars)
Actuarial (Gains)/Losses Arising During the Year Actuarial Losses Reclassified as Net Periodic Benefit Expense Prior Setvice Cost Reclassified as Net Periodic Benefit Expense
IFERC FORM NO.1 (ED. 12-88)
Regulatory Assets ocr
$
2015
(2.0) (142.3)
(3.5)
Page 123.30
For tbe Years Ended December 31,
2014 2015
$ 797.3 $ (6.2) (122.8) (6.2)
(4.2) (0.2)
$
2014
55.9 (5.6) (0.2)

r \
(
Name of Respondent This Report is: Date of Report Year/Period of Report (1) X An Original (Mo, Da, Yr)
NSTAR Electric Company (2) A Resubmission I I 2015104
NOTES TO FINANCIAL STATEMENTS (Continued)
The following is a summary of the remaining Regulatory Assets and Accumulated Other Comprehensive Loss amounts that have not been recognized as components of net periodic benefit expense as of December 31, 2015 and 2014, as well as the amounts that are expected to be recognized as components in 2016:
Regulatory Assets as of Expected AOCI as of Expected December 31, 2016 December 311 2016
(Millions of Dollars) 2015 2014 Ex2ense 2015 2014 Exi!ense
Actuarial Loss $ 1,667.6 $ 1,811.9 $ 120.6 $ 81.1 $ 93.5 $ 5.4 Prior Service Cost 9.7 13.2 3.4 0.6 0.8 0.2
PBOP Plan: On January 1, 2014, concurrent with the service company merger, the PBOP assets and liabilities ofNSTAR Electric & Gas were attributed by participant and transferred to the applicable operating company's balance sheets. This change had no impact on the income statements or net assets ofNSTAR Electric or Eversource. The PBOP Plan is accounted for under the multiple-employer approach, with each operating company's balance sheet reflecting its share of the funded status of the plan. The following tables provide infonnation on the PBOP Plan benefit obligations, fair values of plan assets, and funded status:
PBOP
Eversource As ofDecember31, (Millions of Dollars) 2015 2014 Change in Benefit Obligation Benefit Obligation as ofBeginriing of Year $ (1,147.9) $ (1,038.0) Service Cost (16.3) (12.5) Interest Cost (47.2) (49.5) Actuarial Galnl(Loss) 106.0 (95.5) Benefits Paid 54.0 47.6
Benefit Obligation as of End of Year $ (1,051.4) $ (1,147.9)
Change in Plan Assets Fair Value of Plan Assets as of Beginning of Year $ 862.6 $ 826.5 Actual Return on Plan Assets (4.3) 43.7 Employer Contributions 7.9 40.0
Benefits Paid (54.0) (47.6)
Fair Value of Plan Assets as of End of Year $ 812.2 $ 862.6
Funded Status as ofDecember31St $ (239.2) $ (285.3)
PBOP As of December 31,
2015 2014 NSTAR NSTAR
(Millions of Dollars) CL&P Electric PSNH WMECO CL&P Electric PSNH WMECO Change in Benefit Obligation Benefit Obligation as ofBegirming of Year $ (173.9) $ (468.7) $ (91.8) $ (36.6) $ (180.4) $ $ (93.5) $ (38.7) Change due to transfer of employees 0.1 2.3 (0.3) 3.7 (395.5) 4.3 1.0 Service Cost (2.1) (5.4) (1.4) (0.4) (2.2) (3.1) (1.3) (0.4) Interest Cost (7.2) (19.0) (3.9) (1.5) (8.1) (19.4) (4.3) (1.7) Actuarial Gain/(Loss) 7.2 59.1 3.6 1.5 3.5 (68.6) (1.1) 1.3 Benefits Paid 11.9 18.9 5.3 2.6 9.6 17.9 4.1 1.9 Benefit Obligation as of End of Year $ (164.0) $ (412.8) $ (88.5) $ (34.4) $ (173.9) $ (468.7) $ (91.8) $ (36.6) Change in Plan Assets Fair Value ofPlan Assets as ofBeginning of Year $ 149.0 $ 336.5 $ 80.9 $ 34.4 $ 151.3 $ $ 81.8 $ 35.3 Change due to transfer of employees 0.6 0.2 (3.2) 316.7 (3.1) (1.0) Actual Return on Plan Assets (0.4) (2.8) (0.1) 6.3 18.4 3.8 1.6 Employer Contributions 4.9 4.2 19.3 2.5 0.4 Benefits Paid (11.9) (18.9) (5.3) (2.6) (9.6) (17.9) (4.1) (1.9) Fair Value ofPlan Assets as ofEnd of Year $ 136.7 $ 320.3 $ 75.8 $ 31.7 $ 149.0 $ 336.5 $ 80.9 $ 34.4
Funded Status as of December 31st $ (27 .3) $ (92.5) $ (12.7) $ (2.7) $ (24.9) $ (132.2) $ (10.9) $ (2.2)
IFERC FORM N0.1 (ED. 12-88) Page 123.31

(
Name of Respondent This Report is: Date of Report Year/Period of Report (1) X An Original (Mo, Da, Yr)
NSTAR Electric Company (2) A Resubmission I I 2015104
NOTES TO FINANCIAL STATEMENTS (Continued)
During 2014, the Society of Actuaries released a series of updated mortality tables resulting from studies that measured mortality rates for various groups of individuals. The updated mortality tables released in 2014 increased the life expectancy of plan participants by three to five years and had the effect of increasing the estimated benefits to be provided to plan participants. The impact of adopting the updated mortality tables on Eversource's liability as of December 31, 2014 was an increase of approximately $82 million. In 2015, a revised scale for the mortality table was released having the effect of decreasing the estimate of benefits to be provided to plan participants. The impact of the adoption of the new mortality scale resulted in a decrease of $23 million on Eversource's liability as of December 31, 2015.
The increase in the discount rate used to calculate the funded status resulted in a decrease on Eversource's liability of approximately $60 million as of December 31, 2015. Decreases in the discount rates resulted in an increase on Eversource's l_iability of approximately $110 million as of December 31, 2014.
The following actuarial assumptions were used in calculating the PBOP Plan's year end funded status:
PBOP
As of December 31,
Discount Rate 2015 __,,,.,14':;:;--;;;--4.62% 4.22%
Health Care Cost Trend Rate 6.25% 6.50%
PBOP Expense: Eversource charges net periodic postretirement benefits expense to its subsidiaries based on the actual participant demographic data for each subsidiary's participants. The actual investment return in the trust each year is allocated to each of the subsidiaries annually in proportion to the investment return expected to be earned during the year. For the year ended December 31, 2013 (prior to the service company merger), the net periodic postretirement expense of the NSTARPBOP Plan allocated to NSTAR Electric was $4.6 million.
The components of net periodic benefit expense for the PBOP Plan are shown below. The net periodic benefit expense and the intercompany allocations less the capitalized portion ofPBOP are included in Operations and Maintenance on the statements of income. Capitalized PBOP amounts relate to employees working on capital projects and are included in Property, Plant and Equipment, Net on the balance sheets. PBOP expense reflected in the Statements of cash flows for CL&P. NSTAR Electric, PSNH and WMECO does not include the intercompany aiiocations or the coiTesponding capitalized portion, as these amounts are cash settled on a short-term basis.
(Millions of Dollars) Eversource CL&P PSNH WMECO Service Cost $ 16.3 $ 2.1 $ 5.4 $ 1.4 $ 0.4 Interest Cost 47.2 7.2 19.0 3.9 1.5 Expected Return on Plan Assets (67.4) (11.1) (27.3) (6.0) (2.5) Actuarial Loss 6.8 0.7 2.3 0.5 Prior SeiVice Credit (0.5) (0.2) Total Net Periodic Benefit Expense/(Income) $ 2.4 $ (1.1) $ (0.8) $ (02) $ (0.6) Intercompany Allocations NIA $ 1.9 $ 0.8 $ 0.4 $ 0.3 Capitalized PBOP Expense/(Income) $ 0.1 $ (0.2) $ (02) $ 0.2 $ (02)
(Millions of Dollars) Eversource CL&P Electric PSNH WMECO SeiVice Cost $ 12.5 $ 2.2 $ 3.1 $ 1.3 $ 0.4
· Interest Cost 49.5 8.1 19.4 4.3 1.7 Expected Return on Plan Assets (63.3) (10.5) (25.9) (5.4) (2.3) Actuarial Loss/( Gain) 122 42 (0.5) 22 0.5 Prior SeiVice Credit (2.8) (1.9)
Total Net Periodic Benefit Expense/(Income) $ 8.1 $ 4.0 $ (5.8) $ 2.4 $ 0.3 Intercompany Allocations NIA $ 3.8 $ 0.8 $ 1.0 $ 0.7 Capitalized PBOP Expense/(Income) $ 1.4 $ 1.8 $ (2.3) $ 0.8 $ 0.2
IFERC FORM NO.1 (ED. 12-88) Page 123.32

(
(
Name of Respondent This Report is: Date of Report (1) X An Original (Mo, Da, Yr)
NSTAR Electric Company (2) A Resubmission I I
NOTES TO FINANCIAL STATEMENTS (Continued)
PBOP
For the Year Ended December 31, 2013 (Millions of Dollars) Eversource CL&P PSNH WMECO
Ssrvice Cost $ 16.9 $ 3.4 $ 2.3 $ 0.7 Interest Cost 47.2 7.9 4.0 1.7 Expected Return on Plan Assets (55.4) (10.1) (5.2) (2.3) Actuarial Loss 26.0 7.4 3.6 1.1 Prior Service Credit (2.1) Total Net Periodic Benefit Expense $ 32.6 $ 8.6 $ 4.7 $ 1.2 Intercompany Allocations NIA $ 7.1 $ 1.6 $ 1.3 Capitalized PBOP Expense $ 8.8 $ 3.9 $ 1.3 $ 0.6
The following actuarial assumptions were used to calculate PBOP expense amounts:
Discount Rate Expected Long-Tenn Rate of Return
2015
4.22% 8.25%
PBOP For the Years Ended December 31,
2014
4.78% 8.25%
5.10% 2013
4.04% 8.25%
4.35%
Year/Period of Report
2015104
As of December 31, 2015 and 2014, the health care cost trend rate assumptions used to determine the PBOP Plan's funded status was 6.25 percent and 6.5 percent, respectively, subsequently decreasing to an ultimate rate of 4.5 percent in 2023. The health care cost trend rate assumption used to calculate the PBOP expense amount was 6.5 percent for the year ended December 31, 2015.
Assumed health care cost trend rates have a significant effect on the amounts reported for the health care plans. The effect of changing the assumed health care cost trend rate by one percentage point for the year ended December 31, 2015 would have the following effects:
(Millions of Dollars) Effect on PBOP Obligation Effect on Total Service and Interest Cost Components
One Percentage Point Increase
$ 115.3 8.5
One Percentage Point Decrease
$ (90.8) (6.3)
The following is a summary of the changes in plan assets and benefit obligations recognized in Regulatory Assets and OCI as well as amounts
recognized in Regulatory Assets and OCI that were reclassified as net periodic benefit (expense)/income during the years presented:
(Millions of Dollars)
Actuarial (Gains)/Losses Arising During the Year Actuarial Losses Reclassified as Net Periodic Benefit Expense Prior Service Credit Reclassified as Net Periodic Benefit Income
$
Regulatory Assets ocr
2015
(34.1) (6.4) 0.5
For the Years Ended December 31,
2014 2015
$ 115.1 $ 0.7 (11.6) (0.4)
2.8
$
2014 '•
0.4 (0.6)
The following is a summary of the remaining Regulatory Assets and Accumulated Other Comprehensive Loss amounts that have not been recognized as components of net periodic benefit expense as of December 31,2015 and 2014, as well as the amounts that are expected to be recognized as components in 2016:
Regulatory Assets as of Expected AOCI as of Expected December 31, 2016 December31, 2016
(Millions of Dollars) 2015 2014 Expense 2015 2014 Expense
Actuarial Loss $ 152.2 $ 192.7 $ 4.0 $ 6.3 $ 6.0 $ 0.4 Prior Service Credit (1.3) (1.8) (0.2)
I FERC FOR!\11 NO. 1 (ED. 12-88) Page 123.33

(
Name of Respondent This Report is: Date of Report Year/Period of Report ( 1) X An Original (Mo, Da, Yr)
NSTAR Electric Company (2) A Resubmission I I 2015104
NOTES TO FINANCIAL STATEMENTS (Continued)
Estimated Future Benefit Payments: The following benefit payments, which reflect expected future service, are expected to be paid by the Pension,'
SERP and PBOP Plans:
(Millions of Dollars)
Pension and SERP
PBOP $
2016
253.5 $ 60.8
2017
272.9 $
61.2
2018
273.9 $
61.4
2019
283.7 $
61.8
2020
292.7 $
62.4 1,604.3
315.4
Eversource Contributions: Eversource contributed $154.6 million to the Pension Plan in 2015, of which $5 million was contributed byNSTAR Electric, $1 million by PSNH and the remainder by other Eversource subsidiaries, primarily Eversource Service. Based on the current status of the Pension Plan and federal pension funding requirements, although not required to make a minimum pension contribution in 2016, Eversource currently expects to make contributions of approximately $146 miliion in 2016, of which $21 million will be contributed by NSTAR Electric and $17 million by PSNH. The remaining $108 million is expected to be contributed by other Eversource subsidiaries, primarily Eversource Service.
Eversource contributed $7.9 million to the PBOP Plan in 2015, of which $4.9 million was contributed by NSTAR Electric. Eversource expects to make approximately $9.5 million in contributions in 2016.
Fair Value of Pension and PBOP Plan Assets: Pension and PBOP ftmds are held in external trusts. Trust assets, including accumulated earnings, must be used exclusively for Pension and PBOP payments. Eversource's investment strategy for its Pension and PBOP Plans is to maximize the long-term rates of return on these plans' assets within an acceptable level of risk. The investment strategy for each asset category includes a diversification of asset types, fund strategies and fund managers and it establishes target asset allocations that are routinely reviewed and periodically rebalanced. PBOP assets are comprised of assets held in the PBOP Plan as well as specific assets within the defined benefit pension plan trust (40l(h) assets). The investment policy and strategy of the 40l(h) assets is consistent with that oftl1e defined benefit pension plan. Eversource's expected long-term rates of return on Pension and PBOP Plan assets are based on target asset allocation assumptions and related expected long-terrn rates of return. In developing its expected long-term rate of return assumptions for the Pension and PBOP Plans, Eversource evaluated input from consultants, as well as long-term inflation assumptions and historical returns. For the year ended December 31, 2015, management has assumed long-term rates of return of8.25 percent for the Pension and PBOP Plan assets. These long-term rates of return are based on the assumed rates of
( return for the target asset allocations as foJlows:
Equity Securities: United States International Emerging Markets Private Equity
Debt Securities: Fixed Income High Yield Fixed Income Emerging Markets Debt
Real Estate and Other Assets Hedge Funds
As of December 31, 2015
Pension Plan and Tax~Exempt Assets Within PBOP Plan
Target Asset AJiocation
22% 13% 5%
12%
12% 13% 5%
10% 8%
Assumed Rate of Return
8.5% 8.5% 10% 12%
4.5% 8.5% 7.5% 7.5%
7%
As ofDecember31, 2014
Pension Plan and TaxwExemptAssets Within PBOP Plan
Target Asset Allocation
24% 10% 6%
10%
15% 9% 6% 9%
11%
Assumed Rate of Return
9% 9%
10% 13%
5% 7.5% 7.5% 7.5%
7%
The taxable assets within the PBOP Plan have a target asset allocation of 70 percent equity securities and 30 percent fixed income securities.
IFERC FORM NO.1 (ED. 12-88) Page 123.34

!(
(
Name of Respondent This Report is: Date of Report Year/Period of Report (1) X An Original (Mo, Da, Yr)
NSTAR Electric Company (2) A Resubmission I I 20151Q4
NOTES TO FINANCIAL STATEMENTS (Continued)
The following table presents, by asset category, the Pension and PBOP Plan assets recorded at fair value on a recurring basis by the level in which th'ey are classified within the fair value hierarchy:
Pension Plan
Fair Value Measurements as of December 31,
(Millions of Dollars) 2015 2014
Asset Category: Levell Level2 Levcl3 Total Levell Level2 Level3 Total
Equity Securities (I)
Private Equity
$ 396.5 $ 985.7 $ 305.2 $ 1,687.4 $ 414.7 $ 1,035.0 $ 292.2 $ 1,741.9
Fixed Income (2)
Real Estate and Other Assets
Hedge Funds
Total $
Less: 401{h) PBOP Assets (3)
Total Pension Assets
(Millions of Dollars)
7.6
404.1 $
432.0
117.5
49.7
1,584.9 $
2015
464.7
784.8
260.3
290.8
2,105.8 $
$
472.3
1,216.8
377.8
340.5
4,094.8 $
(189.4)
3,905.4
PBOPPian
18.8
10.2
443.7 $
Fair Value Measurements as of December 31,
561.4
132.0
20.0
1,748.4 $
2014
367.9
722.0
265.8
475.0
386.7
1,293.6
397.8
495.0
2,122.9 $ 4,315.0
(188.5)
$ 4,126.5
Asset Category: Levell Level 2 Leve13 Total Levell Level2 Level3 Total
Equity Securities (I)
Private Equity
$ 109.7 $ 121.6 $ 77.8 $ 309.1 $ 104.1 $ 172.8 $ 75.1 $ 352.0
Fixed Income (2)
Real Estate and Other Assets
Hedge F1mds
Total $
Add: 401(h) PBOP Assets (3)
Total PBOP Assets
9.7
119.4 $
99.9
17.0
238.5 $
32.9
81.6
20.4
52.2
264.9 $
$
32.9
191.2
37.4
52.2
622.8 $
189.4
812.2
16.1
120.2 $
110.0
19.4
302.2 $
24.9 24.9
78.3 204.4
15.0 34.4
58.4 58.4
251.7 $ 674.1 '----
188.5
$ 862.6
(1) United States, International and Emerging Markets equity securities classified as Level2 include investments in commingled funds. Level3 investments include hedge funds that are overlayed with equity index swaps and futures contracts arid funds illvested in equities that have redemption restrictions.
(2) Fixed Income investments classified as Leve13 investments include fixed income funds that invest in a variety of opportunistic fixed income strategies, and hedge funds that are overlayed with fixed income futures.
(3) The assets of the Pension Plan include a 401 (h) acc01mt that has been allocated to provide health and welfare postretirement benefits under the PBOPP!an.
The Company values assets based on observable inputs when available. Equity securities, exchange traded funds and futures contracts classified as Level I in the fair value hierarchy are priced based on the closing price on the primary exchange as of the balance sheet date. Commingled funds included in Level2 equity securities are recorded at the net asset value provided by the asset manager, which is based on the market priceS of the underlying equity securities. Swaps are valued using pricing models that incorporate interest rates and equity and fixed income index closing prices to determine a net present value of the cash flows. Fixed income securities, such as government issued securities, corporate bonds and high yield bond funds, are included in Level2 and are valued using pricing models, quoted prices of securities with similar characteristics or discounted cash flows. The pricing models utilize observable inputs such as·recent trades for the same or similar instruments, yield curves, discount margins and bond structures. Hedge funds and investments in opportunistic fixed income funds are recorded at net asset value based on the values of the underlying assets. The assets in the hedge funds and opportunistic fixed income funds are valued using observable inputs and are classified as Level3 within the fair value hierarchy due to redemption restrictions. Private Equity investments and Real Estate and Other Assets are valued using the net asset value provided by the partnerships, which are based on discounted cash flows of the underlying investments, real estate appraisals or public market comparables of the underlying investments. These investments are classified as Level3 due to redemption restrictions.
IFERC FORM NO.1 (ED.12-88) Page 123.35
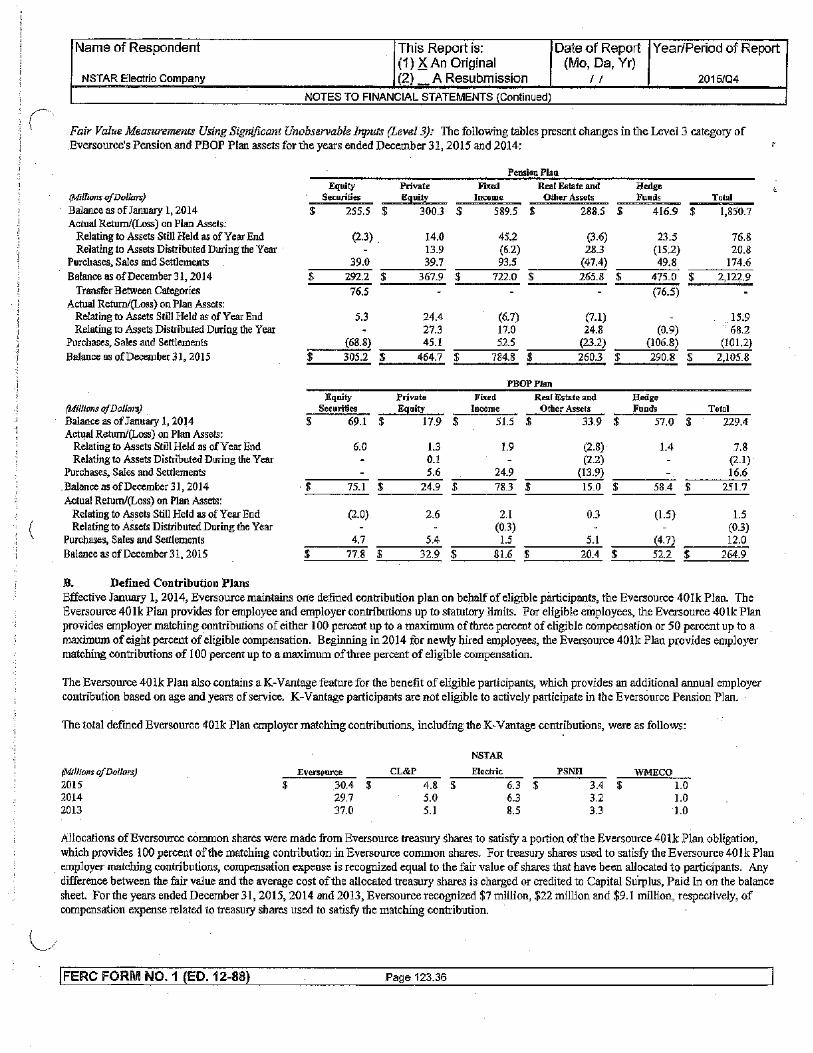
( \
(
Name of Respondent This Report is: Date of Report Year/Period of Report (1) 25, An Original (Mo, Da, Yr)
NSTAR Electric Company (2) A Resubmission I I 2015104
NOTES TO FINANCIAL STATEMENTS (Continued)
Fair Value Measurements Using Significant Unobservable Inputs (Level 3);- The following tables present changes in the Level3 category of Eversource's Pension and PBOP Plan assets for the years ended December 31,2015 and 2014:
Pension Plan
Equity Private Fixed Real Estate and Hedge (Millions ofDoilars) Securities Equity Income Other Assets Funds Total
Balance as of January 1, 2014 $ 255.5 $ 300.3 $ 589.5 $ 288.5 $ 416.9 $ 1,850.7 Actual Return/(Loss) on Plan Assets:
Relating to Assets Still Held as of Year End (2.3) . 14.0 45.2 (3.6) 23.5 76.8 Relating to Assets Distributed During the Year 13.9 (6.2) 28.3 (15.2) 20.8
Purchases, Sales and Settlements 39.0 39.7 93.5 (47.4) 49.8 174.6 Balance as of December 31, 2014 $ 292.2 $ 367.9 $ 722.0 $ 265.8 $ 475.0 $ 2,122.9
Transfer Between Categories 76.5 (76.5) Actual Retum/(Loss) on Plan Assets:
Relating to Assets Still Held as of Year End 5.3 24.4 (6.7) (7.1) 15.9 Relating to Assets Distributed During the Year 27.3 17.0 24.8 (0.9) 68.2
Purchases, Sales and Settlements (68.8) 45.1 52.5 (23.2) (106.8) (101.2) Balance as of December 31, 2015 $ 305.2 $ 464.7 $ 784.8 $ 260.3 $ 290.8 $ 2,105.8
PBOPPian
Equity Private Fixed Real Estate and Hedge (Millions of Dollm:s) Securities Equi.ty Income Other Assets Funds Total Balance as of January 1, 2014 $ 69.1 $ 17.9 $ 51.5 $ 33.9 $ 57.0 $ 229.4 Actual Return/(Loss) on Plan Assets:
Relating to Assets Still Held as of Year End 6.0 1.3 1.9 (2.8) 1.4 7.8 Relating to Assets Distributed During the Year 0.1 (2.2) (2.1)
Purchases, Sales and Settlements 5.6 24.9 (13.9) 16.6 . Balance as of December 31, 2014 $ 75.1 $ 24.9 $ 78.3 $ 15.0 $ 58.4 $ 251.7 Actual Return/(Loss) on Plan Assets:
Relating to Assets Still Held as of Year End (2.0) 2.6 2.1 0.3 (1.5) 1.5 Relating to Assets Distributed During the Year (0.3) (0.3)
Purchases, Sales and Settlements 4.7 5.4 1.5 5.1 (4.7) 12.0 Balance as of December 31, 2015 $ 77.8 $ 32.9 $ 81.6 $ 20.4 $ 52.2 $ 264.9
B. Defined Contribution Plans Effective January 1, 2014, Eversource maintains one defined contribution plan on behalf of eligible participants, the Eversource 40lk Plan. The Eversource 40lk Plan provides for employee and employer contributions up to statutory limits. For eligible employees, the Eversource 40lk Plan provides employer matching contributions of either 100 percent up to a maximum of three percent of eligible compensation or 50 percent up to a maximum of eight percent of eligible compensation. Beginning in 2014 for newly hired employees, the Eversource 401k Plan provides employer matching contributions of I 00 percent up to a maximum of three percent of eligible compensation.
The Eversource 40 lk Plan also contains a K-Vantage feature for the benefit of eligible participants, which provides an additional aruma! employer contribution based on age and years of service. K-Vantage participants are not eligible to actively participate in the EversOurce Pension Plan.
The total defmed Eversource 401k Plan employer matching contributions, including the K-Vantage contributions, were as follows:
NSTAR
(Millions of Dollars) Eversource CL&P Electric PSNH WMECO 2015 $ 30.4 $ 4.8 $ 6.3 $ 3.4 $ 1.0 2014 29.7 5.0 6.3 3.2 1.0 2013 37.0 5.1 8.5 3.3 1.0
Allocations ofEversource common shares were made from Eversource treasury Shares to satisfy a portion of the Eversource 401k Plan obligation, which provides 100 percent of the matching contribution in Eversource common shares. For treasury shares used to satisfY the Eversource 40 I k Plan employer matching contributions, compensation expense is recognized equal to the fair value of shares that have been allocated to participants. Any difference between the fair value and the average cost of the allocated treasury shares is charged or credited to Capital Su.rplus, Paid In on the balance sheet. For the years ended December 31, 2015, 2014 and 2013, Eversource recognized $7 million, $22 million and $9.1 million, respectively, of compensation expense related to treasury shares used to satisfY the matching contribution.
JFERC FORM NO.1 (ED. 12-88) Page 123.36

Name of Respondent This Report is: Date of Report Year/Period of Report (1) ~An Original (Mo, Da, Yr)
NSTAR Electric Company (2) A Resubmission I I 2015104
NOTES TO FINANCIAL STATEMENTS (Continued)
C. Share-Based Payments Sliare-based compensation awards are recorded using a fair-value-based method at the date of grant. Eversource, CL&P, NSTARElectric, PSNH and \VMECO record compensation expense related to these awards, as applicable, for shares issued or sold to their respective employees and officers, as well as for the allocation of costs associated with shares issued or sold to EversourCe's service company employees and officers that support CL&P, NSTAR Electric, PSNH and WMECO.
Eversource Incentive Plans: Eversource maintains long-tenn equity-based incentive plans in which Eversource, CL&P, NSTAR Electric, PSNH and W1v1ECO employees, officers and board members are eligible to participate. The incentive plans authorize Eversource to grant up to 8,000,000 new shares for various types of awards, including RSUs and performance shares, to eligible employees, officers, and board members. As of December 3 I, 2015 and 2014, Eversource had 3,005,010 and 3,112,020 common shares, respectively, available for issuance under these plans.
Eversource accounts for its various share-based plans as follows:
o RSUs ~ Eversource records compensation expense, net of estimated forfeitures,:on a straight-line basis over the requisite service periOd based upon the f~ir value ofEvetsource's common shares at the date of grant The par value·ofRSUs is reclassified to Corrnnon Stock from APIC as RSUs become issued as common shares.
" Performance Shares- Eversource records compensation expense, net of estimated forfeitures, on a straight-line basis over the requisite service period. Performance shares vest based upon the extent to which Company goals are achieved. Vesting of outstanding performance shares is based upon both the Company's EPS gwwth over the requisite service period and the total shareholder return as compared to the Edison Electric Institute (EEl) Index during the requisite service period. The fair value of perfo~ance shares is detemrined at the date of grant using a lattice model.
o Stock Options- Stock options currently outstanding are fully vested.
o ESPP Shares- For shares sold under the ESPP, no compensation expense was recorded as the ESPP qualified as a non-compensatory plan. The ESPP ended as ofFebruary 1, 2016 .
. : ( RSUs: Eversource granted RSUs under the annual long-term incentive programs that are subject to three-year graded Vesting schedules for employees, and one-year graded vesting schedules, or inunediate vesting, for board members. RSUs are paid in shares, reduced by amounts
sufficient to satisfY witbholdings for income taxes, subsequent to vesting. A summary ofRSU transactions is as follows:
\_/
Outstanding as of December 31,2014 Granted Shares issued Forfeited
Outstanding as of December 31,2015
RSUs (Units)
1,380,747 266,230
(888,495) (29,174)
729,308
$ $ $ $ $
Weighted Average Grant-Date Fair Value
35.67 54.57 33.-94 46.68
43.45
TI1e weighted average grant-date fair value ofRSUs granted for the years ended December 31, 2015, 2014 and 2013 was $54.57, $42.27 and $39.56, respectively. As of December 31, 2015 and 2014, the number and weighted average grant-date fair value ofunvested RSUs was 469,772 and $48.58 per share, and 1,024,729 and $38.14 per share, respectively. During 2015, there were 784,376 RSUs at a weighted average grant-date fair value of $37.21 per share that vested and were either paid or deferred. ·As of December 31, 2015; 259,536 RSUs were fully vested and deferred and an additional446,283 are expected to vest.
IFERC FORM NO.1 (ED.12-88) Page 123.37

('
(
lj
Name of Respondent This Report is: Date of Report Year/Period of Report (1) 2); An Original (Mo, Da, Yr)
NSTAR Electric Company (2) A Resubmission I I 2015104
NOTES TO FINANCIAL STATEMENTS (Continued)
Performance Shares: Eversource granted performance shares under the annual long-term incentive programs that vest based upon the extent to which Company goals are achieved at the end ofthree-year performance measurement periods. Performance shares are paid in shares, after the performance measurement period. A summary of performance share transactions is as follows:
Outstanding as of December 31,2014 Granted Shares issued Forfeited Outstanding as of December 31,2015
Performance Shares (Units)
375,644 172,543
(4,604) (15,155)
528,428
Weighted Average Grant-Date Fair Value
$ 42.20 $ 55.04 $ 42.23 $ 45.33 $ 46.30
The weighted average grant-datefairvalue of Performance Shares granted for the years ended December 31, 2015, 2014 and 2013 was $55.04, $43.40 and $40.96, respectively. As of December 31, 2015, all outstanding performance shares are unvested.
The t.otal compensation expense and associated future income tax benefits recognized by Eversource, CL&P, NSTAR Electric, PSNH and WNIECO for share-based compensation awards were as follows:
Eversource
{Millions of Dollars) Compensation Expense Future Income Tax Benefit
$ 2015
2015
NSTAR
For the Years Ended December 31,
23.1 $ 9.4
2014
24.6 $ 10.3
2013
27.0 10.7
For the Years Ended December 31,
2014
NSTAR
2013
NSTAR (Millions of Dollars) CL&P ~ PSNH ~ CL&P Electric ~ WMECO CL&P Electric PSNH WMECO ---Compensation Expense $ 9.3 $ 5.8 $ 3.2 $ 1.7 $ 8.1 $ 7.4 $ 3.0 $ 1.3 $ 6.8 $ 7.5 $ 2.3 $ 1.3 Future Income Tax Benefit 3.8 2.4 1.3 0.7 3.4 3.1 1.3 0.5 2.7 3.0 0.9 0.5
As of December 31, 2015, there was $14.9 million of total unrecognized compensation expense related to nonvested share-based awards for Eversource, including $6.1 million for CL&P, $3.8 million for NSTAR Electric, $2.2 nlillion for PSNH aod $1.2 million for WMECO. This costis expected to be recognized ratably over a weighted-average period of 1. 7 4 years for Eversource, and 1. 73 years for each CL&P, NSTAR Electric, PSNH and WMECO.
For each ofthe years ended December 31, 2015 and 2014, changes in excess tax benefits totaling $9.5 million increased cash flows from financing activities. For the year ended December 31, 2013, changes in excess tax benefits totaling $5.5 million decreased cash flows from financing activities.
Stock Options: Stock options currently outstanding were granted under the NSTAR Incentive Plan, expire ten years from the date of grant and are fully vested. The weighted average remaining contractual lives for the options outstanding as of December 31, 2015 is 2.6 years. A summary of stock option transactions is as follows:
Outstanding and Exercisable- December 31,2014 Exercised Outstanding and Exercisable- December 31, 2015
Options
351,616 (179,744)
171,872
Weighted Average Exercise Price
$ 26.69 $ 26.90
$ 26.47
Intrinsic Value (Millions)
$ 9.4 $ 4.4 $ 4.2
Cash received for options exercised during the year ended December 31, 2015 totaled $4.8 million. The tax benefit realized from stock options exercised totaled $1.9 million for the year ended December 31, 2015.
Employee Share Purchase Plan: Eversource maintained an ESPP for eligible employees, which allowed for Eversource common shares to be purchased by employees at the end of successive six-month offering periods at 95 percent of the closing market price on the last day of each six-month period. Employees were permitted to purchase shares having a value not exceeding 25 percent oftheir compensation as of the beginning of the offering period up to a specified limit. The ESPP qualified as a non-compensatory plan under accounting guidance for share-based payments, and no compensation expense was recorded for ESPP purchases.
IFERC FORM NO.1 (ED. 12-88) Page 123.38

(
(
l_/
Name of Respondent This Report is: Date of Report Year/Period of Report (1) D, An Original (Mo, Da, Yr)
NSTAR Electric Company (2) A Resubmission I I 2015104
NOTES TO FINANCIAL STATEMENTS (Continued)
During 2015, employees purchased 33,715 shares at discounted prices of$52.80 and $47.23. Employees purchased 40,779 shares in 2014 at discounted prices of$41.61 and $41.71. As of December 31, 2015 and 2014, 743,260 and 776,975 shares, respectively, remained available for future issuance under the.ESPP. The ESPP ended as of February I, 2016.
A."'l income tax rate of 40 percent is used to estimate the tax effect on total share-based payments detennined under the fair value-based method for all awards. The Company generally settles stock option exercises and fully vested RSUs and performance shares with the issuance of common shares purchased in the open market.
D. Other Retirement Benefits Eversource provides retirement and other benefits for certain current and past company officers. These benefits are accounted for on an accrual basis and expensed over a period equal to the service lives of the employees. The actuarially-deteiTilined liability for these benefits, which is included in Other Long-Term Liabilities on the balance sheets, as well as the related expense included in Operations and Maintenance on the income statements, are as follows:
Eversource
(Millions of Dollars)
Actuarially-Determined Liability Other Retirement Benefits Expense
(Millions of Dollars) Actuarially-Determined Liability Other Retirement Benefits Expense
10. INCOME TAXES
$
CL&P $ 0.4 $
1.5
As of and For the Years Ended December 31,
2015 2014 2013
1.0
55.2 $ 3.9
PSNH $ 2.4
0.7
WMECO
$ 0.2 0.3
57.5 $ 4.5
CL&P $ 0.4
2.1
Electric
$ 0.3
51.3 4.4
PSNH $ 2.6
0.9
WMECO
$ 0.2 $ 0.4
The components of income tax expense are as follows:
Eversoorce For the Years Ended December 31,
(Millions of Dollars) 2015 2014 2013
Current Income Taxes: Federal $ 6.2 $ 4.4 $ 8.8 State 45.7 24.5 (9.4)
Total Current 51.9 28.9 (0.6)
Deferred Income Taxes, Net Federal 436.1 406.8 386.2 State 55.6 36.5 45.4
Total Deferred 491.7 443.3 431.6 hlVestment Tax Credits, Net (3.6) (3.9) (4.1)
Income Tax Expense· $ 540.0 $ 468.3 $ 426.9
For the Years Ended December 31,
2015 2014
NSTAR NSTAR (Millions of Dollars) CL&P Electric PSNH ~ CL&P Electric PSMf W.MECO CL&P Current Income Taxes:
Federal $ 26.9 $ 36.3 $ (16.7) $ (3.5) $ (0.2) $ 75.0 $ (22.6) $ 1.9 $ 20.1 State 15.8 19.8 6.0 1.6 4.3 20.2 (0.1) 1.8 (6.7)
Total Current 42.7 56.! (!0.7) ~ 4.1 95.2 (22.7) 3.7 13.4 Deferred Income
Taxes, Net Federal !35.8 147.5 74.5 33.4 138.0 88.0 79.6 28.1 114.9 State 0.2 25.7 9.3 6.0 (7.1) 20.! 15.2 6.0 15.1
Total Deferred !36.0 !73.2 83.8 39.4 !30.9 108.! 94.8 34.1 !30.0 Investment Tax
Credits, Net (1.3) (1.3) ~ (!.5) (1.3) (0.5) (1.7)
Income Tax Expense $ 177.4 $ 228.0 $ 73.1 $ 37.0 $ !33.5 $ 202.0 $ 72.1 $ 37.3 $ 14!.7
I FERC FORM NO. 1 (ED. 12-88) Page 123.39
CL&P PSNH WMECO 0.4 $ 2.3 $ 0.1 2.5 1.0 0.5
2013
NSTAR Electric ~ W.MECO
$ 95.8 $ (8.2) $ (53.4) 29.6 3.6 4.2
125.4 ~ (49.2)
49.8 64.5 84.7 (1.0) 1!.2 2.3
48.8 75.7 87.0
(1.3) (0.4)
$ 172.9 $ 7!.1 $ 37.4

(
( ' !
Name of Respondent This Report is: Date of Report Year/Period of Report (1) ~An Original (Mo, Da, Yr)
NSTAR Electric Company (2) A Resubmission NOTES TO FINANCIAL STATEMENTS (Continued)
A reconciliation between income tax expense and the expected tax expense at the statutory rate is as follows:
Eversource
(Millions of Dollars, except percentages)
Income Before Income Tax Expense
Statutory Federal Income Tax Expense at 35% Tax Effect of Differences:
Depreciation Investment Ta'< Credit Amortization Other Federal Tax Credits State Income Taxes, Net of Federal Impact Dividends on ESOP Tax Asset Valuation Allowance/Reserve Adjustments Other, Net
Income Tax Expense Effective Tax Rate
(Millions of Dollars, except percentages)
Income Before Income Tax Expense
Statutory Federal Income Tax Expense at 35%
Tax Effect ofDifferences: Depreciation Investment Tax Credit Amortization
Other Federal Tax Credits State Income Taxes, Net ofFederal Impact
Tax Asset Valuation AllowancelReserve Adjustments
Other, Net
Income Tax Expense Effective Tax Rate
CL&P
$ 476.8
166.9
(1.7)
(1.3)
9.2
1.2 3.1
$i'7"7.4 ---37.2% ---
2015 NSTAR Electric PSNH ---
$ 572.6 $ 187.5
200.4 65.6
(1.4) 0.5
(1.3) (3.8)
29.6 9.9
0.7 ___ o._9
$ 228.0 $ 73.1 ---39.8% 39.0%
$
$
WMECO
$ 93.5
32.7
(0.3)
(0.5)
4.9
0.2 ---$ 37.0 ---39.6%
For the Years Ended December 31,
2015 2014
1,425.9 $ 1,295.4 $
499.1 453.4
(4.6) (5.6) (3.6) (3.9) (3.8) (3.5) 61.1 42.5 (8.1) (8.0) 4.7 (2.9)
(4.8) (3. 7)
540.0 $ 468.3 $ 37.9% 36.2%
For the Years Ended Det:ember 31,
2014
NSTAR CL&P Electric PSNH WMECO --- ---
$ 421.2 $ 505.1 $ 186.1 $ 95.1
147.4 176.8 65.1 33.3
(3.6) (1.3) 0.3 (0.2)
(1.5) (1.3) (0.5) (3.5)
4.4 26.2 9.8 5.0
(6.3)
___i!2l 1.6 --- 0.4 (0.3) $ 133.5 $ 202.0 $ 72.1 $ 37.3 ---
31.7% 40.0% 38.7% 39.2% ---
I I
2013
1,220.6
427.2
(7.4) (4.1) (3.7) 27.6 (8.0) (4.3) [0.4J
426.9
35.0%
2013
NSTAR CL&P Electric
$ 421.1 $ 441.4 $
147.4 154.5
(7.0) 0.1
(1.7) (1.3)
5.0 18.6
0.4 _.£!] 1.0 $ 141.7 $ 172.9 $
33.6% 39.2%
2015/04
PSNH WMECO
182.5 $ 97.8
63.9 34.2
0.6
(0.4) (3.7)
9.6 4.2
0.7 ~ 7l.l $ 37.4
39.0% 38.2%
Eversource, CL&P, NSTAR Electric, PSNH and WMECO file a consolidated federal income tax return and unitary, combined and separate state income tax returns. These entities are also parties to a tax allocation agreement under which taxable subsidiaries do not pay any more taxes than they would have othenvise paid had they filed a separate company tax return, and subsidiaries generating tax losses, if any, are paid for their losses when utilized.
IFERC FORM NO.1 (ED. 12-88) Page 123.40

( \
Name of Respondent This Report is: Date of Report Year/Period of Report (1) ~An Original (Mo, Da, Yr)
NSTAR Electric Company (2) A Resubmission I I 2015104
NOTES TO FINANCIAL STATEMENTS (Continued)
Deferred tax assets and liabilities are recognized for the future tax effects of temporary differences between the carrying amounts and the tax basis of aS'sets and liabilities. The tax effect of temporary differences is accounted for in accordance with the ratepmaking treatment of the applicable regulatory commissions and relevant accounting authoritative literature. The tax effects of temporary differences that give rise to the net accumulated deferred income tax obligations are as follows:
Eversource As of December 31,
(Millions of Dollars) 2015 2014 Deferred Tax Assets:
Employee Benefits $ 637.5 $ 632.2 Derivative Liabilities 172.7 199.6 Regulatory Deferrals - Liabilities. 243.5 366.7 Allowance for Uncollectible Accounts 60.5 60.5 Tax Effect w Tax Regulatory Liabilities 9.7 10.0 Federal Net Operating Loss Carryforwards 5.4 59.1 Purchase Accounting Adjustment 119.3 126.2 Other 197.1 198.7
Total Deferred Tax Assets 1,445.7 1,653.0
Less: Valuation Allowance 3.7 5.1
Net Deferred Tax Assets $ 1,442.0 $ 1,647.9 Deferred Tax Liabilities:
Accelerated Depreciation and Other PlantwRelated Differences $ 4,602.6 $ 4,215.9 Property Tax Accruals 76.7 109.6 Regulatory Amounts:
Regulatory Deferra1s -Assets 1,289.1 1,277.9 Tax Effect - Tax Regulatory Assets 249.3 240.2 Goodwill Regulatory Asset w 1999 Merger 194.9 203.2 Derivative Assets 17.7 32.6 Other 159.4 196.3
Total Deferred Tax Liabilities $ 6,589.7 $ 6,275.7
As of December 31,
2015 2014
NSTAR NSTAR (Millions of Dollars) CL&P Electric PSNH WMECO CL&P Electric PSNH WMECO Deferred Tax Assets:
Employee Benefits $ 126.1 $ 91.3 $ 37.1 $ 10.0 $ 129.0 $ 39.9 $ 46.8 $ 9.2 Derivative Liabilities 165.7 0.6 193.0 1.8 Regulatory Deferrals w Liabilities 36.0 109.4 42.1 6.1 73.9 181.3 46.5 11.4 Allowance for Uncollectible Accounts 30.4 8.5 3.6 4.5 32.3 !3.8 3.2 3.8 Tax Effect w Tax Regulatory Liabilities 3.1 1.5 2.3 2.4 3.1 1.8 2.1 2.5 Federal Net Operating Loss Carryforwards 2.4 0.4 32.1 4.5 Other 55.5 3.4 61.1 5.0 53.8 19.9 48.9 4.9
Total Deferred Tax Assets 416.8 214.7 148.6 28.4 485.1 258.5 179.6 36.3 Less: Valuation Allowance 3.1 4.0
Net Deferred Tax Assets $ 413.7 $ 214.7 $ 148.6 $ 28.4 $ 481.1 $ 258.5 $ 179.6 $ 36.3 Deferred Tax Liabilities:
Accelerated Depreciation and Other PlantwRelated Differences $ 1,545.6 $ 1,387.1 $ 655.3 $ 416.1 $ 1,378.6 $ 1,296.9 $ 596.6 $ 385.8
Property Tax Accruals 27.3 22.8 7.3 10.6 58.1 25.0 7.4 12.8 Regulatory Amounts:
Regulatory Deferrals w Assets 456.8 339.7 137.9 60.5 502.3 276.0 147.6 60.4 Tax Effect- Tax Regulatory Assets 168.7 36.0 15.4 9.0 166.9 35.5 15.9 9.3 Goodwill Regulatory Asset - 1999 Merger 167.4 174.4 Derivative Assets 17.7 32.6 Other 18.5 22.0 38.6 2.7 19.4 33.5 35.6 2.8
Total Deferred Tax Liabilities $ 2,234.6 $ 1,975.0 $ 854.5 $ 498.9 $ 2,157.9 $ 1,841.3 $ 803.1 $ 471.1
IFERC FORM NO.1 (ED.12-88) Page 123.41

Name of Respondent This Report is: Date of Report Year/Period of Report ( 1) 2$, An Original (Mo, Da, Yr)
NSTAR Electric Company (2) A Resubmission I I 20151Q4
NOTES TO FINANCIAL STATEMENTS (Continued)
Canyforwards: The following tables provide the amounts and expiration dates of state tax credit and loss carryforwards and federal tax credit and"
net operating loss canyforwards:
As ofDecember31, 2015
NSTAR (Millions of Dollars) Eversource CL&P Electric PSNH WMECO Expiration Range Federal Net Operating Loss $ 15.5 $ $ $ 7.0 $ 1.0 2032 Federal Tax Credit 26.1 0.1 0.2 15.0 2031-2035 Federal Charitable Contribution 14.9 2016 "2018 State Tax Credit 101.2 73.8 2015 "2020 State Charitable Contribution 3.0 2015 -2019
As ofDecemher31, 2014
NSTAR (Millions of Dollars) Eversource CL&P Electric PSNH WMECO Expiration Range
Federal Net Operating Loss $ 168.8 $ $ $ 91.8 $ 12.7 2031 "2032
Federal Tax Credit 16.3 0.1 0.2 II.! 2031 "2034
Federal Charitable Contribution 19.4 2016 "2018 State Tax Credit 99.7 71.0 2014-2019
State Loss Canyforwards 40.6 2014-2034
State ·charitable Contribution 2.1 2015 "2018
In 2015, the Company decreased its valuation allowance reserve for state credits and state loss carryforwards by $1.3 million (CL&P $0.9 million), net of tax, to reflect an update for expired state tax credits and loss carryforwards.
In 2014, the Company recorded a reduction to its state credit canyforwards of$11 million (CL&P $10.1 million), net of tax, as a result of an update to reflect the amounts expired. Further, the Company decreased its valuation allowance reserve for state credits by $19.2 million at CL&P, net of
/ tax, to reflect an update for expired state credits and latest estimate of usage. \
For 2015 and 2014, state credit and state loss carryforwards have been partially reserved by a valuation allowance of$3.1 million and $4.4 million (net of tax), respectively.
Unrecognized Tax Benefits: A reconciliation of the activity in unrecognized tax benefits, all of which would impact the effective tax rate if recognized, is as follows:
(Millions of Dollars) Eversource CL&P Balance as ofJanuary 1, 2013 $ 83.1 $ 49.0
Gross Increases- Current Year 8.2 2.1 Gross Decreases - Prior Year (1.1) (0.3) Settlements (49.8) (39.4) Lapse of Statute of Limitations (2.2)
Balance as of December 31,2013 38.2 11.4 Gross Increases - Current Year 9.3 2.7 Gross Increases -Prior Year 0.3 0.2 Lapse of Statute of Limitations (1.6)
Balance as of December 31, 2014 46.2 14.3 Gross Increases - Current Year 9.9 2.6 Gross Increases - Prior Year 0.1
Lapse of Statute of Limitations (8.2) (3.4)
Balance as of December 31,2015 $ 48.0 $ 13.5
IFERC FORM NO.1 (ED. 12-88) Page 123.42

(
(
Name of Respondent This Report is: Date of Report Year/Period of Report (1) 2S, An Original (Mo, Da, Yr)
NSTAR Electric Company (2i A Resubmission I I 2015104
NOTES TO FINANCIAL STATEMENTS (Continued)
Interest and Penalties: Interest on uncertain tax positions is recorded and generally classified as a component of Other Interest Expense on the statements of income. However, when resolution of uncertainties results in the Company receiving interest income, any related interest benefit is recorded in Other Income, Net on the statements of income. No penalties have been recorded. The amount of interest expense/(income) on uncertain tax positions recognized and the related accrued interest payable/( receivable) are as follows:
Other Interest Expense/(lncome) Accrued Interest Expense
For the Years Ended December 31, As of December 31,
2015 2014 2013 2015 2014 (Millions of Dollars)
Eversource CL&P
$ 0.1 $ 0.4 $ (8.6) $ 2.0 $ 1.9 (4.0)
Tax Positions: During 2015 and 2014, Eversource did not resolve any of its uncertain tax positions.
Open Tax Years: The following table summarizes Eversource, CL&P, NSTARElectric, PSNH and WlVIECO's tax years that remain subject to examination by major tax jurisdictions as of December 31, 2015:
Description
Federal Connecticut Massachusetts New Hampshire
Tax Years
2015 2012-2015 2012-2015 2012-2015
Eversource estimates that during the next twelve months, differences of a non-timing nature could be resolved, resulting in a zero to $2.3 million . decrease in unrecognized tax benefits by Eversource. These estimated changes are not expected to have a material impact on the earnings of Eversource. Other companies' impacts are not expected to be material.
2015 Federal Legislation: On December 18, 2015, the "Protecting Americans from Tax Hikes" Act became law, which extended the accelerated deduction of depreciation to businesses from 2015 through 2019. This extended stimulus provides Eversource with cash flow benefits in 2016 of approximately $275 million (including approximately $105 miUion for CL&P, $72 million forNSTAR Electric, $46 million for PSNH, and $25 million for WMECO) due to a refund of taxes paid in 2015 and lower expected ta,"{ payments in 2016 of approximately $300 million.
2015 Connecticut Legislation: In 2015, the state of Connecticut enacted several changes to its corporate tax laws. Among the changes, commencing as of January 1, 2015, is the reduction in the amount of tax credits that corporations can utilize against its tax liability in a year and a continuation of the corporate income tax surcharge through 2018, which effectively increases the state corporate tax rate to 9 percent for the years 2016 and 2017 and 8.25 percent for 2018. Also, effective January I, 2016, all Connecticut companies have a mandatory unitary tax filing requirement. Management continues to review the tax law changes and their impact on the effective tax rates of Eversource and CL&P.
2014 Federal Legislation: On December 19, 2014, the "Tax Increase Prevention Act of 20 14" became law, which extended the accelerated deduction of depreciation to businesses through 2014. This extended stimulus provided Eversource with cash flow benefits ofapproximately$250 million (approximately $86 million at CL&P, $64 million at NSTAR Electric, $44 million at PSNH, and $21 million at WMECO) in 2015.
ll. COMMITMENTS AND CONTINGENCIES
A. Environmental Matters General: Eversource, CL&P, NSTAR Electric, PSNH and WMECO are subject to environmental laws and regulations intended to mitigate or remove the effect of past operations and improve or maintain the quality of the environment. These laws and regulations require the removal or the remedy of the effect on the enviromnent of the disposal or release of certain specified hazardous substances at current and fanner operating sites. Eversource, CL&P, NSTAR Electric, PSNH and WlvffiCO have an active environmental auditing and training program and believe that they are substantially in compliance with all enacted laws and regulations.
Environmental reserves are accrued when assessments indicate it is probable that a liability has been incurred and an amount can be reasonably estimated. The approach used estimates the liability based on the most likely action plan from a variety of available remediation options, including no action required or several different remedies ranging from establishing institutional controls to full site remediation and monitoring. These liabilities are estimated on an undiscounted basis and do not assume that the amounts are recoverable from insurance companies or other third parties. The environmental reserves include sites at different stages of discovery and remediation and do not include any unasserted claims.
IFERC FORM NO. i (ED.12-88) Page 123.43

(
(
Name of Respondent This Report is: Date of Report Year/Period of Report (1) ~An Original (Mo, Da, Yr)
NSTAR Electric Company I (2) A Resubmission I I 2015104
NOTES TO FINANCIAL STATEMENTS (Continued)
These estimates are subjective in nature as they take into consideration several different remediation options at each specific site. The reliability and precision of these estimates can be affected by several factors, including new information concerning either the level of contamination at the site, tire: extent ofEversource, CL&P, NSTAR Electric, PSNH and WivlECO's responsibility for remediation or the extent of remediation required, recently enacted laws and regulations or changes in cost estimates due to certain economic factors. It is possible that new infonnation or future developments could require a reassessment of the potential exposure to related environmental matters. As this information becomes available, management will <?
continue to assess the potential exposure and adjust the reserves accordingly.
The amounts recorded as environmental reserves included in Other Current Liabilities and Other Long-Term Liabilities on the balance sheets represent management's best estimate of the liability for environmental costs, and take into consideration site assessment, remediation and long-tenn monitoring costs. The environmental reserves also take into account recuning costs of managing hazardous substances and pollutants, mandated expenditures to remediate previously contaminated sites and any other infrequent and non-recurring clean-up costs. A reconciliation of the activity in the environmental reserves is as follows:
(Millions of Dollars) Eversource CL&P NSTAR Electric PSNH WMECO
Balance as of January 1, 2014 $ 35.4 $ 3.4 $ 1.2 $ 5.4 $ 0.4 Additions 12.7 1.0 0.1 0.2 Payments/Reductions (4.8) (0.6) (0.1) (0.3) (0.1) Balance as of December 31, 2014 43.3 3.8 1.1 5.2 0.5 Additions 13.5 1.3 2.0 2.3 0.2 Payments/Reductions (5.7) (0.5) (0.7) (3.0) (0.1) Balance as ofDecember 31, 2015 $ 51.1 $ 4.6 $ 2.4 $ 4.5 $ 0.6
The number of related environmental sites and reserves for which remediation or long-term monitoring, preliminary site work or site assessment is being performed are as follows:
As of December 31, 2015 As of December 31, 2014
Reserve Reserve Number of Sites (in millions) Number of Sites (in millions)
Eversource 64 $ 51.1 65 $ 43.3 CL&P 14 4.6 16 3.8 NSTAR Electric 15 2.4 13 1.1 PSNH 12 4.5 13 5.2 WMECO 4 0.6 4 0.5
Included in the Eversource number of sites and reserve amounts above are former MGP sites that were operated several decades ago and manufactured gas from coal and other processes, which resulted in certain by-products remaining in the environment that may pose a potential risk to human health and the environment, for which Eversource may have potential liability. The reserve balances related to these former MGP sites were $45.5 million and $38.8 million as of December 31, 2015 and 2014, respectively, and related primarily to the natural gas business segment.
As of December 31, 2015, for 9 environmental sites (3 for CL&P, 1 for WMECO) that are i_ncluded in the Company's reserve for environmental cost~, the information known and the nature of the remediation options allow for the Company to estimate the range oflosses for environmental costs. As of December 31, 2015, $24.7 million (including$!. 7 million for CL&P and $0.3 million for WMECO) had been accrued as a liability for these sites, which represents the low end of the range of the liabilities for environmental costs. Management believes that additional losses of up to approximatelY $33.9 million (approximately $1.4 million for CL&P, and $0.1 million for VIMECO) may be incurred in remediating these sites.
As of December 31,2015, for 12 environmental sites (3 for CL&P and 2 forNSTAR Electric) that are included in the Company's reserve for environmental costs, management cannot reasonably estimate the exposure to loss in excess of the reserve, or range ofloss, as these sites are under investigation and/or there is significant uncertainty as to what remedial actions, if any, the Company may be required to undertake. As of December 31, 2015, $13.7 million (including $2 million for CL&P) had been accrued as a liability for these sites. As of December 31, 2015, for tl1e remaining 43 environmental sites (including 8 for CL&P, 13 for NSTAR Electric, 12 for PSNH, and 3 for WMECO) that are included in the Company's reserve for environmental costs, the $12.7 million accrual (including $0.9 million for CL&P, $2.4 million for NSTAR Electric, $4.5 million for PSNH, and $0.3 million for WMECO) represents management's best estimate of the potential liability and no additional loss is anticipated at this time.
IFERC FORM NO.1 (ED. 12-88) Page 123.44

(
Name of Respondent This Report is: Date of Report Year/Period of Report (1) 2S, An Original (Mo, Da, Yr)
NSTAR Electric Company (2) A Resubmission I I 2015/Q4
NOTES TO FINANCIAL STATEMENTS (Continued)
CERCLA: Of the total environmental sites, nine sites (four for NST AR Electric and three for PSNH) are superfund sites under the federal C8mprehensive Environmental Response, Compensation and Liability Act of 1980 (CERCLA) and its amendments or state equivalents for which the Company has been notified that it is a potentially responsible party but for which the site assessment and remediation are not being managed by the Company. As of December 31, 2015, a liability of $0.8 million accrued on these sites represents management's best estimate of its potential remediation costs with respect to these Superfund sites.
Environmental Rate Recovery: PSNH, NSTAR Gas and Yankee Gas have rate recovery mechanisms for MGP related envirorunental costs, therefore, changes in their respective environmental reserves do not irnp.act Net Income. CL&P recovers a certain level of environmental costs currently in rates. CL&P, NSTAR Electric and Wl\1ECO do not have a separate environmental cost recovery regulatory mechanism.
B. Long-Term Contractual Arrangements Estimated Future Annual Costs: The estimated future annual costs of significant long-term contractual arrangements as of December 31, 2015 are as follows:
Eversource
(Millions of Dollars)
Supply and Stranded Cost Renewable Energy
Peaker C:IDs
Natural Gas Procurement
Coal, Wood and Other Transmission Support Commitments
Total
CL&P
(Millions of Dollars)
Supply and Stranded Cost Renewable Energy
Peaker CfDs
Transmission Support Commitments
Yankee Companies Billings
Total
NST AR Electric
{Millions of Dollars)
Supply and Stranded Cost
Renewable Energy
Transmission Support Conm1itments Yankee Companies Billings
Total
PSNH
(Millions of Dollars)
Supply and Stranded Cost
Renewable Energy
Coal, Wood and Other Transmission Support Commitments
Yankee Companies Billings
Total
IFERC FORI\/1 NO.1 (ED. 12-88)
2016 2017 2018 2019 2020 Thereafter Total
$ 177.4 $ 110.1 $ 81.5 $ 51.1 $ 34.9 $ 80.6 $ 535.6
$
$
246.6
55.8
137.9 45.4 21.4
684.5 $
273.3
41.1 123.8
23.3
19.0
590.6 $
238.3
20.4
78.4
3.4 20.3
237.4
7.8 57.8
237.0
4.0 46.9
2,174.7
3.6
99.7
3,407.3
132.7 544.5
1.9 1.9 13.1 89.0 20.2 20.2 !Ol.l
442.3 $ ::-----;;-:::c::-
376.2 ,_$ __ 3::_4:..:4:o_.9 $ 2,371.7 $ 4,810.2
2016 2017 2018 2019 2020 Thereafter Total
145.0 $ 87.2 $ 58.2 $ 38.0 $ 29.3 $ 47.6 $ 405.3 70.1 71.7 72.1 72.3 72.4 649.7 1,008.3
55.8 41.1 20.4 7.8 4.0 3.6 132.7 8.4 7.5 8.0 8.0 8.0 39.9
:;--=0-,-.1 :;----:=0.4;;- :;;----:-:::::0-:-.8 :;--:-;;-;0:.;:-.8 :;---c;-;';-'0.'0-8 10.7 13.6 $ 279.4 $ 207.9 $ 159.5 $ 126.9 $ 114.5 ;:$ _ _:7..:.11:.:..6::. $ 1,599.8
2016
$ 14.1
99.0 6.6 0.1
$ 119.8
2017
$ 4.8
117.0 5.9 0.2
$ !27.9
2018 2019
$ 5.5 $ 5.5
80.4 78.5
6.3 6.2 0.3 0.3 ::--::::-:-
$ 92.5 $ 90.5
2020
$ 3.1
76.6
6.2 0.3
$ 86.2
Thereafter
$ 28.1 489.8
3.6
$ 521.5
Total
$ 61.1
941.3 31.2 4.8
$ 1,038.4
2016 2017 2018 2019 2020 Thereafter Total
$ 18.3 $ 18.1 $ 17.8 $ 7.6 $ 2.5 $ 4.9 $ 69.2 67.9
45.4
4.6 0.1
69.0
23.3
4.0 0.2
70.1 3.4
4.3 0.3
70.7
1.9 4.3
0.3
72.0 860.4 1,210.1
1.9 13.1 89.0 4.3 21.5
0.3 4.2 5.4
$ 136.3 $ 114.6 $ 95.9 $ 84.8 $ ;;------;::::;--;-
81.0 :::.$ _ _:8"'82::c·::_6 $ 1,395.2
Page 123.45

-( I
Name of Respondent This Report is: Date of Report Year/Period of Report (1) ~An Original (Mo, Da, Yr)
NSTAR Electric Company (2) A Resubmission I I 2015104
NOTES TO FINANCIAL STATEMENTS (Continued)
WMECO
(Millions of Dollars) 2016 2017 2018 2019 2020 Thereafter Total
Renewable Energy $ 9.6 $ 15.6 $ 15.7 $ 15.9 $ 16.0 $ 174.8 $ 247.6
Transmission Support Commitments 1.8 1.6 1.7 1.7 1.7 8.5
Yankee Companies Billings 0.1 0.2 0.2 0.2 2.7 3.4
Total $ 11.4 $ 17.3 $ 17.6 $ 17.8 $ 17.9 $ 177.5 $ 259.5
Supply and Stranded Cost: CL&P, NSTAR Electric and PSNH have various IPP contracts or purchase obligations for electricity, including payment obligations resulting from the buydown of electricity purchase contracts. Such contracts extend through 2024 for CL&P, 2031 for NSTAR Electric and 2023 for PSNH.
In addition, CL&P, along with UI, has four capacity CfDs for a total of approximately 787 MW of capacity consisting of three generation projects and one demand response project The capacity CIDs extend through 2026 and obligate both CL&P and UI to make or receive payments on a monthly basis to or from the generation facilities based on the difference between a set contractual capacity price and the capacity market prices received by the generation facilities in the ISO-NE capacity markets. CL&P has a sharing agreement with UI, whereby UI will share 20 percent of the costs and benefits of these contracts. CL&P's portion of the costs and benefits of these contracts will be paid by or refunded to CL&P's customers.
The contractual obligations table above does not include CL&P's, NSTAR Electric's or WMECO's default service contracts, the amounts of which vazy with customers' energy needs. The contractual obligations table also does not include PSNHs short-term power supply management.
Renewable Energy: Renewable energy contracts include non-cancellable conunitments under contracts of CL&P, NSTAR Electric, PSNH, and WMECO for the purchase of energy and capacity from renewable energy facilities. Such contracts extend through 2035 for CL&P, 2031 for NSTAR Electric, 2033 for PSNH and 2031 for WMECO.
TI1e contractual obligations table above does not include long-term commitments signed by CL&P, NSTAR Electric and WMECO, as required by ( the PURA and DPU, for the purchase of renewable energy and related products that are contingent on the future construction of energy facilities.
Peaker CfDs: In 2008, CL&P entered into three CfDs with developers of peaking generation units approved by PURA (Peaker CfDs). These units have a total of approximately 500 MW of peaking capacity. As directed by PURA. CL&P and ill have entered into a sharing agreement, whereby CL&P is responsible for 80 percent and UI for 20 percent of the net costs or benefits of these CfDs. The Peaker CfDs pay the generation facility owner the difference between capacity, forward reserve and energy market revenues and a ·cost-of-service payment stream for 30 years. The ultimate cost or benefit to CL&P under these contracts will depend on the costs of plant operation and the prices that the projects receive for capacity and other products in the ISO-NE markets. CL&P's portion of the amounts paid or received under the Peaker CfDs will be recoverable from or refunded to CL&P's customers.
Natural Gas Procurement: In the nonnal course of business, Eversource's natural gas distribution businesses have long-term contracts for the purchase, transportation and storage of natural gas as part of its portfolio of supplies. These contracts extend through 2029.
Coal, Wood and Other: PSNH has entered into various arrangements for the purchase of coal, wood and the transportation services for fuel supply for its electric generating assets. Also included in the contractual obligations table above is a contract for capacity on the Portland Natural Gas Transmission System (PNGTS) pipeline that extends through 2018. The costs of this contract of$4.5 million are not recoverable from cUstomers.
Transmission Support Commitments: Along with other New England utilities, CL&P, NSTAR Electric, PSNH and WMECO entered into agreements in 1985 to support transmission and terminal facilities that were built to import electricity from the Hydro-Quebec system in Canada. CL&P, NSTAR Electric, PSNH and WMECO are obligated to pay, over a 30-year period ending in 2020, their proportionate shares of the annual operation and maintenance expenses and capital costs of those facilitie:s.
IFERC FORM NO.1 (ED. 12-88) Page 123.46

(
Name of Respondent This Report is: Date of Report Year/Period of Report (1) X An Original (Mo, Da, Yr)
NSTAR Electric Company (2). A Resubmission I I 2015104
NOTES TO FINANCIAL STATEMENTS (Continued)
Yankee Companies Billings: CL&P, NSTAR Electric, PSNH and WMECO have decommissioning and plant closure cost obligations to.the_Yankee COmpanies, which have each completed the physical deconunissioning of their respective nuclear facilities and are now engaged in the long-term -storage of their spent fuel. For further information on the Yankee Companies, see Note 11 C, "Commitments and Contingencies- Contractual Obligations - Yankee Companies," to the financial statements.
The total costs incurred under these agreements were as follows:
Eversource
(Millions of Dollars)
Supply and Stranded Cost Renewable Energy PeakerCfDs Natural Gas Procurement Coal, Wood and Other Transmission Support Commitments
$
2015
NSTAR
2015
147.6 144.3 42.7
428.6 95.9 25.3
For the Years Ended December 31,
2014
$ 99.2 114.4
18.1 482.5 120.5 25.0
$
For the Years Ended December 31,
2014
NSTAR
2013
141.0 91.3 51.9
349.8 112.6 24.9
2013
NSTAR (Millions of Dollars) CL&P Electric ~ WMECO CL&P Electric PSNH WMECO CL&P Electric PSNH WMECO ---Supply and Stranded Cost $ 120.3 $ 6.5 $ 20.8 $ $ 63.0 $ 7.0 $ 26.0 $ 3.2 $ 77.6 $ 32.4 $ 29.0 $ 2.0 Renewable Energy 20.0 86.7 37.2 0.4 0.7 87.4 26.3 84.9 6.4 PeakerCIDs 42.7 18.1 51.9 Coal, Wood and Other 95.9 120.5 112.6 Transmission Support Commitments 10.0 7.8 5.4 2.1 9.9 7.7 5.3 2.1 9.8 7.7 5.3 2.1
C. Contractual Obligations- Yankee Companies CL&P, NSTAR Electric, PSNH and WMECO have plant closure and fuel storage cost obligations to the Yankee Companies, which have each completed the physical decommissioning of their respective nuclear facilities and are now engaged in the long-tenn storage of their spent fueL The Yankee Companies collect these costs through wholesale, PERC-approved rates charged under power purchase agreements with several New England utilities, including CL&P, NSTAR Electric, PSNH and WMECO. These companies in tum recover these costs from their customers through state regulatory commission-approved retail rates. TheY ankee Companies have collected or are currently collecting amounts that management believes are adequate to recover the remaining plant closure and fuel storage cost estimates for the respective plants. Management believes CL&P, NSTAR Electric and WlVIECO will recover their shares of these obligations from their customers. PSNI-I has recovered its total share of these costs from its customers.
CL&P, NSTAR Electric, PSNH and WMECO's percentage share of the obligations to support the Yankee Companies under PERC-approved rate tariffs is the same as their respective ownership percentages in the Yankee Companies. For further information on the ownership percentages, see Note IJ, 11 Summruy of Significant Accounting Policies- Equity Method Investments," to the financial statements.
Spent Nuclear Fuel Litigation: DOE Phase I Damages- In 2013, CYAPC, YAEC and MYAPC received proceeds of$39.6 million, $38.3 million, and $81.7 million, respectively, based on a final court judgment awarding damages for separate complaints filed by the Yankee Companies in 1998 against the DOE seeking monetary damages resulting from the DOE's failure to begin accepting spent nuclear fuel for disposal pursuant to the tenns of the 1983 spent fuel and high level waste disposal contracts between theY ankee Companies and the DOE (DOE Phase I Damages). Phase I covered damages for the period 1998 through 2002. In 2013, CY APC, Y AEC and MY APC reduced rates in their wholesale power contracts through the application ofthe DOE proceeds for the benefit of customers. CL&P, NSTARElectric, PSNH and WivlECO began receiving the benefit of the Phase I DOE proceeds in 2013, and the benefits are being passed on to customers.
In accordance with MY APC's three-year refund plan of the DOE Phase I Damages proceeds, in September 2014, MY APC returned the second portion ofthe proceeds to the member companies, including CL&P, NSTAR Electric, PSNH, and WMECO, in the amount of$3.2 million, $1.1 million, $1.4 million and $0.8 million, respectively. On September 28, 2015, MYAPC returned the remaining DOE Phase I Damages proceeds to the member companies, including CL&P, NSTAR Electric, PSNH, and WMECO, in the amount of$2.3 million, $0.8 million, $1 million and $0.6 million, respectively. These amounts reduced receivables at CL&P, NSTAR Electric, PSNH and WMECO.
IFERC FORM NO.1 (ED. 12-88) Page 123.47

(
Name of Respondent This Report is: Date of Report Year/Period of Report (1) ~An Original (Mo, Da, Yr)
NSTAR Electric Company (2) A Resubmission I I 2015104
NOTES TO FINANCIAL STATEMENTS (Continued)
DOE Phase II Damages- In 2014, CYAPC, YAEC and MYAPC received proceeds of$126.3 million, $73.3 million and $35.8 million, respectively, based on a final court judgment awarding damages for separate lawsuits filed by the Yankee Companies in 2007 against the DOE seeking recovery•of actual damages incurred related to the alleged failure of the DOE to provide for a pennanent facility to store spent nuclear fuel generated in years 2001 through 2008 for CYAPC and YAEC, and from 2002 through 2008 for MYAPC (DOE Phase II Damages). The Yankee Companies returned the DOE Phase II Damages proceeds to the member companies, including CL&P, NSTAR Electric, PSNH, and WMECO, for the benefit of their respective customers in June 2014.
As of December 31, 2014, CL&P1s refund obligation to customers of$65.4 million was recorded as an offset to the deferred storm restoration costs regulatory asset, as directed by PURA. NSTAR Electric's, PSNH's and WMECO's refund obligation to customers of$29.1 million, $13.1 million and $18.1 million, respectively, was recorded as a regulatory liability in each company's respective regulatory tracker mechanisms. Refunds to customers for these Phase II DOE proceeds were completed in 2015.
DOE Phase III Damages- In August 2013, the Yankee Companies each filed subsequent lawsuits against the DOE seeking recovery of actual damages incurred in the years 2009 through 2012. The DOE Phase III trial concluded on July I, 2015, with a post-trial briefing that concluded on October 14, 2015. The parties are awaiting a decision from the court.
D. Guarantees and Indemnifications In the nonnal course of business, Eversource parent provides credit assurances on behalf of its subsidiaries, including CL&P, NST AR Electric, PSNH and WMECO, in the form of guarantees.
Eversource parent issued a declining balance guaranty on behalf of a who1ly-owned subsidiary to guarantee the payment of the subsidiary's capital contributions for its investment in the Access Northeast project. The guarantee will not exceed $206 million and will decrease as capital contributions are made. l11e guaranty will expire upon the earlier of the full performance of the guaranteed obligations or December 31, 2021.
Eversource parent issued a guaranty on behalf of its subsidiary, NPT, under which, beginning at the time the Northern Pass Transmission line goes into commercial operation, Eversource parent will guarantee the financial obligations ofNPT under the TSA with HQ in an amount not to exceed $25 million. Eversource parent's obligations under the guaranty expire upon the full, fmal and indefeasible payment of the guaranteed obligations.
Eversource parent has also guaranteed certain indemnification and other obligations as a result of the sales offonner unregulated subsidiaries and the tennination of an unregulated business, with maximum exposures either not specified or not material.
Management does not anticipate a material impact to Net Income as a result of these various guarantees and indemnifications.
The following table summarizes Eversource parent's exposure to guarantees and indemnifications of its subsidiaries, including CL&P, NSTAR Electric, PSNH and WMECO, and guarantees to external parties, as ofDecember 31,2015:
Company
On behalf of subsidiaries: Various Eversource Service and Rock-y River Realty Company
On behalf of external parties: Algonquin Gas Transmission, LLC
(owner of Access Northeast assets)
Description
Surety Bonds (1) Lease Payments for Vehicles and Real Estate
Access Northeast project capital contributions guarantee
Maximum Exposure (in millioos) Expiration Dates
$ 32.7 2016-2018 $ 11.4 2019 and 2024
$ 204.8 2021
(1) Surety bo.nd expiration dates reflect tennination dates, the majority of which will be renewed or extended. Certain surety bonds contain credit ratings triggers that would require Eversource parent to post collateral in the event that the unsecured debt credit ratings ofEversource are downgraded.
IFERC FORM NO.1 (ED.12-88) Page 123.48

(
Name of Respondent This Report is: Date of Report Year/Period of Report (1) X An Original (Mo, Da, Yr)
NSTAR Electric Company (2). A Resubmission I I 2015104
NOTES TO FINANCIAL STATEMENTS (Continued)
E. FERC ROE Complaints 1~hree separate complaints have been filed at FERC by combinations of New England state attorneys general, state regulatory commissi.ons, consumer advocates, consumer groups, municipal parties and other parties (the "Complainants"). In the first complaint, filed in 2011, the Complainants alleged that the NETOsr base ROE that had been utilized since 2006 was unjust and unreasonable, asserted that the rate was excessive due to changes in the <..><apital markets, and sought an order to reduce it prospectively from the date of the final PERC order and for the 15-month period beginning October I, 20I I to December 3I, 20I2. In the second and third complaints, filed in 20I2 and 20I4, the Complainants challenged the NETOs' base ROE and sought refunds for the respective I5-month periods beginning December 27, 20I2 and July 3I, 20I4.
As a result of the actions taken by the FERC and other developments in the ftrst complaint matter, the Company recorded additional reseTI~es at its electric subsidiaries in 2015 and 2014. In 2015, Eversource recognized a pre-tax charge to earnings (excluding interest) of $20 million, of which $12.5 million was recorded at CL&P, $2.4 million at NSTAR Electric, $I million at PSNH, and $4.I million at WMECO. The pre-tax charge was recorded as a regulatory liability and as a reduction to Operating Revenues. In 2014, the net aggregate pre-tax charge to earnings (excluding interest) totaled $37 million, of which $20.7 million was recorded at CL&P, $7.9 million at NSTAR Electric, $2.8 million at PSNH and $5.6 million at WMECO. In 2013, the net aggregate pre-tax charge to earnings (excluding interest) totaled $23.7 million, of which $I2.8 million was recorded at CL&P, $5.7 million at NSTAR Electric, $2.3 million at PSNH and $2.9 million at WMECO.
The second and third complaint proceedings are ongoing and a fmal FERC order is expected in late 2016 or early 2017. Although management is uncertain on the final outcome of the second and third complaints regarding the ROE, management believes the current reserves established are appropriate to reflect probable and reasonably estimable refunds.
F. NSTAR Electric and NSTAR Gas Comprehensive Settlement Agreement On March 2, 20I5, the DPU approved the comprehensive settlement agreement between NSTAR Electric, NSTAR Gas and the Massachusetts Attorney General (the "Settlement') as filed with the DPU on December 3I, 20I4. The Settlement resolved the outstanding NSTARElectric CPSL program filings for 2006 through 2011, the NSTAR Electric and NSTAR Gas PAM and energy efficiency-related customer billing adjustments reported in 20I2, and the recovery ofLBR related to NSTARElectric's energy efficiency programs for 2009 through 2011 (II dockets in total). In the first quarter of2015, as a result of the DPU order, NSTARElectric and NSTAR Gas commenced refunding a combined $44.7 million to customers, which was recorded as a regulatory liability. Refunds to customers will continue through December 2016. As a result of the Settlement, NSTAR Electric increased its operating revenues and decreased its amortization expense in 2015, resulting in the recognition of a $21.7 million pre-tax benefit in 2015.
· G. NSTAR Electric Basic Service Bad Debt Adder On January 7, 2015, the DPU issued an order concluding thatNSTAR Electric had removed energy-related bad debt costs from base distribution rates effective January I, 2006. As a result of the DPU order, in the first quarter of2015, NSTAR Electric increased its regulatory assets and reduced its operations and maintenance expense by an under recovered amount of$24.2 million for energy-related bad debt costs through 2014, resulting in a pre-tax benefit in 2015. NSTARElectric filed for recovery of the energy-related bad debt costs regulatory asset from customers and on November 20, 2015the DPU approved NSTAR Electric's proposed rate increase, to recover these costs over a 12-month period, effective January 1, 20I6.
H. PSNH Generation Restructuring On June 10, 2015, Eversource an!}. PSNH entered into the 2015 Public Service Company of New Hampshire Restructuring and Rate Stabilization Agreement (the Agreement) with the New Hampshire Office of Energy and Planning, certain members of the NHPUC staff, the Office of Consumer Advocate, two State Senators, and several other parties. The Agreement was filed with the NHPUC on the same day. Under the terms ofthe Agreement, PSNH has agreed to divest its generation assets upon NHPUC approval. The Agreement is designed to provide a resolution of issues pertaining to PSNH's generation assets in pending regulatory proceedings before the NHPUC. The Agreement provided for the Clean Air Project prudence proceeding to be resolved and all remaining Clean Air Project costs to be included in rates effective January 1, 2016. As part of the Agreement, PSNH has agreed to forego recovery of $25 million of the deferred equity return related to the Clean Air Project. In addition, PSNH will not seek a general distribution rate increase effective before July 1, 2017 and will contribute $5 million to create a clean energy fund, which will not be recoverable from its customers. In2015, PSNH recorded the $5 million contribution as a long-tenn liability and an increase to Operations and Maintenance expense on the statements of income.
Upon completion ofthe divestiture process, all remaining stranded costs will be recovered via bonds that will be secured by a non-bypassable charge or through other recoveries in rates billed to PSNH customers.
I FERC FORM NO.1 (ED. 12-88) Page 123.49

r-
(
Name of Respondent This Report is: Date of Report Year/Period of Report (1) 2s: An Original (Mo, Da, Yr)
NSTAR Electric Company (2) A Resubmission I I 2015104
NOTES TO FINANCIAL STATEMENTS (Continued)
On January 26, 2016, Advisory Staff of the NHPUC and the parties to the Agreement filed a stipulation with the NHPUC agreeing that near-term divestiture ofPSNH's generation was in the public interest and that the Agreement shmild be approved. Implementation of the Agreement is subjeet to NHPUC approval, which is expected in early 2016.
If the NHPUC approves the settlements and the sale of the plants, then management expects to sell the plants in the first half of2017. The sales pri£e of the generating assets could be less than the carrying value, but we believe that full recovery_ ofPSNH's generation assets is probable through a combination of cash flows during the remaining operating period, sales proceeds upon divestiture, and recovery of stranded costs in future rates.
I. Litigation and Legal Proceedings Eversource, including CL&P, NST AR Electric, PSNH and 'W1v!ECO, are involved in legal, tax and regulatory proceedings regarding matters arising in the ordinary course of business, which involve management's assessment to detem1ine the probability of whether a loss will occur and, if probable, its best estimate of probable loss. The Company records and discloses losses when these losses are probable and reasonably estimable, and discloses matters when losses are probable but not estimable or when losses are reasonably possible. Legal costs related to the defense ofloss contingencies are expensed as incurred.
12. LEASES
Eversource, including CL&P, NSTAR Electric, PSNH and WMECO, has entered into lease agreements, some of which are capital leases, for the use of data processing and office equipment, vehicles, service centers, and office space. In addition, CL&P, NSTAR Electric, PSNH and W1v1ECO incur costs associated with leases entered into by Eversource Service and Rocky River Realty Company, which are included below in their respective operating lease rental expenses and future minimum rental payments. These intercompany lease amounts are eliminated on an Eversource consolidated basis. The provisions of the Eversource, CL&P, NSTAR Electric, PSNH, and W1v1ECO lease agreements generally contain renewal options. Certain lease agreements contain payments impacted by the commercial paper rate plus a credit spread or the consumer price index.
Operating lease rental payments charged to expense are as follows:
NSTAR (Millions of Dollars) Eversource CL&P Electric PSNH WMECO
2015 $ 12.1 $ 12.5 $ 9.6 $ 2.8 $ 2.2 2014 14.3 6.0 7.8 1.5 1.2 2013 16.3 8.1 6.7 1.7 2.9
The 2015 rental payments above for CL&P, NSTARElectric, PSNH, and WMECO include an intercompany rate of return, property tax and operational expense component paid to Rocky River Realty Company.
·Future minimum rental payments, excluding executory costs, such as property taxes, state use taxes, insurance, and maintenance, under long-term noncancelable leases, as ofDecember 31,2015 are as follows:
Operating Leases NSTAR (Millions of Dollars) Eversource CL&P Electric PSNH WMECO
2016 $ 16.4 $ 2.9 $ 9.7 $ 0.8 $ 0.8 2017 13.8 2.0 8.5 0.7 0.7 2018 10.4 1.3 6.5 0.5 0.6 2019 8.5 1.0 5.3 0.4 0.5 2020 6.8 0.7 4.3 0.3 0.5 Thereafter 15.4 1.7 9.0 0.7 1.8 Future minimum lease payments $ 71.3 $ 9.6 $ 43.3 $ 3.4 $ 4.9
IFERC FORM N0.1 (ED. 12-88) Page 123.50

(
Name of Respondent This Report is: Date of Report Year/Period of Report (1) 2S An Original (Mo, Da, Yr)
NSTAR Electric Company (2) A Resubmission I I 2015104
NOTES TO FINANCIAL STATEMENTS (Continued)
C~pital Leases (Millions of Dollars) Eversource CL&P PSNH
2016 $ 2.2 $ 1.9 $ 0.3 2017 2.1 1.9 0.2 2~18 2.1 2.0 0.1 2019 2.0 2.0 2020 2.0 2.0 Thereafter 1.4 1.4 Future minimum lease payments 11.8 11.2 0.6 Less amount representing interest 3.6 3.6 Present value of future minimum lease payments $ 8.2 $ 7.6 $ 0.6
CL&.P entered into certain contracts for the purchase of energy that qualify as leases. These CQntracts do not have minimum lease payments and therefore are not included in the tables above. However, such contracts have been included in the contractual obligations table in Note liB, "Commitments and Contingencies - Long-Term Contractual Arrangements," to the financial statements.
13. FAIR VALUE OF FINANCIAL INSTRUMENTS
The following methods and assumptions were used to estimate the fair value of each of the following financial instruments:
Preftrred Stock and Long-Term Debt: The fair value ofCL&P's and NSTARElectrids preferred stock is based upon pricing models that incorporate interest rates and other market factors, valuations or trades of similar securities and cash flow projections. The fair value of long-term debt securities is based upon pricing models that incorporate quoted market prices for those issues or similar issues adjusted for market conditions, credit ratings of the respective companies and treasury benchmark yields. The fair values provided in the tables below are classified as Leve12 within the fair value hierarchy. Carrying amounts and estimated fair values are as follows: -
As ofDecember31,
( Eversource 2015 2014
Carrying Fair Carrying Fuir {Millions ofDollars) Preferred Stock Not Subject
to Mandatory Redemption Long-Term Debt
(Millions of Dollars) Preferred Stock Not Subject to Mandatory Redemption
Long-Term Debt
(Millions of Dollars) Preferred Stock Not Subject
to Mandatory Redemption Long-Tem1 Debt
$
$
$
Amount
155.6 $ 9,034.5
CL&P
Carrying Amount
116.2 $ 2,763.7
CL&P
Carrying Amount
116.2 $ 2,826.2
Value
.157.9 9,425.9
Fair Value
114.9 $ 3,031.6
Fair Value
112.0 $ 3,214.5
Amount Value
$ 155.6 $ 153.6 8,814.0 9,451.2
As ofDecember31, 2015
NSTAR Electric PSNH WMECO Carrying Fair Carrying Fair Carrying Fair Amount Value Amount Value Amount Value
43.0 $ 43.0 $ $ $ $ 2,029.8 2,182.4 1,071.0 1,121.2 517.3 551.8
As of December 31, 2014
NSTAR Electric PSNH WMECO
Carrying Fair Cnn-jing ·Fair Carrying Fair Amount Value Amount Value Amount Value
43.0 $ 41.6 $ $ $ $ 1,786.2 1,993.5 1,070.0 1,137.9 625.2 689.4
Effective December 31, 2015, the carrying amount of Long-Term Debt includes unamortized debt issuance costs presented as a direct reduction from the carrying amount of the debt liability, in accordance with new accounting guidance. The December 31, 2014 carrying amount of Long-Term Debt was retrospectively adjusted to conform to the current year presentation. See Note I C, "Summary of Significant AccoWlting P<?licies- Accounting Standards," for further information.
IFERC FORM NO.1 (ED. 12-88) Page 123.51

(' \
(
Name of Respondent This Report is: Date of Report Year/Period of Report (1) ~An Original (Mo, Da, Yr)
NSTAR Electric Company (2) A Resubmission I I 2015/04
NOTES TO FINANCIAL STATEMENTS (Continued)
Derivative Instruments: Derivative instruments are carried at fair value. For further infonnation, see Note 4, "Derivative Instruments," to the financial statements.
Other Financial Instruments: Investments in marketable securities are carried at fair value. For further information, see Note 5, "Marketable Securities," to the financial statements. The carrying value of other financial instruments included in current assets and current liabilities on the balance sheets, including cash and cash equivalents and special deposits, approximates their fair value due to their short-term nature.
See Note IH, "Summary of Significant Accounting Policies -Fair Value Measurements, 11 for the fair value measurement policy and the fair value hierarchy.
14. ACCUMULATED OTHER COMPREHENSNE INCOMEI(LOSS)
The changes in accumulated other comprehensive income/(loss) by component, net of tax effect, is as folJows:
For the Year Ended December 31, 2015 For the Year Ended December 31, 2014 Qualified Unrealized Qualified Unrealized
Cash Flow Gains/(LossCs) Defined Cash Flow Gains on Defined Eversource Hedging on Marketable Benefit Hedging Marketable Benefit (Millions of Dollars) Instruments Securities Plans Total Instruments Securities Plans Total
Balance as of January JSt $ (12.4) $ 0.7 $ (62.3) $ (74.0) $ (14.4) $ 0.4 $ (32.0) $ (46.0)
OCI Before Reclassifications (2.6) 3.5 0.9 0.3 (34.2) (33.9) Amounts Reclassified from AOCI 2.1 4.2 6.3 2.0 3.9 5.9
NetOCI 2.1 (2.6) 7.7 7.2 2.0 0.3 ~30.3) (28.0)
Balance as of December 31st $ (10.3) $ (1.9) $ (54.6) $ (66.8) $ (12.4) $ 0.7 $ (62.3) $ (74.0)
Eversource's qualified cash flow hedging instruments represent interest rate swap agreements on debt issuances that were settled in prior years. The settlement amount was rficorded in AOCI and is being amortized into Net Income over the term of the underlying debt instmment. CL&P, PSNH and W1v1ECO continue to amortize interest rate swaps settled in prior years from AOCI into Interest Expense over the remaining life of the associated long-tenn debt. Such interest rate swaps are not material to their respective financial statements.
The amortization expense of actuarial gains and losses and prior service cost on the defmed benefit plans is amortized from AOCI into Operations and Maintenance over the average future employee service period, and is reflected in amounts reclassified from AOCI.
Defined benefit plan OCI amounts before reclassifications relate to actuarial gains and losses that arose during the year and were recognized in AOCI. The related ta"X effects recognized inAOCI during 2015 and 2013 were net deferred tax liabilities of$2 million in 2015 and $11.4 million in 2013, respectively, and net deferred tax assets of$22.3 million in 2014.
The following table sets forth the amounts reclassified from AOCI by component and the impacted line item on the statements of income:
Eversource
(Millions of Dollars) Qualified Cash Flow Hedging Instruments Tax Effect Qualified Cash Flow Hedging Instruments, Net of Tax
Defined Benefit Plan Costs: Amortization of Actuarial Losses Amortization of Prior Service Cost
Total Defined Benefit Plan Costs Tax Effect Defined Benefit Plan Costs, Net of Tax
Total Amounts Reclassified from AOCI, Net of Tax
2015
$
$
$
$
$
Amounts Reclassified from AOCI
For the Years Ended December 31, Statements of Income Line Item Impacted
(3.5) $ 1.4
(2.1) $
(6.6) $
(0.2)
(6.8) 2.6
(4.2) $
(6.3) $
2014 2013
(3.4) $ (3.4) 1.4 1.4
(2.0) ~$ ___ ~(2::':-.0)
Interest Expense Income Tax Expense
(6.2) $ (10.5) Operations and Maintenance (l) (0.2) -------'(0:::."'2) Operations and Maintenance (I) (6.4) (10.7)
2.5 ;;---------;4;:·.::,3 Income Tax Expense (3.9) ,$ ___ __,(""6 . .:.!.4)
(5 9) :c$ ___ __,(cc8.214)
(!) These amounts are included in the computation of net periodic Pension, SERP and PBOP costs. See Note 9A, "Employee Benefits- Pension Benefits and Postretirement Benefits Other Than Pensions," for further infonnation.
IFERC FORM NO.1 (ED.12-88) Page 123.52

Name of Respondent This Report is: Date of Report Year/Period of Report (1) ~An Original (Mo, Da, Yr)
NSTAR Electric Company (2) A Resubmission I I 2015104
NOTES TO FINANCIAL STATEMENTS (Continued)
As of December 31, 2015, it was estimated that a pre-tax amount of$3.6 million (including $0.7 million for CL&P, $2 million for PSNH and $0.7 million for \VMECO) will be reclassified from AOCI as a decrease to Net Income over the next 12 months as a result of the amortization of the interest rate swap agreements which have been settled. In addition, it is estimated that a pre-tax amount of$6 million will be reclassified from AOCI as a decrease to Net Income over the next 12 months as a result of the amortization of Pension, SERP and PBOP costs.
15. DIVIDEND RESTRICTIONS
Eversource parent's ability to pay dividends may be affected by certain state statutes, the ability of its subSidiaries to pay common dividends and the leverage restriction tied to its consolidated total debt to total capitalization ratio requirement in its revolving credit agreement.
CL&P, NSTAR Electric, PSNH and WMECO are subject to Section 305 of the Federal Power Act that makes it unlawful for a public utility to make or pay a dividend from any funds "properly included in its capital account. 11 Management believes that this Federal Power Act restriction, as applied to CL&P, NSTAR Electric, PSNH and WMECO, would not be construed or applied by the FERC to prohibit the payment of dividends from retained earnings for lawful and legitimate business purposes. In addition, certain state statutes may impose additional limitations on such compariies and on Yankee Gas and NSTAR Gas. Such state law restrictions do not restrict the payment of dividends-from retained earnings or net income. Pursuant to the joint revolving credit agreement ofEversource, CL&P, PSNH, WMECO, Yankee Gas and NSTAR Gas, and to the NSTAR Electric revolving credit agreement, each company is required to maintain consolidated total debt to total capitalization ratio of no greater than 65 percent at the end of each fiscal quarter. As of December 31, 2015, all companies were in compliance with sU:ch covenant. The Retained Earnings balances subject to these restrictions were $2.8 billion for Eversource, $1.2 billion for CL&P, $1.6 billion forNSTAR Electric, $494.9 million for PSNH and $198.1 million for WMECO as of December 31, 2015. As of December 31, 2015, Eversource, CL&P, NSTAR Electric, PSNH, WMECO, Yankee Gas and NSTAR Gas were in compliance with all such provisions of the revolving credit agreements that may restrict the payment of dividends. PSNH is further required to reserve an additional amount under its FERC hydroelectric Jicense conditions. As of December 31,2015, $13.4 million of PSNH's Retained Earnings was subject to restriction under its FERC hydroelectric license conditions and PSNH was in compliance with this provision.
16. COMMON SHARES
( The following table sets forth the Eversource parent common shares and those of CL&P, NSTAR Electric, PSNH and WMECO that were authorized and issued as well as the respective per share par values:
Shares
Authorized Issued Per Share as of December 31, as of December 31,
Par Value 2015 and 2014 2015 2014
Eversource $ 5 380,000,000 333,862,615 333,359,172 CL&P $ 10 24,500,000 6,035,205 6,035,205 NSTAR Electric $ I 100,000,000 100 100 PSNH $ I 100,000,000 301 301 WMECO $ 25 1,072,471 434,653 434,653
As of December 31, 2015 and 2014, there were 16,671,366 and 16,375,835 Eversource common shares held as treasury shares, respectively. As of December 31, 2015 and 2014, Eversource common shares outstanding were 317,191,249 and 316,983,337, respectively. In May 2015, the Company repurchased 532,521 Eversource conunon shares at a share price of$47.94. Such shares are included in Treasury Stock on the consolidated balance sheet at their weighted average original average cost of$26.02 per share.
IFERC FORM N0.1 (ED. 12-88) Page 123.53

I '
\.___ .. /
Name of Respondent This Report is: Date of Report Year/Period of Report (1) ~An Original (Mo, Da, Yr)
NSTAR Electric Company (2) A Resubmission I I 20151Q4
NOTES TO FINANCIAL STATEMENTS (Continued)
17. PREFERRED STOCK NOT SUBJECT TO MANDATORY REDEMPTION
The CL&P and NSTAR Electric preferred stock is not subject to mandatory redemption and is presented as a noncontrolling interest of a subsidiary in Eversource's financial statements.
CL&P is authorized to issue up to 9,000,000 shares of preferred stock, par value $50 per share, and NSTAR Electric is authorized to issue 2,890,000 shares of preferred stock, parv~ue $100 per share. Holders of preferred stock ofCL&P and NSTAR Electric are entitled to receive cumulative dividends in preference to any payment of dividends on the conunon stock. Upon liquidation, holders of preferred stock of CL&P and NSTAR Electric are entitled to receive a liquidation preference before any distribution to holders of common stock in an amount equal to the par value of the preferred stock plus accrued and unpaid dividends. If the net assets were to be insufficient to pay the liquidation preference in full, then the net assets would be distributed ratably to all holders of preferred stock. The preferred stock ofCL&P and NSTAREJectric is subject to optional redemption by the CL&P and NSTAR Electric Board of Directors at any time.
Details of preferred stock not subject to mandatory redemption are as follows (in millions except in redemption price and shares):
Redemption Price Shares Outstanding as of As of December 31, Series Per Share December 31, 2015 and 2014 2015 2014 CL&P $ 1.90 Series of 1947 $ 52.50 163,912 $ 8.2 $ 8.2 $ 2.00 Series of 1947 $ 54.00 336,088 16.8 16.8 $ 2.04 Series of 1949 $ 52.00 100,000 5.0 5.0 $ 2.20 Series of 1949 $ 52.50 200,000 10.0 10.0
3.90 % Series of 1949 $ 50.50 160,000 8.0 8.0 $ 2.06 Series E of 1954 $ 51.00 200,000 10.0 10.0 $ 2.09 Series F of 1955 $ 51.00 100,000 5.0 5.0
4.50 % Series of 1956 $ 50.75 104,000 5.2 5.2
4.96 % Series· ofl958 $ 50.50 100,000 5.0 5.0
4.50 % Series of 1963 $ 50.50 160,000 8.0 8.0 5.28 % Series of 1967 $ 51.43 200,000 10.0 10.0
$ 3.24 Series G of 1968 $ 51.84 300,000 15.0 15.0
6.56 % Series of1968 $ 51.44 200,000 10.0 10.0
Total CL&P 2,324,000 $ 116.2 $ 116.2
NSTAR Electric 4.25 % Series $ 103.625 180,000 $ 18.0 $ 18.0 4. 78 % Series $ 102.80 250,000 25.0 25.0
Total NSTAR Electric 430,000 $ 43.0 $ 43.0 F_air Value Adjustment due to Merger with NSTAR (3.6) (3.6)
Total Eversource- Preferred Stock of Subsidiaries $ 155.6 $ 155.6
18. COMMON SHAREHOLDERS' EQUITY AND NONCONTROLLING INTERESTS
Dividends on t11e preferred stock ofCL&P and NSTAR Electric totaled $7.5 million, $7.5 million and $7.7 million for the years ended December 31, 2015,2014 and 2013. These dividends were presented as Net Income Attributable to Noncontrolling Interests on the Eversource statements of income. Noncontrolling Interest- Preferred Stock of Subsidiaries on the Eversource balance sheets totaled $155.6 million as of December 31, 2015 and 2014. Common Shareholders' Equity was fully attributable to the parent and Noncontrolling Interest- Preferred Stock of Subsidiaries was fully attributable to the non controlling interest on the Eversource balance sheets.
For the years ended December 31, 2015,2014 and 2013, there was no change in ownership of the common equity ofCL&P and NSTAR Electric.
IFERC FORM NO.1 (ED. 12-88) Page 123.54

(
(
Name of Respondent This Report is: Date of Report Year/Period of Report (1) 6 An Original (Mo, Da, Yr)
NSTAR Electric Company (2) A Resubmission I I 2015104
NOTES TO FINANCIAL STATEMENTS (Continued)
19. EARNINGS PER SHARE
Basic EPS is computed based upon the weighted average number of common shares outstanding during each period. Diluted EPS is computed on the basis of the weighted average number of common shares outstanding during each period plus the potential dilutive effect of certain share-based compensation awards as if they were converted into common shares. For the years ended December 31, 2015, 2014 and 2013, there were 1,474, 3,643 and 1,575 antidilutive share "awards excluded from the computation of diluted EPS, respectively.
The following table sets forth the components of basic and diluted EPS:
Eversource For the Years Ended December 31,
(Millions of Dollars, except share information) 2015
878.5 Net Income Attributable to Common Shareholders ~$~----~!"-
Weighted Average Common Shares Outstanding: Basic Dilutive Effect Diluted
Basic EPS
Diluted EPS
317,336,881 1,095,806
318,432,687 $ 2.77 $ 2.76
2014
$ 819.5 $
316,136,748 1,280,666
317,417,414 $ 2.59 $
$ 2.58 $
2013
786.0
315,311,387 899,773
316,211,160 2.49 2.49
RSU and performance share awards are included in basic w~ighted average common shares outstanding as of the date that all necessary vesting conditions have been satisfied. The dilutive effect ofunvested RSU and performance share awards is calculated using the treasury stock method. Assumed proceeds of these awards under the treasury stock metho4 consist of the remaining compensation cost to be recognized and a theoretical tax benefit. The theoretical tax benefit is calculated as the tax impact of the intrinsic value of the awards (the difference between the market value of the average awards outstanding for the period, using the average market price during the period, and the grant date market value).
The dilutive effect of stock options to purchase common shares is also calculated using the treasury stock method. Assumed proceeds for stock options consist of cash proceeds that would be received upon exercise, and a theoretical tax benefit. The theoretical tax benefit is calculated as the tax impact of the intrinsic value of the stock options (the difference between the market value of the average stock options outstanding for the period, using the average market price during the period, and the exercise price).
20. SEGMENT INFORMATION
Presentation: Eversource is organized between the Electric Distribution, Electric Transmission and Natural Gas Distribution reportable segments and Other based on a combination of factors, including the characteristics of each segments' products and services, the sources of operating revenues and expenses and the regulatory environment in which each segment operates. These reportable segments represent substantially all ofEversource's total consolidated revenues. Revenues from the sale of electricity and natural gas primarily are derived from residential, commercial and industrial customers and are not dependent on any single customer. The Electric Distribution reportable segment includes the generation activities ofPSNH and WMECO.
The remainder ofEversource's operations is presented as Other in the tables below and primarily consists of I) the equity in earnings ofEversource parent from its subsidiaries and intercompany interest income, both of which are eliminated in consolidation, and interest expense related to the debt ofEversource parent, 2) the revenues and expenses ofEversource Service, most of which are eliminated in consolidation, 3) the operations of CY APC and Y AEC, 4) the results of Eversource Gas Transmission LLC and 5) the results of other unregulated subsidiaries, which are nOt part of its core business.
Cash flows used for investments in plant included in the segment information below are cash capital expenditures that do not include amounts incurred but not paid, cost of removal, AFUDC related to equity funds, and the capitalized portions of pension expense.
Eversource's reportable segments are dete1mined based upon the level at which Eversource's chief operating decision maker assesses performance and makes decisions about the allocation of company resources. Each ofEversource's subsidiaries, including CL&P, NSTAR Electric, PSNH and \VMECO, has one reportable segment. Eversource's operating segments and reporting units are consistent with its reportable business segments.
IFERC FORM NO.1 (ED. 12-88) Page 123.55

Name of Respondent This Report is: Date of Report Year/Period of Report (1) 2$, An Original (Mo, Da, Yr)
NSTAR Electric Company (2) A Resubmission I I 2015104
NOTES TO FINANCIAL STATEMENTS (Continued)
( EVersource's segment information is as follows:
For the Year Ended December 31, 2015 Eversource Electric Natural Gas Electric (Millions of Dollars) Distribution Distribution Transmission Other Eliminations Total Operating Revenues $ 5,903.6 $ 995.5 $ 1,069.1 $ 863.6 $ (877.0) $ 7,954:8 Depreciation and Amortization (425.2) (70.5) (165.6) (29.0) 2.1 (688.2) Other Operating Expenses (4,470.2) (776.7) (314.9) (817.9) 877.3 (5,502.4) Operating Income 1,008.2 148.3 588.6 16.7 2.4 1,764.2 Interest Expense (186.3) (36.9) (105.8) (48.0) 4.6 (372.4) Interest Income 5.7 0.1 1.6 4.4 (5.1) 6.7 Other Income, Net 7.2 0.8 14.5 977.8 (972.8) 27.5 Income Tax (Expense)/Benefit (322.8) (40.1) (191.6) 14.5 (540.0) Net Income 512.0 72.2 307.3 965.4 (970.9) 886.0 Net Income Attributable
to Noncontroiiing Interests (4.7) (2.8) (7.5) Net Income Attributable
to Common Shareholders $ 507.3 $ 72.2 $ 304.5 $ 965.4 $ (970.9) $ 878.5 Total Assets (as of) $ 17,981.3 $ 3,104.5 $ 8,019.3 $ 13,256.7 $ (11,781.5) $ 30,580:3 Cash Flows Used for
Investments in Plant $ 718.9 $ 182.2 $ 749.1 $ 73.9 $ $ 1,724.1
For the Year Ended December 31, 2014 Eversource Electric Natural Gas Electric (Millions of Dollars) Distribution Distribution Transmission Other Eliminations Total
Operating Revenues $ 5,663.4 $ 1,007.3 $ 1,018.2 $ 790.9 $ (737.9) $ 7,741.9 Depreciation and An10rtization (384.6) (68.1) (150.5) (42.1) 19.9 (625.4) Other Operating Expenses (4,366.2) (786.7) (302.1) (748.0) 719.3 (5,483.7) Operating Income 912.6 152.5 565.6 0.8 1.3 1,632.8
( Interest Expense (191.6) (34.0) (104.1) (36.6) 4.2 (362.1) Interest Income 5.1 0.9 3.6 (3.6) 6.0 Other Income, Net 10.7 0.2 10.3 916.0 (918.6) 18.6 Income Tax (Expense)/Bene:fit (269.7) (46.4) (174.5) 22.3 (468.3) Net Income 467.1 72.3 298.2 906.1 (916.7) 827.0 Net Income Attributable
to Noncontrolling Interests (4.7) (2.8) (7.5) Net Income Attributable
to Common Shareholders $ 462.4 $ 72.3 $ 295.4 $ 906.1 $ (916.7) $ 819.5 Total Assets (as of) $ 17,536.9 $ 3,029.3 $ 7,615.6 $ !2,664.9 $ (11,106.3) $ 29,740.4 Cash Flows Used for
Investments in Plant $ 645.2 $ 176.7 $ 731.6 $ 50.2 $ $ 1,603.7
For the Year Ended December 31, 2013 Eversource Electric Natural Gas Electric (Millions of Dollars) Distribution Distribution Transmission Other Eliminations Total Operating Revenues $ 5,362.3 $ 855.8 $ 978.7 $ 777.5 $ (673.1) $ 7,301.2 Depreciation and Amortization (604.8) (66.7) (136.2) (62.2) 10.2 (859.7) Other Operating Expenses (3,927.7) (659.4) (281.8) (715.0) 671.8 (4,912.1) Operating Income 829.8 129.7 560.7 0.3 8.9 1,529.4 Interest Expense (175.0) (33.1) (100.3) (35.5) 5.2 (338.7) Interest Income 4.1 0.7 5.4 (5.6) 4.6 Other Income, Net 12.9 0.8 10.9 858.9 (858.2) 25.3 Income Tax (Expense)/Benefit (240.0) (36.5) (182.1) 31.9 (0.2) (426.9) Net Income 431.8 60,9 289.9 861.0 (849.9) 793.7 Net Income Attributable
to Noncontrolling Interests (4.8) (2.9) (7.7) Net Income Attributable
to Common Shareholders $ 427.0 $ 60.9 $ 287.0 $ 861.0 $ (849.9) $ 786.0 Cash Flows Used for
Investments in Plant $ 639.0 $ 168.1 $ 618.5 $ 31.2 $ $ 1,456.8
l IFERC FORM N0.1 (ED.12-88) Page 123.56

.(
(
Name of Respondent This Report is: Date of Report Year/Period of Report (1) ~An Original (Mo, Da, Yr)
NSTAR Electric Company (2) A Resubmission I I 2015104
NOTES TO FINANCIAL STATEMENTS (Continued)
21. GOODWILL '
Eversource recorded approximately $3.2 billion of goodwill in connection with the 2012 merger with NSTAR and $0.3 billion of goodwill related to the acquisition of the parent of Yankee Gas in 2000.
Goodwill is not subject to amortization, however is subject to a fair value based assessment for impairment at least annually and whenever facts or circumstances indicate that there may be an impainnent. A resulting write-down, if any, would be charged to Operating Expenses. Eversource,s reporting units for the purpose of testing goodwill for impainnent are Electric Distribution, Electric Transmission and Natural Gas Distribution. These reporting units are consistent with the operating segments underlying the reportable segments identified in Note 20, 11 Segment Information/' to the financial statements.
The annual goodwill assessment included an evaluation of the Company's share price and credit ratings, analyst reports, financial perfonnance, cost and risk factors, long-term strategy, growth and future projections, as well as macroeconomic, industry and market conditions. Eversource completed its annual goodwill impairment test for each of its reporting units as of October 1, 2015 and determined that no impainnent existed. There were no events subsequent to October 1, 2015 that indicated impairment of goodwill.
There were no changes to the goodwill balance or the allocation of goodwill as of December 31, 2015 or 2014. The following table presents goodwill by reportable segment:
(Billions of Dollars)
Goodwill
Electric Distribution
$ 2.5
22. VARIABLE INTEREST ENTITIES
As of December 31, 2015 and 2014
Electric Transmission
$ 0.6
Natural Gas Distribution
$ 0.4
Total
$ 3.5
The Company's variable interests outside of the consolidated group are not material and consist of contracts that are required by regulation and provide for regulatory recovery of contract costs and benefits through customer rates. Eversource, CL&P and NST AR Electric hold variable interests in variable interest entities (VIEs) through agreements with certain entities that own single renewable energy or peaking generation power plants and with other independent power producers. Eversource, CL&P and NSTAR Electric do not control the activities that are economically significant to these VIEs or provide financial or other support to these VIEs. Therefore, Eversource, CL&P and NSTAR Electric do not consolidate any power plant VIEs.
IFERC FORM NO.1 (ED. 12-88) Page 123.57

Name of Respondent This Report is: Date of Report Year/Period of Report (1) K An Original (Mo, Da, Yr)
NSTAR Electric Company (2) A Resubmission I I 2015104
NOTES TO FINANCIAL STATEMENTS (Continued)
( 23. QUARTERLY FINANCIAL DATA (UNAUDITED)
Eversource Quarter Ended (Millions of Dollars, except
2015 2014 per share infonnation) March311
June30, September 30, December 31, March31, June30, Se!!tember 30, December 31,
Operating Revenues $ 2,513.4 $ 1,817.1 $ 1,933.1 . $ 1,691.2 $ 2,290.6 $ 1,677.6 $ 1,892.5 $ 1,881.2 Operating Income 497.5 412.0 469.2 385.5 467.7 294.0 440.9 430.2 Net Income 255.1 209.4 237.8 183.7 237.8 129.2 236.5 223.6 Net Income Attributable to Conunon Shareholders 253.3 207.5 235.9 181.8 236.0 127.4 234.6 221.5 Basic EPS (a) $ 0.80 $ 0.65 $ 0.74 $ 0.57 $ 0.75 $ 0.40 $ 0.74 $ 0.69 Diluted EPS (a) $ 0.80 $ 0.65 $ 0.74 $ 0.57 $ 0.74 $ 0.40 $ 0.74 $ 0.69
(a) The summation of quarterly E!'S data may not equal annual data due to rounding.
Quarter Ended
2015 2014
(Millions of Dollars) March31, June30, September 30, December 31, March31, June30, Sel!tember 30, December 31,
CL&P Operating Revenues $ 804.9 $ 666.6 $ 704.3 $ 626.9 $ 734.6 $ 587.3 $ 695.6 $ 675.1 Operating Income 141.8 154.0 161.1 154.2 158.0 92.1 146.2 159.0 Net Income 69.2 78.8 80.2 71.2 79.3 37.4 83.9 87.2
NSTAR Electric Operating Revenues $ 766.8 $ 617.2 $ 750.7 $ 546.6 $ 666.2 $ 561.5 $ 727.9 $ 581.1 Operating Income 159.5 151.4 214.2 117.7 118.4 121.5 206.6 132.0 Net h1come 83.6 82.0 118.6 60.3 58.1 60.1 115.6 69.3
PSNH
( Operating Revenues $ 284.8 $ 241.9 $ 234.4 $ 211.1 $ 299.8 $ 211.6 $ 223.7 $ 224.4 Operating Income 63.2 54.1 63.6 49.3 64.0 49.0 56.4 60.0 Net Income 32.0 27.9 32.5 22.0 32.6 24.1 28.2 29.0
WMECO Operating Revenues $ 152.9 $ 125.2 $ 125.1 $ 114.9 $ 137.4 $ 108.3 $ 118.1 $ 129.6 Operating Income 28.6 28.9 30.0 28.0 34.7 17.7 31.2 34.0 Net Income 13.2 14.2 15.0 14.1 18.1 7.0 14.7 18.0
JFERC FORM NO.1 (ED. 12-88) Page 123.58

(
Name of Respondent This Report is: Date of Report Year/Period of Report (1) ~An Original (Mo, Da, Yr)
NSTAR Electric Company (2) A Resubmission I I 20151Q4
NOTES TO FINANCIAL STATEMENTS (Continued) .
GLOSSARY OF TERMS
The following is a glossary of abbreviations or acronyms that are found in this report:
Current or former Eversource Energy companies, segments or investments: Eversource, ES or the Company Eversource Energy and subsidiaries Eversource parent orES parent Eversource Energy, a public utility holding company ES parent and other companies ES parent and other companies are comprised ofEversource parent, Eversource Service and other
CL&P NSTAR Electric PSNH WMECO NSTARGas Yankee Gas NPT Eversource Service
NST AR Electric & Gas
CYAPC MYAPC YAEC Yankee Companies Regulated companies
Regulators: DEEP DOE DOER DPU EPA FERC ISO-NE MADEP NHPUC PURA SEC SJC
Other Terms and Abbreviations: AFUDC AOCI ARO C&LM CID Clean Air Project
COz CPSL CTA CWIP
subsidiaries, which primarily includes our unregulated businesses, HWP Company, The Rocky River Real1y Company (a real estate subsidiary), and the consolidated operations of CY APC and Y AEC The Connecticut Light and Power Company NST AR Electric Company Public Service Company of New Hampshire Western Massachusetts Electric Company NST AR Gas Company Yankee Gas Services Company Northern Pass Transmission LLC Eversource Energy Service Company (effective January 1, 2014 includes the operations ofNSTAR Electric & Gas) NSTAR Electric & Gas Corporation, a former Eversource Energy service company (effective January 1, 2014 merged into Eversource Energy Service Company) Connecticut Yankee Atomic Power Company Maine Yankee Atomic Power Company Yankee Atomic Electric Company CY APC, Y AEC and MY APC The Eversource Regulated companies are comprised of the electric distribution and transmission businesses of CL&P, NST AR Electric, PSNH, and WMECO, the natural gas distribution businesses of Yankee Gas and NSTAR Gas, the generation activities ofPSNH and WMECO, and NPT
Connecticut Department of Energy and Environmental Protection U.S. Department of Energy Massachusetts Department of Energy Resources Massachusetts Department of Public Utilities U.S. Environmental Protection Agency Federal Energy Regulatory Commission ISO New England, Inc., the New England Independent System Operator Massachusetts Department of Environmental Protection New Hampshire Public Utilities Commission Connecticut Public Utilities Regulatory Authority U.S. Securities and Exchange Commission Supreme Judicial Court of Massachusetts
Allowance For Funds Used During Construction Accumulated Other Comprehensive Income/(Loss) Asset Retirement Obligation Conservation and Load Management Contract for Differences The construction of a wet flue gas desulphurization system, known as "scrubber technology," to reduce mercury emissions of the Merrimack coal-fired generation station in Bow, New Hampshire Carbon dioxide
l EPS ./ERISA
Capital Projects Scheduling List Competitive Transition Assessment Construction Work in Progress Earnings Per Share Employee Retirement Income Security Act of 1974
!FERC FORM NO.1 (ED. 12-88) Page 123.59

'(
(
Name of Respondent
NSTAR Electric Company
ES 2014 Form 10-K ESOP ESPP FERCALJ Fitch FMCC FTR GAAP GSC GSRP GWh HQ
HVDC Hydro Renewable Energy IPP ISO-NE Tariff kV kVa kW kWh LBR LNG LRS MGP MMBtu Moody's MW MWh NEEWS Northern Pass NOx PAM PBOP PBOPPlan
PCRBs Pension Plan PPA RECs Regulatory ROE
ROE RRB RSUs S&P SBC SCRC SERP SIP SOz
ss TCAM TSA UI
This Report is: Date of Report Year/Period of Report (1) 2S An Original (Mo, Da, Yr) (2) A Resubmission I I 2015104
NOTES TO FINANCIAL STATEMENTS (Continued)
The Eversource Energy and Subsidiaries 2014 combined Annual Report on Fonn 10-K as filed with the SEC Employee Stock Ownership Plan Employee Share Purchase Plan FERC Administrative Law Judge Fitch Ratings Federally Mandated Congestion Charge Financial Transmission Rights Accounting principles generally accepted in.the United States of America Generation Service Charge Greater Springfield Reliability Project Gigawatt-Hours Hydro-Quebec, a corporation wholly owned by the Quebec govenunent, including its divisions that produce, transmit and distribute electricity in Quebec, Canada High voltage direct current Hydro Renewable Energy, Inc., a wholly owned subsidiary of Hydro-Quebec Independent Power Producers ISO-NE PERC Transmission, Markets and Services Tariff Kilovolt Kilovolt-ampere Kilowatt (equal to one thousand watts) Kilowatt-Hours (the basic unit of electricity energy equal to one kilowatt of power supplied for one hour) Lost Base Revenue Liquefied natural gas Supplier of last resort service Manufactured Gas Plant One million British thermal units Moodis Investors Services, Inc. Megawatt Megawatt-Hours New England East-West Solution The high voltage direct current transmission line project from Canada into New Hampsh.ire Nitrogen oxides Pension and PBOP Rate Adjustment Mechanism Postretirement Benefits Other Than Pension Postretirement Benefits Other Than Pension Plan that provides certain retiree benefits, primarily medical, dental and life insurance Pollution Control Revenue Bonds Single uniform noncontributory defmed benefit retirement plan Pension Protection Act Renewable Energy Certificates The average cost of capital method for calculating the return on equity related to the distribution and generation business segment excluding the wholesale transmission segment Return on Equity Rate Reduction Bond or Rate Reduction Certificate Restricted share units Standard & Poor's Financial Services LLC Systems Benefits Charge Stranded Cost Recovery Charge Supplemental Executive Retirement Plans and non-qualified defined benefit retirement plans Simplified Incentive Plan Sulfur dioxide
Standard service Transmission Cost Adjustment Mechanism Transmission Service Agreement The United Illuminating Company
IFERC FORM N0.1 (ED.12-88) Page 123.60

BlANK PAGE
(

Name of Respondent This Report Is: Date of Report Year/Period of Report
NSTAR Electric Company (1) ~KJAn Original (Mo, Da, Yr)
End of 2015104 (2) OA Resubmission I I
STATEMENTS OF ACCUMUlATED COMPREHENSIVE INCOME, COMPREHENSIVE INCOME, AND HEDGING ACTIVITIES
1. Report in columns (b),(c),(d) and (e) the amounts of accumulated other comprehensive income items, on a net-of-tax basis, where appropriate. 2. Report in columns (f) and (g) the amounts.of other categories of other cash flow hedges. 3. For each category of hedges that have been accounted for as "fair value hedges", report the accounts affected and the related amounts in a footnote. 4. Report data on a year-to-date basis.
•'
Line Item Unrealized Gains and Minimum Pension Foreign Currency Other
Losses on Available- Liability adjustment Hedges Adjustments ' No.
for-Sale Securities (net amount)
(a) (b) (c) (d) (e)
1 Balance of Account 219 at Beginning of
Preceding Year
2 Preceding Qtr/Yr to Date Reclassifications
from Acct 219 to Net Income
3 Preceding Quarter/Year to Date Changes in
Fair Value 441,923
4 Total (lines 2 and 3) 441,923
5 Balance of Account 219 at End of
Preceding Quarter/Year 441,923
6 Balance of Account 219 at Beginning of
Current Year 441,923
7 Current Qtr/Yr to Date Reclassifications
from Acct 219 to Net Income
8 Current Quarter/Year to Date Changes in
Fair Value 103,337
9 Total (lines 7 and 8) 103,337
10 Balance of Account 219 at End of Current
Quarter/Year 545,260
(
FERC FORM NO. 1 (NEW 06·02) Page 122a

i
j
(
NSTAR Electric Company
No.
Other Cash Flow Hedges
Interest Rate Swaps
· FERC FORM NO. 1 (NEW 06-02)
Other Cash Flow Hedges [Specify]
for each category of items
recorded in Account 219
Page 122b
·-- -·. ·-r-·· (Mo: oa: vrf -I I
End of 20151Q4
Net Income (Carried Forward from
Page 117, Line 78) Comprehensive
Income

(
l/
End of 2015/04
Column (c) the amount for electric function, in column (d) the amount for gas function, in column (e), (f), and {g) report other (specify) and in (h) common function.
Classification
(a)
FERC FORM NO.1 (ED.12-89) Page 200
Current Year/Quarter Ended
(b)
Electric
(c)

NSTAR Electric Company
Gas
(
FERC FORM NO.1 (ED. "12-89) Page 201
(Mo, Da, Yr) I I
End of
Common
2015104

(
Name of Respondent
NSTAR Electric Company
!Schedule Page: 200 General Plant Intangible
Line No.: 21 Column: c 6,516,101
12,981,854
19,497,955
Information on Formula Rates:
This Report is: (1) ~An Original (2) A Resubmission
FOOTNOTE DATA
Page 106 lines 10, 13 Depreciation related to station specific fixed assets.
I FERC FORM NO. 1 (ED. 12-87) Page 450.1
Date of Report Year/Period of Report (Mo, Da, Yr)
I I 2015104

(
BLANK PAGE
. (

i I (, I I
I I ' l I I ~~
I 1
j j
(
End of 2015/04
Report below the original cost of electric plant in se!Vice according to the prescribed accounts. In addition to Account 101, Electric Plant.in Service (Classified), this page and the next include Account 102, Electric Plant Purchased or Sold;
103, Experimental Electric Plant Unclassified; and Account 106, Completed Construction Not Classified-Electric. Include in column (c) or (d), as appropriate, corrections of additions and retirements for the current or preceding year.
For revisions to the amount of initial asset retirement costs capitalized, included by primary plant account, increases in column (c) additions and 1 in column (e) adjustments.
Enclose in parentheses credit adjustments of plant accounts to indicate the negative effect of such accounts.
Classify Account 106 according to prescribed accounts, on an estimated basis if necessary, and include the entries in column (c). Also to be included 1 column (c) are entries for reversals of tentative distributions of prior year reported in column {b). Likewise, if the respondent has a significant amount
retirements which have not been classified to primary accounts at the end of the year, include in column (d) a tentative distribution of such " on· an estimated basis, with appropriate contra entry to the account for accumulated depreciation provision. Include also in column (d)
FERC FORM NO.1 (REV. 12-05) Page 204

(
(
(1) ! An Original (2) A Resubmission NSTAR Electric Company
: PlA "IN (Account 10' 102,
(Mo, Da, Yr) I I
l3 and 106) I End of 2015IQ4
distributions of these tentative classifications in columns (c) and (d), including the reversals of the prior years tentative account distributions of these amounts. Careful observance of the above instructions and the texts of Accounts 101 and 106 will avoid serious omissions of the reported amount of respondent's plant actually in service at end of year. 7. Show in column (f) reclassifications or transfers within utility plant accounts. Include also in column (f) the additions or reductions of primary account
!;:~~~~~::~:'~arising from distribution of amounts initially recorded in Account 102, include in column (e) the amounts with respect to accumulated
for depreciation, acquisition adjustments, etc., and show in column (f) only the offset to the debits or credits distributed in column (f) to primary classifications.
B. For Account 399, state the nature and use of plant included in this account and if substantial in amount submit a supplementary statement showing subaccount classification of such plant conforming to the requirement of these pages. 9. For each amount compri.sing the reported balance and changes in Account 102, state the property purchased or sold, name of vendor or purchase,
land date of transaction. If i journal entries have been filed with the Commission as required by the Uniform System r>f · , give also date
L~:e1
2 . 3
FERC FORM NO. 1 (REV. '12-05) Page 205
9
10 11 12 13 14 15
19 20 21
23 24 25 26
28 29 30 31
33 . 34
38 39 40 41
_42 43
45 46

(
FERC FORM ~10. 1 (REV. 12-05) Page 206

(
i (
l/
NSTAR Electric Company
1' 688,52C 857,743 213,042
545, 12< 12,794
I (1) ~An Original (2) OAR•
ELECTRIC PLANT IN I (Mo, Da, Yr)
I I
1101, 102, 103 and 106)
-20~
/ End of
. ' 37,376,041
'.826
2015104
50 51 52
53 54
-55 36,037,528 56
·57
~~2ill8:~~~~~~~~~~~~~~~::::~; d+-· ---+---';"'-!
···:· ····•···
6,196,007 21,529
13,647,21:
1.474.410
34,711,461
.:" :·.:•.•.::
48.057 48,956 12,447 15,677 15,662 6,344
26,45] 7,669
181,269
181.2691
FERC FORM NO. 'I (REV. 12-05)
, .... · .. ·•>· ·:.:·:c::·
112,914
.
112,914
112,91• 135,394
Page
183,664 -1.953
-86.851
-163
''!' . • ••.. ".': . .• 'I' ·:• : y :.:
207
647,854,763 ,·
· ... · >:•T 239 11
,, ,-,
198,261,069
21,762,120
',.,. ,. ;·_.,
7. 1?? '7
523,11: 7.275.657
153.627
2,193,558 197.
63 64 65 66
67 68
7z 73
74 75 76
77 78
80 81 82 83
84 85 86 87 88
89 90 91
93 94 95 96 97 98
~ 100
101 102 103 104

Name of Respondent This Report is: Date of Report Year/Period of Report (1) ~An Original (Mo, Da, Yr)
NSTAR Electric Company (2) A Resubmission I I I 2015104
FOOTNOTE DATA
!Schedule Page: 204 Line No.: 5 Column: g Information on Formula Rates Page 106 lines 10, 13: Investment base related to station s ecific fixed assetS.
chedu/e Page: 204 Line No.: 49 Column: b Information on Formula Rates Page 106.2 line 5: Investment base related to station specific fixed assets.
/Schedule Page: 204 Line No.: 49 Column: g Information on Formula Rates Page 106.2 line 5: Investment base related to station specific fixed assets.
/Schedule Page: 204 Line No.: 50 Column: b Information on Formula Rates Page 106.2 line 5: Investment base related to station specific fixed assets.
/Schedule Page: 204 Line No.: 50 Column: g Information on Formula Rates Page 106.2 line 5: Investment base related to station specific fixed assets.
/Schedule Page: 204 Line No.: 58 Column: b Localized transmission plant at the beginning of the year is $27,016,117.
Information on Formula Rates Page 106 line 23: Investment base related to station specific fixed assets.
Information on Formula Rates Page 106 line 26:
( Investment base as stipulated by contract.
/Schedule Page: 204 Line No.: 58 Column:g Localized transmission plant at the end of the year is $28,961,117.
Information on Formula Rates Page 106 line 23: Investment base related to station specific fixed assets.
Information on Formula Rates Page 106 line 26: Investment base as stipulated by contract. /Schedule Page: 204 Line No.: 61 Column: b Information on Formula Rates Page 106.2 line 5: Investment base related to station specific fixed assets.
/Schedule Page: 204 Line No.: 61 Column: g Information on Formula Rates Page 106.2 line 5: Investment base related to station specific fixed assets.
/Schedule Page: 204 Line No.: 62 Column: b Information on Form~la Rates Page 106.2 line 5: Investment base related to station specific fixed assets.
/Schedule Page: 204 Line No.: 62 Column: g Information on Formpla Rates Page 106.2 line 5: Investment base related to station specific fixed assets.
/Schedule Page: 204 Line No.: 66 Column: b Information on Formula Rates Page 106.2 line 5:
JFERC FORM NO. ·1 (ED.12-87) Page 450.1

k-
1 l l I
i ' l I 1 l I
J 'I l 1 l l ' 1
l 1
·;;
I 1
,I I
J
j ' 1
.-j '.l
:l
;1 '
! '· I
(
Name of Respondent This Report is: Date of Report Year/Period of Report (1) ,21: An Original (Mo, Da, Yr)
NSTAR Electric Company (2) A Resubmission I I 2015/04
FOOTNOTE DATA
Investment base related to station specific fixed asse-ts.
rschedule Page: 204 Line No.: 66 Column: g Information on Formula Rates Page 106.2 line 5: Investment base related to station specific fixed assets.
!Schedule Page: 204 Line No.: 67 Column: b Information on Formula Rates Page 106.2 line 5: Investment base related to station specific fixed assets.
!Schedule Page: 204 Line No.: 67 Column: g Information on Formula Rates Page 106.2 line 5: Investment base related to station specific fixed assets.
!Schedule Page: 204 Line No.: 75 Column: b Information on Formula Rates Page 106 lines 10,13,16,19,23: Investment base related to station specific fixed assets. JSchedule Page: 204 Line No.: 75 Column: g Information on Formula Rates Page 106 lines 10,13,16,19,23: Investment base related to station specific fixed assets. !Schedule Page: 204 Line No.: 99 Column: b Information on Formula Rates Page 106 lines 10,13,16,19,23: Investment base related to station s ecific fixed assets. Schedule Page: 204 Line No.: 99 Column:
At the end of the year, there is $58,732 in General Plant Account 390, relating to rebranding.
Information on Formula Rates Page 106 lines 10,13,16,19,23: Investment base related to station specific fixed assets. !Schedule Page: 204 Line No.: 100 Column: g Information on Formula Rates:
Page 106 lines 30 Amount stipulated per contract.
Page 106.2 lines 1,5 Amount stipulated per contract.
Page 106 lines 35 Amount stipulated per contract and station specific fixed assets.
Page 106.1 lines 1,8,15,20,27,34 Amount stipulated per contract and station specific fixed assets.
!Schedule Page: 204 Line No.: 104 Column: b Information on Formula Rates Page 106.2 line 5: Investment base related to station specific fixed assets.
~chedule Page: 204 Line No.: 104 Column: e Transfer Utility Plant In-service a/c 101 from NSTAR Gas Plant In-service a/c 101 Transfer Utility Plant In-service a/c 101 from NSTAR Gas Plant In-service a/c 101
!Schedule Page: 204 Line No.: 104 Column: g Information on Formula Rates Page 106.2 line 5:
IFERC FORM N0.1 (ED.12-87) Page 450.2
22,480 112,914
135,394

Name of Respondent This Report is: Date of Report Year/Period of Report (1) ~An Original (Mo, Da, Yr)
NSTAR Electric Company (2) A Resubmission I I 2015104
FOOTNOTE DATA
Investment base related to station specific fixed assets.
' ·-'1
; !
(
I FERC FORM NO. 1 (ED. 12-87) Page 450.3

NSTAR Electric Company I t IJ F:;"R ungma1 I llVIO, U8, HJ l End of 20151Q4 (2) i I I
ELEGTR_!l' PLAN. HELD FOR FUTUKE UoE : 105)
1. Report separately each property held for future use at end of the year having an original cost of $250,000 or more. Group other items of property held for future use. 2. For property having an original cost of $250,000 or more previously used in utility operations, now held for future use, give ill column (a), in addition to other required information, the date that utility ~s~ of such property was discontinued, and the date the original cost was transferred to Account 105.
"
'fi~e Of pf~f~,ly"catlon •
ILandandRights:. , ... . . ... . .. .. · ._,.. . ... ,._ 1
Boston- Taber and Harrison Avenue 1987 2016 10,226 " 4 Norfolk - Dean Street 2020 8,475
I Natick - Mill Street 1987 2019 60,794
6 1- I i 1 Station 2008 2019 1"""'_' ' fJ Parcel F-8-B South Boston- 2009 2018 591,505
81300-316 North Beacon Street, Brighton 2010 2016 1,521,764
~ t Street-, 1 2015 2022
10 Seafood Way- South Boston 2012 2016 862,801
11
12
13 i
14 I 1 rights of way 108,660
15 1- [ i "•th Station 2008 2023 4o?,Rno
1E 1-0 i r Road 2015 2021 644,538
17 Parcel F-8-B South Boston - . 2009 2018 1B2o169
. 18 Seafood Way - South Boston 2012 2016
19 t-. 2015 2022 1 0,0 '"" 20 Boston - Hyde Park : 2014 2020 1~148
21 I Other -22
23
( 24
21
2e
27
28
29
30
31
32
33
34
35
36
37
3E
3~
40
41
42
43
_44
45
46 .·
' \ 47 Total i" 23,133,127
'-·
FERC: FORM NO.1 (ED. 12-96) Page 214

·NameorRSsponde-nr This Report Is: Date of Report Year/Period of Report
NSTAR Electric Company (1) 1!1An Original (Mo, Da, Yr) End of 2015104 (2) 0 A Resubmlssion I I
CONSTRUCTION WORK IN PROGRESS-- ELECTRIC (Account 107)
1. Report below descriptions and balances at end of year of projects in process of construction (1 07) 2. Show items relating to "research, development, and demonstration" projects last, un<;ter a caption Research, Development, and Demonstrating (see Account 107 of the Uniform System of Accounts) 3. Minor projects (5% of the Balance End of the Year for Account 107 or $1,000,000, whichever is less) may be grouped.
Line Description of Project Construction work in progress -No. Electric (Account 1 07)
(a) (b)
1 DISTRIBUTION PLANT
2 '
3 BOSTON NETWORK STAS FIRE PROTECTION 1,288,419
4 CAM 181 MASS AVE, NOVARITS BIOMEDIC 2,234,372
5 INSTALL LINE 850- NORTH POINT BOULEVARD 1,006,580
6 DISTRIBUTION VEGETATION 2,518,199
7 DOE SELF HEALING PROGRAM (STREED 1,014,933
a DOUBLE WING LANE STA 624 2,366,691
9 EAST BOSTON STA 131 . 1,639,560
10 ELECTRIC AVE D STREET 1,409,125
11 ELECTRIC AVE DIST STA 16,976,731
12 FRAMINGHAM CENTER CIVIL STRUCTURES 3,338,599
13 HYANNIS JUNCTION STA 961 6,621,608
14 KENDALL STATION #850 UPGRADES 3,930,327
15 LONG LEAD TIME DIST MATERIALS 2011 5,161,182
16 NETWORK TRANSFORMERS 1,321,116
17 NORTH DA COMMUNICATIONS (REPEATERS) 1,142,562
18 PUTNAM RD CHILMARK URD REBUILD 1,510,897
19 REPLACE 25KV OIL BREAKERS STA 110 1,942,649
( 20 REPLACE 4KV CIRCUIT BREAKERS 1,740,967
21 SEAFOOD WAY DIST STATION 14,965,461
22 SOUTH END STA 318 UPGRADE STA WORK 3,829,491
23 STA 24 REPLACE TRANSFORMER 14G 1,809,608
24 UPGRADE MASHPEE SUBSTATION 946 1,900,297
25 INDIVIDUAL PROJECTS UNDER $1,000,000 73,510,225
26 SUBTOTAL DISTRIBUTION PROJECTS $153,179,599
27
28 TRANSMISSION PLANT
29
30 115KV CABLE WOBURN MYSTIC 1,872,276
31 3RD 115KV LINE HOLBROOK- WALPOLE 3,074,033
32 ACUSHNET TO PINE ST UPGRADE 1,368,999
33 BELMONT 115/14KV STATION 9,293,132
34 CARVER ST STA 71115 GIS BREAKERS 7,107,247
35 EAST BOSTON STA 131 1,523,414
36 ELECTRIC AVE TRANSMISSION STA 315 28,292,966
37 KSTTO DAY BLVD 115KV PTC 21,399,383
38 LELAND ST SUBSTATION BPS 1,004,034
39 LONG LEAD TIME MATERIALS- TRANS 1,642,097 <
40 MASHPEE 4 BREAKER RING 4,083,262
41 MEDWAY STA 65 (BPS) 3,105,441 '
42 MID CAPE 115 LINE 1,597,673
43 TOTAL 310,452,811
FERC FORM N0.1 (ED.12-87) Page 216

NSTAR Electric Company ll"' I ~An u~1gmaJ I (lVlo, ua, Yr) I End of 2015104 (2) OA Resubmission I I
CONSTRUCTION WORK IN PROGRESS-- ELELTRIC (Account 107)
1. Report below descriptions and balances at end of year of projects in process of construction (1 07) 2. Show items relating to "research, development, and demonstration" projects last, under a caption Research, Development, and Demonstrating {see Account 107 of the Uniform System of Accounts) 3. Minor projects (5% of the Balance End of the Year for Account 107 or $1,000,000, whichever is less) may be grouped.
( Line Description of Project Construction work in progress ~
,, No. Electric (Account 1 07) (a) (b)
1 NEW CONTROL HOUSE- BRIGHTON STATION 6,564,075
2 NEW CONTROL HOUSE- W MEDWAY #446 4,780,332
3 NEW CONTROL HOUSES K STREET STATION 4,894,594
4 NORTHERN AVE TRANSM FOR STATION 13,245,626
5 ORLEANS - WELLFLEET 115 LINE #2 1,137,178
6 PINE ST TRANSMISSION REACTOR 2,009,353
7 RELOCATION STRUCTURES LINE 488-518 1,075,601
8 STOP JOINT INSTALLATION STA 71 3,086,338
9 WALTHAM STA 282 RECONFIGURATION 3,397,954
10 WOBURN TO WAKEFIELD 345KV UG T LINE 3,277,149
11 INDIVIDUAL PROJECTS UNDER'$1,000,000 8,899,728
12 SUBTOTAL TRANSMISSION PROJECTS $137,731,885
13
14 INTANGIBLE PLANT
15
16 DOE SELF HEALING PROGRAM (SOFTWARE) 2,282,905
17 EBILL SOFTWARE UPGRADE FOR SUPPORTABLE APPLICATION 1,236,312
18 INDIVIDUAL PROJECTS UNDER $1,000,000 1,309,979
19 SUBTOTAL INTANGIBLE PROJECTS $4,829,196
20
( 21 GENERAL PLANT
22
23 NSTAR VOICE OVER IP 7,188,555
24 PURCHASE FLEET VEHICLES 3,304,597
25 INDIVIDUAL PROJECTS UNDER $1,000,000 . 4,218,979
26 SUBTOTAL GENERAL PROJECTS $14,712,131
27
28
29
30
31
32
33
34
35
36
37
38
39
40
41
42
43 TOTAL 310,452,811
F[ORC FORM NO.1 (ED. 12-87) Page 216,'/

(
End of 2015104
Explain in a footnote any important adjustments during year. Explain in a footnote any difference between the amount for book cost of plant retired, Line 11, column (c), and that reported for
jel<,ctr·ic plant in service, pages 204-207, column 9d), excluding retirements of non-depreciable property. The provisions of Account 108 in the Uniform System of accounts require that retirements of depreciable plant be recorded when
plant is removed from service. If the respondent has a significant amount of plant retired at year end which has not been recorded classified to the various reserve functional classifications, make preliminary closing entries to tentatively functionalize the boo/<
cost of the plant retired. In addition, include all costs included in retirement work in progress at year end in the appropriate functional classifications.
Show separately interest credits under a sinking fund or similar method of depreciation accounting.
FERC FORM NO. 1 (REV. 12-05) Page 219

(
(
Name of Respondent This Report is: Date of Report Year/Period of Report
NSTAR Electric Company
/Schedule Page: 219 Line No.: 12 Column: c
BOOK COST OF PLANT RETIRED
Retirements from Reserves Retirements or Sales of Land
Mise Reserve Retirements
Retirements from Account 404000
Total Retirements (ties to page 207)
/Schedule Page: 219 Line No.: 16 Column: c
OTHER DEBIT OR (CREDIT) ITEMS
Journal Entries Transfers and Adjustments
ARO Activity
Total Other Debit or Cr. Items
/schedule Page: 219 Line No.: 19 Information on Formula Rates:
Column: b
(1) 6 An Original (2) A Resubmission
FOOTNOTE DATA
38,766,602
10,529 544,924
39,322,055
3,447,962
8 123,387
3,571,357
Page 106.2 line 1 Depreciation amount stipulated by contract.
/Schedule Page: 219 Line No.: 25 Column: b Information on Formula Rates:
Page 106 line 23 Depreciation amount stipulated by contract.
/Schedule Page: 219 Line No.: 26 Column: b Information on Formula Rates:
(Mo, Da, Yr) I I 2015104
Page 106 lines 10,13,23 Depreciation related to station specific fixed assets.
Page 106.2 line 1 Depreciation ampunt stiPulated by ·co.ntract.
/Schedule Page: 219 Line No.: 28 Column: b Information on Formula Rates:
Page 106 l~nes 10,13,23 Depreciation related to station specific fixed assets.
Page 106.2 line 1 Depreciation amount stipulated by contract.
/Schedule Page: 219 Line No.: 28 Column: c
The cost associated with the rebranding in 108010 Accumulated Depreciation for Transmission is $214.12
The cost associated with the rebranding in 108030 Cost of Removal for Transmission is $6,460.20
/FERC FORM N0.1 (ED.12-87) Page 450.1

Name of Respondent This ~ort Is: Date of Re~ort Year/Period of Report
NSTAR Electric Company (1) An Original (Mo, Da, Yr)
End of 2015104 (2) 0 A Resubmission I I
INVESTMENTS IN SUBSIDIARY COMPANIES (Account 123.1)
1. Report below investments in Accounts 123.1, investments in Subsidiary Companies. 2. Provide a subheading for each company and List there under the information called for below. Sub- TOTAL by company and give a TOTAL in columns (e).(n,(g) and (h) (a) Investment in Securities- List and describe each security owned. For bonds give also principal amount, date of issue, maturity and interest rate. (b) Investment Advances- Report separately the amounts of loans or investment advances which are subject to repayment, but which are not subject to current settlement. With respect to each advance show whether the advance is a note or open account. List each note giving date of issuance, maiUJity date, and specifying whether note is a renewal. 3. Report separately the equity in undistributed subsidiary earnings since acquisition. The TOTAL in column (e) should equal the amount entered for Account 418.1.
Line Description of Investment Date Acquired Date Of Amount of Investment at No. (a) (b)
Maturity Beginning of Year (c) (d)
1 Connecticut Yankee Atomic Power Company
2 Common Stock 146,421
3 Equity and Dividends 77,800
4 Subtotal 224,221
5
6 Maine Yankee Atomic Power Company
7 Common Stock 77,318
8 Equity and Dividends . 19;911
9 Subtotal 97,229
10 Yankee Atomic Electric Company (Massachusetts)
11 Common Stock 95,211
12 Equity and Dividends 117,491
13 Subtotal 212,702
14
15 Harbor Electric Energy Company
16 Common Stock 1,000
17 Capital Contribution 2,100,000
( 18 Undistributed subsidiary earnings 3,677,905
19 Subtotal 5,778,905
20
21 New England Hydro-Transmission Electric Company .
22 Common Stock 68,719
23 Capital Contribution 903,470
24 Undistributed subsidiary earnings 577,106
25 Subtotal 1,549,295
26 ·' 27 New England Hydro-Transmission Corporation
28 Common Stock 1,446
29 Capital Contribution 521,105
30 Undistributed subsidiary earnings 322,990
31 Subtotal 845,541
32
33
34
35
36
37
38
39
40
41
42 Total Cost of Account 123.1 $ Ol TOTAL 8,707,893
FERC FORM NO.1 (EO. 12-89) Page 224

NSTAR Electric Company I (1) I!] An Original I (Mo, Da, Yr) I 2015104 (2) OA Resubmission I I End of
INVESTMENTS IN SUBSIDIARY COMPANIES (Account 123.1) (Continued)
4. For any securities, r'lotes, or accounts that were pledged designate such securities, notes, or accounts in a footnote, and state the name of pledgee and purpose of the pledge. 5. If Commission approval was required for any advanCe made or security acquired, designate such fact in a footnote and give name of Commission, date of authorization, and case or docket number. 6. Report column (f) interest and dividend revenues form investments, including such revenues for~ securities disposed of during the year. 7. In column (h) report for each investment disposed of during the year, the gain or foss represented by the difference between cost of the investment (or
" the other amount at which carried in the books of account if difference from cost) and the selling price thereof, not including interest adjustment includible in column (f). 8. Report on Line 42, column (a) the TOTAL cost of Account 123.1
Equity in Subsidiary Revenues ror Year Amount of Investment at Gain or Loss from Investment Line Earnin~s of Year End of.Year Dispflfrd of e) (fj (g) No.
1
146,421 2
9,486 87,286 3
9,486 233,707 4
5 . 6
77,318 7
4,824 24,735 8
4,824 102,053 9
10
95,211 11
-3,806 113,685 12
-3,806 208,896 13
14
15
1,000 16
2,100,000 17
429,883 4,107,788 18
( 429,883 6,208,788 19
20
21
68,719 22
903,470 23
375,482 952,588 24
375,482 1,924,777 25
26
27
1,446 28
521,105 29
-42,571 280,419 30
-42,571 802,970 31
32
33
34
35
36
37
38
39
40
41
773,298 9,481 '191 42
FERC FORM ND. 1 (ED. 12-89) Page 225

Name of Respondent This 0ort Is: Date of Report Year/Period of Report
NSTAR Electric Company (1) An Original (Mo, Da, Yr)
2015104 (2) 0 A Resubmission I I End of
MATERIALS AND SUPPLIES
1. For Account 154, report the amount of plant materials and operating supplies under the primary functional classifications as indicated in column (a);
estimates of amounts by function are acceptable. In column (d), designate the department or departments which use the class of material.
(' 2. Give an explanation of important inventory adjustments during the year (in a footnote) showing general classes of material and supplies and the
various accounts (operating expenses, clearing accounts, plant, etc.) affected debited or credited. Show separately debit or credits to stores expense
clearing, if applicable. . Line Account Balance Balance Department or No. Beginning of Year End of Year Departments which
(a) (b) (c) Use Material
(d) "
1 Fuel Stock (Account 151)
2 Fuel Stock Expenses Undistributed (Account 152)
3 Residuals and Extracted Products· (Account 153)
4 Plant Materials and Operating Supplies (Account 154) .
5 Assigned to - Construction (Estimated) 44,268,118 ··.·· .. ··· .·· .·· ~§:,'~2g·;~~Q~ * Electric
6 Assigned io- Operations and Maintenance
7 Production Plant (Estimated)
8 Transmission Plant (Estimated) 781,909 222,591 ..
9 Distribution Plant (Estimated) 10,004,430 6,555,409 Electric
10 Regional Transmission and Market Operation Plant
(Estimated)
11 Assigned to- Other (provide details in footnote)
12 TOTAL Account 154 {Enter Total of Jines 5 thru 11) 55,054,457 36,398,906
13 Merchandise (Account 155)
14 Other Materials and Supplies (Account 156) .
15 Nuclear Materials Held for Sale (Account 157) (Not
applic to Gas Uti!)
16 Stores Expense Undistributed {Account 163) 5,349
17
18
19
20 TOTAL Materials and Supplies (Per Balance Sheet) 55,054,457 36,404,255
FERC FORM NO.1 (REV. 12-05) Page 227

(
Name of Respondent This Report is: (1) 6 An Original
NSTAR Electric Company (2) A Resubmission
FOOTNOTE DATA
!Schedule Page: 227 Line No.: 5 Column: c Transmission related construction (estimated) Distribution related construction (estimated) Total (estimated)
$ 8,071,715 21,549,191
$29,620,906
I FERC FORM NO. 1 (ED. 12-87) Page 450.1
Date of Report Year/Period of Report (Mo, Da, Yr)
I I 2015104

(
Report below the particulars (details) called for concerning allowances. Report all acquisitions of allowances at cost.
End of 2015/04
Report allowances in accordance with a weighted average cost allocation method and other accounting as prescribed by General Instruction No. 21 in the Uniform System of Accounts. 4. Report the allowances transactions by the period they are first eligible for use: the current year's allowances in columns (b)-(c)," allowances for the three succeeding years in columns (d)-(i), starting with the following year, and allowances for the remaining succeeding years in columns 0)-(k). 5. Report on line 4 the Environmental Protection Agency (EPA) issued allowances. Report withheld portions Lines 36-40.
Line No.
S02 Allowances Inventory (Account 158.1)
FERC FORM NO. 1 (ED. 12-95) Page 228a

(
NSTAR Electric Company End of 2015/04
6. Report on Lines 5 allowances by the EPA. Report on Line 39 the EPA's sales of the wtthheld allowances. Report on Lines 43-46 the net sales proceeds and gains/losses resulting from the EPA's sale or auction of the withheld allowances. 7. Report on Lines 8-14 the names of vendors/transferors of allowances acquire and identify associated compan_ies (See "associated comparly" under "Definitions" in the Uniform System of Accounts). 8. Report on Lines 22 - 27 the name of purchasers/ transferees of allowances disposed of an identify associated companies.
Report the net costs and benefits of hedging transactions on a separate line under purchases/transfers and sales/transfers. 10. Report on Lines 32-35 and 43-46 the net sales proceeds and gains or losses from allowance sales.
FERC FORM N0.1 (ED. 12-95) Page 229a

(
NSTAR Electric Company ................. '''"'!""''• (Mo, Da, Yr) I I
I <:=QIII "-''''-''"" "'' ''"'!""~''
End of 2015104
1. Report below the particulars (details) called for concerning allowances. 2. Report all acquisitions of allowances at cost. 3. Report allowances in accordance with a weighted average cost allocation method ai"Jd other accounting as prescribed by General Instruction No. 21 in the Uniform System of Accounts. 4. Report the allowances transactions by the period they are first eligible for use: the current year's allowances in columns (b)-( c), allowances for the three succeeding years in columns (d)-(i), starting with the following year, and allowances for the remaining succeeding years in columns Q)-(k). 5. Report on line 4 the Environmental Protection Agency (EPA) issued allowances. Report withheld portions Lines 36-40.
I
FERC FORM N0.1 (ED. 12-95) Page 228b

(
(
NSTAR Electric Company {IVJO, Ua, Yr)
I I End of 2015104
Report on Lines 5 allowances returned by the EPA. Report on Line 39 the EPA's sales of the withheld allowances. Report on Lines 43-46 the net sales proceeds and gains/losses resulting from the EPA's sale or auction of the withheld allowances. 7. Report on Lines 8-14 the names of vendors/transferors of allowances acquire and identify associated companies (See "associated company" under "Definitions" in the Uniform System of Accounts). 8. Report on Lines 22- 27 the name of purchasers/ transferees of allowances disposed of an identify associated companies. 9. Report the net costs and benefits of hedging transactions on a separate line under purchases/transfers and sales/transfers. 10. Report on Lines 32-35 and 43-46 the net sales proceeds and gains or losses from allowance sales.
FERC FORM NO.1 (ED. 12-95) Page 229b

(
Name of Respondent This Report is: Date of Report Year/Period of Report (1) 2S An Original (Mo, Da, Yr)
NSTAR Electric Company (2) A Resubmission I I 2015104
FOOTNOTE DATA
!Schedule Page: 229 Line No.: 10 Column: c Represents the value of Renewable Energy Certificates· (RECs} that NSTAR Electric uses to meet the Commonwealth of Massachusetts' Renewabl.e Portfolio Standards requirements. These RECs are recorded in Account 158.3.
IFERC FORM N0.1 (ED.12-87) Page 450.1
Company

' \
NSTAR Electric Company <1Jf29 An Original (2) 0 A Resubmission
(Mo, Da, Yrf I I
Transmission Service and Generation Interconnection Study Costs
End of 2015104
1. Report the particulars (details) ca!Jed for concerning the costs incurred and the reimbursements received for performing transmission service and generator interconnection studies. · 2: List each study separately. 3. In column (a) provide the name of the study. 4. In column (b) report the cost incurred to perform the study at the end of period. 5. In column (c) report the account charged with the cost of the study. 6. In column (d) report the amounts received for reimbursement of the study costs at end of period. 7. In column (e) report the account credited with the reimbursement received for performing the study. Lme No. Description
(a)
Costs Incurred During Period
(b) Account Charged
(c)
Reim ursements Received During
the Period (d)
Account Credited With Reimbursement
(e)
Transmission Studies ,:•' "'I~ '" ~t ''I ---,---,--. ,-,-,-.--.-, -------------,-.,-\
2 Amtrak- 7,660 186 7,660 186
3 Canal 6,399 186 56,399 186
4 Cape Wind 14,800 186 186
5 Medway Peaker 3,242 186 50,844 186
6
7
8
9
10
11
12
13
14
15
16
17
18
19
20
21 Generation Studies ~--.-------.-----------------, 1/Ll:;,.(;: •:!;'; L. );:;-:.: .. ·:: ,_;_,;::/:-:·,,' tl
22
23 None
24
25
26
27
28
29
30
31
32
33
34
35
36
37
38
39
40
FERC FORM NO. ·IJH/3·0 (NEW. 03·07) Page 23'1

Name of Respondent This ~art Is: Date of Report Year/Period of Report '
NSTAR Electric Company (1) An Original (Mo, Da, Yr) End of 2015104 (2) EJA Resubmission I I
OTHER REGUlATORY ASSETS (Account 182.3)
1. Report below the particulars (details) called for conc~rning other regulatory assets; including rate order docket number, if applicable. 2. Minor items (5% of the Balance in Account 182.3 at end of period, or amounts less than $100,000 which ever is less), may be grouped by classes. 3. For Regulatory Assets being amortized, show period of amortization.
Line Description and Purpose of Balance at Beginning Debits CREDITS Balance at end of No. Other Regu!~tory Assets of Current Written off During the Written off During Current Quarter/Year
Quarter/Year Quarter Near Account the Period Amount
(a) (b) (c) Cha~ad (d) (e) (ry '
1 Northeast Energy Associates Contract Buyout
2 On 1f7/05, the MDPU issued Docket No. 04·85
3 approving the restructured contract with
4 Northeast Energy Associates, LP. An eleven
5 year and nine month amortization and recovery
6 period began in 2005. 38,599,541 1,928,681 557 30,599,985 9,928,237
7
8 Fuel litigation costs 158,678 158,678
9
10 Connecticut Yankee Shutdown Costs:
11 On 12!4/96, the Board decided to cease
12 operations at the nuclear power plant. This
13 is NSTAR Electric's share (14%) of estimated
14 costs to decommission ihe plant. 760,000 557 225,000 535,000
15
16 Massachusetts Yankee Shutdown Costs:
17 On 2126192, the Board decided to cease
18 operations at the nuclear power plant. This
( 19 is NSTAR Electric's share (14%) of estimated .
20 costs to decommission the plant. 10,000 10,000
21
22 Maine Yankee Shutdown Costs:
23 On 8/6/97, the Board decided to cease
24 operations at ihe nuclear power plant This
25 is NSTAR Electric's share (4%) ofihe
26 estimatcid costs to decommission the plant 4,892,000 557 768,000 4,124,000
. 27
28 Income tax regulatory liability (ASC 740)
29 (elements amortized over various periods) 87,768,732 3,771,557 283 2,470,468 89,069,821
30
31 Asset Retirement Obligation (ASC 410) 32,638,563 1,910,932 230 4,912,759 29,636,736
32
33 NSTAR Goodwill-40 year amortization 433,887,584 407.3 17,590,044 416,297,540
34 (MOPU 99-19)
35
36 Pension and PBOP:
37 On 10/31103, the MDPU issued Doc!<et No.
38 03.47 ·A, which requires the Company to defer
39 pension and PBOP expense that exceeds the
40 curent rate recovery. Each year's deferred
41 amount is amortized over the subsequent three
42 year period 20,278,651 36,6so,s6sjOOtr1bie ·: 38,323,448 18,646,172
43
FERC FORM NO. 113-Q (REV. 02-04) Page 232

Name of Respondent This Report Is: Date of Report Year/Period of Report
NSTAR Electric Company (1) j2gAn Original (Mo, Da, Yr) End of 2015104 (2) 0 A Resubmission I I
OTHER REGULATORY ASSETS (Account 182.3)
1. Report below the particulars (details) called for conc~rning other regulatory assets, including rate order docket number, if applicable. 2. Minor items (5% of the Balance in Account 182.3 at end of period, or amounts less than $100,000 which ever is less), may be grouped
( by classes. 3. For Regulatory Assets being amortized, show period of amortization.
Line Description and Purpose of Balance at Beginning Debits CREDITS Balance at end of • No. Other Regulatory Assets of Current Written off During the Written off During Current Quarter/Year
Quarter/Year Quarter Near Account the Period Amount
(a) (b) (c) Charged (d) (e) (fj
1 Prepaid Pension 329,940,761 5,000,00 0 182.3/228 20,828,614 314,112,147
2
3 Pension and PBOP (ASC 715) 186,038,232 53,888,902 9261228 74,076,180 165,850,954
4
5 Circuit Performance Incentive {MDPU 05-85) - 1,400,000 456 1,006,517 393,483
6
7 In accordance with MDPU 96-23, MDPU 06-40,
8 and MDPU 97-111, NSTAR Electric is allowed
9 to defer the following four items:
10 ·.
11 Basic Service Reconciliation: {MDPU 06-40)
12 The Company defers the cost to
13 provide basic service to customers compared
14 to amounts billed to customers, plus Carrying
15 charge. 13,932,433 50,792,295 555 1,487,295 63,237,433
16
17 Transition Reconciliation-Boston Edison
18 Electric Company: {MDPU 96-23)
19 This account captures the difference between
( 20 costs incurred related to the transition charge
21 and the amounts actually billed to customers. 3,688,000 407.3/254 3,582,946 105,054
22
23 T ransilion Reconciliation-Commonwealth
24 Electric Company: (MDPU 97-111)
25 This account captures the difference between
26 costs incurred related to the transiUon charge
27 and the amounts actually billed to customers. 29,201,005 254 11,395,071 17,805,934
28
29 Transmission Reconciliation: (MDPU 06-40)
30 The Company defers the difference between
31 the transmission revenue billed to customers
32 and the cost to provide transmission service, 2,735,955 9,910,829 431 296,240 12,350,544
33
34 Residential Assistance Adjustment Clause:
35 This mechanism allows for the recovery of
36 costs related to low Income Residential
37 Assistance (MDPU 12-126) 2,200,695 1,992,263. robtriii.i<i.·· .•• : • ·· 1,352,435 2,840,523 - .. -
38
39 CPSL Costs (MDPU 05..'15) 17,329,510 14,955,714 407.31454 32,285,224
40
41 AFUDC (MDPU method amortized over 42 years) 3,223,699 407.3 270,901 2,952,798
42
43
FERC FORM NO. 113-Q (REV. 02-04) Page 232.1

Name of Respondent This wart Is: Date of Report Year/Period of Report
NSTAR Electric Company (1) An Original (Mo, Da, Yr)
End of 2015/04 (2) EJ A Resubmission I I
OTHER REGULATORY ASSETS (Account 182.3)
1. Report below the particulars (details) called for conc~rning other regulat01y assets, including rate order docket number, if applicable.
( 2. Minor items (5% of the Balance in Account 182.3 at end of period, or amounts less than $100,000 which ever is less), may be grouped by classes. 3. For Regulat01y Assets being amortized, show period of amortization.
Line Description and Purpose of Balance at Beginning Debits CREDITS Balance atena of No. Other Regulatory Assets of Current Written off During !he Written off During Current Quarter/Year
Quarter/Year Quarter ('{ear Account the Period Amount
(a) (b) (c) Charged (d) (e) <n ' 1 Asbestos removal-distribution plant 241,234 407.4 110,652 130,582
2 {amortized over 30 years)
3
4
5 NSTAR Green Implementation costs 182,413 407.4 52,118 130,295
6 (MOPU 07-64-A)
7
8 Energy contract derivative 4,534,952 244 3,190,318 1,344,634
9
10 Deferred net metering costs {MDPU 12~116) 14,954,533 45,926,258 456 30,037,694 30,843,097
11
12 Attorney Genera! consultant expenses 224,789 90,165 407.3 201,350 113,604
13 (MOPU 11-90) .
14
15 Deferred Smart Grid costs {MDPU 10~ 163) 409,407 1,484,479 407.3/431 1,893,886
16
17 Deferred storm restoration costs 74,813,757 18,461,943 598/426 4,500,000 88,775,700
18
( 19 Recoverable storm costs 2011 (MDPU 13~52) 28,849,314 839,805 593 7,544,842 22,144,277
20
21 Long term renewable contract adjustment
22 (MDPU 11-05,11-06, 11-07)
23 This mechanism allows for the recovery of
24 costs associated with Long~Term Renewable
25 Contracts that are in place to satisfy the
26 requirements of the Green Communities
27 Act 17,217,000 254 3,178,777 14,038,223
28
29 Energy Efficiency Reconciliation 62,384,765 111,568,407 254 37,018,748 136,934,424
30 (MOPU 13-121)
31
32 Storm Performance Adjustment 1,600,000 242 1,595,850 4,150
33 (MOPU 115)
34
35 Uncolleclibles Associated with Basic Service 7,842,103 7,842,103
36 (MDPU 03-88A)
37
38
39
40
41
42
43
44 TOTAL: 1 ,363,980,198 417,171,307 ,, \ .•• ,· \' \ -.. 330,795,362 1,450,356,143
FERC FORM NO. 1/3-Q (REV. 02-04) Page 232.2

(
(
Name of Respondent
NSTAR Electric Company
/Schedule Page: 232 Account: 456 926 440
Total
Line No.: 42 Column: d Amount: $14,852,002 14,666,000
8/805,446 $38,323,448
/Schedule Page: 232.1 Line No.: 37 Column: d Account: 442 440 444
Total
Amount: $ 884,766
461,348 6, 321
$1,352,435
I FERC FORM NO. 1 (ED. 12-87)
This Report is: Date of Report Year/Period of Report (1) ~An Original (Mo, Da, Yr) (2) A Resubmission I I 20151Q4
FOOTNOTE DATA
Page 450.1

Name of Respondent This ~art Is: Date of Report Year/Period of Report
NSTAR Electric Company (1) An Original (Mo, Da, Yr) End of 2015104 (2) OA Resubmission I I
MISCELlANEOUS DEFFERED DEBITS (Account 186)
1. Report below the particulars (details) called for conc~ming miscellaneous deferred debits.
2. For any deferred debit being amortized, show period of amortization in column (a)
( 3. Minor item (1% of the Balance at End of Year for Account 186 or amounts less than $100,000, whichever is less) may be grouped by
classes.
Line Description of Miscellaneous Balance at Debits CREDITS Balance at No. Deferred Debits Beginning of Year ~fCOU~~ Amount End of Year
(a) (b) (c) Ch(i/led
(e) (I)
1 Reimbursable Edgar project -925,983 925,983
2
3 Deferred basic service bad debt 32,986,509 28,811,78 3 --fo6bfOtS:--:': ;:'>: 51,622,514 10,175,778
4 costs 5
6 Reimbursable substation costs 8,134,099 565 624,813 7,509,286
7
8
9 Unamortized revolver fees 1,310,782 556,638 428 368,619 1,498,801
10
11 Deferred Insurance Costs 13,507,703 853,092 228 305,210 14,055,585
12
13 Allowance for hardship accounts 25,334,204 25,334,204
14
15 Miscellaneous 2,380,399 1,443,310 JOOtnote · 3,719,037 104,672
16
17
18
19
20
21
22
23
( 24
25
26
27
28
29
30
31
32
33
34
35
36
37
38
39
40
41
42
43
44
45
46
47 Misc. Work in Progress ,,;•:.;,,,,,
"h';:; ; ; ''.:"'""'" "'"':::. :';" '. ''h;
48 Deferred Regulatory Comm.
-3,515,136 6,409,466 928 2,894,330 Expenses (See pages 350- 351)
49 TOTAL 53,878,373 •.. · ::::::.:r ,, , .. ,., ,, ,, .,, .. ,·. < ? ••• . '• ,;:, .-,., .;),:;,'''''' ,{: 58,678,326
FERC FORM NO. 1 (ED. 12-94) Page 233

(
(
Name of Respondent
NSTAR Electric Company
/Schedule Page: 233 Account: 904 182.3 431
Total /Schedule Page: 233 Account: 143 182.3 144 142
Total
Line No.: 3 Column: d Amount: $39,247,232 11,621,861
753,421 $51,622,514
Line No.: 15 Column: d Amount: $2,339,828 1,165,190
190,304 23,715
$3,719,037
I FERC FORM NO. •j (ED. 12-87)
This Report is: Date of Report Year/Period of Report (1) 2S An Original (Mo, Da, Yr) (2) A Resubmission I I 2015104
FOOTNOTE DATA
Page 450.1

1 Name or misi ~ ·:~ ~;iginal f7~~ g~~~~ort '~~;;;~4 NSTAR Electric Company End of (2)
AGGUI1 IUlA Tl TAXE:S t 1 90)
1. Report the information called for below concerning the respondent's accounting for deferred income taxes. 2. At Other (Specify), include deferrals relating to other income and deductions .
. r rune i Balance at. ~nd 1 ana Locatron
No. (a) or !ear or rear
~ lolec!ric
' 4
t 6 .
Other
TOTAL ElectriG_\'="l_er , u1el of lines 2 thru 7) " ~ Gas :!•;i '"'''·
1(
11
12
13
14
1• Other
1E TOTAL Gas (Enter Total of lines 10 thru 15
17 ~•"o'
1E TOTAL (Acct 190) (Total of lines 8, 16 and 17) 63,896,752 35,729,300
Notes
(
FERC FORM N0.1 (ED.12-88) Page 234

(
(
Name of Respondent
NSTAR Electric Company
!Schedule Page: 234 Line No.: 2 Column: c
Post employment benefits accrued Performance reward program Workers Compensation Non-qualified pension plan Provision for rate refund Self insurance reserves Allowance for uncollectible accounts Other items
Total
This Report is: Date of Report (1) 2\ An Original (Mo, Da, Yr) (2) A Resubmission I I
FOOTNOTE DATA
Amount
$13,247,347 2,105,046 2,303,035 1,276,759 1,846,125 3,250,555 9,471,949 2,228,484
$35,729,300
Business Unit
All (Labor) All (Labor) All (Labor) All (Labor) All (Plant) All (Plant) Distribution All (Plant)
Information on Formula Rates page· 106.2 line 1: Amount as stipulated per contract.
I FERC FORM NO. 'I (ED. 12-87) Page 450.1
Year/Period of Report
2015104

Name of Respondent This ~art Is: Date of Report Year/Period of Report
NSTAR Electric Company (1) An Original (Mo, Da, Yr)
End of 20151Q4 (2) OA Resubmission I I
CAPITAL STOCKS (Account 201 and 204)
1. Report below the particulars (details) called for concerning common and preferred stock at end of year, distinguishing separate series of any general class. Show separate totals for common and preferred stock. If information to meet the stock exchange reporting
( requirement outlined in column (a) is available from the SEC 1 O-K Report Form filing, a specific reference to report form (i.e., year and company title) may be reported in column (a) provided the fiscal years for both the 1 O-K report and this report are compatible. 2. Entries in column (b) should represent the number of shares authorized by the articles of incorporation as amended to end of year . . Line Class and Series of Stock and Number of shares Par or Stated Call Price at No. Name of Stocl< Series Authorized by Charter Value per share End of Year -
(a) (b) (c) (d)
1 Account 201:
2 Common Stock 100 1.00
3
4
5
6
7 Total Common 100 1.00
8
9
10 Account 204:
11 Cumulative preferred:
12 4.25% series 180,000 100.00 103.63
13 4.78% series 250,000 100.00 102.80
14
15
16
17 Authorized and unissued 2,460,000
18
( 19 Total Preferred 2,890,000
20
21
22
23
24
25 26.
27
28
29
30
31
32
33
34
35 .
36
37
38
39
40
41
42
FERC FORM N0.1 (ED.12-9"1) Page 250

I (1) l!J An Original (Mo, Da, Yr) I ~ ' ~
NSTAR Electric Company End of 2015104 (2} DA Resubmission I I
CAPITAL STOCKS (Account 201 and 2 4) (Continued)
3. Give particulars (details) concerning shares of any class and series of stock authorized to be issued by a regulatory commission which have not yet been issued. 4. The identification of each class of preferred stock should show the dividend rate and whether the dividends are cumulative or non-cumulative.
(~ 5. State in a footnote if any capital stock which has been nominally issued is nominally outstanding at end of year. Give particulars (details) in column (a) of any nominally issued capital stock, reacquired stock, or stock in sinking and other funds which is pledged, stating name of pledgee and purposes of pledge.
OUTSTANDING PER BALANCE SHEET HELD BY RESPONDENT Line (Total amount outstanding without reduction
for amounts held by respondent) AS REACQUIRED STOCK (Account 217) IN SINKING AND OTHER FUNDS No.
s~?res Amount sry?res <gr Shares Amount (e) (fj (g) (i) Q)
1
100 100 2
3
4
5
6
100 100 7
8
9
10
11
180,000 18,000,000 12
250,000 25,000,000 13
14
15
16
17
18
: ( 430,000 43,000,000 19
20
21
22
23
24
25
26
27
28
29
30
31
32
33
34
35
36
37
38
39
40
41
42
FERC FORM NO. ·1 (ED. 12-88) Page 251

(
I \
Name of Respondent This wart Is: Date of Report Year/Period of Report
NSTAR Electric Company (1) An Original (Mo, Da, Yr) End of 2015104 (2) DA Resubmission I I
OTHER PAID-IN CAPITAL {Accounts 208-211, inc.)
Report below the balance at the end of the year and the information specified below for the respective other paid-in capital accounts. Provide a subheading for each account and show a total for the account, as well as total of all accounts for reconciliation with balance sheet, Page 112. Add more columns for any account if deemed necessary. Explain changes made in any account during the year and give the accounting entries effecting such change. (a) Donations Received from Stockholders (Account 208)-State amount and give brief explanation of the origin and purpose of each donation. (b) Reduction in Par or Stated value of Capital Stock (Account 209): State amount and give brief explanation of the capital change which gave rise td' amounts reported under this caption including identification with the class and series of stock to which related. (c) Gain on Resale or Cancellation of Reacquired Capital Stock (Account 21 0): Report balance at beginning of year, credits, debits, and balance at end of year with a designation of the nature of each credit and debit identified by the class and series of stock to which related. . (d) Miscellaneous Paidwin Capital (Account 211)-Ciassify amounts included in this account according to captions which, together with brief explanations, disclose the general nature of the transactions which gave rise to the reported amounts.
L1me No. 'l~r A76\unt
1 Donations Received from Stockholders (Account 208)
2 None
3
4
5 Reduction in Par or Stated Value of Capital Stock (Account 209)
6 None
7
8
9 Gain on Resale or Cancellation of Reacquired Capital. Stock
10 (Account 21 0)
11 None
12
13
14 Miscellaneous Paid-In Capital (Account 211)
15 Purchase price allocation 3/31/2012 2,177,692,047
16 ESOP Adjustment 2,753,371
17 Subtotal 2,180,445,418
18
19
20
21
22 .
23
24
25
26
27
28
29
30
31
32
33
34
35
36 .
37
38
39
40 TOTAL . 2,180,445,418
. FERC FORM NO.1 (ED.12-87) Page ?.53

ir· j ''·
i
BLANK PAGE
(

Name of Respondent ·ThiS ·wort Is: oi:de -of Report Year/Period of Report-
NSTAR Electric Company (1) An Original (Mo, Da, Yr)
End of 2015104 (2) 0 A Resubmission I I
LONG-TERM DEBT (Account 221, 222, 223 and 224)
1. Report by balance sheet account the particulars (details) concerning long-term debt included in Accounts 221, Bonds, 222, Reacquired Bonds, 223, Advances from Associated Companies, and 224, Other long-Term Debt. 2. In column (a), for new issues, give Commission authorization numbers and dates. 3. For bonds assumed by the respondent, include in column (a) the name of the issuing company as well as a description ofthe bonds. 4. For advances from Associated Companies, report separately advances on notes and advances on open accounts. Designate demand notes as such. Include in column (a) names of associated companies from which advances were received. -5. For receivers, certificates, show in column (a) the name of the court -and qate of court order under which such certificates were issued. 6. In column (b) show the principal amount of bonds or other long-term debt originally issued. . 7. In column (c) show the expense, premium or discount with respect to the amount of bonds or other long-term debt originally issued. 8. For column (c) the total expenses should be listed first for each issuance, then the amount of premium (in parentheses) or discount. Indicate the premium or discount with a notation, such as (P) or (D). The expenses, premium or discount should not be netted. 9. Furnish in a footnote particulars (details) regarding the treatment of unamortized debt expense, premium or discount associated with issues redeemed during the year. Also, give in a footnote the date of the Commission's authorization of treatment other than as specified by the Uniform System of Accounts.
Line Class and Series of Obligation, Coupon Rate Principal Amount Total expense, No. (For new issue, give commission Authorization numbers and dates) Of Debt issued Premium or Discount
(a) (b) (c)
1 Account 224:
2 5.75% Debentures 200,000,000 2,180,549
3 17,719,179
4 2,114,000 D
5
6 5.625% Debentures 300,000,000 . 2,365,576
7 1,311,000 D
8 100,000,000 920,662
( 9 -4,553,000 p
10
11 5.50% Debentures 300,000,000 3,123,342
12 4,806,000 D
13
14 2.375% Debentures 400,000,000 3,178,574
15 1,096,000 D
16
17 Floating Rates Debentures (DPU 12-32, $600M, expires 12/31/13) 200,000,000 974,880
18
19 4.40% Debentures 300,000,000 3,064,448
20 2,073,000 D
21 NSTAR E 2015 $300M Debentures 250,000,000 1,948,076
22 Subtotal Account 224 2,050,000,000 42,322,286
23
24 Column (c): expenses listed first, followed by calf premiums,
25 then discount (D)/premium (P) for each obligation
26
27
28
29
30
31
32
33 TOTAL 2,050,000,000 42,322,286
FERC FORM N0.1 (ED. 12-96) Page 256

(1)- -~;nROfiQina! (Nio: oa: YFf · I . __ ,,- ·-- -·. ·-r--··
NSTAR Electric Company End of 20t51Q4 (2) '~oouu'"'ooluu I I
L' 1 tJEB <«,a' ana <Z4J i
1 D. Identify separate undisposed amounts applicable to issues which were redeemed in prior years. 11. Explain any debits and credits other than debited to Account 428, Amortization and Expense, or credited to Account 429, Premium on Debt - Credit. .
( 12. In a footnote, give explanatory (details) for Accounts 223 and 224 of net changes during the year. With respect to long-term "'' show for each company: (a) principal advanced during year, (b) interest added to principal amount, and (c) principle repaid
during year. Give Commission authorization numbers and dates. 13. If the respondent has pledged any of its long-term debt securities give particulars (details) in a footnote including name of pledgee
;and purpose ofthe pledge. 14. If the respondent has any long-term debt securities which have been nominally issued and are nominally outstanding at end of
., year, describe such securities in a footnote . 15. If interest expense was incurred during the year on any obligations retired or reacquired before end of year, include such interest "~ in column (i). Explain in a footnote any difference between the total of column (i) and the total of Account 427, interest on
Long-Term Debt and Account 430, Interest on Debt to Associated Companies. 16. Give particulars (details) concerning any long-term debt authorized by a regulatory commission but not yet issued.
[T;>,!~!.ar~ Nominal Date Date of M">V~' >LM' •v•< PERIOD
Interest for Year I Line
of ~~)ue M(~)rity Oat~; rom D~~To Amount No.
(h) (i)
'03/t3/2006 1 uo" o«voo 1 uo' 'o«uuo tt,finn non
3
4
5
tt, t7 ttlt912007 1tlt512017 6
7
t7 1 o211112oo9 17 t' 8
( 9
tU
'031t6110 1 uo" o«u•u 1 o31t6no """"'<u•u 1R,finn nnn _11 t2
_1_3 t0/1512012 It olt512022 t' tOit512022 14
t5
t6
I05It7113 05/t71t6 U51t7/13 I051t7116 t,070,324 t7
t8
t4 t:, t9
2C
It It 970,486 21
22 .. 23
24
25
26 _27
28
_29 3C
-31 32
-: ·,-· . ·"·' ·:< .. ... ·· o,n'n nnn nne 75,204, t43 33
FERC FORM NO.1 (ED. 12-96) Page 257

·INameo, mis• ~ 1
!~-\5~g.inal Pi~~ g~~~~ort ' ~~; ;;;~· NSTAR Electric Company End of
(2)
I fiON OF NIT •WITH. •FOR
1. Report the reconciliation of reported net income for the year with taxable income used in computing Federal income tax accruals and show computation of such tax accruals. Include in the reconciliation, as far as practicable, the same detail as furnished on Schedule M~1 of the tax return for the year. Submit a reconciliation even though there is no taxable income for the year. Indicate clearly the nature of each reconciling amount.
( 2. If the utility is a member of a group which files a consolidated Federal tax return, reconcile reported net income with taxable net income as if a separate return were to be field, indicating, however, intercompany amounts to be eliminated in such a consolidated return. State names of group member, tax assigned to each group member, and basis of allocation, assignment, or sharing of the consolidated tax among the group members. 3. A substitute page, designed to meet a particular need of a company, may be used as Long as the data is consistent and meets the requirements of the above instructions. For electronic reporting purposes complete Line 27 and provide the substitute Page in the context of a footnote.
"
L~~ "' "o"'"(;) (Details) A(g)mt
1 ,Net r the Year (Page 117)
• 2
3
4 faxable Income Not I on Books
5 see footnote
6 '
7_ 8
~ 9 I on Books Not I lforReturn
10 see footnote
11
12
13
~: 14 Income j on Books Not Included in Return
15
16
17
18
-19 ; on Return Not c.narged Against Bool< Income
20 see footnote .
21
(
22 Taxable I -line 1 +line 5 +line 10 -line 15-line 20 .1~58,427
23
24 !State IUS'
25 Taxable income for state 264,731 ,033
26 !Stat.e tax rate @ 8% 21,178,483
27 1Federal Tax Net Income 144,979,9~
28 Showt I 1 ofTax:
29
30 I federal tax payable @ 35%
31
32
33
34 •.ax .c:• :Y:: '· · ·.· .. · ··· .. ·: r ·-:.·.•>.·:.. ··.·:. :·: :.· ... ··. ·.<.'' • ,:/·•·: ·.·· :-· ·i.'/ •.--· .... •:•;,,..;·· ·.>>,'·<•. 35
36
37
38
39
40
41
42
43
44
FERC FORM NO.1 {cU. u-•bJ Page 261

(~
'
(
Name of Respondent
NSTAR Electric Company
/Schedule Page: 261 Line No.: 5 Contributions in aid of construction !Schedule Page: 261 Line No.: 10 Bond redemption amortization Book depreciation Capital leases Capitalized interest Deferred net metering costs Federal income tax expense Goodwill amortization Hazardous waste disposal costs Tangible property tax Municipal taxes Pension and post retirement costs Prepaid insurance State income taxes Other items Total
@chedule Page: 261 Line No.: 15 Amortization of fTC Contributions in aid of construction Total /Schedule Page: 261 Line No.: 20 Tax depreciation Bonus depreciation Repairs expense AFUDC Debt AFUDC Equity Compensation expense Cost of removal Customer refunds Deferred cost of electricity Energy efficiency spending accrual Life insurance expense Loss on asset retirements Medical expense Mixed service cost Pension payments Safes tax Storm cost Uncollectible accounts Other Total
This Report is: (1) X An Original (2) A Resubmission
FOOTNOTE DATA
Column: b $ 29,806,308 Column:b
521,176 195,446,768
7,331,124 5,846,050
22,222,302. 183,595,137
17,590,044 1,299,908 1,015,988 2,953,708
12,102,675 2,342,429
45,486,108 1,081,898
$ 498,835,315
Column: b
Column: b
$ 1,292,607 2,405.480
$ 3,698,087
$180,195,528 206,032,568
4,976,467 746,054
4,336,447 832,214
31,328,817 28,100,000
108,074,361 75,430,872
522,301 11,080,321
1,873,525 11,466,771 17,069,272
659,791 7,256,907
15,540,611 1 878 727
$707,401,554
/Schedule Page: 261 Line No.: 34 Column: a
Date of Report Year/Period of Report (Mo, Da, Yr)
I I 20151Q4
This company is a member of an affiliated group 1 Eversource Energy and Subsidiaries, which will file a 2015 consolidated federal Income Tax return on or before September 15,2016.
Members of the group are: Eversource Energy The Connecticut Light and Power Company The Connecticut Steam Company Electric Power, Inc.
/FERC FORM NO.1 (ED.12-87) Page 450.1

(' \
(
Name of Respondent This Report is: (1) .2\An Original
NSTAR Electric Company I i2) A Resubmission
FOOTNOTE DATA
NGS Sub 1 Inc. Harbor Electric Energy Company Hopkinton LNG Corp. HWP Company North Atlantic Energy Corporation North Atlantic Energy Service Corporatio~ Northeast Generation Services Company Northeast Nuclear Energy Company
Date of Report Year/Period of Report (Mo, Da, Yr)
I I 2015104
Eversource Energy Service Company {formerly known as Northeast Utilities Service Company) NSTAR Communications 1 Inc. NSTAR Electric Company NSTAR Gas Company NU Enterprises, Inc. Eversource Energy Transmission Ventures 1 Inc. The Nutmeg Power Company Properties, Inc. Public Service Company of New Hampshire Renewable Properties, Inc. The Rocky River Realty Company Select Energy Contracting, Inc. Select Energy, Inc. Western Massachusetts Electric Company Yankee Energy Financial Services Company Yankee Energy Services Company Yankee Energy System, Inc. Yankee Gas Services Company
The above entities are parties to a tax allocation agreement under which taXable subsidiaries do not pay any more taxes than they would have otherwise paid had they filed a separate Company tax return, and subsidiaries generating tax losses, if any, are paid for their losses when utilized.
/FERC FORM NO. ·1 (ED. 12-87) Page 450.2

BLANK PAGE
(

Name of Respondent This Report Is: Date of Re~ort Year/Period of Report
NSTAR Electric Company (1) IKJAn Original (Mo, Da, Yr)
End of 2015104 (2) OA Resubmissioil I I
TAXES ACCRUED, PREPAID AND CHARGED DURING YEAR
1. Give particulars (details) of the combined prepaid and accrued tax accounts and show the total taxes charged to operations and other accounts during
the year. Do not include gasoline and other sales taxes which have been charged to the accounts to which the taxed material was charged. If the
actual, or estimated amounts of such taxes are know, show the amounts in a footnote and designate whether estimated or actual amounts.
2. Include on this page, taxes paid during the year and charged direct to final accounts, (not charged to prepaid or accrued taxes.)
Enter the amounts in both columns (d) and (e). The balancing of this page is not affected by the inclusion of these taxes.
3. lncl~de in column (d) taxes charged during the year, taxes charged to operations and other accounts through (a) accruals credited to taxes accruGd,
(b)amounts credited to proportions of prepaid taxes chargeable to current year, and (c) taxes paid and charged direct to operations or accounts other
than accrued and prepaid tax accounts.
4. List the aggregate of each kind of tax in such manner that the total tax for each State and subdivision can readily be ascertained. '
Line Kind of Tax BALANCE AT BEGINNING OF YEAR c~~xes axes Adjust-C arged . Paid No. (See instruction 5) Taxes Accrued .. '::repa!..a~Laxes Durmg During ments
(Account 236) (Include m Account 165) Year Year (a) (b) (c) (d) (e) (~
1 FEDERAL
2 Unemployment 2015 85,076 84,670
3 Unemployment 2014 168 168
4 FICA2015 6,724,029 6,441,223
5 FICA2014 -1,140 -1,140
6 Highway 345 345
7 Income 86,322,028 109,149,873 21,440,698
8 Medicare 2015 1,849,979 1,784,319
9 Medicare 2014 -1,891 -1,891
10 Subtotal -2,863 86,322,028 117,809,302 29,748,392
11
12 STATE OF CONNECTICUT
13 Insurance Premium Excise 203,925 203,925
14 Unemployment 2015 88,758 88,766
15 Subtotal 292,683 292,691
16
( 17 COMMONWEALTH OF
18 MASSACHUSETTS
19 Unemployment 2015 145,320 154,684
20 Unemployment 2014 6,592 6,592
21 Franchise 12,973,658 20,394,828 4,364,029
22 Mass Sales Tax -96,039 -96,039
23 Universat.Health 2015 45,425 44,614
24 Universal Health 2014 776 776
25 State of MA tangible property 1,015,988 1,015,988
26 Subtotal 7,368 12,973,658 21,505,522 . 5,490,644
27
28 LOCAL MASSACHUSETTS
29 Property 2015 123,187,563 119,666,025
30 Property 2014 4,191,426 4,191,426
31 Subtotal 4,191,426 123,187,563 123,857,451
32
33 STATE OF NEW
34 HAMPSHIRE
35 Unemployment 2015 5,425 5,425
36 Subtotal 5,425 5,425
37
38 DISTRICT OF COLUMBIA
39 Unemployment 2015 83 83
40 Sl)btotal 83 83
41 TOTAL 4,195,931 99,295,686 262,800,623 159,394,731
FERC FORM NO.1 (ED. 12-96) Page 262

. --···- -·. ---,.---~---· (1')"' '~A~ Ofiginal I .................... '"'"'!-''-'''
I ''"'"'''' "'''"''-' ...... , ·~"t-''"'''
NSTAR Electric Company (Mo, Da, Yr) End of 2015104
{2) O.A Resubmission I I
TAXES ACCF UED, PREPAID AND CHARGED DURING YEAR (Continued)
5. If any tax (exclude Federal and State income taxes)- covers more then one year, show the required infonnation separately for each tax year, identifying the year in column (a). 6. Enter all adjustments of the accrued and prepaid tax accounts in column (f) and explain each adjustment in a foot- note. Designate debit adjustments by parentheses.
:r 7. Do not include on this page entries with respect to deferred income taxes or taxes collected through payroll deductions or otherwise pending transmittal of such taxes to the taxing authority. 8. Report in columns (i) through (I) how the taxes were distributed. Report in column (/)only the amounts charged to Accounts 408.1 and 409.1 pertaining to electric operations. Report in column (I) the amounts charged to Accounts 408.1 and 109.1 pertaining to other utility departments and amounts charged to Accounts 408.2 and 409.2. Also shown in column (I) the taxes charged to utility plant or other balance sheet accounts. 9. For any tax apportioned to more than one utility department or account, state in a footnote the basis (necessity) of apportioning such tax.
BALANCE AT END OF YEAR DISTRIBUTION OF TAXES CHARGED Line (Taxes accrued Prepaid Taxes Electric Extraordinary Items Adjustments to Ret. Other No. Acco~nt 236) (Incl. in Account 165) (Account 408.1, 409.1) (Accou8J409.3) Earnmgs (Account 439)
g) (h) (i) (k) (I) . 1
406 85,076 2
3
282,806 6,724,029 4
5
345 6
1,387,147 34,304,032 7~.?45,§4) 7
65,660 1,824,393 ... 25,§$6 8
9
1,736,019 42,937,875 74,871,427 10
11
12
203,925 13
8 88,750 8 14
8 292,675 8 15
16
( 17
18
9,364 135,955 9,365 19
20
3,057,141 19,319,261 1 ,07~;§.~!, 21
-96,074 .···. Jf635, 22
811 45,425 23
24
1,015,988 25
3,057,952 9,364 20,420,555 1,084,967 26
27
28
3,521,538 . ·.> •,.'. ;:f22i~9b,763 i1g§,?RQ . 29
. 30
3,521,538 122,990,763 196,800 31
32
33
34
5,425 35
5,425 36
37
38
83 39
83 40
8,315,509 9,372 186,647,421 76,153,202 41
FERC FORM NO.1 (ED. 12-96) Page 263

Name of Respondent This Report Is: Date of Report Year/Period of Report
NSTAR Electric Company (1) [2g An Original (Mo, Oa, Yr)
End of 20151Q4 (2) DA Resubmission I I
TAXES ACCRUED, PREPAID AND CHARGED DURING YEAR
1. Give particulars (details) of the combined prepaid and accrued tax accounts and show the total taxes charged to operations and other accounts during
the year. Do not include gasoline and other sales taxes which have been charged to the accounts to which the taxed material was charged. If the
actual, or estimated amounts of such taxes are know, show the amounts in a footnote and designate whether estimated or actual amounts.
2. Include on this page, taxes paid during the year and charged direct to final accounts, (not charged to prepaid or accrued taxes.) ( Enter the amounts in both columns (d) and (e). The balancing of this page is not affected by the inclusion of these taxes.
3. Include in column (d) taxes charged during the year, taxes charged to operations and other accounts through (a) accruals credited to taxes accrued,
(b)amounts credited to proportions of prepaid taxes chargeable to, current year, and (c) taxes paid and charged direct to operations or accounts other
than accrued and prepaid tax accounts.
4. List the aggregate of each kind of tax in such manner that the total tax for each St.ate and subdivision can readily be ascertained.
me Kind of Tax BALANCE AT BEGINNING OF YEAR c~fes '~:axes Adjust~ C arged Paid No. (See instruction 5) Taxes Accrued Prepaid Taxes ~unng During ments
(Account 236) (Include m Account 165) ear Year (a) (b) (c) (d) (e) (I)
1 STATE OF FLORIDA
2 Unemployment 2015 2 2
3 Subtotal 2 2
4
5 STATE OF MICHIGAN
6 Unemployment 2015 42 42
7 Subtotal 42 42
8
9 STATE OF NEW YORK
10 Unemployment 2015 1 1
11 Subtotal 1 1
12
13
14
15
16
( 17
18
19
20
21
22
23
24
25
26
27
28
29
30
31
32
33
34
35
36
37
38
39
40
41 TOTAL 4,195,931 99,295,686 262,800,623 159,394,731
FERC FORM NO. ·1 (ED.12-96) Page 262.1

. ·-···- -·. ·--.-- .. --··· I {1F ·Jt]An Ortginal (iliii; oa; vr) · I NSTAR Electric Company End of 2015104 {2) 0 A Resubmission I I
TAXES ACCRUED, PREPAID AND CHARGED DU lNG YEAR (Continued)
5. If any tax (exclude Federal and State income taxes)- covers more then one year, show the required information separately for each tax year, identifying the year in column (a). 6. Enter all adjustments of the accrued and prepaid tax accounts in column {f) and explain each adjustment in a foot- note. Designate debit adjustments by parentheses.
'( 7. Do not include on this page entries with respe9t to deferred income taxes or taxes collected through payroll deductions or otherwise pending transmittal of such taxes to the taxing authority.
. 8. Report in columns (i) through (I) how the taxes were distributed. Report in column (/)only the amounts charged to Accounts 408.1 and 409.1 pertaining to electric operations. Report in column (/)the amounts charged to Accounts 408.1 and 109.1 pertaining to other utility departments and amounts charged to Accounts 408.2 and 409.2. Also shown in column {I) the taxes charged to utility plant or other balance sheet accounts. 9. For any tax apportioned to more than one utility department or account, state in a footnote the basis (necessity) of apportioning such tax.
'
BALANCE AT END OF YEAR DISTRIBUTION OF TAXES CHARGED Line (Taxes ac.crued Prepaid Taxes Electric Extraordinal)l Items ~ l\a1ustments to_ :<~t. Other No. Acco~nt 236) {Incl. in Account 165) (Account 408.1, 409.1) (Account 409.3) Earnmgs (Account 439)
g) (h) (i) (j) (k) (I) . 1
2 2
2 3
4
5
42 6
42 7
8
9
1 10
1 11
12
13
14
15
16
( 17
18
19
20
21
22
23
24
25
26
27
28
29 . 30
31
32
33
34
35
36
37
38
39
40
l.~ 8,315,509 9,372 186,647,421 76,153,202 41
FERC FORM NO.1 (ED, 12-96) Page 263.1
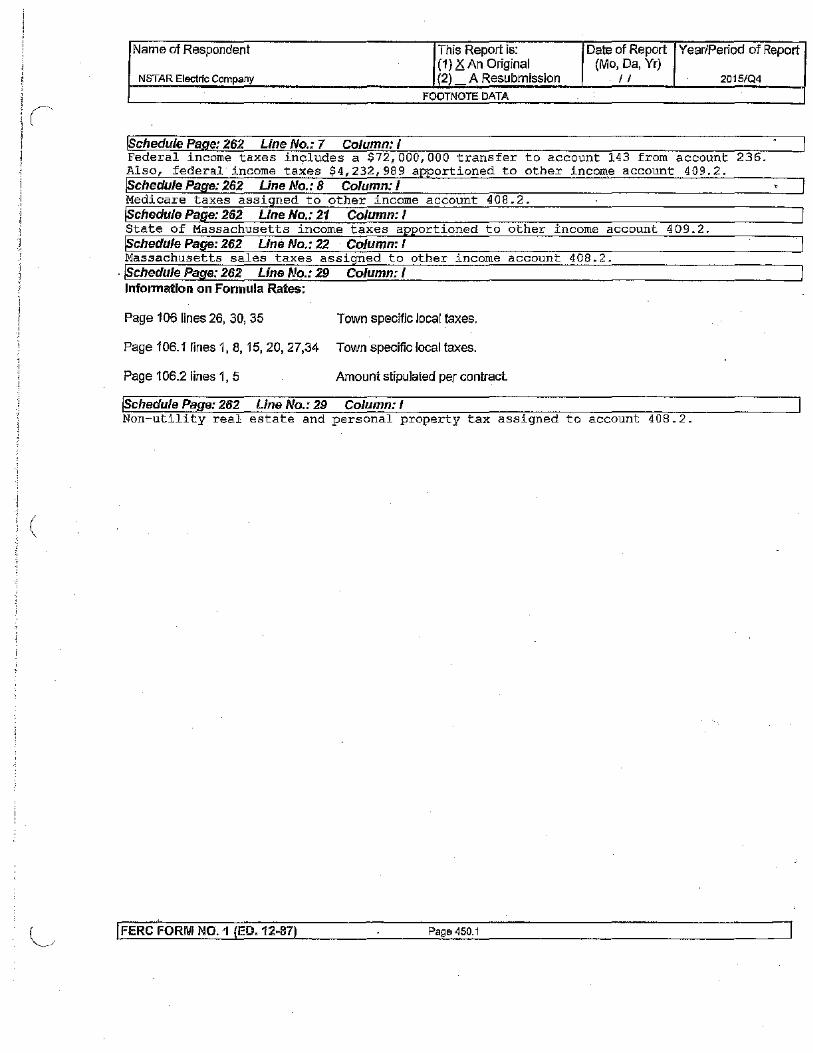
(
(
l,
Name of Respondent This Report is: Date of Report Year/Period of Report (1) KAn Original (Mo, Da, Yr)
NSTAR Electric Company (2) A Resubmission I I 2015104
FOOTNOTE DATA
!Schedule Page: 262 Line No.: 7 Column: I Federal income taxes includes a $72,000,000 transfer to account 143 from account 236. Also, federal income taXes $4,232,989 a portioned to other income account 409.2. Schedule Page: 262 Line No.: 8 Column: I Medicare taxes assigned to other income account 408.2. !Schedule Page: 262 Line No.: 21 Column: I State of Massachusetts income taxes apportioned to other income account 409.2. @chedule Page: 262 Line No.: 22 Column: I Massachusetts sales taxes assigned to other income account 408.2.
-/Schedule Page: 262 Line No.: 29 Column: i Information on Formula Rates:
Page 106 lines 26, 30, 35 Town specific local taxes.
Page 106.1 lines 1, 8, 15, 20, 27,34 Town specific local taxes.
Page 106.2 lines 1, 5 Amount stipulated per contract.
!Schedule Page: 262 Line No.: 29 Column: I Non utility real estate and personal property tax assigned to account 408.2.
IFERC FORM N0.1 (ED.12-87) Page 450.1

BlANK PAGE
: (
I '-

(
(
J Name of I -· 1 or t<epoo NSTAR Electric Company End of 2015/Q4
A . TAX :RED ITS 255)
I ~~~o~~,,below information applicable to Account 255 .. Where appropriate, segregate the balances and transactions by utility and ~'!-operations. Explain by footnote any correction adjustments to the account balance shown in column (g). Include in column (i)
the ; ~ period over which the tax credits are amortized.
une s· Abcc .0 .""' ~aranc~,ft -~~ar 1
. I I Deferred ror rear ~me Adj'Ustments
No~IEiectri:U:~:;:ions -101 ~rNo A~ :unt ;~~~uf.ir-,,.--t~
J3% 4%
'7%
' 10% '
411.4
411.4
117,021 '
1'
9~~~:~~List I ' , ,. . ·' , .. , 1,?ee,m1 . 1
and show 3%, 4%, . .
1( 10% and TOTAL) , , . S:.S:•:/:· ':fij:ili· S)!]2:i1Gfr'Ff~fl2±:J}2£
1' 317,871 411.4 29,571
12
13
14
1:
1E 1S
2(
21 .
22
2<
21
2E
27
28
30 31 .
31
3E
37
3E
3S 4C 41
42
43
4<
41 .
4E
41
4E
FERC FORM N0.1 (ED. '12-89) Page 266

'r j \
' ..
(
NSTAR Electric Company
LA TED
Bal'b'/c-/'e~t End A~~~_a,Re_P.~nod
u!.;'ii~;me lhl
' ""'> :_·_,';.,;,; ,:;•,:,,:.;;,
. 819,557
- 288,303
FERC FORM NO. ·1 (ED. 12-89)
(1) 11 ~n Original (2) I
Page 267
(Mo, Da, Yr) End of 2015104
I I lAX !255)
ADJU~ 1 "'"" f >'YDI 1 Line No.
~ 2
3
4
5
E
7 8
9
10
1.1 . 12
13
14
15
16
17 1s
' 19 To 21 22 23 24 2s 26 -27 28 30
31
32
33
34
35
36
37
38
39
40
41
42 43 44 4s 4s 47 4s

Name of Respondent This Report Is: Date of Report Year/Period of Report
NSTAR Electric Company (1) ~!]An Original (Mo, Da, Yr)
End of 2015104 {2) OA Resubmlssion I I
OTHER DEFFERED CREDITS (Account 253)
1. Report below the particulars (details) called for concerning 9ther deferred credits.
2. For any deferred credit being amortized, show the period of amortization.
( 3. Minor items (5% of the Balance End of Year for Account 253 or amounts Jess than $100,000, whichever is greater) may be grouped by classes.
Line Description and Other Balance at DEBITS Balance at
No. Deferred Credits Beginning of Year Contra Amount Credits End of Year .,
(a) (b) Account
(c) (d) (e) <n 1 Northeast Energy Associates
2 power contract buyout ' 3 (long-term portion) 9,938,217 242 9,938,217
4
5 Decommissioning obligations 5,384,000 242 768,000 25,000 4,641,000
6
7 Disputed property taxes 2,373,890 . 242 6,098,975 9,385,678 5,660,593
8
9 Miscellaneous credits 2,093,568 fooinot~ ; ·. J 1,439,106 2,481,029 3,135,491
10
11 ·. 12
13
14
15
16
17
18
19
20
21
22 .
23 ( 24
25
26
27
28
29
30
31
32
33
34
35
36
37
38
39
40
41
42
43
44
45
46
47 TOTAL 19,789,675 . ;:_.,, ,;-,., 18,244,298 11,891,707 13,437,084
FERC FORM NO.1 (EO. 12-94) Page 269

(
Name of Respondent
NSTAR Electric Company
/Schedule Page: 269 Account: 107 232 234
Line No.: 9 Column: c Amount: $1,075,589
312,999 50,518
$1,439,106
I FERC FORM NO. 1 (ED. •/2-87)
This Report is: Date of Report Year/Period of Report (1) 2S An Original (Mo, Da, Yr) (2) A Resubmission I I 2015/Q4
FOOTNOTE DATA
Page 450.1

\
End of 2015/04
Report the information called for below concerning the respondent's accounting for deferred income taxes rating to property not
ISL!OJ<'cr to accelerated amortization For other (Specify),include deferrals relating to other income and deductions.
Account No.
(a)
FERC FORM NO.1 (ED. 12-96)
Balance at Beginning of Year
(b)
NOTES
Page 274
Amounts Debited to Account 410.1
(c)

r . \
(
L
NSTAR Electric Company
ACCUMULATEC
;3. Use footnotes as required.
TAX -OTHER
YEAR ADJUSli~~NfS
frJJo; oa: Yrl- · I I
t~ljL){{ i
; Debited Amounts Credited Debits Credits
I End of 2015104
Balance at Line End of Year No.
~2 toAcco(~n~t4jS1;}l1.g2~ ~~{gf~~~~ '6~~~J l'iC!\• A~~unt . ~~~~~~~
3
4
: \ j, -5 6
. . 7
8
1• ' 12 13
NOTES (Continued)
FERC FORM NO. ·1 (ED. '12-96) Page 275

Name of Respondent This Report is: Date of Report Year/Period of Report (1) 2S An Original (Mo, Da, Yr)
NSTAR Electric Company (2) A Resubmission I I 2D15IQ4
FOOTNOTE DATA
!Schedule Page: 274 Line No.: 5 Column: k Information on Formula Rates Page 106.2 line 1: Amount as stipulated per contract.
(
IFERG FOR/\11 N0.1 (ED.12-87) Page 450.1

I '
BlANK PAGE
(

(
(
NSTAR Electric Company
1. Report the information called for below concerning the resporident's accounting for deferred income taxes relating to amounts / re,conjed in Account 283.
2. For other (Specify),include deferrals relating to other income and deductions.
NOTES
FERC FORM NO. 'l (ED.iZ-96) Page 276

(
(
NSTAR Electric Company fMO~ oa; YF)-·· II
End of 2015/Q4
Provide i,n the space below explanations for Page 276 and 277. Include amounts relating to insignificant items listed under Other.
Use footnotes as required.
NOTES (Continued)
FERC FORM NO. 1 (ED. 12-96} Page 277

I \
Name of Respondent
NSTAR Electric Company
/Schedule Page: 276 Line No.: 3 Column: k
AFUDC/asbestos regulatory asset Bond redemption call premiums Pension expense Performance reward program General and administrative costs Mitigation incentive & Montaup billing receivable Property tax lien date accrual Retail adjuster clause deferrals Deferred net metering costs Storm contingency fund Pension adjustment mechanism ASC 740 deferred income taxes (FAS109) Goodwill other items
Total
Information on Formula Rates Page 106.2 line 1: Amount as stipulated by contract.
JFERC FORM NO.1 (ED.12-87)
This Report is: (1) X An Original (2\. A Resubmission
FOOTNOTE DATA
Page 450.1
$ 1,202,014 4,796,899
108,550,017 2,178,714
101,050 7,517,944
22,818,788 98,521,637 12,394,611 43,524,422
7,060,602 85,821,092
167,351,614 1 436 857
$563,276,261
Date of Report Year/Period of Report (Mo, Da, Yr)
I I
All (Plant) All (Plant) All (Labor) All (Labor) All (Labor) Retail Adjuster Clause All (Plant) Retail Adjuster Clause Distribution Distribution Retail Adjuster Clause All (Plant) Regulatory Asset All (Plant)
20151Q4

I
I( ' i ' . I j J j
' -l I I ' 'I
(
(1'j'- ~ iA~ O;iginal ~-·~ ~· . ·-r---·.
I ........ , ..................... ,, ... !-' .... ''
NSTAR Electric Company (Mo, Da, Yr) End of 2015104
(2) FA "".""" ., ... "" I I
OTHER fORY I I t254)
1. Report below the particulars (details) called for concerning other regulatory liabilities, including rate order docket number, if applicable. ,2. Minor items (5% of the Balance in Account 254 at end of period, or amounts less than $100,000 which ever is less), may be grouped by classes. 3. For Regulatory Liabilities being amortized, show period of amortization.
Balance at DEBITS Balance at End Line Description and Purpose of of Current of Current No. Other Regulatory Liabilities
Quarter/Year ~~~w~~ Amount Credits
Quarter/Year
(a) (b) (d) (e) (I)
Income I r(ASC740) 4,015,556 283 766,827 3,248,72'
2
31 AFII Jon I 4,435,570 407.4 138,0" 1,372,151 5,669,699
4 1 work in progress
5
6 MBTA Contract 1,278,24' 1.278,241
7
Bllongterm
SllMDPU 11-05,_11:06,11-07)
_10 ITh'' o[l• do dh HOCO"erv
11 ofoosts i l with. I
12 >in 1the
13 'Green 1
14 Act. 3,178,777 182.3 3,178,777
15 -
16 I In 'with MDPU 96-23, MDPU 06-40,
17 <« ·: is allowed to
18 I 'Items:
19
20 Transltlon I 1 Edison
21 Company: (MDPU 96-23)
22 I Thiso i 'betlveen. 23 I cosls incurred related to· lCharge
24 I and 1he amounts actually billed to· 2,750,926 182.3 2,750,926
25
26
27 I 197-111)
28 t captures the '
_29 costs incurred i
_30 and the I il 11,395,071 182.3 11,395,071
31
32 I Transition , Ill , Electric
33 lli9hl Company: 111)
34 I Thiso i 'between
35 I related to the transition charge
36 . and 1he amounts actually billed to , otomo.< 688,439 431 1,000 105,478 792,917
37
38 CPSl Costs, 1,906,640 1,906,640
39
40 Deferred8mart Grid PU 10·_163) 581,45S _581,455
41 TOTAL 26,464,339~ """f'' <,?A3,971 13,477,689
FERC FORM NO. 113-Q (REV 02-04) Page 278

,,.---,
1.
(
End of 2015/04
1 :~,~;;;, -,~; ~~h;-,[. generally apply to the annual pages. Do not report quarterly data in columns (c), (e), (f), and {g). UnbiJJed revenues and MWH r r il revenues need not be reported separately as required in the annual version of these pages. 2. Report below operating revenues for each prescribed account, and manufactured gas revenues in total. 3. Report number of customers, columns {f) and {g), on the basis of meters, in addition to the number of flat rate accounts; except that where separate meter readings are added for billing purposes, one customer should be counted for each group of meters added. The -average number of customers means the average of twelve figures at the close of each month.
If increases or decreases from previous period (columns (c),(e), and (g)), are not derived from previously reported figures, explain any inconsistencies in a footnote. Disclose amounts of $250,000 or greater in a footnote for accounts 451, 456, and 457 .2.
Title of Account
FERC FORM N0.1/3-Q (REV. 12-05) Page 300

i l .l
I ':]
-~
!
NSTAR Electric Company Original (Mo. Da, Yr)
II End of 2015/Q4
industrial Sales, Account 442, may be classified according to the basis of classification (Small or Commercial, and Large or Industrial) regularly used by the basis of classification is not generally greater than 1000 Kw of demand. (See Account 442 of the Uniform System of Accounts. Explain basis of classification
in a footnote.) 7. See pages 108-109, Important Changes During Period, for important new territory added and Important rate increase or decreases.
r- a. For lines 2,4,5,and 6, see Page 304 for amounts relating to unbi!Jed revenue by accounts. ( 9. Include unmetered sales. Provide details of such Sales in a footnote.
( Line 12, column (b) includes $
Line 12, column (d) includes
FERC FORM N0.1/3-Q (REV. 12-05)
-277,001
-75,392
of unbilled revenues.
MWH relating to unbilled revenues
Page 301

(
Name of Respondent This Report is: Date of Report Year/Period of Report (1) t<;An Original (Mo, Da, Yr)
NSTAR Electric Company (2) A Resubmission II 2015104 FOOTNOTE DATA
/Schedule Page: 300 Line No.: 4 Column: b Commercial @chedule Page: 300 Line No.: 5 Column:b Industrial @chedule Page: 300 Line No.: 10 Column:b Total Revenues derived from retail customers include a {$277,001) change in unbilled revenues for the year 2015. See page 304 for details of change in unbilled revenues by customer class. /Schedule Page: 300 Line No.: 10 Column: c Total Revenues derived from retail customers include a ($11,627,000) change in unbilled revenues for the year 2014. JSchedule Page: 300 Line No.: 10 Column: d Instruction 9 Unmetered Sales (MWH)
Street Lighting 31,789
The total "Megawatt Hours Sold" to NSTAR Electric retail customers represents the delivery of energy to all distribution customers including energy for those customers who have chosen third party suppliers. In addition, it includes (75,392} MWH related to a change in unbilled revenue for 2015. · /Schedule Page: 300 Line No.: 10 Column: e Instruction 9 Unmetered Sales (MWH)
Street Lighting 116,834
The total "Megawatt Hours Sold" to NSTAR Electric retail customers represents the delivery of energy to all distribution customers including energy for those customers who have chose third party suppliers. In addition, it includes {26,790) MWH related to a change in unbilled revenue for 2014. /Schedule Page: 300 Line No.: 19 Column:b Associated company rents Pole att-achments rent Wireless and Substation rents Wireless and ROW rents - transmission Total
$ 4,217,874 1,949,214 1,347,418 3,238,175
$10,752,681 /Schedule Page: 300 Line No.: 21 Column: b Energy Efficiency revenue META distribution facilities MATEP distribution CPSL programs ~assport distribution facilities PAM carrying charge Enhanced billing & metering services CIAC adder Net metering revenue Belmont support revenue Service quality performance Return check fee Account reactivation Other revenue Total
fee
Information on Formula Rates:
Page 106 Jines 10 and 13
I FERC FORM NO. 1 (ED. 12-87)
$71,560,306 2,263,545 1,383,383
24,763,741 2,561,651 1,848,998
560,769 2,405,480
15,792,809 486,058
(1,006,517) 365,037 280,660 421,196
$123,687' 116
Terms stipulated per contract.
Page 450.1

!( !
I '~ '
l 'j
l I
Name of Respondent
NSTAR Electric Company
/Schedule Page: 300 Line No.: 22 Column: b Refer to Pages 328-330 for detail.
Information on Formula Rates:
Page 106 lines 10, 13, 23, 26, 26, 30, 35
Page 106.1 lines 1, 8, 15, 20, 27,34
Page 1 06.2 lines 1, 5
IFERC FORM N0.1 (ED. 12-87)
Th.is Report is: Date of Report Year/Period of Report (1) 2S An Original (Mo, Da, Yr) (2) A Resubmission II 2015/04
FOOTNOTE DATA
Terms stipulated per contract.
Terms stipulated per contract.
Terms stipulated per contract.
Page 450.2

1 Name of gr ~~~~;ig,in~!ooiv•• ~~~ 0~~~~ort io;~~~~ NSTAR Electric Company End of
SAL•:; =L lY KA I 'SC:HEOULES
1. Report below for each rate schedule in effect during the year the MWH of electricity sold, revenue, average number of customer, average Kwh per customer, and average revenue per Kwh, excluding date for Sales tor Resale which is reported on Pages 310-311. 2. Provide a subheading and total for each prescribed operating revenue account in the sequence followed in "Electric Operating Revenues," Page 300-JOI. If the sales under any rate schedule are classified in more than one revenue account, List the rate schedule and sales data under each . applicable revenue account subheading. 3. Where the same customers are served under more than one rate schedule in the same revenue account classification (such as a general residen·aar schedule and an off peak water heating schedule), the entries in column (d) for the special schedule should denote the duplication in number of reported customers. 4. The average number of customers should be the number of bills rendered during the year divided by the number of billing periods during the year (~2 if all billings are made monthly). 5. For any rate schedule having a fuel adjustment clause state in a footnote the estimated additional revenue billed pursuant thereto. 6. Report amount of unbilled revenue as of end of year for each applicable revenue account subheading.
Ter= !Line Numoer ano 1 ;:~ or Kate
r of >_Nurn.r:er "v{fj ~010 I No. (b) (c)
,. ""'"'' . }:i':"'·-::_,;;c'i. 715,799,91< 6,605 0.199E
;,!R-21 I A«i<l.-121(3 322,141 36,108,472 5~ 5,88< 0.1121
R-3 Res. Space i 44,91' 10,15< 0.1909
R-4 Optional Time of Use-123F 2,06< A?? ORO 11E _17,77E 0.2051
S-2 Street lighting ' 1F 461 31,5?; 51 ,22< 0.0685
E R-1 i z; 263,598 6,445 0.1619
IR-2. i 172,424 2(,804 6,201 0.121'
81 R-3 Res. Space I 31,213,89~ 24,24' 9,650 0.1334
_9 ; Assist. Sp. 30,61: 2,61' 11,71 0.1021
10 IR-51 I I Water 10,47; 1' 6,21E 1 ,68E 0.1454
1 R-6 Opt. J<:s· TOU-325F 36~ . 75,897 3E ~1 0.2057
1< S-1 Streetlighting 54( 147,916 1,07< 504 0.2739
11 R-1 i 17fi n?F 37,651,962 40,547 _4,317 0.2151
14 IR-2 i 9,94E 2,293 4,338 0.1239
1E I R-3 Res. Space I 12,34€ 2,772,157 1,649 7,488 0.2245
( 1E . Assist. Sp Heat -223H 1,266 173,53E 176 7,193 0.1371
1 I R-5 Optional res. TC 26 5,25E 13,00( 0.202<
18 i R-6 Opt. Res. Sp. 1: 2,987 13,00( 0.2298
19 S-1 St lighting ZOE 1,00( 0.2050
_20 'Change inunbilled -25,60E -878,00C 0.0343
<I IO!al I 6,687,471 7,52E 1,013,07: 6,601 0.1813
2<
21 G-1 General 511,97' 9; 71,703 7,140 0.1910
24 G-2 General 131F 7 ""'·"n1 350,119,421 29,086 ~33 0.1319
2E I G-3 Lg General : I 348 7,381,101 0.0529
2€ IR-1 17,58C ? AAA nRf 2,663 ~60< 0.139(
27 I R-3 Res. Space 4,155 n 54,671 0.1572
28 I S-1 Streetlighting 57 9,79E _.:" ~75C 0.1719
29 'S-2 Street lighting 4< 4,889
30 I S-3 Outdoor lighting 71 11 ,27E 1E _4,733 0.1588
31 'T-1 Optional Time of Use-133F 161 28,672 34 4,941 0.1707
3< T-2 Time of Use-134F 3,921,57! ,784 2,842 1,379,866 0.0816
31 SG3 14,24E 721,859 0.0507
101,12E 101 '126,000 0.0233
i 42,081 880,090 00~
3E G-1 I 1 ,015,181 111,481,034 44,059 23,041 0.109E
37 G-2 Med. General i 441,434 ?0 RR7 RO! 419 1 n!" fiA' 0.067~ ' 38 I G-3 Lg. General Service- 332F 1 49 4,787,85; 0.0682
39 1 G-4 General 1,173 75,44( 15 78,200 0.0643
40 IG-5 I space I 14,543 1 541 440 82~ ~3 a,~
41 TOTAL Billed 21, 1,187,191 17,79~ 0.117<
42 Total Unbilled > lnstr. 6) -75,39< -277,001 ( 0.0~ 43 TOTAL 1,187,191 17,73E 0.1180
FERC FORM NO.1 (ED. '12-95) Page 304

NSTAR Electric Company I (1) [!jAn Original (Mo, Da, Yr) I End of 2015104 (2) EJA Resubmission I I
SALES OF ELECTRICITY BY RATE SC HEDULES
1. Report below for each rate schedule in effect during the year the MWH of. electricity sold, revenue, average number of customer, average Kwh per customer, and average revenue per Kwh, excluding date for Sales for Resale which is reported on Pages 310-311. 2. Provide a subheading and total for each prescribed operating revenue account in the sequence followed in "Electric Operating Revenues," Page
( . 300-301. If the sales under any rate schedule are classified in more than one revenue account, List the rate schedule and sales data under each applicable revenue account subheading. 3. Where the same customers are seJVed under more than one rate schedule in the same revenue account classification (such as a general residential
" schedule and an off peak water heating schedule), the entries in column (d) for the special schedule should denote the duplication in number of reported customers. 4. The average number of customers should be the numb~r of bills rendered during the year divided by the number of billing periods during the year (12
" if all billings are made monthly). 5. For any rate schedule having a fuel adjustment clause state in a footnote the estimated additional revenue billed pursuant thereto. 6. Report amount of unbilled revenue as of end of year for each applicable revenue account subheading.
Line Numoer ana Iitle o "a'e scneaure '"'"" ~O<u Kevenue A~er~~i)~'l_Umuer P~~~~~~ro~:r "l@l~'!fofd"r No. (a) (b) (c)
ofC aomers e) m
1 G-6 All Electric School- 335F 4,437 220,170 7 633,857 0.0496
2 G-7 General TOU- 336F 46,187 3,906,523 466 99,114 0.0846
3 R-1 Residence - 320F 330 52,450 78 4,231 0.1589
4 R-5 Water Htg. - 324F 222 27,458 80 2,775 0.1237
5 S-1 Street lighting 5,552 1,054,049 2,967 1,871 0.1899
6 CON- MIT MAG Lab 1,711 241,892 1 1,711,000 0.1414
7 G-O General Non-demand-230G 38,881 6,445,241 5,136 7,570 0.1658
8 G-1-Genera/ Service-231G 208,049 25,320,186 2,03E 102,235 0.1217
9 G-2 General Service - 232G 576,287 40,404,953 429 1,343,326 0.0701
10 G-3 General Service-233G 522,414 20,732,246 65 8,037,138 0.0397
11 G-4 General TOU - 234G 5,405 295,667 32 168,906 0.0547
12 G-5 Commcial Sp. Htg.- 235G 8,532 763,530 60 142,200 0.0895
13 MS-1 Main! Servi13.8KV-2381 8,865 248,400 1 8,865,000 0.0280
14 SB-1 Stan by Svce/13.8KV-2371 28,778 1,016,414 1 28,778,000 0.0353
15 SB-G3 CAMB 26,885 1,973,594 1 26,885,000 0.0734
16 SS1 Supp Servi13.8KV-239G 46,466 1,907,844 1 46,466,000 0.0411
( 17 R-1 Residence-220G 3 803 1 3,000 0.2677
18 S-1 Streetlighting 401 84,894 131 3,061 0.2117
19 S-2 Street lighting 72 5,397 1 72,000 0.0750
20 Change in unbilled -45,992 622,000 -0.0135
21 Total Commercial 13,025,724 1,175,123,892 163,655 79,593 0.0902
22
23 G-1 General Service-130F 1,431 194,939 169 8,467 0.1362
24 G-2 General Service-131F 50,708 8,118,132 524 96,771 0.1601
25 G-3 General Servcie- 132F 759,847 41,801,347 129 5,890,287 0.0550
26 H2-General Service 607 56,538 1 607,000 0.0931
27 T -2 Time of Use-134F 123,516 13,825,692 128 964,969 0.1119
28 CON- Canal 31,135 3,855,743 1 31,135,000 0.1238
29 G-1 General Service -330F 10,270 1,358,567 117 87,778 0.1323
30 G-2 General Service-331 F 53,706 4,351,687 63 852,476 0.0810
31 G-3 General Service - 332F 194,342 9,804,103 38 5,114,263 0.0504
32 G-4 General Power-333F 1,237 190,415 13 95,154 0.1539
33 G-7 Optional General TOU-336F 153 21,354 5 30,600 0.1396
34 S-1 Street lighting 32 6,676 10 3,200 0.2086
35 G-0 General Non-Demand-230G 30 6,065 5 6,000 0.2022
36 G-2 Generai-232G 2,688 237,997 5 537,600 0.0885
37 G-3 General- 233G 22,016 795,708 6 3,669,333 0.0361
38 Change in unbilled -3,795 -21 ,001 0.0055
'39 Total Industrial 1,247,923 84,603,962 1,214 1,027,943 0.0678
40
41 TOTAL Billed 21,130,67 2,483,833,246 1 '187, 19 17,79 0.117 42 Total Unbilled Rev.(See lnstr. 6) -75,39 -277,001 c 0.003 '43 TOTAL 21,055,28 2,483,556,245 1,187,19t 17,73 0.118
FERC FORM NO.1 (ED. 12-95) Page 304.1

. Name of :'ooeuuuo."
gr ~~~r ~;ig_inal 1
" ·-·,------ Date of Report Year/Period of Report
NSTAR Electric Company (Mo, Da, Yr)
End of 20151Q4 I I
SALES C EL I jy KAI
1. Report below for each rate schedule in effect during the year the MWH of electricity sold, revenue, average number of customer, average Kwh per customer, and average revenue per Kwh, excluding date for Sales for Resale which is reported on Pages 310-311.
( 2. Provide a subheading and total for each prescribed operating revenue account in the sequence followed in "Electric Operating Revenues," Page 300-301. If the sales under any rate schedule are classified in more than one revenue account, List the rate schedule and sales data under each applicable revenue account subheading. 3. Where the same customers are served under more than one rate s~hedule in the same revenue account classification (such as a gerleral.residential
and an off peak water heating schedule), the entries in column (d) for the special schedule should denote the duplication in number of reported customers. 4. The average number of customers should be the number of bills rendered during the year divided by the number of billing periods during the year (12 if all billings are made monthly). ' 5. For any rate schedule having a fuel adjustment clause state in a footnote the estimated additional revenue billed pursuant thereto. 6. Report amount of unbilled revenue as of end of year for each applicable revenue account subheading.
~:e ~<umoer ana , ;:~ u• ""'" IVIV~:)i>Oia ~r ~~~ ~ (c)
S-1 Street 6,68( '
101 66, 13E 0.3005
S-2 Street Lighting 60,22< 4"""' 4,78< 12,591 0.0802
1 S-3 Outdoor 13,601 2,361,881 2,95E 4,601 0.1737
41 G-1 General 1,318 ?On ORf 507 2,600 _ 0,1_5_25
I S-1 Outdoor I i 3,417 5g6 5,733 0.2507
S-2 Street Light Gust 1 4,002 660, 17E 32 125,061 0.1650
G-O General! 1,24< 167,951 22< 5,60' 0.135(
t G-1 General Service- 231G 59< 67,531 11 59,20( 0.1141
S S-1 Street i 657 150,988 E 82, 12< 0.2298
1C I S2 Street Light Gust 0 2,421 191,920 31 63,895 0.0790
11 I Total Street Lighting 94,161 11 500 RR' g,25< 10,17i 0.1221
12
1:
1<
1:
( 11 .
17
11
1S
20
21
2<
21
2! .
2E
_2E 27
28
29
3C
31
32
31
3<
3E
3E
37
3E
3S
4C
4' TOTAL Billed 1,187,191 17,7m 0.111'
42 Total Unbilled • ' lnstr. 6) -75,39; -277,001 0.003i
43 TOTAL 21 1,187,191 17,73! 0.118(
FERC FORM NO.1 (ED.12-95) Page 304.2

(
Name of Respondent This Report is: Date of Report Year/Period of Report (1) X An Original (Mo, Da, Yr)
NSTAR Electric Company (2) A Resubmission I I 2015104
FOOTNOTE DATA
/Schedule Page: 304 Line No.: 1 Column: a MWh Sold (Column b) represents all energy deliveries to customers. Revenues{Column c) include delivery revenues as well as energy revenues for those customers who receive their energy supply from NSTAR via Basic Service or NSTAR Green. Since revenues do not include the supply cost to customers of competitive energy suppliers, revenue per KWh sold (Column f) is not necessarily representative of the average customer bill.
I FERC FORM NO. 1 (ED. 12-87) Page 450.1

Name of Respondent This 00ort Is: Date of Report Year/Period of Report
NSTAR Electric Company (1) X An Original (Mo, Da, Yr)
End of 2015104 (2) [jA Resubmission I I
SALES FOR RESALE (Account 447)
1. Report all sales for resale (i.e., sales to purchasers other than ultimate consumers) transacted on a settlement basis other than power exchanges during the year. Do not report exchanges of electricity (i.e., transactions involving a balancing of debits and credits
( for energy, capacity, etc.) and any setllements for imbalanced exchanges on this schedule. Power exchanges must be reported on the Purchased Power schedule (Page 326-327). 2. Enter the name of the purchaser in column (a). Do note abbreviate or truncate the name or use acronyms. Explain in a footnote any ownership interest or affiliation the respondent has with the purchaser. . 3. In column (b), enter a Statistical Classification Code based on the original contractual terms and conditions of the service as follows: RQ -for requirements service. Requirements service is service which the supplier plans to provide on an ongoing basis (i.e., the supplier includes projected load for this service in its system resource planning). In addition, the reliability of requirements service must be the same as, or second only to, the supplier's service to its own ultimate consumers. '' LF- for tong-term service. "Long-term" means five years or Longer and "firm" means that service cannot be interrupted for economic reasons and is intended to remain reliable even under adverse conditions (e.g., the supplier must attempt to buy emergency energy from third parties to maintain deliveries of LF service). This category should not be used for Long-term firm service which meets the definition of RQ service. For all transactions identified as LF, provide in a footnote the termination date of the contract defined as the earliest date that either buyer or setter can unilaterally get out of the contract. IF- for intermediate-term firm service. The same as LF service except that ''intermediate-term" means longer than one year but Less
than five years. SF- for short-term firm service. Use this category for all firm services where the duration of each period of commitment for. service is one year or less. LU - f9r Long-term service from a designated generating unit. "Long-term" means five years or Longer. The availability and reliability of service, aside from transmission constraints, must match the availability and reliability of designated unit. IU- for intermediate-term service from a designated generating unit. The same as LU service except that "intermediate-term" means· Longer than one year but Less than five years.
Line Name of Company or Public Authority Statistical FERC Rate Avera~e Actual Demand (MW)
No. (Footnote Affiliations) Classifi- Schedule or Monthly illing r..~vera~e Average cation Tariff Number Demand (MW) Monthly NC Deman Monthly CP Demand
(a) (b) (c) (d) (e) m ( 1 ISO-NE SF 10
2
3
4
5
6
7
8
9
10
11
12
13
14
Subtotal RQ 0 0 0
Subtotal non-RQ 0 0 0
Total 0 0 0
FERC FORM NO.1 (ED. '12-90) Page 310

. ·-····- -·. ---,...-··--··· j (1)·- ·0iln original I ..... .,. ....... ,_.,,, .... 1-''-'"
I '""'"'Ill '-'I IV'-' VI I~<;>,...VIL
NSTAR Electric Company (Mo, Da, Yr) End of 2015104
(2) OA Resubmission I I SALES FOR RESALE (Account 447) (Continued)
OS -for other service. use this category only for those services which cannot be placed in the above-defined categories, such as all non-firm service regardless of the Length of the contract and service from designated units of Less than one year. Describe the nature of the service in a footnote.
( AD- for Out-of-period adjustment. Use this code for any accounting adjustments or "true-ups" tor service provided in prior reporting years. Provide an explanation in a footnote for each adjustment. 4. Group requirements RQ sales together and report them starting at line number one. After listing all RQ sales, enter "Subtotal - RQ"
• in column (a). The remaining sales may then be listed in any order. Enter "Subtotai-Non-RQ" in column (a) after this Listing. Enter 'Total" in column (a) as the Last Line of the schedule. Report subtotals and total for columns (9) through (k) 5. In Column (c), identify the FERC Rate Schedule or Tariff Number. On separate Lines, List all FERC rate schedules or tariffs under
. which service, as identified in column (b), is provided . 6. For requirements RQ sales and any type of-service involving demand charges imposed on a monthly (or Longer) basis, enter the average monthly billing demand in column (d), the average monthly non-coincident peak (NCP) demand in column (e), and the average monthly coincident peak (CP) demand in column (f). For all other types of service, enter NA in columns (d), (e) and (f). Monthly NCP demand is the maximum metered hourly (60-minute integration) demand in a month. Monthly CP demand is the metered demand during the hour (60-minute integration) in which the supplier's system reaches its monthly peale Demand reported in columns (e) and (f) must be in megawatts. Footnote any demand not stated on a megawatt basis and explain. 7. Report in column (g) the megawatt hours shown on bills rendered to the purchaser. 8. Report demand charges in column (h), energy charges in column (i), and the total of any other types of charges, including out-of-period adjustments, in column 0). Explain in a footnote all components of the amount shown in column 0). Report in column (I<) the total charge shown on bills rendered to the purchaser. 9. The data in column (g) through (k) must be subtotaled based on the RQ/Non-RQ grouping (see instruction 4), and then totaled on the Last -line of the schedule. The "Subtotal- RQ" amount in column (g) must be reported as Requirements Sales For Resale on Page 401, line 23. The "Subtotal - Non-RQ" amount in column (g) must be reported as Non-Requirements Sales For Resale on Page 401,iine 24. 10. Footnote entries as required and provide explanations following all required data.
MegaWatt Hours REVENUE Total($) Line
Sold Demand Charges Energy Charges Other Charges (h+i+j) No. ($) ($) ($)
(g) (h) 0) Q) (k)
2,801,371 127,020,411 127,020,411 1
( 2
3
4
5
6
7
8
9
10 . 11
12
13
14
0 0 0 0 0
2,801,371 0 127,020,411 0 127,020,411
2,801,371 0 127,020,411 0 '127,020,411
FERC FORM NO.1 (ED. 12-90) Page 311

(
(
FERC FORM N0.1 (ED. 12-93) Page 320

NSTAR Electric Company --·~ ~· . -~~~·· (Mo, Da, Yr) II
..................................... ,... ...... End of 2015104
c
(
FERC FORM N0.1 (ED. 12-93) Page 321

(
FERC FORIVJ NO.1 (ED. 12-93) Page 322

NSTAR Electric Company \'"'"• LJc:<, '., LUl0/{...!4 End of II
(
(
FERC FORM NO.1 (ED. 12-93) Page 323

I
\
Name of Respondent This Report is: Date of Report Year/Period of Report (1) 6An Original (Mo, Da, Yr)
NSTAR Electric Company (2) A Resubmission I I
FOOTNOTE DATA
!Schedule Page: 320 Line No.: 85 Column: b These costs are 100% internal costs. )Schedule Page: 320 Line No.: 85 Column: c These costs are 100% internal costs. [Schedule Page: 320 Line No.: 86 Column: b These costs are 100% internal costs. [Schedule Page: 320 Line No.: 86 Column: c These costs are 100% internal costs. )Schedule Page: 320 Line No.: 87 Column: b These costs are 100% internal costs. [Schedule Page: 320 Line No.: 87 Column: c These costs are 100% internal costs. [Schedule Page: 320 Line No.: 88 Column: b These costs are 100% external costs. [Schedule Page: 320 Line No.: 88 Column: c These costs are 100% external costs. !Schedule Page: 320 Line No.: 89 Column: b Internal costs and external costs are $504,385 and $35,151, respectively. !Schedule Page: 320 Line No.: 89 Column: c Internal costs and external costs are $21 1 719 and $251,507, respectively. !Schedule Page: 320 Line No.: 90 Column: c These costs are 100% internal costs. !Schedule Page: 320 Line No.: 92 Column: b These costs are 100% external costs. \Schedule Page: 320 Line No.: 92 Column: c These costs are 100% external costs. !Schedule Page: 320 Line No.: 96 Column: b Information on Formula Rates Page 106 line 4: Hydro Quebec DC Phase I Support see page 332 col g ln 5 Hydro Quebec DC Phase II Support see page 332 col g ln 6
/Schedule Page: 320 Line No.: 96 Column: c Information on Formula Rates Page 106 line 4: Hydro Quebec DC Phase I Support see page 332 col g ln 7 Hydro Quebec DC Phase II Support see page 332 col g ln 8
/Schedule Page: 320 Line No.: 187 Column: b Postretirement Benefits Other Than Pension (PBOP} Capitalized and Other Recoverable PBOP Expense [Schedule Page: 320 Line No.: 187 Column: c Postretirement Benefits Other Than Pension (PBOP} Capitalized and Other Recoverable PBOP Income /Schedule Page: 320 Line No.: 198 Column: b Information on Formula Rates Page 106.2 line 1: Amount as stipulated per contract.
\Schedule Page: 320 Line No.: 198 Column: c Information on Formula Rates Page 106.2 line 1: Amount as stipulated per contract.
/FERC FORM N0.1 (ED.12-87) Page 450.1
$ 0 311, 000
$311,000
$(5,000,000) 3,052,000
$(1,948,000)
20151Q4

BLANK PAGE
(

I \
(
N;:~me of Respondent
NSTAR Electric Company /
This ~art Is: (1) l!jAn Original (2) OA Resubmission I
PURCHASED POWER (Accou~t 555) (Including power excflanges)
Date of Report (Mo, Da, Yr) I I
Year/Period of Report
End of 2015104
1. Report all power purchases made during the year. Also report exchanges of electricity (i.e., transactions involving a balancing of debits and credits for energy, capacity, etc.) and any settlements for imbalanced exchanges. · 2. Enter the name of the seller or other party in an exchange transaction in column (a). Do not abbreviate or truncate the name or use acronyms. Explain in a footnote any ownership interest or affiliation the respondent has with the seller. 3. In column (b), enter a Statistical Classification Code based on the original contractual terms and conditions of the service as follo~s:
RQ- for requirements service. Requirements service is service which the supplier plans to provide on an ongoing basis (i.e., the supplier includes projects load for this service in its system resource planning). In addition, the reliability of requirement service must be the same as, or second only to, the supplier's service to its own ultimate consumers.
LF- for long-term firm service. 11Long-term" means five years or longer and "firm" means that service cannot be interrupted for economic reasons and is intended to remain reliable even under adverse conditions (e.g., the supplier must attempt to buy emergency energy from third parties to maintain deliveries of LF service). This category shciuld not be used for long-term firm· service firm service which meets the definition of RQ service. For all transaction identified as LF, provide in a footnote the termination date of the contract defined as the earliest date that either buyer or seller can unilaterally get out of the contract.
IF- for intermediate-term firm service. The same as LF service expect that "interm"ediate-term" means longer than one year but less than five years.
SF- for short-term service. Use this category for all firm services, where the duration of each period of commitment for service is one year or less.
LU- for long-term service from a designated generating unit. "Long-term" means five years or longer. The availability and reliability of service, aside from transmission constraints, must match the availability and reliability of the designated unit
IU -for intermediate-term service from a designated generating unit. The same as LU service expect that "intermediate-term" means longer than one year but less than five years.
EX- For exchanges of electricity. Use this category for transactions involving a balancing of debits and credits for energy, capacity, etc. and any settlements for imbalanced exchanges.
OS- for other service. Use this category only for those services which cannot be placed in the ·above-defined categories, such as aH non-firm service regardless of the Length of the contract and service from designated units of Less than one year. Describe the nature of the service in a footnote for each adjustment.
Line No.
Name of Company or Public Authority
{Footnote Affiliations)
(a)
1 Associated Utilities:
2 yy-e~t.ern __ r0aSsl?;Chy·s~.t~.-~.~~·c.~rjc·.90mp_any_{i:'[i
4
5 Nonassociated Utilities/Companies:
6 Competitive Suppliers
7 Enel Green Power North America, Inc.
8 Massachusetts Bay
9 NextEra Energy Power Marketing, LTD
10 NextEra Energy Power Marketing, LTD
11 NextEra Energy Power Marketing, LTD
12 SEMASS Partnership
13 SEMASS Partnership
14 Vermont Yankee Nuclear Power Corp.
Total
FERC FORM NO.1 (ED. 12-90)
Statistical Classification
(b)
OS
Ll)
LU
Li.J·· ·.:Di.:-·3 LU 12
FERCRate Schedule or
Tariff Number (c)
Page 326.
9.1
Average Monthly Billing Demand (MW)
(d)
22.3
130.8
25.8
20.0
47.3
23.9
Actual Demand (MW) Average Average
Monthly NCP Deman Monthly CP Demand
13.4
7.2
130.8
25.8
20.0
57.2
26.0
(e) (f)
.

NSTAR Electric Company I c(1) IKJAn Original
I
(Mo, Da, Yr) _I
End of 2015/04 (2) tJ A Resubmission I I
PURCHA\j~!:l.!;;~~v,E0~~,ccou~t 55~A) (~ontinued) lncludmg po er exc anges
AD -tor out-of-period adjustment. Use this code for any accounting adjustments or "true-ups" for service provided in prior reporting years. Provide an explanation in a footnote for each adjUstment.
( 4. In column (c), identify the FERC Rate Schedule Number or Tariff, or, for non-FERC jurisdictional sellers, include an appropriate designation for the contract. On separate Jines, list all FERC rate schedules, tariffs or contract designations under which seruice, as
• identified in column (b), is provided. 5. For requirements RQ purchase;; and any type of service involving demand charges imposed on a monnthly {or longer) basis, enter the monthly average billing demand in column {d), the average monthly non-coincident peak (NCP) demand in column (e), and the average monthly coincident peak (CP) demand in column m. For all other types of service, enter NA in columns (d), (e) and (~.Monthly - NCP demand is the maximum metered hourly (60-minute integration) demand in a month. Monthly CP demand is the metered demand during the hour (60-minute integration) in which the supplier's system reaches Its monthly peak. Demand reported in columns (e) and (~ must be in megawatts. Footnote any demand not stated on a megawatt basis and explain. 6. Report in column (g) the megawatthours shown on bills rendered to the respondent. Report in columns (h) and (i) the megawatthours of power exchanges received and delivered, used as the basis for settlement. Do not report net exchange. 7. Report demand charges in column (j), energy charges in column (k), and the total of any other types of charges, including out-of-period adjustments, in column (1). Explain in a footnote all components of the amount shown in column (1). Report in column (m) the total charge shown on bills received as settlement by the respondent. For power exchanges, report in column (m) the settlement amount for the net receipt of energy. If more energy was delivered than received, enter a negative amount. If the settlement amount (I) include credits or charges other than incremental generation expenses, or (2) excludes certain credits or charges covered by the agreement, provide an explanatory footnote. 8. The data in column (g) through (m) must be totalled on the last line of the schedule. The total amount in column (g) must be reported as Purchases on Page 401, line 10. The total amount in column (h) must be reported as Exchange Received on Page 401, line 12. The total amount in column (i) must be reported as Exchange Delivered on Page 401, line 13. 9. Footnote entries as requir~d and provide explanations following all required data.
(
MegaWatt Hours POWER EXCHANGES COST/SETTLEMENT OF POWER Line
Purchased MegaWatt Hours MegaWatt Hours Demand Charges Energy Charges Other Charges Total (j+k+l) No. Received Delivered ($) \~l \fl of Setilement ($)
(g) (h) (i) (j) (m)
1
92,87( 92,870 2
-585,79 -585,798 3
4
5
13,912,63 6
68,49 6,192,62 6,192,623 7
79 2,435,819 295,49 -781,811 1,949,507 8
1,145,25 49,892,03 49,892,033 9
226,07 9,995,49 9,995,498 10
175,20 7,324,33 7,324,332 11
398,00 7,960,059 21,147,22 29,107,286 12
190,43 5,474,374 5,474,374 13
-39,980 -39,980 14
24,983,307 10,395,878 1,113,715,546 -24,347,488 1 ,099,763,93E
FERC FORM N0.1 (ED.12-90) Page 327

Name of Respondent T.~is Report Is: Date of Report Year/Period of Report
NSTAR Electric Company (1) IKJAn Original (Mo, Da, Yr)
End of 20151Q4 (2) tJ A Resubmission I I
PU~CHASED POWER hAccou7t 5 5) ( ncludmg power exc anges
1. Report all power purchases made during the year. Also report exchanges of electricity (i.e., transactions involving a balancing of debits and credits for energy·, capacity, etc.) and any settlements for imbalanced exchanges.
( 2. Enter the name of the seller or other party in an exchange transaction in column (a). Do not abbreviate or truncate the name or use acronyms. Explain in a footnote any ownership interest or affiliation the respondent has with the seller. 3. In column (b), enter a Statistical Classification Code based on the original contractual terms and conditions of the service as follows:
RQ ~for requirements service. Requirements service is service which the supplier plans to provide on an ongoing basis (i.e., the supplier includes projects load for this service in its system resource planning). In addition, the reliability of requirement service must_ be the same as, or second only to, the supplier's service to its own ultimate consumers.
LF- for long-term firm service. "Long-term" means five years or longer and "firm" means that service cannot be interrupted for economic reasons and is intended to remain reliable even under adverse condition's (e.g., the supplier must attempt to buy emergency energy from third parties to maintain deliveries of LF service). This category should not be used for long-term firm service firm service which meets the definition of RQ service. For all transaction identified as LF, provide in a footnote the termination date of the contract defined as the earliest date that either buyer or seller can unilaterally get out of the contract.
IF- for intermediate-term firm service. The same as LF service expect that "intermediate-term" means longer than one year but less than five years.
SF- for short-term service. Use this category for all firm services, where the duration of each period of commitment for service is one year or less.
LU- for long-term service from a designated generating unit. "Long-term" means five years or longer. The availability and reliability of service, aside from transmission constraints, must match the availability and reliability of the designated unit.
IU -for intermediate-term service from a designated generating unit. The same as LU service expect that "intermediate-term" means longer than one year but less than five years.
EX- For exchanges of electricity. Use this category for transactions involving a balancing of debits and credits for energy, capacity, etc_ and any settlements for imbalanced exchanges.
( OS -for other service. Use this category only for those services which cannot be placed in the above-defined categories, such as all non-firm service regardless of the Length of the contract and service from designated units of Less than one year. Describe the nature of the service in a footnote for each adjustment.
.
Line Name of Company or Public Authority Statistical FERC Rate Average Actual Demand (MW)
No. (Footnote Affiliations) Classifi- Schedule or Monthly Billing Average Average cation Tariff Number Demand (MW) Monthly NCP Deman Monthly CP Demand
(a) (b) (c) (d) (e) (f)
1 Atlantic Renewables Project, LLC LU 1
2 Atlantic Renewables Project, LLC OS . . -~·;
3 Blue Sky East, LLC LU 1
4 Blue Sky East, LLC qs t,:·, 5 Citigroup Energy, Inc. SF 1
6 Direct Energy Business Marketing, LLC SF 1
7 DTE Energy Trading, Inc. SF 1 · ..
8 Evergreen Wind Power IJ, LLC LU 1
9 Evergreen Wind Power II, LLC OS .. -\·"· --;···
10 Exelon Generation Corp, LLC SF 11
11 GDF Suez Energy Marketing NA Inc. SF 3
12 Groton Wind, LLC LU 1
13 Groton Wind, LLC OS'· '< 14 National Grid os·, :: .. :
Total
FERC FORM NO.1 (ED. 12-90) Page 326.1

NSTAR Electric Company I (1) !!JAn Original I (Mo, Da, Yr) I End of 2015104 (2) OA Resubmission I I
~UKGHA~~~ PPWEFUAccouRt ~gg§) (Gontinued) ( nc udmg po er exc ange )
AD -for out-of-period adjustment. Use this code for any accounting adjustments or "true-ups" for service provided in prior reporting years. Provide an explanation in a footnote for each adjustment.
4. In column (c), identify the FERC Rate Schedule Number or Tariff, or, for non-FERC jurisdictional sellers, include an appropriate designation for the contract. On separate lines, list all FERC rate schedules, tariffs or contract designation_s under which service,-as
. identified in column (b), is provided . 5. For requirements RQ purchases and any type of service involving demand charges imposed on a monnthly (or longer) basis, enter the monthly average billing demand in column {d), the average monthly non-coincident peak (NCP) demand in column (e), and the
.. average monthly coincident peak (CP) demand in column (n. For all other types of service, enter NA in columns (d), (e) and (f). Monthly NCP demand is the maximum metered hourly (60'minute integration) demand in a month. Monthly CP demand is the metered demand during the hour (60-minute integration) in which the suppliers system reaches its monthly peak. Demand reported in columns (e) and (f) must be in megawatts. Footnote any demand not stated on a megawatt basis and explain. 6. Report in column (g) the megawatthours shown on bills rendered to the respondent. Report in columns (h) and (i) the megawatthours of power exchanges received and delivered, used as the basis for settlement. Do not report net exchange. 7. Report demand charges in column 0), energy charges in column (k), and the total of any other types of charges, including out-of-period adjustments, in column {1). Explain in· a footnote all components of the amount shown in column (1). Report in column (m) the total charge shown on bills received as settlement by the respondent. For power exchanges, report in column (m) the settlement amount for the net receipt of energy. If more energy was delivered than received, enter a negative amount. If the settlement amount (I) include credits or charges other than incremental generation expenses, or (2) excludes certain credits or charges covered by the agreement, provide an explanatory footnote. 8. The data in column (g) through (m) must be totalled on the last line of the schedule. The total amount in column (g) must be reported as Purchases on Page 401, line 10. The total amount in column (h) must be reported as Exchange Received on Page 401, line 12. The total amount in column (i) must be reported as Exchange Delivered on Page 401, line 13. 9. Footnote entries as required and provide explanations following all required data.
(
MegaWatt Hours POWER EXCHANGES COSTISETILEMENT OF POWER
Line Purchased MegaWatt Hours MegaWatt Hours Demand Charges Energy Charges Other Charges Total Q+k+l) No.
Received Delivered ($1 ($l ($) of Settlement ($) (g) (h) (i) 0 (k (I) (m)
109,85 7,454,82 7,454.822 1
1,306,22 1.306,224 2
109,771 7,794,14 7,794.143 3
1,059,93 1,059,934 4
7,43 556,73 556,737 5
1,92 204,65 204,652 6
189,10 16,590,22 16,590,228 7
31,781 1,875,10 1,875,108 8
941,27 941,274 9
1,999,98 207,341,09 207,341,099 10
628,35 74,780,48~ 74,780,489 11
114,71 5,925,00E 5,925,006 12
3,364,32[ 3,364,320 13
1,33 367,37E 367,378 14
24,983,307 10.395,878 1 '113, 715,546 -24,347,488 1,099,763,93
FERC FORM NO. 1 (ED. 12-90) Page 327.1

Name of Respondent This fg]ort Is: Date of Report Year/Period of Report
NSTAR Electric Company (1) X An Original (Mo, Da, Yr)
End of 2015/04 (2) 0 A Resubmission II
PURCHASED POWER hAccou~t 555) (Including power exc anges
1. Report all power purchases made during the year. Also report exchanges of electricity (i.e., transactions involving a balancing of debits and credits for energy, capacity, etc.) and any settlements for imbalanced exchanges. 2. Enter the name of the seller or other party in an exchange transaction in column (a). Do not abbreviate or truncate the name or use acronyms. Explain in a footnote any ownership interest or affiliation the respondent has with the seller. 3. In column (b), enter a Statistical Classification Code based on the original contractual terms and conditions of the service as follmys:
RQ -for requirements service. Requirements service is service which the supplier plans to provide on an ongoing basis (i.e., the supplier includes projects load for this service in its system resource planning). In addition, the reliability of requirement service must~ be the same as, or second only to, the supplier's service to its own ultimate consumers.
LF- for long-term firm service. "Long-term" means five years or longer and "firm" means that service cannot be interrupted for economic reasons and is intended to remain reliable even under adverse conditions (e.g., the supplier must attempt to buy emergency energy from third parties to maintain deliveries of LF service). This category should not be used for long-term firm service firm service which meets the definition of RQ service. For all transaction identified as LF, provide in a footnote the termination date of the contract defined as the earliest date that either buyer or seller can unilaterally get out of the contract.
IF- for intermediate-term firm service. The same as LF service expect that "intermediate-term" meclns longer than one year but less than five years.
SF- for short-term service. Use this category for all firm services, where the duration of each period of commitment for service is one year or Jess.
LU -for long-term service from a designated generating unit. "Lo~g-term" means five years or longer. The availability and reliability of service, aside from transmission constraints, must match the availability and reliability of the designated unit.
IU- for intermediate-term service from a designated generating unit. The same as LU service expect that "intermediate-term" m.eans longer than one year but less than five years.
EX- For exchanges of electricity. Use this category for transactions involving a balancing of debits and credits for ~nergy, capacity, etc. and any settlements for imbalanced exchanges.
( OS- for other service. Use this category only for those services which cannot be placed in the above-defined categories, such as all non-firm service regardless of the Length of the contract and service from designated units of Less than one year. Describe the nature of the service in a footnote for each adjustment.
Line Name of Company or Public Authority Statistical FERC Rate Average Actual Demand (MW)
No. (Footnote Affiliations) Classifi~ Schedule or Monthly Billing Average Average cation Tariff Number Demand (MW) Monthly NCP De_man Monthly CP Demand
(a) (b) (c) (d) (e) CD 1 New England Wind, LLC LlJ 1
2 New England. Wind, LLC OS
3 NextEra Energy Power Marketing, lTD SF 1
4 TransCanada Power Marketing, LTD SF 1
5 TrarisCanada PowerMarJ(eting, LTD LlJ 1
6 TransCanada Power Marketing, l TO qs;o.:···· 7
.
8 Municipals:
9 Middleborough Gas and Electric Depart. q~:,· ·.:: .·: 10 Reading Municipal Light Department <.!.~-< •••. ·:•:·· 11
12 Other Sellers:
13 Default Service Deferral ?~·;: . 14 Default Service Deferral IAr;!):•.·.•:
Total .
FERC FORM NO.1 (ED. "/2-90) Page 326.2

I'IISTAR Electric Company I (1) !2U An ungmaJ I liVIO, Ua, T I) I End of 2015/Q4 (2) OA Resubmission I I
PURCHA?E~ POWER(Accou~t 55~~) (Contmuea) (Inc udmg power exc ange
AD -for out-of-period adjustment. Use this code for any accounting adjustments or "true-ups" for service provided in prior reporting years. Provide an explanation in a footnote for each adjustment.
( 4. In column (c), identify the FERC Rate Schedule Number or Tariff, or, for non-FERC jurisdictional sellers, include an appropriate designation for the contract. On separate lines, list all FERC rate schedules, tariffs or contract designations under which service, as
. identified in column (b), is provided. 5. For requirements RQ purchases and any type of service involving demand charges imposed on a monnthly (or longer) basis, enter the monthly average billing demand in column (d), the average monthly non-coincident peak (NCP) demand in column (e), and the average monthly coincident peak (CP) demand in column (f). For all other types of service, enter NA in columns (d), (e) and (f). Monthly
- NCP demand is the maximum metered hourly (60-minute integration) demand in a month. Monthly CP demand is the metered demand during the hour (60-minute integration) in which the supplie~s system reaches its monthly peak. Demand reported in columns (e) and W must be in megawatts. Footnote any demand not stated on a megawatt basis and explain. 6. Report in column (g) the megawatthours shown on bills rendered to the respondent. Report in columns (h) and (i) the megawatthours of power exchanges received and delivered, used as the basis for settlement. Do not report net exchange. 7. Report demand charges in column Q), energy charges in column (1<), and the total of any other types of charges, including out-of-period adjustments, in column (1). Explain in a footnote all components of the amount shown in column (1). Report in column (m) the total charge shown on bills received as settlement by the respondent. For power exchanges, report in column (m) the settlement amount for the net receipt of energy. If more energy was delivered than received, enter a negative amount. If the settlement amount (I) include credits or charges other than incremental generation expenses, or (2) excludes certain credits or charges covered by the agreement, provide an explanatory footnote. 8. The data in column (g) through (m) must be totalled on the last line of the schedule. The total amount in column (g) must be reported as Purcha~es on Page 401, line 10. The total amount in column (h) must be reported as Exchange Received on Page 401, line 12. The total amount in column (i) must be reported as Exchange Delivered on Page 401, line 13. 9. Footnote entries as required and provide explanations following all required data.
MegaWatt Hours POWER EXCHANGES COST/SETTLEMENT OF POWER Line
Purchased MegaWatt Hours MegaWatt Hours Demand Charges Energy Charges Other Charges Total Q+k+l) Na. Received Delivered ~~ ($l ($) of Settlement ($)
(g) (h) (i) (k (I) (m)
90,21 I 5,652,122 5,652,123 1
2,646,57 2,646,570 2
2,642,84 259,321,66 259,321,664 3
2,602,44 255,433,05 255,433,054 4
78,81 5,136,51 5,136,514 5
2,732,26 2,732,268 6
7
8
19 29,36( 29,360 9
3,02E 605,12( 605,120 10
11
12
-27,647,459 -27,647,459 13
4,121,762 4,121,762 14
24,983,307 10,395,878 1,113,715,546 -24,347,488 1,099,763,93
FERC FORM NO. 'I (ED. '12-90) Page 327.2

Name of Respondent This mort Is: Date of Report Year/Period of Report
NSTAR Electric Company (1) X An Original (Mo, Da, Yr)
End of 20151Q4 (2) []A Resubmission I I
PU~C~A$ED POWER hAccou~t 555) ( nc udmg power exc anges
1. Report all power purchases made during the year. Also report exchanges of electricity (i.e., transactions involving a balancing of debits and credits for energy, capacity, etc.) and any settlements for imbalanced exchanges.
( 2. Enter the name of the seller or other party in an exchange transaction in column (a). Do not ·abbreviate or truncate the name or use acronyms. Explain in a footnote any ownership interest or affiliation the respondent has with the seller. 3. In column (b), enter a Statistical Classification Code based on the original contractual terms and conditions of the service as follo!"s:
RQ- for requirements seruice. Requirements service is service which the supplier plans to provide on an ongoing basis (i.e., the supplier includes projects load for this·service in its system resource planning). In addition, the reliability of requirement service must be the same as, or second only to, the supplier's service to its own ultimate consumers. -
LF- for long-term firm service. "Long-term" means five years or longer and "firm" means that service cannot be interrupted for economic reasons and is intended to remain reliable even under adverse conditions (e.g., the supplier must attempt to buy emergency energy from third parties to maintain deliveries of LF service). This category should not be used for long-term firm service firm service which meets the definition of RQ service. For all transaction identified as LF, provide in a footnote the termination date of the contract defined as the earliest date that either buyer or seller can unilaterally get out of the contract.
IF- for .intermediate-term firm service. The same as LF service expect that "intermediate-term" means longer than one year but less than five years.
SF- for short-term service. Use this category for all firm services, where the duration of each period of commitment for service is one year or Jess.
LU -for long-term service from a designated generating unit. "Long-term" means five years or longer. The availability and reliability of service, aside from transmission constraints, must match the availability and reliability of the designated unit.
IU- for intermediate-term service from a designated generating unit. The same as LU service expect that "intermediate-term" means longer than one year but less than five years.
EX- For exchanges of electricity. Use this category for transactions involving a balancing of debits and credits for energy, capacity, etc. and any settlements for imbalanced exchanges.
( OS -for other service. Use this category only for those services which cannot be placed in the above-defined categories, such as all non-firm service regardlesS of the Length of the contract and service from designated units of Less than one year. Describe the nature of the seJvice in a footnote for each adjustment.
.
Line Name of Company or Public Authority Statistical FERC Rate Average Actual Demand (MW)
No. (Footnote Affiliations) Classifi- Schedule or Monthly Billing Average Average cation Tariff Number Demand (MW) Monthly NCP Deman Monthly CP Demand
(a) (b) (c) (d) (e) (f)
1 MA Renewable Portfolio Standards Cis ... ' 2 Net Metering Deferral OS . ''
' .'.
3
4
5
6
7
8
9
10
11
12
13
14
Total
FERC FORM N0.1 (ED. "12-90) Page 326.3

··~·"~ ~· ........... 1-''"'""'""' iir 'lf[i\~ original I LJc.tl"' Ul > ~"'J-:''-'' L
I 1'-'CUII '-'LIUU Ul 1\'-'f-'VIL
NSTAR Electric Company (Mo, Da, Yr)
End of 20151Q4 (2) DA Resubmission I I
. PUKCHA~E~ ~OWE0~;;,ccouRt 555)) (c;ontinued) nc u tng po er exc anges
AD- for out-of-period adjustment. Use this code for any accounting adjustments or "true-ups 11 for service provided in prior reporting years. Provide an explanation in a footnote for each adjustment.
4. In column (c), identify the FERC Rate Schedule Number or Tariff, or, for non-FERC jurisdictional sellers, include an appropriate designation for the contract. On separate lines, list all FERC rate schedules, tariffs or contract designations under which service, as . identified in column (b), is provided . 5. For requirements RQ purchases and any type of service involving demand charges imposed on a monnthly (or longer) basis, enter the monthly average billing demand in column (d), the average monthly non-coincident peal< (NCP) demand in column (e), and the average monthly coincident peak (CP) demand in column (f). For all other types of service, enter NA in columns (d), (e) and (f). Monthly NCP demand is the maximum metered hourly (60-minute integration) demand in a month. Monthly CP demand is the metered demand during the hour (60-minute integration) in which the supplier's system reaches its monthly peak. Demand reported in columns (e) and (f) must be in megawatts. Footnote any demand not stated on a megawatt basis and explain. 6. Report in column (g) the megawatthours shown on bills rendered to the respondent. Report in columns (h) and (i) the megawatthours of power exchanges received and delivered, used as the basis for settlement. Do not report net exchange. 7. Report demand charges in column 0), energy charges in column (k), and the total of any other types of charges, including out-of-period adjustments, in column (1). Explain in a footnote all components of the amount ~hown in column (1). Report in column (m) the total charge shown on bills received as settlement by the respondent. For power exchanges, report in column (m) the settlement amount for the net receipt of energy. If more energy was delivered than received, enter a negative amount. If the settlement amount (I) include credits or charges other than incremental generation expenses, or (2) excludes certain credits or charges covered by the agreement, provide an explanatory footnote. 8. The data in column (g) through (m) must be totalled on the last line of the schedule. The total amount in column (g) must be reported as Purchases on Page 401, line 10. The total amount in column (h) must be reported as Exchange Received on Page 401, line 12. The total amount in column (i) must be reported as Exchange Delivered on Page 401, line 13. 9. Footnote entries as required and provide explanations following all required data.
(
MegaWatt Hours POWER EXCHANGES COSTISETILEMENT OF POWER Une
Purchased MegaWatt Hours MegaWatt Hours Demand Charges Energy Charges Other Charges Total (j+k+l) No. Received Delivered ($) m ($) of Settlement ($)
(g) (h) (i) (j) (I) (m)
107,632,52E 107,632,526 1
254,61 45,136,27! 45,136,275 2
I 3
4 . 5
6
7
8
9
10
11
12
13
14
24,983,307 10,395,878 1,113,715,546 -24,347,488 1 ,099,763,93E
FERC FORM N0.1 (ED. 12-90) Page 327.3

(
(
Name of Respondent This Report is: Date of Report Year/Period of Report (1) 2S An Original (Mo, Da, Yr) ·
NSTAR Electric Company (2) A Resubmission I I 2015104
FOOTNOTE DATA
!Schedule Page: 326 Line No.: 2 Column: a Associated Utility. !Schedule Page: 326 Line No.: 2 Column: b Short term Renewable Ener y Certificate (REC) purchases. Schedule Page: 326 Line No.: 3 Column: a Associated utility. jSchedule Page: 326 Line No.: 3 Column: b Short term REC sales related to procurement activities. Due to EITF Issue No. 03 11, certain sales are recorded as purchase power. !Schedule Page: 326 Line No.: 6 Column: b Represents energy for those customers who have chosen third party suppliers. NSTAR Electric Company delivers energy to these customers, but does not bear the supply costs. !Schedule Page: 326 Line No.: 7 Column: b Boston Edison Company Boott Mills Hydro contract. !Schedule Page: 326 Line No.: 8 Column: b Boston Edison Com any META Jet 2 contract.
chedule Page: 326 Line No.: 9 Column: b Boston Edison Company Northeast Energy A contract. !Schedule Page: 326 Line No.: 10 Column: b Commonwealth Electric Company - Northeast Energy Associates I contract. !Schedule Page: 326 Line No.: 11 Column: b Commonwealth Electric Company Northeast Energy Associates II contract. lschedulr:~ Page: 326 Line No.: 13 Column: b Expansion project. !Schedule Page: 326.1 Line No.: 2 Column: b Short-term REC purchases. !Schedule Page: 326.1 Line No.: 4 Column: b Short term REC purchases. !Schedule Page: 326.1 Line No.: 9 Column: b Short term REC purchases. !Schedule Page: 326.1 Line No.: 13 Column: b Short term REC purchases. !Schedule Page: 32.6.1 Line No.: 14 Column: b Borderline Service. !Schedule Page: 326.2 Line No.: 2 Column: b Short term REC purchases. !Schedule Page: 326.2 Line No.: 6 Column: b Short term REC purchases. !Schedule Page: 326.2 l.,ine No.: 9 Column: b Borderline Service. rschedule Page: 326.2 Line No.: 10 Column: b Borderline Service. !Schedule Page: 326.2 Line No.: 13 Column: b Cumulative recovery of Default Service costs of 2015. !Schedule Page: 326.2 Line No.: 14 Column: b Electric rate refund per MA statute 2015, chapter 46, subsection 187 (Fixed/Variable rate recalculation difference between November 1, 2014 and April 13, 2015). !Schedule Page: 326.3 Line No.: 1 Column: b Accrual for the anticipated yearly expense associated with the cost of energy procurement in compliance with the Massachusetts Renewable Portfolio Standards. !Schedule Page: 326.3 Line No.: 2 Column: b Cumulative recovery of net metering deferral costs for 2015.
I FERC FORM NO. 1 (ED. 12-87) Page 450.1

NSTAR Electric Company I ~I) I.!:!::JMIIVII!:JHIC:ll
I ~1v1u 1 L.IC< 1 1 'I
I End of t::U1b/U4 (2) 0 A Resubmission I I
TRAN"j\~'!/.SJf>':' ,OF ELECTRICITY F2_K_ 0,'.'1':t<,?,~~ccount 456.1) {Including transactions referred to as 'wheeling')
1. Report all transmission of electricity, i.e., wheeling, provided for other electric utilities, cooperatives, other public authorities, qualifying facilities, non-traditional utility suppliers and uitimate cUstomers for the quarter. 2. Use a separate line of data for each distinct type of transmission service involving the entities listed in column (a), (b) and (c) ..
( 3. Report in column (a) the· company or public authority that paid for the transmission service. Report in column (b) the company or public authority that the energy was received from and in column (c) the company or public authority that the energy was delivered to. Provide the full name of each company or public authority. Do not abbreviate or truncate name or use acronyms. Explain in a footnote any ownership interest in or affiliation the respondent has with the entities listed in columns (a), (b) or (c) 4. In column (d) enter a Statistical Classification code based on the original contractual terms and conditions of the service as follows:
FNO- Firm Network Service for Others, FNS- Firm Networl< Transmission Service for Self, LFP- "Long-Term Firm Point to Point ' Transmission Service, OLF- Other Long-Term Firm Transmission Service, SFP- Short-Term ·Firm Point to Point Transmission
Reservation, NF- non-firm transmission service, OS- Other Transmission Service and AD- Out-of-Period Adjustments. Use this code
for any accounting adjustments or "true-ups" for service provided in prior reporting periods. Provide an explanation in a footnote for
each adjustment. See Genera/Instruction for definitions of codes.
Line Payment By Energy Received From Energy Delivered To Statistical
No. (Company of Public Authority) (Company of Public Authority) {Company of Public Authority) Classifi-(Footnote Affiliation) (Footnote Affiliation) (Footnote Affiliation) cation
(a) (b) (c) (d)
1 MBTA Various MBTA FNO
2 MBTA Various MBTA AD
3 Concord Various Concord FNO
4 Concord Various Concord AD
5 Massachusetts Port Authority (MASS PORT) Various MASSPORT FNO
6 Massachusetts Port Authority (MASSPORT) Various MASSPORT AD
7 Nantucket-LNS Various Nantucket FNO
8 Nantucket-LNS Various Nantucket AD
9 Belmont Various Belmont OLF 10 Belmont Various Belmont AD
11 Covanta-SEMass Various Covanta LFP
( 12 Covanta-SEMass Various Covanta AD
13 HQUS Hydro Quebec Various LFP
14 HQUS Hydro Quebec Various AD
15 HQUS Hydro Quebec Various NF
16 HQUS Not Applicable Not Applicable . OS
17 Hydro Quebec Phase II Support -AC VariOus Various OS
18 Hydro Quebec Phase II Support -AC Various Various AD
19 Hydro Quebec Phase II Support -AC Associated Utility Various OS
20 Hydro Quebec Phase II Support -AC Associated Utility Various AD
21 NEP Lines 255-2337/2338 Various Various OS 22 NEP Lines 255-2337/2338 Various Various AD
23 Concord/Wellesley Subtrans Facilities Various Various OS 24 ConcordNVellesley Subtrans Facilities Various Various AD
25 NSTAR Electric Company Associated Utility NSTAR Electric Company FNS 26 National Grid-Dewar Street Various Various OS
27 National Grid-Dewar Street Various Various AD
28 ANP Blackstone Energy Co. Various Various OS
29 ANP Blackstone Energy Co. Various Various AD
30 AES Londonderry-Facilities Various Various OS
31 AES Londonderry~Facilities Various Various AD
32 Merchants Way-Nantucl\et AFC Various Various OS
33 Merchants Way-Nantucket AFC Various Various AD
34 Millenium Power Partners Various Various OS
TOTAL
FERC FORM NO. 1 (ED. 12-90) Page 328

Name of Respondent 1 n1s Keporr 1s:
I Uate ot KSROrt
I Yearwenoo or Kepon
NSTAR Electric Company (1) IKJAn Original (Mo, Da, Yr) End of 2015104 (2) D A Resubmission I I
TRANSMISSIO !.'J.C 1=\:"<J:I_R[\,'~_Y_t-pR OTHER,~. (Account 456)(Continued) (Including transactions reffered to as 'wheeling')
5. In column (e), identify the FERC Rate Schedule or Tariff Number, On separate lines, list all FERC rate schedules or contract designations under which service, as identified in column (d), is provided.
( 6. Report receipt and delivery locations for all single contract path, "point to point" transmission service. In column (f), report the designation for the substation, or other appropriate identification for where energy was received as specified in the contract. In column (g) report the designation for the substation, ~r other appropriate identification for -where energy was delivered as specified in the contract. ' 7. Report in column (h) the number of megawatts of billing demand that is specified in the firm transmission service contract. Demand reported in column (h) must be in megawatts. Footnote any demand not stated on a megawatts basis and explain. 8. Report in column (i) and Q) the total megawatthours received and delivered.
FERC Rate Point of Receipt Point of Delivery Billing TRANSFER OF ENERGY Line Schedule of (Subsatation or Other (Substation or Other Demand
MegaWatt H?Urs JVJegaWatt Hours No. Tariff Number Designation) Designation) (MW) Received Delivered
(e) (fj (g) (h) (i) 0)
ISONEOAIT Various MBTA 352,145 352,14 1
ISONEOAIT Various MBTA 2
ISONEOAIT Various Concord 178,013 178,01 3
ISONEOAIT. Various Concord 4
ISONEOAIT Various MASSPORT 206,582 206,58, 5
ISONEOAIT Various MASSPORT 6
ISONEOAIT Com Interconnection Lothrop Station 176,779 176,77 7
ISONEOAIT Com Interconnection Lothrop Station 8
36 Station 509 CEL MH21771BMLD MH59 131,946 131,94 9
36 Station 509 CEL MH21771BMLD MH59 10
( ISONEOAIT Various Covanta 147 14/ 11
ISONEOAIT Various Covanta 12
ISONEOAIT NEHVDC Border HQ Phase I or II 1,568,040 1,568,04( 13
ISONEOAIT NEHVDC Border HQ Phase I or II 14
ISONEOAIT NEHVDC Border HQ Phase I or II 1,042,440 1,042,44 15
Negotiated Not Applicable Not Applicable 16
Support Various Various 17
Support Various Various 18
Support Various Various 19
Support Various Various 20
Support Various Various 21
Support Various Various 22
Support Various Concord/Wellesley 23
Support Various Concord/Wellesley 24
ISONEOAIT Various NSTAR System 21,927,318 21,927,31 25
Support Various Various 26
Support Various Various 27
ISONEOAIT Not Applicable Not Applicable 28
ISONEOAIT Not Applicable Not Applicable 29
ISONEOAIT Not Applicable Not Applicable 30
ISONEOAIT Not Applicable Not Applicable 31
ISONEOAIT Not Applicable · Not Applicable 32
ISONEOAIT Not Applicable Not Applicable 33
ISONEOAIT Not Applicable Not Applicable 34
0 25,583,410 25,583,41(
FERC FORM NO. 1 (ED. 12-90) Page 329

NSTAR Electric Company I (1) :1 :~ Original I (lVIo, Ua, Yr) I End of 2015/04 (2) Resubmission I I
" Lit I= r r~if.~e'ci to as ~n' i ~,
I
9. In column (I<) through (n), report the revenue amounts as shown on bjJ/s or vouchers. In column (k), provide revenues from demand related to the billing demand reported in column (h). In column (!), provide revenues from energy charges related to the
amount of energy transferred. In column (m), provide the total revenues from all other charges on bills or vouchers rendered, including
( out of period adjustments. Explain in a footnote all components of the amount shown in column (m). Report in column (n) the total !char~e shown on bills rendered to the entity Listed in column (a). If no monetary settlement was made, enter zero (11011) in column
. (n). Pmvirle a footnote explaining the nature of the non-monetary settlement, including the amount and type of energy or service
10. The total amounts in columns (i) and 0) must be reported as Transmission Received and Transmission Delivered for annual report only on Page 401, Lines 16 and 17, respectively.
- 11. Footnote entries and provide explanations following all required data.
'FROM !OFEL 'FOR• ncM
(~fharges Energ\~harges (Other($)'"'"""' Total I ' ($) 1 une (k+l+m) No.
(k) (m) (n)
'"' oon '"'·''" 1
.·· ........ _. ·,. . 'i; . 112,294 " 97,172\ 97,172 3
I ;· " ,· • .. :. . : .. ,. •·· .. ?~i9§pl 26,965 4
497,486 m ,qoo 5
' ·.· . ,·. ··. · .. ·· ··_·... .,_. • 139,.~1!!; 6
239,11 239,11~ .. _,/·, .. · ... ·.-·_··-·-•·11s:z~1 65,7~ 8
415,3~ 9
. : .;·••iir·<'.~ill~§ _:2,54{; 10
( 105,024 105,0~ 1
·• .. ·.' ... :: ... . 33,6~ 12
3,793,474 3"""·"' 13
,,._·:.:D\·i?••.>•.:<,tP3~ -31,68C 14
15
27,400 27,400 16
"•'' 17
. ' · .. ' : .. ' . -13,9~ 18
152,629 152,62!) 19
· ... '·. > . . .. ·· .. i/~~i[~J: -8,751_ . 20
4,050 4,05(1 21
1-'·p:-;,:•-:,:i>.•-.;_ .• ,.•:;_.·· . .-:-~ -70_4 22
79,70C _79,70(] 23 . ·· . .
..·· '621: -621 24
. ,: ... · . . 25
26
::·.(·:?·:,::;:· .. ,.,:.·;•:.:. ...• ·::'.· :. .. L -59.45~ 27
681,700 ",o V' 28
, ... ·:··.· . :.::;-, . -21,03~ 29
. 14,400 .14,400 30
,,.·,··-······· .,.·, .. _ :::::'·' . • ·,;_ .. :;::~~~-! 328 31
69,600 69,600 32
···.·· ... •.:·'/;:· ;,·_.: ... ·:: :. -1,398 33
25,200 25,200 34
0 0 244,729,016 244,729,016
FERC FORM NO. 1 (ED. 12-90) Page 330

Name of Respondent This wort IS: Date of Report Year/Period of Report
NSTAR Electric Company (1) X An Original (Mo, Da, Yr) End of 2015104 (2) O A Resubmission I I
TRANSM 9"J2~ ,OF ELECTRI<,<~I_Y_ F'?_K_ OTHEI:<,>'j~ccount 456.1) (Including transactions referred to as 'wheeling')
1. Report all transmission of electricity, i.e., wheeling, provided for other electric utilities, cooperatives, other public authorities, qualifying facilities, non-traditional utility suppliers and ultimate customers for the quarter.
( 2. Use a separate line of data for each distinct type of transmission service involving the entities listed in column (a), (b) and (c). 3. Report in column (a) the company or public authority that paid for the transmission service. Report in column (b) the company or public authority that the energy was received from and in column (c) the company or public authority that the energy was delivered to. Provide the full name of each company or public authority. Do not abbreviate or truncate name or use acronyms. Explain in a footnote any ownership interest in or affiliation the respondent has with the entities listed in columns (a), (b) or (c) 4.1n column (d) enter a Statistical Classification code based on the original contractual terms and conditions of the service as follows; FNO- Firm Network Service for Others, FNS- Firm Network Transmission Service for Self, LFP- "Long-Term Firm Point to Point Transmission Service, OLF- Other Long-Term Firm Transmission Service, SFP- Short-Term Firm Point to Point Transmission Reservation, NF- non-firm transmission service, OS - Other Transmission Service and AD - Out-of-Period Adjustments. Use this code for any accounting adjustments or "true-ups" for se111ice provided in prior reporting periods. Provide an explanation in a footnote for each adjustment. See General instruction for definitions of codes.
Line Payment By Energy Received From Energy Delivered To Statistical
No. (Company of Public Authority) (Company of Public Authority) (Company of Public Authority) Classifi-
(Footnote Affiliation) (Footnote Affiliation) (Footnote Affiliation) cation (a) (b) (c) (d)
1 Millenium Power Partners Various Various AD
2 Mystic Interconnection Constellation Various Various OS
3 Mystic Interconnection Calpine Various Various OS
4 Mystic Interconnection Calpine Various Various AD
5 Constellation Fore River Various Various AD
6 GenOn Kendall Facilities Kendall Station Various OS
7 GenOn Kendall Facilities Kendal! Station Various AD
8 Entergy Capacitor Bank Various Entergy OS
9 Entergy Capacitor Bank Various Entergy AD
10
( 11 NEPOOUISO
12 OATf- RNS Transmission Revenue Not Applicable Not Applicable OS
13 OATT- RNS Transmission Revenue Not Applicable Not Applicable AD
14 OATT- Scheduling & Dispatch Service Not Applicable Not Applicable OS
15 OA Tf - Scheduling & Dispatch Service Not Applicable Not Applicable AD
16 OATf- Through or Out Service Not Applicable Not Applicable OS
17 OATT- Through or Out Service Not Applicable Not Applicable AD
18
19
20
21
22
23
24
25
26
27
28
29
30
31
32
33
34
TOTAL
FERC FORM N0.1 (ED. 12-90) Page 328:1

NSTAR Electric Company I \'I ~MIJVII!::IIIIi:U I
\IVJU, U<;l1 II}
I End of 2015104 (2) 0 A Resubmission I I
TRANSMIS~J'?C'J. OF EL~';'J_~[plTY FOR_<]THE_K,S (Account 456)(<Contonueo) (Including transactions reffered to as 'wheeling')
5. In column (e), identify the FERC Rate Schedule or Tariff Number, On separate lines, list all FERC rate . .schedules or contract designations under which service, as identified in column (d), is provided. 6. Report receipt and delivery locations for all single contract path, "point to point" transmission service. In column {f), report the
( designation for the substation, or other appropriate identification for where energy was received as specified in the contract. In column (g) report the designation for the substation, or other appropriate identification for where energy was delivered as specified in the contract.
" 7. Report in column (h) the number of megawatts of billing demand that is specified in the firm transmission service contract. Demand reported in column (h) must be in megawatts. Footnote any demand not stated on a megawatts basis and explain. 8. Report in column (i) and OJ the total megawatthours received and delivered.
FERC Rate Point of Receipt Point of Delivery Billing TRANSFER OF ENERGY Line Schedule of (Subsatation or Other (Substation or Other Demand MegaWatt Hours MegaWatt Hours No. Tariff Number Designation) Designation) (MW) Received Delivered
(e) (ry (g) (h) (i) OJ ISONEOATT Not Applicable Not Applicable 1
ISO NE OATT Not Applicable Not Applicable 2
ISONEOATT Not Applicable Not Applicable 3
ISO NEOATT Not Applicable Not Applicable 4
ISO NEOATT Not Applicable Not Applicable 5
ISO NE OATT Kendall Station Various 6
ISO NEOATT Kendall Station Various 7
ISO NEOATT Manomet Station Pole #178 8
ISONEOATT Manomet Station Pole#178 9
10
11
' ( ISONEOATT Not Applicable Not Applicable 12
ISO NEOATT Not Applicable Not Applicable 13
ISONEOATT Not Applicable Not Applicable 14
ISO NEOATT Not Applicable Not Applicable 15
ISO NE OATT Not Applicable Not Applicable 16
ISONEOATT Not Applicable Not Applicable 17
18
19
.. 20
21
22
23 . 24
25
26
27
28
29
30
31
32
33
34
0 25,583,4'10 25,583,4'1
FERC FORM NO. 1 (ED. 12-90) Page 329.1

Name ot Kespondent I OIS ~OIT IS:
I uare or n:eRon:
I ream-·e11uu 01 nt:::fJUil
NSTAR Electric CompanY. (1) X An Original (Mo, Da, Yr)
End of 2015104 (2) D A Resubmission I I
I KANSIVII~S)p '?,\_~\-!:;':'L':.\\:'2! .~9_';_q \!:'~!'~ (Account 4o6) (Continued) (Including transactions reffered to as 'wlieeling')
9. In column (k) through (n), report the revenue amounts as shown on bills or vouchers. In column (1<), provide revenues from demand charges related to the billing demand reported in column (h). In column (1), provide revenues from energy charges related to the
( amount of energy transferred. In column (m), provide the total revenues from all other charges on bills or vouchers rendered, including out of period adjustments. Explain in a footnote all components of the amount shown in column (m). Report in column (n) the total charge shown on bills rendered to the entity Listed in column (a). If no monetary settlement was made, enter zero (11011) in column (n). Provide a footnote explaining the nature of the non-monetary settlement, including the amount and type of energy or service rendered. 10. The total amounts in columns (i) and 0) must be reported as Transmission Received and Transmission Delivered for annual report purposes only on Page 401, Lines 16 and 17, respectively. . 11. Footnote entries and provide explanations following all required data.
REVENUE FROM TRANSMISSION OF ELECTRICITY FOR OTHERS Demand Charges Energy Charges (Other Charges) Total Revenues ($) Line
($) ($) ($) (k+l+m) No. (k) (I) (m) (n)
' ..... .•. , .. , .• 237 1
1,100,004 1,100,004 2
288,900 288,900 3
·_.·. ·. ·•· A$~ 339 4
.. - <. . •.. .. •.. · .. . §;§~3 5,893 5
548,300 548,300 6
".;:'f:: ., .. ,: .··, .. ... -11,575 7
30,000 30,000 8 . ·· .. · .. ··_. ...... . -!i67 -667 9
10
( 11
229,967,782 229,967,782 12
.· .. -i;;~J4 .. ~:5~ -4,314,958 13
6,366,776 6,366,776 14
< · .. -.··· ... ;:;~~p;~g -30,467 15
387,471 387,471 16
-12,614 17
18
19
20
21
22
23
24
25
26
27
28
29
30
31
32
33
34
0 0 244,729,016 244,729,016
FERC FORM NO.1 (ED. 12-90) Page 330.1

(
(
Name of Respondent This Report is: Date of Report Year/Period of Report (1)2S_An Original (Mo, Da, Yr)
NSTAR Electric Company (2) A Resubmission II 2015/Q4
FOOTNOTE DATA
)Schedule Page: 328 Line No.: 2 Column: m This reflects an adjustment as a result of the FERC ROE order in Docket No. EL11 66-001 along with the 2014 Annual True-up and the FERC Audit Refund. )Schedule Page: 328 Line No.: 4 Column: m This reflects an adjustment as a result of the FERC ROE order in Docket No. ELll:-66-001 along with the 2014 Annual True-up and the FERC Audit Refund. )Schedule Page: 328 Line No.: 6 Column: m This reflects an adjustment as a result of. the FERC ROE order in Docket No. EL11 66-001 along with the 2014 Annual True-up and the FERC Audit Refund. )Schedule Page: 328 Line No.: 8 Column: m This reflects an adjustment as a result of the FERC ROE order in Docket No. EL11-66 001 along with the 2014 Annual True-up and the FERC Audit Refund. )Schedule Page: 328 Line No.: 10 Column: m This relates to the 2014 Annual True Up. )Schedule Page: 328 Line No.: 12 Column: m This reflects an adjustment as a result of the FERC ROE order in Docket No. EL11 66-001 alon with the 2014 Annual True-up and the FERC Audit Refund.
This relates to the 2014 Annual True Up. )Schedule Page: 328 Line No.: 18 Column: m This reflects an adjustment as a result of the FERC ROE order in Docket No. EL11 66 001 along with the 2014 Annual True-up and the FERC Audit Refund. ~chedule Page: 328 Line No.: 20 Column: m This reflects an adjustment as a result of the FERC ROE order in Docket No. EL11-66-001 along with the 2014 Annual True-up and the FERC Audit Refund. )Schedule Page: 328 Line No.: 22 Column: m This reflects an adjustment as a result of the 2014 Annual True up and the FERC Audit Refund. )Schedule Page: 328 Line No.: 24 Column: m This reflects an adjustment as a result of the 2014 Annual True up and the FERC Audit Refund. l$chedule Page: 328 Line No.: 25 Column: m Intracompany revenues are not reported on the FERC form. )Schedule Page: 328 Line No.: 27 Column: m TThis reflects an adjustment as a result of the FERC ROE order in Docket No. ELll 66-001 along with the 2014 Annual True-up and the FERC Audit Refund. [$chedule Page: 328 Line No.: 29 Column: m This reflects an adjustment as a result of the 2014 Annual True up and the FERC Audit Refund. )Schedule Page: 328 Line No.: 31 Column: m j· This reflects an adjustment as a result of the FERC ROE order in Docket No. EL11 66-001 along with the 2014 Annual True-u and the FERC Audit Refund. Schedule Page: 328 Line No.: 33 Column: m This reflects an adjustment as a result of the FERC ROE order in Docket No. ELll 66 001 along with the 2014 Annual True-u and the FERC Audit Refund. Schedule Page: 328.1 Line No.: 1 Column: m This reflects an adjustment as a result of the 2014 Annual True-up and the FERC Audit Refund. )Schedule Page: 328.1 Line No.: 4 Column: m This reflects an adjustment as a result of the 2014 Annual True up and the FERC Audit Refund. )Schedule Page: 328.1 Line No.: 5 Column: m
This relates to the 2014 Annual True-Up. )Schedule Page: 328.1 Line No.: 7 Column: m This reflects an adjustment as a result of the FERC ROE order in Docket No. ELll 66-001
I FERC FORM NO. 1 (ED. 12-87) Page 450.1

(
(
Name of Respondent This Report is: Date of Report Year/Period of Report (1) 2S,An Original (Mo, Da, Yr)
NSTAR Electric Company (2) A Resubmission I I 2015/04
FOOTNOTE DATA
along with the 2014 Annual True-u and the FERC Audit Refund. Schedule Page: 328.1 Line No.: 9 Column: m This reflects an adjustment as a result of the FERC ROE order in Docket No. EL11-66 001 along with the 2014 Annual True-up and the FERC Audit Refund. /Schedule Page: 328.1 Line No.: 13 Column: m This reflects an adjustment as a result of the FERC ROE order in Docket NO EL11-66 001 · 2011~ (207,695.97) 2012~ (4,025,599.04) 2013~ 10,338.25 2014~ (92,001.04)
(4,314,957.80)
/Schedule Page: 328.1 Line No.: 15 Column: m This reflects an adjustment as a result of the FERC ROE order in Docket NO. EL11-66 001. 2012~($30,467.14)
/Schedule Page: 328.1 Line No.: 17 Column: m This reflects an adjustment as a result of the FERC ROE order in Docket NO. EL11 66 001. 2011~ (879.87) 2012~ (11,621.34) 2013~ 50.76 2014~ (163.75)
(12, 614 .20)
/FERC FORM N0.1 (ED.12-87) Page 450.2 ]

BLANK PAGE
i (

Name of Respondent This ~10rt Is: --- -- Date of Report Year/Period of Report
NSTAR Electric Company (1) An Original (Mo, Da, Yr) End·of 2015104 (2) OA Resubmission I I
TRANSMISSION OF ELECTRICITY BY OTHE S (Account 565) (Including transactions referred to as "wheeling")
1. Report all transmission, i.e. wheeling or electricity prOvided by other electric utilities, cooperatives, municipalities, other public authorities, qualifying facilities, and others for the quarter. 2. ·1n column (a) report each company or public authority that provided transmission service. Provide the full name of the company, abbreviate if necessary, but do not truncate name or use acronyms. Explain in a footnote any ownership interest in or affiliation with the transmission service provider. Use additional columns as necessary to report all companies or public authorities that provided . transmission service for the quarter reported. 3. In column (b) enter a Statistical Classification code based on the original contractual terms and conditions of the service as follows: FNS- Finn Network Transmission Service for Self, LFP- Long-Term Firm Point-to-Point Transmission Reservations. OLF. Other Long-Term Firm Transmission Service, SFP- Short-Term Firm Point-to- Point Transmission Reservations, NF- Non-Firm TransmissiOn Service, and OS- Other Transmission Sell/ice. See Genera/Instructions for definitions of statistical classifications. 4. Report in column (c) and (d) the total megawatt hours received and delivered by the provider of the transmission service. 5. Report in column (e), (f) and (g) expenses as shown on bills or vouchers rendered to the respondent. In column (e) report the demand charges and in column (f) energy charges related to the amount of energy transferred. On column (g) report the total of all other charges on bills or vouchers rendered to the respondent, including any out of period adjustments. Explain in a footnote all components of the amount shown in column (g). Report in column (h) the total charge shown on bills rendered to the respondent. If no monetary settlement was made, enter zero in column (h). Provide a footnote explaining the nature of the non-mon·etary settlement, including the amount and type of energy or service rendered. 6. Enter "TOTAL" in column (a) as the last line. 7. Footnote entries and provide explanations following all required data.
Line TRANSFER OF EN ERG EXPENSES FOR TRANSMISSION OF ELECTRICITY BY OTHER No. Name of Company or Public Statistical IVJ~gawatt- ,v,agaw~tt- w~m·~9 -"'"ergy ch~'~~~s Total Cost of
liours liours Charyes Charres TransOOission Authority (Footnote Affiliations) Classiflcatioil Rece1ved Delivered ($ ($ ($ (a) (b) (c) (d) (e) en (g)
1 New England Power Co. OS -158,914 -158,914
2 Wellesley Municipal Lgt OS 16,261 16,261
3 Norwood Municipal Light OS 1,994,116 1,994,116
4 Bell Roc!< OS 40,008 40.008
5 Vermont Elec. Trans Co. OS ?1~.~,~?; 213,567
6 National Grid OS ·.-.•. !ic,ey.Rfi~: 7,624,643
( 7 ISO-NE OS 349,260,9501 349,260,950
8 ISO-NE AD .. i:it9;~QI:!.1.~-~ -9,801,743
9 yf~t~i:n MassachUSetts · · · · OS 566,117 566,117
10
11
12
13
14
15
16
TOTAL 349,755,005 349,755,005
FERC FORM NO. 113-Q (REV. 02-04) Page 332

' \
Name of Respondent This Report is: Date of Report Year/Period of Report (1) 2S An Original (Me, Da, Yr)
NSTAR Electric Company (2) A Resubmission I I 2015104
FOOTNOTE DATA
!Schedule Page: 332 Line No.: 5 Column: g Hydro Quebec DC Phase 1 Support {Vermont Electric Transmission Co.) $ 213,567
Information on Formula Rates Page 106 line 4: Hydro Quebec DC Phase 1 Support $213,567 !schedule Page: 332 Line No.: 6 Column: g Hydro Quebec DC Phase I Support {New England Electric Transmission Corp.) Hydro Quebec DC Phase II Support (New England Hydro Transmission Electric Hydro Quebec DC Phase II Support (New England Hydro Transmission Corp) Hydro Quebec AC Phase II Support (New England Power Co.) Hydro Quebec Phase II Support Chester SVC {New England Hydro Transmission
Total
Information on Formula Rates Page 106 line 4: Hydro Quebec DC Phase I Support Hydro Quebec DC Phase II Support
!Schedule Page: 332 Line No.: 8 Column: g FERC ROE Adjustment for:
2011 $ (682,670) 2012 (8,864,917) 2013 (112, 798) 2014 (141,358) Total $(9,801,743) !Schedule Page: 332 Line No.: 9 Column: a Affiliated Company
)FERC FORM N0.1 (ED.12-87)
$ 327,793 6,057,762
$ 6,385,555
Page 450.1
$ 327,793 Co.) 3,520,529
2,537;233 856,552
Corp.) 382,536 $7,624,643
I

Name of Respondent I This wort Is:
I Date of ReP.ort
I Year/Period of Report
NSTAR Electric Company (1) An Original (Mo, Da, Yr) End of 2015/04
(2) D A Resubmission II MISCELlANEOUS GENERAL EXPENSES (Account 930.2) (ELECTRIC)
Line Descriftion Amount No. (a (b)
1 Industry Association Dues 632,454
( 2 Nuclear Power Research Expenses
3 Other Experimental and General Research Expenses
4 Pub & Dist Info to Stkhldrs ... expn servicing outstanding Securities ..
5 Oth Expn >=5,000 show purpose, recipient, amount. Group if< $5,000
6 Net Eversource Energy SeNice Company rate of return 614,~76
7 Amortization of revolver expense 456,250
8 Trustee Fees and Expenses 441,465
9 Employee Compensation Expenses 401,253
10
11
12
13
14
15
16
17
18
19
20
21
22
23
24
25
' \ 26
27
28
29
30
31
32
33
34
35
36
37 ••
38
39
40
41
42
43
44
45
46 TOTAL 2,546,098
FERC FORM NO. ·1 (ED. 12-94) Page 335

(
NSTAR Electric Company Ill} ~Mil UJI!;!Uic:ll I \11/IU, Wc1, II)
(2) Ej A Resubmission 1 1 I DEPRECIATION AND AMORTIZATION OF ELECTRIC PLANT (Account 403,404, 405)
(Except amortization of aquisition adjustments)
End of 2015/04
1. Report in section A for the year the amounts for : (b) Depreciation Expense (Account403; (c) Depreciation Expense for Asset Retirement Costs (Account403.1; (d) Amortization of Limited-Term Electric Plant (Account 404); and (e) Amortization of Other Electric Plant (Account 405). 2. Report in Section 8the rates used to compute amortization charges for electric plant (Accounts 404 and 405). Stale the basis used to compute charges and whether any changes have been made in the basis or rates used from the preceding report year.
, 3. Report all available information called for in Section C every fifth year beginning with report year 1971, reporting annually only changes to columns (c) through (g) from the complete report of the preceding year. Unless composite depreciation accounting for total depreciable plant is followed, list numerically in column (a) each plant subaccount,
" account or functional classification, as appropriate, to which a rate is applied. Identify at the botlom of Section C the type of plant included in any sub-account used. In column (b) report all depreciable plant balances to which rates are applied showing subtotals by functional Classifications and showing composite total. Indicate at the bottom of section C the manner in which column balances are obtained. If average balances, state the method of averaging used. For columns (c), (d), and (e) report available information for each plant subaccount, account or functional classification Listed in column (a). If plant mortality studies are prepared to assist in estimating average service Lives, show in column (I) the type mortality curve selected as most appropriate for the account and in column (g), if available, the weighted average remaining life of surviving plant. If composite depreciation accounting is used, report available information called for in columns (b) through (g) on this basis. 4. If provisions for depreciation were made during the year in addition to depreciation provided by application of reported rates, state at the bottom of section C the amounts and nature of the provisions and the plant items to which related.
A. Summary of Depreciation and Amortization Charges
Line No.
Functional Classification
(a)
1 Intangible Plant
2 Steam Production Plant
3 Nuclear Production Plant
4 Hydraulic Production Plant-Conventional
5 Hydraulic Production Plant-Pumped Storage
6 Other Production Plant
7 Transmission Plant
8 Distribution Plant
9 Regional Transmis.sion and Market Operation
10 General Plant
11 Common Plant-Electric
12 TOTAL
D@reciation Expense
(Account 403) (b)
;; ~4,S84,717.
191,420,031
Depreciation Expense for Asset Retirement Costs (Account 403.1)
(c)
B. Basis for Amortization Charges
Amortization of limited Term Electric Plant
(Account 404) (d)
3,707,706
270,843
3,978,549
Intangible plant amortization relates primarily to computer software which is amortized over five years.
General Plant Amortization includes the amortization of leasehold improvements over the life of the lease.
FERC FORM NO.1 (REV.12-03) Page 336
Amortization of Other Electric
Plant (Ace 405) (e)
Total
3,707,706
44,584,717
137,906,476
9,199,681
195,398,580

Name of Respondent This mort Is: Date of Report Year/Period of Report
NSTAR Electric Company (1) An Original (Mo, Da, Yr) End of 2015104 (2) OA Resubmission I I
DEPRECIATION AND AMORTIZATION OF ELECTRIC PLANT (Continued)
C. Factors Used in Estimating Depreciation Charges
( Line ueprec1ao1e ~511ma1ea . ·~·l "ppuea '"o""'"Y .:--verage No. Account No. Plant Base Avg. Service Salvage D~r. rates Curve Remaining
(at (In Th(~1sands) ~~) (Pe(g
1entJ c ·r;;mt) Trt\'• _':
12 "
13 Transmission
14 352 72,113 2.30 . 15 353 852,545 2.42
16 354 37,660 2.05
17 355 247,051 2.09
18 356 170,736 2.17
19 357 89,847 2.06
20 358 478,340 2.14
21 359 34,821 1.59
22 Subtotal Transmission 1,983,113
23 .
24 Distribution
25 361 96,240 1.91
26 362 677,950 2.36
27 364 338,446 3.03
28 365 . 638,922 2.76
29 366 594,445 2.41
30 367 1,306,001 3.15
31 368 536,380 3.38
32 369 306,631 2.68
( 33 370 195,735 4.17
34 371
35 373 21,585 10.19
36 Subtotal Distribution 4,712,335
37
38 General- Non Project
39 390 121,259 2.18
40 391 21,009 .15.56
41 393 281 1.50
42 394 7,329 7.08
43 395 157 333.17
44 397 31,763 7.66
45 398 2,191 7.21
46 Subtotal General 183,989
47
48 Intangible Plant
49 303 27,862 13.31
50 Subtotal Intangible 27,862
.FERC FORM NO.1 (REI!. 12-03) Page 337

NSTAR Electric Company I {"IJ ~An ungma1 I ~IVlo, ua, Y r)
I End of 2015104 (2) flA Resubmission I I
DEPRECIATION AND AMORTIZATION OF ELECTRIC PLANT (Continued)
C. Factors Used in Estimating Depreciation Charges
(
Line ':_8Pf9CI8Die . ~st1mateo Net _ Appneo IVJonanty _Average No. Account No. Plant Base Avg. Service Salvage Depr. rates
~r~e Remaining
(a) (In Th?~1sands) 7~f (Pe[g
1ent) (Pe[~fnt) T e 7~i
12
13 Total 6,907,299
14
15 ' 16
17
18
19
20 .
21
22
23 ' 24
25
26
27
28
29
30
31
32
33 .
( 34
35
36
37
38
39
40 .
41
42
43
44
45
46
47
48
49
50
FERC FORM NO. 1 (REV. 12-03) Page 337.1

(
(
Name of Respondent This Report is: Date of Report (1) X An Original
NSTAR Electric Company (2) A Resubmission FOOTNOTE DATA
/Schedule Page: 336 Line No.: 7 Column: b Estimated Depreciation Accrual on AFUDC Equity For the Twelve Months Ended December 2015
Company Function Twelve Months Ended
December 2015 NSTAR T Transmission Plant
2,035
Information on Formula Rates Page 106 line 23: Depreciation related to station specific fixed assets.
Information on Formula Rates Page 106 line 30 and 106.2 line 1: Amount of depreciation as stipulated in contract. /Schedule Page: 336 Line No.: 8 Column: b Information on Formula Rates Page 106 line 23: Depreciation related to station specific fixed assets.·
Information on Formula Rates Page 106 line 30 and 106.2 line 1: Amount of depreciation as stipulated in contract. /Schedule Page: 336 Line No.: 10 Column: b Estimated Depreciation Accrual on AFUDC Equity For the Twelve Months Ended December 2015
Company Function Twelve Months Ended
December 2015 NSTART General Plant
Information on Formula Rates Page 106 line 23: Depreciation related to station specific fixed assets.
Information on Formula Rates Page 106 line 30 and 106.2 line 1: Amount of depreciation as stipulated in contract.
IFERC FORM NO. •f (ED. 12-87) Page 450.1
(Mo, Da, Yr) I I
Year/Period of Report
20151Q4

BlANK PAGE
(

Name ot Respondent This mort Is: Date of Report
I Year/Period of Report
NSTAR Electric Company (1) An Original (Mo, Da, Yr)
End of 2015/04 (2) EJA Resubmission II
R GUlATORY COMMISSION EXPENSES
1. Report particulars (details) of regulatory commission expenses incurred during the current year (or incurred in previous years,- if being amortized) relating to format cases before a regulatory body, or cases in which such a body was a party. 2. Report in columns (b) anr! (c), only the current year's expenses that are not deferred and the current year's amortization of amounts deferred in previous years.
Line Description Assessed by Expenses Total Deferred
No. (Furnish name of regulatory commission or body the Regulatory of Expense for in Account .. Commission Current Year 182.3 a/ docket or case number and a description of the case) Utility (b)+ (c) Beginnmg o Year
(a) (b) (c) (d) (e)
1 Assessment charged by the Massachusetts -2 Department of Public Utilities 5,072,305 5,072,305 -3,012,653
3
4 Proportionate share of expenses of the Federal
5 Energy Regulatory Commission (FERC)
6 Assessment Order No. 472 1,703,616 1,703,616 -502,483
7
8 Legal fees-Distribution 34,969 34,969
9
1 0 Minor items-Distribution 14,790 14,790
11
12
13
14
15
16
17
18
19
20
21
( 22
23
24
25
26
27
28
29
30
31
32
33
34
35
36
37
38
39
40
41
42
43
44
45
46 TOTAL 6,775,921 49,759 6,825,680 -3,515,136
FERC FORM NO.1 (ED. 12-96) Page 350

NSTAR Electric Company I (1) I!JAn Original (Mo, Da, Yr) I End of 2015104 (2) Fi A Resubmission I I
REGULATORY COMMISSION EXPENSE (Continued)
3. Show in column (k) any expenses incurred in prior years which are being amortized. List in column {a) the period of amortization. 4. List in column (f), (g), and (h) expenses incurred during year which were charged currently to income, plant, or other accounts.
5. Minor items (less than $25,000) may be grouped.
( \ EXPENSES INCURRED DURING YEAR AMORTIZED DURING YEAR
,. CURRENTLY CHARGED TO Deferred to Contra Amount Deferred in Line Department ""'ii~""' Amoum Account 182.3 Account Account 182.3
No. End of Year m (g) (h) (i) OJ (I<) (I)
" 1
Electric 928 3,440,371 4,644,587 928 1,631,934 2
3
4
5
Electric 928 441,220 1,764,879 928 1,262,396 6
7
Electric 928 34,969 8
9
Electric 928 14,790 10
11
12
13
14
15
16
17
18
19
20
21
( 22
23
24
25
26
27
28
29
30
31
32
33
34
35
36
37
38
39
40
41
42
43
44
45
: .:,:~'>··· . ::- i· ·' ... 3,931,350 6,409,466 ~·)i_c_········ 2,894,330 46
FERC FORM N0.1 (ED. 12-96) Page 351

(
(
End of. 2015/04
Construction, Plant Remova,ls, and Other Accounts, and enter such amounts in the appropriate lines and columns In determining this segregation of salaries and wages originally charged to clearing accounts, a method of approximation
giving substantially correct results may be used.
Classification
FERC FORM N0.1 (ED. 12-88) Page 354.

{IVJO, ua, '( r) I I
End of 2015104 NSTAR Electric Company
(
(
FERG FORM N0.1 (ED. 12-88) Page 355

(
(
Name of Respondent
NSTAR Electric Company
/Schedule Page: 354 Line No.: 77 Column: b Account
123 143 146 154 182.3 185 186 253 408 417 426 456 Total
40,117 87,012
1,180,916 8,014
3,643,551 525,233 514,107 37,777
665 23,24 9
585,921 9, 386
6,655,948
/FERC FORM N0.1 (ED.12-87)
This Report is: Date of Report Year/Period of Report (1) X An Original (Mo, Da, Yr) (2) A Resubmission I I 2015104
FOOTNOTE DATA
Page 450.1

BLANK PAGE

Name of Respondent This wart Is: Date of Report Year/Period of Report
NSTAR Electric Company (1) An Original (Mo, Da, Yr)
End of 2015104 (2) OA Resubmission I I
AMOUNTS INCLUDED IN ISOIRTO SETTLEMENT STATEMENTS
1. The respondent shall report below the details called for concerning amounts it recorded in Account 555, Purchase Power, and Account 447, Sales for Resale; for items shown on ISO/RTO Settlement Statements. Transactions should be separately netted for each JSO/RTO administered energy marl<et
( for purposes of determining whether an entity is a net seller or purchaser in a given hour. Net megawatt hours are to be used as the basis for determining whether a net purchase or sale has occurred. In each monthly reporting period, the hourly sale and purchase net amounts are to be aggregated and separately reported in Account 447, Sales for Resale, or Account 555, Purchased Power, respectively.
'
Line Description of ltem{s) Balance at End of Balance at End of Balance at End of Balance at End of
No. Quarter 1 Quarter 2 Quarter 3 Year (a) (b) (c) (d) (e) e
1 Energy
2 Net Purchases {Account 555)
3 Net Sales (Account 447) 64,735,675 82,936,962 105,493,294 127,991,113
4 Transmission Rights
5 Ancillary SeiVices
6 Other Items (list separately) 129,393 ( 1,300,041) ( 1,061,471 ) ·. > ( )976,"702) 7
8 .
9
10
11
12
13
14
15
16
17
18
19
( 20
21
22
23
24
25
26
27
28
29
30
31
32
33
34
35
36
37
38
39
40
41
42
43
44
l/ 45
46 TOTAL 64,865,068 81,636,921 104,431,823 127,020,411
FERC FORM NO. 113-Q (NEW.12-05) Page 397

f \
(
Name of Respondent This Report is: (1) X An Original
NSTAR Electric Company (2) A Resubmission FOOTNOTE DATA
!Schedule Page: 397 Line No.: 6 Column: e Other items (Account 447)
$ 819,967 (A) (1,790,669) Adjustment for 2014 net energy sales
$( 970,702)
Date of Report Year/Period of Report (Mo, Da, Yr)
I I 2015104
(A) Includes various non day-ahead and real-time energy items billed by ISO-NE, including: demand response, GIS costs, communication expenses, renewable energy certificate revenue, and other miscellaneous prior period reserve and energy adjustments.
IFERC FORM NO. 'I (ED.12-87) Page 450.1

Name of Respondent This Report Is: Date of Report Year/Period of Report
NSTAR Electric Company (1) [!JAn Original (Mo, Da, Yr)
End of 2015/04 (2) Ef A Resubmission I I
PURCHASES AND SALES OF ANCILLAR SERVICES
Report the amounts for each type of ancillary service shown in column (a) for the year as specified in Order No. 888 and defined in the respondents Open Access Transmission Tariff.
In columns for usage, report usage-related billing determinant and the unit of measure.
(1) On line 1 columns (b), (c), (d), (e), (f) and (g) report the amount of ancillary services purchased and sold during the year. '
(2) On line 2 columns (b) (c), (d), (e), (f), and (g) report the amount of reactive supply and voltage control services purchased and sold during the year. -
(3) On line 3 columns (b) (c), (d), (e), (f), and (g) report the amount of regulation and frequency response services purchased and sold during the year.
(4) On line 4 columns (b), (c), (d), (e), (f), and (g) report the amount of energy imbalance services purchased and sold during the year.
(5) On lines 5 and 6, columns (b), (c), (d), (e), (f), and (g) report the amount of operating reserve spinning and supplement services purchased and sold during the period.
(6) On line 7 columns (b), (c), (d), (e), (f), and (g) report the total amount of all other types ancillary services purchased or sold during the year. Include in a footnote and specify the amount for each type of other ancillary service provided.
Amount Purchased for the Year Amount Sold for the Year
Usage- Related Billing Determinant Usage- Related Billing Determinant
Unit of Unit of
Lin Type of Ancillary Service Number of Units Measure Dollars Number of Units Measure Dollars
No. (a) . (b) (c) (d) (e) (fj (g)
( 1 Scheduling, System Control and Dispatch . · ... ·.·. :. $/mw 11.954,877 .. ..· ;,;:·.· $/mw 6,494,113
2 Reactive Supply and Voltage . '·' ···•· $/mw 4,535,770
3 Regulation and Frequency Response
4 Energy Imbalance ·.... ' ••i:\, $/mwh 17 ~38,656
5 Operating Rese!Ve ~Spinning
6 Operating Reserve~ Supplement
7 Other ·.. .• • ·i\~ $/mw 2,446,777
8 Total (Lines 1 thru 7) 18,937,424 23,832,769
( \'-.....-/
FERC FORM NO. 1 (New 2-04) Page 398

!
(
r I l
1 l 'J l i l ' ! J j j
1
I J j (
l
I I j I
I
Name of Respondent
NSTAR Electric Company
\Schedule Page: 398 Line No.: 1 Column: b ) Data is not readily available.
[Schedule Page: 398 Line No.: 1 Column: e Data is not readily available. [Schedule Page: 398 Line No.: 2 Column: b Data is not readily available. [Schedule Page: 398 Line No.: 4 Column: e Data is not readily available. (Schedule Page: 398 Line No.: 7 Column: b Data is not readily available.
I FERC FORM NO. 1 (ED. 12-87)
This Report is: Date of Report Year/Period of Report ( 1) 2:; An Original (Mo, Da, Yr) I (2) A Resubmission II 2015104
FOOTNOTE DATA
Page 450,1

.l ' j
·~
I j
·"
I i(
I
(
Name of Respondent This ~ ~ort Is: Date of Report
I Year/Period of Report
NSTAR Electric Company (1) ·pJAn Original (Mo, Da, Yr)
End of 2016104 (2) jA P• I I
IP OAKLOAC
(1) ve monthly peak load on the respondent's transmission system. If the respondent has two or more power systems which are not physically furnish the required information for each non-integrated system.
(2) Report on Column (b) by month the transmission system's peak load. (3) Report on Columns (c) and (d) the specified information for each monthly transmission- system peak load reported on Column (b). (4) Report on Columns (e) through fj) by month the system' monthly maximum megawatt load by statistical classifications. See General instruction for the definition of each statistical classification.
'
-
NAME OF ~y~ I toiVJ: NSTAR Electric r
Line Monthly Peak Day of Hour of F1rm Network Firm Network long· Term Firm Other long· ShorHerm Flrm Other No. Month MW- Total Monlhly Monthly Service for Self Service for Point·to·point Term Firm Point-to-point Service
Peak Peak Others Reservations Service Reservation
(a) (b) (c) (d) (e) (f) (g) (h) (i) Q)
Janual)' ~08! E 1€ 3,45: 632
3,971 24 11 3,357 621
March ~ ' 11 3,12E 596
I 9,93E 1,841 21
*'" 3,301 12 2,798 so• eiMay 4,151 2E 1l 3,527 621
I ;June ~ ~ 1l 3,806 67€
~lm•n,,~,,~ 10,131 1,807 21
I Ju~ 5.2zi 2C 17 4,45< 768
1C August 5,09: 1E 14 4,327 761
11 I Seplember ~3C _8 _!II 4,37' 75E
12 ' ·' 13, 15' 2,29' . 21
13 I Oclober 3,27: 1< _1_9 2,77E 497
14 'November 3~1 3( _18 2,971 54f r
11 3,55: 21 _18 2,989 564
_!€ To~ll ~ 8,735 1,606 21
1i Tolal Year lo .
Dale/Year 41,95€ 7,554 8<
FERC FORM N0.113-Q (NEW. 07.C4) Page 400

I j
--'
' f 1
' l .1
1
I I I
Name of Respondent
NSTAR Electric Company
This Report is: (1) X An Original (2) A Resubmission
FOOTNOTE DATA
Date of Report Year/Period of Report (Mo, Da, Yr)
I I 2015104
!(-, ! /Schedule Page: 400 Line No.: 17 Column: b
Information on Formula Rates ~age 106 lines 10 & 13: Ratio of fixed load per contract divided by station peak load per company records. Applicable to lines 1-17
JFERC FORM N0.1 (ED.12-87) Page 450.1

k I I l
Name of Respondent
NSTAR Electric Company
This {1) (2)
Date of Report (Mo, Da, Yr) I I
Year/Period of Report End of 2015104
Report below the infonnation called for concerning the disposition of electric energy generated, purchased, exchanged and wheeled during the year.
Item No.
MegaWatt Hours Line Item No.
MegaWatt Hours
Interdepartmental Sales)
linstruc,tion 4, page 311.)
Sales for Resale (See
FERC FORM NO.1 lED. 12-90) Page 401a

BLANK PAGE
. (

(
NSTAR Electric Company End of 2015/04
1. Report the monthly peal< load and energy output. If the respondent has two or more power which are not physically integrated, furnish the required information for each non- integrated system. 2. Report in column (b) by month t.he system's output in Megawatt hours for each month. 3. Report in column (c) by month the non-requirements sales for resale. Include in the monthly amounts any energy losses associated with the sales. 4. Report in column (d) by month the system's monthly maximum megawatt load (60 minute integration) associated with the system. 5. Report in column (e) and (f) the specified information for each monthly peak load reported in column (d).
Hour
24,983,307
FERC FORM NO.1 (ED. 12-90) Page 401b

(
Name of Respondent This Report is: Date of Report Year/Period of Report (1)_6An Original (Mo, Da, Yr)
NSTAR Electric Company (2) A Resubmission II 2015/04
FOOTNOTE DATA
!Schedule Page: 401 Line No.: 10 Column: b Purchases include competitive supplier loads. !Schedule Page: 401 Line No.: 29 Column: d Information on Formula Rates Page 106 line 27:
Ratio of 12-rnonth average transmission load divided by reference year 1993 transmission load per contract
· JFERC FORM NO.1 (ED. 12-87) Page 450.1

(
NSTAR Electric Company End of 2015104
1. Report information concerning transmission lines, cost of li~es, and expenses for year. List each transmission line having nominal voltage of 132 kilovolts or greater. Report transmission lines below these voltages in group totals only for each voltage .
. Transmission lines include all lines covered by the definition of transmission system plant as given in the Uniform System of Accounts. Do not report substation costs and expenses on this page. 3. Report data by individual lines for all voltages if so required by a State commission. 4. Exclude from this page any transmission lines for which plant costs are included in Account 121, Non utility Property. 5. Indicate whether the type of supporting structure reported in column (e) is: (1) single pole wood or steel; (2) H-frame wood, or steel poles; (3) tower; or (4) underground construction If a transmission fine has more than one type of supporting structure, indicate the mileage of each type of construction
the use of brackets and extra lines. Minor portions of a transmission line of a different type of construction need not be distinguished from the I remaind,er of the line. -6. Report in columns (f) and (g) the total pole miles of each transmission line. Show in column (f) the pole miles of line on structures the cost of which is reported for the line designated; conversely, show in column (g) the pole miles of line· on structures the cost of which is reported for another line. Report pole miles of line on leased or partly owned structures in column (g). In a footnote, explain the basis of such occupancy and state whether expenses respect to such structures are included in the expenses reported for the line designated.
Line No.
From (a)
FERC FORM NO.1 (ED. 12-87)
To (b) (d)
Page 422
Structure (e)

··~···~ ~· .. ~ .... ,... .............. ~~( ·~~~ROriginal
......~ .... "'' ·~'"'~"'''
I I "COlli VIIVV VI 1~'"'1-'VIL
NSTAR Electric Company (Mo, Da, Yr)
End of 2015104 I I
I LIN~ I i(l i
7. Do not report the same transmission line structure twice. ~eport Lower voltage Lines and higher voltage Jines as one line. Designate in a footnote if you do not include Lower voltage lines with higher voltage Jines. If two or more transmission line structures support lines of the same voltage, report the pole miles of the primary structure in column (f) and the pole miles of the other line(s) in column (g)
( 8. Designate any transmission line or portion thereof for which the respondent is not the sole owner. If such property is leased from another company, give name of lessor, date and terms of Lease, and amount of rent for year. For any transmission line other than a leased line, or portion thereof, for I which the respondent is not the sole owner but which the respondent operates or shares in the operation of, furnish a succinct statement explaining the arrangement and giving particulars (details) of such matters as percent ownership by respondent in the line, name of co-owner, basis of sharing expenses of the Line, and how the expenses borne by the respondent are accounted for, and accounts affected. Specify whether lessor, co-owner, or other party is an associated company. 9. Designate any transmission line leased to another company and give name of lessee, date and terms of lease, annual rent for year, and how
Specify whether lessee is an associated company. 10. Base the plant cost figures called for in columns Q) to (I) on the bool< cost at end of year.
vu~ 1 ur UN~ (Include in votumn Ul Lano, EXPENSES, EXCEPT DEPRECIATION AND TAXES Size of Land rights, and clearing right-of-way)
Conductor Oi otk Total and Material Land ~o!rie~;?o~t;nct Total Cost i Rents lune
(i) m (I) '(m) . (n) (o) _(P) No.
1
~-900 AL 2
2500AGSH 1,698,314 3
25DOAGSR 97,03[ 11,681,62< 4
2-1590ACSR 5 130,421 130.421 6
1.441.01~ . 7 578,72[ 578,726 8
~-954AGSR 2,733,661 9
187,11: 4.407,291 10
( i2-1703 AGAR 144,81: 11 2-1590AGSR .. :·. ; ·j•·•• •. 12
13
2-900 AL 912,765 912,76E 114 2-1113AGSR 2,777,06: 2,777,06' 115 ~-1113AGSR 163,50E 163,50E 116 ~-1024.5 AGAR . ............. : 17 ~~900AGSS 320,65< 1E .435 •.121 I 18
~-900AGSS 1: 1.53C 19
. 210,27: ,Q1? 761 20
•• • ..... 21 · ... · . 1_22_
2:954AGSS 17,168,711 IE_
.• < .• ······' ~ 2338AGAH
. ·.·.· .. ··.·· ~ 2-1703ACAR_ I .·· ... - • 1_26_ 2335ACAR. I ·.· 127 2-1703ACAR • . ·: 28
~338ACAR •••• . ... 29
~-1703AGAR .:•;: .. ,:•.,••· 30 837,57[ 837,570 31
~-900ACSS .·. . .. · . 32
. ;.;.::x 133 11113 AGSR 383,46[ 383.460 134 1113ACSR .·, ..•.....• ,.,,,)'' ·.< 35
"•' 1, 6,035,927 . 53,947 9,969,69~ 36
FERG FORM N0.1 (ED.12-87) Page 423

1 Name of I
!~r· ~~~ ~~iginal 1
~~~g~~~ort " j ;~~~6~rt NSTAR Electric Company End of
. JUNE
1. Report information concerning transmission Jines, cost of lil)es, and expenses for year. List each transmission line having nominal voltage of 132 kilovolts or greater. Report transmission lines below these voltages in group totals only for each voltage.
( 2. Transmission lines include all Jines covered by the definition of transmission system plant as given in the Unifonn System of Accounts. Do not report
I costs and expenses on this page. 3. Report data by individual lines for all voltages if so required by a State commission. 4. Exclude from this page any transmission fines for which plant costs are included in Account 121, Nonutility Property.
,
5. Indicate whether the type of supporting structure reported in column (e) is: (1} single pole wood or steel; (2) H-frame wood, or steel poles; (3) tower; or (4) underground construction If a transmission line has more than one type of supporting structure, indicate the mileage of each type of construction by the use of brackets and extra lines. Minor portions of a transmission line of a different type of construction need not be distinguished from the -remainder of the line. 6. Report in columns (f) and (g) the total pole miles of each transmission line. Show in column (f) the pole miles of line on structures the cost of which is
for the line designated; conversely, show in column (g) the pole miles of line on structures the cost of which is reported for another line. Report pole miles of line on leased or partly owned structures in column (g). In a footnote, explain the basis of such occupancy and state whether expenses with respect to such structures are included in the expenses reported for the line designated.
Line IM y< . "'~ Type of Lc~G.I H (Pole n;Jiles)
I No.
6ii"cvd :·3 oh ase) report circuit 1ri:R~~) Of -ee
un0
( ug, Circuits From To Operating Designed Structure Lin~-
·~~· {a) {b) {c) {e) I
{d) {h)
West Medway Stalion ;'1446 r Station #342 230.01 13.2C 10.1€
West Medway : 230.01 4.25
' Station #342 I 1 Station #282 230.QI I 7.20 720
'I ncotinn< !Various I cotinn< 115.01 435.43 66.66 101
5 UNO
6 No. ( ' Station #509 I Woburn Stalion #211 345.01 12.0<
71 Everett Station #250 No. ' Station #509 345.01 9,9<
81 Everett Station #250 Saugus Nat'! Grid Sta. #90 345.01 12.51
9 I Everett Station #250 Boston Stalion #514 345.0 8.4C
( Hyde Park St,_#496 C 3164 345.01 11.19
1 1 Station #330 K St. Station #385, C 3162 345.01 345.00 17.40
1: 1 Station #330 jKSt. 'c 3163 345.01 17.41
1: !Various 115.01 11: £'l:OE 37
14
15 16 17 18 19
2C .
21 22 23 24 25 26
27 28 29
30 31
32
.& . Line
34 35
36 TOTAL 931.64 100.91 184
FERC FORM NO.1 (ED. 12-87) Page 422.1

·~~···~ ~· ·-~~,.. ............. , .. (1')'" ·~~~~ original
'-'"''"" "'' ,,,.,.., ..... ,,
I I CCIIII CIIUU Vll\<:>tJVIl
NSTAR Electric Company (Mo, Da, Yr) End of 2015104
(2) 'A Resubmission I I
I LINE rrcs 7. Do not report the same transmission line structure twice. ~eport Lower voltage Lines and higher voltage lines as one line. Designate in a footnote if you do not include lower voltage lines with higher voltage lines. If two or more transmission line structures support lines of the same voltage, report the pole miles of the primary structure in column (f) and the pole miles of the other line(s) in column {g)
8. Designate any transmission line or portion thereof for which the respondent is not the sole owner. If such property is leased from another company, give name of lessor, date and terms of Lease, and amount of rent for year. For any transmission line other than a leased line, or portion thereof, for ;hich-fhe respondent is not the sole owner but which the respondent operates or shares in the operation of, furnish a succinct statement explaining the arrangement and giving particulars (details) of such matters as percent ownership by respondent in the line, name of cowowner, basis of sharing
expenses of the Line, and how the expenses borne by the respondent are accounted for, and accounts affected. Specify whether lessor, co-owner, or other party is an associated company.
9. Designate any transmission line leased to another company and give name of Lessee, date and terms of lease, annual rent for year, and how determined. Specify whether Jessee is an associated company. 10. Base the plant cost figures called for in columns (j) to (I) on the bool< cost at end of year.
vU<> 1 ur UN!= llnCIUOe 1n c;o1umn U) Land, EXPENSES, EXCEPT DEPRECIATION AND TAXES
Size of Land rights, and clearing right-of-way)
Conductor
and Material Land I 1 and Total Cost Operation Maintenance Rents Total lune _othe[kfosts Expenses Expenses Expenses
(i) 0) (I) (m) (n) (o) {p) No.
1113ACSR .. , .... . r;,~ 1 1113ACSR _. -• ·.· .. "C"o ;;.: •. \. >c:-!if.il 2 1113ACSR 3 Various 2,615,41< 4
5 2,411,131 6
CU-2500 77,81: 7 8
[CU-2500 ' 9
~soocu 41,900,31" 10
( '2SOOCU 6i 75: 04R 11 2500CU 82, 73€ 78< [12 Various 263,74< [13
! 14
l_15_ _1_6 _1_7 18
[19 [20
[21 [22 . 23
24 25 26 27
[28
[29 I [30
1 31 [32
0 R70,R?' R noo oo; 53,947 • 33
_34_ 35
o,. 1, "•" 53,947 36
FERC FORM NO.1 (ED.12-87) Page 423:!

Name of Respondent This Report is: Date of Report Year/Period of Report (1) .2\ An Original (Mo, Da, Yr)
NSTAR Electric Company )z) A Resubmission I I 20151Q4
FOOTNOTE DATA
(
/Schedule Pag_e: 422 Line No.: 12 Column: I 'I Cost included in line 11. /Schedule Page: 422 Line No.: 17 Column: I Cost included in line 18. /Schedule Page: 422 Line No.: 21 Column: I Cost included in line 20. /Schedule Page: 422 Line No.: 22 Column: I Cost included in line 20. /Schedule Page: 422 Line No.: 24 Column: I Cost included in line 23. /Schedule Page: 422 Line No.: 25 Column: I Cost included in line 23. /Schedule Page: 422 Line No.: 26 Column: I Cost included in line 23. ~chedule Page: 422 Line No.: 27 Column: I Cost included in line 4. /Schedule Page: 422 Line No.: 28 Column: I Cost included in line 11. ~chedule Page: 422 Line No.: 29 Column: I Cost included in line 11. /Schedule Page: 422 Line No.: 30 Column: I Cost included in line 10. ~chedule Page: 422 LineNo.:32 Column: I Cost included in line 18. /Schedule Pafle: 422 Line No.: 33 Column: I
( Cost included in line 11. /Schedule Page: 422 Line No.:35 Column: I Cost included in line 34. ~chedule Page: 422.1 Line No.: 1 Column: I Cost included in line 3. ~chedule Page: 422.1 Line No.: 2 Column: I Cost included in line 3.
/FERC FORM N0.1 (ED. 12-87) Page 450.1

BLANK PAGE
(

Name of Respondent This ~art Is: Date of Report Year/Period of Report
NSTAR Electric Company (1) An Original (Mo, Da, Yr) End of 2015104 (2) OA Resubmission I I
TRANSMISSION LINES ADDED DURING YEAR
1. Report below the information called for concerning T:ransmission lines added or altered during the year. It is not necessary to report minor revisions of lines. 2. Provide separate subheadings for overhead and under- ground construction and show each transmission line separately. If actual costs of compeled construction are not readily available for reporting columns (I) to (o), it is permissible to report in these columns the
Line NE DESIGNATION 1 :-~ne SUPPORTING STRUCT RE CIRCUITS PER STRUC'fUR
No. From To Lergth
Type verage
Ultimate In Number per Present Miles Miles
(a) (b) (c) (d) (e) m (g) •'
1 Barnstable Station #958 Harwich Tap #963 7.8 4 Steel
2
3
4
5
6
7
8
9
10
11
12
13
14
15
16
17
18
19
( 20
21
22 .
23
24
25
26
27
28
29
30
31
32
33
34
35
36
37
38
39
40
41
42
43
44 TOTAL 7.84
FERC FORM NO.1 (REV. 12-03) Page 424

··~···~ ~· .......... !-''-'''"'"'''' b')'" '~A~ Oi-iginal 1-Jc:!Lt:: Ul 1""\.Cj-!Uil
I I t:ctl/rt::IIUU- UJ r'\.t::jJUJ l
NSTAR Electric Company (Mo, Da, Yr)
End of 2015/04 (2) EJ A Resubmission II
TRAN MISSION LINES ADDED DURING Y AR (Continued)
costs. Designate, however, if estimated amounts are re;ported. Include costs of Clearing Land and Rights-of-Way, and Roads and
Trails, in column (I) with appropriate footnote, and costs of Underground Conduit in column (m).
3. If design voltage differs from operating voltage, indicate such fact by footnote; also where line is other than 60 cycle, 3 phase,
indicate such other characteristic.
CON CTORS Voltage LINE COST Line ' Size Specification Conf~uration KV land and Poles,· Towers Conductors Asset Total No.
(h) and pacing (Operating) Land ~ights and Fixtures and Devices Retire0fosts
(p) (i) Q) (k) (I (m) (n) (0
795ACSS 115 ~\lii:fJiit~i.~M 11,276,834 1 .. 2 3
4 5 6 7 a 9
10 11 12 13 14
15 16 17 18 19 20
. 21
( 22 23 24 25 26 27 28 29 30 31 32 33 34 35 36
37 38 39
40 41 42
43
11,276,83 11,276,834 44
FERC FORM NO. 1 (REV. 12-03) Page 425

Name of Respondent This Report is: Date of Report Year/Period of Report (1) ~An Original (Mo, Da, Yr)
NSTAR Electric Company (2) A Resubmission I I 2015104
FOOTNOTE DATA
/Schedule Page: 424 Line No.: 1 Column: m Cost is in 106010 and not unitized.
(
jFERC FORM NO. ·1 (ED. 12-87) Page 450.1

(
BlANK PAGE
(

Name of Respondent This '[Z]ort Is: Date of ReRort Year/Period of Report
NSTAR Electric Company (1) X An Original (Mo, Da, Yr) End of 2015104 (2) D A Resubmission I I
SUBSTATIONS
1. Report below the information called for concerning substations of the respondent as of the end of the year. 2. Substations which serve only one industrial or street railway customer should not be listed below.
( 3. Substations with capacities of Less than 10 MVa except those serving customers with energy for resale, may be grouped according to functional character, but the number of such substations must be shown. 4. Indicate in column (b) the functional character of each substation, designating whether transmission or distribution and whether attended or unattended. At the end of the page, summarize according to function the capacities reported for the individual stations iF; column (f).
-Line VOLTAGE (In MVa) No. Name and Location of Substation Character of Substation
Primary SecondaJY Tertiary (a) (b) (c) (d) (e)
1 Sub #2 Boston Dist.wUnatt. 115.00 13.80
2 Sub #4 S. Boston Dist.wUnatt. 115.00 13.80
3 Sub #12 Boston Dist.-Unatt. 115.00 13.80
4 Sub #13 Roslindale Dist.WUnatt. 13.80 4.16
5 Sub #16 Somerville Dist.-Unatt. 13.80 4c16
6 Sub #17 Newton Center Dist.-Unatt. 24.00 13.80
7 Sub #17 Newton Center Dist.-Unatt. 13.80 4.16
8 Sub #20 Dedham Dist.wUnatt. 24.00 13.80
9 Sub #20 Dedham Dist.-Unatt. 13.80 4.16
10 Sub #23 Natick Dist.-Unatt. 13.80 4.16
11 Sub #24 Framingham Dist.-Unatt. 13.80 4.16
12 Sub #26 Walpole Dist.-Unatt. 13.80 4.16
13 Sub #30 Boston Dist.-Unatt. 13.80 4.16
14 Sub #33 Waltham Dist.-Unatt. 13.80 4.16
15 Sub #34 Lexington Dist.-Unatt. 13.80 4.16
( 16 Sub #36 Allstqn Dist.-Unatt. 13.80 4.16
17 Sub #43 Dorchester Dist.-Unatt. 13.80 4.16
18 Sub #49 Boston Dist.-Unatt. 13.80 4.16
19 Sub #52 RoxbuJY . Dist.-Unatt. 13.80 4.16
20 Sub #53 Boston Dist.-Unatt. 115.00 13.80
21 Sub #59 Arlington Dist.-Unatt. 13.80 4.16
22 Sub #60 Hyde Park Dist.-Unatt. 13.80 4.16
23 Sub #65 West Medway Dist.-Unatt. 115.00 13.80
24 Sub #67 Dorchester Dist.-Unatt. 13.80 4.16
25 Sub #71 Boston Dist.-Unatt. 115.00 13.80
26 Sub #1 06 S. Boston Dist.-Unatt. 115.00 13.80
27 Sub#110·W. Roxbury Dist.-Unatt. 115.00 24.00
28 Sub #110 W. Roxbury Dist.-Unatt. 115.00 115.00.
29 Sub#124 Watertown Dist.-Unatt. . 13.80 4.16
30 Sub #126 Hopkinton Dist.-Unatt. 115.00 13.80
31 Sub #130 Holliston Dist.-Unatt. 115.00 13.80
32 Sub #139 S. Boston Dist.-Unatt. 13.80 4.16
33 Sub #143 RoxbuJY Dist.-Unatt. 13.80 4.16
34 Sub #146 Walpole Dist.-Unatt. 115.00 13.80
35 Sub #148 Needham Dist.-Unatt. 13.80 4.16
36 Sub #148 Needham Dist.-Unatt. 115.00 13.80
37 Sub #211 Winchester/Woburn Dist.-Unatt. 115.00 13.80
38 Sub #211 Winchester/Woburn Dist.-Unatt. 13.80 4.16
39 Sub #240 Framingham Dist.-Unatt. 115.00 13.80
40 Sub #250 Charlestown/Everett Dist.-Unatt. 115.00 13.80
FERC FORM NO.1 (ED. 12-96) Page 426

··-·"~ -·. ---1"-·'--··· I iii"- ·0;;~ o;iginal I .._.,., ... VI 1~'-'1-''-'1<
I I <=><:UII ..,IIVU VI l'l:>J-'VIL
NSTAR Electric Company (Mo, Da, Yr) End of 2015104
(2) OA Resubmission I I SUBSTATIONS (Continued)
5. Show in columns (1), G), and (I<) special equipment such as rotary converters, rectifiers, condensers, etc. and auxiliary equipment for increasing capacity. 6. Designate substations or major items of equipment leased from.others, jointly owned with others, or operated otherwise than by
( reason of sole ownership by the respondent. For any substation or equipment operated under lease, give name of lessor, date and period of lease, and annual rent. For any substation or equipment operated other than by reason of sole ownership or lease, give name of co-owner or other party, explain basis of sharing expenses or other accounting between the parties, and state amounts and accounts
' affected in respondent's bool<s of account. Specify in each case whether lessor, co-owner, or other party is an associated company.
Capacity of Substation Number of Number of CONVERSION APPARATUS AND SPECIAL EQUIPMENT Line (In Service) (In MVa)
Transformers Spare Type of Equipment Total Capacity No. In Service Transformers Number of Units
(In (~Va) <n (g) (h) (i) Gl k)
150 2 1
150 2 2
250 4 3
20 3 4
17 2 5
20 2 6
23 3 7
60 3 Capacitors 2 11 8
19 3 9
15 3 Capacitors 1 5 10
21 3 11
26 3 12
13 2 13
22 4 14
25 3 15
30 3 Capacitors 3 4 16
( 20 3 17
27 3 18
19 3 . 19
250 4 Capacitors 4 40 20
15 3 21
15 2 22
80 2 Capacitors 1 5 23
14 2 24
150 2 Capacitors 4 40 25
178 4 1 Capacitors 4 40 26
150 2 Capacitors 1 63 27
Ph Angle Reg Xfrm 2 330 28
20 2 29
116 2 30
50 1 31
24 3 32
14 2 33
188 3 Capacitors 2 11 34
30 3 . 35
175 3 36
160 2 Capacitors 6 32 37
20 3 38
125 2 Capacitors 3 74 3g
188 3 Capacitors 1 63 40
FERG FORM NO.1 (ED.i?.-96) Page 427

Name of Respondent This @ort Is: Date of Report Year/Period of Report
NSTAR Electric Company (1) X An Original (Mo, Da, Yr) End of 2015104 (2) OA Resubmission I I
SUBSTATIONS
1. Report below the information called for concerning substations of the respondent as df the €nd of the year. 2. Substations which serve only one industrial or street railway c:;:ustomer should not be listed below. 3. Substations with capacities of Less than 10 MVa except those serving customers with energy for resale, may be grouped according to functional character, but the number of such substations must be shown. 4. Indicate in column (b) the functional character of each substation, designating whether transmission or distribution and whether attended or unattended. At the end of the page, summarize according to function the capacities reported for the individual stations in· column (f).
-Line VOLTAGE (In MVa)
No. Name and Location of Substation Character of Substation Primary Secondary Tertiary
(a) (b) (c) (d) (e)
1 Sub #250 Charlestown/Everett Dist.-Unatt. 24.00 13.80
2 Sub #27 4 Sherborn Dist.-Unatt. 115.00 13.80
3 Sub #277 Newtonville Dist.-Unatt. 13.80 4.16
4 Sub #278 Saxonville Dist.-Unatt. 115.00 13.80
5 Sub #282 Waltham Dist.-Unatt. 115.00 13.80
6 Sub #284 Jamaica Plain Dist.-Unatt. 13.80 4.16
7 Sub #285 E. Watertown Dist.-Unatt. 13.80 4.16
8 Sub #292 Newton Dist.-Unatt. 115.00 13.80
9 Sub #292 Newton Dist.-Unatt. 13.80 4.16
10 Sub #293 S. Boston Dist.-Unatt. 13.80 4.16
11 Sub #301 Stoneham Dist.-Unatt. 13.80 4.16
12 Sub #311 Mattapan Dist.-Unatt. 13.80 4.16
13 Sub #316 W. Newton Dist.-Unatt. 13.80 4.16
14 Sub #318 Boston Dist.-Unatt. 13.80 4.16
15 Sub #320 Lexington Dist.-Unatt. 115.00 13.80
( 16 Sub #321 Dorchester Dist.-Unatt. 13.80 4.16
17 Sub #322 Bedford Dist.-Unatt. 13.80 4.16
18 Sub #323 Boston Dist.-Unatt. 13.80 4.16
19 Sub #325 Woburn Dist.-Unatt. 13.80 4.16
20 Sub #329 Brighton Dist.-Unatt. 115.00 24.00 13.80
21 Sub #329 Brig~ton Dist.-Unatt. 115.00 13.80
22 Sub #340 Boston Dist.-Unatt. 13.80 4.16
23 Sub #342 Sudbury Dist.-Unatt. 115.00 13.80
24 Sub #344 Hyde Pari< Dist.-Unatt. 13.80 4.16
25 Sub #350 Boston Dist.-Unatt. 115.00 13.80 .
26 Sub #351 E. Lexington Dist.-Unatt. 13.80 4.16
27 Sub #355 Maynard Dist.-Unatt. 13.80 4.16
28 Sub #360 Sudbury Dist.-Unatt. 13.80 4.16
29 Sub #362 Milton Dist.-Unatt. 13.80 4.16
30 Sub #369 Newton Dist.-Unatt. 13.80 4.16
31 Sub #374 W. Roxbury Dist.-Unatt. 24.00 4.16
32 Sub #375 N. Woburn Dist.-Unatt. 115.00 13.80
33 Sub #385 S. Boston Dist.-Unatt. 115.00 13.80
34 Sub #391 Burlington Dist.-Unatt. 115.00 13.80
35 Sub #396 Roxbury Dist.-Unatt. 24.00 4.16
36 Sub #402 Somerville Dist.-Unatt. 115.00 13.80
37 Sub #416 Maynard Dist.-Unatt. 115.00 13.80
38 Sub #430 S. Boston Dist.-Unatt. 13.80 4.16
39 Sub #433 Framingham Dist.-Unatt. 115.00 13.80
40 Sub#441 Roslindale Dist.-Unatt. 13.80 4.16
FERC FORM NO. 1 (ED. 12-96) Page 426.1

............. ~· ........... ,... ................... 1 i1j- "!IDi\.i original I
............. '-'' ....... ,... .... I
''-"'-'"' ........................ ,...., .. NSTAR Electric Company
(Mo, Da, Yr) End of 2015/04
(2) D A Resubmission I I
SUBSTATIONS (Continued)
5. Show in columns (1), U), and (k) special equipment such as rotary converters, rectifiers, condensers, etc. and auxiliary equipment for . increasing capacity.
6. Designate substations or major items of equipment leased from others, jointly owned with others, or operated otheiWise than by reason of sole ownership by the respondent. For any substation or equipment operated under lease, give name of lessor, date and period of lease, and annual rent. For any substation or equipment operated other than by reason of sole ownership or lease, give name of co"owner or other party, explain basis of sharing expenses or other accounting between the parties, and state amounts and accounts
"'1 affected in respondent's books of account. Specify in each case whether lessor, co-owner, or other party is an associated company.
Capacity of Substation Number of Number of CONVERSION APPARATUS AND SPECIAL EQUIPMENT Line (In Service) (In MVa)
Transformers Spare Type of Equipment Total Capacity No. In Service Transformers Number of Units
(In (~Va) (f) (g) (h) (i) U) I<)
142 3 Capacitors 2 19 1
80 2 2
15 3 3
20 1 . 4
215 3 Capacitors 2 11 5
15 3 6
13 2 7
250 4 8
10 2 9
15 2 10
10 2 11
31 3 12
10 2 13
26 3 14
160 2 Capacitors 3 74 15
13 2 16
( 10 2 17
10 2 18
10 2 19
100 1 20
190 2 Capacitors 2 19 21
22
128 2 Capacitors 2 57 23
15 .. 3 24
250 4. Capacitors 4 40 25
15 3 26
13 2 27
10 2 28
10 2 29
10 2 30
17 2 31
162 3 32
250 4 Capacitors · 2 206 33
160 2 Capacitors 1 5 34
19 2 35
125 2 36
100 2 37
20 2 38
188 3 Capacitors 1 5 39
l/ 20 2 40
FERC FORM N0.1 (ED. 12-96) Page 427.1

Naf!1e of Respondent This wort Is: Date of Report Year/Period of Report
NSTAR Electric Company (1) X An Original (Mo, Da, Yr)
End of 2015104 (2) 0 A Resubmission I I
SUBSTATIONS
1. Report below the information called for concerning substations of the respondent as of the end of the year. 2. Substations which serve only one industrial or street railway customer should not be listed below. 3. Substations with capacities of Less than 10 MVa except those serving customers with energy for resale, may be grouped according to functional character, but the number of such substations must be shown. 4. Indicate in column (b) the functional character of each substation, designating whether transmission or distribution and whether attended or unattended. At the end of the page, summarize according to function the capacities reported for the individual stations f-n column (f).
.. Line VOLTAGE (In MVa)
No. Name and Location of Substation Character of Substation Primary Secondary Tertiary
(a) (b) (c) (d) (e) 1 Sub #443 W. Roxbury Dist.-Unatt. 24.00 4.16
2 Sub #445 Chelsea Dist.-Unatt. 24.00 13.80
3 Sub #450 Waltham Dist.-Unatt. 115.00 13.80
4 Sub #454 Dorchester Dist.-Unatt. 13.80 4.16
5 Sub #455 Framingham Dist.-Unatt. 115.00 13.80
6 Sub #456 Dover Dist.-Unatt. 115.00 13.80
7 Sub #467 Watertown Dist.-Unatt. 115.00 13.80
8 Sub #468 W. Roxbury Dist.-Unatt. 24.00 4.16
9 Sub #469 W. SomeiVille Dist.-Unatt. 13.80 4.16
10 Sub #470 Canton Dist.-Unatt. 115.00 13.80
11 Sub #483 Dorchester Dist.-Unatt. 115.00 13.80
12 Sub #483 Dorchester Dist.-Unatt. 13.80 4.16
13 Sub #488 Chelsea Dist.-Unatt. 115.00 13.80
14 Sub #492 Boston Dist.-Unatt. 115.00 13.80
15 Sub #496 Hyde Park Dist.-Unatt. 115.00 13.80
( 16 Sub #506 Brookline Dist.-Unatt. 13.80 4.16
17 Sub #514 Boston Dist.-Unatt. 115.00 .13.80
18 Sub #516 W. Roxbury Dist.-Unatt. 24.00 4.16
19 Sub #533 Lexington Dist.-Unatt. 115.00 13.80
20 Sub #611 New Bedford Dist.-Unatt. 115.00 13.20
21 Sub #612 Acushnet Dist.-Unatt. 115.00 13.20
22 Sub #624 Acushnet Dist.-Unatt. 115.00 13.20
23 Sub #636 New Bedford Dist.-Unatt. 115.00 13.20
24 Sub #646 Mattapoisett Dist.-Unatt. 115.00 13.20
25 Sub #651 Dartmouth Dist.-Unatt. 115.00 13.20
26 Sub #654 Fairhaven Dist.-Unatt. 115.00 13.20 .
27 Sub #657 Dartmouth Dist.-Unatt. 115.00 13.20
28 Sub #661 Fall River Dist.-Unatt. 115.00 34.50
29 Sub #713 Wareham Dist.-Unatt. 115.00 23.00
30 Sub #714 Wareham Dist.-Unatt. 115.00 23.00
31 Sub#715 Plymouth Dist.-Unatt. 115.00 23.00
32 Sub #721 Plymouth Dist.-Unatt. 115.00 23.00
33 Sub #727 Plympton Dist.-Unatt. 115.00 23.00
34 Sub #735 KingstOn Dist.-Unatt. 115.00 23.00
35 Sub #737 Plymouth Dist.-Unatt. 115.00 23.00
36 Sub #738 Duxbury Dist.-Unatt. 115.00 23.00
37 Sub #739 Marshfield Dist.-Unatt. 115.00 23.00
38 Sub #7 45 Rochester Dist.-Unatt. 115.00 13.20
39 Sub #817 Cambridge Dist.-Unatt. 13.80 4.16
40 Sub #824 Cambridge Dist.-Unatt. 13.80 4.16
FERC FORM NO. "I (ED. 12-96) Page 426.2

'·-···- -· . ---r--··--···
I ~~i -~An Original I (Mo: oa: vr) ··· I . --··. - ·-- -· ... ,.. ...
NSTAR Electric Company End of 2015104 0 A Resubmission I I SUBSTATIONS (Continued)
5. Show in columns (1), Q), and (k) special equipment such as rotary converters, rectifiers, condensers, etc. and auxiliary equipment for increasing capacity. 6. Designate substations or major items of equipment leased from others, jointly owned with others, or operated otherwise than by
( reason of sole ownership by the respondent. For any substation or equipment operated under lease, give name of lessor, date and period of lease, and annual rent. For any substation or equipmerit operated other than by reason of sole ownership or lease, give name of co-owner or other party, explain basis of sharing expenses or other accounting betvveen the parties, and state amounts and accounts affected in respondent's books of account. Specify in each case whether lessor, co-owner, or other party is an associated company.
" Capacity of Substation Number of Number of CONVERSION APPARATUS AND SPECIAL EQUIPMENT Transformers Spare
Line (In Service) (In MVa) In SeiVice Transformers Type of Equipment Number of Units Total Capacity No.
(In MVa) (I) (g) (h) (i) Q) (k)
19 2 1
2
187 3 3
15 2 4
80 2 Capacitors 1 63 5
125 2 6
250 2 7
25 2 8
11 2 9
188 . 3 10
265 2 11
25 2 12
188 3 Capacitors 1 35 13
250 2 14
250 2 15
28 3 16
( 250 2 Capacitors 4 40 17
15 2 18
250 2 Capacitors 1 37 19
180 3 1 Capacitors 3 18 20
140 2 21
39 1 Capacitors 1 35 22
100 2 C~pacitors 2 10 23
40 1 24
125 2 Capacitors 2 10 25
39 1 26
40 2 27
30 2 28
40 2 29
50 1 30
45 2 Capacitors 1 5 31
50 1 Capacitors 1 5 32
50 1 Capacitors 1 5 33
40 2 1 Capacitors 2 5 34
100 2 Capacitors 2 5 35
100 2 36
50 1 Capacitors 1 5 37
25 2 38
18 2 . 39
11 2 40
FERC FORM NO. "I (ED. "12-96) Page 427.2

(
(
J Name of I i
NSTAR Electric Company End of 2015/04
an associated/affiliated comg~pa~ne~Y: fo~r~~ ~i~~~i r gOods:~nd: ""n1 1"'~=>.:: lor. must be specific in nature. should not attempt to include or aggregate · ~·Y,;"~.~ .... ,J ~~ .. !::lc'u"'~~
3. Where amounts billed to or I from· i j) f ar~.b~;ed on an allocation nrn , explain in a f,n+r nt<
Nameof_ Amount Line Charged or Charged or .
tNo~1-~~D;e;sc~rip~· :~o0n~0o~df5~th '~e~ (Nao~)_n~-P~ow~e~r;G~oo~d~o~~ :~e~rv~ic~e~!::::l (~jted 2
3
4
5 1 General 1 1 in a Holding'
6
7 .
8
_9
10
11
12
13
14
15 Officeand' li 1 Rental
16
17
18 Total Goods u• ,.,ooo 1 ! by,
22
23
24
251 Right of Way Fees
26
271 Office and i , Rental
28 .
29
30
31
32
33 Total Goods or Services c•u,ueu '"'.
34
35
36
37
39
40
41
42
FERC FORM NO. 1 (New) FERC FORM NO. 1-F (New)
/System 'Energy Service vu"'"""Y Various1
: _·, •'
NSTARGas 931
454
NSTAR Gas 454 679,149
_,
4,21i,ot
Page 429

Name of Respondent This Report is: Date of Report Year/Period of Report (1)~An Original (Mo, Da, Yr)
NSTAR Electric Company (2) A Resubmission I I 2015104
FOOTNOTE DATA

Name of Respondent This Report is: Date of Report Year/Period of Report (1) D;An Original (Mo, Da, Yr)
NSTAR Electric Company (2) A Resubmission I I 2015104
FOOTNOTE DATA
401 14,425,632 402 15,939 408 4 421 (74)
jFinance and Accounting Total 17,211,5661 General Administration 184 186
401 1,233,549 402 110,393 403 5,287,136 408 25,586 426
jGeneral Administration Total 6,656,850 1 Govt + Legislative Affairs .401 248,899
426 228,590 jGovt +Legislative Affairs Total 477,4891 Human Resources 228
236 401 68,452,451 402 1,834 408 5,841,433 426 134,972 431 7
( jHuman Resources Total 7 4,430,6971 Information Technology 107 1,442,863
165 2,734 184 472 232 (31,820) 242 3,409 401 23,096,699 402 1,367,572 426
jlnformation Technology Total 25,881,9291 Internal Audit+ Security 401 2,424,900
jlnternal Audit+ Security Total 2,424,9oo 1 Investor Relations 401 592,998
402 181
j1nvestor Relations Total 593,1791 Legal 107 13,197
143 2,546 186 11,954 232 21,768 242 (69) 401 5,101,251 402 1,758 426 219,613
I /FERC FORM NO. ·1 (E0.12-87) Page 450.2 \~·

. Name of Respondent This Report is: Date of Report Year/Period of Report (1) X An Original (Mo, Da, Yr)
NSTAR Electric Company (2) A Resubmission I I 20151Q4
FOOTNOTE DATA
(-/Lega I Tota I 5,372,018/ Miscellaneous 186 216,475
401 (25,777,208) 402 3,230
./ 403 (5,258,601) 408 (5,504,620) 421 355,996 426 10,775 431 151
/Miscellaneous Total (35,953,802)/ Operations Services 106
107 285,622 163 240 184 356,210 401 4,476,546 402 466,063 408 35 426 82
/operations Services Total 5,584,798/ Rates+ reg requirements 165 31,607
401 3,054,469 402 834
/Rates + reg requirements Total 3,086,9101 i ( Reg Affairs+ Community Relations 232 (1,165)
401 1,482,299 402 13,301 426 100,570
/Reg Affairs+ Community Relations Total 1,595,005/ Supply Chn + Env Affs +Property Mgmt 107 555,836
108 791 143 37,431 163 9,978,729 184 1,012,892 186 346,966 232 (86,567) 242 969 253 13,752 401 16,070,095 402 3,371,429 417 26,627 426 765 431
/supply Chn + Env Affs +Property MgmtTotal 31,329,715/ Transmission 107 322,890
108 5,802 186 1,749,995 cj IFERG FORM NO.1 (ED. 12-87) Page 450.3

Name of Respondent
NSTAR Electric Company
frransmission Total Grand Total
(
jFERC FORM NO.1 (ED. 12-87)
This Report is: (1)~An Original (2) A Resubmission
FOOTNOTE DATA
Page 450.4
401 402 426
Date of Report (Mo, Da, Yr)
I I
936,842 170,256
155
Year/Period of Report
2015104
3,185,940 1 211,511,318

(
INDEX
Schedule Page No.
Accrued and prepaid taxes ................................................. : . ..................... 262-263
Accumulated Deferred Income Taxes ..........................................................•......... 234
272-277
'iccumulated provisions for depreciation of
common utility plant ............................................................................. 356
utility plant .................................................................................... 219
utility plant (summary} ...................................................................... 200-201
Advances
from associated companies •.............................•..................................... 256-257
Allowances ....................................................................................... 228-229
Amortization
miscellaneous .................................................................................... 340
of nuclear fuel .............................................................................. 202-203
Appropriations of Retained Earnings .............................................................. 118-119
Associated Companies
advances from ................................................................................ 256-257
corporations controlled by respondent . , ................... , ............................ , , ......... 103
control over respondent .......................................................................... 102
interest on debt to .......................................................................... 256-257
Attestation ............................................................................................ i
Balance sheet
comparative .................................................................................. 110-113
notes to ..................................................................................... 122-123
Bonds ............................................................................................ 256-257
Capital Stock ........................................................................................ 251
expense .......................................................................................... 254
premiums ......................................................................................... 252
reacquired ....................................................................................... 251
subscribed ....................................................................................... 252
Cash flows, statement of ......................................................................... 120-121
Changes
important during year ........................................................................ 108-109
Construction
work in progress - common utility plant ............................. ·. . . . . . . . . . . . . . . . . . . . . . . . . . . . . 35 6
work in progress - electric ................................................................. , .... 216
work in progress - other utility departments ............................. · .................... 200-201
Control
corporations controlled by respondent ....................................... , . . . . . . . . . . . . . . . . . . . . 103
over respondent ....................................... , .. , ............................ , ...... , .. , 102
Corporation
controlled by .................................................................................... · ·103
incorporated . . . . . . . . . . . . . . . . . . . . . . . . . . . . . . . . . . . . . . . . . . . . . . . . . . . . . . . . . . . . . . . . . . . . . . . . . . . . . . . . . . . . . 101
CPA, background information on 101
CPA Certification, this report form ................................................................. i-ii
FERC FORM NO. 1 (ED. 12-93) Index

(
Schedule Deferred
INDEX (continued)
Page No.
credits, other . . . . . . . . . . . . . . . . . . . . . . . . . . . . . . . . . . . . . . . . . . . . . . . . . . . . . . . . . . . . . . . . . . . . . . . . . . . . . . . . . . . 2 69
debits, miscellaneous ............................................................................ 233
income taxes accumulated - accelerated
amortization property ................................ , ............................. , ......... 272-273
income taxes accumulated other property .................................................... 274-275
income taxes accumulated - other ............................................................. 276-277
income taxes accumulated- pollution control facilities .......................................... 234
Definitions, this report form
Depreciation and amortization
iii
of common utility plant .......................................................................... 356
of electric plant ................................................................................ 219
336-337
Directors ....................................... _ ..................................................... 105
Discount - premium on -long-term debt ............................................................. 256-257
Distribution of salaries and wages ............................................................... 354-355
Dividend appropriations ........................................................................... 118-119
Earnings, Retained ............................................................................... 118-119
Electric energy account .............................................................................. 401
Expenses
electric operation and maintenance ........................................................... 320-323
electric operation and maintenance, sununary ...................................................... 323
unamortized debt ....................... ; ......................................................... 256
Extraordinary property losses ........................................................................ 230
Filing requirements, this report form
General information . . . . . . . . . . . . . . . . . . . . . . . . . . . . . . . . . . . . . . . . . . . . . . . . . . . . . . . . . . . . . . . . . . . . . . . . . . . . . . . . . . 101
Instructions for filing the FERC Form 1 ................... , . , .......................... , ............ i-iv
Generating plant statistics
hydroelectric (large) ...................... , ...... , ... , ...................................... 406-407
pumped storage (large) ................................................................... , ... 408-409
small plants ................................................................................. 410-411
steam-electric (large) ....................................................................... 402-403
Hydro-electric generating plant statistics ....................................................... 406-407
Identification . . . . . . . . . . . . . . . . . . . . . . . . . . . . . . . . . . . . . . . . . . . . . . . . . . . . . . . . . . . . . . . . . . . . . . . . . . . . . . . . . . . . . . . 101
Important changes during year .................................................................... 108-109
Income
statement of, by departments .................................................................. 114-117
statement of, for the year (see also revenues) ............................................... 114-117
deductions, miscellaneous amortization ........................................................... 340
deductions, other income deduction
deductions, other interest charges
340
340
Incorporation information .............................. , .. , . . . . . . . . . . . . . . . . . . . . . . . . . . . . . . . . . . . . . . . . . . 101
FERC FORI\II NO.1 (ED. 12-95) Index 2
..

(
(
INDEX (continued)
Schedule Page No.
Interest charges, paid on long-term debt, advances, etc .........................•..................... 256-257
Investments ··~
nonutili ty property .............................................................................. 221
subsidiary companies ............................................................... ·: ......... 224-225
Jnvestment tax credits, accumulated deferred ...............................•..................... 266-267
Law, excerpts appliCable to this report form .......................................................... iv
List of schedules, this report form .................................................................. 2-4
Long-term debt ................................................................................... 256-257
Losses-Extraordinary property ........................................................................ 230
Materials and supplies ............................................................................... 227
Miscellaneous general expenses ....................................................................... 335
Notes
to balance sheet ............................................................................. 122-123
to statement of changes in financial position ................................................ 122--123
to statement of income ....................................................................... 122-123
to statement of retained earnings .......................................................... ' .. 122-123
Nonutility property ................................................................................... 221
Nuclear fuel materials ........................................................................... 202-203
Nuclear generating plant, statistics ............................................................. 402-403
Officers and officers' salaries ...................................................................... 104
Operating
expenses-electric ............................................................................ 320-323
expenses-electric (summary) ............................................................. · ......... 323
other
paid-in capital .................................................................................. 253
donations received from stockholders ............................................................. 253
gains on resale or cancellation of reacquired
capital stock 253
miscellaneous paid-in capital .............................. '.' .................................... 253
reduction in par or stated value of capital stock ................................................ 253
regulatory assets ................................................................................ 232
regulatory liabilities
Peaks, monthly, and output
Plant, Common utility
278
401
accumulated provision for depreciation . . . . . . . . . . . . . . . . . . . . . . . . . . . . . . . . . . . . . . . . . . . . . . . . . . . . . . . . . . . 356
acquisition adjustments .......................................................................... 356
allocated to utility departments ................................................................. 356
completed construction not classified ............................................................ 356
construction work in progress .................................................................... j56
expenses ......................................................................................... 356
held for future use .............................................................................. 356
in service ....................................................................................... 356
leased to others ................................................................................. 356
Plant data ................................................................................... 336-337
401-429
FERC FORM N0.1 (EO. 12-95) Index 3

( '
(
l
INDEX (continued)
Schedule Page No. Plant - electric
accumulated provision for depreciation . . . . . . . . . . . . . . . . . . . . . . . . . . . . . . . . . . . . . . . . . . . . . . . . . . . . . . . . . . . 219
construction work in progress .................................................................... 216
held for future use .............................................................................. 214
in service ................................................................................ , .. 204-207
leased to others ................................................................................. 213
Plant - utility and accumulated provisions for depreciation
amortization and depletion (summary} 201
Pollution control fa·cilities, accumulated deferred
income taxes ..................................................................................... 234
Power Exchanges ......................... ~ ..................................................... · ... 326-327
Premium and discount on long-term debt ............................................................... 256
Premium on capital stock ............................................................................. 251
Prepaid taxes .................................................................................... 262-263
Property - losses, extraordinary ..................................................................... 230
Pumped storage generating plant statistics ....................................................... 408-409
Purchased power (including power exchanges} ...................................................... 326-327
Reacquired capital stock ............................................................................. 250
Reacquired long-term debt ........................................................................ 256-257
Receivers' certificates .......................................................................... 256-257
Reconciliation of reported net income with taxable income
from Federal income taxes . . . . . . . . . . . . . . . . . . . . . . . . . . . . . . . . . . . . . . . . . . . . . . . . . . . . . . . . . . . . . . . . . . . . . . 2 61
Regulatory commission expenses deferre? .............................................................. 233
Regulatory commission expenses for year .......................................................... 350-351
Research, development and demonstration activities ............................................... 352-353
Retained Earnings
amortization reserve Federal ..................................................................... 119
appropriated ................................................................................. 118-119
statement of, for the year ................................................................... 118-119
unappropriated ........ · ....................................................................... 118-119
Revenues - electric operating .................................................................... 300-301
Salaries and wages
directors -fees . . . . . . . . . . . . . . . . . . . . . . . . . . . . . . . . . . . . . . . . . . . . . . . . . . . . . . . . . . . . . . . . . . . . . . . . . . . . . . . . . . . 105
distribution of ............................................................................... 354-355
officers' .......................................................................................... 104
Sales of electricity by rate schedules .............................................................. /. 304
Sales - for resale ............................................................................... 310-311
Salvage - nuclear fuel ........................................................................... 202-203
Schedules, this report form .......................................................................... 2-4
Securities
exchange registration ........ · ................................................................ 250-251
Statement of Cash Flows .......................................................................... 120-121
Statement of income for the year ................................................................. 114-117
Statement of retained earnings for the year ....................................................... 118-119
Steam-electric generating plant statistics ....................................................... 402-403
Substations . . . . . . . . . . . . . . . . . . . . . . . . . . . . . . . . . . . . . . . . . . . . . . . . . . . . . . . . . . . . . . . . . . . . . . . . . . . . . . . . . . . . . . . . . . 42 6
Supplies - materials and . . . . . . . . . . . . . . . . . . . . . . . . . . . . . . . . . . . . . . . . . . . . . . . . . . . . . . . . . . . . . . . . . . . . . . . . . . . . . 227
FERC FORI\Il N0.1 (ED. 12-90) Index 4

(
INDEX (continued}
Schedule Page No. Taxes
..
accrued and prepaid
charged during year
262-263
262-263
on income, deferred and accumulated ............. , ............................................... 234
272-277
reconciliation of net income with taxable income for •........................................... 261
-t _Transformers, line - electric ........................ , .............................................. 429
Transmission
lines added during year . . . . . . . . . . . . . . . . . . . . . . . . . . . . . . . . . . . . . . . . . . . . . . . . . . . . . . . . . . . . . . . . . . . . . 424-425
lines statistics . . . . . . . . . . . . . . . . . . . . . . . . . . . . . . . . . . . . . . . . . . . . . . . . . . . . . . . . . . . . . . . . . . . . . . . . . . . . 422-423
of electricity for others ... , , , , , ........................................................... 328-330
of electricity by others ........................................................................ 332
Unamortized
debt discount ...... , ........................................................................ 256-257
debt expense ................................................................................ 256-257
premium on debt ............................................................................. 256-257
Unrecovered Plant and Regulatory Study Costs ........................................................ 230
FERC FORM NO. 1 (ED. 12-90) Index 5


) f
DEPARTMENT OF PUBLIC UTILITIES
This statement is filed in accordance with Chapter 164, Section 84A
CONDENSED FINANCIAL RETURN
Item
OPERATING INCOME
FOR YEAR ENDED DECEMBER 31,2015
NSTAR Electric Company.
800 BOYLSTON STREET
BOSTON, MA 02199
STATEMENT OF INCOME FOR THE YEAR
Current Year
Operating Revenues ..................................................................... .
Increase or (Decrease) from Preceding Year
Operating Expenses: ..................................................................... ----------~---------Operation Expense .................................................................... . Maintenance Expense ........... : ................................................... . Depreciation ~xpense .......... : ..................................... ~---············ Amortization of Utility PlanL ..................................................... . Amortization of Property Losses ................................................ . Amortization of Investment Tax Credit.. .................................... . Regulatory Debits, net ....... : ...................................................... . Taxes other than Income Taxes ................................................ . Income Taxes ............................................................................ . Provisions for Deferred Federal income Taxes ......................... . Federal income Taxes Deferred In Prior Years (Credit) ............ .
Total Operating Expenses ....................................................... .
Net Operating RevenueS .......................................................... . Income from Utility Plant Leased to Others ............................... . Other Utility Operating Income ................•..................................
OTHER INCOME Income from Mdse. Jobbing & Contract Work .......................... . Revenues from Merchandising, Jobbing and Contract Work (Less) Costs and Exp. of Merchandising, Job. & Contract Work Equity in Earnings of Subsidiary Companies, net. ................... . Income from Nmlutility Operations ............................................... . NOnoperating Rental Income ...................................................... . Interest and Dividend Income ....................................................... . Interest Charged to Construction-Debit. .................................. . Miscellaneous Nonoperating Income .......................................... .
T a tal Other Income .................................................................. .
SEE THE ATTACHED AUDITED INCOME STATEMENT FOR 2015
IN THE FERC FORM 1 FORMAT
1-------j---------Total Income .............................................................................. .
MISCELLANEOUS INCOME DEDUCTIONS Miscellaneous Amortization .......................................................... . Other Income Deductions ............................................................. .
Total Income Deductions ......................................................... ·
Income Before Interest Charges ............................................... .
INTEREST CHARGES Interest on long-Term Debt. ........................................................ . Amortization of Debt Discount and Expense ............................... .. Amortiu:~tion of Premium on Debt-Credit.. .................................... . Interest on Debt to Associated Companies .................................. . Other Interest Expense ............................ , ................................. : .. . Interest Charged to Construction-Credit. ..................................... .
---------- --------1 Total Intere-st Ch~H'QSS;.:.-....... : ..... ::-::· .. :.-.-:: . .-............................... .
----------- -------Net Income ............................................................................... .

\ .J
I I I I I Title of Account 1 I I I UTILITY PLANT I I Utility Plant.. ..•....•.••..•..•..........••.•.•..•...•.........•..•...... I I I J OTHER PROPERTY f J AND INVESTMENTS J
J Nonutility Property ..••...••....•.......•........•....•...••.•......... I J InveStment in Associated Companies .•..•.•••.•............ J
J Other Investments ..•....•..........•..•.••......•...............•.. I J Special Funds .•.......•....•....•...•....•..•...............••.....•.... [ I I 1 Total Other Property and InVestments [
I I J CURRENT AND ACCRUED ASSETS .[ 1 cash ......................................................................•. 1 I Special Deposits ..•.....•.•.....•. ~ ......•.....•.......... : .....•...... [ J Working Funds ............•.....•.....•.........•......... : •.•......... [ 1 Temporary Cash Investments .............•..............•...... [ J Notes and Accounts Receivable ............•••..•.•.•.•..•.... [ 1 Receivables from Associated Companies ................. [ J Materials and Supplies ..•................•.•......•...•............ I I Allowances .•.•...•.....••.........•..............................•..... I [ Prepayments .. ." ......................................................... I I Rents Receivable ................................................... I I Accrued Utility Revenues .......................................... / 1 Misc. Current and Accrued Assets ............................ [
I I I I I I I I I Total Current and Accrued Assets................. . ... 1 I I [ DEFERRED DEBITS I J Unamortized Debt Discount and Expense.. ..1 I Temporary facilities ............... ,. ................................. J
J Unamortized Loss on Reacquired Debt.. ............... 1
I I I Reserve for Deferred Income Taxes ......................... ] I Regulatory Assets .................................................... I I Miscellaneous Deferred Debits ................................. J
I I I Total Deferred Debits ............................................. [
I I I CAPITAL STOCK DISCOUNT J
I AND EXPENSE I I Discount on Capital Stock...... . ....................... :.[ I Capital Stock Expense............... . ....................... [
I I I I I Total Capital Stock Discount and expense ............ 1
I I I REACQUIRED SECURITIES I I Reacquired Capital Stock.... ..................... I I Reacquired Bbnds....... .............................. ..[
I I I Total Reacquired Securities.......... . ............ [
I I I Total Assets and Other Debits........ . ............. /
I I I I I I I I I I I I I I I I I I I I I I I I I I
BAlANCE SHEET
I Balance I
End of Year I I I I
----1 I I I I I I
----1 I
----1 I I I I I I I I I I I I I I I
--'---1 I I
----1 I I I I I I I I
----1 I
----1 I I I I I
----1 I
----1 I I I
---~1
I --~-1
I ----1
I I I I I I I
Title of Account
I I I
--~~~~~~---1 PROPRIETARY CAPITAL I
CAPITAL STOCK I Common Stock Issued ............................................. I Preferred Stock Issued ............................................ I Capital Stock Subscribed.... ........................ ... I Premium on Capital Stock ........................................ [
I Total ....................................................................... I
I SURPLUS [
Other Paid-In Capital.. ............................................. I Eamed Surplus ....................................................... : I Surplus Invested in Plant... ...................................... I
I Total.. .................................................................... [
Total Propriety Capita!.. ........................... .. I I I
LONG-TERM DEBT [ Bonds............................................................ .. I Advances from Associated Companies ................... [ Other Long-Term Debt.. ............................... , ......... ]
Total Long-Term Debt ..................................... .
OTHER NON CURRENT LIABILITIES
I ·I I I
Asset Retirement ObligatiOns............... 1 Accumulated Provision for Pensions and Benefits.. 1
Total Other Noncurrent Obligations ..... . I
·I I
CURRENT AND ACCRUED [ . LIABILITIES I
Notes Payable .......................................................... J
Accounts Payable ........ : .......................................... I Payables to Associated Companies ........................ 1 Customer Deposits ................................................. I Taxes Accrued ......................................................... [ Interest Accrued ....................................................... ] Dividends Declared .................................................. J
Matured Long-Term Debt. ........................................ ] Matured Interest.......... .. .............................. [ Tax Collections Payable ........................................... J
Misc. Current and Accrued Liabilities ....................... 1
I Total Current and Accrued Liabilities......... .. ..... [
DEFERRED CREDITS I Ace. Deferred Investment Tax Credit.. .................... [ Unamortized Premium on Debt ............................... I Customer Advances for Construction ...................... [ Regulatory Liabilities........................ .. ............... ] Other Deferred Credits ............................................ [
Total Deferred Credits .................. .. I
···I I
RESERVES I Reserves for Depreciation ...................................... I Reserves for Amortization.... ...................... . ..... J
Reserves for Uncollectible Accounts ....................... 1 Operating Reserves ................................................ J
Reserve for Depreciation and Amortization 1 of Nonutility Property .............................................. 1
Reserves for Deferred Income Taxes ............ .-...... ,. .. [
I Balance ]
End of Year 1
----1 I I I I I I
-----1 I
-----1 I I I I
-----1 I
----1 I
-----1 I I I I
-----1 I
----1 I I I
----1 I
-----1 I I I I I I I I I I I I I
-----1 I
----1 I I I I I
-----1 I
----1 I I I I I I I I
I ----1 Total Reserves ........................................ . ······I I
-----1 I I I I I
CONTRIBUTIONS IN AID OF CONSTRUCTION I I
.... 1 I I
----1 I
Contributions in Aid of Construction.
Total Liabilities and Other Credits. I
···I
NOTES: SEE THE ATTACHED AUDITED BALANCE SHEET FOR 2015 IN THE FERC FORM 1 FORMAT.

\ )
STATEMENT OF EARNED SURPLUS
I Account :
Unappropriated Earned Surplus {at beginning of period) .......................................... J I
Balance Transferred from Income ...........•..........•..............•........•... --··············------····-1 Miscellaneous Credits to Surplus.............. ................• . ........................•. / Miscellaneous Debits to Surplus ..............................................•.....•.............•..•.....•... 1 Appropriations of Surplus ............. ,........................................... .. .......... I
Amount for Year
$279,814,205
348,616,445
I lnc/(Dec) from
: Preceding Year
I $44,458,606
I I 49,603,324
I (405,485)
I I -------1----------1
Net Additions to Earned Surplus ............................................ . .. ............ / 348,616,445 1 49,197,839
I -------1-------~--J Dividends Declared-Preferred Stock .......................................................................... 1 1,96o,ooo 1 o Dividends Declared-Common Stock ......................................................................... 1 .198,ooo,ooo ! (55,ooo,ooo)
I ·-----/ ------Unappropriated Earned Surplus {at end of period) ................................................... / $428,470,650 I $148.656,445
ELECTRIC OPERATING REVENUES
Operating Revenues Account
I Amount I J for Year J
SALES OF ELECTRICITY / / Residential Sales............................................................................................ .. 1 $1,212,327,526 1 Commercial and Industrial Sales .................................................................. I I
Small (or Commercial} ........................................................................................... 1 1, 175,123,892 1 Large (or Industrial) ................................. ,. ................. .. ......................... 1 84,603,962. 1
Public Street and Highway Lighting ................. ~..................... . .. 1 11,500,865 1 Other Sales to Public Authorities................................................................ .. ... I I Sales to Railroad and Railways..................... . .. -............................. .. I I Interdepartmental Sales......... . ... I I Miscellaneous Electric Sales....................... ................. . ...... 1 1
lnc!(Dec) from Preceding Year
$107,395,969
25,264,191 (5,038, 790)
(97,816)
I ------·/ ------1 Total Sales to Ultimate Consumers ....................................................................... I 2,483·,556,245 1 127,523,554
(65,134,721) (10,700,000)
SalesforResale...................................... .. ................................... ) 127,020,411 1 Less: Provision for Rate Refunds........... .......................... .. ....... / (4,100,000) 1
I ---------/ ----·---Total Sales of Electricity .................................................... .. ............... / 2,614,676,656 1 73,088,833
OTHER OPERATING REVENUES I 1------Forteited Discounts......................................................................... . ...................... 1 3,769,404 1 1,143,209 Miscellaneous Service Revenues................ ......................... .. I Sales of Water and Water Power................. ................. ......................... ..1 Rent from Electric Property......... ...................... ................................ . .. ) 10,752,681 (1,200,323) Interdepartmental Rents................. .................... ........................ . ... 1 I Other Electric Revenues.............................. ................. .. ...... 1 368,416,132 1 80,658,181
I ---------1 -------Total Other Operating Revenues .......... . ......... 1 382,938,217 1 80,601,os7
I ---·------1 -------Total Electric Operating Revenues ..................... . ........ 1 $2,997,614,873 J $153,689,900
r-----------------------------------'--------------------~ SUMMARY OF ELECTRIC OPERATION AND MAINTENANCE EXPENSES
Functional Classification 1 Operation Maintenance 1 Total
/oPo:-o:-w-e"r"Pc-ro-:d;:-u:-ct"'io-:n"Ex~p"e"ns-e-:s-... -.. -.. -. --------.... l $ $ / ~$-------/ Electric Generation I J
Steam Power............ ...................... I J
Nuclear Power........... .. ... I I Hydraulic Power ........ . .: .. / I Other Power ... .J I I
Other Power Supply Expenses. .../ 1,142,643,626 1 1 1,142,643,626 I ---------I ·-·-. ------·-/ ------
Total Power Production Expenses ................ .. -1 1,142,643,626 I o 1 1,142,643,626 Transmission Expenses .. {Note) .. .. .. 1 377,659,972 1 8,863,367 1 386,523,339 Distribution Expenses .................... .. ... J 67,402,027 J 36,650,968 1 104,052,995 Customer Accounts Expenses .. .. J 229,299,255 1 1 229,299,255 Sales Expenses.. . .................... . .... J 1,215,803 1 1 1,215,803 Administrative and General Expenses .. ...J 158,524,795 1 3,315 J 158,528,110
I -------- I -------------1 ----------Total Electric Operation and Maintenance Expenses ........ ) $1,976,745,478 1 $45,517,650 1 $2,022,263,128 Note: Includes $295,677 Regional Transmission and Market Op Expense
---···--·----··--··

GAS OPERATING REVENUES
Operating Revenues
Account
SALES OF GAS Residential Sales .................................................................................................... . Commercial and Industrial-Sales
Smarr (or Commercial) ............................................................................................. .. Large {or Industrial).................................... . .................................................... ..
Other Sales to Public Authorities ............................................................................. .. Interdepartmental Sales ...................................................... . Miscellaneous Gas Sales .......................................................................... .
Total Sales to Ultimate Consumers .......... : ............................................................... . Sales for Resale ..................................... : ........................................................ .
Total Sales of Gas ........................................................ .
OTHER OPERATING REVENUES
Miscellaneous Service ReVenues ........................................................................... . Revenues from Transportation of Gas to Others ...................................................... . Sales of Products Extracted from Natural Gas ......................................................... . Revenues from Natural Gas Processed by Others .................................................... . Rent from Gas Property ........................................................................................... . Interdepartmental Rents ............................................................................. . Other Gas Revenues ................................................................................................ .
Total Other Operating Revenues ............................................................................ ..
Amount for Year
NONE
NONE
NONE
NONE 1-------
Total Gas Operating Revenues ................ .. NONE
SUMMARY OF GAS OPERATION AND MAINTENANCE EXPENSES
Functional Classification Operation
NONE Steam Production .............................. . .
ManUfactured Gas Production ......................... . Other Gas Supply Expenses.
Total Production Expenses .............................. . NONE Local Storage Expenses .................................. . Transmission and Distribution Expense ........ . customer Accounts Expense ....................... .. Sales Expense ........................................... . Administrative and General Expenses ............. .
Total Gas Operation and Maintenance Expenses ...... .NONE
April 15, 2016, J hereby certify thai the foregoing statements are full, just and true to the best of my knowledge and belief. This statement is signed under the penalties of perjury.
Maintenance
NONE
NONE
NONE
Increase or {Decrease) from Preceding Year
NONE
NONE
NONE
NONE
NONE
Total
NONE
NONE
NONE
r 1 .
\tM ~ --:t-_t /'_ Philip!!. Lembo- Vice\: !dent and Tr~rer
Jay S. Buth - Vice,resident, Contflmer and Chief Accounting Officer

Name of Respondent
NSTAR Electric Company An Original A Resubmission
COMPARATIVE BALANCE SHEET
FERC FORM NO.1 (REV. 12-031 Pa<1e 110
Date of Report (Mo, De, Yr)
I I
Year/Period of Report
End of 201SIQ4

Name of Respondent
NSTAR Electric Company An Original A Resubmission
COMPARATIVE BALANCE SHEET
FERC FORM N0.1 (REV. 12-03) Page 111
Date of Report (Mo, Da, Yr)
I I
AND OTHER
Year/Period of Report
End of 2015104
Current Year Prior Year End Balance
12/31 Ref. End of QuarterlY ear
Page No. Balance

Name of Respondent
NSTAR Electric Company
This Report is:
(1) [X] An Original A Resubmission
Date of Report (mo, da, ytj
I I
Year/Period of Report
end of 2015/04
COMPARATIVE BALANCE SHEET (LIABILITIES AND OTHER CREDITS)
FERC FORM NO.1 (rev. 12-03)
Title of Account (a)
Page '112
Ref. Page No.
(b)
Current Year Prior Year End of Quarter/Year End Balance
Balance 12/31 (c) (d)

Name of Respondent
NSTAR Electric Company
litle of Account (a)
This Report is:
(1) [XI An Original A Resubmission
(LIABILITIES
Date of Report (mo, da, yr)
Year/Period of Report
I I
Ref. Page No.
(b)
end of
CREDITtS)ntinued) Current Year
End of Quarter/Year Balance
(c)
2015104
PriorY ear End BalanCe
12131 (d)

NameonRe5(X~~~--------------------~IT~J§~?rf~~~----------ll--~rteEf~P."'~----r-~~~>.>r~~~~~--l
NSTAR Electric Company End of 2015/Q4
1. Report in column (c). the current year to date balance. Column (c) equals the tot~! of adding the data in column (g) plus the data in column (i) plus the /'l.uo.a in column (k). Report in column (d) similar data for the previous year. This information is reported in the annual filing only.
Enter in column (e) the balance for the reporting quarter and in column {f) the balance for the same three month period for the prior year. Report in column (g) the quarter to date amounts for electric utility function; in column 0) the quarter to date amounts for gas utility, and in column (k)
quarter to date amounts for other utility function for the current year quarter. Report in column (h) the quarter to date amounts for electric utility function; in column (j) the quarter to date amounts for gas utility, and in column (I) quarter to date amounts for other utility function for the prior year quarter.
If additional columns are needed, place them in a footnote.
or Quarterly if applicable Do not report fourth quarter data in columns (e) and (f) Report amounts for accounts 412 and 413, Revenues and Expenses from Utility Plant Leased to Others, in another utility columriin a similar manner to
utility department. Spread the amount(s) over lines 2 thru 26 as appropriate. Include these amounts in columns (c) and (d) totals. Report amounts in account 414, Other Utility Operating Income, in the same manner as accounts 412 and 413 above.
Line No.
\ J.
FERC FORM NO. 1/3-Q (REV. 02-04) Page 114

End of 2015/Q4
important notes regarding any concise explanations concerning unsettled rate proceedings where a contingency exists such that refunds of a material amount may need to be
to the utility's customers or which may result in material refund to the utility with respect to power or gas purchases. State for each year effected revenues or costs to which the contingency relates and the tax effects together with an explanation of the major factors which affect the rightS
utility to retain such revenues or recover amounts paid with respect to power or gas purchases. Give concise explanations concerning significant amounts of any refunds made or received during the year resulting from settlement of any rate
I ococe,ediina affecting revenues received or costs incurred for power or gaS pu~ches, and a summary of the adjustments made to balance sheet, income, expense accounts.
12. If any notes appearing in the report to stokholders are applicable to the Statement of Income, such notes may be included at page 122. 13. Enter on page.122 a concise explanation of only those changes in accounting methods made during the year which had an effect on net income, including the basis of allocations and apportionments from those used i·n the preceding year. Also, give the appropriate dollar effect ·of such changes. 14. Explain in a footnote if the previous year's! quarter's figures are different from that reported in prior reports. 15. If the columns are insufficient for reporting additional utility departments, supply the appropriate account titles report the information in a footnote to
1 schedule. · ·

I'IICUIII; Ul 1"\.I::::Sf..IUIIUen[
NSTAR Electric Company
Line No.
FERC FORM NO. 1/3-Q
Title of Account
from
End of
Page 117
2015/04
Quarterly Only No 4th Quarter

Name of Respondent This Report is: (1) 2S; An Original
NSTAR Electric Company (2) A Resubmission FOOTNOTE DATA
/Schedule Page: 114 Line No.; 49 Column: c Note that for the year ended December 31, 2015, the total expenses in Account 426.5 includes a transmission related I,Schedule Page: 114 Line No.: 49 ·Column: d Note that for the year ended December 31, 2014, the total expenses in Account 426.5 includes a transmission related
Date of Report Year/Period of Report (Mo, Da, Yr)
I I . 20151Q4
amount of Public Education component of $0.
amount of Public Education component of $0.

Name of Respondent This Report is: Date of Report Year/Period of Report (1) c; An Original (Mo, Da, Yr)
NSTAR Electric Company (2) A Resubmission I I 20151Q4
FOOTNOTE DATA .
/Schedule Page: 110 Line No.: 72 Column: c I For Form 1 reporting purposes, the following reclassification of debit or credit balance accounts at December 31, 2015 are being included with Account 182.3- Other Regulatory Assets. The balances are as follows:
Balance in Account 182.3
Reclass of balances from Account 254: Deferred Energy Efficiency
Reclass of balances to Account 254: Transition ReconciliationCambridge Electric Company
Reclass of balances to Account 254: Deferred Smart Grid costs
Reclass of balances to Account 254: CPSL costs
Account 182.3 Being Reported
$1,310,140,707 Dr.
136,934,424 Dr.
792 917 Dr.
581 455 Dr.
1 906 640 Dr.
$1,450,356,143 Dr.
/Schedule Page: 110 Line No.: 72 Column: d l .J For Form 1 reporting purposes, the following reclassification of debit or credit balance
accounts at December 31, 2014 are being included with Account 182.3 - Other Regulatory Assets. The balances a_re as follows:
Balance in Account 182.3 $1,283,582,220 Dr.
Reclass of balances from Account 254: Deferred Energy Efficiency 62,384,765 Dr.
Reclass of balances to Account 254: Transition Reconciliation - Boston Edison 2,750,926 Dr.
Reclass of balances to Account 254: Transition Reconciliation - Commonwealth Electric Company 11,395,071 Dr.
Reclass of balances to Account 254: Transition Reconciliation -Cambridge Electric Company 688,439 Dr.
Reclass of balances to Account 254: Long term renewable contract adjustment 3,178,777 Dr.
Account 182.3 Being Reported $1,363,980,198 Dr.
IFER.C FORM NO.1 (ED. 12-87) Page 450.1

Name of Respondent This Report is: Date of Report Year/Period of Report (1) X An Original (Mo, Da, Yr)
NSTAR Electric Company (2) A Resubmission I I 2015104
FOOTNOTE DATA
)Schedule Page: 112 Line No.: 2 Column:d Information on Formula Rates:
Page 1 06.2 lines 1 Amount stipulated per contract. (Schedule Page: 112 Line No.: 3 Column:d Information on Formula Rates:
.,.,::, .. . :. Page 1 06 lines 16, 19 and 23 Amount stipulated per contract.
Page 106.21ines 1, 5 Amount stipulated per contract. (Schedule Page: 112 Line No.: 16 Column: d Information on Formula Rates:
Page 106.2 lines 1, 5 Amount stipulated per contract. (Schedule Page: 112 Line No.: 18 Column: d Information on Formula Rates:
Page 106.2 lines 1, 5 Amount stipulated per contract.. (Schedule Page: 112 Line No.: 21 Column: d Information on Formula Rates:
) Page 1061ines 16, 19 and 23 Amount stipulated per contract.
Page 106.2 lines 1, 5 Amount stipulated per contract. (Schedule Page: 112 Line No.: 60 Column: c For Form 1 reporting purposes, the following reclassification or debit or credit balance accounts at December 31, 2015 are being included with Account 254 - Other Regulatory
·Liabilities. the balances are as follows:
Balance in Account 254 Reclass of balances from Account 182.3:
Deferred Energy Efficiency Reclass of balances to Account 182. 3:
Transition Reconciliation - Cambridge Electric Company Reclass of balances to Account 182.3:
Deferred Smart Grid costs Reclass of balances to Account 182.3:
CPSL costs
Account 254 Being Reported )Schedule Page: 112 Line No.: 60 Column: d
$126,737,747 Dr.
136,934,424 Cr.
792,917 Cr.
581,455 Cr.
1, 906, 640 Cr.
$13,477' 689 Cr.
For Form 1 reporting purposes, the following reclassification of debit or credit balance accounts at December 31, 2014 are being included with Account 254 - Other Regulatory Liabilities. The balances are as follows:
Balance in Account 254
Reclass of balances. to Account 182: Deferred Energy Efficiency
f Reclass of balances from Account 182: ~-} Transition Reconciliation - Boston Edison
Reclass of balances from Account 182:
$ 53,933,639 Dr.
62,384,765 Cr.
2, 750,926 Cr.
c:l f_:E::_R:c:C:..:F:_:O::.:R:..:M""--'-N"'0:::._,1_.(:;::ED::.:·:...1,.,2:_:-8::_7L.) ---'-------'--Pa"'g"'-e .::45:::0·:..:.1 __ --'----'--'-----""'--------=--"--'"------'------'-'-""'-'·.c;J' _

c Name of. Respondent This Report is:
(1) ~An Original NSTAR Electric Company (2) A Resubmission
FOOTNOTE DATA
Transition Reconciliation - Commonwealth Electric Company Reclass of balances from Account 182:
Transition Reconciliation - Cambridge Electric Company Reclass of balances from Account 182:
Long term renewable ·contract adjustment
Account 254 Being Reported
/FERC FORM NO.1 (ED._12-8 . .:.,7)t__ __ _
Date of Report Year/Period of Report (Mo, Da, Yr)
I I 2015104
11,395,071 Cr.
688,439 Cr.
3,178,777 Cr.
$ 26,464,339 Cr.

Commonwealth of Massachusetts Department of Public Utilities
One South Street Boston, MA 02110
STATEMENT OF OPERATING REVENUES
YEAR 2015
Name of Company NSTAR Electric Company
D/B/A
Address BOO Boylston Street
Boston, MA 02199-8003
Massachusetts Operating Revenues (Intrastate) $2,483,556,245
Other Revenues (Outside Massachusetts)
'~otal Revenues !
$0
$2,483,556,245
I hereby certify under the penalties of perjury that the foregoing statement is true to the best of my knowledge and belief.
Signature
Name JayS. Buth
Location on Annual Return
FERC Form 1, page 300, line 10, column b
Title Vice President, Controller and Chief Accounting Officer
The purpose of this statement is to provide the Department of Public Utilities with the amount of intrastate operating revenues for the annual assessment made pursuant to G.l. c. 25, § 18.
If invoices or correspondence are to be addressed to a particular individual or department of the Company, please provide the name, title, and address below.
Name
... )tie Address

(
NSTAR Electric Company Massachusetts Supplement to the FERC Form No. 1
General Information
Notes Receivable·
Accounts Receivable
Production Fuel and Oil Stocks
Table of Contents
Deferred Losses from Disposition of Utility Plant
Notes Payable
Payables to Associated Companies
Deferred Gains from Disposition of Utility Plant
Operating Reserves
Sales of Electricity to Ultimate Customers
Other Utility Operating Income
Overhead Distribution Lines Operated
Electric Distribution Services
Street Lamps Connected to System
Rate Schedule Information
Advertising Expenses
Charges for Professional and Other Consulting Services
Deposits and Collateral
Signature Page
Extracts of the General Laws
S1-S3
S4
ss S6
S7
sa S9
S10
S11
S12
S13
S14
S14
S15
S16
S17
S18
S19
S20
S21

J
J
I 1 j
i 1 i ,,
(
j (
f l
l I ! I l t
l
Name of Respondent This Re ort Is:
NSTAR Electric Company
~:r An Original
A Resubmission
GENERAL INFORMATION
PRINCIPAL AND SALARIED OFFICERS AS OF DECEMBER 31, 2015*
Tilles Nemes Addre$SeS
Chalnnan Thomas J. May 600 Boylston street, Boston, MA 02199
Chief Executive Officer Werner J. Schweriger 107 selden Street, Berlin, CT 06037
President and ChiefOperalingOif.cer Craig A. Hallstrom 1165 Massachusett~ Ave. Dorchester, MA 02125
Executive Vice President and Chief Financial Officer James J. Judge 800 Boylston Street, B?s!On, MA 02199
Senior \/Ice President ami General Counsel Gregory B. Buder 56 Prospect Street Hartford, CT 05103
Senior VIce President-Transmission James A. Muntz 56 Prospect Street Hartford, CT 08103
Vice Presid~mt ·supply Chain, Environmental Affairs and Property Management Ellen K Angley One NSTAR Way, Westwood, MA 02090
Vice President, Controller and Chief AccounUng Officer Jays. Buth 107 Selden Street, Be~in, CT 06037
Vice President-Energy Supply James G. Daly One NST AR WSy, Westwood, MA 020ll0
Vice President-Eieclric Field Operations Douglas W. Foley 1165 Massachusetts Ave, Dorchester, MA 02125
Vice President - Eleclric System Operalions Michael F. Hayhurst 1165 Massachusetts Ave, Dorchester, MA 02125
Vice President and Treasurer Philip J. Lembo One NSTAR Way, Westwood, MA 02090
Vice President· Engineering Paul R. Renaud One NSTAR Way, Westwood, MA 02090
Secretary and Clerk Richard J. Morrison BOO Boylston Street, Boston, MA 02199
(A) Represents the portion oftbe !Otal annual salary allocated tlJ NSTAR Electric by EvenourOO Energy Senrice Crunpcny.
DIRECTORS AS OF DECEMBER 31, 201 ~
Names Addresses
Gregory B. Butler 56 Prospect Street Hartford, CT 06103
James J. Judge 800 Boylslon street, Boston, MA 02199
Thomas J. May 800 Boylston Slreet, Boston, MA 02199
Werner J. Schwei er 107 Selden Street Berlin CT 06037
• By General laws, Chapter 164, Seclion 83, lhe Retum must oontain a "list of the names of alllhelr salaried officers and the amount of the salary paid to each," and bySeclion 77, the department is required to include in Its annual report '1ha names and addresses of the principal officers and of the directors."
(.B) See page SI-B for clumges in incumbents.
S-1
Date of Report Year of Report
December 31, 2015
Annual Salaries (A)
$395,147
199,404
242,626
192,436
149,853
69,930
79,789
86,867
76,908
210,050
191,301
57,447
206,000
69,549
Fees Paid During Year
None
None
Nona
None

i .j
l \( l
I
Name of Respondent
NSTAR Electric Company
This Report Is: (1) [KJ An Original
(2) 0 A Resubmission
Date of Report (Mo, Da, Yr)
GENERAL INFORMATION (Continued)
1. Corporate name of company making this report, NSTAR Electric Company
Year of Report
December 31, 2015
J 2. Date of organization, December 26, 1885
l ~ l 1 1 I
i ' 1 l '
I !
(
3. Date of incorporation, January 8, 1886
4. Give location (including street and number) of principal business office: 800 Boylston Street, Boston, MA 02199
5. Total number of stockholders, see page S2-A
6. Number of stockholders in Massachusetts, see page S2-A
7. Amount of stock held in Massachusetts, No. of shares, see page S2-A
8. Capital stock issued prior to June 5, 1894, No. of shares, 481,700; par value $481,700
9. Capital stock issued with approval of Board of Gas and Electric Light Commissioners or Department of Public Utilities since June 5, 1894, No. of shares, Total, shares, par value, $ , outstanding December 31 of the fiscal year
' see page S2-A
10. If any stock has been issued during the last fiscal period, give the date and terms upon which such issue was offered to the stockholders, and if the whole or any part of the issue was sold at auction, the date or dates of such sale or sales, the number of shares sold and the amounts realized therefrom.
None
11. Management Fees and Expenses during the Year.
List all individuals, corporations or concerns with whom the company has any contract or agreement covering management or supervision of its affairs, such as accounting, financing, engineering, construction, purchasing, operation, etc., and show the total amount paid to each for the year:
Eversource Energy Service Company rendered various services at actual costs amounting to $211,511 ,318
S-2

I
I I( l I
I I I
I .I
l l l j j I j
-1
l
-.)
I
i ;
(
NSTAR Eleciric Company Year Ended December 31, 2015
Item 5: Total number of stockholders: Common 4.25% preferred 4. 78% preferred
General Information ~ continued
Item 6: Number of stockholders in Massachusetts: Common 4.25% preferred 4. 78% preferred
Item 7: Amount of stock held in Massachusetts: Common 4.25% preferred 4. 78% preferred
1 52 57
1 5 8
No. of shares 100 544 534
Item 9: Capital stock issued with approval of Board of Gas and Electric Light Commissioners or Department of Public Utilities since June 5, 1894:
Common 4.25% preferred 4. 78% preferred
Total shares Qncluding item 9), par value, outstanding at December 31, 2015:
Common 4.25% preferred 4. 78% preferred
No. of shares 100
180,000 250,000
No. of shares 100
180,000 250,000
S-2A
Par value $ 100 $ 54,400 $ 53,400
Par value $ 100 $ 18,000,000 $ 25,000,000
Par value $ 100 $ 18,000,000 $ 25,000,000

I
l lr ' ! '
I l
l 1 '
I
(
This Report Is: (1)[XJ An Original
Name of Respondent
NSTAR Electric Company 2)11 A Resubmission
Date of Report (Mo, Da, Yr)
GENERAl INFORMATION (Continued)
S3 Year of Report
December 31, 2015
Names of the cities or towns in which the company supplies ELECTRICITY, with the number of customers' meters in each place.
Number of Customers' Number of Customers'
Watthour Meters, Watthour Meters,
City or Town December 31,2015 City or Town December31, 2015
Acton 10,463 Mattapoisett 3,904
Acushnet 4,563 Maynard 5,112
Arlington 21,755 Medfield 4,978
Ashland 7,629 Medway 5,251
Aquinnah 557 Middleboro 3
Barnstable 30,806 Millis 3,718
Bedford 6,246 Milton 10,501
Bellingham 1,734 Natick 17,311
Boston 278,168 Needham 12,519
Bourne 12,637 New Bedford 48,551
Brewster 9,149 Newton 41,014
Brookline 26,084 Norfolk 3,827
Burlington 11,606 Oak Bluffs 4,850
Cambridge 54,006 Orleans 6,613
Canton 10,538 Pembroke 67
Carlisle· 2,042 Plymouth 30,334
Carver 5,803 Plympton 1,319
Chatham 8,565 Provincetown 5,782
Chelsea 16,007 Rochester 2,334
Chilmark 1,827 Sandwich 11,293
Dartmouth 14,518 Scituate 721
Dedham 11,278 Sharon 6,855
Dennis 17,337 Sherborn 1,763
Dover 2,294 Somerville 38,764
Duxbury 6,764 Stoneham 10,860
Eastham 6,844 Sudbury 7,073
Edgartown 6,025 Tisbury 3,901
Fairhaven 8,262 Truro 3,591
Falmouth 24,552 Walpole 10,568
Framingham 30,543 Waltham 30,058
Freetown 4,104 Wareham 14,847
HaiWich 11,544 Watertown 17,968
Holliston 6,245 Wayland 5,682
Hopkinton 6,498 Wellfleet 4,872
Hyde Park 37,929 West Tisbury 2,629
Kingston 6,067 Weston 4,378
lakeville 458 Westport 5,575
Lexington 13,470 Westwood 6,156
Lincoln 2,628 Winchester 8,566
Marion 3,228 Woburn 20,808
Marshfield 12,418 Yarmouth 18,759
Mashpee 11,863 *Foreign 289
Total 1,209,018
*Represents ''fnnge" or "fore1gn terntory". It IS electnc power provided by NSTAR Electrrc Company through mutual agreement into another's franchise area(s). Generally this service is rendered due to convenient plant facilities, geographic location, and/or basic economic consideration.

1 (~ '
I I 1
(
Name of Respondent This Report Is: Date of Report (1)[KJ An Original (Mo, Da, Yr)
NSTAR Electric Company (2)0 A Resubmission
NOTES RECEIVABLE (Account 141)
1. Give the particulars called for below concerning notes receivable at end of year. 2. Give particulars of any note pledged or discounted. 3. Minor items may be grouped by classes, showing number of such items. 4. Designate any note the maker of which is a director, officer or other employee.
Line Name of Maker and Purpose for Date of Date of No. Which Received lssu.e Maturity
(a) (b) (c) 1 2 3 4 5 6 7 8 9
10 11 12 13 14 15 16 17 18 19 20 21
22
S4 Year of Report
December 31, 2015
Interest Amount End Rate of Year (d) (e)
·Total $0

S5 Name of Respondent This Report Is: Date of Report Year of Report
(1)[Kj An Original (Mo, Da, Yrj ( NSTAR Electric Company (2J0 A Resubmission December 31, 2015
ACCOUNTS RECEIVABLE (Accounts 142, 143) 1. Give the particulars called for below concerning accounts receivable at end of year. 2. Designate any account included in Account 143 in excess of $5,000 .
.
Line Description Amount End of Year No. (a) (b)
1 Customers (Account 142): 2 Electric $ 211,299,666 3 4 other Electric and Gas Utilities 564,603 5 Other Accounts Receivable (Account 143): 6 Officers and employees 7 Due on subscriptions to capital stock (state class
series of stock) 8 9 Miscellaneous (group and describe by classes):
10 Receivable for tax refunds 72,000,000 11 Purchase of Receivables 53,100,829 12 Verizon-Joint owned poles 7,234,878 13 Property Damage Claims 3,510,038 14 U.S. Army Engineering District 550,000 15 Energy efficiency financing program 3,492,399 16 Massachusetts DOT 571,344
(
.
Total $ 352,323,757

~
i Name of This Report Is: Date of Report
!NSTAR Electric Company
(1) [X] An Original
(2)n A Resubmission ; IIUN FUEL AND OIL STOCKS(lncludedTn
(Except Nuclear Materials) 1. Report below the information called for concerning production fuel and oil stocks. 2. Show quantities in tons of 2,000 lbs., gal., or Mel, whichever unit of quantity is applicable. 3. Each kind of coal or oil should be shown separately. ~ Show electric fuels separately bv specific use
Oil
Year of Report
31,2015 lt151)
-- ·-- --------~-
Kinds of Fuel and Oil Jetfuel
I Line No.
Item _M
Total Cost (b) I (c) BBLS
Cost (d)
uuamrry I Cost !e! BBLS (f)
- 1ibn l:laDd Be[iinnin~f Year 2 Received During Year 3 TOTAl 4IUsed During Year (Note A)
Electric #6 oil; Jet fuel #2 oil
71 Steam sold from 8 Misc. 9 Sold or Transferred-
1 0 TOTAL DISPOSED OF 11 BALANCE Ef\ID _9F_YE:f\R
I Line No. JiJOn Hand Beginning of Year 13 Received During Year 14 TOTAl - - - uring Year (Note A)
ic - fossil st · ' - jet turbines
Steam sold from I .::1 "liiiiSc:' - -20 Sold or Transferreo 21 TOTAL DISPOSED OF 2~ _ 8_!\l,O,NCE~ND OF YEAR
Item (g)
-
_$0
-Note A-- Indicate specific purpose for which used, e.g:, Boiler Oil, Make Oil,
- - ·- - --- --
___ .:._Ki:::ln.::d:.:s of Fuel and Oil (C
Natural Gas
Quantity I Cost (h) MCF (i)
r Fueil, efc.
Ouantltv (j)
Cost (k)
) S6

S?
Name of Respondent This Report Is: Date of Report Year of Report (1)[]] An Original (Mo, Da, Yr)
(' NSTAR Electric Company (2)0 A Resubmission December31, 2015
DEFERRED LOSSES FROM DISPOSITION OF UTILITY PLANT (Account 187) 1. In column (a) give a brief description of property creating the deferred loss and the date the loss was recognized. Identify items by
department where applicable. 2. Losses on property with an original cost of Jess than $50,000 may be grouped. The number of items making up the grouped amount
shall be reported in column (a). 3. In column (b) give the date of Commission approval of joumal entries. Where approval has not been received, give explanation
following the resoective item in column (aL (See Account 187, Deferred Losses from Sale of Utility Plant.
Current Year
Unei Date J.E. Total Amount Balance Amortizations Additional Balance No. Description of Property Approved of Loss Beginning of Year to Ace. 411.8 Losses End of Year
(a) (b) (c) (d) (e) m (g)
1 $0 $0 $0 $0 $0 2 3 NONE 4 5 6 7 8 9
10 11 12 13 14 15 16 17 18 19 20 21 22 23 24 .
25 Total $0 $0 $0 $0 $0
(

SB
Name of Respondent This Report Is: Dale of Report Year of Report (1)[K] An Original (Mo, Da, Yr)
NSTAR Electric Company (2)0 A Resubmission December 31,2015
NOTES PAYABLE (Account 231) Report the particulars indicated concerning notes payable at end of year.
Date of Date of Int. Balance End Line Payee Note Maturity Rate of Year No. (a) (b) (c) (d) (e)
1 2 Commercial Paper Various Various 0.400'% $ 62,500,000 3 4 5 6 7 8 9
10 11 12 13 14 15 16 17 18 19 20
21 Total $ 62,500,000

S9 Name of Respondent Thi~ R,port Is: Date of Report Year of Report
(1) X An Original (Mo, Da, Yr)
NSTAR Electric Company (2)0 A Resubmission December 31,2015
PAY ABLES TO ASSOCIATED COMPANIES (Accounts 233, 234) Re art particulars of notes and accounts payable to associated companies at end of vear.
Amount Interest for Year Line Name of Company End of Year Rate Amount No. . ('"./._ (b) (c) (d)
1 Eversource Energy Service Company $ 31,457,497 2 NSTAR Gas Company 4,175,897 3 Western Massachusetts Electric Company 2,778,570 5 Connecticut Light and Power Company 192,380 6 Public Service Company of New Hampshire 38,942 7 NSTAR Communications Inc. 4,253 8 9
10 11 12 13 14 15 16 17 18 19 20
( 22 Totals $38,647,539 $ -

••. ,_ ·=···~-___;_,..:.,, -~----"-'- -------~~---~---~ ... ----···¥··----~-~.--
~-~ ~,
r v10 Name ot Respondent Thi! Rerrt Is: Date of Report Year of Report
(1) X An Original (Mo, Da, Yr)
NSTAR Electric Company (2)0 A Resubmission December 31, 2015
DEFERRED GAINS FROM DISPOSITION OF UTILITY PLANT (Account 256) 1. In column (a) give a brief description of property creating the deferred gain and the date the gain was recognized. Identify items by department
where applicable. 2. Gains on property with an original cost of less than $50,000 may be grouped. The number of items making up the grouped amount shall be
reported in column (a). 3. In column (b) give the date of Commission approval of journal entries. Where approval has not been received, give explanation following the
! respective item in column (a). (See Account 256, Deferred Gains From Sale of Utility Plant.)
Current Year
Line Date J.E. Total Amount Balance Amortizations Additional Balance No. Description of Property Approved of Gain Beginning of Year toAcc. 411.6 Gains End of Year
(a) . (b) (c) (~) ~) _(f)_ (g) 1 NONE $0 $0 $0 $0 $0 2 3 4 5 6 7 8 9
10 11
.
12 13 14 15 16 17 18 19 20 21 22
23 Total $0 $0 $0 $0 $0

( S11
Name of Respondent This Reeort Is: Date of Report Year of Report C1H X I An Original (Mo, Da, Yr)
NSTAR Electric Company (2)1 I A Resubmission December 31 , 20 15
OPERATING RESERVES (Accounts 228 & 229)
1. Report below an analysis of the changes during the year for each of the above-named reserves. 2. Show name of reserve and account number, balance beginning of year, credits, debits and balance at end
of year. Credit amounts should be shown in black, debit amounts enclosed by parantheses. 3. Each credit and debit amount should be described as to its general nature and the contra account debited
or credited shown. Combine the amounts of monthly accounting entries of the same general nature. If respondent has more than one utilfty department contra accounts debited or credited should indicate the utility department affected.
4. For accounts 261, Property Insurance Reserve, and 262, Injuries and Damages Reserve, explain the nature of the risks covered by the reserve.
5. For Account 265, Miscellaneous Operating Revenues, report separately each reserve composing the account and explain briefly its purpose.
Note: Per FERC order 390 in 1984, accounts 261~265 were renumbered to accounts 228.~229
Balance@ Contra Balance@ Line Item 01/01/2015 Account (debit)/credit 12/31/2015 No. (debit)/credit Charged
1 Account228 2 3 Accumulated provision for injuries and damages $28,809,127 925 $ 382,572 $29,191,699
4 Accumulated provision for pensions and benefits 242,076,316 182.3 (35,998,836)
( 146 5,501,793 219 441,923 212,021,196
5 Accumulated miscellaneous operating provisions (134,000) 224 (876,404) (1,010,404) 6 7 8 Total account 228 $ 270,751,443 $ (30,548,952} $ 240,202,491 9 Account229
10 11 Customer refund reserve $ 33,500,000 456 $ (28,900,000) 12 593 $ 800,000 5,400,000 13 14 15 Total account 229 $ 33,500,000 $ (28,100,000) $ 5,400,000

S12 Name of Respondent Thij Rerort Is: Date of Report Year of Report
(1) X An Original (Mo, Da, Yr)
NSTAR Electric Company (2)0 A Resubmission Decernber31,2015
( SALES OF ELECTRICITY TO ULTIMATE CONSUMERS
Report by account, the KWh sold, the amount derived and the number of customers under each filed schedule or contract. Contract sales and unbilled sales may be reported separately in total.
Average Number of Customers Revenue (Per Bills Rendered) per KWh (cents)
Line Account Schedule KWh Revenue (0.0000) July 31 December .31 No. No. (a) (b) (c) (d) (e) (f)
1 see page S12A-D, page 304 of FERC Form 1. 2 3 4 5 6 7 8 9
10 11 12 13 14 15 16 17
( 18 19 20 21 22 23 24 25 26 27 28 29 30
31 Total sales to ultimate consumers

NSTAR Electric Company (1) !!!An Original (2) FiA Resubmission
SALES ' JF ELto<; 1 Klt;ll f BY RATE S
(Mo, Da, Yr) I I I End of 2015104
1. Report below for each rate schedule in effect during the year the MWH of electricity sold, revenUe, average number of customer, average Kwh per customer, and average revenue per Kwh, excluding date for Sales for Resale which is reported on Pages 310-311. 2. Provide a subheading and total for each prescribed operating revenue account in the sequence followed in "Electric Operating Revenues," Page "~n 'ln· If the sales under any rate schedule are classified in more than one revenue account, List the rate schedule and sales data under each
( >plicable revenue account subheading. J. Where the same customers are served under more than one rate schedule in the same revenue account classification (such as a general residential I ~~::7:~:~r:and an off peak water heating schedule), the entries in column (d) for the special schedule should denote the duplication in number of reported
4. The average number of customers should be the number of bills rendered during the year divided by the number of billing periods during the year (12 if all billings are made monthly). 5. For any rate schedule having a fuel adjustment clause state in a footnote the estimated additional revenue billed pursuant thereto. 6. Report amount of unbilled revenue as of end of year for each applicable revenue account subheading.
':oe~onu IIUe Ul ""'e IVIV~~)i>OIQ (c) of -(rJr~'!~~el PerTer KVI(~ Sold
1 ~~==~j3~~·~s;,~.5;~~~==7~11,s~.,7~99,,91 ~2==~~543,~014==~~~6,6~J===~~o~.11:9~96 R-2_ i lC . -101G"" 322,148 OU>_"'V,.,._. 54,772 5,882 0.1121
R-3Res. Space 455,947 87! ~4,91 10,15~ ll:1_909
4 R-4' Time ofUse-123F 2,06; 11E 17,77E IJ3051
~IS:2_Streetlighting 141F 461 31,5T 51,22; ~~
I R-1 6,44~ 0.161S
IR-2 i 1G 172,424 27,804 6,201 0.1211
'R-3 Res. Space 31. 24,244 9,650 0.1334
R-4-R~< .Sp.Heat-323G 30,61:1 3,130,800 2,614 11,711 0.1023
11 R-5" I jWater 10,477 1, '""' 6,211 1,685 0.1454
1· R-6 Opt. Res. TOU-325F 36~ 75,89i 31 9, 71· 0.2051
1< S-1 Street lighting 54( 147,91E 1,07< 504 0.273£
13IR-1 175,02E 37,651,96< 40,547 4,31~ 0.21s1
14IR-2 1H 9,94E t"?4oc 2,293 4,338 0.1239
151 R-3Res. Space 12,348 2,772,157 1,649 7,488 0.2245
6 . Assist. Sp H_"_at :223H 1 .~66 173,536 176 7, 19c 0.1371
1 R-5 ~ I res. TC 26 5,256 , 13,00C 0:~02<
H R-60pt. Res. Sp. HeatT 1: · 2,981 13,00( 0~8
1S S-1 St lighting 20~ . 1 ,OOC 0~
' in unbilled -25,60~ . 0.0343
211Total
22
23IG-1
241
G-2
25'G-3 Lg
i 130F
i 131F .
2f R-1
21 R-3 Res. Space
21 S-1 Street lighting
2q S-2 Street lighting
3Ci S-3 '::'"'uuuf lighting
-122F
31 T-1 i TimeofUse-133F
32 T-2 Ti111e of Use-134F
33 SG3 _
135G
3E G-1 I
3: G-2 ~d,General 1 , ,-
31IG-3 Lgc_(3eneral - 332F
3S[G-4 I P
IG-~ I space~,,_-•• ~,
41 I U_IAL <lilled 42 Total Unbil/ed Rev.CSee lnstr. 6) 43 TOTAL
FERC FORM NO. 1 (ED. 12-95)
6,687,471 1 ,212,327,52E 1, 6,601 0.1813
511,971 97,766,688 71,703 7,14( 0.191(
?R'"Rn1 350,119,421 29,086 91,23c 0.131£
? """ "" 136,003 603 341 7,381,101 0.052S
17,58C . ? 444 ORf 2,66< 6,60< 0.1390
4, 15~ ss. o,; 7€ 54,671 0.1572
S< 9,791 1:1 4,750 0.1719
44 9 4,889
71 11,278 15 4,733 0.1581
~8 28,673 3' 4,941 0.1707
3,921 ,Sj'~ 320,048,784 2,84< 1 ,3·oo,vv• 0.0816
14,24~ 7~1,859 _1424~.nnr 0.0507
101,~ ? _11)1,126,00C O.CJ333 ·
. 42,0!j_1 42 ns1 nnn · o D3'l' 1 ,015,f!!3 111 ,41!1,1J:34 44,059 23,041 0.11)_98
441 434 29,667,89£ 419 tn!i3 54: O.IJil72
n4 605 49 4,787,857 0.0~82
1,~ ~0 15 78,20( 0.06~3
14,54: 1, 82£ _17,54< 0.1_(l60
21,130,67, -75,39<
21 055 28f
-277,001
Page 304
1 '187, 191 (
1,187,19!
17,79f (
17,73~
0.1_1_7~
0.0~
0.118(

NSTAR Electric Company I (1) ~An Original (Mo. Da, Yr) I End of 2015104 (2) 0 A Resubmission I I
SALES OF ELECTRICITY BY RATES HEDULES
1. Report below for each rate schedule in effect during the year the MWH of electricity sold, revenue, average number of customer, average Kwh per customer, and average revenue per Kwh, excluding date for Sales for Resale which is reported on Pages 310-311. 2. Provide a subheading and total for each prescribed operating revenue account in the sequence followed in "Electric Operating Revenues," Page
,_. _300-301. If the sales under any rate schedule are classified in more than one revenue account, List the rate schedule and sales data under each ( '>plici:lble revenue account subheading .
.s. Where the same customers are served under more than one rate schedule in the same revenue account classification (such as a general residential schedule and an off peak water heating schedule), the entries in column (d) for the special schedule should denote the duplication in number of reported customers. 4. The average number of custorhers should be the number of bills rendered during the year divided by the number of billing periods during the year (12 if all billings are made monthly). 5. For any rate schedule having a fuel adjustment clause state in a footnote the estimated additional revenue billed pursuant thereto. 6. Report amount of unbilled revenue as of end of year for each applicable revenue account subheading .
ine .. umoer anu ooue oo "a'e sc euuoe IVIVVn .OOIU "evenue AVerage,~"-umHer ~~~?~sfo",;,";r ~6~older No. (a) (b) (c)
of Cufcbomers (f) 1 G-6 All Electric School- 335F 4,437 220,170 7 633,857 0.0496
2 G-7 General TOU - 336F 46,187 3,906,523 466 99,114 0.0846
3 R-1 Residence - 320F 330 52,450 78 4,231 0.1589
4 R-5 Water Htg. - 324F 222 27,458 80 2,775 0.1237
5 S-1 Street lighting 5,552 1,054,049 2,967 1,871 0.1899
6 CON- MIT MAG Lab 1 '711 241,892 1 1,711,000 0.1414
7 G-0 General Non-demand-230G 38,881 6,445,241 5,136 7,570 0.1658
8 G-1-General Service-231G 208,049 25,320,186 2,035 102,235 0.1217
9 G-2 General Service - 232G 576,287 40,404,953 429 1,343,326 0.0701
10 G-3 General Service-233G 522,414 20,732,246 65 8,037,138 0.0397
11 G-4 General TOU - 234G 5,405 295,667 32 168,906 0.0547
12 G-5 Commcial Sp. Htg.- 235G 8,532 763,530 60 142,200 0.0895
13 MS-1 Main! Servi13.8KV-2381 8,865 248,400 1 8,865,000 0.0280
14 SB-1 Stanby Svcei13.8KV-2371 28,778 1,016,414 1 28,778,000 0.0353
15 SB-G3 CAMB 26,885 1,973,594 1 26,885,000 0.0734
( · 6 SS1 Supp Servi13.8KV-239G 46,466 1,907,844 1 46,466,000 0.0411
1 7 R-1 Residence-220G 3 803 1 3,000 0.2677
18 S-1 Street lighting 401 84,894 131 3,061 0.2117
19 S-2 Street lighting 72 5,397 1 72,000 0.0750
20 Change in unbilled -45,992 622,000 -0.0135
21 Total Commercial 13,025,724 1,175,123,892 163,655 79,593 0.0902
22
23 G-1 General Service-130F 1,431 194,939 169 8,467 0.1362
24 G-2 General Service-131 F 50,708 8,118,132 524 96,771 0.1601
25 G-3 General Servcie~ 132F 759,847 41,801,347 129 5,890,287 0.0550
26 H2-General Service 607 56,538 1 607,000 0.0931
27 T -2 Time of Use-134F 123,516 13,825,692 128 964,969 0.1119
28 CON -Canal 31,135 3,855,743 1 31,135,000 0.1238
29 G-1 General Service -330F 10,270 1,358,567 117 87,778 0.1323
30 G-2 General Service-331F 53,706 4,351,687 63 852,476 0.0810
31 G-3 General Service - 332F 194,342 9,804,103 38 5,114,263 0.0504
32 G-4 General Power-333F 1,237 190,415 13 95,154 0.1539
33 G-7 Optional General TOU-336F 153 21,354 5 30,600 0.1396
34 S-1 Street lighting 32 6,676 10 3,200 0.2086
35 G-0 General Non-Demand-230G 30 6,065 5 6,000 0.2022
36 G-2 Generai-232G 2,688 237,99 5 537,600 0.0885
37 G-3 General- 233G 22,016 795,708 6 3,669,333 0.0361
38 Change in unbilled -3,795 -21,001 0.0055
39 Total Industrial 1,247,923 84,603,962 1,214 1,027,943 0.0678
1"--/ 41 TOTAL Billed 21,130,671 2,483,833,246 1,187,19 17,79£ 0.117" 42 Total Unbilled Rev.(See lnstr. 6) -75,39 -277,001 c c 0.003 43 TOTAL 21,055,28€ 2,483,556,245 1,187,19 17,73" 0.1180
FERC FORM NO. 1 (ED. 12-95) Page 304.1

I (1) I!JAn Original I (Mo, Da, Yr) I End of 2015/Q4 r-NSTAR Electric Company (2) EjA Resubmission I I
SALES OF ELECTRICITY BY RATE SCHEDULES
1. Report below for each rate schedule in effect during_ the year the MWH of electricity sold, revenue, average number of customer, average Kwh per customer, and average revenue per Kwh, excluding date for Sales for Resale which is reported on Pages 310-311. 2. Provide a subheading and total for each prescribed operating revenue account in the sequence followed in "Electric Operating Revenues," Page
( -:?tp0-301. If the sales under any rate schedule are classified in more than one revenue account, List the rate schedule and sales data under each plicable revenue account subheading .
.j_ Where the same customers are seJVed under more than one rate schedule in the same revenue account classification (such as a general residential schedule and an off peak water heating schedule), the entries in column (d) for the special schedule should denote the duplication in number of reported customers. 4. The average number of customers should be the number of bills rendered during the year divided by the number of billing periods during the year (12 if all billings are made monthly). 5. For any rate schedule having a fuel adjustment clause state in a footnote the es~imated additional revenue billed pursuant thereto. 6. Report amount of unbilled revenue as of end of year for each applicable revenue account subheading.
Ltne Numoer ana IItie or Kare scneawe IVIVVn ::>ola Kevenue Average.Numoer ~~~?~s?o~ir ~B~ofder No. (a) (b) (c) of Cu{IJ\omers (f)
1 S-.1 Street Lighting-140F 6,680 2,010,168 101 66,139 0.3009
2 S-2 Street Lighting Energy-141 F 60,222 . 4,832,513 4,782 12,593 0.0802
3 S-3 Outdoor Lighting-142F 13,601 2,361,881 2,956 4,601 0.1737
4 G-1 General Service-330F 1,318 200,986 507 2,600 0.1525
5 S-1 Outdoor Lighting-340S 3,417 856,744 596 5,733 0.2507
6 S-2 Street Light Gust Owned-341T 4,002 660,176 32 125,063 0.1650
7 G-0 General Non-demand-230G 1,244 167,951 222 5,604 0.1350
8 G-1 General Service- 231G 592 67,538 10 59,200 0.1141
9 S-1 Street Lighting-240G 657 150,988 8 82,125 0.2298
10 S2 Street Light Gust Owned-241 F 2,428 191,920 38 63,895 0.0790
11 Total Street Lighting 94,161 11,500,865 9,252 10,177 0.1221
12
13
14
15
( ' 17
18
19
20
21
22
23
24
25
26
27
28
29
30
31
32
33
34
35
36
37
38 .
39 I
~
41 TOTAL Billed 21 '130,671 2,483,833,246 1,187,191 17,79 0.117
42 Total Unbilled Rev.(See lnstr. 6) -75,39 -277,001 c ( 0.003
43 TOTAL 21 ,055,28€ 2,483,556,245 1,187,191 17,73 0.1180
FERC FORM NO.1 (ED. 12-95) Page 304.2

(
(
S/,;t-JJ Name of Respondent This Report is: Date of Report Year/Period of Report
(1) 2S An Original (Mo, Da, Yr) NSTAR Electric Company (2) A Resubmission I I 2015104
FOOTNOTE DATA
!Schedule Page: 304 Line No.: 1 Column: a MWh Sold {Column b) represents all energy deliveries to customers. Revenues(Column c) include deli very revenues as well as energy revenues for those customers who receive· their energy supply from NSTAR via Basic Service or NSTAR Green. Since revenues do not include the supply cost to customers of competitive energy suppliers, revenue per KWh sold (Column f) is not necessarily representative of the average customer bill.
IFERC FORM NO.1 (ED. 12-87) Page 450.1

813 Name of Respondent Thij Refort Is: Date of Report Year of Report
{1) X An Original (Mo, Da, Y!J NSTAR Electric Company {2)0 A Resubmission December 31,2015
OTHER UTILITY OPERATING INCOME {Account 414) Report below the particulars called for in each column.
Amount Gain or Amount of Amount of of Operating {Loss) from
Line Property Investment Revenue Expenses Operation No. (a) (b) (c) (d) (e)
1 $0 $0 $0 $0 2 3 4 5 6 7 8 9
10 11 12 13 14 15 16 17
( 18 19 20 21 22 23 24 25 26 27 28 29 30 31 32 Totals $0 $0 $0 $0

( \
(
S14 Name of Respondent Thij Rerort 1s: Date of Report Year of Report
( 1) X An Original (Mo, Da, Yr)
NSTAR Electric Company (2J0 A Resubmission December 31,2015
OVERHEAD DISTRIBUTION LINES OPERATED
Line Length (Pole Miles) No. Wood Poles Steel Towers Total
1 Miles--beginnillflof year 10,802 10,802 2 Added during year 45 45 3 Retired during year 99 99 4 Adjustment* (2,765 (2,765) 5 Miles--end of year 7,983 7,983 6 7 8 Distribution System Characteristics--A. C., phase, cycles and operating voltage for light and power. 9
10 A. C. three phase 60Hz, 24kV, 13.8kV, 4.16kV, 6DOV, 480V, 240V, and 208V. 11 12 A. C. single phase 60Hz, 8kV, 2.4kV, 277V, 120V and 120/24DV. 13 14 *In previous years the overhead distribution lines were reported in conductor miles. This year we have 15 changed to reporting in circuit miles which agrees to the Company's GIS records. Due to this change, 16 an adjustment of (2, 765) has been made.
17
ELECTRIC DISTRIBUTION SERVICES
Line Item Electric No. Services
18 Number at beginning of year 658,039 19 Additions during year: 20 Purchased 0 21 Installed 5,045 22 Associated with utility plant acquired 0 23 Total additions 5,045 24 Reductions during year: 25 Retirements 6,615 26 Associated with utility plant sold 0 27 Total reductions 6,615 28 Number at end of year 656,469

r \_
INanie of
NSTAR Electric
\Line\ City or No. Town
I-
(a) !Acton*
v Aauinnah 4 Arlin ton* 5 Arlin ton 6 Ashland* 7 Barnstable. 8 Barnstable* 9 Bedford•
1ham
H s H
t
lover
han iiic); ·rtown*
)Uth
This Report Is: -v-----. "n Original
~
DBTe of Report (Mo, Da, Yr)
Aori115. 2016
STREET LAMPS CONNECTED TO SYSTEM
Total (Q)
I,Jj..l•:u I Other (g) -- (d)
.:.1 1'
3, __b
455
_2
15
8 562
s. E 2,074 ~-5-
1·
__§_
2, 6
1
1
2
1
2§._
_(e)
v Vapor
1
31
~
1
1'
4:
15
11
Other _m
:)()
-16
1:
_j_
1
-4
__:)}_
Sodium 'Pe -Meta!Halide-
l.<I!JCII I other _(g) (h)
590 I 65
8
2,5· S±
6
741
312
6T
272
136 3~ I 66
153
15 85
1'
25!3_
256
104
.12
185 -55'
I Other
(i) (j) 358
5
18
__§__
12
2
2_
31
11'-'11-'•
(k)
LE IVIUIIII..Ol!J
(I) 378
20.753
104
880
4 691
__n_
-1 566 2.033
__b
276
\
S15 Year of Re-porf
·r 31, 2015
Other l•v•u•ut,;Lpcul 1VIumc1pa1
(m) (n) __(Ql_
_B
2
15j
11_
43
_:1~
258

r
\Name of rte::;ponuem
:Electric 1
\Line No.
~ ~
City or Town
(a)
!Iiston
Total (b)
494'
~
----·"-~~-- ·~·-·-·-·- --~~ ·--~--~ ,_,,
~
This Report Is: Date of Report (Mo, Da, Yr)
Aoril15, 2016 Js_JAn Original ---,A-
"'""""'I Other (c) (d) (e)
__<__
STREET LAMPS CONNECTED TO SYSTEM
LY'_~_QQf Other
m
1 11
§_odj _Iype
F-_"iM'-e"ta::;I"_Hr::a'"-llde tvtuntctpe~t \ Other
(Q) (h)
IVIUfl
m I m 4 94/
~ 14i 123
15 _jl _
J!sl._ _1Q_
181 __ I __ L~ 8 9
-,
s1s-A Year of Report
r31,2015
LED Induction-! Fil-e ATarms · :ipal Other Municipal! Municipal
(I) Jml in) .1_~-
5 !,Q88_
2~~ I ___ 5! __ I~ __ ~~lL_~ 5181 221 I 1 I 20 I I ±:: L I I ~ Kiiiilston" - - 353 35
53 Lakeville 16 2 14 I I I' I 54 LexinQton• 3 569 1 36 4 I 902 I I _ _ _ __j_ g,626 -1
55 Lincoln 267 19 11 2 _.). _.). _.). __j. 235 1 56 Marion 438 8 4 323 103
t::""J' rt.J1 ... t"r<h-t:1,1...J -1 'lAO 1Q 819 301
f-i
§ ~
:tm*~dford ~dford*
luffs Oak Bluffs• Orf~ans Orleans"
438 3,304
2,:
__]_,; ___§,
_1_
-:o::
__<__
1
1 2
-88--2
3
29 1 1221
41
2,8: 398
1_ll_ 1_ll_
5 89
19-
11
5
341
634
203
7-:-421
461
277
__1_
168
_1§_

r '
I Name of
NSTAR Electric'
lune No.
City or Town
:al
Total
_(QL 9
968
A ·-·-"''-•• ~'' -~--·-·-"·"- '"---"-
This Report Is: JC]An Original ~A"• ...
~
Date of Report (Mo, Da, Yr)
April15, 2016
STREET LAMPS CONNECTED TO SYSTEM
pe Sodium -- -MelaiH
Other Municipal! Other (g) I _ill) _ill _l_ (iL
'-'1!-IC:II l Other
- (gL_ _l__j<j)_
Other
_ill_ __w _Q_
IVI~IIIl.olj.JCII
_(k) (I)
Other
(ml
-,
515-8 Year of Report
r31,2015
I Flee Alarms
(n) (O)
-~ _1.
~~I s61 61 31 I 9
1 I I 3 _ill_
1-
iinceto, hester dwich *
mdWi'Cfl ;cituate
dbury~
•burv •bury*
rruro tm Truro* 97 Wakefi-'-' "" •nr_, __
4,285 _1, ~
6
1
_]_
34 91 _2:j_
_]_
1
5_
____§
40 I I 1.86 4,1451---1-_1 1_ -- _3,7~
.I§_
""""1'25
7~
_7£
ham 16 23 Vareham* -~ ~
-:392
242
1 517
21_4
_E._
~ 3§4
Wayland 734 427 141 150 16
1
1u'+ Wellfleet 61 3 54 1 3 '"51)/yellfleet• 236 14 222
828 4 824 bury 8 1 ____ __ -~ _________ _1_ a
13 VeSiPort -- - 288 - 92 I 183 I _I 13
4£
1 1u vVestwood* 1120 4 1116 .. " .. ''Vinchester 59 4 55 ! I
;ter• 1 702 154 I 1548 r • 4,243 _ __ _ __ _ _ __ 173_1 _ _l _ _L _l _ _ 1- __ 4,07.0
Yarmouth- 3 24 Yarmouth• 2 424
1189 52 3 461 313 7 321 374 308 912_ _82,365 424 2,626 1,480

(".
I 816
Name of Respondent rhis report is: lDate of Report: ~~ear of Report: (1) X An Original (Mo, Da, Yr)
NSTAR Electric ComoanY (2)l A Resubmission December31, 2015
RATE SCHEDULE INFORMATION 1. Attach copies of all filed rates for general consumers (at end of report)
2. Show below the changes in rate schedules during year and the attac~e0~ increase or decrease In the annual revenue predicated on the previous ar's o erations.
Estimated Effect on
Date M.D.P.U. Rate Annual Revenues
Effective Number Schedule Increases Decreases
Ia\ /b) I c l I d) tel
01/01/201 5 120F R-1 Residential $72,173,012
01/01/201 5 121G R-2 Residential Assistance 1,347,685
01/01/201 5 122F R-3 Residential Space Heating 8,911,516
01/01/201 5 123F R-4 Optional Residential Time of Use 82,168
01/01/201 5 320F R-1 Residential 12,302,973
01/01/201 5 321G R-2 Residential Assistance 1,220,848
01101/201 5 322F R--3 Residential Space Heating 535,819
01101/201 5 323G R-4 Residential Assistance Space Htg. 315,151
01/01/201 5 324F R-5 Controlled Water Heating (13,367)
01/01/201 5 325F R-6 Optional Residential Sp Htg. TOU 7,555
01/01/201 5 220G R-1 Residential 5,321,843
01/01/201 5 221H R-2 Residential Assistance 134,525
01/01/201 5 222G R-3 Residential Space Heating 411,536
01/01/201 5 223H R-4 Residential Assistance Space Htg. 12,091
01/01/201 5 224G R-5 Optional Residential TOU 2,975
01/01/201 5 225G R-6 Optional Residential Sp Htg. TOU 263
01/01/201 5 132F G-3 General Service (8,641,718)
01/01/201 5 134F T-2 Time· of Use (10,094,910)
( 01/01/201 5 136E SB-G3 General Service -Standby (76,798)
01/01/201 5 135G WR Special Contract (339,172)
01/01/2015 AM Amtrak Transmission Special Contract (38,129)
01/01/201 5 331F G-2 Medium General Service TOU (4,088,555)
01/01/2015 332F G-3 Large General Service TOU (1 ,692,377)
01/01/2015 CON Special Contract MIT Mag Lab (25,439)
01/01/2015 CON Special Contract Can/ 608,698
01/01/2015 232G G-2 Large General Service TOU 2,389,523
01/01/2015 233G G-3 Large General Service TOU 13.8kv 3,728,698
01/01/2015 2381 MS1 68,527
01/01/2015 2371 SB-1/MS-1/SS-1 Standby Service/13.8kv 192,195
01/01/2015 239G SS1 336,109
01/01/2015 255F SB-G3 General Service- Standby (261,401)
01/01/2015 130F G-1 General Service 7,630,236
01/01/2015 131F G-2 General Service 21,360,283
01/01/2015 132F H2-General Service 5,114
01/01/2015 133F T -1 Optional General Time of Use 6,291
01/01/2015 330F G-1 General Service (2, 143,802)
01/01/2015 333F G-4 General Power Service (45,339)
01/01/2015 334F G-5 Commercial Space Heating (18,767)
01/01/2015 335F G-6 All Electric Schools (62,247)
01/01/2015 336F G-7 Optional General TOU 657,282
01/01/2015 230G G-0 General Service Non-Demand 992,325
01/01/2015 231G G-1 General Service 3,034,291
01/01/2015 234G G-4 General Power Service (42,472)
01/01/2015 235G G-5 Commercial Space Heating 47,920
01/01/2015 140R S-1 Street Lighting 428,044
01/01/2015 141F S-2 Street Lighting Energy Rate (304,725)
01/01/2015 142R S-3 Outdoor Lighting Rate 196,666
01/01/2015 340S S-1 Street Lighting (12)
01/01/2015 341T S-2 Street Lighting Customer Owned (313,417)
01/01/2015 240S S-1 Street Lighting 32,036
~ .• j 01/01/2015 241R S-2 Street Uahtina Customer Owned (117,997
Totals 144494198 ($28 20 644)

S17 Name of Respondent This Report Is: Date of Report Year of Report
(- (1)[]] An Original (Mo, Da, Yr)
NSTAR Electric Company (2)0 A Resubmission December 31, 2015
ADVERTISING EXPENSES
Line Account I Type General Description Amount for Year No. No. (a) (b) . (c)
1 930.1 Television, radio, print, and online Brochure inserts for customer bills $75,579 2 advertisting 3 4 5 6 7 8 9
10 11 12 13 14 15 16 17 18 19 20 21
( 22 23 24 25 26 27 28 29 30 31 32 33 34 35 36 37 38 39 40 41 42 43 44 45 Total $75,579

(
Name of Respondent Thij Refort Is: (1) X An Original
Date of Report (Mo, Da, Yry
Year of Report S18
NSTAR Electric Company (2)0 A Resubmission December 31,2015 .·f.'
CHARGES FOR OUTSIDE SERVICES 1. Report the information specified below for all charges made during the year included in any. account (including plant
accounts) for outside services, such as services concerning rates, management, construction, engineering, research, financial, valuation, legal, accounting, purchasing, advertising, labor relations, and public relations, rendered the respondent under written or oral arrangement, for which aggregate payments during the year to any corporation, partnership, organization of any kind, or individual (other than for services as an employee or for payments made for medical and related services) amounted to 5% or more of total charges for outside professional and other consultative services, including payments for legislative services except those which should be reported in Account 426.4, Expenditures for Certain Civil, Political and Related Activities:
(a) Name and address of person or organization rendering services, (b) description of services received during year and-project or case to which services relate, (c) basis of charges, (d) total charges for the year, detailing utility department and account charges.
2. For aggregate payments to any one individual, group, partnership, corporation or organization of any kind in excess of $25,000 (not included in No.1), there shall be reported the name of the payee, the predominant nature of the services performed and the amount of the payment. Amounts charged to plant accounts shall be reported separately.
3. All charges not reported under No.1 or 2 shall be aggregated by the type of service and each type shall show the amount charged. Amounts charged to plant accounts shall be reported separately for each type.
4. For any such services which are of a continuing nature give date and term of contract and date of Commission authorization, if contract received Commission approval.
5. Designate associated companies.
1 2 see the following pages 3 4 5 6 7 8 9
10 11 12 13 14 15 16 17 18 19 20

NSTAR Electric Company ,~ ' Charges for outside services 2015 \
Payments of 5% or more of total charges for outside services
Vendor Descri~tion of Services Mitsubishi Electric Power Products, Inc. Construction Thorn Hill Industrial Park 530 Keystone Drive Warrendale, PA 15086
McCourt Construction Construction 60 K Street Boston, MA 02127
Riley Brothers Inc Construction 84 Tasca Drive Stoughton, MA 02072
W A Chester LLC Construction 4390 Parliament Place Lanham, MD 20706
(
S18-A
Account Amount Charged
$ 26,308,512 107
18,542,106 107
15,465,355 107
15,251,038 107
Total $ 75,567,011

Year2015 Total payments of greater than $25,000
h but less t an 5% of total A P SERVICES COMPANY ABBINC. ADVANCE AIR & HEAT CO INC ADVANCED CONTROl SYSTEMS INC ADVANCED FIBER OPTICS, INC. ADVANCED SAFElY SYSTEMS INC AERIAl PRODUCTIONS, llC AGI CONSTRUCTION AHC,CORP. AMEC ENVIRONMENT & INFRASTRUCTURE AMERICAN BURGLAR AlARM AMERICAN PlUMB & HEATING CORP ANDERSEN & SCOlARI INC ARROW FENCE CO ASPWNDH TREE EXPERT CO ATl CONSTRUCTION INC AVTEC COMPANY, INC. AZZ CENTRAl ElECTRIC MFG B & 0 GENERAl CONTRACTORS INC B & E EXCAVATING BAG SALES DBA FOREVERLAWN BAHWAN CYBERTEK INC BAKERCORP BARNES TREE SERVICE INC
( BAY STATE PIPING CO INC BEALS AND THOMAS INC BETTENCOURT ElECTRIC BlACK & VEATCH CORPORATION BONO BROTHERS INC BOSCO CRANE CO INC BRIDGE ENERGY GROUP INC BSC GROUP INC BUILDERS SYSTEMS INC BURNS & MCDONNEll ENGINEERING C J MABARDY INC CAPE POWER SYSTEMS CONSUlTING CARLO MOLINARI INC CAROUSEL INDUSTRIES OF N A INC CDWCORP CENTRAl ElECTRIC COMPANY DBA CHAMPION RESOURCES CHARLES CONTRACTING CO INC CHARTER ENVIRONMENTAL INC CHETS PlUMBING & HEATING INC CH-IV INTERNA TIONAlllC CISTERNElll BROTHERS INC ClEAN HARBORS ENV SERVICES INC COlliERS INTERNATIONAl COlliNS CRANE & RIGGING SERV COlliNS OVERHEAD DOOR INC COMPUWORKS SYSTEMS, INC. CONCORDE SPECIAlTY GASES INC CONSUlTING ENGINEERS GROUP INC CON-TEST ANAl YTICAllABORATORY CORNERSTONE ENERGY SERVICES
Predominant nature of
services performed FaciliTies ConstrucHon Maintenance IT Services IT Services Construction Engineering ConstrucUon Facilities Engineeling IT Services Maintenance Construction Facilities Vegetation Construction Construction Construction Construction Construction Maintenance IT Services Maintenance Vegetation Construction Construction Construction Engineering Construction Construction IT Services Engineering Maintenance Construction Environmental Engineering Construction IT Services IT Services Maintenance Maintenance Construction Engineering_ Maintenance Maintenance Maintenance Environmental Engineering Construction Construction IT Services Environmental Engineering Engineering Engineering
Total Paid $ 279,020
1,308,565 162,283 26,636 52,382
739,963 125,572 732,914 55,395 76,544
100,381 73,149 69,330 28,229
2,870,450 1,324,755 1,486,742 8,486,453
253,942 578,963 363,578 289,800 69,504
3,405,671 3,645,655
71,638 25,241
315,234 .
2,836,419 219,114 305,760 81,560 80,056
5,606,618 82,016 63,450
518,382 363,638 268,035 28,900 37,766
300,595 210,717 58,353 80,255
305,573 5,053,117
35,000 495,126
32,953 318,626 55,529
287,073 143,443 27,366
Amount charged to plant accounts $ 1,280
1,251,535 31,575 22,418 52,382
739,963 3,105
651,662 47,917 76,544
401 34,798 16,585 12,430
461,394 1,319,915 1,486,742 8,486,453
37,216 528,663 248,735
9,000 33,514
427,613 3,575,225
67,315 23,017
315,234 2,807,229
170,674 305,760
81,091 78,770
5,606,618 49,210 63,450
267,306 165,000
16,947 28,900 16,383
300,595 184,142 37,798 62,711 24,500
2,443,980 35,000
495,126 12,214 86,731 42,377
287,073 139,830 27,366
518-B
Plant account charged
107 107 107 107 107 107 107 107 107 107 107 107 107 107 107 107 107 107 107 107 107 107 107 107 107 107 107 107 107 107 107 107 107 107
107/108
107 107 107 107 107 107 107 107 107 107 107
107/108
107 107 107 107
107/108
107 107 107

Year2015 Total payments of greater than $25,000
but less than 5% of total COVIELLO ELECTRIC COX ENGINEERING CO CRITICAL SPACE SOLUTIONS CSS MINDSHARE LLC D & H BACKHOE SERVICE DENNIS K BURKE INC DGIINVISUALS DILO COMPANY INC DIS-TRAN PACKAGED SUBSTATIONS DOBlE ENGINEERING COMPANY E G SAWYER, INC E.B. ROTONDI & SONS INC EDWARD G SAWYER CO, .INC ElDCO lANDSCAPE & TREE SERVICE ElECCOM CORPORATION ElECNOR HAWKEYE llC, ElECTRO WIRE INC ENERGY MAT AlliANCE llC ENERNEX CORP ENGINEERED SOlUTIONS INC ENVIRONMENTAL SOil MANAGEMENT EPSilON ASSOCIATES INC ESRI, INC F E FRENCH CONSTRUCTION INC F PMABARDY
( FARRISSEYTElE- COMM, INC. FASTENAl COMPANY FEENEY BROS EXCAVATION CORP FIRE EQUIPMENT INC FIRE SYSTEMS TECHNOlOGY INC FORMMAKER SOFTWARE INC FRANKliN UTiliTY CORP FRASER ENGINEERING CO INC FRUEAN UTiliTIES INC G&P SERVICE CONTRACTORS INC G. GREENE CONSTRUCTION CO. INC GE GRID SOlUTIONS llC GEOLOGIC· EARTH EXPLORATION Gil-DEN INC GRADIENT GZA GEOENVIRONMENTAliNC HAMil TON TREE & lANDSCAPE INC HARRINGTON AIR SYSTEMS llC HARRY R FElDMAN INC HATCH MOTT MACDONAlD HAUGlAND GROUP llC HB COMMUNICATIONS INC HElENE-KARl ARCHITECTS INC HICO AMERICA SAlES & TECH HOlMESTEAD NURSERY INC HUGHES ASSOCIATES INC I DEliVER TECHNOLOGIES llC
. I. B. ABEl, INC INDEPENDENT ELECTRIC SUPPlY J & M BROWN COMPANY INC J H EGGER CO INC
Predominant nature of
seiVices performed Construction Engineering Facilities IT Services Construction Maintenance IT Services Construction Construction Construction Facilities Construction Construction Maintenance Construction Construction Construction Construction Construction Engineering Environmental Engineering IT Services Construction Environmental Construction Construction Construction Construction Construction IT Services Construction ConstrUction Construction Maintenance Construction Engineering Construction Maintenance Engineering Environmental Vegetation Construction Engineering Engineering Engineering IT SeNices Facilities Construction Maintenance Construction IT Services Construction Construction Construction Construction
Total Paid 79,824
140,278 26,994 34,593 42,314
168,186 35,692 42,239
1,702,822 129,036 44,763
1,254,897 79,169
279,965 1,862,866 5,068,098
584,126 31,000
140,441 169,631 71,168
929,141 660,548 335,350 466,350 90,353 53,141
4,417,842 111,673 160,498 683,242 578,858 55,789
396,366 32,630
4,814,223 95,995
370,372 205,580 40,803
463,698 1,594,878 1,470,454
69,615 52,458
544,056 153,130 30,254
4,869,541 209.419 38,881 46,000
961,014 58,689 55,127
234,486
Amount charged to plant accounts
79,824 . 16,843
26,994 5,261
41,314 4,845 1,091
42,239 1,702,822
18,286 8,544
1,248,890 62,890 22,136
156,701 4,674,119
584,126 31,000
140,041 25,993 1,239
855,733 660,548
7,225 466,350 68,271 10,880
4,320,644 59,460 15,071 7,425
531,458 42,130
346,037 14,675
4,814,223 95,995
370,372 138,257 38,725
107,310 184,384
1,470,454 60,498 38,819
544,056 153,130 30,254
4,869,541 30,553 38,881 46,000
922,171 45,160 32,895
119,234
S/8-C-Plant account
charged
107 107 107 107 107 107 107 107 107 107 107 107 107 107 107 107 107 107 107 107
107/108
107 107 107
107/108
107 107 107 107 107 107 107 107 107 107 107 107 107 107 107
107/1,08
107 107 107 107 107 107 107 107 107 107 107 107 107 107 107

( Year2015 Total payments of greater than $25,000
but less than 5% of total JF2 LLC JOSEPH BOITI CO INC K .W. REESE INC KEMAINC KUBRA DATA TRANSFER L TO KVAINC LAWRENCE LYNCH CORP. LEIDOS ENGINEERING LLC. LEWIS TREE SERVICE INC LIGHTSHIP ENGINEERING LLC LINDE ENGINEERING NORTH LOCUSVIEW SOLUTIONS INC LONDON ECONOMICS INTERNATIONAL MAC PRODUCTS INC MAMMOET USA NORTH INC. MARR SCAFFOLDING COMPANY INC MARTIN GEO ENVIRONMENTAL, LLC MAS BUILDING & BRIDGE INC MASS BAY ELECTRICAL CORP MASS ELECTRIC CONSTRUCTION INC MAVERICK CONSTRUCTION CORP MBA INTERNATIONALIARCHITECTS MEG TECHNOLOGIES LLC MECHANICAL MANAGEMENT INC MICHELS POWER
' ( MICRODESK INC MIDLAND RESOURCE RECOVERY MOHAWK LTD MORAN ENVIRONMENTAL RECOVERY MOTT MACDONALD LLC MSR UTILITY MAINTENANCE CORP MURPHY & FAHY CONSTRUCTION INC MURPHY ELECT & INDUST INC NASHUA FABRICATION INC NEUCO NEW BEDFORD PLUMB & HEAT CORP NEW ENGLAND CLEANING SERV INC NEW ENGLAND ELECTRIC GROUP NH LEARNING SOLUTIONS CORP NITSCH ENGINEERING, INC NORTH BRANCH CONSTRUCTION INC NORTHEAST TRAFFIC CONTROL SERVICE NORTHERN LAND CLEARING NORTHERN TREE SERVICE INC NOVINIUM INC NWN CORPORATION ORACLE AMERICA INC OXBOW ASSOCIATES, INC. PA LANDERS INC PAR ELECTRICAL CONTRACTORS INC PASEK LOCK CORPORATION PAVEMENT MAINTENANCE SYS INC PHOENIX COMMUNICATIONS INC
Predominant nature of
services performed Construction Construction Construction Engineering Maintenance Construction ConStruction Engineering Vegetation Environmental Engineering IT Services Engineering Maintenance Maintenance Maintenance Engineering Construction Construction Construction Construction Construction IT Services Facilities Construction IT Services Environmental IT Services Environmental Engineering Construction Construction Construction Engineering Construction Maintenance Maintenance Construction Training Engineering Construction Construction Construction Vegetation Construction IT Services IT Services Environmental Construction Construction Maintenance Construction Construction
l'otal Paid 767,082
3,449,355 54,431
2,639,793 219,978 943,298
7,815,326 50,740
8,262,725 161,704 962,600 99,464
130,518 1,796,798
120,000 58,627 32,686 82,700
766,399 92,252
427,360 230,542 151,526 47,635
516,885 90,357
103,005 96,608
276,998 107,635 197,080 399,155 25»95 45,000
205,192 204,687 95,399 46,200
243,892 151,212 80,055
133,858 300,320
1,621,205 341,880 281,688
1,887,126 35,962
199,981 9,958,272
93,571 332,996 402,006
Amount charged to plant accounts
168,866 3,029,884
54,431 10,829 32,175
943,298 7,626,623
50,740 311,329 16,036
962,600 99,464
130,518 1,796,798
120,000 58,627 32,686 82,700
756,929 92252
182,060 225,857 151,526
5,697 516,885 90,357 9,552
32,120 174,006 107,635 36,430
399,155 25,995 45,000
179,412 197,890
367 46,200
220,395 133,488 80,055
133,858 3,290
370,239 341,880 281,688
6,251 35,962 8,618
9,382,885 64,586
252,747 263,066
Plant account charged
107 107 107 107 107 107 107 107 107
107/108
107 107 107 107 107 107 107 107 107 107 107 107 107 107 107
1071108
107 107
1071108
107 107 107 107
.·107
107 107 107 107 107 107 107 107 107 107 107 107 107
1071108
107 107 107 107 107

(
Year2015 Total payments of greater than $25,000
but Jess than 5% of total PINNACLE WIRELESS INC PJ SPILLANE COMPANY PLM ELECTRIC POWER ENGINEERING PMA CONSULTANTS LLC POWER ENGINEERS CONSULT INC POWER GRID ENGINEERING LLC PREFERED COMMUNICATION, INC. PREMIER UTILITY SERVICES LLC R G VANDERWEIL ENGINEERS INC R H WHITE CONSTRUCTION CO INC RCM TECHNOLOGIES (USA) INC. REPUBLIC SERVICES RHINO LININGS OF SALEM N H ROBERT J DEVEREAUX CORP S & C ELECTRIC COMPANY SECURITYWORKS, INC SELEX ES INC SHAUGHNESSY & AHERN CO INC SHEERIN CONSTRUCTION CORP SHERMAN CRANE SERVICE SIEMENS INDUSTRY INC. SMART SOURCE LLC SPECIALIZED ROOFING CO STANDARD ELECTRIC SUP CO INC STATE ELECTRIC CORPORATION STORTI QUALITY SERVICES LLC SURVEYING & MAPPING CONSULTANT T & T ELECTRICAL CONTRACTORS TEL VENT USA LLC THE ERGONOMIC GROUP INC THREE PHASE LINE CONST INC .
TIBBETTS ENGINEERING CORP TIGHE & BOND INC TRANE TRC TREE TECH INC TRINITY MEYER UTILITY TRI-STATE DRILLING INC US SECURITY ASSOCIATES INC VEGETATION CONTROL SERVICE INC VERACITY CONSTRUCTION GROUP VHB INC VITTIGLIO CONSTRUCTION CORP W H GLANCY & SONS INC WATCH ALL WAVEGUIDE, INC WEATHERPROOFING TECHNOLOGIES WEST TATNUCK HOME & LAWN CARE WILLIAMS SCOTSMAN INC WIRELESS CONSULTING GROUP WORK ZONE CAM LLC WUNDERLICH MALEC SYSTEMS INC
Total payments greater than $25,000, less than 5% of total Total from Page S18-A Grand Total
Predominant nature of
services performed Construction Construction Construction Staffing Construction Engineering IT Services Engineering Engineering Construction IT Services Environmental Construction Engineering Construction Engineering IT Services Construction Construction Construction IT Services IT Services Maintenance Construction Construction Maintenance Engineering Construction Services IT Services Construction Engineering Environmental Construction Engineering Vegetation Engineering Construction Staffing Vegetation Construction Environmental Construction Construction Facilities IT Services Facilities Facilities Construction IT Services Construction Construction
Total Paid 142,991 59,190
330,147 1,410,410
158,992 757,169 48,953
371,714 815,335
3,629,538 55,818
395,618 122,221
7,513,340 32,980
386,892 208,850 400,025
5,012,791 167,950 373,488 141,000 125,900 787,550 406,811 573,220 375,934 30,860
511,376 1,699,339 3,364,648
65,685 1,013,980
264,758 902,462
1,544,618 1,458,871
12,417,217 460,660 328,227
72,515 1,608,653
876,407 339,175 75,793 26,783
109,299 133,037 31,319 49,284 26,316
9,812,937
192,118,808 75,567,011
$ 267,685,819 $
Amount charged to plant accounts
142,991 32,000
330,147 1,368,098
158,992 757,169 48,953
148,695 699,105
3,621,659 55,818 21,576
113,934 7,485,338
32,980 205,949 208,850 386,709
2,967,074 150,110 204,093 15,251
112,700 610,099 406,811 573,220 375,934 30,860
261,376 279,019
3,364,648 48,140
664,204 222,570 886,668 175,950
1,458,871 12,417,217
69,310 80,983 72,515
1,402,187 665,813 274,848 42,065 26,783 20,879 86,774 19,333 49,284 26,316
9,812,937
148,327,184 75,567,011
223,894,195
Plant account charged
107
107
107
107
107
107
107
107
107
107
107
107/108
107
107
107
107
107
107
107
107
107
107
107
107
1d7
107
107
107
107
107
107
107
107/108
107
107
107
107
107
107
107
107
107/108 107
107
107
107
107
107
107
107
107
107

(
(
(\._ ___ _/
S19
Annual reoort of NSTAR Electric Comoany Year ended December 31, 2015
DEPOSITS AND COLLATERAL 1. Statement of money and the value of any collateral held as guaranty for the payment of charges
pursuant to Massachusetts General laws. Ch a ter 164, Section 128.
Line Name of City or Town Amount line Name of City or Town No. No.
1 Acton $ 77,255 41 Mattapoisett
2 Acushnet 5,809 42 Maynard
3 Arlington 57,894 43 Medfield
4 Ashland 20,281 44 Medway
5 Assonet 18,473 45 Millis
6 Bedford 278,915 46 Milton
7 Bellingham 10,338 47 Natick
8 Boston 2,020,982 48 Needham
9 Bourne 19,645 49 Newton
10 Brewster 6,510 50 New Bedford
11 Brookline 112,600 51 Norfolk
12 Burlington 197,493 52 Oak Bluffs
13 Cambridge 198,993 53 Orleans
14 Canton 66,150 54 Pembroke
15 Carlisle 1,515 55 Plymouth
16 Garver 17,608 56 Plympton
17 Chatham 11,138 57 Provincetown
18 Chelsea 82,730 58 Rochester
19 Chilmark 430 59 Sandwich
20 Dartmouth 69,256. 60 Scituate
21 Dedham 33,392 61 Sharon
22 Dennis 28,983 62 Somerville
23 Dover 2,862 63 Stoneham
24 Duxbury 9,351 64 Sudbury
25 Eastham 6,907 65 Truro
26 Edgartown 10,874 66 Vineyard Haven
27 Fairhaven 37,605 67 Walpole
28 Falmouth 61,922 68 Waltham
29 Framingham 144,309 69 Wareham
30 Harwich 16,183 70 Watertown
31 Holliston 21,772 71 Wayland
32 Hopkinton 13,247 72 Wellfleet
33 Hyannis 103,847 73 Weston
34 Kingston 35,358 74 Westport
35 lakeville 400 75 Westwood
36 lexington 98,170 76 West Tisbury
37 lincoln 630 77 Winchester
38 Marion 2,450 78 Woburn
39 Marshfield 36,762 79 Yarmouth
40 Mashpee 18,292
Total .
Note: Except for the above amount, the Company does not presently hold any collateral from its customers as a guaranty for the payment of charges which is capable of valuation within the meaning ofM.G.l. Chapter 164; Section 128. The Company does in certain instances accept surety bonds and/or second mortgages as guaranties of payment. The value of such collateral cannot be ascertained however, since the Company holds nothing but a commitment to make payment in the event of a customer's default up to the limit of the instruments.
Amount
8,809 94,882
8,443 3,847
12,046 6,410
80,628 70,475 95,618
169,111 9,215
11,470 20,484
1,880 131,786
2,408 27,157 13,972 22,921
1,800 5,424
205,538 37,112 18,985 4,604 6,251
27,134 213,749
11,548 48,416 15,450 7,460 4,160
12,224 9,620
367 21,547
220,386 45,824
$ 5,666,492

NSTAR Electric Company 2015
Calculation of Return on Equity
Net utility income available for common shareholders (A)
Total utility common equity (B)
ROE% (AlB} Adjusted ROE
(A) Net utility income available for common shareholders (note 1)
Net utility operating income (pg. 117, line 27) Plus: Service quality penalties Less: Net interest charges (pg. 117, line 70) Total dividends declared (pg. 118, line 29) Subtotal
Total utility plant as % of total utility plant and other property and investments
(
Total utility plant (pg. 110, line 4) Total other property and investments (note 3)
Total utility plant and other property and investments
Net utility income available for common shareholders
Total utility common equity (note 2)
Total proprietary capital (pg.112, line 16) Plus: Discount on capital stock applicable to preferred stock (pg.112, line 9) Capital stock expense applicable to preferred stock (pg. 112, line 1 0) Less: Preferred stock issued (pg.112, line 3) Unappropriated undistributed retained earnings (pg. 112, line 12) Subtotal
Total utility common equity
Notes:
balance@ end of year
7,500,736,947 7,993,817
7,508,730,764
(1) Amortization of acquisition premium included due to approval for recovery in DTE 99-19.
99.89% 0.11%
100.00%
balance@ be9. of ;tear
2,502,452,736
0 0
43,000,000 1,295,104
2,458,157,632
(2) Unamortized acquisition premium adjustment is not applicable due to approval for recovery in DTE 99-19.
75,291 '117 1,960,000
77,251,117
99.89%
77,166,141
balance@ end of year
2,652,461,428
0 0
43,000,000 2,068,402
2,607,393,026
$ 333,850,357
$ 2,529,989,276
13.20%
11.81% (note4)
411,016,498
77,166,141
333,850,357
2,577,457,082
43,000,000 1,681,753
2,532,775,329 99.89%
2,529,989,276
(3) Other property and investments (pg. 110, line 32) is adjusted for unappropriated undistributed subsidiary earnings (pg. 112, line 12) and long-term portion of derivative assets (pg. 110, line 30). (4) Excluding the impact of out of period adjustments, transition charge mitigation, and LTRCA remuneration earnings ($58,626,508), the transmission and distribution business ROE was 11.81%.

(
Name of Respondent T~is Report Is: (1)[KJ An Original
Date of Report (Mo, Da, Yr)
April15, 2016
Year of Report
NSTAR Electric Company (2)0 A Resubmission December 31,2015
THIS RETURN (THE~FERC FORM N0.1 AND THE MASSAC':1_L,JSETT:S SUPPLEMENT) f}. ~SIGNED UNDER THE PENAL TIES OF PERJURY
""-.f _A' 1 ~ / fA_p, Thomas J. May Chairman and a Director
........ --:-~::.: ..• :::·p:_:::z -James J. Judge Executive Vice President and Chief
................................................................................... Werner J. Schweiger
James A. Muntz
Gregory B. Butler
Ellen K. Angley
---·Jays. Buth
_ .................... -...... _ .................. ___ ........ -............. Craig A. Hallstrom
James G. Daly
.................... _ .................................. - .......... Douglas W. Foley
Michael F. Hayhurst
Paul R. Renaud
............................ -...... - .................... -........................... -..................... Philip J. Lembo
Richard J. Morrison
Financial Officer and a Director
Chief Executive Officer and a Director
Senior Vice President~ Transmission
Senior Vice President and General Counsel and a Director
Vice President-Supply Chain, Environmental
Affairs and Property Management
Vice President, Controller and Chief Accounting Officer
President and Chief Operating Officer
Vice President-Energy Supply
Vice President-Electric Field Operations
Vice President-Electric System Operations
Vice President-Engineering
Vice President and Treasurer
Secretary and Clerk
SIGNATURE OF ABOVE PARTIES AFFIXED OUTSIDE THE COMMONWEALTH OF MASSACHUSETTS MUST BE PROPERLY SWORN TO
State of Massachusetts Suffolk County Boston
·························· ·············· !:\pr.i1 ... !.5.,_.~Q1~ ..
Then personally appeared 7/, ~ilt/k5 .J./':t4Yand severally made oath to the truth of the forgoing statement by them subscribed according to their best knowledge and belief. ·
~ BARBA · · /{, • J., ..~mrf/)1#otary Public . RAJ, MURPHY ~u,.,. ... .. '/.t:.v"'"""" ... ·
Notary Public , · (J COMMONWEALTH QF ll,lASSACHUSETTS ·
Mv Commission Exnko< '. ~ Marc]> ~o. 2018
S20

(
(
Name of Respondent
NSTAR Electric Company
This Report Is: (1 )[K] An Original (2)0 A Resubmission
Date of Report (Mo, Da, Yr)
April15, 2016
Year of Report
December31, 2015
THIS RETUKN (THE _!:!:'RC FORM N0.1 AND_THE MASSACHI,!S!=TTS SUPPLEMENT) IS SIGNED UNDER THE PENAL TIES OF PERJURY
............. Thomas J. May
~~-·JamesJ.Judge
....................................................................................................... Werner J. Schweiger
James A. Muntz
................. Gregory B. Butler
Ellen K. Angley
JayS. Buth
......................................................................................................... Craig A. Hallstrom
......................................................................................................... James G. Daly
.................. Douglas W. Foley
................................. Michael F. Hayhurst
Paul R. Renaud
......................................................................................................... Philip J. Lembo
Richard J. Morrison
Chairman and a Director
Executive Vice President and Chief Financial Officer and a Director
Chief Executive Officer and a Director
Senior Vice President-Transmission
Senior Vice President and General Counsel and a Director
Vice PresidentMSupply Chain, Environmental
Affairs and Property Management
Vice President, Controller and Chief Accounting Officer
President and Chief Operating Officer
Vice PresidentMEnergy Supply
Vice President-Electric Field Operations
Vice President-Electric System Operations
Vice PresidentMEngineering
Vice President and Treasurer
Secretary and Clerk
SIGNATURE OF ABOVE PARTIES AFFIXED OUTSIDE THE COMMONWEALTH OF MASSACHUSETTS MUST BE PROPERLY SWORN TO
State of Massachusetts Suffolk County Boston
............. Jv1arch .. ~.1.,_?Q16
Then personally appeared James J. Judge and severally made oath to the truth of the forgoing statement by him subscribed according to his best knowledge and belief. ? /
/~/ii;ota~Public
~ BARBARA J. MURPHY
m•y Notary Public ~Er COMMONWEAlTH .OF MASSACHUSETTS
My Commrssron Expires - . . Mm\.t! 30. 2018
S20

(
(
Name of Kespondent
NSTAR Electric Company
This Report Is: (1) [KJ An Original (2) 0 A Resub(llission
Date of Report (Mo, Oa, Yr)
April15, 2016
Year of Report
December 31, 2015
THIS RETURN (THE FERC FORM ":!_u~ 1 AND THE MASSACHUSETTS SUPPLEMENT) IS SIGNED UNDER THE PENALTIES OF PERJURY
.................................................................................................................... Thomas J. May
........................................................................................................ James J. Judge
Werner J. Schweiger
James A. Muntz
............................................................................................. Gregory B. Butler
..................................................................................................................... Ellen K. Angley
..................................................................................................................... Jay S. Buth
................................................................................................................... Craig A. Hallstrom
James G. Daly
Douglas W Foley
Michael F. Hayhurst
Paul R. Renaud
.................................................................................................................. Philip J. Lembo
Richard J. Morrison
Chairman and a Director
Executive Vice President and Chief Financial Officer and a Director
Chief Executive Officer and a Director
Senior Vice President-Transmission
Senior Vice President and General Counsel and a Director
Vice President-Supply Chain, Environmental
Affairs and Property Management
Vice President, Controller and Chief Accounting Officer
President and Chief Operating Officer
Vice President-Energy Supply
Vice President-Electric Field Operations
Vice President-Electric System Operations
Vice President-Engineering
Vice President and Treasurer
Secretary and Clerk
SIGNATURE OF ABOVE PARTIES AFFIXED OUTSIDE THE COMMONWEALTH OF MASSACHUSETTS MUST BE PROPERLY SWORN TO
State of Connecticut County of Hartford Berlin
.......................................... 6E'.iL1?., .. ~.9..1§. ....
Then personally appeared IJ,r,,,r ~ s,_},we<'J<C :~er1y made on the truth of the forgomg statement by
them subscribed according to their best knowl~~:: .. &::0. Notary Public
0/::;;;i/z.- 31- 2_61 2'
S20

(
(
Naine'cif Kespohdent
NSTAR Electric Company
This Report Is: · · (1)f5<'f An Original (2JLl A Resubmission
·~:~~te ~~Report (Mo, Da, Yr)
1\pri/15, 2016
·year of Report
December31, 2015
TI-llS RETU"" 11 HE FERC l'nRM '"' 1.1 '""D THE MA,,ACHU,ETT" '" •PPLE•v•~'""" .. ·· - • is siGNED uNDER-iHEPENALTIEs-a·F PERJURY---· _ .. _ · •
....................................................................................... Thomas J. May
................................................................................... _.James J. Judge
Chairman and a Director
Executive Vice President and Chief Financial Officer and a Director
....................................................................................... Werner J. Schweiger Chief Executive Officer and a Director
............ ~~ .................... James A. Muntz Senior Vice President-Transmission
....................................................................................... Gregory B. Butler Senior Vice President and General Counsel
....................................................................................... Ellen K. Angley
....................................................................................... Jay S. Buth
....................................................................................... Craig A. Halls/rom
....................................................................................... James G. Daly
....................................................................................... Douglas W. Foley
....................................................................................... Michael F. Hayhurst
Paul R. Renaud
....................................................................................... Philip J. Lembo
Richard J. Morrison
and a Director
Vice President-Supply Chain, Environmental
Affairs and Property Management
Vice President, Controller and Chief Accounting Officer
President and Chief Operating Officer
Vice President,Energy Supply
Vice President-Electric Field Operations
Vice President-Electric System Operations
Vice President-Engineering
Vice President and Treasurer
Secretary and Clerk
SIGNATURE OF ABOVE PARTIES AFFIXED OUTSIDE THE COMMONWEALTH OF MASSACHUSETTS MUST BE PROPERLY SWORN TO
State of Connecticut County of Hartford Hartford
................................ 8.P.r.!!.1.S.,}9.1?. .................... , ... ..
Then personally appeared -;J....,, ,\. M ,.,r,__ and severally made oath to the truth of the forgoing statement by them subscribed according to their best knowledge and belief.
S20
C4,t.tiil.J~.,e~ ..... Notary Public CYNTHIA L. l'tiO X NOTARY PUBLIC .
state of Connectlp~t My commission !;<jplrer

(~
\
(
Name o Respondent T 1s Report Is: (1)[Kj An Original
NSTAR Electric Company (2)0 A Resubmission
Date of Report (Mo, Da, Yr)
April 15, 2016
Yearo Report
De.cember 31,2015
THIS RET RN (THE FERC FORM N0.1 D THE MASSACHUSETTS SU PLEMENT) IS SIGNED UNDER THE PENAL TIES OF PERJURY
. _________ •• _________________ •••• ____ .. ___ •• Thomas J. May
.. ________________________________________ .. James J. Judge
Chairman and a Director
Executive Vice President and Chief Financial Officer and a Director
..... ---------------------------------------Werner J. Schweiger Chief Executive Officer and a Director
James A Muntz Senior Vice President-Transmission
····~ ..... .. . ..
.. ________________________________________ .. Ellen K. Angley
------------Gregory B. Butler
... _______________________________________ .. Jay S. Buth
--------------------------------------------Craig A. Hallstrom
--------------------------------------------James G. Daly
______ ..... ---------. , ________ --------------Douglas W. Foley
------------------------------ ____ -------- .. Michael F. Hayhurst
Paul R. Renaud
. _________________________________________ .. Philip J. Lembo
Richard J. Morrison
Senior Vice President and General Counsel and a Director
Vice President-Supply Chain, Environmental
Affairs and Property Management
Vice President, Controller and Chief Accounting Officer
President and Chief Operating Officer
Vice President-Energy Supply
Vice President:Eiectric Field Operations
Vice President-Electric System Operations
Vice President-Engineering
Vice President and Treasurer
Secretary and Clerk
SIGNATURE OF ABOVE PARTIES AFFIXED OUTSIDE THE COMMONWEALTH OF MASSACHUSETTS MUST BE PROPERLY SWORN TO
StateofMassacliMSelts &m~i~- f
S~fiGik G9YRI)' t!-tJ?VJ'l--h_ p-/! ~ Basten Jj..e;r£r, {T . __________________ . _. _____________________ ·pdl~ ________ . _. _____ ~e~i! _1_~._ ?_0.! !l. _____ . _____ _
Then· personally appeared a,!'~ ~ · and severally made oath to the truth of the forgoing staiement by them subscribed according to their best knowledge and belief.
(j .~4.-:~~lf:~_NotaryP~Iic ~t~ ~taJ f~:Jc.~;Zg/'1
S20

(
Name of Respondent
NSTAR Electric Company
This Report Is: (1) [K] An Original (2) 0 A Resubmission
Date of Report (Mo, Da, Yr)
April15, 2016
Year of Report
December 31, 2015
THIS RETURN ( 1 t11=FERC FORM NO.1 AND_'· HI=_ MASSACI:ll)SETTS SUPPLEMENT) IS SIGNED UNDER THE PENAL TIES OF PERJURY
.................................................................................................................. Thomas J. May
.................................................................................................................... James J. Judge
Chairman and a Director
Executive Vice President and Chief Financial Officer and a Director
.................................................................................................................... Werner J. Schweiger Chief Executive Officer and a Director
James A Muntz Senior Vice President-Transmission
.................................................................................................................... Gregory B. Butler
.................................................................................................................... Jay s. Buth
.................................................................................................................. Craig A. Hallstrom
.................................................................................. , ............................... James G. Daly
.................................................................................................................. Douglas W. Foley
.................................................................................................................... Michael F. Hayhurst
Paul R. Renaud
.................................................................................................................... Philip J. Lembo
Richard J. Morrison
Senior Vice President and General Counsel and a Director
Vice President-Supply Chain, Environmental
Affairs and Property Management
Vice President, Controller and Chief Accounting Officer
President and Chief Operating Officer
Vice President-Energy Supply
Vice President-Electric Field Operations
Vice President-Electric System Operations
Vice President-Engineering
Vice President and Treasurer
Secretary and Clerk
SIGNATURE OF ABOVE PARTIES AFFIXED OUTSIDE THE COMMONWEALTH OF MASSACHUSETTS MUST BE PROPERLY SWORN TO
State of Massachusetts Suffolk County Boston
Then personally appeared~!,,., .~~~.:~~~ly made. oath to the !.ruth of the forgoing statement by them subscribed according to their best kno2Lelief.
?7.;.~ .. - ......... ,.:~~otary Public
~ flY.!!!>..,'""-\ TIM
Notary Public Commonwealth of Massachusetts
Commission Expires Nov 20, 2020
S20
I

( I
(
Name of Respondent
NSTAR Electric Company
This Report Is: (1)[KJ An Original
(2) 0 A Resubmission
Date of Report (Mo, Da, Yr)
April 15, 2016
Year of Report
December31, 2015
THIS RETURN (THE FERC FORM N0.1 AND THE MASSACHUSETTS SUPPLEMENT) IS SIGNED UNDER THE PENALTIES OF PERJURY
............................................................................................................ Thomas J. May
............................................................................................................... James J. Judge
............................................................................................................ Werner J. Schweiger
James A. Muntz
Gregory B. Butler
............................................................................................................... Ellen K. Angley
............ . 4:t:J~ ... JayS. Buth
....................................................................... ...................................... Craig A. Hallstrom
.................................................................................................... James G. Daly
Douglas W. Foley
............................................................................................................. Michaei·F. Hayhurst
Paul R. Renaud
Philip J. Lembo
Richard J. Morrison
Chairman and a Director
Executive Vice President and Chief Financial Officer and a Director
Chief Executive Officer and a Director
Senior Vice President~ Transmission
Senior Vice President and General Counsel and a Director
Vice President~Supply Chain, Environmental
Affairs and Property Management
Vice President, Controller and Chief Accounting Officer
President and. Chief Operating Officer
Vice President-Energy Supply
Vice President-Electric Field Operations
Vice President-Electric System Operations
Vice President-Engineering
Vice President and Treasurer
Secretary and Clerk
SIGNATURE OF ABOVE PARTIES AFFIXED OUTSIDE THE COMMONWEALTH OF MASSACHUSETTS MUST BE PROPERLY SWORN TO
State of Connecticut County of Hartford Berlin
.... ... .. ....... .. . .. ... ~P.EiL!~, .?.9 !.§ .......... ............. ..
Then personally appeared Ui!LL; 5 {)uf.l} and severally made oath to the truth of the forgoing statement by
them subscribed according to their best knowledge~0 .'iJ..f1{2.~!!:??. ..................... Notary Public
820
..

(
Name of Respondent
NSTAR Electric Company
This Report Is: ( 1) [K] An Original
(2)0 A Resubmlssion
Date of Report (Mo, Da, Yr)
Aprll15, 2016
Year of Report
December31, 2015
THIS RETURN (THE FERC FORM N0.1 AND THE MASSACHUSETTS SUPPLEMENT) IS SIGNED UNDER THE PENAL TIES OF PERJURY
...................................................................... _Thomas J. May
.............................................................................................................. James J. Judge
....................................................................................... .. WernerJ. SchweJger
James A. Muntz
............................................................................................ , ................ Gregory B. Butler
............................................................................... . ................. Ellen K. Angley
JayS. Buth . ... .. .... .. '?'\ .. ......... ... . ............ .
~~ ....... _Craig A. Hallstrom
.. .. ........ ::::~ ....................... 7
T .... 77
............. James G. Daly
·. ...\..~t.U .......... ~ ..... Douglas W. Foley
~.t!:.t.._~{C__Michael F. Hayhurst
Paul R. Renaud
.............................................................................................................. Philip J. Lembo
Richard J. Morrison
Chairman and a Director
Executive Vice President and Chief Financial Officer and a Director
Chief Executive Officer and a Director
Senior Vice President-Transmission
Senior Vice President and General Counsel and a Director
Vice President-supply Chain, Environmental
Affairs and Property Management
Vice President, Controller and Chief Accounting Officer
President and Chief Operating Officer
Vice President-Energy Supply
Vice President-Electric Field Operations
Vice President-Electric Syste·m Operations
Vice President-Engineering
Vice President and Treasurer
Secretary and Clerk
SIGNATURE OF ABOVE PARTIES AFFIXED OUTSIDE THE COMMONWEALTH OF MASSACHUSETTS MUST BE PROPERLY SWORN TO
State of Massachusetts Suffolk County Boston
them subscribed according to their best kn · · 1:;9~ef. Then personally appeared and severally madeU[o· he truth of the forgoing statement by
.. ~(.~J?~£ .g, .............. Notary Public
&;;, TIMOTHY A CEURVELS ~-----------------~ff9~--~~~~--~--------------~
COMMONWEAlrH OF MASSACHUSffiS My Commission Expires
May 18, 2018
S20

(
(
l/
December 31, 2015
IS SIGNED UNDER THE PENAL TIES OF PERJURY
.................................................................................................................. Thomas J. May
................................................................................................................... James J. Judge
................................................................................................................... Werner J. Schweiger
James A. Muntz
Gregory B. Butler
Ellen K. Angley
................................................................................................................... JayS. Buth
Craig A. Hallstrom
~4.0 .. 4-~.James G. Daly
................................................................................................................. Douglas W. Foley
.... Michael F. Hayhurst
Paul R. Renaud
Philip J. Lembo
Richard J. Morrison
Chairman and a Director
Executive Vice President and Chief Financial Officer and a Director
Chief Executive Officer and a Director
Senior Vice President~ Transmission
Senior Vice President and General Counsel and a DirectOr
Vice President-Supply Chain, Environmental
Affairs and Property Management
Vice President, Controller and Chief Accounting Officer
President and Chief Operating Officer
Vice President-Energy Supply
Vice President-Electric Field Operations
Vice President-Electric System Operations
Vice President-Engineering
Vice President and Treasurer
Secretary and Clerk
SIGNATURE OF ABOVE PARTIES AFFIXED OUTSIDE THE COMMONWEALTH OF MASSACHUSETTS MUST BE PROPERLY SWORN TO
State of Massachusetts Suffolk County Boston
....................... ............ .............. .................................... . ......................................... ~E~ii 1.§,?..Q!~ ............................ .
personally appeared ~•/l..eA ft.D~nd severally made oath to the truth of the forgoing statement by subscribed according~~ their best kno\l,fedge and belief .
. N~ /V1.Jl./~:d'o!,//f. Notary Public
S20

(
: (
.................................................................................................................... Thomas J. May
...................................................................................................... : .......... James J. Judge
Chairman and a Director
Executive Vice President and Chief Financial Officer and a Director
.................................................................................................... Werner J. Schweiger Chief Executive Officer and a Director
James A. Muntz
.................................................................................................................... Gregory B. Butler
........................................................................................ , ........................... Ellen K. Angley
.................................................................................................................... Jay S. Buth
................................................................................................................. Craig A. Hallstrom
.................................................................................................................. James G. Daly
.................................................................................................................. Douglas W. Foley
............. "(} ............................................................................................ Michael F. Hayhurst
....... Yf.d ... ~.: ... ~~- ... Paul R. Renaud
.................................................................................................................. Philip J. Lembo
Richard J. Morrison
Senior Vice President-Transmission
Senior Vice President and General Counsel and a Director
Vice President-Supply Chain, Environmental
Affairs and Property Management
Vice President, Controller and Chief Accounting Officer
President and Chief Operating Officer
Vice President-Energy Supply
Vice President-Electric Field Operations
Vice President-Electric System Operations
Vice President-Engineering
Vice President and Treasurer
Secretary and Clerk
SIGNATURE OF ABOVE PARTIES AFFIXED OUTSIDE THE COMMONWEALTH OF MASSACHUSETTS MUST BE PROPERLY SWORN TO
State of Massachusetts Suffolk County Boston
................................................................................................................... ............... .. ...... A.P.ril.l_§,?.Ql~. . ..... ..
personally appeared ?e.../ ~"~d severally made oath io the truth of the forgoing statement by
l / sub::::d:~::~:g~::::bestkn/E~".~~NotaryPublic i'ulbiic 0 ................ .. ~~--------------------_J
820

( \
(
I . \_..__/
L
•,'
Name of Respondent This Report Is: Date of Report Year of Report (1 )[KJ An Original (Mo, Da, Yrj
NSTAR Electric Company (2)0 A Resubmission April15, 2016 December 31,2015
THIS RETURN (THE FERC F()RM N0.1 AND THE MASSACHUSETTS SUPPLEMENT) IS SIGNED UNDER THE PENAL TIES OF PERJURY
........................................................................................................... Thomas J. May
.......................................................................................................... James J. Judge
........................................................................................................... Werner J. Schweiger
James A. Muntz ...........................................................................................................
................... : ... : ............. : ................... ~.· ................................................ G"tegory s:-sutrer
Ellen K. Angley
.................................................................................. JayS. Buth
......................................................................................................... Craig A. Hallstrom
................................................................................................ ~ ..... James G. Daly
....................................................................... Douglas W. Foley
Michael F Hayhurst
Paul R. Renaud
.@J .. 7:r2.... ...... Philip J Lembo
Richard J. Morrison
Chairman and a Director
Executive Vice President and Chief Financial Officer and a Director
Chief Executive Officer and a Director
Senior Vice President-Transmission
s·ehlor·Vice··pre·siaenranct .. Ge·ne·rar-cO'u-nsel"
and a Director
Vice President-Supply Chain, Environmental
Affairs and Property Management
Vice President, Controller and Chief Accounting
Officer
President and Chief Operating Officer
Vice President-Energy Supply
Vice President-Electric Field Operations
Vice President-Electric System Operations
Vice President-Engineering
Vice President and Treasurer
Secretary and Clerk
SIGNATURE OF ABOVE PARTIES AFFIXED OUTSIDE THE COMMONWEALTH OF MASSACHUSETTS MUST BE PROPERLY SWORN TO
State of Massachusetts Suffolk County Boston
................................ !v.l.~.rg~.~!, .. ?.Q!.€5. .. ...
Then personally appeared Philip J. Lembo and made oath to the truth of the foregoing statement by
him subscribed according to his best knowl~dge and belief. ~
:· r#. .. . BARBARA J. MURPHY .. -~·-· ?:::t.c.J.tYif. . .. y. ...... .. ..... !ota<y.Public·:•·•·
I ~ ~ rr~ . NolaJY Public . . . ~~ i;~CQMMONWEALTH OF MASSACHUsETTS.
VA My Commission e. · Marc_f:!.30, 201'8 -
S20

1 (
(
Name of Respondent
NSTAR Electric Company
This Report Is: (1)[Kj An Original (2) D A Resubmission
Date of Report {Mo, Da, Yr)
April15, 2016
Year of Report
December 31,2015
THIS RETURN (THE t-ERC FORM N0.1 AND THE MASSACHUSETTS SUPPLEMENT) IS SIGNED UNDER THE PENAL TIES OF PERJURY
............................................................................... Thomas J. May
..................... James J. Judge
....................................................................................................... Werner J. Schweiger
James A. Muntz
....................... "' .................................. Gregory B. Butler
................................................................................................. Ellen K. Angley
JayS. Buth
...................................................................................................... Craig A. Hallstrom
...................................................................................................... James G. Daly
.................. Douglas W. Foley
........................................ Michael F. Hayhurst
Paul R. Renaud
........................................................................................................ Philip J. Lembo
..... 'E.~~ .. : ...... d~ .............................. Richard J. Morrison
Chairman and a Director
Executive Vice President and Chief Financial Officer and a Director
Chief Executive Officer and a Director
Senior Vice President-Transmission
Senior Vice President and General Counsel and a Director
Vice President-Supply Chain, Environmental
Affairs and Property Management
Vice President, Controller and Chief Accounting Officer
President and Chief Operating Officer
Vice President-Energy Supply
Vice President-Electric Field Operations
Vice President-Electric System Operations
Vice President-Engineering
Vice President and Treasurer
Secretary and Clerk
SIGNATURE OF ABOVE PARTIES AFFIXED OUTSIDE THE COMMONWEALTH OF MASSACHUSETIS MUST BE PROPERLY SWORN TO
State of Massachusetts Suffolk County Boston
............. f1A.ar:c.h .. ~! .•.. ~2.1.~ ....
Then personally appeared Richard J. Morrison and made oath to the truth of the foregoing statement by him subscribed according to h1s best knowledge and belief. 'd
r~-""l!'BA~R~S:;-:1\~R~A'":J~: M!'!lUA:"!!!!I?!!!'!\oi4Y~·~·:'·~"' ... "'. '"""~""~:<..t ·"-·"" .. tf-:1:~ Notary Public
! t•1 ~- Notary Publi~ • , --V
My Commission Expires Marc/1 30 2018
S20

j
(
( \
S21
EXTRACTS FROM THE GENERAL LAWS.
CHAPTER 164.
Section 2. In construing sections"** seventy-four to eighty-three Inclusive,*** unless this context otherwise requires, the terms "corporation", "gas company" and "electric company" shall include all persons, firms, associations and private corporations which own or operate works or a distributing plant for the manufacture and sale or distribution and sale of gas for heating and Illuminating purposes, or of electricity, within the commonwealth.-
GENERAL DUTIES OF DEPARTMENT
SECTION 76. The department shall have the general supervision of aU gas and electric companies and shall make all necessary examination and inquiries and keep itself informed as to the condition of the respective properties owned by such corporation and the manner in which they are conducted with reference to the safety and convenience of the public and as to their compliance with the provisions of raw and the orders, directions and requirements of the department.
FORM OF BOOKS AND ACCOUNTS PRESCRIBED.
SECTION 81. Gas and electric companies or persons engaged in the manufacture and sale or distribution of gas or electricity shall keep their books and accounts In a form to be prescribed by the department, and the accounts shall be closed annually, so that a balance sheet can be taken therefrom. Manufacturing companies in which the manufacture of gas or electricity is a minor portion of their business shall be required to keep accounts of the expenses and Income of their gas or electric business only.
FORM OF STATION RECORDS PRESCRIBED.
SECTION 82. Gas and electric companies and manufacturing companies or persons engaged in the manufactUI or sale of gas or electricity shall keep such records of their work at their manufacturing station, and in respect to their distributing plant, and in such forms as the department may from time to time require.
FORM OF ANNUAL RETURNS PRESCRIBED.
SECTION 83. Gas and electric companies and manufacturing companies and persons engaged in the manufacl and sale or distribution and sale of gas or electricity shall annually, on or before such date as the department fixes, make to the department, in the form prescribed by it, a return for the year ending on such date as the department may from time to time require, signed and sworn to by the president or vice-president, and treasurer or assistant treasurer, and a majority of the directors, of the amount of their authorized capital, their indebtedness and financial condil'lon, on the said date, their income and expenses during the preceding year, their dividends paid and declared, a list of the names of all their salaried officers and the amount of the salary paid to each, and the balance sheet of their accounts as of said date. Such companies and persons shall at all times, upon request, furnish any information required by the department of its duly authorized employees relative to their condition, management and operation, and shall comply with all lawful orders of the department: but manufacturing companies in which the manufacture and sale of gas or electricity is a minor portion of their business shall be required to include in their annual returns the income and expenses and other data relative to their gas and electric business only.
PENALTY FOR FAILURE TO MAKE RETURN.
SECTION 84. Each such gas or electric company or manufacturing company or person neglecting to make the annual return required by the preceding sect'lon shall, for the fu'SI fifteen days or portion thereof during which such neg led continues, forfeit five dollars a day: for the_second fifteen days or any portion thereof, ten dollars a cjay: and for each day thereafter not more than fifteen dollars a day. If any such company or person Unreasonably refuses or neglects to make such return, it or he shall, in addition thereto, forfeit not more than fiVe hundred dofJars. If a return is defective or appears to be erroneous, the department shall notify the company or person to amend· it within fifteen days. A company or perscm neglecting to amend said return within the time specified in the notice, when notified to do so, shall forfeit fifteen dollars for each day during which such neglect continues. All forfeitures incurred under this section may be recovered by an information in equity brought in the supreme judicial court by the attorney-general, at the relation of the department, and when so recovered shall be paid to the commonwealth.
CHAPTER26 B
PENALTIES FOR MAKING FALSE REPORT.
SECTION 6 Except as provided in sections forty-eight and forty-nine of chapter one hundred and fifty-five, whoever shall willfully make false report to the department of public utilities, the department of public works, the department of banking and insurance, or the commissioner of corporations and taxation, or who, before any such department or commissioner, shall testify or affirm falsely to any material fact in any manner wherein an oath or affirmation is required or authorized, or shall make any false entry or memorandum upon any book, report, paper or statement of any company making report to any of the said departments or said commissioner, with intent to deceive the department or commissioner, or any agent appointed to examine the affairs of any such company, or to deceive the stockholders or any officer of any such company, or to injure or defraud any such company, and any person who with like intent aide or abets lnother in any violation of this section shall be punished by a fine of not more than one thousand dollars or by imprisonment for not more than one year, or both.