delivering biomass to europe, the port of rotterdam … · logo london, october 1-2, 2012 port of...
TRANSCRIPT

Logo
London, October 1-2, 2012
Port of Rotterdam
D E L I V E R I N G B I O M A S S T O E U R O P E , T H E
P O R T O F R O T T E R D A M
EUROPEAN BIOMASS POWER GENERATION CONFERENCE

Logo Port of Rotterdam
Rotterdam, The Netherlands
• Deepwater port
• No locks
• 435 million tons in 2011
• 12.000 ha
• 89 km quay
• No. 5 port in the World
• No. 1 port in Europe
• Investments € 500 million.
ROTTERDAM
© Copyright - Port of Rotterdam - 2012 27-9-2012 2

Logo
Biomass for climate change
International Energy Agency
• Biomass
• Coal and CCS
• Gas
© Copyright - Port of Rotterdam - 2012 27-9-2012 3
INCREASE BIOMASS, REDUCE CO2
POWER (MW)
7000
2011
CO2
SOLAR WIND
BIOMASS
COAL + CCS
COAL
GAS
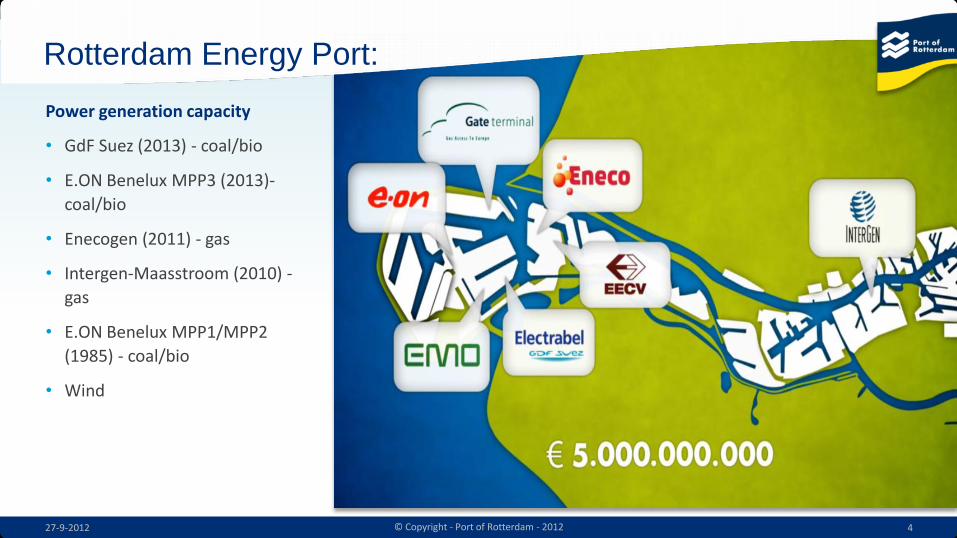
Logo Rotterdam Energy Port:
Power generation capacity
• GdF Suez (2013) - coal/bio
• E.ON Benelux MPP3 (2013)-
coal/bio
• Enecogen (2011) - gas
• Intergen-Maasstroom (2010) -
gas
• E.ON Benelux MPP1/MPP2
(1985) - coal/bio
• Wind
© Copyright - Port of Rotterdam - 2012 27-9-2012 4

Logo Projected CO2 emissions & reduction Rotterdam
REDUCTION OF CO2
© Copyright - Port of Rotterdam - 2012 27-9-2012 5
Rotterdam Climate Initiative –
27mt CO2 reduction:
1. Energy efficiency: 5.0mt
2. Biomass: 4.5mt
3. CCS: 17.5mt

Logo
27-9-2012 © Copyright - Port of Rotterdam - 2012 6
ECONOMICS LOGISTICS

Logo Wood pellets vs coal
Coal is the more profitable fuel in power generation
© Copyright - Port of Rotterdam - 2012 27-9-2012 7
PSS -2.40€/MWh
CDS 9.34€/MWh
PSS -43.62€/MWh
CDS -0.13€/MWh
Coal €70/ton
Pellets €135/ton
€/MWh - August 2012 UK NL
electricity 53.22 43.75
pellet 26.25 26.25
coal 10.35 10.35
CO2 9.38 9.38
pellet spark spread -2.40 -43.75
clean dark spread 9.34 -0.13
clean dark spread minus pellet spark spread 11.74 43.62
Coal power plant with 30% efficiency
Source: Argus, July/August
Economics of co-firing
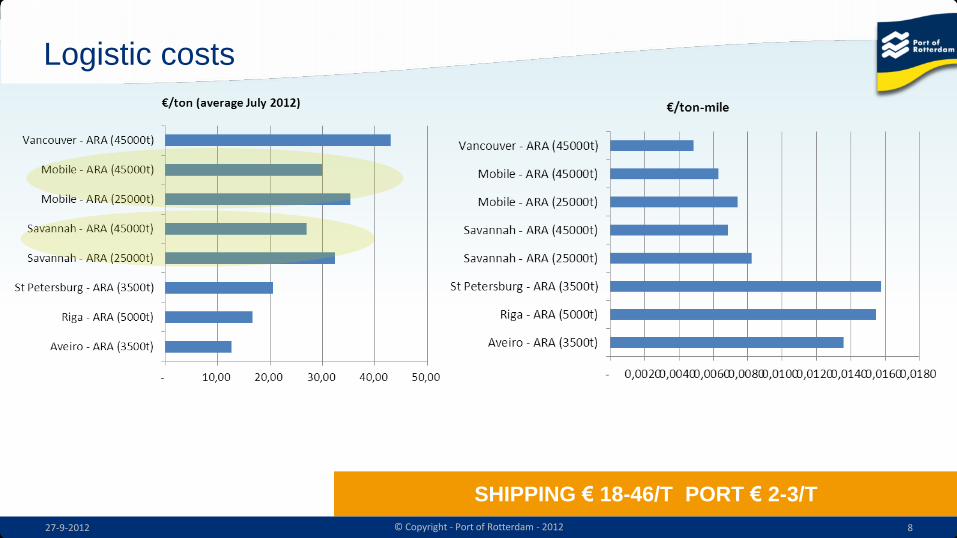
Logo Logistic costs
SHIPPING € 18-46/T PORT € 2-3/T
© Copyright - Port of Rotterdam - 2012 27-9-2012 8

Logo
Ship size development Year Size range/DWT
2000 750 –10,000
2010 1,500‐40,000
2012 45,000
2013 50,000- 60,000
(supramax)
2013/’15 - 80,000
(Panamax)
PANAMAX
© Copyright - Port of Rotterdam - 2012 27-9-2012 9

Logo
27-9-2012 © Copyright - Port of Rotterdam - 2012 10
TRENDS/SCENARIO'S 2030

Logo Wood pellet demand scenario's 2010-2030 (1)
• Business as usual (BAU): continuation of
current renewable energy support and
policy instruments to 2030, but the RES-
2020 targets will not be met.
• Business as Usual, barrier mitigated
(BAU-bm): similar to BAU, a continuation
of current policies is assumed, but non-
economic barriers will be mitigated.
• Strengthened National Policies (SNP):
improvement and fine-tuning of current
policies implemented to meet the RES
2020 targets.
WOOD PELLET DEMAND (COPERNICUS STUDY)
© Copyright - Port of Rotterdam - 2012 27-9-2012 11
Total primary demand of solid biomass for electricity and heat in
the BAU scenario - 15Mt in 2030

Logo Wood pellet demand scenario’s 2010-2030 (2)
WOOD PELLET DEMAND (COPERNICUS STUDY): WORK IN PROGRESS
27-9-2012 12
Total primary demand of solid biomass for electricity
and heat in the BAU-bm scenario - 24Mt in 2030
Total primary demand of solid biomass for electricity
and heat in the SNP scenario - 25 Mt in 2030
SNP: exclusive biomass obligation needed for NL RES target. If included: SNP growth already
in 2020

Logo Supply 2020 - 2030
• 2012-2020: NA export
• 2020-2030:
• NA more domestic use,
export declines
• Potential new suppliers: BRA,
Russia, Ukraine
• Issues: sustainability, logistics
• Other potential suppliers:
AUS, MAL, AFR: but export to
EU depends on development
of Asian demand (China?)
Source: Copernicus 2012 GLOBAL DEMAND AND SUPPLY
© Copyright - Port of Rotterdam - 2012 27-9-2012 13

Logo Transition
TRANSITION
2010-2020
• Co-firing and conversion
• Increasing demand = imports
• Growth in overseas production,
energy crops
• Dedicated pellet plants
• Certification and standardization
initiatives
• Increase in trade, coal traders enter
wood pellet market
• OTC trade, clearing
2020-2030
• Co-firing, residential heating, bio-
refining and bio-chemicals
• Imports, blending and stockpiling
• Torrefaction?
• Biomass is a commodity
• Market liquidity, physical + financial
trading
• Standard contract: Index CIF ARA
2000-2010
• Still in experimental phase
• Biomass plants, local feedstock
• Start up of co-firing
• Dependent on subsidies
• Feedstock: residues, waste
• Ad hoc trade, bilateral contracts

Logo
27-9-2012 © Copyright - Port of Rotterdam - 2012 15
HUB: ECONOMIES OF SCALE PORT OF ROTTERDAM

Logo
• EU seaborne steam coal
imports: 125 Million Tons p/a
• Large import flows, capesize
bulk carriers
• Large stocks in ARA ports
(security of supply for power
plants, physical trading)
• Coal imports are concentrated
into a few large hub ports to
create economies of scale
• The transition in biomass needs
a hub port!!
© Copyright - Port of Rotterdam - 2012 27-9-2012 16
Lessons to be learned from the thermal coal market

Logo
17
ROTTERDAM
Rotterdam – central location
© Copyright - Port of Rotterdam - 2012 7-3-2012 17
HUB: ECONOMIES OF SCALE!
Captive cargo for energy
generation Rotterdam
> 3000MW coal/bio fired capacity
> Syngas cluster (2018/2020)
Hub:
• Hinterland NL (Essent, GdF,
Vattenfall)
• UK (RWE, Drax, E.ON, IPP’s)
• Belgium (GdF, E.ON)
• Denmark (Vattenfall)
• Germany (residential heating)

Logo
Bioport HUB
BioPort/Hub: terminals Biomass transhipment/storage terminals
© Copyright - Port of Rotterdam - 2012 27-9-2012
BIOMASS TERMINALS
18
EMO
EBS 1
2
2
1
1
Marcor 3
RBT 4
3
4
5 ZHD
5
• Ship to shore
• Board-board
• Covered storage (500,000m3)

Logo
27-9-2012 © Copyright - Port of Rotterdam - 2012 19
ROTTERDAM BIOPORT PORT OF ROTTERDAM

Logo
Port of Rotterdam map
ENERGY PORT
© Copyright - Port of Rotterdam - 2012 27-9-2012 20
Logo
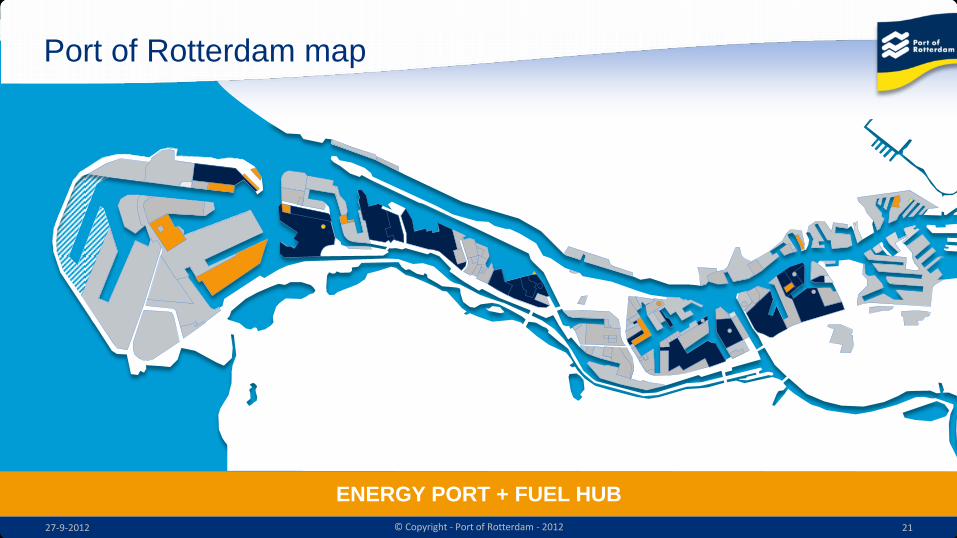
Port of Rotterdam map
ENERGY PORT + FUEL HUB
© Copyright - Port of Rotterdam - 2012 27-9-2012 21

Logo
Port of Rotterdam map
ENERGY PORT + FUEL HUB + CHEMICAL CLUSTER
© Copyright - Port of Rotterdam - 2012 27-9-2012 22

Logo
Biomass use Biomass for co-firing in power
plants
• Legislation: 20% in 2020 (RES)
Biofuels production and storage
• Legislation: 10% renewable
fuels in 2020
Biochemicals
• No legislation yet: market pull,
pilots
BIOMASS ROTTERDAM
© Copyright - Port of Rotterdam - 2012 27-9-2012 23
Energy Port
Bio-energy Fuel Hub
Bio-fuels
Biobased
industry
Chemical
Cluster
Bio-chemicals

Logo
Rotterdam offer Rotterdam BioPort
• Demand NW EU increase
• Import increase
• Shipment size increase
• Hub needed for economies of
scale and security of supply
• Rotterdam excellent position for
hub:
• captive, • central, • energy feedstock hub, • efficient handling • cascading
MAASVLAKTE BIOBASED CLUSTER
© Copyright - Port of Rotterdam - 2012 27-9-2012 24

Logo
27-9-2012 © Copyright - Port of Rotterdam - 2012 25
Hugo du Mez
+31 6 20134664
THANK YOU PORT OF ROTTERDAM
Logo
27-9-2012 © Copyright - Port of Rotterdam - 2012 26
ADDITIONAL SLIDES PORT OF ROTTERDAM

Logo European Bulk Services (EBS)
Minerals, coal, iron ore,
agribulk, biomass
• 4.3 mio t (2010)
• Storage silos cap 400,000 m3
• 35 silos and sheds
• Surface area 320,000 m2
• 14,5 m draught
Botlek
© Copyright - Port of Rotterdam - 2012 27-9-2012 27

Logo Rotterdam Bulk Terminal (RBT)
Minerals, agribulk, coal, biomass
• 1.1 mio t (2010)
• 8 steel storage silos (80,000 m3)
• Covered shed (15,000 m3)
• Covered storage shed (3,696
m2)
• 3 km covered belt system
Vlaardingen
© Copyright - Port of Rotterdam - 2012 27-9-2012 28

Logo Zeehavenbedrijf Dordrecht (ZHD)
Minerals, scrap, coal, general
cargo, biomass
• 2.7 mio t (2010)
• Surface area 230,000 m2
• Quay length 1,750 m (draught
9.5m)
• transhipment biomass
Dordrecht
© Copyright - Port of Rotterdam - 2012 27-9-2012 29

Logo
© Copyright - Port of Rotterdam - 2012 27-9-2012 30

Logo
Bioport
BIOBASED CLUSTER MV2
© Copyright - Port of Rotterdam - 2012 27-9-2012 31