degradation of tib ceramics in liquid...
TRANSCRIPT

A
IltoTda©
K
1
atcttTaecgacid
w
0d
Available online at www.sciencedirect.com
Journal of the European Ceramic Society 28 (2008) 3155–3164
Degradation of TiB2 ceramics in liquid aluminum
M.S. Jensen a,1, M. Pezzotta b,1, Z.L. Zhang b,M.-A. Einarsrud a, T. Grande a,∗
a Department of Materials Science and Engineering, Norwegian University of Science and Technology (NTNU),N-7491 Trondheim, Norway
b Department of Structural Engineering, Norwegian University of Science and Technology (NTNU),N-7491 Trondheim, Norway
Received 12 February 2008; received in revised form 30 April 2008; accepted 9 May 2008Available online 24 June 2008
bstract
nfiltration of liquid aluminum in three TiB2 materials with significantly different microstructures at 1000 ◦C has been studied. The results showarge differences in resistance towards aluminum penetration. A TiB2 material containing transition metal sintering aid, displayed a low resistanceowards penetration of liquid aluminum along grain boundaries. Grain boundary penetration was also observed in a second material containing anxycarbide secondary phase TiC O , while Al infiltration could not be detected after 100 h, in a third material with apparently no secondary phases.
1−x xhe flexural strength, hardness and stiffness of the exposed material showing the lowest resistance towards penetration of aluminum, decreasedue to penetration along grain boundaries, and the fracture mode changed from transgranular to intergranular. The experimental observations werenalyzed using a two-dimensional finite element model, reproducing the observed reduction in the stiffness due to aluminum infiltration.
2008 Elsevier Ltd. All rights reserved.
cgmmctts(eteed
eywords: TiB2; Corrosion; Al; Grain boundaries; Infiltration; Fracture
. Introduction
Titanium diboride (TiB2) is the prime candidate as a drainednd inert cathode material in Hall–Heroult aluminum elec-rolysis cells.1–4 Despite the potential of TiB2 materials, inertathodes based on TiB2 have still to be demonstrated in indus-rial cells. The main challenge is related to the fabrication andhe properties of TiB2 polycrystalline materials. Sintering ofiB2 is a challenge due to the high melting point (∼3000 ◦C),nd a very fine powder, sintering aids or hot pressing are nec-ssary in order to obtain high density and at the same timeontrol grain growth during sintering.5–8 Controlling the grainrowth is important since microcracking is known to occurbove a critical grain size.9,10 TiB2 exposed to air is always
overed by an oxide scale due to oxidation, and TiB2 ceram-cs free of oxide impurities are difficult to achieve. Moreover,espite the low solubility of TiB2 in liquid aluminum,11 TiB2∗ Corresponding author.E-mail address: [email protected] (T. Grande).
1 M.S. Jensen has performed most of the experimental data reported here,hile M. Pezzotta has performed the finite element method simulations.
bfbi
iso
955-2219/$ – see front matter © 2008 Elsevier Ltd. All rights reserved.oi:10.1016/j.jeurceramsoc.2008.05.011
eramics are vulnerable to penetration of liquid aluminum alongrain boundaries.12–20 The resistance towards infiltration of alu-inum along grain boundaries is most likely dependent on theicrostructure of the materials, especially the impurity level and
omposition at the grain boundaries, the grain size, and finallyhe porosity and the degree of microcracking.12–20 The degrada-ion mechanism of TiB2 during exposure to liquid aluminum hasome common features of liquid metal-induced embrittlementLMIE or LME)21 however, Al penetration in TiB2 is differ-nt from LMIE due to the low solubility of TiB2 in Al andhe lack of ductility of solid TiB2. For metal–metal systems thembrittled solid metal fractures at a lower strain,21 while a soft-ning of TiB2 is anticipated by Al grain boundary infiltrationue to the ductile nature of Al. The excellent wetting of TiB2y Al,3 indicates that the wetting and spreading processes arear too rapid to have a large influence on the much slower grainoundary infiltration restricted by the low solubility of TiB2n Al.
Here, we present a study of the infiltration of liquid aluminumn three TiB2 materials with different secondary phases, den-ity and microstructures. Moreover, the mechanical propertiesf one partly infiltrated TiB2 material were investigated by four

3 pean
pn
2
2
urmWHCWa
2
poiaiAfcAfewbnatrS
2
aummM
2(swtutfN
mmstT
c(a1N
2
fswA(pwdptV1w
2
t
TD
S
CHW
156 M.S. Jensen et al. / Journal of the Euro
oint bending, and the experimental data was modeled usingumerical simulations.
. Experimental
.1. Materials
Three different TiB2 materials from external suppliers weresed, material C (Ceradyne Inc., Costa Mesa, CA, USA), mate-ial W (Wacker Chemie AG, Munchen, Germany) and finallyaterial H (Norsk Hydro ASA, Oslo, Norway). Materials C andare commercial materials, while material H was produced by
ydro Research Laboratories in Porsgrunn, Norway. Materialsand H were fabricated by hot pressing (HP), while materialwas produced by conventional sintering. More information
bout the materials is given in Table 1.
.2. Exposure to liquid aluminum
Four point (4-pt) bending test bars (described below) werelaced in an alumina crucible between two aluminum blocksf ∼75 g and heated to 1000 ◦C followed by immediate cool-ng to ambient temperature (heating/cooling rate 10 ◦C/min) ingraphite furnace filled with Argon. This first heating cycle in
nert atmosphere was performed in order to obtain a completel coverage of the bars. The following exposure to Al were per-
ormed in a muffle furnace at 1000 ◦C in air so that the crucibleould be turned up-side down to separate the bars from moltenl after exposure. However, due to oxidation of liquid Al, which
urther resulted in oxidation of the bars and would thereby influ-nce on the interaction with molten aluminum, the exposure timeas limited to <24 h. Therefore, for exposure times >24 h, testars were held at 1000 ◦C for longer times in the graphite fur-ace filled with Argon, before reheating in the muffle furnacend separation from the liquid Al by the same procedure. Afterhe exposure, the remaining Al at the surface of the bars wasemoved first by etching in HCl followed by polishing usingiC papers (Struers FEPA P#500–P#1000).
.3. Mechanical characterization
4-Pt bending bars (3 mm × 4 mm × 50 mm) were preparedccording to the ASTM C 1161–2002 standard with the B config-
ration. Flexural strength of the unexposed and exposed bars waseasured at room temperature using a 4-pt bending test arrange-ent with a fully articulating 40/20 span SiC bend fixture (MTSodel 642.85) placed between two SiC pushrods attached to adcas
able 1ensity, grain size, secondary phases and flexural strength of materials C, H and W
ample Density (%) Grain size (�m) Secondary phases
98.0 7.6 (250)a Ti0.50N0.27O0.12C0.1
94.5 10.5 (394)a –99.0 16.6 (365)a Ti0.48N0.25O0.16C0.1
a Number of measured grains are included in parenthesis.b Metallic phase.
Ceramic Society 28 (2008) 3155–3164
0 kN electrochemical machine (Cormet) and a 2 kN load cellHBN). Deflection of the specimens during loading was mea-ured with a bend bar extensiometer (MTS Model 632.70-03)ith three extensiometer pushrods (MTS Model 602.81). The
wo outer pushrods were placed in correspondence with the twopper rollers of the bend fixture, while the third was placed inhe center of the sample. The deflection was taken as the dif-erence in movement between the center rod and the outer rods.ormally 3 test bars were measured for each exposure time.After testing, the bars were cut using an automatic cut-off
achine (Struers Accutom-5, Ballerup, Denmark) using a dia-ond blade to obtain a cross section of the specimens. The cross
ections were ground and polished to a mirror like finish usinghe procedure described in Struers e-Metal for preparation ofiB2 ceramics.
Vickers indentation tests were carried out on the polishedross sections using a Leica VMHT Mot microhardness testerWetzlar, Germany). Loads between 0.981 and 19.62 N werepplied, the loading rate was 25 �m/s and the holding time was0 s. The indents were measured using SEM (Hitachi S-3500N).ormally 4 indents for each load were used to calculate hardness.
.4. Characterization of the microstructure
Polished cross sections of the tested bars and fracture sur-aces of the bars were investigated using a Hitachi S-3500Ncanning electron microscope (SEM, Ibaraki, Japan) attachedith an energy dispersive spectrometer (EDS, Oxford Inc.,bingdon, UK) and a digital electron backscatter diffraction
EBSD) detector (Nordif, Trondheim, Norway). An electronrobe microanalyzer (EPMA, Jeol JXA-8500F, Tokyo, Japan)as used for element analysis of the secondary phases. X-rayiffraction (XRD) of the 4 mm × 50 mm surface of the bars waserformed using a Bruker AXE D8 Advance X-ray diffrac-ometer (Karlsruhe, Germany) using Cu K� radiation and aANTEC-1 detector. A stepsize of 0.082◦ and a counting time ofs were used in the 2θ range 25–70◦. The density of the materialsas measured using Archimedes method in isopropanol.
.5. Finite element modeling
Finite element (FE) calculations were performed to predicthe mechanical properties of the exposed TiB2. A two-
imensional model of the 4-pt bending specimen was used, andonsidering the geometry of the specimen,22 plane strain wasssumed. Since both the geometry and the applied load wereymmetric, only half of the specimen as shown in Fig. 1 wasFlexural strength (MPa)
1 + B0.22N0.21Co0.19Ni0.16Fe0.16Ti0.04Cr0.02b 411 ± 152
293 ± 6
1 273 ± 18
M.S. Jensen et al. / Journal of the European C
Fm
mtal
tTsCateatdiyttvF
Fsigd
sesFempbhit
wTa7t0
3
3
acasmmboNtp
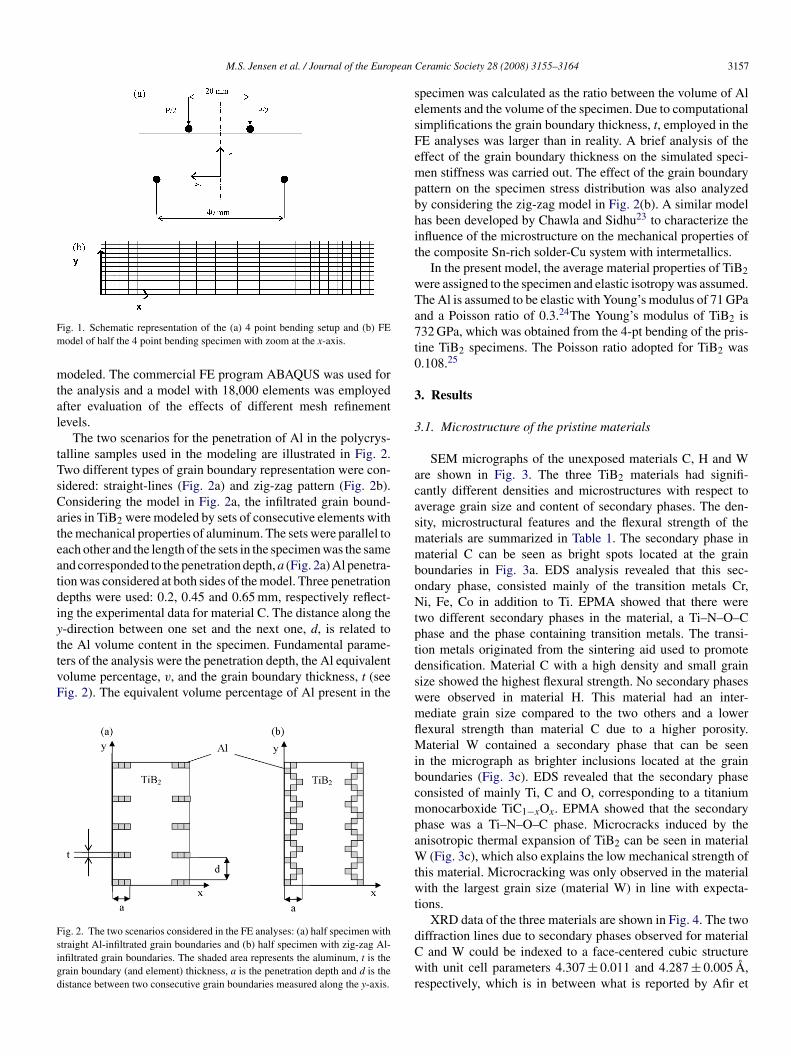
ig. 1. Schematic representation of the (a) 4 point bending setup and (b) FEodel of half the 4 point bending specimen with zoom at the x-axis.
odeled. The commercial FE program ABAQUS was used forhe analysis and a model with 18,000 elements was employedfter evaluation of the effects of different mesh refinementevels.
The two scenarios for the penetration of Al in the polycrys-alline samples used in the modeling are illustrated in Fig. 2.wo different types of grain boundary representation were con-idered: straight-lines (Fig. 2a) and zig-zag pattern (Fig. 2b).onsidering the model in Fig. 2a, the infiltrated grain bound-ries in TiB2 were modeled by sets of consecutive elements withhe mechanical properties of aluminum. The sets were parallel toach other and the length of the sets in the specimen was the samend corresponded to the penetration depth, a (Fig. 2a) Al penetra-ion was considered at both sides of the model. Three penetrationepths were used: 0.2, 0.45 and 0.65 mm, respectively reflect-ng the experimental data for material C. The distance along the-direction between one set and the next one, d, is related to
he Al volume content in the specimen. Fundamental parame-ers of the analysis were the penetration depth, the Al equivalentolume percentage, v, and the grain boundary thickness, t (seeig. 2). The equivalent volume percentage of Al present in theig. 2. The two scenarios considered in the FE analyses: (a) half specimen withtraight Al-infiltrated grain boundaries and (b) half specimen with zig-zag Al-nfiltrated grain boundaries. The shaded area represents the aluminum, t is therain boundary (and element) thickness, a is the penetration depth and d is theistance between two consecutive grain boundaries measured along the y-axis.
tdswmflMibcmpaWtwt
dCwr
eramic Society 28 (2008) 3155–3164 3157
pecimen was calculated as the ratio between the volume of Allements and the volume of the specimen. Due to computationalimplifications the grain boundary thickness, t, employed in theE analyses was larger than in reality. A brief analysis of theffect of the grain boundary thickness on the simulated speci-en stiffness was carried out. The effect of the grain boundary
attern on the specimen stress distribution was also analyzedy considering the zig-zag model in Fig. 2(b). A similar modelas been developed by Chawla and Sidhu23 to characterize thenfluence of the microstructure on the mechanical properties ofhe composite Sn-rich solder-Cu system with intermetallics.
In the present model, the average material properties of TiB2ere assigned to the specimen and elastic isotropy was assumed.he Al is assumed to be elastic with Young’s modulus of 71 GPand a Poisson ratio of 0.3.24The Young’s modulus of TiB2 is32 GPa, which was obtained from the 4-pt bending of the pris-ine TiB2 specimens. The Poisson ratio adopted for TiB2 was.108.25
. Results
.1. Microstructure of the pristine materials
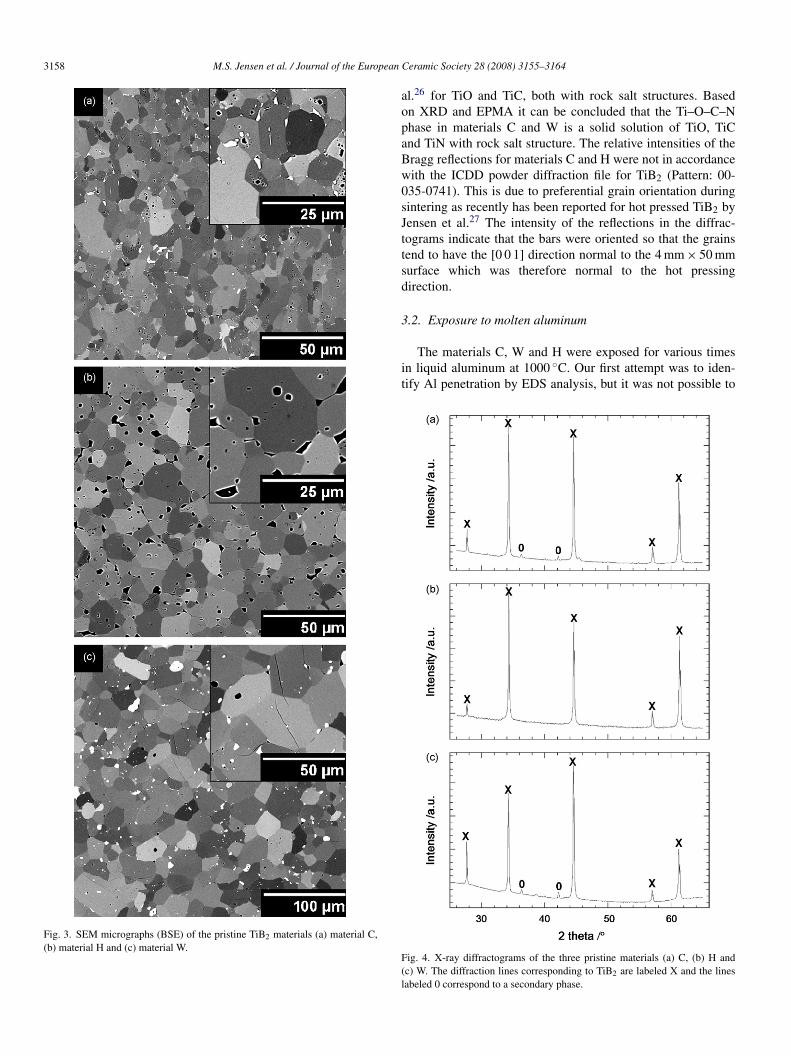
SEM micrographs of the unexposed materials C, H and Wre shown in Fig. 3. The three TiB2 materials had signifi-antly different densities and microstructures with respect toverage grain size and content of secondary phases. The den-ity, microstructural features and the flexural strength of theaterials are summarized in Table 1. The secondary phase inaterial C can be seen as bright spots located at the grain
oundaries in Fig. 3a. EDS analysis revealed that this sec-ndary phase, consisted mainly of the transition metals Cr,i, Fe, Co in addition to Ti. EPMA showed that there were
wo different secondary phases in the material, a Ti–N–O–Chase and the phase containing transition metals. The transi-ion metals originated from the sintering aid used to promoteensification. Material C with a high density and small grainize showed the highest flexural strength. No secondary phasesere observed in material H. This material had an inter-ediate grain size compared to the two others and a lowerexural strength than material C due to a higher porosity.aterial W contained a secondary phase that can be seen
n the micrograph as brighter inclusions located at the grainoundaries (Fig. 3c). EDS revealed that the secondary phaseonsisted of mainly Ti, C and O, corresponding to a titaniumonocarboxide TiC1−xOx. EPMA showed that the secondary
hase was a Ti–N–O–C phase. Microcracks induced by thenisotropic thermal expansion of TiB2 can be seen in material
(Fig. 3c), which also explains the low mechanical strength ofhis material. Microcracking was only observed in the materialith the largest grain size (material W) in line with expecta-
ions.XRD data of the three materials are shown in Fig. 4. The two
iffraction lines due to secondary phases observed for materialand W could be indexed to a face-centered cubic structure
ith unit cell parameters 4.307 ± 0.011 and 4.287 ± 0.005 A,espectively, which is in between what is reported by Afir et
3158 M.S. Jensen et al. / Journal of the European
Fig. 3. SEM micrographs (BSE) of the pristine TiB2 materials (a) material C,(b) material H and (c) material W.
aopaBw0sJttsd
3
it
F(l
Ceramic Society 28 (2008) 3155–3164
l.26 for TiO and TiC, both with rock salt structures. Basedn XRD and EPMA it can be concluded that the Ti–O–C–Nhase in materials C and W is a solid solution of TiO, TiCnd TiN with rock salt structure. The relative intensities of theragg reflections for materials C and H were not in accordanceith the ICDD powder diffraction file for TiB2 (Pattern: 00-35-0741). This is due to preferential grain orientation duringintering as recently has been reported for hot pressed TiB2 byensen et al.27 The intensity of the reflections in the diffrac-ograms indicate that the bars were oriented so that the grainsend to have the [0 0 1] direction normal to the 4 mm × 50 mmurface which was therefore normal to the hot pressingirection.
.2. Exposure to molten aluminum
The materials C, W and H were exposed for various timesn liquid aluminum at 1000 ◦C. Our first attempt was to iden-ify Al penetration by EDS analysis, but it was not possible to
ig. 4. X-ray diffractograms of the three pristine materials (a) C, (b) H andc) W. The diffraction lines corresponding to TiB2 are labeled X and the linesabeled 0 correspond to a secondary phase.

M.S. Jensen et al. / Journal of the European Ceramic Society 28 (2008) 3155–3164 3159
Fig. 5. SEM micrographs (SE) close to the surface of (a) material C after exposure for 2 h, (b) material W after exposure for 24 h, (c) material H after exposure for100 h, as well as the penetration front (indicated by dashed line) (d) located 0.45 mm from the surface in material C exposed for 2 h, and (e) 0.25 mm from the surfaceand in material W exposed for 24 h. The surface of the samples is towards the top of the micrographs.

3 pean Ceramic Society 28 (2008) 3155–3164
phAtbdctttd
trcgslFwaotmaf
FaoHe
bpa
x
Tftac2teipps
oidst
FC
oA
eWmt
iwsapplied load shows a similar trend for both the bulk and thesurface.
160 M.S. Jensen et al. / Journal of the Euro
revent the Al from being smeared out during polishing andence, chemical analysis could not be used to determine thel penetration depth. However, comparing the micrographs of
he exposed and pristine materials, we observed that the grainoundaries of the exposed materials were mechanically softeneduring the polishing. For the exposed samples, grain boundarieslose to the sample surface were infiltrated by Al and appearedo be mechanically softened and became more pronounced byhe polishing, while the interior of the material were similar tohe pristine materials. In the following this method were used toetermine the penetration depth.
Micrographs of polished cross-sections close to the surface ofhe exposed materials C, W and H are shown in Fig. 5. For mate-ial H, no indication of Al penetration along the grain boundariesould be observed. For materials C and W, the softening of therain boundaries due to penetration of liquid Al can clearly beeen. The metallic secondary phase present in material C can noonger be seen in the BSE SEM images of the exposed part inig. 5. The Ti–O–C–N phase present in both material C and Was however, still present in the infiltrated part of the materi-
ls. Any reaction between Al and the Ti–O–C–N phase was notbserved by EDS analysis. The penetration front was defined ashe boundary between the infiltrated material and the unaffected
aterial after exposure and the penetration depth was defineds the distance from the surface of the sample to the penetrationront.
SEM micrographs of the penetration front are included inig. 5 for material C after 2 h, exposure and for material Wfter 24 h, exposure. The degraded material due to penetrationf liquid Al can clearly be seen in Fig. 5(d) and (e). For material, softening of the grain boundaries could not be determined
ven after 100 h, of exposure.The penetration of Al along the grain boundaries in TiB2 can
e described by the simple relation in Eq. (1) where x is theenetration depth, D is the grain boundary diffusion coefficientnd t is the exposure time.
2 = Dt (1)
he x2 as a function of the exposure time in liquid aluminumor the three materials are plotted in Fig. 6. The penetra-ion rate was fast for material C, intermediate for material Wnd slow for material H. The grain boundary diffusion coeffi-ient for penetration of liquid Al estimated from Eq. (1) was.5 × 10−11 m2/s for material C and for material W it was foundo be 9.2 × 10⁻¹³ m2/s. For material H the penetration rate isstimated to be <1.6 × 10⁻¹⁶ m2/s. Clearly the grain boundariesn the three materials have different affinity for liquid Al. Weropose that these differences reflect the different chemical com-osition of the grain boundaries, indicated by the difference ofecondary phases in the materials.
The flexural strength and Young’s modulus as a functionf penetration depth of the exposed material C are shown
n Fig. 7. The Young’s modulus of the material was clearlyecreasing with increasing penetration depth while the flexuraltrength shows only a small decrease with increasing penetra-ion depth. Mechanical testing could not be performed for theFf
ig. 6. Penetration depth squared as a function of exposure time for materials, W and H.
ther two materials due to oxidation during exposure to liquidl.SEM micrographs of the fracture surfaces of pristine and
xposed materials are shown in Fig. 8 for materials C, H and. The micrographs show that the fracture mode changes fromainly intragranular in the pristine materials to intergranular in
he infiltrated materials.The hardness of the C material measured by Vicker’s method
s presented in Fig. 9. The hardness of the interior of the material,hich is not infiltrated by Al, is larger than the hardness of the
urface for all the applied loads. The hardness as a function of
ig. 7. Flexural strength and Young’s modulus as a function of penetration depthor material C.

M.S. Jensen et al. / Journal of the European Ceramic Society 28 (2008) 3155–3164 3161
Fig. 8. SEM micrographs of fracture surface of material C (a) before and (b) after exposure to liquid Al, material H (c) before and (d) after exposure to liquid Al andmaterial W (e) before and (f) after exposure to liquid Al.

3162 M.S. Jensen et al. / Journal of the European
Fe
3
TTtmobeAuF
Fff
siumati0sdufree
mcsTabltkhoTsms
ig. 9. Vicker’s hardness as a function of applied load for material C afterxposure to liquid Al.
.3. Modeling of the stiffness of the materials
The FE model was employed to simulate the degradation ofiB2 material C by penetration of Al along the grain boundaries.he measured Young’s modulus of the pristine material, pene-
ration depths and corresponding flexural strengths of exposedaterials were adopted for the simulations. Since the percentage
f Al present in the specimens after exposure was not possi-le to measure quantitatively, a “trial-and-error” method was
mployed to study the effect of the volume of the infiltratedl on the stiffness. Stiffness obtained from the numerical sim-lations was compared with the experimental observations inig. 10. The stiffness of the different samples was taken as theig. 10. Material stiffness from FE simulations compared to experimental valuesor material C. Al content percentage is given in the figure for the stiffness valuesrom FE simulations.
FIwu
FA
Ceramic Society 28 (2008) 3155–3164
lope load versus deflection curves. A decreasing stiffness withncreasing Al penetration depth and increasing equivalent vol-me of Al was the main trend given by the simulations. Using theodel given in Fig. 2a, two values for d was employed: d = 0.3
nd d = 1.05 mm. Simulations with d = 0.3 and 0.2 mm penetra-ion depth gave a stiffness matching well the experiments andt gave an Al content of 1.9%. Simulations with Al content of.6% corresponding to d = 1.05 and 0.2 mm penetration depthlightly overestimated the stiffness. Increasing the penetrationepth from 0.2 to 0.45 and 0.65 mm resulted in a significantnderestimation of the stiffness for d = 0.3 mm. Calculationsor d = 1.05 mm and penetration depths of 0.45 and 0.65 mmesulted in Al contents of 1.38% and 2%, respectively. The mod-led stiffness for these Al contents was in accordance with thexperiments.
A representative experimental load–deflection curve for eachaterial with a given penetration depth is plotted in Fig. 11 and
ompared to simulations from the FE analysis. The FE modelimulates fairly well the experimental load–deflection curves.he simulations overestimate the stiffness in the case a = 0.2 mmnd d = 1.05 mm as discussed above. The influence of the grainoundary thickness on the simulated stiffness values was ana-yzed by changing the thickness of the Al grain boundaries inhe FE model. The Al content and the penetration depth wereept constant. The considered thicknesses were t and 2t (Fig. 2),owever, no noticeable difference in the predicted stiffness wasbserved after changing the thickness of the grain boundaries.he effect of the FE mesh on the results was also studied. Thelope of the load–displacement curve was slightly affected by theesh refinement level. Further refinement of the present model
howed no significant change of the results. Therefore the used
E model was regarded as sufficient for the present purpose.n addition, the stress distribution in the penetrated materialas studied. The stress levels obtained from the FE analysissing both models in Fig. 2a and b, are about or below the yieldig. 11. Experimental load–displacement curves for material C with differentl penetration depths compared to data from FE simulations.

pean C
sb
4
4
TtfccetmiAdaAtrgsFtpTspsb(oithTpo
iotstsi
ATEtTT
AsfAVaeTfdif
tiwAim
4p
tadiobTlcFhti
indabtAbath
4
M.S. Jensen et al. / Journal of the Euro
tress value of aluminum alloys24 confirming the assumed elasticehavior of Al.
. Discussion
.1. Infiltration of liquid aluminum in TiB2
The investigation of the microstructure of the three differentiB2 materials before and after exposure to liquid Al shows that
hey are vulnerable to degradation due to infiltration of Al in theorm of penetration along the grain boundaries. The penetrationauses a weakening of the grain boundary cohesion and possiblyracking, pull out of grains and failure of the TiB2 cathode duringlectrolysis. There are several possible mechanisms for the infil-ration of Al along grain boundaries in a polycrystalline ceramic
aterial. For the first, wetting of the grain boundaries will occurf the TiB2 grain boundary interfacial energy is twice that of thel–TiB2 interfacial energy. The interfacial energy may changeue to impurities segregated to the grain boundaries, temperaturend crystallography. Due to the low solubility of TiB2 in liquidl, elastic strains will build up upon penetration of Al along
he grain boundaries. This will either impede the penetration, oresult in cracking of the material. Secondly, infiltration of therain boundaries will result if there is a reduction of internaltrain due to the anisotropic thermal expansion after infiltration.urther, penetration through open porosity in the material or
hrough microcracks is a possible infiltration mechanism. Lastly,enetration due to reactions with a secondary phase is possible.he penetration in a material with a secondary phase which isoluble in Al (e.g. metal) will be driven by diffusion, while theenetration in a material with a secondary phase not coexistent oroluble in Al (e.g. refractory oxide such as TiO2) will be driveny the chemical reaction between the secondary phase and Ale.g. Al + TiO2 = Al2O3 + Ti). If the reaction between the sec-ndary phase and Al forms a phase with increased molar volume,nternal stresses will build up and possibly induce crack forma-ion and by this way increase the rate of degradation. Such effectas been reported for the reaction 4Al + 3TiC = Al4C3 + 3Ti.28
he distribution of the secondary phase will also influence theenetration rate. Hence, the penetration rate will be dependentn both the nature and the distribution of the secondary phase.
The materials investigated in this study which has beennfiltrated by Al during the exposure experiments contained sec-ndary phases and hence the penetration involved reactions withhe secondary phases. Material C was penetrated due to the dis-olution of the metallic secondary phase as there were no sign ofhis phase after penetration of Al. TiB2 materials with metallicecondary phases exposed to Al have been shown to be readilynfiltrated in earlier studies.16
Material W was probably penetrated due the reaction betweenl and the Ti–N–C–O phase, however, any formation of ai–N–C–O–Al phase due this reaction was not observed by
DS. It is possible, however, that only the outermost layer ofhe Ti–N–C–O phase reacted with the Al. After exposure ofiB2 with several oxide impurities Pettersen,28 e.g. found that ai(CNO) phase present prior to exposure was partly reacted with
t∼of
eramic Society 28 (2008) 3155–3164 3163
l after exposure. An �-Al2O3 phase was also found in the sameample and Ti2O3 was proposed to be the main oxygen sourceor the alumin formation. Penetration due to reaction betweenl and oxide secondary phases has also been identified by Nord-arhaug17 who found �-Al2O3 and �-Al2O3 in triple junctionsnd an (Al2OC)1−x(AlN)x phase surrounding the grains afterxposure of TiB2 with SiO2 as the main oxide impurity phase.he SiO2 was believed to be the oxygen source for the alumina
ormation, however the source for (Al2OC)1−x(AlN)x was notetermined. Gesing and Wheeler29 reported formation of Al2O3n a material containing oxide impurities on grain boundaries andormation of Al4C3 in materials containing C in triple junctions.
In this study the rate of penetration of Al in the material withhe metallic secondary phase is higher than the rate of penetrationn the material with the Ti–N–C–O phase. However, material Hith no secondary phase observed shows superior resistance tol penetration. Thus it seems that the grain boundary chemistry
s more important than the density and the strength of a TiB2aterial used as a cathode during Al electrolysis.
.2. Influence of the infiltration on the mechanicalroperties
The mechanical properties of TiB2 are degraded by infiltra-ion of liquid Al as shown for material C. A decrease of stiffnessnd Young’s modulus of TiB2 was observed as the Al penetrationepth increased (Fig. 7). The stiffness of the penetrated materials a function of Young’s modulus of TiB2, the Young’s modulusf Al, the amount of Al and the penetration depth along the grainoundaries. The role of aluminum, a ductile material, is to softeniB2. Therefore Al-infiltrated TiB2 responds to the same applied
oad with a larger deflection than pristine TiB2 (Fig. 11). Thishange of load–deflection behavior was well simulated by theE model. The infiltrated material also presents a lower Vicker’sardness than pristine material. As hardness is a measure of plas-ic deformation during indentation, material infiltrated with Als more prone to local deformation.
The flexural strength of TiB2 also seems to decrease byncreasing the Al penetration depth. The decrease is howeverot so pronounced probably due to a crack bridging effect of theuctile Al along the grain boundaries as the penetrated materi-ls show intergranular fracture mode. There is a change in grainoundary cohesion at room temperature giving a change fromransgranular to intergranular fracture mode after penetration ofl. At elevated temperatures, the grain boundary cohesion wille significantly lower since the Al present at the grain bound-ries will be in the liquid state. A change of fracture mode fromransgranular to intergranular due to Pb infiltration in an Al alloyas also been reported.30
.3. Potential for inert cathodes based on TiB2
Finch11 measured the solubility of Ti and B in liquid Al at
emperatures between 800 and 1300 ◦C. A solubility product of1 × 10−8 for TiB2 in liquid Al at 960 ◦C was reported. Basedn this, Thonstad et al.31 estimated a wear rate of ∼0.2 mm/yearor a commercial electrolysis cell. A degradation rate of this

3 pean
oHdamd∼v
5
paeassttsApFimt
A
wT
R
1
1
1
1
1
1
1
1
1
1
2
2
2
2
2
2
2
2
2
2
164 M.S. Jensen et al. / Journal of the Euro
rder would be of no concern for a massive TiB2 cathode.owever, as shown in this study, the degradation of TiB2 isetermined by the infiltration of Al along the grain boundariesnd not dissolution of the TiB2 material itself. Assuming detach-ent of grains from the electrode in the infiltrated material, the
egradation rate would be ∼60 mm/year for material W and1900 mm/year for material C, which is well above acceptable
alues.
. Conclusions
Polycrystalline TiB2 ceramics with secondary phases wereenetrated by aluminium during exposure in liquid aluminiumt 1000 ◦C. The penetration rate depended especially on the pres-nce and distribution of secondary phases at the grain boundariesnd triple junctions while density, porosity and grain size werehown to be of less importance. After penetration of Al, thetiffness, Young’s modulus, hardness and flexural strength ofhe material were reduced and the fracture mode changed fromransgranular to intergranular. A FE model was developed toimulate the stiffness decrease in TiB2 due to the presence ofl. The stiffness of TiB2 was predicted as a function of theenetration depth and the Al equivalent volume content. TheE model showed that the equivalent volume percentage of Al
n the specimen affected largely the stiffness of the penetratedaterial. The FE simulation showed results in accordance with
he experiments.
cknowledgement
This study was supported by The Research Council of Nor-ay through the project “Thermodynamics Applied to Highemperature Materials Technology”.
eferences
1. Sørlie, M. and Øye, H. A., Cathodes in Aluminium Electrolysis (2nd ed.).Aluminium-Verlag, Dusseldorf, 1994.
2. Boxall, L. G., Cooke, A. V. and Hayden, H. W., Light metals 1984. The Met-allurgical Society of AIME. Warrendale, Pennsylvania, 1984, pp. 573–588.
3. Billehaug, K. and Øye, H. A., Inert cathodes for aluminum electrolysis inHall–Heroult cells. Pt. I. Aluminium, 1980, 56(10), 642–648.
4. Billehaug, K. and Øye, H. A., Inert cathodes for aluminum electrolysis inHall–Heroult cells. Pt. II. Aluminium, 1980, 56(11), 713–718.
5. Baumgartner, H. R. and Steiger, R. A., Sintering and properties of titaniumdiboride made from powder synthesizes in a plasma-arc. J. Am. Ceram. Soc.,1984, 67(3), 207–212.
6. Einarsrud, M.-A., Hagen, E., Pettersen, G. and Grande, T., Pressurelesssintering of titanium diboride with nickel, nickel boride, and iron additives.J. Am. Ceram. Soc., 1997, 80(12), 3013–3020.
7. Finch, C. B., Effect of impurities on the densification of submicrometer TiB2
powders. Adv. Ceram. Mater., 1986, 1(1), 50.8. Tennery, V. J., Finch, C. B., Yust, C. S. and Clarck, G. W., In
Structure–Property Correlations for TiB2-based Ceramics Densified UsingActive Liquid Metals, ed. R. K. Viswanadham, D. J. Rowcliff and J. Gurland.Plenum Publishing Corp., New York, 1983.
3
3
Ceramic Society 28 (2008) 3155–3164
9. Evans, A. G., Microfracture from thermal-expansion anisotropy. 1. Single-phase systems. Acta Metall., 1978, 26(12), 1845–1853.
0. Pezzotta, M., Zhang, Z. L., Jensen, M., Grande, T. and Einarsrud, M.-A.,Cohesive zone modeling of grain boundary microcracking induced by ther-mal anisotropy in titanium diboride ceramics. Comp. Mater. Sci., 2008,43(3), 440–449.
1. Finch, N. J., The mutual solubilities of titanium and boron in pure aluminum.Metall. Mater. Trans. B, Process Metall. Mater. Process. Sci., 1972, 3(10),2709–2711.
2. Bannister, M. K. and Swain, M. V., A preliminary investigation of the corro-sion of a TiB2/BN/AIN composite during aluminium evaporation. Ceram.Int., 1989, 15(6), 375–382.
3. Baumgartner, H. R., Subcritical crack velocities in titanium diboride undersimulated Hall–Heroult cell conditions. Am. Ceram. Soc. Bull., 1984, 63(9),1172–1175.
4. Baumgartner, H. R., Mechanical properties of densely sintered high-puritytitanium diborides in molten aluminum environments. J. Am. Ceram. Soc.,1984, 67(7), 490–497.
5. Dorward, R. C., Aluminium penetration and fracture of titanium diboride.J. Am. Ceram. Soc., 1982, 65(1), C6.
6. Finch, C. B. and Tennery, V. J., Crack formation and swelling of TiB2–Niceramics in liquid aluminum. J. Am. Ceram. Soc., 1982, 65(7), C100–C101.
7. Nord-Varhaug, K. K., TEM investigation of impurity phases and the pen-etration of liquid aluminum in hot isostatically pressed TiB2 compacts. J.Am. Ceram. Soc., 1996, 79(5), 1147–1154.
8. Zdaniewski, W. A., Role of microstructure and intergranular phases in stresscorrosion of TiB2 exposed to liquid aluminum. J. Am. Ceram. Soc., 1985,68(11), 309–312.
9. Zdaniewski, W. A., Degradation of hot-pressed TiB2–TiC composite inliquid aluminium. Am. Ceram. Soc. Bull., 1986, 65(10), 1408–1414.
0. Zdaniewski, W. A., Effect of segregated Cr on degradation of (Ti,Cr)B2 exposed to liquid aluminium. J. Electrochem. Soc., 1986, 133(9),1777–1781.
1. Joseph, B., Picat, M. and Barbier, F., Liquid metal embrittlement: a state-of-the-art appraisal. EPJ Appl. Phys., 1999, 5(1), 19–31.
2. Chen, C. R., Pascual, J., Fischer, F. D., Kolednik, O. and Danzer, R., Pre-diction of fracture toughness of a ceramic multilayer composite—modelingand experiments. Acta Mater., 2007, 55(2), 409–421.
3. Chawla, N. and Sidhu, R. S., Microstructure-based modeling of deformationin Sn-rich (Pb-free) solder alloys. J. Mater. Sci.: Mater. Electron., 2007,18(1–3), 175–189.
4. Benham, P. P., Crawfords, R. J. and Armstrong, C. G., Mechanics of Engi-neering Materials (2nd ed.). PAddison Wesley Longman Limited, Essex,1996.
5. Munro, R. G., Material properties of titanium diboride. J. Res. Nat. Inst.Stand. Technol., 2000, 105(5), 709–720.
6. Afir, A., Achour, M. and Saoula, N., X-ray diffraction study of Ti–O–Csystem at high temperature and in a continuous vacuum. J. Alloys Compd.,1999, 288(1/2), 124–140.
7. Jensen, M. S., Einarsrud, M.-A. and Grande, T., Preferential grain orientationin hot pressed TiB2. J. Am. Ceram. Soc., 2007, 90(4), 1339–1341.
8. Pettersen, G., Development of microstructure during sintering and alu-minium exposure of titanium diboride ceramics. Dr. Ing. Thesis, NorwegianUniversity of Science and Technology, Department of Physics, Trondheim,1997.
9. Gesing, A. J. and Wheeler, D. J., In Screening and Evaluation Methodsof Cathode Materials for use in Aluminum Reduction Cells in Presence ofMolten Aluminum and Cryolite up to 1000 ◦C, in Light Metals, AIME Annual
Meeting, 1987, pp. 327–334.0. Wouters, O. and De Hosson, J. Th. M, Lead induced intergranular fracturein aluminum alloy AA6262. Mater. Sci. Eng., 2003, A361(1–2), 331–337.
1. Thonstad, J., Aluminium Electrolysis: Fundamentals of the Hall–Heroultprocess. Aluminium-Verlag, Dusseldorf, 2001, p. 359.