determining material true stressstrain curve from tensile...
TRANSCRIPT
\PERGAMON International Journal of Solids and Structures 25 "0888# 2386Ð2405
9919Ð6572:88:, ! see front matter Þ 0888 Elsevier Science Ltd[ All rights reservedPII] S 9 9 1 9 Ð 6 5 7 2 " 8 7 # 9 9 0 4 2 ÐX
Determining material true stressÐstrain curve from tensilespecimens with rectangular cross!sectionZ[ L[ Zhang�\ M[ Hauge\ J[ Ošdega�rd\ C[ Thaulow
SINTEF Materials Technolo`y\ Rich[ Birkelands vei 0C\ N!6923 Trondheim\ Norway
Received 11 November 0886^ in revised form 12 April 0887
Abstract
The uniaxial true stress logarithmic strain curve for a thick section can be determined from the loadÐdiameter reduction record of a round tensile specimen[ The correction of the true stress for necking can beperformed by using the well!known Bridgman equation[ For thin sections\ it is more practical to usespecimens with rectangular cross!section[ However\ there is no established method to determine the completetrue stressÐlogarithmic strain relation from a rectangular specimen[ In this paper\ an extensive three!dimensional numerical study has been carried out on the di}use necking behaviour of tensile specimensmade of isotropic materials with rectangular cross!section\ and an approximate relation is establishedbetween the area reduction of the minimum cross!section and the measured thickness reduction[ It is foundthat the area reduction can be normalized by the uniaxial strain at maximum load which represents thematerial hardening and also the section aspect ratio[ Furthermore\ for the same material\ specimens withdi}erent aspect ratio give exactly the same true average stressÐlogarithmic strain curve[ This _nding impliesthat Bridgman|s correction can still be used for necking correction of the true average stress obtained fromrectangular specimens[ Based on this _nding\ a method for determining the true stressÐlogarithmic strainrelation from the loadÐthickness reduction curve of specimens with rectangular cross!section is proposed[Þ 0888 Elsevier Science Ltd[ All rights reserved[
Keywords] Fracture^ True stressÐstrain curve^ Rectangular tensile specimen^ Di}use necking^ Plastic forming^ Bridging correction
Nomenclature
s¹ ~ow stress used as input for the _nite element analysessE {exact| true average stress obtained directly from the _nite element resultssa approximate true average stress calculated according to the proposed equation from the
loadÐthickness reduction curves¹ a Bridgman corrected true stress from the sa
S cross!section aspect ratio
� Corresponding author[ Fax] 99 36 62 48 18 20^ E!mail] zhiliang[zhangÝmatek[sintef[no
Z[L[ Zhan` et al[ : International Journal of Solids and Structures 25 "0888# 2386Ð24052387
DA:A9 total area reduction ratioDt:t9 thickness reduction ratioPmax maximum loadA9 initial area of the cross!sectionA current area of the cross!sectiono logarithmic strain\ o � ln"A9:A#t9 initial thicknessDAP area reduction ratio due to proportional deformationDAS area reduction ratio due to shape change of the cross!section
0[ Introduction
True stressÐlogarithmic strain curve including material response in both the pre! and post!plasticlocalization regime\ becomes essential when large deformation is considered\ for example\ in themetal forming analysis and in the analysis of ductile damage and fracture[ It is also important inthose cases where plastic strain hardening mismatch e}ect on the ductile behaviour is concerned[For thick sections\ the true stressÐlogarithmic strain curve can usually be conveniently determinedfrom the loadÐdiameter reduction curve of round tensile bars\ and the well known Bridgman"0841# equation can be used for necking correction[ When thin sections are concerned\ it is morepractical to use specimens with rectangular cross!section for uniaxial tensile test[ However\ thereis no method available for determining the whole true stressÐlogarithmic strain curve usingrectangular specimens and the correction of the true stress for necking was thought to be morecomplicated than for the round bar[ There are basically two problems in developing the method[The _rst problem is how to calculate or measure the true area\ which is not only a function ofloading\ but also depends on section|s aspect ratio and material|s plastic hardening[ Accordingto the authors| knowledge\ there is no practical measuring system available in the market tosimultaneously measure the minimum true area of cross!section vs loading[ The second problemis how to correct the true stress obtained from rectangular tensile specimen for necking\ as it isobvious that the so!called true stress is the {true average tensile stress| in the neck where the stressdistribution is not uniform "see e[g[ Aronofsky\ 0840# and it should be corrected before it can beused as the uniaxial ~ow stress[
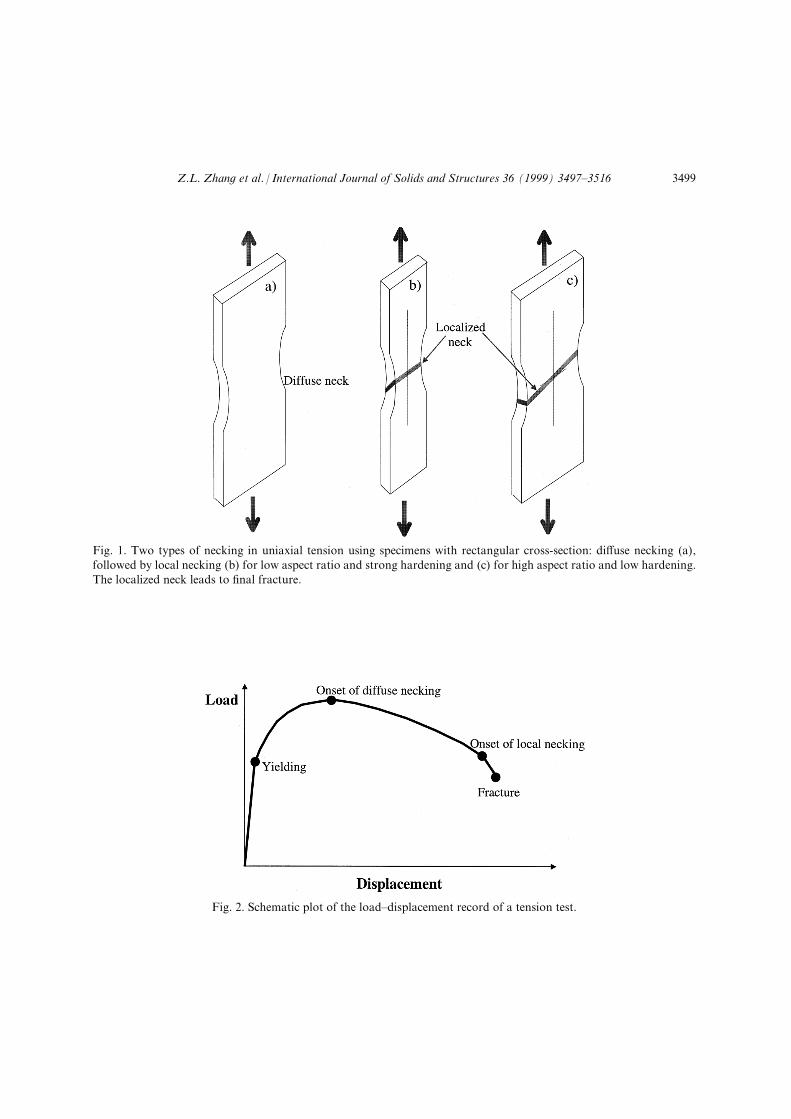
In a uniaxial tension test with ductile rate!independent material\ plastic instability and ~owlocalization will occur just after the maximum load and the so!called di}use necking starts[ Thisform of unstable ~ow is analogous to the neck formed in a round tensile bar[ Di}use necking mayterminate in fracture[ But usually after the onset of the di}use neck\ the deformation continuesunder the falling load until the development of a localized neck\ which leads ultimately to ductilefracture "see e[g[ Dieter\ 0875^ Bayoumi and Joshi\ 0881#[ Figure 0 depicts the two types of neckingobserved in the uniaxial tension test with rectangular cross!section specimens[ For specimens withlow cross!section aspect ratio and strong plastic hardening ability\ the localized neck can occurinclined at an angle to the tension axis\ across the thickness of the specimen "Ošdega�rd\ 0886#[ Theso!called sheet necking with a through thickness neck\ inclined to the tension axis across the widthof the specimen can be observed for specimens with high cross!section aspect ratio and lowhardening ability[ Figure 1 schematically shows the typical load vs displacement curve of a tension
Z[L[ Zhan` et al[ : International Journal of Solids and Structures 25 "0888# 2386Ð2405 2388
Fig[ 0[ Two types of necking in uniaxial tension using specimens with rectangular cross!section] di}use necking "a#\followed by local necking "b# for low aspect ratio and strong hardening and "c# for high aspect ratio and low hardening[The localized neck leads to _nal fracture[
Fig[ 1[ Schematic plot of the loadÐdisplacement record of a tension test[

Z[L[ Zhan` et al[ : International Journal of Solids and Structures 25 "0888# 2386Ð24052499
test[ Uniform elasticÐplastic deformation stops at the onset of di}use necking\ followed by non!uniform plastic deformation[ The process from the onset of local necking to fracture is often avery short and rapid process[ This investigation focuses on the non!uniform ~ow process from theonset of di}use necking to the onset of local necking[ The proposed equations cease to be validwhen the localized neck starts to develop[
In this study\ an extensive three!dimensional "2!D# numerical study on the di}use neckingbehaviour of rectangular tensile specimens with various aspect ratios and plastic strain hardeningability has been carried out[ Isotropic homogeneous materials are considered[ It is shown that thearea reduction can be separated into two parts\ the proportional area reduction calculated directlyfrom the thickness reduction and the non!proportional reduction due to shape change of the cross!section[ The total area reduction deviates from the proportional part once the di}use neckingstarts\ just after the maximum load[ Numerical results show that the area reduction due to shapechange can be approximately normalized by the cross!section aspect ratio and the strain at themaximum load\ which represents materials plastic hardening ability[ After the true area reductionhas been calculated\ the true stressÐlogarithmic strain curve can be obtained[
It has been found that for the same material\ before the local necking all the specimens withdi}erent aspect ratios give exactly the same true average stressÐlogarithmic strain curves as a roundtensile bar[ Therefore\ the Bridgman equation can still be applied for the correction of true stressobtained from rectangular specimens for necking[
In the following\ the numerical procedure used in the study\ including the _nite element modelsand materials\ is reported _rst[ The di}use necking behaviour is brie~y discussed in Section 2[Then an approximate relation between the thickness reduction and the total area reduction fordi}erent materials and aspect ratios is presented in Section 3[ In Section 4\ the relation was veri_edby comparing the true stressÐstrain curve calculated according to the proposed procedure usingthe loadÐthickness reduction relation and the {exact| curve directly obtained from the _nite elementanalyses for various kinds of materials[ The Bridgman correction for the true stressÐstrain curveis examined in Section 5[ A procedure for determining true stressÐstrain from rectangular tensilespecimens in proposed in the _nal part of the paper[ The limitation of the method is also discussed[The scope of the work carried out in this paper is schematically shown in Fig[ 2[
1[ Numerical procedure
1[0[ Finite element models
Figure 3"a# shows the typical mesh "0:7# for the tensile specimen with rectangular cross!section[ The initial thickness of all the specimens\ t9\ is _xed[ Specimens with initial aspect ratioS � w9:t9 � 0Ð4\ 7 have been analyzed[ The initial length of the specimens with aspect ratio 0Ð4 is_xed to L9 � 13t9[ The length of the specimen with aspect ratio 7 is L9 � 39t9\ in order to havesu.cient length:width ratio[ Because only the di}use necking is concerned in this study\ by makinguse of the symmetries with all the three co!ordinate planes one eighth of the specimen was modeled[There are four 2!D 7!node brick elements in half of the thickness and 01 elements in half of thewidth[ The mesh in the length direction is biased with _ne mesh close to the centre of the specimen[There are 539 2!D elements and 824 nodes in the model with aspect ratio 3[ The meshes for other

Z[L[ Zhan` et al[ : International Journal of Solids and Structures 25 "0888# 2386Ð2405 2490
Fig[ 2[ Schematic plot of the scope of the study] from the FE analysis we can obtain both the loadÐthickness reductioncurve and the {exact| true stressÐstrain curve\ sE−o^ a method is proposed to calculate the approximate true stressÐstrain curve\ sa−o\ from the loadÐthickness reduction curve^ this method is veri_ed by comparing the approximate and{exact| true stressÐstrain curves[
specimens with di}erent aspect ratios are in general similar to the mesh shown in Fig[ 3"a#[ Theactual number of elements in the width direction is adjusted according to the absolute value of thewidth[ The e}ect of mesh size and Gauss integration scheme on the loading behaviour of rectangulartensile specimen has been investigated by Tvergaard "0882# and very limited e}ect was observed[Compared with other notched or cracked specimens the stress distribution in the tensile specimenis relatively uniform even after the di}use necking has appeared[ Therefore\ we can expect that thecurrent meshes employed in the computations may be _ne enough[
Because only di}use necking is concerned in this study\ the displacement boundary conditionsapplied to the model are de_ned as follows]
y � L9:1 ] uy � uprescribed\
y � 9] uy � 9\
x � 9 ] ux � 9\
z � 9 ] uz � 9[ "0#
In order to trigger necking\ an initial imperfection\ 9[3) of the width with a notch radius 01t9

Z[L[ Zhan` et al[ : International Journal of Solids and Structures 25 "0888# 2386Ð24052491
Fig[ 3[ "a# Finite element mesh "0:7# for the model with aspect ratio 3\ "b# symmetrical necking for specimen with aspectratio 3\ hardening exponent 9[04\ E:sy � 499\ and "c# shape change of the cross!section "0:3#[
is applied to both sides in the width direction in the centre of the model[ Preliminary study withdi}erent values of the imperfection has shown that the applied initial imperfection has littlein~uence on the numerical results[ A similar observation was noted by Tvergaard "0882#[
1[1[ Materials
Materials with various hardening behaviour have been analyzed[ The materials in general canbe classi_ed into two categories\ the one with which the hardening behaviour can be described bya single parameter\ for example\ the hardening exponent according to a power hardening law andthe one its hardening behaviour cannot be described by a single parameter[ In this study\ materialswith the following rate!independent strain hardening power law have been analyzed _rst]
s¹ � s9 00¦o¹p
o91n
\ "1#

Z[L[ Zhan` et al[ : International Journal of Solids and Structures 25 "0888# 2386Ð2405 2492
Fig[ 4[ "a# The materials used for deriving the areaÐthickness reduction relation[ Shown in the _gure are the materialswith di}erent hardening exponents and E:sy � 499 and n � 9[2\ "b# the two real materials used for testing the areaÐthickness reduction relation[ In "b# the bold dashed line after the dot is arti_cially extrapolated[
where s¹ is the ~ow stress corresponding to the equivalent plastic strain o¹p\ s9 is the yield stress\ o9
is the yield strain o9 � s9:E\ n is the strain hardening exponent and E the Young|s modulus[ Fourhardening exponents\ n � 9[94\ 9[0\ 9[04 and 9[1 with E:sy � 499 and Poisson ratio n � 9[2 havebeen considered[ One calculation with n � 9[04\ E:sy � 064 and n � 9[2\ has also been carried out[From the results of this type material\ the approximate relation between the area reduction andthickness reduction for determining the true stressÐlogarithmic strain curve was established[
The established method was then tested by applying the method to two real materials\ one steeland one aluminium\ for which the hardening behaviour cannot be described by a single parameter[Figure 4"a# shows the materials with E:sy � 499\ n � 9[94\ 9[0\ 9[04 and 9[1 and Fig[ 4"b# the tworeal materials\ steel D "see Zhang and Hauge\ 0884# and aluminium M2 "Ošdega�rd and Zhang\0886#[
The analyses were performed by using large deformation and incremental plasticity theoryimplemented by ABAQUS[ Each run with extensive output takes approximately one hour CPUtime in a CRAY J89 computer[ By combining di}erent material and cross!section aspect ratios\totally 37 analyses have been performed[
2[ Diffuse necking
The main concern of this study is to determine the true stressÐstrain curve from the di}usenecking mode "symmetrical# of tensile specimens with rectangular cross!section[ The assumedboundary conditions\ symmetries and initial imperfections guarantee that the di}use neckingrather than the local necking appears _rst critical[ According to the Considere "0774# criterion\the onset of necking occurs when the true hardening rate exactly equals the true stress\ just afterthe maximum load]

Z[L[ Zhan` et al[ : International Journal of Solids and Structures 25 "0888# 2386Ð24052493
Fig[ 5[ "a# Gross stress vs thickness reduction\ "b# total area reduction vs thickness reduction\ "c# non!proportional areareduction vs thickness reduction and "d# normalized curves of "c# by the corresponding non!proportional area reductionat 49) thickness reduction[ The material is n � 9[04\ E:sy � 499 and n � 9[2[
ds
do� s[ "2#
Figure 5"a# shows the gross stress vs thickness reduction curves for the material with hardeningexponent n � 9[04\ obtained from the _nite element analyses for various aspect ratios[ For thematerial model shown by eqn "1#\ we obtain the strain at the maximum load at o � 9[04\ whichcorresponds to 6[4) of thickness reduction[ The maximum load in the analyses appears very closeto the 6[4) thickness reduction[ This observation is the same for all the aspect ratios[ The exactvalue is slightly in~uenced by the value of the initial imperfection and the load increment scheme[It can be seen from Fig[ 5"a# that after the maximum load\ the load decreases much faster in thespecimens with low aspect ratio than with high aspect ratio[
Figure 3"b# shows the deformed mesh for the model with aspect ratio 3 and 3"c# for the originaland deformed minimum cross!section[ Although there is a tendency for local necking in later stage
Z[L[ Zhan` et al[ : International Journal of Solids and Structures 25 "0888# 2386Ð2405 2494
especially for low hardening material\ the minimum area appears in the centre of the specimen inall the analyses\ where the thickness reduction is recorded[ This certi_es that the recorded thicknessreduction is the reduction at the minimum section[ The check is performed for all the analyses toguarantee a valid load thickness reduction curve[
3[ Thickness reduction and area reduction of rectangular cross!section
3[0[ Proportional and non!proportional area reduction
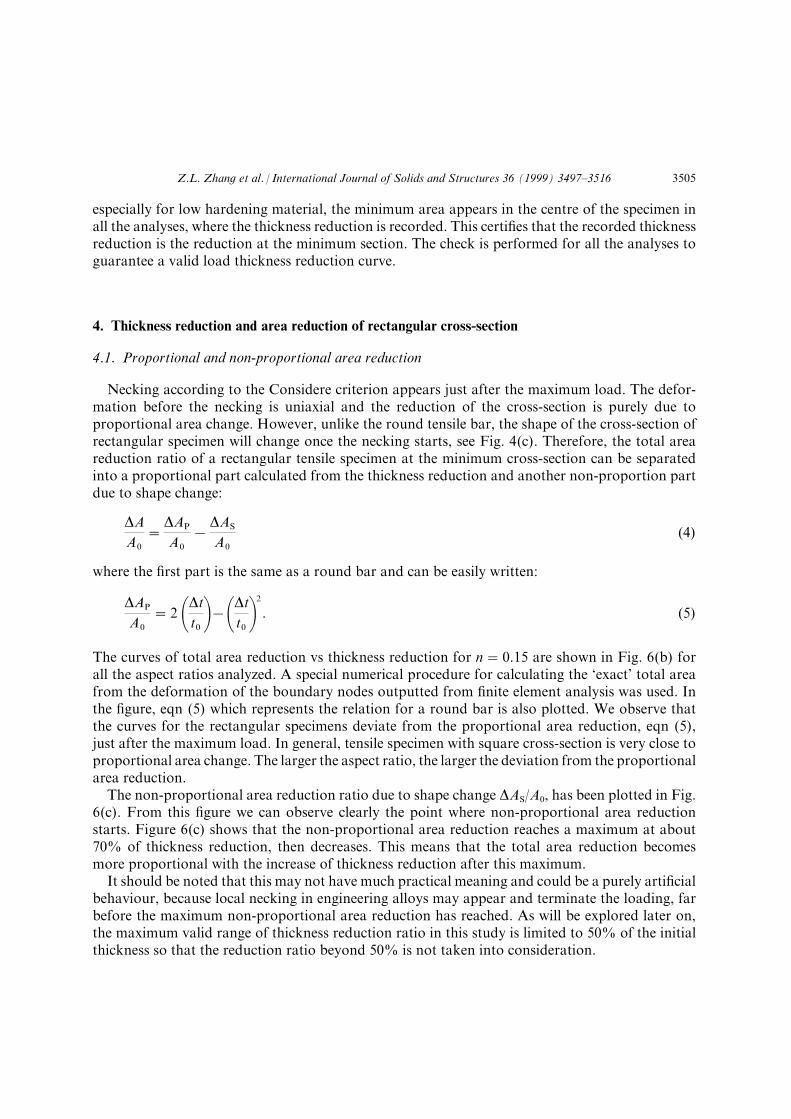
Necking according to the Considere criterion appears just after the maximum load[ The defor!mation before the necking is uniaxial and the reduction of the cross!section is purely due toproportional area change[ However\ unlike the round tensile bar\ the shape of the cross!section ofrectangular specimen will change once the necking starts\ see Fig[ 3"c#[ Therefore\ the total areareduction ratio of a rectangular tensile specimen at the minimum cross!section can be separatedinto a proportional part calculated from the thickness reduction and another non!proportion partdue to shape change]
DAA9
�DAP
A9
−DAS
A9
"3#
where the _rst part is the same as a round bar and can be easily written]
DAP
A9
� 1 0Dtt9 1−0
Dtt9 1
1
[ "4#
The curves of total area reduction vs thickness reduction for n � 9[04 are shown in Fig[ 5"b# forall the aspect ratios analyzed[ A special numerical procedure for calculating the {exact| total areafrom the deformation of the boundary nodes outputted from _nite element analysis was used[ Inthe _gure\ eqn "4# which represents the relation for a round bar is also plotted[ We observe thatthe curves for the rectangular specimens deviate from the proportional area reduction\ eqn "4#\just after the maximum load[ In general\ tensile specimen with square cross!section is very close toproportional area change[ The larger the aspect ratio\ the larger the deviation from the proportionalarea reduction[
The non!proportional area reduction ratio due to shape change DAS:A9\ has been plotted in Fig[5"c#[ From this _gure we can observe clearly the point where non!proportional area reductionstarts[ Figure 5"c# shows that the non!proportional area reduction reaches a maximum at about69) of thickness reduction\ then decreases[ This means that the total area reduction becomesmore proportional with the increase of thickness reduction after this maximum[
It should be noted that this may not have much practical meaning and could be a purely arti_cialbehaviour\ because local necking in engineering alloys may appear and terminate the loading\ farbefore the maximum non!proportional area reduction has reached[ As will be explored later on\the maximum valid range of thickness reduction ratio in this study is limited to 49) of the initialthickness so that the reduction ratio beyond 49) is not taken into consideration[

Z[L[ Zhan` et al[ : International Journal of Solids and Structures 25 "0888# 2386Ð24052495
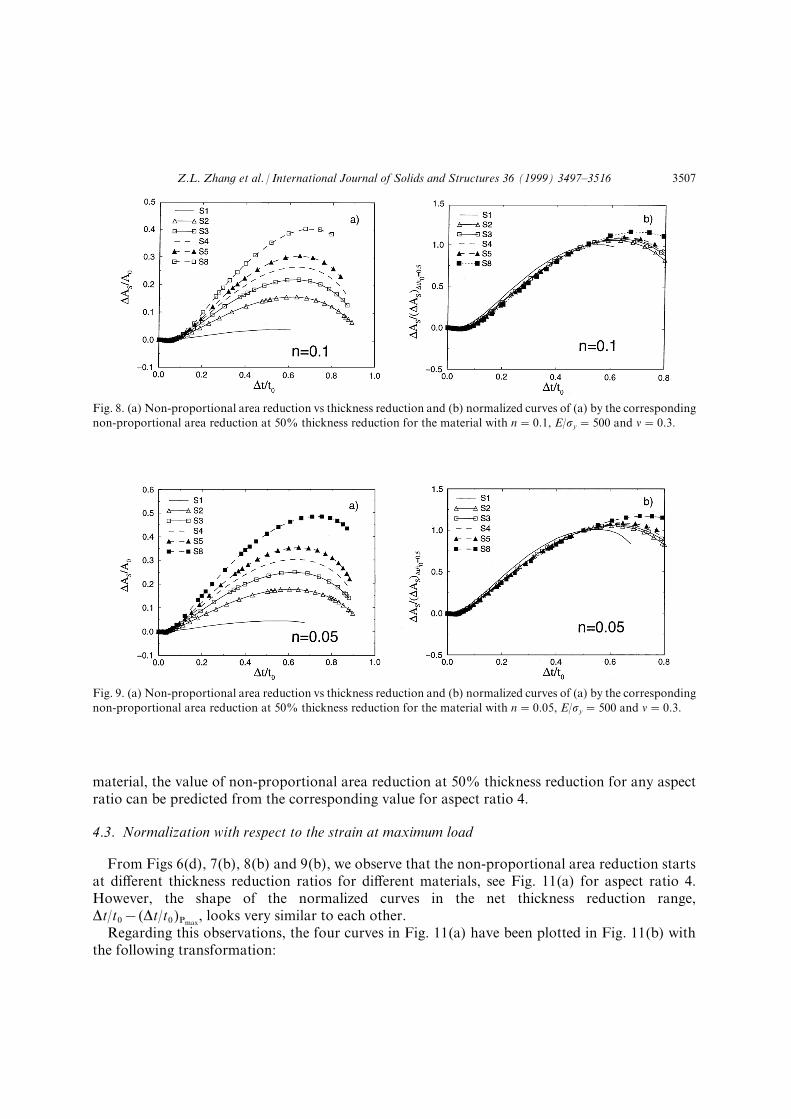
Fig[ 6[ "a# Non!proportional area reduction vs thickness reduction and "b# normalized curves of "a# by the correspondingnon!proportional area reduction at 49) thickness reduction[ The material is n � 9[0\ E:sy � 499 and n � 9[2[
3[1[ Normalization of the non!proportional area reduction with respect to section aspect ratio
By examining the shapes of the curves in Fig[ 5"c#\ we notice that they are very similar to eachother before the maximums[ It has therefore been tried to _nd whether the curves of di}erentaspect ratios can be normalized[ By taking out the non!proportional area reduction at 49)thickness reduction and normalizing the curves in Fig[ 5"c# by these values\ we obtain a new set ofcurves which are shown in Fig[ 5"d#[
Interestingly\ all the curves approximately collapse into one in the range Dt:t9 ¾ 9[4\ especiallyfor the aspect ratios greater than one[ In contrast\ the normalized curve for the specimen withsquare cross!section deviates slightly from the curves with larger aspect ratios[ The reason for thisbehaviour is not quite clear to the authors\ it maybe due to the very small non!proportional areareduction "see Fig[ 5"b#\ "c## that the present mesh for the specimen with square cross!section isnot _ne enough[
The non!proportional area reduction vs thickness reduction and the corresponding normalizedcurves for the material with n � 9[1\ 9[0 and 9[94 are shown in Figs 6Ð8\ respectively[ Similarbehaviour as Figs 5"c# and "d# is observed[ Comparing Figs 5Ð8\ it can be seen that non!pro!portional area reduction starts early for low hardening material[ Furthermore\ for a given thicknessreduction\ the corresponding non!proportional are reduction for a low hardening material is largerthan that for a strong hardening material[ This implies that soft material tends to have large shapechange[
Figure 5Ð8 show that for the materials investigated\ the non!proportional area reduction vsthickness reduction for di}erent aspect ratios can be normalized by the non!proportional areareduction at 49) of thickness reduction[
Figure 09"a# shows the non!proportional area reductions corresponding to 49) of thicknessreduction\ used for the normalization in Figs 5Ð8\ as a function of the aspect ratio for the fourmaterials analyzed[ Figure 09"b# is a new set of curves of Fig[ 09"a#\ by normalizing the curves bythe corresponding values of aspect ratio 3[ Interestingly\ the curves for the four materials collapseinto one especially for aspect ratio less than eight[ This normalization indicates that for any
Z[L[ Zhan` et al[ : International Journal of Solids and Structures 25 "0888# 2386Ð2405 2496
Fig[ 7[ "a# Non!proportional area reduction vs thickness reduction and "b# normalized curves of "a# by the correspondingnon!proportional area reduction at 49) thickness reduction for the material with n � 9[0\ E:sy � 499 and n � 9[2[
Fig[ 8[ "a# Non!proportional area reduction vs thickness reduction and "b# normalized curves of "a# by the correspondingnon!proportional area reduction at 49) thickness reduction for the material with n � 9[94\ E:sy � 499 and n � 9[2[
material\ the value of non!proportional area reduction at 49) thickness reduction for any aspectratio can be predicted from the corresponding value for aspect ratio 3[
3[2[ Normalization with respect to the strain at maximum load
From Figs 5"d#\ 6"b#\ 7"b# and 8"b#\ we observe that the non!proportional area reduction startsat di}erent thickness reduction ratios for di}erent materials\ see Fig[ 00"a# for aspect ratio 3[However\ the shape of the normalized curves in the net thickness reduction range\Dt:t9−"Dt:t9#Pmax
\ looks very similar to each other[Regarding this observations\ the four curves in Fig[ 00"a# have been plotted in Fig[ 00"b# with
the following transformation]

Z[L[ Zhan` et al[ : International Journal of Solids and Structures 25 "0888# 2386Ð24052497
Fig[ 09[ "a# The quantities used in the normalization of Fig[ 5"c#\ 6"b#\ 7"b# and 8"b# as a function of aspect ratio S forthe four materials and "b# new set of curves by dividing the curve for each material in "a# by the corresponding valuefor aspect ratio 3[
Dtt9
�Dtt9
−0Dtt9 1Pmax
¦0Dtt9 1
n�9[04
Pmax
[ "5#
The above transformation simply means that all the curves except the one for n � 9[04 aretransformed to have the same value of thickness reduction at which the non!proportional areareduction starts as the one for the material n � 9[04[ It can be seen that the four curves do notcollapse into one[ Using the same normalization procedure as used in the Figs 5"d#\ 6"d#\ 7"b# and8"b#\ the four curves collapse into one in Fig[ 00"c#[ Figure 00"d# shows the normalized non!proportional area reduction for material n � 9[04 vs net thickness reduction[ The quantities usedfor the normalization in Fig[ 00"c#\ "DAS:A9#T
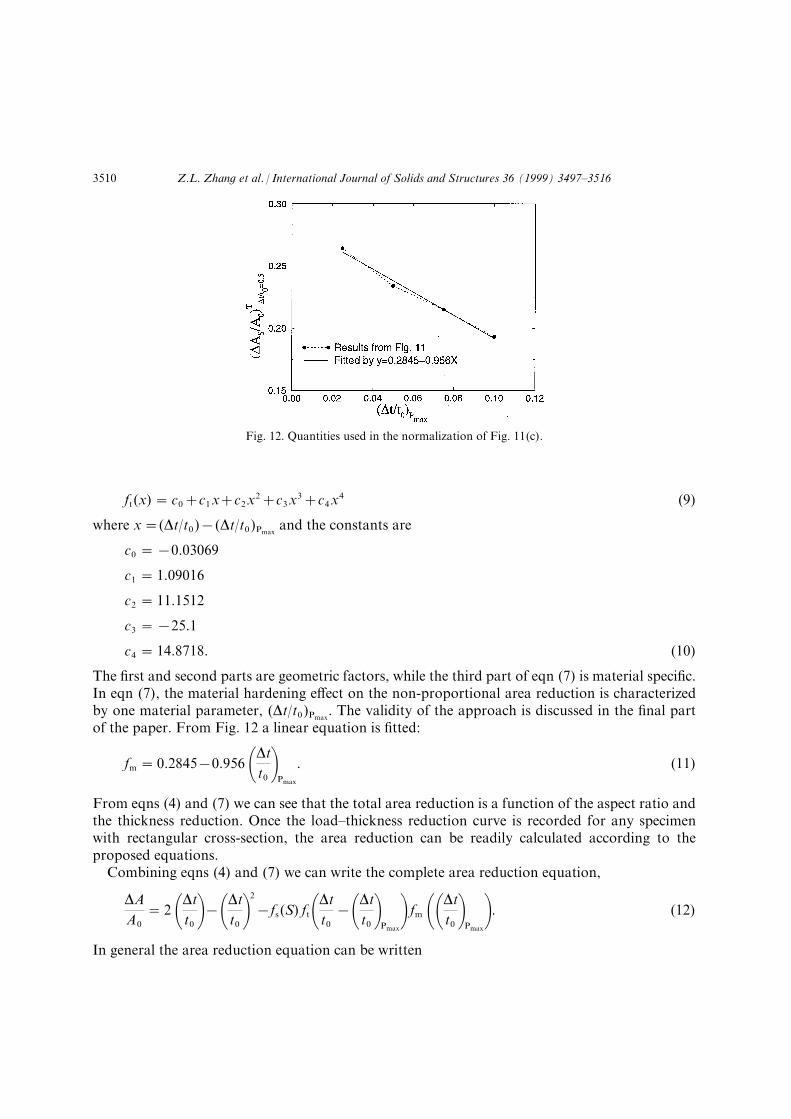
Dt:t9�9[4\ where the superscript T represents thetransformed curves\ are plotted as a function of the corresponding thickness reduction at themaximum load in Fig[ 01[ An approximate linear relation is shown[
3[3[ Proposed area reduction equation
Figures 00 and 01 show that di}erent material di}ers in "Dt:t9#Pmax[ However\ when the non!
proportional area reduction vs thickness reduction curves are transformed to the same thicknessreduction at which necking starts\ the curves can be normalized by the quantities which are a linearfunction of the "Dt:t9#Pmax
*the material parameter[ The normalized curve is only a function of thenet thickness reduction\ Dt:t9−"Dt:t9#Pmax
\ see Fig[ 00"d#[Figure 00 indicates that the non!proportional area reduction curves for di}erent materials but
same cross!section can be normalized by the net thickness reduction after the maximum load[From the above observation and be recalling Fig[ 09"b# that for the same material the non!proportional area reduction vs thickness reduction for an aspect ratio can be derived from another\we can derive the following equation for calculating the non!proportional area reduction]

Z[L[ Zhan` et al[ : International Journal of Solids and Structures 25 "0888# 2386Ð2405 2498
Fig[ 00[ "a# Non!proportional area reduction vs thickness reduction for the four materials with aspect ratio 3^ "b#transformed according to eqn "5# to the same thickness reduction at which the non!proportional area reductions startsas that of material with n � 9[04^ "c# normalized curves of Fig[ 00"b# by the values at 49) reduction thickness^ "d#normalized non!proportional area reduction for n � 9[04 vs net thickness reduction[
0DAA9 1S
� fs "S# ft 0Dtt9
−0Dtt9 1Pmax
1 fm 00Dtt9 1Pmax
1[ "6#
The above equation includes three parts] the _rst part is dependent on the aspect ratio[ In thisstudy\ the aspect ratio 3 has been chosen as the reference aspect ratio\ therefore\ fs"3# � 0[ For anyother aspect ratio\ the following equation has been _tted from Fig[ 09"b#\
fs "S# � 9[0575¦9[5 ln"S#[ "7#
The second part is a distribution of the non!proportional area reduction vs the net thicknessreduction "the total thickness reduction minus the reduction at the maximum load# which is _ttedfrom Fig[ 00"d#\
Z[L[ Zhan` et al[ : International Journal of Solids and Structures 25 "0888# 2386Ð24052409
Fig[ 01[ Quantities used in the normalization of Fig[ 00"c#[
ft "x# � c9¦c0x¦c1x1¦c2x
2¦c3x3 "8#
where x �"Dt:t9#−"Dt:t9#Pmaxand the constants are
c9 � −9[92958
c0 � 0[98905
c1 � 00[0401
c2 � −14[0
c3 � 03[7607[ "09#
The _rst and second parts are geometric factors\ while the third part of eqn "6# is material speci_c[In eqn "6#\ the material hardening e}ect on the non!proportional area reduction is characterizedby one material parameter\ "Dt:t9#Pmax
[ The validity of the approach is discussed in the _nal partof the paper[ From Fig[ 01 a linear equation is _tted]
fm � 9[1734−9[845 0Dtt9 1Pmax
[ "00#
From eqns "3# and "6# we can see that the total area reduction is a function of the aspect ratio andthe thickness reduction[ Once the loadÐthickness reduction curve is recorded for any specimenwith rectangular cross!section\ the area reduction can be readily calculated according to theproposed equations[
Combining eqns "3# and "6# we can write the complete area reduction equation\
DAA9
� 1 0Dtt9 1−0
Dtt9 1
1
−fs "S# ft0Dtt9
−0Dtt9 1Pmax
1 fm 00Dtt9 1Pmax
1[ "01#
In general the area reduction equation can be written
Z[L[ Zhan` et al[ : International Journal of Solids and Structures 25 "0888# 2386Ð2405 2400
DAA9
� f 0Dtt9
\ S\ 0Dtt9 1Pmax
1[ "02#
4[ Veri_cation of the area reduction formula
4[0[ {Exact| true stressÐstrain curves
Before verifying the area reduction equation "01# the {exact| true average stressÐlogarithmicstrain curves calculated directly from the _nite element analyses with di}erent aspect ratios arecompared[ Figure 02"a# shows the results for the material n � 9[1[ The results from the analysisof round tensile specimen using the mesh shown in Fig[ 02"b# are also presented[ Specimens withdi}erent aspect ratios give exactly the same true average stressÐlogarithmic strain curves as theround specimen[ This behaviour is the same for all the other materials[ The results in Fig[ 02"a#means that materials true stressÐstrain curve can be actually determined from either the roundspecimen or rectangular tensile specimen\ as long as the area reduction can be measured[
4[1[ Comparison of the {exact| and approximate true stressÐstrain curves
The proposed area reduction equation eqn "01# has been veri_ed by comparing with the {exact|area reduction directly calculated from the _nite element analyses[ The input for calculating thearea reduction using eqn "01# is the loadÐthickness reduction curve obtained from the _nite elementanalyses[ Figure 03"a# shows the results for the material with n � 9[1[ The calculation by usingeqn "01# stops when the thickness reduction is greater than 49)[ The logarithmic strain calculatedas\ o � ln"A9:A#\ is limited to 099) in the presentation of Figs 03 and 04\ which should be su.cientfor most of the cases[ We observe that the true average stressÐlogarithmic strain curves for all theaspect ratios calculated by using eqn "01# _ts exactly with the {exact| curve obtained directly fromthe _nite element analyses\ for the aspect ratio 3[ The comparison for the material n � 9[94 isshown in Fig[ 03"b#[ The results by using eqn "01# agree well with the _nite element results exceptslightly worse agreement for the case with aspect ratio 7[ This is due to the fact that local neckingtends to appear quite early even in the boundary conditions de_ned by eqn "0# for this lowhardening material with aspect ratio 7[
The proposed area reduction equation has been veri_ed against the material with n � 9[04\E:sy � 064 and n � 9[2\ and also the materials which cannot be described by a single powerhardening law in Fig[ 04"a# for the steel and Fig[ 04"b# for the aluminium[ Very satisfactoryagreement is seen in the comparison[
5[ Necking correction for the true stress
As it is obvious that the stress distribution across the cross!section is not uniform and triaxialstress starts to develop once the necking appeared\ the calculated true stress is in an average senseand should be corrected due to the non!uniform distribution in the neck[ The real stress distributionacross the cross!section is very complicated[ Arnofsky "0840# attempted to calculate the neck stress

Z[L[ Zhan` et al[ : International Journal of Solids and Structures 25 "0888# 2386Ð24052401
Fig[ 02[ "a# {Exact| true stressÐlogarithmic strain curves of a round specimen and specimens with di}erent aspect ratios\"b# mesh used for the round specimen "0:3#[
from the measured strain and the true stress strain relation determined from the round specimenmade of the same material[ However\ Fig[ 02 shows that as long as the true area reduction can becalculated\ the specimens with various aspect ratios give exactly the same true average stressÐ

Z[L[ Zhan` et al[ : International Journal of Solids and Structures 25 "0888# 2386Ð2405 2402
Fig[ 03[ "a# Comparison of the true stressÐstrain curve calculated from the proposed area reduction equation and directlyfrom the _nite element analyses for the material with n � 9[1 and "b# for the material with n � 9[94[
Fig[ 04[ "a# Comparison of the true stressÐstrain curve calculated from the proposed area reduction equation and directlyfrom the _nite element analyses for the steel D and "b# for the aluminium M2[ Both materials cannot be described byone single hardening parameter[
logarithmic strain curves[ That means that the same procedure used for the round tensile specimencan be {equivalently| used for the correction of the true stress obtained from rectangular tensilespecimen\ without going to details of the stress distribution[ For the round tensile specimen\ thefollowing correction equation by Bridgman "0841# is well known]
sb
s� 0>000¦
1Ra 1 ln 00¦
s
1R11 "03#
where a is the current radius of the neck and R is the radius of curvature of the neck surface in thelongitudinal plane at the minimum section[ The correction starts once the maximum load haspassed[
The di.cult part in the application of the Bridgman correction is the determination of the neck

Z[L[ Zhan` et al[ : International Journal of Solids and Structures 25 "0888# 2386Ð24052403
Fig[ 05[ BridgmanÐLe Roy correction for "a# material with n � 9[1\ "b# with n � 9[94\ "c# steel D and "d# aluminiumM2[
geometry parameter\ the value of a:R[ Le Roy et al[ "0870# have presented an empirical expressionfor the neck geometry parameter]
aR
� 0[0"o−oPmax#[ "04#
The above equation has been examined for all the materials considered in the paper[ The resultsfor the material with n � 9[1\ n � 9[94 and the two real materials are shown in Fig[ 05[ Reasonablygood results are observed[
6[ Proposed procedure and discussions
The main _ndings from numerical calculations carried out in the paper can be summarized asfollows]
Z[L[ Zhan` et al[ : International Journal of Solids and Structures 25 "0888# 2386Ð2405 2404
Fig[ 06[ Location for measuring the thickness reduction[
For same material\ the non!proportional area reduction vs thickness reduction for di}erentaspect ratios can be normalized by the value at 49) thickness reduction[ Furthermore\ for anymaterial\ the quantities used for the normalization can be described by an unique equation ofaspect ratio[ For di}erent materials with same aspect ratio\ the area reduction due to shape changevs net thickness reduction curves can be normalized by quantities which are a linear function ofthe thickness reduction at the maximum load[
By summarizing the results\ the following procedure for determining the true stressÐstrain curvefrom rectangular specimens is proposed]
Prepare tensile specimens with rectangular cross!section[ The maximum aspect ratio of the cross!section is limited to eight[ When aspect ratio larger than eight is used\ there is no guarantee forvalid large range true stressÐstrain curve by using the proposed equation eqn "01#[ The rec!ommended aspect ratio for the rectangular cross!section is four[
An initial imperfection up to 9[3) in both sides of the width direction located in the centralpart of the specimen may be used to trigger di}used necking in the centre where the thicknessreduction measuring device is positioned[
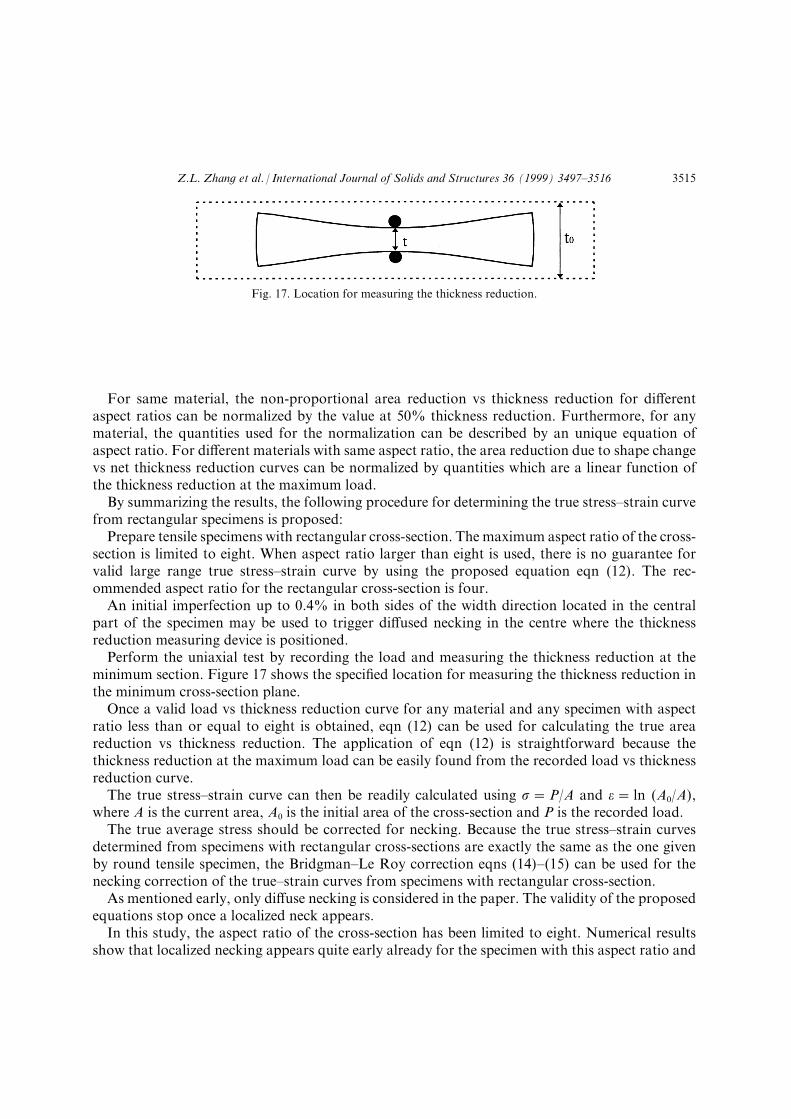
Perform the uniaxial test by recording the load and measuring the thickness reduction at theminimum section[ Figure 06 shows the speci_ed location for measuring the thickness reduction inthe minimum cross!section plane[
Once a valid load vs thickness reduction curve for any material and any specimen with aspectratio less than or equal to eight is obtained\ eqn "01# can be used for calculating the true areareduction vs thickness reduction[ The application of eqn "01# is straightforward because thethickness reduction at the maximum load can be easily found from the recorded load vs thicknessreduction curve[
The true stressÐstrain curve can then be readily calculated using s � P:A and o � ln "A9:A#\where A is the current area\ A9 is the initial area of the cross!section and P is the recorded load[
The true average stress should be corrected for necking[ Because the true stressÐstrain curvesdetermined from specimens with rectangular cross!sections are exactly the same as the one givenby round tensile specimen\ the BridgmanÐLe Roy correction eqns "03#Ð"04# can be used for thenecking correction of the trueÐstrain curves from specimens with rectangular cross!section[
As mentioned early\ only di}use necking is considered in the paper[ The validity of the proposedequations stop once a localized neck appears[
In this study\ the aspect ratio of the cross!section has been limited to eight[ Numerical resultsshow that localized necking appears quite early already for the specimen with this aspect ratio and

Z[L[ Zhan` et al[ : International Journal of Solids and Structures 25 "0888# 2386Ð24052405
low hardening ability n � 9[94\ therefore\ it is recommended to use specimens with small aspectratio to determine the true stressÐlogarithmic strain curve[
The application of eqn "01# is limited to maximum 49) of the thickness reduction[ Thecorresponding true strain is dependent on the aspect ratio[ For small aspect ratio\ more than 099)true strain can be obtained[ Nevertheless\ the range of true strain has been limited to 099) in allthe analysis[ This range should be considered su.cient for many practical applications[
Finally\ it should be pointed out that only isotropic materials with Poisson ratio 9[2 have beenconsidered in this study[ Thus\ the validity of the proposed equations is strictly limited to theabove materials[ An experiment procedure to verify the proposed method is going on[ How tomodify the present method for anisotropic materials has been investigated and will be publishedelsewhere "Zhang et al[ "0887#[
Acknowledgements
HRARC "Hydro!Raufoss Automotive Research Centre# is greatly appreciated for their _nancialsupport and the permission to publish this work[ The work has also received support from theResearch Council of Norway[
References
Aronofsky\ J[\ 0840[ Evaluation of stress distribution in the symmetrical neck of ~at tensile bars[ Journal of AppliedMechanics 07\ 64Ð73[
Bayoumi\ A[E[\ Joshi\ R[\ 0881[ On the formability:instability of stretch!forming sheet metals[ Applied MechanicsReview 34\ S043ÐS053[
Bridgman\ P[W[\ 0841[ Studies in Large Plastic Flow and Fracture[ McGraw!Hill\ New York[Considere\ A[\ 0774[ Annales des Ponts er Chaussees IX8\ 5 eme serie p[ 463[Dieter\ D[\ 0875[ Mechanical Metallurgy[ McGraw!Hill\ Singapore[Le Roy\ G[\ Embury\ J[D[\ Edwards\ G[\ Ashby\ M[F[\ 0870[ A model of ductile fracture based on the nucleation and
growth of voids[ Acta Metall[ 18\ 0498Ð0411[Ošdega�rd\ J[\ 0886[ Unpublished test report on the rectangular specimens of aluminium[Ošdega�rd\ J[\ Zhang\ Z[L[\ 0886[ Quanti_cation of damage parameters[ SINTEF Report STF13 F86126[Tvergaard\ V[\ 0882[ Necking in tensile bars with rectangular cross!section[ Computer Methods in Applied Mechanics
and Engineering 092\ 162Ð189[Zhang\ Z[L[\ Hauge\ M[\ 0884[ RambergÐOsgood parameter _tting for ACCRIS steels[ SINTEF Memo[Zhang\ Z[L[\ Ošdega�rd\ J[\ S�vik\ O[P[\ 0887[ Determining the true stressÐstrain curve for anisotropic materials with
rectangular tensile specimen\ in preparation[