defining dangerous climate change: does the ipcc … · 2012-10-05 · what is dangerous climate...
TRANSCRIPT

IPCC
Defining Dangerous Climate
Change: Does the IPCC Fourth
Assessment provide guidance on
what is dangerous climate change?Bill Hare
IPCC AR4 Lead Author
Potsdam Institute for Climate Impacts Research
ANU Centre for Climate Law and Policy
Wednesday 12 March 2008

IPCC
Article 2 of the UNFCCC• “The ultimate objective of this Convention and any
related legal instruments ….is to achieve…stabilization of greenhouse gas concentrations in the atmosphere at a level that would prevent dangerous anthropogenic interference with the climate system. Such a level should be achieved within a time-frame sufficient to allow ecosystems to adapt naturally to climate change, to ensure that food production is not threatened and to enable economic development to proceed in a sustainable manner.”
IPCC
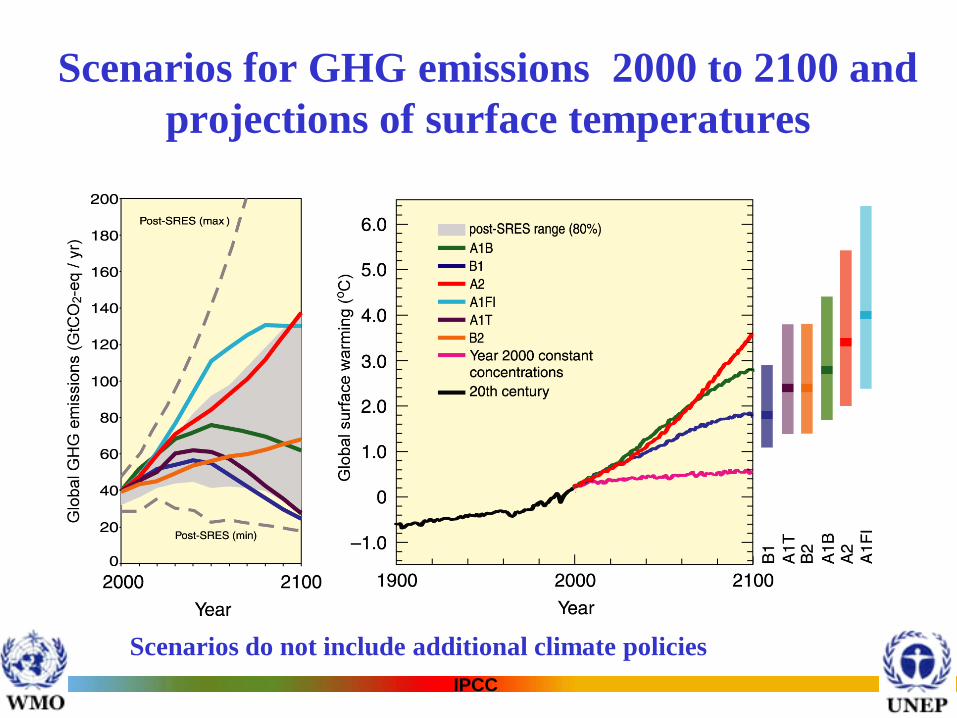
Scenarios for GHG emissions 2000 to 2100 and
projections of surface temperatures
Scenarios do not include additional climate policies

IPCC
Risk aspects
• Carbon cycle feedbacks: Warming reduces
terrestrial and ocean uptake of atmospheric CO2,
increasing the fraction of anthropogenic emissions
remaining in the atmosphere.
• Sea level rise: Projections do not include:
– Uncertainties in climate-carbon cycle feedbacks
– Full effects of changes in ice sheet flow
– Upper values of the ranges are not to be considered
upper bounds for sea level rise.

IPCC
Higher confidence
in projected regional changes• Warming greatest over land and high north
• Precipitation increases in high latitudes
• Precipitation decreases in most subtropical land regions
• Increase in frequency of hot extremes, heat waves, and heavy precipitation
• Increase in tropical cyclone intensity;
• Contraction of snow cover, permafrost thaw
• Decreases in sea ice extent

IPCC
Projected surface temperature
(2090-2099)
Average projection for the A1B SRES scenario relative to
the period 1980-1999. SYR Figure SPM. 6

IPCC
Regional changes
• High confidence that by mid-century, annual river
runoff and water availability increase at high
latitudes (and in some tropical wet areas) and
decrease in some dry regions in the mid-latitudes
and tropics.
• High confidence that many semi-arid areas (e.g.
Mediterranean basin, western United States,
southern Africa and northeast Brazil) will suffer a
decrease in water resources due to climate change

IPCC
High latitude
increases
Decreases over
some dry regions
Percentage changes
uncertain in desert
regions
Changes less
reliable in lower
latitudes e.g,
monsoon regions
White areas - less than 66% of 12 considered models agree on sign of change.
Stippled areas - more than 90% models agree on sign of change.
Relative changes in annual runoff
% 2090-2099, relative to 1980-1999

IPCC
Especially affected systems and sectors
• Ecosystems:
– Tundra, boreal forest and mountain regions
– Mediterranean-type ecosystems
– Tropical rainforests where precipitation declines
– Coral reefs, Mangroves and salt marshes
– Sea ice biome
• Water resources - some dry regions at mid-latitudes, dry tropics, areas dependent on snow and ice melt
• Agriculture in low-latitudes
• Low-lying coastal systems
• Human health - populations with low adaptive capacity.

IPCC
• Arctic– Impacts of high rates of projected warming on natural
systems and human communities
• Africa– Low adaptive capacity and projected climate change impacts
• Small islands– High exposure to projected climate change impacts
• Asian and African megadeltas– Large populations and high exposure to sea level rise, storm
surges and river flooding.
• Some people (such as the poor, young children, and the elderly) can be particularly at risk even in high income countries
Especially affected regions

IPCC
Figure SPM.2. Key impacts as a function of increasing global average temperature change
(Impacts will vary by extent of adaptation, rate of temperature change, and socio-economic pathway)
IPCC
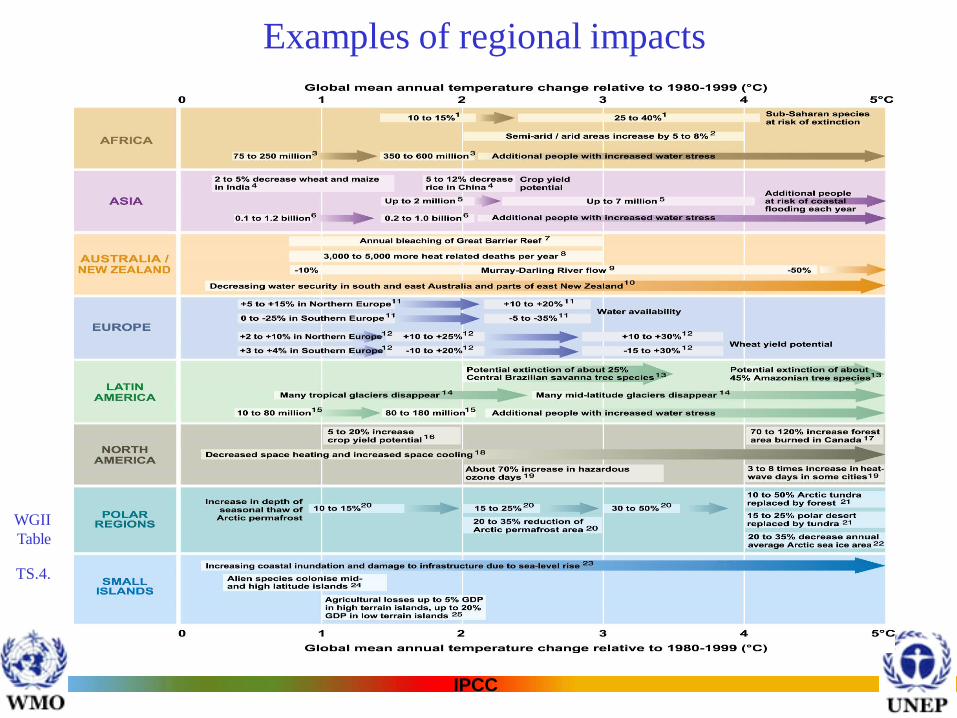
Examples of regional impacts
WGII
Table
TS.4.

IPCC
Climate change and risks to
sustainable development
• Very likely that climate change can slow the
pace of progress towards sustainable
development.
• Climate change could impede achievement
of the Millennium Development Goals over
next half century

IPCC
“Reasons for concern” identified in
Third Assessment Report
• Risks to unique and threatened systems
• Risks of extreme weather events
• Distribution of impacts and
vulnerabilities
• Aggregate impacts
• Risks of large-scale singularities

IPCC
“Reasons for concern” are now
assessed to be stronger• Many risks identified with higher confidence
• Some projected to be larger or to occur at lower
increases in temperature.
– (1) Better understanding of the magnitude of impacts and
risks associated with increases temperature
– (2) More precise identification of the circumstances that
make systems and regions especially vulnerable
– (3) Growing evidence that the risk of very large impacts on
multiple century time scales would continue to increase as
long as GHG concentrations and temperature continue to
increase.
IPCC
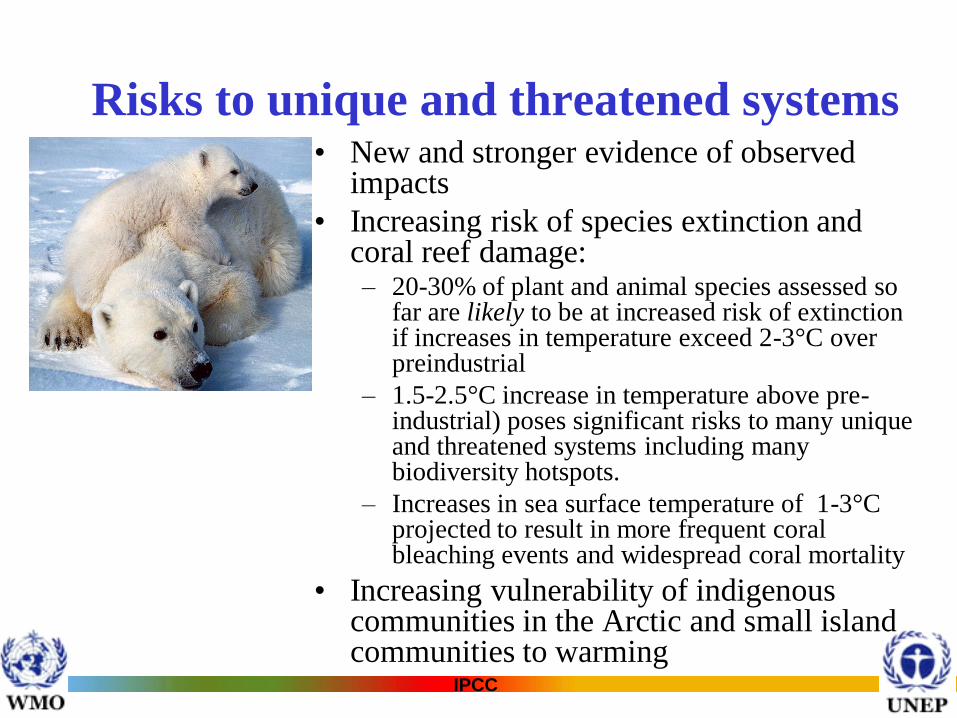
Risks to unique and threatened systems• New and stronger evidence of observed
impacts
• Increasing risk of species extinction and coral reef damage:– 20-30% of plant and animal species assessed so
far are likely to be at increased risk of extinction if increases in temperature exceed 2-3°C over preindustrial
– 1.5-2.5°C increase in temperature above pre-industrial) poses significant risks to many unique and threatened systems including many biodiversity hotspots.
– Increases in sea surface temperature of 1-3°C projected to result in more frequent coral bleaching events and widespread coral mortality
• Increasing vulnerability of indigenous communities in the Arctic and small island communities to warming

IPCC
Figure TS.6. Projected risks due to critical climate change impacts on
ecosystems

IPCC
Figure TS.14. Key hotspots for Latin America

IPCC
Risks of extreme weather events
• Responses to some recent extreme climate events reveal higher levels of vulnerability in both developing and developed countries
• Higher confidence in the projected increases in droughts, heat-waves, and floods as well as their adverse impacts.
• Mostly adverse impacts:– Increased water stress and wild fire
frequency
– Adverse effects on food production and health
– Increased flood risk and extreme high sea level, and damage to infrastructure.

IPCC
Impacts of extreme eventsExamples of major projected impacts by sector
Phenomenon
Likelihood Agriculture, forestry and ecosystems {WGII
4.4, 5.4}
Water resources {WGII 3.4}
Human health {WGII 8.2, 8.4}
Industry, settlement and society {WGII 7.4}
Increased frequency of heavy precipitation events.
Very likely
Damage to crops; soil erosion, inability to cultivate land due to waterlogging of soils
Adverse effects on quality of surface and groundwater; contamination of water supply; water scarcity may be relieved
Increased risk of deaths, injuries and infectious, respiratory and skin diseases
Disruption of settlements, commerce, transport and societies due to flooding: pressures on urban and rural infrastructures; loss of property
Increased area affected by drought
Likely
Land degradation; lower yields/crop damage and failure; increased livestock deaths; increased risk of wildfire
More widespread water stress
Increased risk of food and water shortage; increased risk of malnutrition; increased risk of water-and food- borne diseases
Water shortage for settlements, industry and societies; reduced hydropower generation potentials; potential for population migration

IPCC
Distribution of impacts and
vulnerabilities• There are sharp differences across
regions and those in the weakest economic position are often the most vulnerable to climate change.
• Increasing evidence of greater vulnerability of specific groups such as the poor and elderly
• Increased evidence that low-latitude and less-developed areas generally face greater risk, for example in dry areas and mega-deltas

IPCC
Figure TS.8. Relative vulnerability of coastal deltas

IPCC
Figure TS.7. Sensitivity of cereal yield to climate change

IPCC
Water resource risks
• Decreases in precipitation are a major driver
of many risks in many dry areas and a
reduction, by as much as about 20%, is
likely in many of them for a global average
warming of about 2.8°C above 1980-1999
levels, with a decrease in water resources
projected.
IPCC
Aggregate impacts
• Market based estimates:
– Likely that there will be higher damages than estimated in the TAR
– Net costs of impacts of increased warming are projected to increase over time.
• Other metrics
– Likely adverse effects on hundreds of millions of people through increased coastal flooding, reductions in water supplies, increased malnutrition and increased health impacts.

IPCC
Figure TS.18. Estimated millions of people per annum at risk globally
from coastal flooding

IPCC
Risks of large-scale singularities
• Risk that additional sea level
rise from both the Greenland
and Antarctic ice sheets may be
larger than projected and could
occur on century time scales.
• Ice dynamical processes seen in
recent observations but not fully
included in ice sheet models
could increase the rate of ice
loss.
IPCC
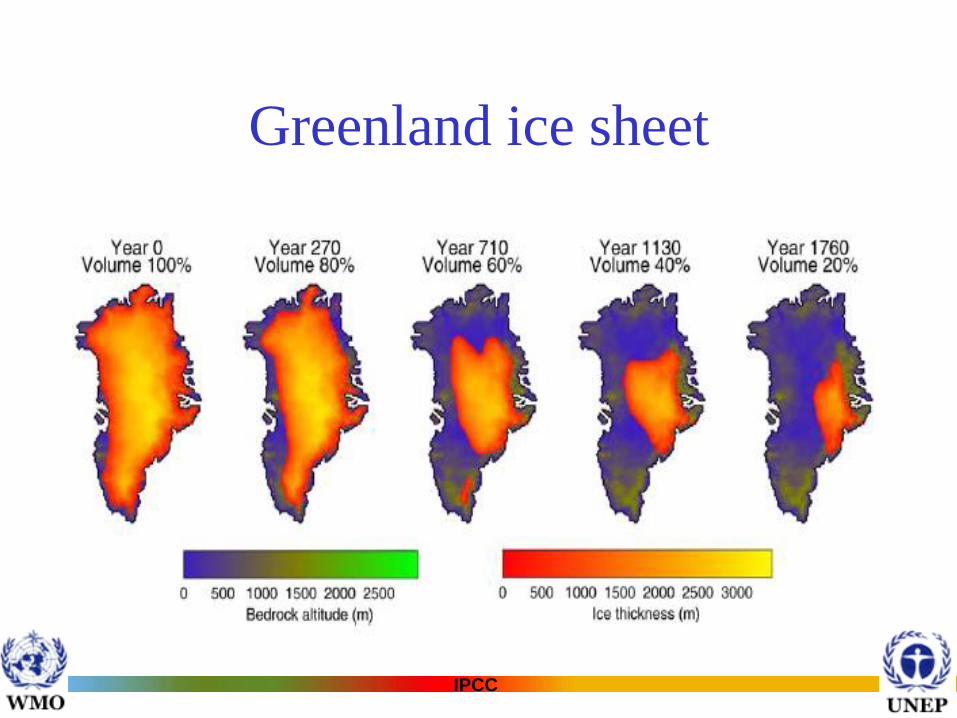
Greenland ice sheet
IPCC
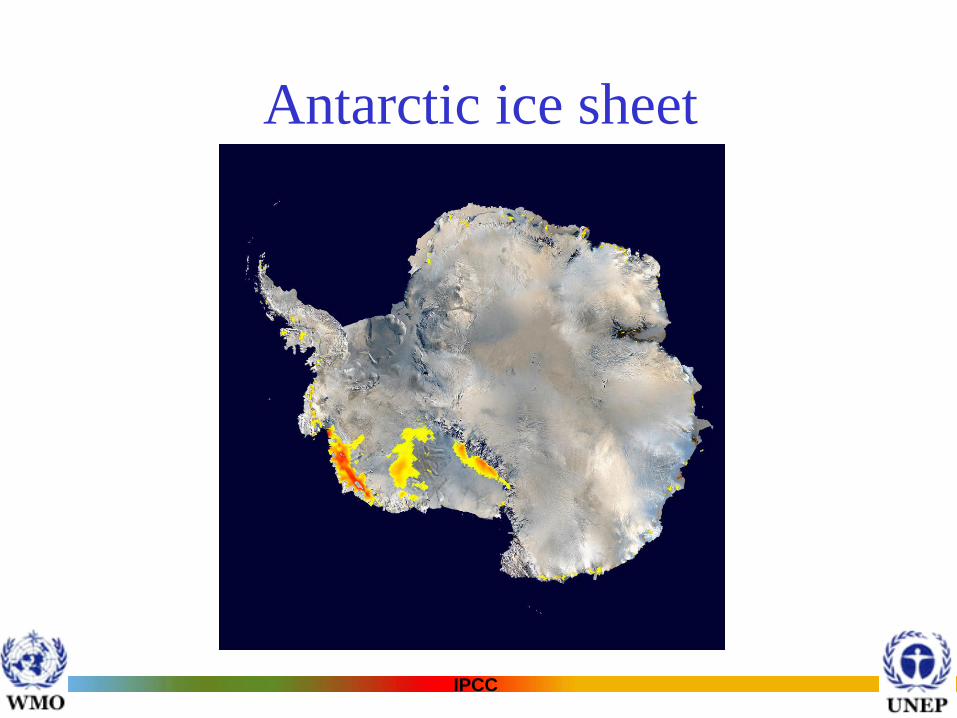
Antarctic ice sheet

IPCC
Greenland loss increasing

IPCC
IPCC AR4 Finds Greater Risks

IPCC
Risk aspects
• Carbon cycle feedbacks: Warming reduces
terrestrial and ocean uptake of atmospheric CO2,
increasing the fraction of anthropogenic emissions
remaining in the atmosphere.
• Sea level rise: Projections do not include:
– Uncertainties in climate-carbon cycle feedbacks
– Full effects of changes in ice sheet flow
– Upper values of the ranges are not to be considered
upper bounds for sea level rise.
IPCC
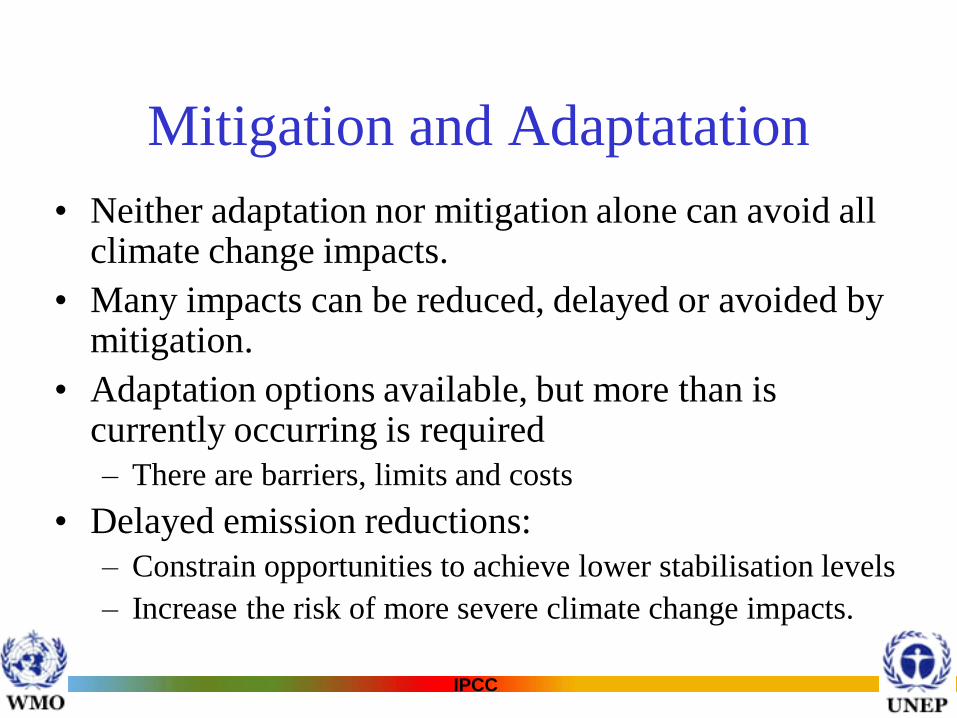
Mitigation and Adaptatation
• Neither adaptation nor mitigation alone can avoid all climate change impacts.
• Many impacts can be reduced, delayed or avoided by mitigation.
• Adaptation options available, but more than is currently occurring is required
– There are barriers, limits and costs
• Delayed emission reductions:
– Constrain opportunities to achieve lower stabilisation levels
– Increase the risk of more severe climate change impacts.

IPCC
Reducing impacts, risks and vulnerabilities
4°C3°C2°C1.5°CAbove preindustrial

IPCC
Reducing impacts, risks and vulnerabilities
WGII
Table
TS.4.
4°C3°C2°C1.5°CAbove preindustrial

IPCC
Risk management perspective
• Responding to climate change involves an iterative risk management process
• Includes both adaptation and mitigation and takes into account climate change damages, co-benefits, sustainability, equity, and attitudes to risk.
• Limiting global average warming could reduce likelihood impacts and risks

IPCC
Stabilization levels Stabilization
levels
Cat.Concentration
Global mean
temperature
increase Peaking year
CO2 emission
change
ppm CO2-eq ºC Year Percent
A1 445 – 490 2.0 – 2.4 2000 - 2015 -85 to -50
A2 490 – 535 2.4 – 2.8 2000 - 2020 -60 to -30
B 535 – 590 2.8 – 3.2 2010 - 2030 -30 to +5
C 590 – 710 3.2 – 4.0 2020 - 2060 +10 to +60
D 710 – 855 4.0 – 4.9 2050 - 2080 +25 to +85
E 855 – 1130 4.9 – 6.1 2060 - 2090 +90 to +140
WGIII AR4 Summary for Policy Makers

IPCC
Costs

IPCC
Costs

IPCC
IPCC
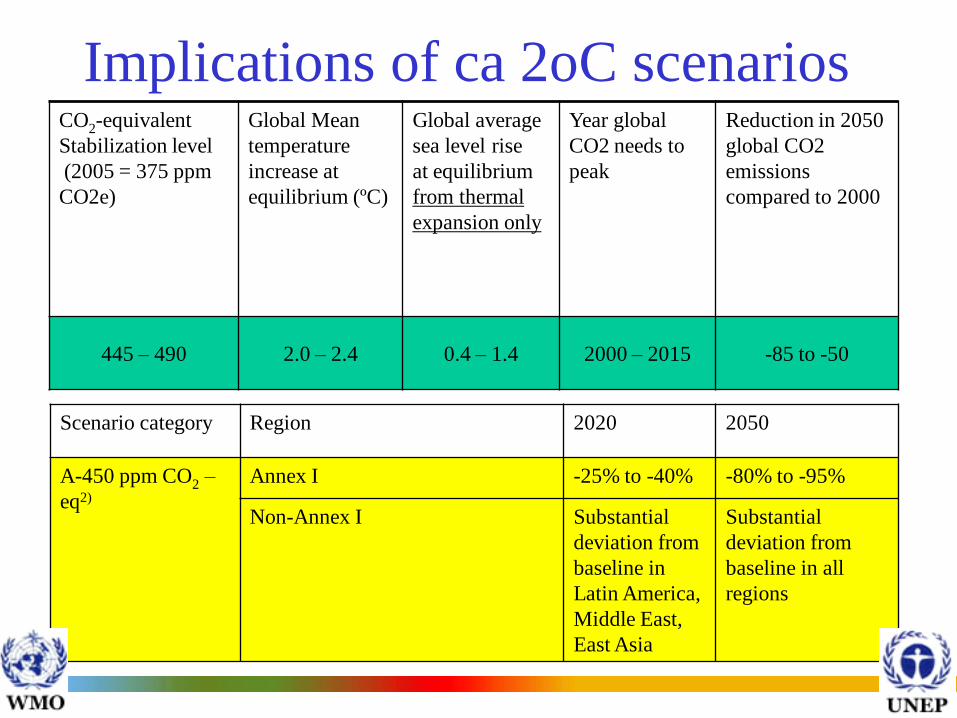
Implications of ca 2oC scenariosCO2-equivalent
Stabilization level
(2005 = 375 ppm
CO2e)
Global Mean
temperature
increase at
equilibrium (ºC)
Global average
sea level rise
at equilibrium
from thermal
expansion only
Year global
CO2 needs to
peak
Reduction in 2050
global CO2
emissions
compared to 2000
445 – 490 2.0 – 2.4 0.4 – 1.4 2000 – 2015 -85 to -50
Scenario category Region 2020 2050
A-450 ppm CO2 –
eq2)
Annex I -25% to -40% -80% to -95%
Non-Annex I Substantial
deviation from
baseline in
Latin America,
Middle East,
East Asia
Substantial
deviation from
baseline in all
regions
IPCC
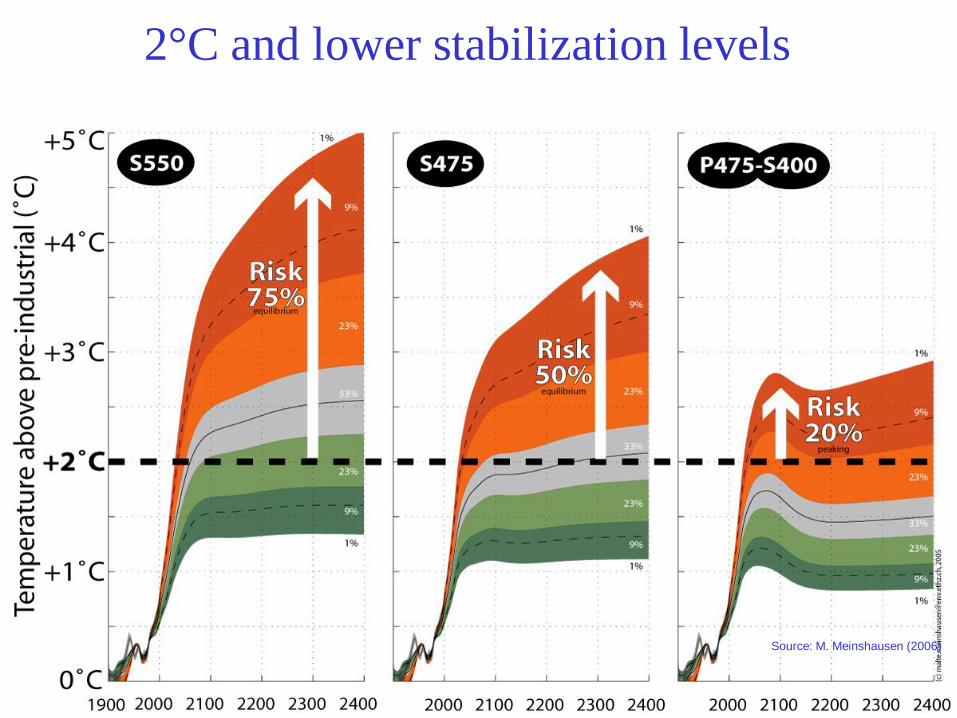
2°C and lower stabilization levels
Source: M. Meinshausen (2006)

IPCC
IPCC

IPCC

IPCC
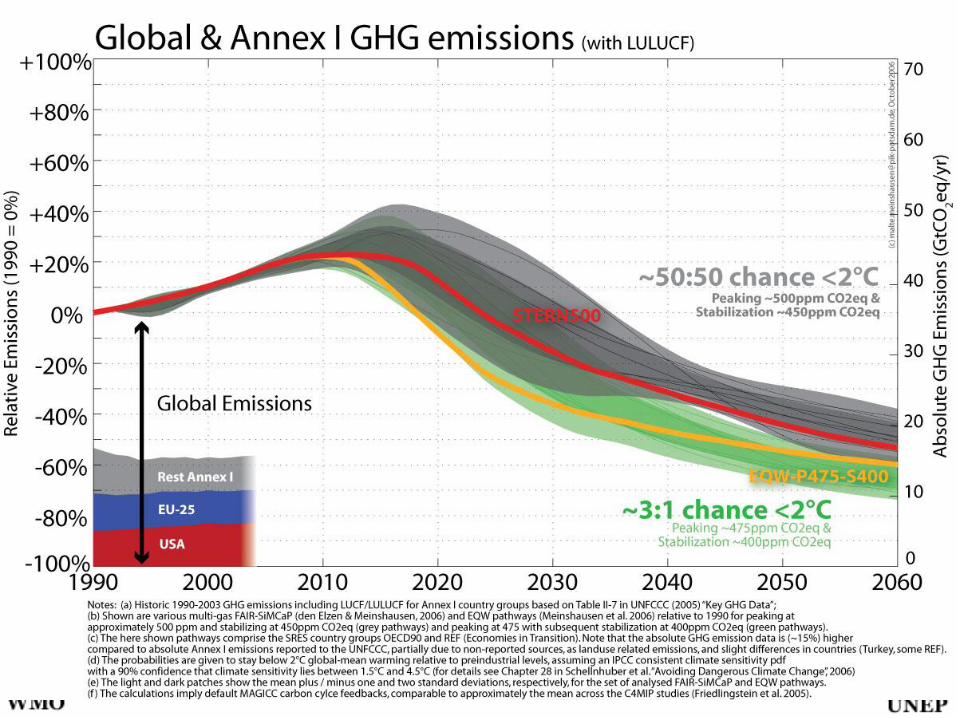
Annex I: roughly -60% to -80% by 2050 for ~50:50 chance.

IPCC
The Effect of Delay • Higher emissions in near future lower emissions at 2030 and beyond

IPCC
Source for IMA-B1 P480-S400: den Elzen & Meinshausen
The Effect of Delay • Higher Emissions in the near-term Higher reduction rates in medium-
term

IPCC
Conclusions – The Effect of Delay

IPCC
Role of science
• Determining what constitutes “dangerous anthropogenic interference with the climate system” in relation to Article 2 of the UNFCCC involves value judgements.
• Science can support informed decisions
• Demonstrates that limiting global average warming can reduce likelihood and magnitude of impacts and risks

IPCC
Synthesis Report can be downloaded from
http://www.ipcc.ch/

IPCC
RISK = Probability X Consequence

IPCC
RISK = Probability X Consequence
Likelihood or
confidence an
event will occur
Impact of
climate change

IPCC
Table TS.3. (upper) Global temperature changes for selected time periods,
projected for SRES and stabilisation scenarios
IPCC
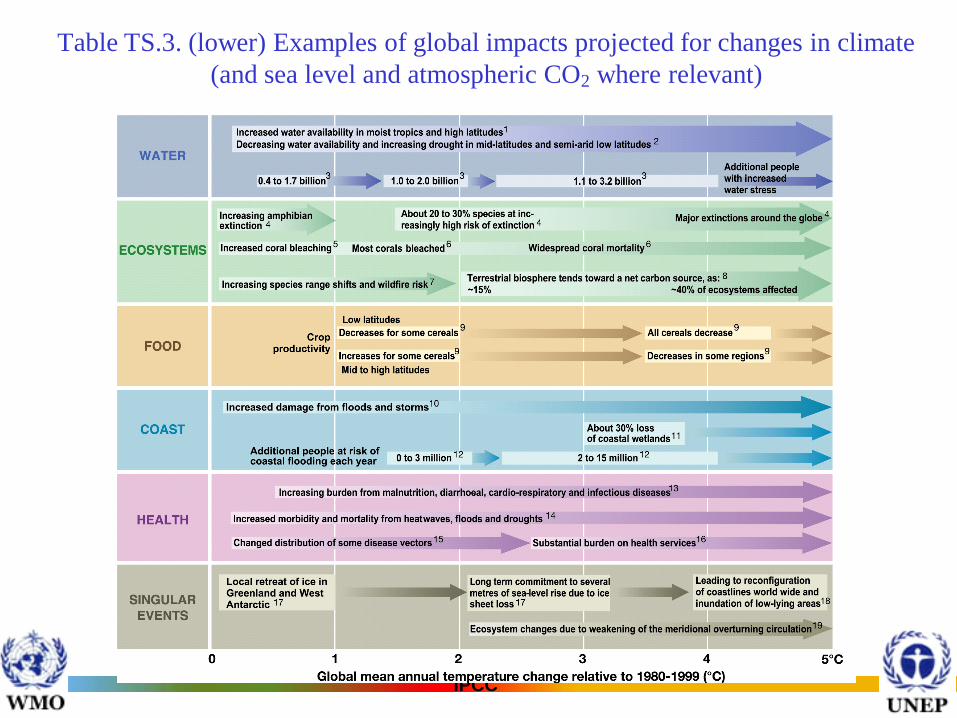
Table TS.3. (lower) Examples of global impacts projected for changes in climate
(and sea level and atmospheric CO2 where relevant)

IPCC
Figure TS.9. Direction and magnitude of change of selected health
impacts of climate change
IPCC
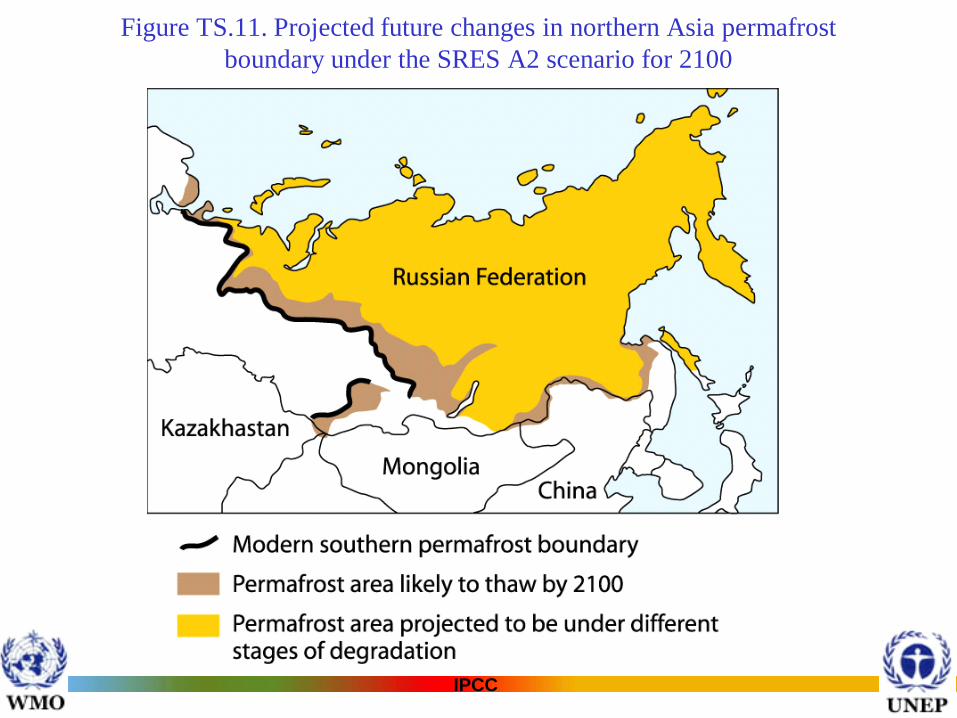
Figure TS.11. Projected future changes in northern Asia permafrost
boundary under the SRES A2 scenario for 2100

IPCC
Figure TS.16. Vegetation of the Arctic: current conditions and projected changes
under the IS92a scenario for 2090-2100

IPCC
Figure TS.12. Key hotspots in Australia and New Zealand

IPCC
Impacts of extreme eventsExamples of major projected impacts by sector
Phenomenon
Likelihood Agriculture, forestry
and ecosystems Water resources Human health
Industry, settlement and society
Warmer and fewer cold days and nights, warmer and more frequent hot days and nights
Virtually certainb
Increased yields in colder environments; decreased yields in warmer environments; increased insect outbreaks
Effects on water resources relying on snowmelt; effects on some water supplies
Reduced human mortality from decreased cold exposure
Reduced energy demand for heating; increased demand for cooling; declining air quality in cities; reduced disruption to transport due to snow, ice; effects on winter tourism
Warm spells/heat waves. Frequency increased over most land areas
Very likely
Reduced yields in warmer regions due to heat stress; increased danger of wildfire
Increased water demand; water quality problems, e.g. algal blooms
Increased risk of heat-related mortality, especially for the elderly, chronically sick, very young and socially isolated
Reduction in quality of life for people in warm areas without appropriate housing; impacts on the elderly, very young and poor

IPCC
Impacts of extreme eventsExamples of major projected impacts by sector
Phenomenon
Likelihood Agriculture, forestry and ecosystems {WGII
4.4, 5.4}
Water resources {WGII 3.4}
Human health {WGII 8.2, 8.4}
Industry, settlement and society {WGII 7.4}
Increased frequency of heavy precipitation events.
Very likely
Damage to crops; soil erosion, inability to cultivate land due to waterlogging of soils
Adverse effects on quality of surface and groundwater; contamination of water supply; water scarcity may be relieved
Increased risk of deaths, injuries and infectious, respiratory and skin diseases
Disruption of settlements, commerce, transport and societies due to flooding: pressures on urban and rural infrastructures; loss of property
Increased area affected by drought
Likely
Land degradation; lower yields/crop damage and failure; increased livestock deaths; increased risk of wildfire
More widespread water stress
Increased risk of food and water shortage; increased risk of malnutrition; increased risk of water-and food- borne diseases
Water shortage for settlements, industry and societies; reduced hydropower generation potentials; potential for population migration

IPCC
Impacts of extreme eventsExamples of major projected impacts by sector
Phenomenon
Likelihood Agriculture, forestry and ecosystems {WGII
4.4, 5.4}
Water resources {WGII 3.4}
Human health {WGII 8.2, 8.4}
Industry, settlement and society {WGII 7.4}
Intense tropical cyclone activity increases
Likely
Damage to crops; windthrow (uprooting) of trees; damage to coral reefs
Power outages causing disruption of public water supply
Increased risk of deaths, injuries, water- and food- borne diseases; post-traumatic stress disorders
Disruption by flood and high winds; withdrawal of risk coverage in vulnerable areas by private insurers, potential for population migrations, loss of property
Increases in extreme high sea level
Likelyd
Salinisation of irrigation water, estuaries and freshwater systems
Decreased freshwater availability due to saltwater intrusion
Increased risk of deaths and injuries by drowning in floods; migration-related health effects
Costs of coastal protection versus costs of land-use relocation; potential for movement of populations and infrastructure; also see tropical cyclones above
IPCC
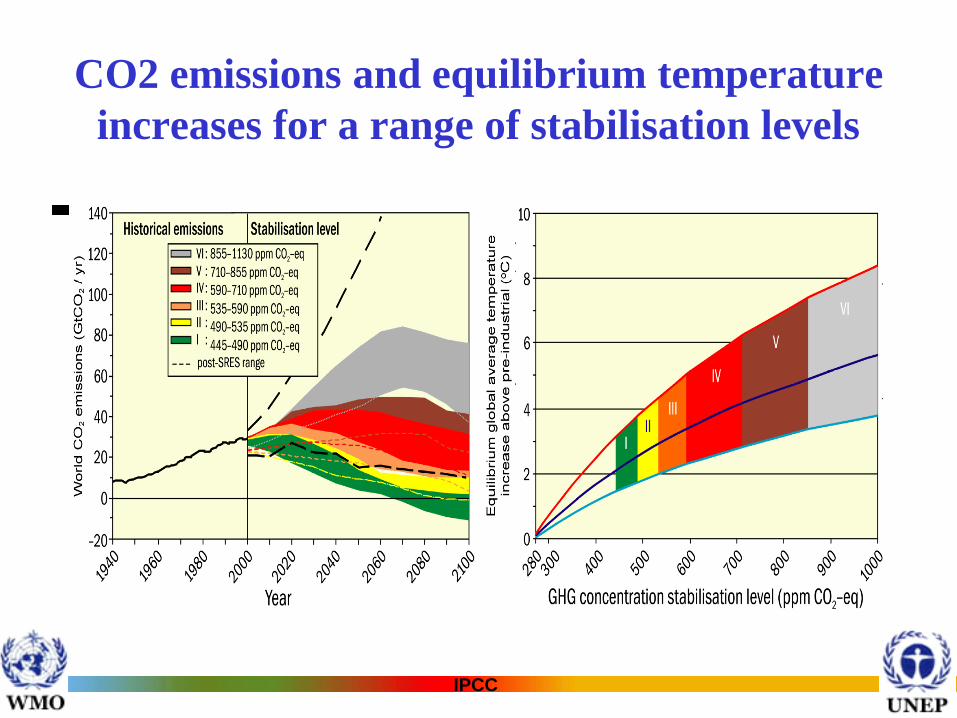
CO2 emissions and equilibrium temperature
increases for a range of stabilisation levels

IPCC
Figure TS.19. Geographical distribution of vulnerability in 2050

IPCC
Greenland
• Contraction of the Greenland ice sheet is projected to continue to contribute to sea level rise after 2100. Current models suggest virtually complete elimination of the Greenland ice sheet and a resulting contribution to sea level rise of about 7 m if global average warming were sustained for millennia in excess of 1.9 to 4.6ºC relative to pre-industrial values. The corresponding future temperatures in Greenland are comparable to those inferred for the last interglacial period 125,000 years ago, when paleoclimatic information suggests reductions of polar land ice extent and 4 to 6 m of sea level rise.

IPCC
Risks of large-scale singularities
• Sea level rise from thermal expansion alone projected to be much larger than observed over the 20th century
• Greenland Ice Sheet: – Complete deglaciation would raise sea level by 7 m
– Models project that sustained warming in excess of 1.9-4.6°C above pre-industrial would lead to sea level rise of several meters.
• Antarctic Ice Sheet: – Models project sea level lowering due to increased precipitation
• Risk that additional sea level rise from both the Greenland and Antarctic ice sheets may be larger than projected and could occur on century time scales.
• Ice dynamical processes seen in recent observations but not fully included in ice sheet models could increase the rate of ice loss.

IPCC
Total sea level projections
Antarctic ice sheet reduces
sea level over 21s century
Ad Hoc adjustment for ice
sheet dynamics not included
in models
1993-2003 mean trend
extrapolated to 2100

IPCC
Limiting temperature increase to 2
degrees C above pre-industrial
CO2-equivalent
Stabilization
level
(2005 = 375
ppm CO2e)
Global Mean
temperature
increase at
equilibrium
(ºC)
Global
average sea
level rise at
equilibrium
from thermal
expansion
only
Year global
CO2 needs to
peak
Reduction in
2050 global
CO2
emissions
compared to
2000
445 – 490 2.0 – 2.4 0.4 – 1.4 2000 – 2015 -85 to -50
490 – 535 2.4 – 2.8 0.5 – 1.7 2000 – 2020 -60 to -30
535 – 590 2.8 – 3.2 0.6 – 1.9 2010 – 2030 -30 to +5
590 – 710 3.2 – 4.0 0.6 – 2.4 2020 – 2060 +10 to +60
710 – 855 4.0 – 4.9 0.8 – 2.9 2050 – 2080 +25 to +85
855 – 1130 4.9 – 6.1 1.0 – 3.7 2060 – 2090 +90 to +140

IPCC
Long term sea level rise risks
Source: Brooks Nicholls Hall 2006
Areas
inundated with
20m SLR

IPCC
Greenland ice sheet loss accelerating
Recent