beyond 'dangerous' climate change: emission scenarios for a new world
TRANSCRIPT

November 2010, published 29, doi: 10.1098/rsta.2010.0290369 2011 Phil. Trans. R. Soc. A
Kevin Anderson and Alice Bows scenarios for a new worldBeyond 'dangerous' climate change: emission
References
ated-urlshttp://rsta.royalsocietypublishing.org/content/369/1934/20.full.html#rel
Article cited in: tml#ref-list-1http://rsta.royalsocietypublishing.org/content/369/1934/20.full.h
This article cites 22 articles, 4 of which can be accessed free
This article is free to access
Subject collections
(37 articles)environmental engineering � (9 articles)atmospheric chemistry �
collectionsArticles on similar topics can be found in the following
Email alerting service herein the box at the top right-hand corner of the article or click Receive free email alerts when new articles cite this article - sign up
http://rsta.royalsocietypublishing.org/subscriptions go to: Phil. Trans. R. Soc. ATo subscribe to
on May 23, 2014rsta.royalsocietypublishing.orgDownloaded from on May 23, 2014rsta.royalsocietypublishing.orgDownloaded from

Phil. Trans. R. Soc. A (2011) 369, 20–44doi:10.1098/rsta.2010.0290
Beyond ‘dangerous’ climate change: emissionscenarios for a new world
BY KEVIN ANDERSON1,3 AND ALICE BOWS2,*1Tyndall Centre for Climate Change Research, School of Mechanical,
Aerospace and Civil Engineering, and 2Sustainable Consumption Institute,School of Earth, Atmospheric and Environmental Sciences,
University of Manchester, PO Box 88, Manchester M60 1QD, UK3School of Environmental Sciences and School of Development,
University of East Anglia, Norwich NR4 7JT, UK
The Copenhagen Accord reiterates the international community’s commitment to ‘holdthe increase in global temperature below 2 degrees Celsius’. Yet its preferred focuson global emission peak dates and longer-term reduction targets, without recourse tocumulative emission budgets, belies seriously the scale and scope of mitigation necessaryto meet such a commitment. Moreover, the pivotal importance of emissions from non-Annex 1 nations in shaping available space for Annex 1 emission pathways received,and continues to receive, little attention. Building on previous studies, this paper usesa cumulative emissions framing, broken down to Annex 1 and non-Annex 1 nations, tounderstand the implications of rapid emission growth in nations such as China and India,for mitigation rates elsewhere. The analysis suggests that despite high-level statementsto the contrary, there is now little to no chance of maintaining the global mean surfacetemperature at or below 2◦C. Moreover, the impacts associated with 2◦C have beenrevised upwards, sufficiently so that 2◦C now more appropriately represents the thresholdbetween ‘dangerous’ and ‘extremely dangerous’ climate change. Ultimately, the science ofclimate change allied with the emission scenarios for Annex 1 and non-Annex 1 nationssuggests a radically different framing of the mitigation and adaptation challenge fromthat accompanying many other analyses, particularly those directly informing policy.
Keywords: emission scenarios; Annex 1; non-Annex 1; cumulative emissions; climate policy;emission pathways
1. Introduction
The 2009 Copenhagen Accord [1] has received widespread criticism fornot including any binding emission targets. Nevertheless, it does reiteratethe international community’s commitment to ‘hold the increase in globaltemperature below 2 degrees Celsius, and take action to meet this objective*Author for correspondence ([email protected]).
Electronic supplementary material is available at http://dx.doi.org/10.1098/rsta.2010.0290 or viahttp://rsta.royalsocietypublishing.org.
One contribution of 13 to a Theme Issue ‘Four degrees and beyond: the potential for a globaltemperature increase of four degrees and its implications’.
This journal is © 2011 The Royal Society20
on May 23, 2014rsta.royalsocietypublishing.orgDownloaded from

Beyond dangerous climate change 21
consistent with science and on the basis of equity’ [1].1 The Accord does not,however, quantify the degree of mitigation required to meet this commitment nordoes it give an indication of whether it is still possible to do so. Moreover, anddespite making reference to being guided by the ‘science’, the Accord makes nomention of cumulative emissions as providing the scientifically credible framingof mitigation; preferring instead to focus on the ‘peaking of global and nationalemissions as soon as possible’ and the need for ‘Annex I Parties to implement. . . quantified economy-wide emissions targets for 2020’. While the inclusionof nearer-term targets is certainly a welcome complement to targets for 2050,the Accord still falls short of acknowledging what the science makes absolutelyclear—it is cumulative emissions that matter.
This paper takes both the Accord’s commitment to ‘hold the increase in globaltemperature below 2 degrees Celsius’ along with its focus on the nearer termtargets, and considers these in light of post-2000 and recession-adjusted emissiontrends. Building particularly on previous analyses by Anderson & Bows [2] andmore recently by Macintosh [3], the paper translates earlier global assessmentsof cumulative emissions into emission pathways for Annex 1 and non-Annex 1nations. The importance of the distinction between Annex 1 and non-Annex 1 isalso noted in the Accord. Specifically, the Accord recognizes ‘that the time framefor peaking will be longer in developing countries’ and also, very significantly,that ‘social and economic development and poverty eradication are the first andoverriding priorities of developing countries’.
2. Analysis framing
The first decade of the new millennium has witnessed unprecedented increases inemissions reflecting ongoing high levels of energy usage for heat, electricity andtransport within Annex 1 nations coupled with the very rapid industrializationof many non-Annex 1 nations, in particular China and India. Total cumulativeemissions produced by nations that underwent industrialization in the nineteenthcentury and first half of the twentieth century will be eclipsed if the five billionpeople currently resident in non-Annex 1 nations remain or become locked intoa fossil fuel economy. Although included in non-mitigation energy scenarios (e.g.[4,5]), this dramatic potential for emissions growth within non-Annex 1 nationsis typically neglected in global and national mitigation scenarios. By consideringglobal emission budgets alongside emission pathways for non-Annex 1 nations,this paper illustrates the increasing relevance of the latter for the mitigationpolicies of Annex 1 nations.
Recent years have seen the development of an increasing number of globalemissions scenarios, each with a differing quantity of cumulative emission overthe twenty-first century and hence with different temperature implications (e.g.[2,3,6–10]). Alongside these global analyses a growing range of ever more detailednational-level energy and emission scenarios are being developed (e.g. [11–13]).Clearly, integrating national and global analyses is a prerequisite of understandingthe scale and rate of mitigation, impacts and adaptation associated with differinglevels of climate change. However, as it stands, such integration is rare with1For the purpose of this paper, it is assumed that the ‘2 degrees Celsius’ relates to the temperaturerise above pre-industrial levels; though this is not made clear in the Accord.
Phil. Trans. R. Soc. A (2011)
on May 23, 2014rsta.royalsocietypublishing.orgDownloaded from

22 K. Anderson and A. Bows
little more than perfunctory correlation between national and global emissionpathways. By disaggregating selected global emission pathways into Annex 1and non-Annex 1 nations, this paper provides an improved and more contextualunderstanding of the extent of the mitigation challenge specifically and theadaptation challenge more generally.2 Such analysis cannot substitute for detailednational-level assessments, but does offer clear guidance as to the scale and rate ofmitigation necessary to avoid particular rises in temperature above pre-industriallevels.3
The paper comprises three principal analyses. The first derives pathways forCO2 emissions consistent with reasonable-to-low probabilities of exceeding 2◦C.The second explores the implications of incorporating all greenhouse gases withinthe scenario pathways for a similar chance of exceeding 2◦C. The third considershow a slower uptake of mitigation measures combined with later emissionspeaking impact on cumulative emissions and, hence, temperature.
(a) Determining the ‘appropriate’ probability for 2◦CThe framing of the Copenhagen Accord around the importance of ‘hold[ing]
to . . . below 2 degrees Celsius’ reflects the clear and long-established stancesof both the European Union (EU) Commission and the UK Government. TheEU maintains it ‘must adopt the necessary domestic measures . . . to ensurethat global average temperature increases do not exceed preindustrial levels bymore than 2◦C’ [15] (emphasis added). Within the UK, the language of manyGovernment statements suggests, if not a zero probability of exceeding 2◦C, atleast a very low one [16]. For example, in July 2009, the UK Government publishedits UK Low Carbon Transition Plan, in which it stated explicitly that ‘to avoidthe most dangerous impacts of climate change, average global temperatures mustrise no more than 2◦C’ [17, p. 5] (emphasis added). The previous Secretary ofState for Energy and Climate Change, Ed Miliband, subsequently reiteratedthis commitment, stating ‘we should limit climate change to a maximum of twodegrees’ [18] (emphasis added).
Although this language is qualitatively clear, the Accord, EU and the UKdo not make explicit what quantitative ‘risk’ of exceeding 2◦C is considered‘acceptable’. Without such quantification it is not possible to derive theaccompanying range of twenty-first century cumulative emissions budgets fromwhich emission pathways can be derived. In the absence of such quantification,probabilities may be inferred based on the approach developed for theIntergovernmental Panel on Climate Change’s (IPCC’s) reports, whereby acorrelation is made between the language of likelihood and quantified probabilities[19, p. 23]. Following this approach, the Accord’s, EU’s and UK Government’s
2Similar but less-contextual analyses also illustrate the division of global emissions between Annex 1and non-Annex 1 nations (e.g. [14]).3It is important to note that within non-Annex 1 nations there will be significant differences inpeaking years and emission reduction rates between the rapidly industrializing nations (e.g. China)and regions such as sub-Saharan Africa. However, whilst China’s total emissions are now higherthan those from any other nation, their per capita emissions are around one fifth of those for theUSA, and given current trends and agreements, are unlikely to succeed those in the USA in thenext two to three decades (see note 17 for a discussion on cumulative per capita emissions).
Phil. Trans. R. Soc. A (2011)
on May 23, 2014rsta.royalsocietypublishing.orgDownloaded from
Beyond dangerous climate change 23
statements all clearly imply very low probabilities of exceeding 2◦C, and even ahighly conservative judgement would suggest the statements represent no morethan a 5–33% chance of exceeding 2◦C.4
If government responses to climate change are to be evidence-based or at leastinformed significantly by science, the argument for low probabilities is reinforcedstill further. The characterization of 2◦C5 as the appropriate threshold betweenacceptable and ‘dangerous’ climate change is premised on an earlier assessment ofthe scope and scale of the accompanying impacts. However, these have since beenre-evaluated with the latest assessments suggesting a significant increase in theseverity of some impacts for a 2◦C temperature rise (e.g. [20,21]). Consequently,it is reasonable to assume, ceteris paribus, that 2◦C now represents a threshold,not between acceptable and dangerous climate change, but between dangerousand ‘extremely dangerous’ climate change; in which case the importance of lowprobabilities of exceeding 2◦C increases substantially.
Although the language of many high-level statements on climate changesupports unequivocally the importance of not exceeding 2◦C, the accompanyingpolicies or absence of policies demonstrate a pivotal disjuncture between high levelaspirations and the policy reality.6 In part this reflects the continued dominance of‘end point’ targets7 rather than scientifically credible cumulative emission budgetsand their accompanying emission pathways. However, even within nations suchas the UK, where the relevant policy community (and recent legislation) alignthemselves closely with the science of climate change, the disjuncture remains.
The first report of the UK’s Committee for Climate Change (CCC) [8]heralded a significant departure from a focus on end-point and typically long-termtargets. Complementing the UK’s 2050 emission-reduction target with short-termbudgets, the report proceeds to describe an emissions pathway out to 2050,acknowledging explicitly the need to re-align policy with cumulative emissionsrather than simplistic targets. Nevertheless, although the UK Government’sframing of its climate change legislation is the first to detail emission pathways, itis still far removed from its and others’ high-level commitments to ‘limit climatechange to a maximum of two degrees’ [18]. As it stands the carbon budgetand emission pathway now enshrined in legislation are underpinned by analysisassuming a 63 per cent probability of exceeding 2◦C [8, p. 21];8 a position thatcannot be reconciled with the probabilities implied repeatedly by Governmentstatements (i.e. at their highest 5–33% of exceeding 2◦C).
4At the ‘less likely’ end of the spectrum, the IPCC categorizes a 33 per cent probability of missingor exceeding something as ‘unlikely’, 10 per cent as ‘very unlikely’, 5 per cent as ‘extremely unlikely’and 1 per cent as ‘exceptionally unlikely’.5Or at least the rate of increase associated with a 2◦C rise by 2100.6Although this paper explicitly steers away from issues of governance, there are clearly majorimplications for all tiers of government, and wider public and private decision making in bothbringing about the scale of mitigation accompanying 2◦C and responding to the impacts andassociated adaptation of a failure to significantly mitigate.7Typically 2050 but also, more recently, 2020.8The 63 per cent probability of exceeding 2◦C is an outcome of the CCC’s modelling approach andrelates to its global cumulative emissions budget. Given the UK budget is premised on the CCC’schoice of regime for apportioning global emissions between nations, it is reasonable to describe theUK’s budget as correlating with a 63 per cent chance of exceeding 2◦C, albeit with the importantcaveat that other nations, at least collectively, do not exceed their apportioned emissions budgets.
Phil. Trans. R. Soc. A (2011)
on May 23, 2014rsta.royalsocietypublishing.orgDownloaded from

24 K. Anderson and A. Bows
While the climate specialists within the CCC are aware of the implicationsof their analysis and conclude explicitly that ‘it is not now possible to ensurewith high likelihood that a temperature rise of more than 2◦C is avoided’ [8,p. 16], the language of many policy statements suggests such implications arenot either understood or accepted. In general there remains a common viewthat underperformance in relation to emissions now can be compensated withincreased emission reductions in the future.9 Although for some environmentalconcerns delaying action may be a legitimate policy response, in relation toclimate change it suggests the scale of current emissions and their relationship tothe cumulative nature of the issue is not adequately understood.
From a mitigation perspective, the gap between the scientific and policyunderstanding of the challenge needs urgently to be addressed. What is perhapsless evident is the implication of this gap for adaptation. As it stands andin keeping with the dominant policy discourse, the framing of much of thedetailed research and practice around adaptation, if guided quantitatively atall, is informed primarily by the 2◦C characterization of dangerous climatechange. Yet, as the impacts of rising temperatures are unlikely to be linearand also given rising temperatures are increasingly likely to be accompaniedby additional feedbacks and hence further temperature rises, adaptation mustconsider more extreme climate change futures than those associated with 2◦C[22]. This is certainly important for the transition of Annex 1’s existing builtenvironment and infrastructures. However, it is appreciably more important forthe development of new built environments, infrastructures, agricultural practicesand water regimes etc. within the non-Annex 1 nations, where an opportunitystill exists for societies to locate in areas geographically less vulnerable to theimpacts of climate change.10
3. Scenario pathway assumptions
Scenario approaches are increasingly used within mitigation and adaptationresearch for visioning alternative futures, exploring consistency, assessingplausibility and providing policy guidance [23]. These approaches vary in termsof ‘backcasting’ and ‘forecasting’, and range from top-down and quantitativethrough to more bottom-up and qualitative assessments. The scenario pathwaysdeveloped in this paper are explicitly ‘backcasting’ and quantitative. They arenot vision-based, but rather are premised on a cumulative emissions framing ofclimate change for which richer and more qualitative scenarios could be developedin terms of mitigation, impacts and adaptation. With regard to exploring theconsistency of scenarios, the relative simplicity of the analysis presented herepermits the connection between temperature targets and emission reductions tobe readily assessed. In that sense, the scenarios are internally consistent. This9This is particularly evident in the continued recourse to the implementation of future andinnovative low-carbon technologies (e.g. carbon capture and storage, nuclear power, marine-basedbiofuels, etc.) as the principal route by which emissions reductions will be achieved; a position thatcannot be reconciled with the rate of reductions implied in high-level statements on 2◦C.10Such geographical vulnerability will need to be considered alongside other cultural, institutionaland economic factors if resilience to the impacts of climate change is to be embedded indevelopment.
Phil. Trans. R. Soc. A (2011)
on May 23, 2014rsta.royalsocietypublishing.orgDownloaded from
Beyond dangerous climate change 25
contrasts with most, if not all, bottom-up mitigation analyses where consistencyis constrained to issues of mitigation with climate related impacts typicallyexogenous to the analyses.11
(a) Cumulative emission budget
The scenario pathways developed in this paper illustrate quantitatively thescale of mitigation implied in high-level policy statements on 2◦C. Moreover,and with direct reference to Annex 1 and non-Annex 1 nations, the scenariopathways demonstrate the disjuncture between such high-level statements andthe emission pathways proposed by many policy-advisers and academics. Thescenario pathways are all premised on a cumulative emission budget approach,building particularly on the work of Macintosh [3] and Anderson & Bows [2,24]but also on a range of wider studies [7,25,26].
While Macintosh [3] focused on CO2-only emissions in correlating twenty-first century budgets with global mean temperatures (denoted by the CO2 plusregime), the budgets within Anderson & Bows’ analysis were for the basket ofsix Kyoto gases. Given there are merits and drawbacks for each of the budgetaryregimes, both are considered in this paper.
(i) The CO2-plus regime (C+) and twenty-first century budgets
The budgetary regime used by Macintosh [3] separates CO2 emissions fromnon-CO2 greenhouse gases and aerosols by applying Meinshausen et al.’s[7] assumptions on the net radiative forcing of the non-CO2 components.Consequently, for a given temperature and assuming other factors remainunchanged, the cumulative budget for CO2-only is lower than would be theequivalent CO2e greenhouse gas value. The advantage of this regime is that non-CO2 emissions, including aerosols, are more robustly incorporated than is possiblethrough the coarser regimes reliant on global warming potential. However,although offering significant scientific merit, the approach poorly represents thecontextual framing of emission scenarios, for example, the link between aerosolemissions and assumptions about fossil fuel combustion and rates of deforestation.
The CO2-only budgets considered in this paper are the same as the middleand lower estimates used by Macintosh [3]. Macintosh also analysed a higherbudget of 2055 GtCO2 (560 GtC) as an ‘outer marker’ of abatement necessaryfor avoiding a 2◦C. However, given the analysis here illustrates pathways offeringan ‘unlikely to extremely unlikely’4 chance of exceeding 2◦C, Macintosh’s highbudget is excluded from the analysis.
11For example, few if any energy scenarios addressing mitigation include reductions in efficiency ofthermal power stations if the temperature of cooling water rises, the potential of culturally distinctmigrants to embed alternative practices into established transport and housing energy use, howdrought conditions may impact energy use for desalination and grey-water recycling or the impactsof changing precipitation and temperature on biomass yields. This is not a criticism of existingbottom-up analyses, but a recognition that the range of impacts associated with different levels ofclimate change and differential impacts on temperature and precipitation make bottom-up analysismuch more challenging, if not impossible, with regard to achieving consistency.
Phil. Trans. R. Soc. A (2011)
on May 23, 2014rsta.royalsocietypublishing.orgDownloaded from

26 K. Anderson and A. Bows
The two remaining budgets, 1578 GtCO2 (430 GtC) and 1321 GtCO2 (360GtC), are taken directly from Macintosh [3]. The first is informed by theGarnaut Climate Change Review’s 450 ppm CO2e stabilization scenario [27]12
and according to Macintosh [3] provides an approximate 50 per cent chanceof not exceeding 2◦C. The latter, according to Macintosh reflects the ‘risk thatclimate-carbon cycle feedbacks respond earlier and more strongly than previouslybelieved’ and corresponds with a higher probability of not exceeding 2◦C.13
(ii) The basket of six regime (B6) and twenty-first century budgets
The B6 regime, used previously by Anderson & Bows [2], assumes thecorrelation between global mean temperature and cumulative emissions of thebasket of six Kyoto gases as adequate for informing policy-makers of the scale ofmitigation necessary. In relation to aerosols it assumes they are both short-livedand sufficiently highly correlated with fossil fuel combustion and deforestation asto have little net impact on temperatures associated with twenty-first century low-emission scenario pathways [10].14 Moreover, it assumes the ‘CO2 equivalence’ ofKyoto gases reasonably captures the warming implications of non-CO2 emissionsfrom producing food for an increasing and more affluent population. Evidently,the CO2e regime is not as scientifically robust as the CO2-only regime, but itmore appropriately captures the contextual implications of alternative emissionscenario pathways.
The two CO2e budgets within this paper are those used within Anderson &Bows [2] and represent the low (1376 GtCO2e) and high (2202 GtCO2e) ends ofthe IPCC AR4 cumulative emission range for stabilization at 450 ppmv CO2e[29]. Currently Meinshausen’s et al.’s PRIMAP tool [28] does not permit adirect calculation of the probability of exceeding 2◦C for emission pathways thatmaintain a substantial and long-term emission burden. However, a coarse-levelbut nevertheless adequate estimate is possible if the long lived gases within the‘emissions floor’15 are added to the 2000–2050 cumulative values.
(b) Empirical data
The continued and high level of current emissions is consuming the twenty-first century emission budget at a rapid rate. Consequently, it is necessary to useup-to-date and complete emissions data to construct future emission pathways.Within this paper data are aggregated for the latest year available from a numberof different sources.
12For more details see Macintosh [3].13Probabilities based on Meinshausen et al.’s [7] model assumptions can be calculated using thePRIMAP tool [28] if the 2000–2049 emissions are known.14‘Twenty-first century low-emission’ scenarios are premised on low fossil fuel combustion and lowdeforestation rates. The probabilities related to 2◦C in the B6 regime do however take into accountthe radiative forcing of the different emissions including aerosols based on assumptions embeddedin Meinshausen’s et al.’s PRIMAP tool for estimating probabilities of exceeding 2◦C [28].15Refers to the lowest level of annual emissions considered viable in the scenario. These emissionsare typically related to agriculture and food production.
Phil. Trans. R. Soc. A (2011)
on May 23, 2014rsta.royalsocietypublishing.orgDownloaded from
Beyond dangerous climate change 27
(i) Energy and industrial process emissions
For energy and process related CO2 emissions from 2000 until 2008, dataare taken for each Annex 1 and non-Annex 1 nation from the Global CarbonProject using the Carbon Dioxide Information Analysis Centre (CDIAC) [30]and aggregated to produce an Annex 1 and non-Annex 1 total. The nationallyconstructed data from this source exclude CO2 emissions from internationalaviation and shipping. To include these additional emissions, data are not takenfrom CDIAC as their bunker fuel CO2 emission data are not disaggregatedbetween nations and global marine bunker emissions are based on sales recordsthat currently underestimate significantly the global greenhouse gas emissionburden [31]. Instead, international aviation CO2 for Annex 1 nations is taken fromthe memo submissions to the United Nations Framework Convention on ClimateChange (UNFCCC) [32]. Non-Annex 1 international aviation CO2 data are takenfrom the International Energy Agency [33] as non-Annex 1 nations do not submitthis information to the UNFCCC. For international marine bunkers, the datahave previously been subject to high levels of uncertainty [34–36]. However, arecent study by the International Maritime Organisation [37] has produced a timeseries for greenhouse gas emissions associated with international shipping activity.These data provide a figure for the global aggregated CO2 and other greenhousegas emissions between 1990 and 2007. However, the data are not disaggregatedinto national statistics. To estimate the proportion of international shipping CO2emissions split between Annex 1 and non-Annex 1 nations, an assumption istaken that shipping activity is directly proportional to each nation’s proportionof global GDP. This crude method of apportionment was used previously (e.g.[36]), and given difficulties in apportioning international shipping emissions tonations [38,39], is also used here as an adequate, though inevitably coarse-level,division of emissions between Annex 1 and non-Annex 1 nations.16
(ii) Deforestation and land-use change
For deforestation and land-use change (hereafter referred to as ‘deforestation’)data between 2000 and 2008 carbon emissions are again taken from the GlobalCarbon Project Carbon Budget Update 2009 [41]. Their figures are estimatedbased on deforestation statistics published by the United Nations Food andAgriculture Organization [42] and a bookkeeping method up until 2005. The2006–2008 emissions are derived from estimates of fire emissions using satellitedata from the Oak Ridge National Laboratory Distributed Active Archive CenterGlobal Fire Emissions Database in combination with a biogeochemical model [43].
(iii) Non-CO2 greenhouse gas data
The non-CO2 greenhouse gas emission data for 2000–2005 are based on theUS Environmental Protection Agency (EPA) estimates [44]. For 2006 and 2007,data are taken from an interpolation between the 2005 and 2010 EPA projections.
16A hybrid approach for apportioning aviation emissions between regions may provide insights intopotential apportionment regimes for shipping [40].
Phil. Trans. R. Soc. A (2011)
on May 23, 2014rsta.royalsocietypublishing.orgDownloaded from
28 K. Anderson and A. Bows
This dataset is identical to the one used within Anderson & Bows [2] but in thiscase individual national statistics are aggregated to produce the Annex 1 andnon-Annex 1 totals.
(c) Economic downturn
The economic downturn of 2007–2009 had a direct impact on greenhousegas emission growth rates, particularly those associated with energy. Althoughthe crisis is beginning to show within 2008 emissions inventories, data werenot available for either 2008–2010 bunker fuel emissions or 2009–2010 domesticfossil fuel CO2 emissions. In the absence of such data, estimates draw onthe work of Macintosh [3] and the Global Carbon Project [41]. For Annex 1nations, fossil fuel CO2 (excluding bunkers) is assumed to decline by 6 percent in 2009, stabilizing at 0 per cent in 2010. Non-Annex 1 nations areassumed to exhibit 0.5 per cent decline in emissions in 2009, but given Chinais already reporting high levels of growth for early 2010, the 2010 growth figureis assumed to be half the recent decade’s average (i.e. 2.7%). Consequently,growth in global fossil fuel CO2 (excluding bunkers) is assumed to be −3.0per cent in 2009 rising to 1.5 per cent in 2010. For international aviationbunkers, it is estimated Annex 1 nations’ emissions declined by 2 per centin 2008, remaining static in 2009 and 2010. Non-Annex 1 nation aviationbunkers are assumed to be stable at 2007 levels until 2009, after which theygrow at 2 per cent in 2010, again half the recent decade’s average. Given theinternational marine bunker figures are based on proportions of global GDP,the same percentage growth rates for national emission trends are appliedas for Annex 1 and non-Annex 1 domestic CO2 emissions between 2008and 2010.
For the emissions of non-CO2 greenhouse gases, it is assumed that their growthis also impacted by the economic downturn. However, non-CO2 greenhouse gasemission growth rates are typically lower than those for global fossil fuel CO2 byapproximately 1–2% per year. Given the absence of recent data from the EPA,Annex 1 and non-Annex 1 non-CO2 greenhouse gas emissions are assumed toproportionally follow the percentage change in their CO2 counterparts. In otherwords, if the rate of growth halves for Annex 1 CO2 emissions, then the rate ofgrowth for non-CO2 greenhouse gas emissions is also assumed to halve.
4. Scenario pathway development
Following a brief explanation of how historical and deforestation emissionsare accounted for, the construction of the scenario pathways involves thefollowing steps.
— Decide on a global cumulative CO2 and greenhouse gas emission budgetassociated with a range of probabilities of exceeding 2◦C.
— Construct emission pathways for the non-Annex 1 nations with varyingpeak dates.
— Construct emission pathways for the Annex 1 nations for which thecumulative emissions, when added to non-Annex 1 and deforestationemissions, do not exceed the global ‘2◦C’ cumulative budget.
Phil. Trans. R. Soc. A (2011)
on May 23, 2014rsta.royalsocietypublishing.orgDownloaded from

Beyond dangerous climate change 29
— Construct emission pathways for the non-Annex 1 nations with a 2030peak date and more ‘orthodox’ annual reduction rates following the peak.
— Construct emission pathways for the Annex 1 nations with a 2015 peakdate and ‘orthodox’ annual emission-reduction rates following the peak.
— Assess the potential future climate impact of these more ‘politicallyacceptable’ and ‘economic feasible’ pathways.
(a) Historical emissions
In developing emission pathways for Annex 1 and non-Annex 1 regions it isnecessary to make explicit which region is deemed responsible for which emissions.While the following analysis focuses specifically on the period 2000–2100, it isimportant to reflect briefly on the treatment of recent historical emissions. Giventemperature correlates with cumulative emissions of greenhouse gases, a casecould be made for considering the responsibility for twentieth century emissionsin apportioning future twenty-first century emission-space between Annex 1and non-Annex 1 regions. However, the highly constrained emission-space nowremaining for a 2–3◦C rise in global mean surface temperature leaves little optionbut to explicitly neglect the responsibility of historical emissions in developingpragmatic twenty-first century emission profiles.17 Getting an appropriate balanceof responsibilities is a matter of judgement that inevitably will not satisfy allstakeholders and certainly will be open to challenge. As it stands, the approachadopted for this paper in which historical (and deforestation) emissions are takento be global overheads,18 is a pragmatic decision that, if anything, errs in favourof the Annex 1 nations.19
(b) Deforestation emissions
To explore the constraints on emissions from Annex 1 nations of continuedgrowth in emissions from non-Annex 1 nations, only data for fossil fuelcombustion, industrial processes and agriculture are split between Annex 1 andnon-Annex 1. Deforestation emissions are treated as a global overhead and thusremoved from the available emission budgets prior to developing the pathways.Such an approach could be argued to unreasonably favour non-Annex 1 nationsas deforestation emissions occur within their geographical boundaries. However,given most Annex 1 countries have already deforested (emitting CO2) it could
17Factoring twentieth century emissions from Annex 1 nations into calculations of the ‘fair’ emissionspace available for Annex 1 in the twenty-first century would leave Annex 1 nations already in‘emission debt’. Whilst such an outcome may have some moral legitimacy, it evidently would notprovide for a politically consensual framing of emission apportionment. However, the implicationsof including twentieth century emissions and the concept of emission debt may guide the scopeand scale of climate-related financial transfers (arguably as reparation) between Annex 1 andnon-Annex 1 nations.18Emissions not attributable to any specific geographical location.19It is worth noting that a recent paper [45] based on analysis undertaken at Tsinghua Universityin Beijing makes the case that ‘reasonable rights and interests should be strived for, based on theequity principle, reflected through cumulative emissions per capita’. Building on this cumulativeemissions per capita approach, the authors demonstrate how China’s historical cumulativeemissions are only one-tenth of the average in industrial countries and one-twentieth that ofthe USA.
Phil. Trans. R. Soc. A (2011)
on May 23, 2014rsta.royalsocietypublishing.orgDownloaded from
30 K. Anderson and A. Bows
50(a) (b) (c)
40
30
20
10
02000
GtC
O2
yr–1
2020 2040 2060year
2080 2100 2000 2020 2040 2060year
2080 2100 2000 2020 2040 2060year
2080 2100
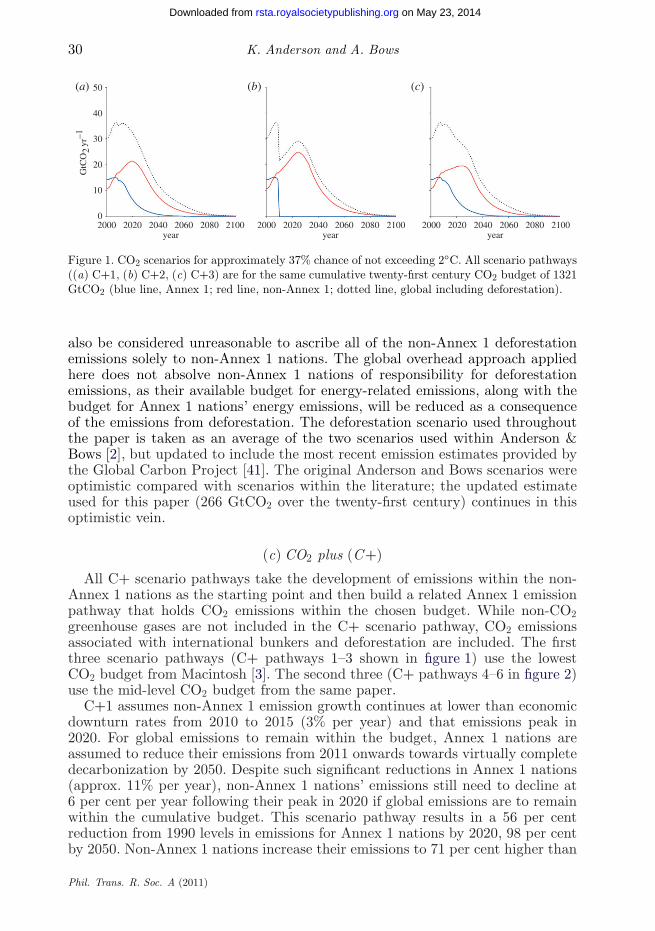
Figure 1. CO2 scenarios for approximately 37% chance of not exceeding 2◦C. All scenario pathways((a) C+1, (b) C+2, (c) C+3) are for the same cumulative twenty-first century CO2 budget of 1321GtCO2 (blue line, Annex 1; red line, non-Annex 1; dotted line, global including deforestation).
also be considered unreasonable to ascribe all of the non-Annex 1 deforestationemissions solely to non-Annex 1 nations. The global overhead approach appliedhere does not absolve non-Annex 1 nations of responsibility for deforestationemissions, as their available budget for energy-related emissions, along with thebudget for Annex 1 nations’ energy emissions, will be reduced as a consequenceof the emissions from deforestation. The deforestation scenario used throughoutthe paper is taken as an average of the two scenarios used within Anderson &Bows [2], but updated to include the most recent emission estimates provided bythe Global Carbon Project [41]. The original Anderson and Bows scenarios wereoptimistic compared with scenarios within the literature; the updated estimateused for this paper (266 GtCO2 over the twenty-first century) continues in thisoptimistic vein.
(c) CO2 plus (C+)
All C+ scenario pathways take the development of emissions within the non-Annex 1 nations as the starting point and then build a related Annex 1 emissionpathway that holds CO2 emissions within the chosen budget. While non-CO2greenhouse gases are not included in the C+ scenario pathway, CO2 emissionsassociated with international bunkers and deforestation are included. The firstthree scenario pathways (C+ pathways 1–3 shown in figure 1) use the lowestCO2 budget from Macintosh [3]. The second three (C+ pathways 4–6 in figure 2)use the mid-level CO2 budget from the same paper.
C+1 assumes non-Annex 1 emission growth continues at lower than economicdownturn rates from 2010 to 2015 (3% per year) and that emissions peak in2020. For global emissions to remain within the budget, Annex 1 nations areassumed to reduce their emissions from 2011 onwards towards virtually completedecarbonization by 2050. Despite such significant reductions in Annex 1 nations(approx. 11% per year), non-Annex 1 nations’ emissions still need to decline at6 per cent per year following their peak in 2020 if global emissions are to remainwithin the cumulative budget. This scenario pathway results in a 56 per centreduction from 1990 levels in emissions for Annex 1 nations by 2020, 98 per centby 2050. Non-Annex 1 nations increase their emissions to 71 per cent higher than
Phil. Trans. R. Soc. A (2011)
on May 23, 2014rsta.royalsocietypublishing.orgDownloaded from

Beyond dangerous climate change 31
50(a) (b) (c)
40
30
20
10
0
GtC
O2
yr–1
2000 2020 2040 2060year
2080 2100 2000 2020 2040 2060year
2080 2100 2000 2020 2040 2060year
2080 2100
Figure 2. CO2 scenarios for approximately 50% chance of not exceeding 2◦C. All scenario pathways((a) C+4, (b) C+5, (c) C+6) are for the same cumulative twenty-first century CO2 budget of 1578GtCO2 (blue line, Annex 1; red line, non-Annex 1; dotted line, global including deforestation).
50(a) (b)
40
30
20
10
0
year2000 2020 2040 2060 2080 2100
year2000 2020 2040 2060 2080 2100
GtC
O2e
yr–1
Figure 3. Kyoto gas scenarios for approximately 39–48% chance of not exceeding 2◦C ((a) B6 1not viable). For (b) B6 2, the cumulative twenty-first century CO2e budget is 2202 GtCO2e (blueline, Annex 1; red line, non-Annex 1; dotted line, total including deforestation).
1990 levels by 2020 and then reduce them to 76 per cent below 1990 levels by2050. Using the PRIMAP tool developed by Meinshausen et al. [7,28] this scenariopathway is estimated to have a 36 per cent20 probability of exceeding 2◦C.
Following the same approach, C+2 has non-Annex 1 emissions continuing togrow at a lower than pre-economic downturn rate until 2020 (3% per year), andpeak in 2025. However, if this is the case, non-Annex 1 nations use the entirecarbon budget and leave no emission budget for Annex 1 nations. Thus, thisscenario pathway is not compatible with the lower of the cumulative carbonbudgets.21
20PRIMAP provides a range of probabilities and a ‘best estimate’ using cumulative emissionsbetween 2000 and 2049. Here, ‘best estimates’ are presented; probabilities may vary slightly forthe same twenty-first century budget, owing to differences in the 2000–2049 emissions.21Given it is not possible to have an immediate cessation of emissions from all Annex 1 nations.
Phil. Trans. R. Soc. A (2011)
on May 23, 2014rsta.royalsocietypublishing.orgDownloaded from

32 K. Anderson and A. Bows
To explore the potential of providing for more acceptable reduction rates whilestill offering a ‘reasonable’ chance of not exceeding 2◦C, C+3 assumes non-Annex 1 nations’ emissions grow at a much reduced rate (1% per year) until2025. Given this, and if Annex 1 emissions begin to reduce immediately (as inC+1), non-Annex 1 nations’ emissions must still reduce at 7–8% per year after thepeak date in order for global emissions to remain within the cumulative budget.Following the dip in emissions owing to the economic downturn, and as a resultof a step-change in emission growth from non-Annex 1 nations, global emissionspeak in 2011 and Annex 1 nations’ future emissions do not grow any higher thancurrent levels. This plausible but highly unlikely scenario has a 37 per cent chanceof exceeding 2◦C according to PRIMAP [28].
The next three scenario pathways (figure 2) use the higher budget of 1578GtCO2 within Macintosh [3]. C+4 assumes non-Annex 1 nation emissions growat 4 per cent per year until 2015 peaking in 2020. The Annex 1 nations havemore room to grow in early years than in C+1, but are assumed to reach a peakby 2015. Global emissions thus peak in 2019 with Annex 1 emissions 6 per centbelow 1990 by 2020 and 84 per cent by 2050. Non-Annex 1 emissions are 186per cent above 1990 levels in 2020 and 45 per cent below them by 2050. Globalemissions are 67 per cent below 1990 by 2050. Both Annex 1 and non-Annex 1emissions are assumed to decline post-peak at 5–6% per year. This scenariopathway has an estimated 50 per cent chance of exceeding 2◦C according toPRIMAP [28].
C+5 again uses the higher budget within Macintosh [3] but assumes non-Annex 1 emissions to continue to grow at 4 per cent per year rates until 2020,and peak in 2025 with a rapid decline to a maximum of 7–8% per year. To remainwithin budget, Annex 1’s emissions peak by 2010 and decline at 7–8% per year.Within this scenario pathway, global emissions are broadly flat between 2014 and2022, although emissions are highest in 2020. Thus the penalty for a five yeardelay in the non-Annex 1 peak date is an additional 2 per cent per year on top ofthe emission reduction rate for both Annex 1 and non-Annex nations, in additionto an immediate Annex 1 reduction. C+5 has a 52 per cent chance of exceeding2◦C. C+6 uses the same higher budget but illustrates that if reductions are lower,at 4–5% per year for non-Annex 1 nations following the peak date, no emissionspace is available for Annex 1 nations.
(d) Basket of six scenario pathways (B6)
In a similar approach to the C+ pathways, all B6 pathways (figures 3 and 4)take the development of emissions within the non-Annex 1 nations as the startingpoint and then build a related Annex 1 emission scenario pathway that must, inthis case, keep total greenhouse gas emissions within the chosen budget. Thesignificant difference between the B6 and the C+ pathways is that the givenemission budget is assumed to apply to the full basket of 6 greenhouse gasesmirroring the approach taken in Anderson & Bows [2]. In addition to consideringthe effect of non-CO2 greenhouse gases contributing to the overall budget, anessential difference is the requirement for significant emissions space post-2050 toallow for greenhouse gas emissions (specifically N2O and CH4) associated withfood production for an approximate 9.2 billion global population (based on UN
Phil. Trans. R. Soc. A (2011)
on May 23, 2014rsta.royalsocietypublishing.orgDownloaded from

Beyond dangerous climate change 33
year2000 2020 2040 2060 2080 2100
year2000 2020 2040 2060 2080 2100
(a) (b)
40
50
30
20
10
0
GtC
O2e
yr–1
Figure 4. Kyoto gas scenarios for approximately 38–48% chance of not exceeding 2◦C ((a) B6 3,(b) B6 4). The cumulative twenty-first century CO2e budget is 2202 GtCO2e. Blue line, Annex 1;red line, non-Annex 1; dotted line, total including deforestation.
median estimate for 2050 [46]). In an update to the previous Anderson & Bows[2] study, the assumed minimum level of greenhouse gas production related tofood is more optimistic still at 6 GtCO2e per year as opposed to 7.5 GtCO2eper year. This is in line with the value chosen by the UK [8] and results inan estimated 0.67 tCO2e per person from 2050 onwards for food-related non-CO2 greenhouse gases compared with an approximate figure of 0.95 GtCO2e perperson for 2010 [44,46]. Assuming by 2050 there are 7.9 billion people in non-Annex 1 nations, and 1.3 billion in Annex 1 nations [46], and assuming foodconsumption is more evenly balanced between Annex 1 and non-Annex 1 nationsthan currently, this would allow approximately 5.1 GtCO2e as a minimum annualgreenhouse gas emission for non-Annex 1 nations and 0.86 GtCO2e per year forAnnex 1 nations.
B6 1 uses the IPCC ‘low’ emission budget and assumes that between 2010and 2015 non-Annex 1 emissions grow at slightly lower (3% per year) than pre-economic downturn rates and peak by 2020 (figure 3). Given the food-related non-CO2 greenhouse gases post-2050, emissions from 2017 onwards for non-Annex 1nations must tend immediately towards the emissions floor of 5.1 GtCO2e. Inother words, this scenario pathway is not viable.
B6 2 makes identical assumptions to B6 1 but for the ‘high’ IPCC emissionbudget (figure 3). The additional space allowed leads to a viable scenario pathway,where non-Annex 1 emissions peak in 2020, while Annex 1 nation emissionsdecline from 2010 onwards. Emission reductions for non-Annex 1 nations in thiscase are 6 per cent per year, while for Annex 1 they gradually build from around 3per cent per year for 2015 to 2020 to 6 per cent later in the century. The PRIMAPtool to estimate the probability of exceeding the 2◦C threshold assumes the vastmajority of emissions are released pre-2050 (fig. 2 in [7]). Given that within theB6 scenario pathways there is a substantial cumulative emission total for the post-2050 emissions (with at least 300 GtCO2e from greenhouse gases associated with
Phil. Trans. R. Soc. A (2011)
on May 23, 2014rsta.royalsocietypublishing.orgDownloaded from

34 K. Anderson and A. Bows
food production), inputting the 2000–2049 cumulative total for each B6 scenariointo PRIMAP will result in an underestimate of the probability of exceeding2◦C. To account for this underestimate, an alternative probability is calculatedassuming the following.
— The shorter-lived nature of methane compared with N2O results in anegligible impact on post-2050 warming from methane.22
— N2O and methane each account for approximately 50 per cent of the non-CO2 greenhouse gases post-2050 (Smith, personal communication).
— The amount of non-CO2 greenhouse gas emissions released per yearpossible post-2050 is 6 GtCO2e (in line with assumptions made by theUK CCC [8]) of which 3 GtCO2e per year is from N2O.
— Thus 150 GtCO2e of cumulative emissions are added to the pre-2050emissions to estimate an alternative probability.
If 150 GtCO2e is added to the cumulative emission total for each scenario,PRIMAP estimates an approximate ten percentage point increase in probabilityof exceeding 2◦C (see table 1, figure is in brackets). For example, B6 2 hasat least a 39 per cent chance of exceeding 2◦C and is potentially as high as48 per cent.
Both B6 3 and B6 4 take the IPCC’s ‘high’ cumulative budget as a constraint.B6 3 assumes non-Annex 1 nation emissions peak in 2025 following a growthof 3 per cent per year between 2010 and 2020 (figure 4). With steep emissionreductions for non-Annex 1 nations post-peak of 6 per cent per year, Annex 1nations would need to reduce emissions from 2010 onwards at more than 10 percent per year to remain within the high IPCC cumulative budget. More gradualreductions in emissions from non-Annex 1 nations would render this scenariopathway impossible. B6 3 has the same probability of exceeding 2◦C as B6 2.
B6 4 mirrors the assumptions within C+3, with considerably slower growth of1 per cent per year until a peak date in 2025 (figure 4). The emission reductionspost-peak for non-Annex 1 nations are 4–5% per year, whereas for Annex 1nations, following a levelling off of emissions until 2014, emissions decrease at6 per cent per year. This scenario pathway has at least a 38 per cent probabilityof exceeding 2◦C, and potentially as high as 47 per cent once post-2050 emissionsare factored in.
(e) Orthodox scenario pathways
The final scenario pathways developed are unconstrained by a particularemission budget (figure 5). For both the C+ and B6 regimes, pathways areconstructed that assume non-Annex 1 nations’ emissions continue to developalong their current trajectory until 2025, peaking in 2030, then reducing at
22This is an explicitly conservative assumption and results in slightly higher probabilities of notexceeding 2◦C than would be the case if some allowance were to be made for post-2050 emissionsof methane.
Phil. Trans. R. Soc. A (2011)
on May 23, 2014rsta.royalsocietypublishing.orgDownloaded from
Beyond dangerous climate change 35
Tab
le1.
Sum
mar
yof
scen
ario
path
way
char
acte
rist
ics.
Ann
ex1
peak
non-
Ann
ex1
appr
oxim
ate
%gl
obal
21st
cent
ury
date
/21s
tpe
akda
te/2
1st
ofex
ceed
ing
CO
2or
cent
ury
cent
ury
Ann
ex1
%no
n-A
nnex
1%
post
-pea
k2◦
C(b
ased
ongr
eenh
ouse
gas
cum
ulat
ive
cum
ulat
ive
redu
ctio
non
redu
ctio
non
post
-pea
kpo
st-p
eak
glob
alra
teof
2000
–204
9bu
dget
inem
issi
ons
emis
sion
sgl
obal
1990
leve
ls19
90le
vels
Ann
ex1
non-
Ann
ex1
redu
ctio
nem
issi
ons
scen
ario
GtC
O2
orin
GtC
O2
inG
tCO
2pe
akby
2020
by20
20ra
teof
rate
of(i
nclu
des
usin
gpa
thw
ay[G
tCO
2e]
or[G
tCO
2e]
or[G
tCO
2e]
date
(205
0)(2
050)
redu
ctio
nre
duct
ion
defo
rest
atio
n)P
RIM
AP
)
C+1
1321
2007
2020
2012
56%
(98%
)+1
714%
(54%
)10
–11%
6–7%
6–7%
36%
313
742
C+2
a13
2120
0720
2520
0710
0%(1
00%
)+1
93%
(27%
)—
6–7%
6–7%
139
916
C+3
1321
2007
2025
2007
56%
(98%
)+1
43%
(54%
)10
–11%
7–8%
7–8%
37%
313
742
C+4
1578
2007
2020
2019
6%(8
4%)
+186
%(4
5%)
5–6%
b5–
6%5–
6%50
%53
278
0C
+515
7820
0720
2520
2044
%(9
5%)
+220
%(3
2%)
8%7–
8%7–
8%52
%36
394
9C
+6a
1578
2007
2025
2024
100%
(100
%)
+220
%(+
38%
)—
4–5%
4–5%
—15
311
59B
61a
,c[1
376]
2007
2017
2017
95%
(95%
)61
%(6
1%)
——
——
[265
][8
41]
B6c
2[2
202]
2010
2020
2017
25%
(82%
)+1
35%
(46%
)4–
6%5–
6%3%
39%
(48%
)d[6
39]
[129
3]B
6c3
[220
2]20
0720
2520
13–2
018
57%
(95%
)+1
54%
(24%
)8–
10%
6–7%
4–5%
39%
(48%
)d[4
29]
[150
3]B
6c4
[220
2]20
0720
2520
1334
%(9
0%)
+111
%(1
7%)
6%4–
5%4–
5%38
%(4
7%)d
[552
][1
380]
orth
odox
C+
2741
2015
2030
2027
2%(6
0%)
+223
%(+
163%
)3%
3%3%
88%
[729
]17
47or
thod
oxB
6[3
662]
2015
2030
2028
5%(6
2%)
+180
%(1
28%
)3%
3%3%
88%
(92%
)d[8
91]
[250
1]a T
hese
scen
ario
path
way
sar
eno
tvi
able
asth
eyco
uld
not
rem
ain
wit
hin
the
carb
onbu
dget
pres
crib
ed.
bT
his
isth
ere
duct
ion
rate
follo
win
gth
epe
riod
ofre
lati
vely
stab
leem
issi
ons
unti
l20
16.
c All
B6
scen
ario
path
way
sas
sum
ean
‘em
issi
onflo
or’of
6GtC
O2e
for
food
-rel
ated
emis
sion
sfo
ran
appr
oxim
ate
9bi
llion
popu
lati
onpo
st-2
050
unti
l21
00.If
adi
ffer
ent
‘em
issi
onflo
or’w
ere
tobe
used
,em
issi
onre
duct
ion
rate
sw
ould
beal
tere
dfo
rth
esa
me
cum
ulat
ive
valu
es.
dT
hefig
ure
inbr
acke
tsill
ustr
ates
ahi
gher
prob
abili
tyto
take
into
acco
unt
the
ongo
ing
emis
sion
sas
soci
ated
wit
hfo
odpr
oduc
tion
asop
pose
dto
gree
nhou
sega
sem
issi
ons
tend
ing
toze
ro.
Phil. Trans. R. Soc. A (2011)
on May 23, 2014rsta.royalsocietypublishing.orgDownloaded from

36 K. Anderson and A. Bows
year2000 2020 2040 2060 2080 2100
year2000 2020 2040 2060 2080 2100
60
(a) (b)
40
20
0
GtC
O2e
yr–1
Figure 5. Emission scenarios for approximately 88–92% chance of not exceeding 2◦C. Bothplots illustrate ‘orthodox’ mitigation pathways with (a) C+ for CO2 only (twenty-first centurycumulative emissions: 2741 GtCO2) and (b) B6 for Kyoto gases (twenty-first century cumulativeemissions: 3662 GtCO2e). Blue line, Annex 1; red line, non-Annex 1; dotted line, totalincluding deforestation.
a rate considered politically and economically acceptable23 (3% reduction peryear). For the Annex 1 nations, emissions are assumed to be relatively stablewith a peak in 2016 and subsequent emission reductions of 3 per cent per year.These scenario pathways both result in an 88 per cent chance of exceeding the2◦C threshold (potentially 92% for orthodox B6). Furthermore, their twenty-firstcentury cumulative budgets suggest the future temperature increase comparedwith pre-industrial times is more likely to be of the order of 4◦C rather than 2◦C.
For orthodox C+, cumulative emissions of CO2 alone are 2,741 GtCO2.Cumulative emissions of approximately 2700 GtCO2 are associated withstabilization of 550 ppmv CO2. Figures in excess of 3500 GtCO2e can be assumedto be closer to the 750 ppmv range. Orthodox B6 has cumulative emissions ofgreenhouse gases of 3662 GtCO2e, thus a reasonable probability of exceeding 4◦C.
5. Discussion
(a) CO2 plus (C+)
Although six C+ pathways were developed in the previous section, two wererejected for exceeding the constraints on cumulative CO2 budgets related tothe 2◦C temperature threshold. One exceeded the lower of the two chosen23The pathway of the CCC’s [8] most challenging scenario, ‘2016:4% low’, has post-peak emissionsreducing at 3.5 per cent per year from all sources. Stern [6] states ‘there is likely to be a maximumpractical rate at which global emissions can be reduced’ pointing to ‘examples of sustained emissionscuts of up to 1 per cent per year associated with structural change in energy systems’ and that‘cuts in emissions greater than this (1%) have historically been associated only with economicrecession or upheaval’. Stern concludes ‘it is likely to be difficult to reduce emissions faster thanaround 3 per cent per year’ [6, pp. 201–204]. The most stringent of the ADAM scenarios assumedemission reduction rates of approximately 3 per cent per year between a 2015 peak and 2050 [47fig. 2, p. 32].
Phil. Trans. R. Soc. A (2011)
on May 23, 2014rsta.royalsocietypublishing.orgDownloaded from
Beyond dangerous climate change 37
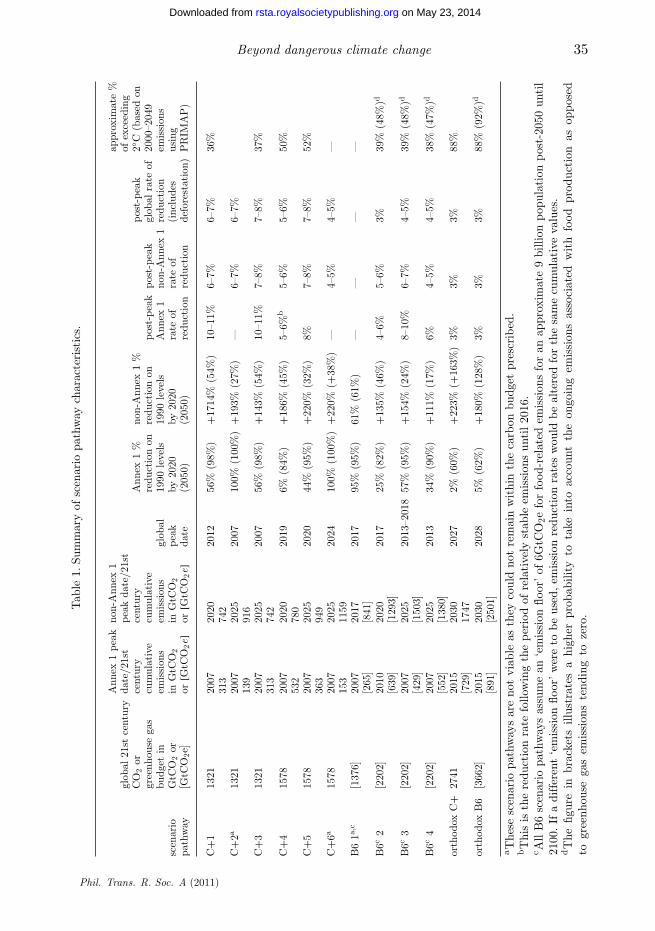
budgets (approx. 37% of not exceeding 2◦C) owing to non-Annex 1 emissionsboth continuing with recent growth rates out to 2020 and peaking in 2025.The other surpassed the higher of the two cumulative budgets (approx. 50%of not exceeding 2◦C) because, in addition to the emissions growth and peakyears, post-peak emission reductions of 4–5% per year were insufficient to staywithin the cumulative budget. Those pathways remaining within the lower budgetrequired an immediate and rapid decline in Annex 1 emissions and an early peakin non-Annex 1 emissions, unless the latter’s emission growth was constrainedto rates much lower than historical trends (i.e. to 1%, compared with currentgrowth of 3–4% per year [48]). In all cases, Annex 1 emissions continue todecline following the current economic downturn at rates in excess of 5 percent per year. Given these pathways explicitly exclude non-CO2 greenhouse gasemissions, the rates of reduction for CO2 presented in table 1 illustrate thechange necessary within the energy system primarily. Furthermore, figures 1and 2 illustrate the need for complete decarbonization of the Annex 1 energysystem by around 2050. For the higher (approx. 50%) chance of not exceeding2◦C, figure 2 and table 1 illustrate that a 5 year delay in the peak year fornon-Annex 1 nations (from 2020 to 2025) forces a 2 per cent increase inreduction rates globally in addition to an immediate emission reduction forAnnex 1 nations.
(b) Basket of six (B6)
When developing the B6 pathways (figures 3 and 4), it became apparentimmediately that the ‘low’ IPCC cumulative emission value was not viableif non-Annex 1 emissions peak as late as 2020. Consequently, the minimumprobability of not exceeding the 2◦C threshold achievable in this scenariopathway set is 38 per cent. Moreover, given a significant portion of emissionsare attributable to food production post-2050, this probability is likely to bea significant underestimate, with a more probable figure closer to 48 per cent.This result is in line with the scenario pathway analysis within Anderson &Bows [2]. For the IPCC’s ‘high’ end of the range, emission reductions of 6 percent per year for both Annex 1 and non-Annex 1 nations are necessary if non-Annex 1 emissions continue at recent growth rates and peak in 2020. However,if these rates are sustained for a further five years (i.e. to 2025), and non-Annex 1 post-peak reductions are 6 per cent per year or less, no emissionsspace remains for Annex 1 nations. Even if non-Annex 1 emissions grow atmuch slower rates to a 2025 peak, post-peak emission reductions of 4–5 percent per year are still needed from the aggregate of all nations. Therefore,under the IPCC’s higher budget, all viable scenario pathways exhibit emissionreduction rates well in excess of those typically considered to be politically andeconomically feasible.
(c) Orthodox
In light of the recent Copenhagen negotiations, there continues to be an absenceof any meaningful global action to mitigate emissions or set binding targets. Evenif Annex 1 nations agree on the scale of necessary emission reductions, it is more
Phil. Trans. R. Soc. A (2011)
on May 23, 2014rsta.royalsocietypublishing.orgDownloaded from

38 K. Anderson and A. Bows
probable that non-Annex 1 nations will set targets based on levels of carbonor energy intensity improvements. Although these will go some way towardsaddressing future high-carbon lock-in, it is unlikely that emission growth rates willbe significantly moderated during the coming decade. To explore the implicationsof this, the two orthodox scenario pathways paint a picture of ongoing non-Annex 1 emission growth, slow action to mitigate emissions on the part of Annex 1nations, and then sustained emission reductions at rates considered politicallyand economically feasible. Resulting cumulative emissions, while still within thebounds of possibility of not exceeding the 2◦C threshold (8–12% chance), aremore closely aligned with much higher climate change futures associated with atleast 3–4◦C of warming.
(d) Simple and complex scenarios
The scenarios developed in this paper are relatively contextual24 and assuch complement the wealth of scenarios from more non-contextual integratedassessment models.25 However, while it may be argued that the latter approachbenefits from greater internal consistency and more theoretically coherentparameters, the outputs are typically removed from the political and empiricalreality within which responses to climate change are developed. For example,recent overviews of scenarios generated by a range of different internationalintegrated assessment modelling communities [10,14] illustrate the non-contextualframing that typifies much of this form of analysis. Of the principal 450 ppmvscenarios reviewed, the majority had a global emissions peak in 2010, this despiteirrefutable evidence to the contrary [48].26 Over a third factored in negativeemissions through the inclusion of geo-engineering in the form of ‘biomass withcarbon capture and storage’ (CCS) technologies. These bio-CCS scenarios allincluded wider CCS facilities, yet were without detailed analysis of potentiallysignificant constraints on storage capacity.27 At least half of the scenarios reliedon significant levels of ‘overshoot’ (between 500 and 590 ppmv CO2e)28 and
24Though constrained explicitly to consider top-down emissions only with coarse high-leveldivisions between food, deforestation, energy and industrial processes.25Bottom-up and built on typically idealized inputs with only limited regard for ‘real-world’constraints.26While Köne & Büke’s [48] paper was published after many of the scenarios referred to, theoverarching data and trend lines underpinning Köne and Büke’s analysis were available at thetime many of the scenarios were developed.27The inclusion of bio-CCS also demonstrates a degree of non-contextual engagement withtechnology. Aside from the considerable bio-energy debate surrounding the sustainability ofbiofuels, no CCS power plants have yet being built and consequently large-scale CCS remains atheoretical possibility with no operating experience of capture rates (though many of the componentprocesses have undergone testing). Given the many unknowns around bio-CCS, it is perhapssurprising they are central to so many scenarios. This non-contextual approach to technologyextends to nuclear power, included as a ‘key energy supply technology’ in all but one of the 450ppmvscenarios reviewed. Whilst sufficient uranium exists for moderate increases in conventionally fuelledreactors, significant ramping up of nuclear capacity is likely to require fast breeder reactors withmajor challenges associated with their widespread introduction; here too the integrated assessmentmodelling approach typically treats these wider concerns as exogenous and resolvable.
Phil. Trans. R. Soc. A (2011)
on May 23, 2014rsta.royalsocietypublishing.orgDownloaded from

Beyond dangerous climate change 39
several assumed fossil fuel CO2 emissions from non-Annex 1 nations would exceedthose from Annex 1 as late as 2013–2025 [14], despite the actual date beingaround 2006.29
The non-contextual framing of many complex modelling approaches (includingintegrated assessment modelling), allied with their inevitable opaqueness andoften abstract and implicit assumptions, leaves space for the simpler, moretransparent and contextual approach to scenarios presented in this paper. Makingexplicit the implications of particular assumptions (such as peak emission datesor very low probabilities of exceeding 2◦C) provides insights that not onlyare intelligible to wider stakeholders and decision-makers, but can also provide‘contextual’ parameters and constraints to more complex modelling approaches.
(e) Development on the authors’ 2008 paper
Two years on from earlier analysis by Anderson & Bows [2], only the globaleconomic slump has had any significant impact in reversing the trend of risingemissions. However, with Annex 1 and non-Annex 1 nations returning rapidlyto their earlier economic and emissions trajectories and with the failure ofCopenhagen to achieve a binding agreement to reduce emissions in line with2◦C, the prospects for avoiding dangerous climate change, if they exist at all,are increasingly slim. Furthermore, disaggregating global into Annex 1 and non-Annex 1 emission pathways only serves to exacerbate the scale of this disjuncturebetween the rhetoric and reality of mitigation. In both these regards and with thecontinued high-level reluctance to face the real scale and urgency of the mitigationchallenge, the conclusions arising from this paper are significantly bleaker thanthose of the authors’ 2008 paper.
6. Conclusions
Over the past five years a wealth of analyses have described very differentresponses to what, at first sight, appears to be the same question: what emission-reduction profiles are compatible with avoiding ‘dangerous’ climate change?However, on closer investigation, the difference in responses is related less todifferent interpretations of the science underpinning climate change and muchmore to differing assumptions related to five fundamental and contextual issues.
(1) What delineates dangerous from acceptable climate change?(2) What risk of entering dangerous climate change is acceptable?(3) When is it reasonable to assume global emissions will peak?(4) What reduction rates in post-peak emissions is it reasonable to consider?(5) Can the primacy of economic growth be questioned in attempts to avoid
dangerous climate change?
28Overshoot scenarios remain characterized by considerable uncertainty and are the subject ofsubstantive ongoing research (e.g. [49,50]).29Within the integrated assessment modelling scenarios referred to, the division related to Annex Bregions. For all practical purposes aggregated emissions related to Annex 1 are the same as thosefor Annex B.
Phil. Trans. R. Soc. A (2011)
on May 23, 2014rsta.royalsocietypublishing.orgDownloaded from

40 K. Anderson and A. Bows
While (1) and, to a lesser extent, (2) are issues for international consideration,30
the latter three have pivotal regional dimensions that, at their most crude level,can be understood in relation to Annex 1 and non-Annex 1 emission profiles.
In relation to the first two issues, the Copenhagen Accord and many other high-level policy statements are unequivocal in both their recognition of 2◦C as theappropriate delineator between acceptable and dangerous climate change and theneed to remain at or below 2◦C. Despite such clarity, those providing policy advicefrequently take a much less categorical position, although the implications of theirmore nuanced analyses are rarely communicated adequately to policy makers.Moreover, given that it is a ‘political’ interpretation of the severity of impactsthat informs where the threshold between acceptable and dangerous climatechange resides, the recent reassessment of these impacts upwards suggests currentanalyses of mitigation significantly underestimate what is necessary to avoiddangerous climate change [20,21]. Nevertheless, and despite the evident logic forrevising the 2◦C threshold,31 there is little political appetite and limited academicsupport for such a revision. In stark contrast, many academics and wider policyadvisers undertake their analyses of mitigation with relatively high probabilitiesof exceeding 2◦C and consequently risk entering a prolonged period of whatcan now reasonably be described as extremely dangerous climate change.32 Putbluntly, while the rhetoric of policy is to reduce emissions in line with avoidingdangerous climate change, most policy advice is to accept a high probability ofextremely dangerous climate change rather than propose radical and immediateemission reductions.33
This already demanding conclusion becomes even more challenging whenassumptions about the rates of viable emission reductions are consideredalongside an upgrading of the severity of impacts for 2◦C. Within global emissionscenarios, such as those developed by Stern [6], the CCC [8] and ADAM [47],annual rates of emission reduction beyond the peak years are constrained tolevels thought to be compatible with economic growth—normally 3 per cent to4 per cent per year. However, on closer examination these analyses suggest suchreduction rates are no longer sufficient to avoid dangerous climate change. Forexample, in discussing arguments for and against carbon markets the CCC state‘rich developed economies need to start demonstrating that a low-carbon economyis possible and compatible with economic prosperity’ [8, p. 160]. However, giventhe CCC acknowledge ‘it is not now possible to ensure with high likelihoodthat a temperature rise of more than 2◦C is avoided’ and given the view thatreductions in emissions in excess of 3–4% per year are not compatible witheconomic growth, the CCC are, in effect, conceding that avoiding dangerous(and even extremely dangerous) climate change is no longer compatible witheconomic prosperity.
30Regions can evidently identify what may constitute dangerous within their geographicalboundaries, but given many impacts (and the responsibility for them) extend well beyond suchboundaries any regional assessment needs to be within the context of a more global perspective.31If the impacts are to remain the principal determinant of what constitutes dangerous, then wouldit be more reasonable to characterize ‘1◦C as the new 2◦C’?32Assuming the logic for the 2◦C characterization of what constitutes dangerous still holds.33With policies themselves lagging even further behind in terms of both actual reductions achievedor planned for.
Phil. Trans. R. Soc. A (2011)
on May 23, 2014rsta.royalsocietypublishing.orgDownloaded from
Beyond dangerous climate change 41
In prioritizing such economic prosperity over avoiding extremely dangerousclimate change, the CCC, Stern, ADAM and similar analyses suggest they areguided by what is feasible.34 However, while in terms of emission reductionrates their analyses favour the ‘challenging though still feasible’ end of orthodoxassessments, the approach they adopt in relation to peaking dates is very different.All premise their principal analyses and economic assessments on the ‘infeasible’assumption of global emissions peaking between 2010 and 2016; a profounddeparture from the more ‘feasible’ assumptions framing the majority of suchreports. The scale of this departure is further emphasized when disaggregatingglobal emissions into Annex 1 and non-Annex 1 nations, as the scenario pathwaysdeveloped within this paper demonstrate.
Only if Annex 1 nations reduce emissions immediately35 at rates far beyondthose typically countenanced and only then if non-Annex 1 emissions peakbetween 2020 and 2025 before reducing at unprecedented rates, do globalemissions peak by 2020. Consequently, the 2010 global peak central to manyintegrated assessment model scenarios as well as the 2015–2016 date enshrined inthe CCC, Stern and ADAM analyses, do not reflect any orthodox ‘feasibility’. Bycontrast, the logic of such studies suggests (extremely) dangerous climate changecan only be avoided if economic growth is exchanged, at least temporarily, for aperiod of planned austerity within Annex 1 nations36 and a rapid transition awayfrom fossil-fuelled development within non-Annex 1 nations.
The analysis within this paper offers a stark and unremitting assessment ofthe climate change challenge facing the global community. There is now littleto no chance of maintaining the rise in global mean surface temperature atbelow 2◦C, despite repeated high-level statements to the contrary. Moreover,the impacts associated with 2◦C have been revised upwards (e.g. [20,21]),sufficiently so that 2◦C now more appropriately represents the threshold betweendangerous and extremely dangerous climate change. Consequently, and withtentative signs of global emissions returning to their earlier levels of growth,2010 represents a political tipping point. The science of climate change alliedwith emission pathways for Annex 1 and non-Annex 1 nations suggests aprofound departure in the scale and scope of the mitigation and adaptionchallenge from that detailed in many other analyses, particularly those directlyinforming policy.
However, this paper is not intended as a message of futility, but rather a bareand perhaps brutal assessment of where our ‘rose-tinted’ and well intentioned(though ultimately ineffective) approach to climate change has brought us.Real hope and opportunity, if it is to arise at all, will do so from a raw
34The reference to ‘feasible’ technologies typically extends to carbon capture and storage, which,in 2010, remains untried for a large scale power station. Moreover, it is often allied with biomasscombustion to provide ‘negative’ emissions (§5d). Without such negative emissions, several of themajor analyses (e.g. [9,10]) will have increased cumulative emissions and hence further increasedprobabilities of exceeding 2◦C (see also footnote 27).35With the only exception being C+4 where Annex 1 emissions are stable until 2016, reducingthereafter.36In essence, a planned economic contraction to bring about the almost immediate and radicalreductions necessary to avoid the 2◦C characterization of dangerous climate change whilst allowingtime for the almost complete penetration of all economic sectors with zero or very low carbontechnologies.
Phil. Trans. R. Soc. A (2011)
on May 23, 2014rsta.royalsocietypublishing.orgDownloaded from

42 K. Anderson and A. Bows
and dispassionate assessment of the scale of the challenge faced by the globalcommunity. This paper is intended as a small contribution to such a vision andfuture of hope.
Grateful thanks go to the following Tyndall Centre, Sustainable Consumption Institute andManchester Alumni researchers: Rudra Shrestha, Bachir Ismael Ouedraogo, Maria Sharmina, DanCalverley and Richard Starkey, all of whom are based at the University of Manchester, for theirassistance and valuable comments in relation to this research. Similar thanks go to Steve Sorrel,senior fellow of the Sussex Energy Group at the University of Sussex.
References
1 Copenhagen Accord. 2009 FCCC/CP/2009/L.7. Copenhagen, Denmark: United NationsClimate Change Conference.
2 Anderson, K. & Bows, A. 2008 Reframing the climate change challenge in light of post-2000emission trends. Phil. Trans. R. Soc. A 366, 3863–3882. (doi:10.1098/rsta.2008.0138)
3 Macintosh, A. 2010 Keeping warming within the 2◦C limit after Copenhagen. Energy Policy38, 2964–2975. (doi:10.1016/j.enpol.2010.01.034)
4 Shell. 2008 Shell energy scenarios to 2050. The Hague, The Netherlands: Shell InternationalBV.
5 IEA. 2009 World energy outlook. Paris, France: International Energy Agency.6 Stern, N. 2006 Stern review on the economics of climate change. Cambridge, UK: Cambridge
University Press.7 Meinshausen, M., Meinshausen, N., Hare, W., Raper, S. C. B., Frieler, K., Knutti, R., Frame,
D. J. & Allen, M. R. 2009 Greenhouse-gas emission targets for limiting global warming to 2◦C.Nature 458, 1158–1162. (doi:10.1038/nature08017)
8 CCC. 2008 Building a low-carbon economy—the UK’s contribution to tackling climate change.Norwich, UK: The Stationery Office.
9 Hulme, M., Neufeldt, H., Colyer, H. & Ritchie, A. 2009 Adaptation and mitigation strategies:supporting European climate policy. Norwich, UK: University of East Anglia.
10 Clarke, L., Edmonds, J., Krey, V., Richels, R., Rose, S. & Tavoni, M. 2009 International climatepolicy architectures: overview of the EMF 22 international scenarios. Energy Econ. 31, S64–S81.(doi:10.1016/j.eneco.2009.10.013)
11 Anderson, K. L., Mander, S. L., Bows, A., Shackley, S., Agnolucci, P. & Ekins, P. 2008 TheTyndall decarbonisation scenarios—part II: scenarios for a 60% CO2 reduction in the UK.Energy Policy 36, 3764–3773. (doi:10.1016/j.enpol.2008.06.002)
12 Wang, T. & Watson, J. 2008 Carbon emission scenarios for China to 2100. Tyndall Centreworking paper 121.
13 Sukla, P. R., Dhar, S. & Mahapatra, D. 2008 Low-carbon society scenarios for India. ClimatePolicy 8, S156–S176.
14 Clarke, L., Edmonds, J., Jacoby, H., Pitcher, H., Reilly, J. & Richels, R. 2007 Scenarios ofgreenhouse gas emissions and atmospheric concentrations. Washington, DC: US Department ofEnergy.
15 European Commission. 2007 Limiting global climate change to 2 degrees Celsius: the way aheadfor 2020 and beyond. Brussels, Belgium: European Commission.
16 Anderson, K., Starkey, R. & Bows, A. 2009 Defining dangerous climate change—a call forconsistency. Tyndall Centre briefing note 40.
17 DECC. 2009 The UK low carbon transition plan: national strategy for climate and energy.London, UK: Department of Energy and Climate Change.
18 Miliband, D. & Miliband, E. 2009 Copenhagen: in the balance press briefing. London, UK:Foreign Office and Department for Energy and Climate Change.
19 Solomon, S., Qin, D., Manning, M., Chen, Z., Marquis, M., Averyt, K. M, Tignor, M. &Millier, H. L. (eds) 2007 Contribution of working group 1 to the fourth assessment report ofthe Intergovernmental Panel on Climate Change. Cambridge, UK; New York, NY: CambridgeUniversity Press.
Phil. Trans. R. Soc. A (2011)
on May 23, 2014rsta.royalsocietypublishing.orgDownloaded from
Beyond dangerous climate change 43
20 Smith, J. B. et al. 2009 Assessing dangerous climate change through an update of theIntergovernmental Panel on Climate Change (IPCC) ‘reasons for concern’. Proc. Natl Acad.Sci. USA 106, 4133–4137. (doi:10.1073/pnas.0812355106)
21 Mann, M. E. 2009 Defining dangerous anthropogenic interference. Proc. Natl Acad. Sci. USA106, 4065–4066. (doi:10.1073/pnas.0901303106)
22 New, M., Liverman, D. & Anderson, K. 2009 Mind the gap. Nature 912, 143–144. (doi:10.1038/climate.2009.126)
23 Mander, S. L., Bows, A., Anderson, K. L., Shackley, S., Agnolucci, P. & Ekins, P. 2008 TheTyndall decarbonisation scenarios—part I: development of a backcasting methodology withstakeholder participation. Energy Policy 36, 3754–3763. (doi:10.1016/j.enpol.2008.06.003)
24 Bows, A., Mander, S., Starkey, R., Bleda, M. & Anderson, K. 2006 Living within a carbonbudget. Manchester, UK: Tyndall Centre.
25 Allen, M. R., Frame, D. J., Huntingford, C., Jones, C. D., Lowe, J. A., Meinshausen, M. &Meinshausen, N. 2009 Warming caused by cumulative carbon emissions towards the trillionthtonne. Nature 458, 1163–1166. (doi:10.1038/nature08019)
26 Matthews, H. D., Gillett, N. P., Stott, P. A. & Zickfeld, K. 2009 The proportionality of globalwarming to cumulative carbon emissions. Nature 459, 829–832. (doi:10.1038/nature08047)
27 Garnaut, R. 2008 The Garnaut climate change review. Cambridge, UK: Cambridge UniversityPress.
28 PRIMAP. 2010 The PRIMAP model. Potsdam, UK: Potsdam Institute for Climate ImpactResearch.
29 IPCC, Pachauri, R. K. & Reisenger, A. (eds) 2007 Contribution of working groups I, II and IIIto the fourth assessment report of the Intergovernmental Panel on Climate Change. Cambridge,UK; New York, NY: Cambridge University Press.
30 Boden, T., Marland, G. & Andres, R. 2009 Global CO2 emissions from fossil-fuel burning,cement manufacture, and gas flaring: 1751–2006. Oak Ridge, TN: Oak Ridge NationalLaboratory.
31 Eyring, V. et al. In press. Transport impacts on atmosphere and climate: shipping. Atmos.Environ. (doi:10.1016/j.atmosenv.2009.04.059)
32 UNFCCC. 2010 GHG data from UNFCCC. New York, NY: United Nations.33 IEA. 2009 CO2 emissions from fuel combustion. Paris, France: International Energy Agency.34 Eyring, V., Kohler, H. W., van Aardenne, J. & Lauer, A. 2005 Emissions from international
shipping: 1. The last 50 years. J. Geophys. Res. 110, D17305. (doi:10.1029/2004JD005619)35 Corbett, J. J. & Kohler, H. W. 2003 Updated emissions from ocean shipping. J. Geophys. Res.
108, 4650. (doi:10.1029/2003JD003751)36 Anderson, K., Bows, A. & Mander, S. 2008 From long-term targets to cumulative emission
pathways: reframing UK climate policy. Energy Policy 36, 3714–3722. (doi:10.1016/j.enpol.2008.07.003)
37 Buhaug, O. et al. 2009 2nd IMO GHG study. London, UK: International Maritime Organisation.38 Environmental Audit Committee. 2009 Reducing the CO2 and other emissions from shipping:
fourth report of session 2008–2009. London, UK: The Stationery Office.39 Gilbert, P., Bows, A. & Starkey, R. 2010 Shipping and climate change: scope for unilateral
action. Manchester, UK: University of Manchester.40 Wood, F. R., Bows, A. & Anderson, K. 2010 Apportioning aviation CO2 emissions to regional
administrations for monitoring and target setting. Transport Policy 17, 206–215. (doi:10.1016/j.tranpol.2010.01.010)
41 Global Carbon Project. 2009 Carbon budget and trends 2008. See www.globalcarbonproject.org/carbonbudget.
42 Houghton, R. A. 1999 The annual net flux of carbon to the atmosphere from land use 1850–1990.Tellus B 51B, 298–313.
43 van der Werf, G. R., Morton, D. C., DeFries, R. S., Gigilo, L., Randerson, J. T., Collatz,G. J. & Kasibhatla, P. S. 2009 Estimates of fire emissions from an active deforestation regionin the southern Amazon based on satellite data and biogeochemical modelling. Biogeosciences6, 235–249. (doi:10.5194/bg-6-235-2009)
Phil. Trans. R. Soc. A (2011)
on May 23, 2014rsta.royalsocietypublishing.orgDownloaded from

44 K. Anderson and A. Bows
44 EPA. 2006 Global anthropogenic non-CO2 greenhouse gas emissions: 1990–2020. Office ofAtmospheric Programs, Climate Change Division, US Environmental Protection Agency.
45 Jiankun, H., Wenying, C., Fei, T. & Bin, L. 2009 Long-term climate change mitigation targetand carbon permit allocation. Beijing, China: Tsinghua University.
46 UN. 2010 UN Population Division’s annual estimates and projections. See esa.un.org/UNPP.47 Hof, A., den Elzen, M. G. J. & van Vuuren, D. 2009 The use of economic analysis in
climate change appraisal of post-2012 climate policy. Bilthoven, The Netherlands: NetherlandsEnvironmental Assessment Agency.
48 Köne, A. Ç. & Büke, T. 2010. Forecasting of CO2 emissions from fuel combustion using trendanalysis. Renew. Sustainable Energy Rev. 14, 2906–2915. (doi:10.1016/j.rser.2010.06.006)
49 Nusbaumer, J. & Matsumoto, K. 2008 Climate and carbon cycle changes under the overshootscenario. Glob. Planet. Change 62, 164–172. (doi:10.1016/j.gloplacha.2008.01.002)
50 Schneider, S. H. & Mastrandrea, M. D. 2005 Probabilistic assessment of ‘dangerous’ climatechange and emissions pathways. Proc. Natl Acad. Sci. USA 102, 15 728–15 735. (doi:10.1073/pnas.0506356102)
Phil. Trans. R. Soc. A (2011)
on May 23, 2014rsta.royalsocietypublishing.orgDownloaded from